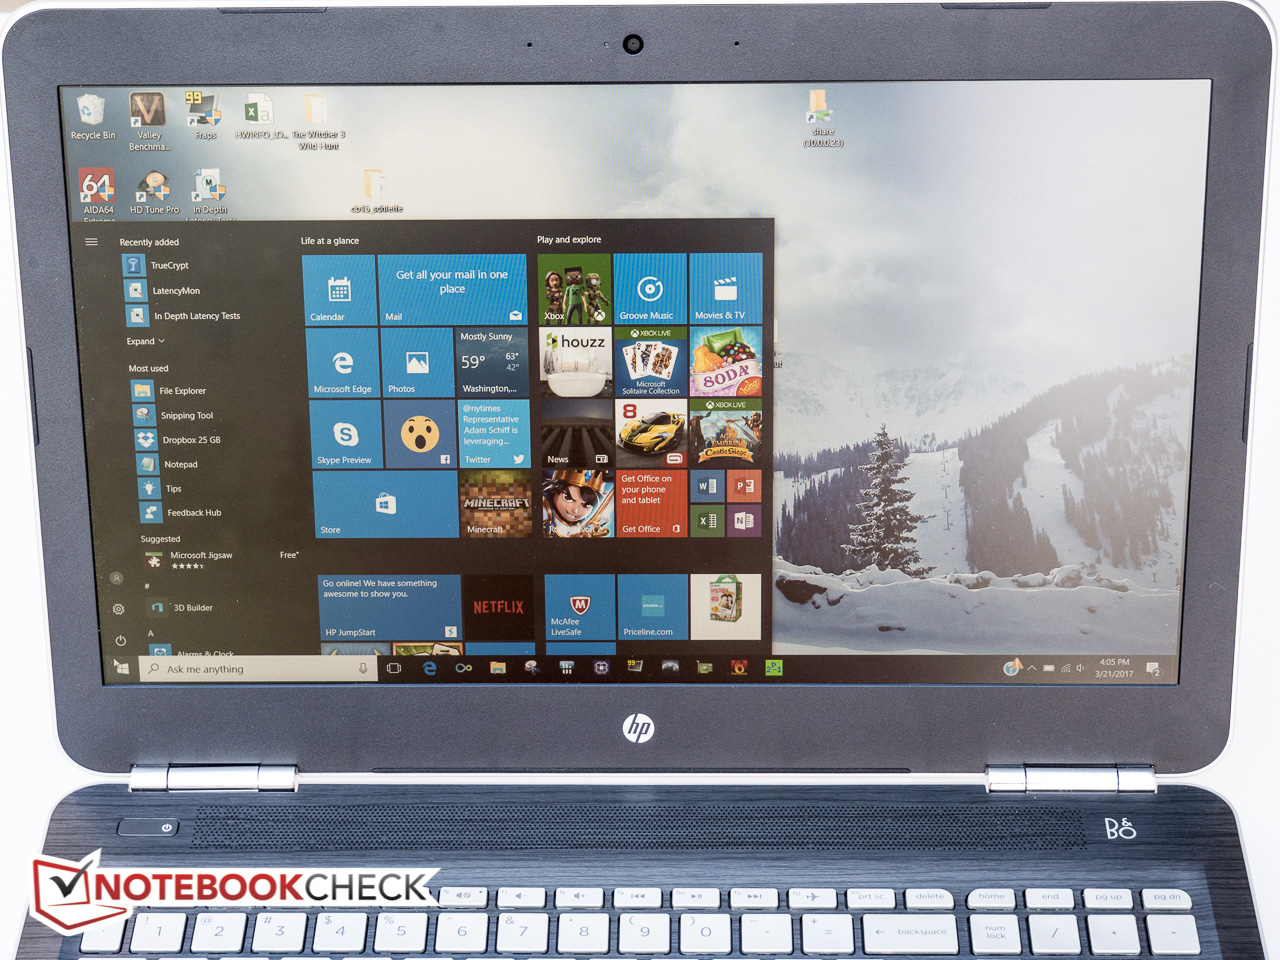
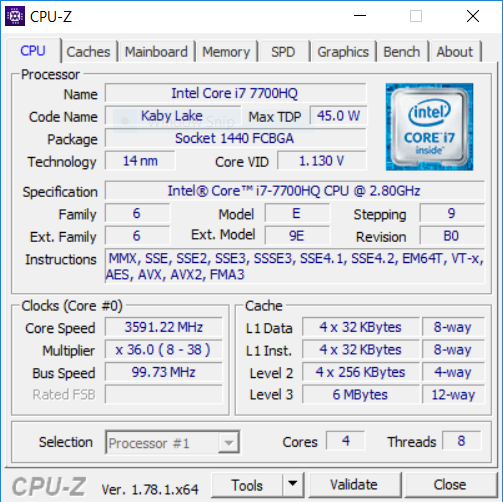
惠普 Pavilion 15t X7P44AV (7700HQ, FHD, GTX 1050) 笔记本电脑简短评测
| SD Card Reader | |
| average JPG Copy Test (av. of 3 runs) | |
| HP Pavilion 15t-X7P42AV | |
| Lenovo IdeaPad 510-15IKB 80SV0087GE | |
| Dell XPS 15 2017 9560 (7300HQ, Full-HD) | |
| Asus N552VX-FY103T | |
| maximum AS SSD Seq Read Test (1GB) | |
| Dell XPS 15 2017 9560 (7300HQ, Full-HD) | |
| HP Pavilion 15t-X7P42AV | |
| Asus N552VX-FY103T | |
| Lenovo IdeaPad 510-15IKB 80SV0087GE | |
| Networking | |
| iperf3 transmit AX12 | |
| Apple MacBook Pro 15 2016 (2.6 GHz, 450) (Klaus I211) | |
| Dell XPS 15 2017 9560 (7300HQ, Full-HD) | |
| HP Pavilion 15t-X7P42AV | |
| iperf3 receive AX12 | |
| Apple MacBook Pro 15 2016 (2.6 GHz, 450) (Klaus I211) | |
| Dell XPS 15 2017 9560 (7300HQ, Full-HD) | |
| HP Pavilion 15t-X7P42AV | |
| |||||||||||||||||||||||||
Brightness Distribution: 75 %
Center on Battery: 209.7 cd/m²
Contrast: 1104:1 (Black: 0.19 cd/m²)
ΔE ColorChecker Calman: 7.8 | ∀{0.5-29.43 Ø4.71}
ΔE Greyscale Calman: 7.3 | ∀{0.09-98 Ø4.96}
56.5% sRGB (Argyll 1.6.3 3D)
39.3% AdobeRGB 1998 (Argyll 1.6.3 3D)
39.29% AdobeRGB 1998 (Argyll 3D)
56.5% sRGB (Argyll 3D)
38.03% Display P3 (Argyll 3D)
Gamma: 2.39
CCT: 5771 K
| HP Pavilion 15t-X7P42AV AU Optronics AUO41ED, IPS, 15.6", 1920x1080 | Dell XPS 15 2017 9560 (7300HQ, Full-HD) Sharp SHP1453 LQ156M1, LED IGZO IPS InfinityEdge, 15.6", 1920x1080 | Lenovo IdeaPad 510-15IKB 80SV0087GE BOE HF NV156FHM-N42, IPS, 15.6", 1920x1080 | Asus N552VX-FY103T LG Philips LP156WF6-SPB5, AH-IPS, 15.6", 1920x1080 | MSI PE60 6QE-056XUS Name: Chi Mei N156HGE-EAL, ID: CMN15D2, TN LED, 15.6", 1920x1080 | HP Pavilion 15 UHD T9Y85AV SDC5958, IPS, 15.6", 3840x2160 | |
|---|---|---|---|---|---|---|
| Display | 79% | 12% | 66% | 106% | 56% | |
| Display P3 Coverage (%) | 38.03 | 68.9 81% | 42.66 12% | 67.9 79% | 86 126% | 60 58% |
| sRGB Coverage (%) | 56.5 | 98.9 75% | 64.1 13% | 87.7 55% | 99.8 77% | 85.8 52% |
| AdobeRGB 1998 Coverage (%) | 39.29 | 70.9 80% | 44.08 12% | 64 63% | 84.2 114% | 61.8 57% |
| Response Times | -58% | -28% | 5% | 1% | 6% | |
| Response Time Grey 50% / Grey 80% * (ms) | 44.4 ? | 54 ? -22% | 51 ? -15% | 42 ? 5% | 43.6 ? 2% | 39.6 ? 11% |
| Response Time Black / White * (ms) | 27.2 ? | 52.4 ? -93% | 38 ? -40% | 26 ? 4% | 27.6 ? -1% | 27.2 ? -0% |
| PWM Frequency (Hz) | 50 ? | 1000 ? | 1282 ? | |||
| Screen | 45% | 25% | 27% | -8% | 14% | |
| Brightness middle (cd/m²) | 209.7 | 400 91% | 291 39% | 336 60% | 200.1 -5% | 336.2 60% |
| Brightness (cd/m²) | 193 | 392 103% | 265 37% | 304 58% | 194 1% | 323 67% |
| Brightness Distribution (%) | 75 | 89 19% | 86 15% | 85 13% | 86 15% | 87 16% |
| Black Level * (cd/m²) | 0.19 | 0.26 -37% | 0.23 -21% | 0.34 -79% | 0.429 -126% | 0.629 -231% |
| Contrast (:1) | 1104 | 1538 39% | 1265 15% | 988 -11% | 466 -58% | 534 -52% |
| Colorchecker dE 2000 * | 7.8 | 4.9 37% | 4.78 39% | 5.26 33% | 10.63 -36% | 3.32 57% |
| Colorchecker dE 2000 max. * | 24.1 | 11 54% | 9.51 61% | 10.49 56% | 18.19 25% | 7.4 69% |
| Greyscale dE 2000 * | 7.3 | 7.2 1% | 3.49 52% | 4.26 42% | 11.51 -58% | 2.88 61% |
| Gamma | 2.39 92% | 2.11 104% | 2.58 85% | 2.35 94% | 2.23 99% | 2.34 94% |
| CCT | 5771 113% | 6911 94% | 6013 108% | 6758 96% | 14492 45% | 6279 104% |
| Color Space (Percent of AdobeRGB 1998) (%) | 39.3 | 64.2 63% | 40 2% | 57 45% | 74.6 90% | 55.3 41% |
| Color Space (Percent of sRGB) (%) | 56.5 | 98.9 75% | 64 13% | 88 56% | 99.8 77% | 85.5 51% |
| Total Average (Program / Settings) | 22% /
38% | 3% /
16% | 33% /
32% | 33% /
16% | 25% /
21% |
* ... smaller is better
Display Response Times
| ↔ Response Time Black to White | ||
|---|---|---|
| 27.2 ms ... rise ↗ and fall ↘ combined | ↗ 6.8 ms rise | 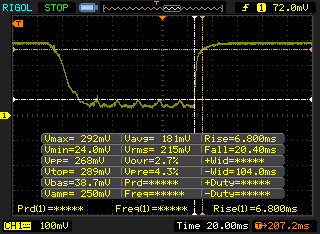 |
| ↘ 20.4 ms fall | ||
| The screen shows relatively slow response rates in our tests and may be too slow for gamers. In comparison, all tested devices range from 0.1 (minimum) to 240 (maximum) ms. » 69 % of all devices are better. This means that the measured response time is worse than the average of all tested devices (19.8 ms). | ||
| ↔ Response Time 50% Grey to 80% Grey | ||
| 44.4 ms ... rise ↗ and fall ↘ combined | ↗ 15.2 ms rise | 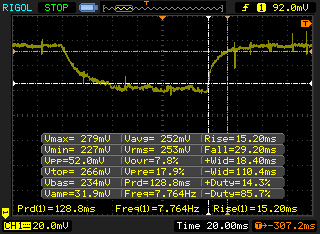 |
| ↘ 29.2 ms fall | ||
| The screen shows slow response rates in our tests and will be unsatisfactory for gamers. In comparison, all tested devices range from 0.165 (minimum) to 636 (maximum) ms. » 76 % of all devices are better. This means that the measured response time is worse than the average of all tested devices (31 ms). | ||
Screen Flickering / PWM (Pulse-Width Modulation)
| Screen flickering / PWM not detected | 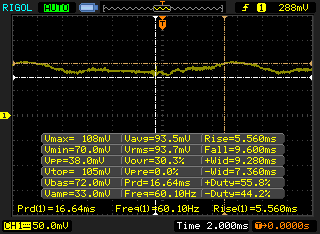 | ||
In comparison: 52 % of all tested devices do not use PWM to dim the display. If PWM was detected, an average of 7754 (minimum: 5 - maximum: 343500) Hz was measured. | |||
| Cinebench R10 | |
| Rendering Multiple CPUs 32Bit | |
| Asus N552VX-FY103T | |
| MSI PE60 6QE-056XUS | |
| HP Pavilion 15 UHD T9Y85AV | |
| HP Pavilion 15t-X7P42AV | |
| Lenovo IdeaPad 510-15IKB 80SV0087GE | |
| Rendering Single 32Bit | |
| HP Pavilion 15t-X7P42AV | |
| Lenovo IdeaPad 510-15IKB 80SV0087GE | |
| MSI PE60 6QE-056XUS | |
| Asus N552VX-FY103T | |
| HP Pavilion 15 UHD T9Y85AV | |
| wPrime 2.10 - 1024m | |
| HP Pavilion 15t-X7P42AV | |
| HP Pavilion 17t-ab200 | |
| MSI PE60 6QE-056XUS | |
| HP Pavilion 15 UHD T9Y85AV | |
* ... smaller is better
| PCMark 8 Home Score Accelerated v2 | 4182 points | |
| PCMark 8 Creative Score Accelerated v2 | 5275 points | |
| PCMark 8 Work Score Accelerated v2 | 2880 points | |
Help | ||
| HP Pavilion 15t-X7P42AV Samsung CM871a MZNTY128HDHP | Dell XPS 15 2017 9560 (7300HQ, Full-HD) WDC WD10SPCX-75KHST0 + SanDisk Z400s M.2 2242 32 GB Cache | Lenovo IdeaPad 510-15IKB 80SV0087GE Liteonit CV3-DE256 | MSI PE60 6QE-056XUS Intel SSD 535 SSDSCKJW120H6 | HP Pavilion 15 UHD T9Y85AV SanDisk Z400s SD8SNAT-128G | HP Pavilion 17t-ab200 Samsung CM871a MZNTY128HDHP | |
|---|---|---|---|---|---|---|
| CrystalDiskMark 3.0 | -83% | 7% | -36% | -22% | -10% | |
| Read Seq (MB/s) | 522 | 123 -76% | 469.2 -10% | 445.3 -15% | 484.6 -7% | 520 0% |
| Write Seq (MB/s) | 476.6 | 74.2 -84% | 431.5 -9% | 173.9 -64% | 185.2 -61% | 353.6 -26% |
| Read 512 (MB/s) | 399.7 | 101.7 -75% | 338.3 -15% | 212.4 -47% | 307.6 -23% | 376.2 -6% |
| Write 512 (MB/s) | 185.4 | 42.51 -77% | 297.9 61% | 133.7 -28% | 180 -3% | 118.5 -36% |
| Read 4k (MB/s) | 33.12 | 10.84 -67% | 28.68 -13% | 17.6 -47% | 22.08 -33% | 32.7 -1% |
| Write 4k (MB/s) | 89.8 | 1.021 -99% | 66.8 -26% | 83.6 -7% | 77.7 -13% | 85.3 -5% |
| Read 4k QD32 (MB/s) | 400.9 | 69.8 -83% | 364.7 -9% | 109.1 -73% | 143.7 -64% | 399 0% |
| Write 4k QD32 (MB/s) | 140.2 | 1.057 -99% | 245.9 75% | 130.7 -7% | 177.6 27% | 132.5 -5% |

| 3DMark | |
| 1280x720 Cloud Gate Standard Graphics | |
| Dell XPS 15 2017 9560 (7300HQ, Full-HD) | |
| HP Pavilion 15t-X7P42AV | |
| HP Pavilion 17t-ab200 | |
| MSI PE60 6QE-056XUS | |
| HP Pavilion 15 UHD T9Y85AV | |
| Asus N552VX-FY103T | |
| HP Spectre x360 15-bl002xx | |
| 1920x1080 Fire Strike Graphics | |
| Dell XPS 15 2017 9560 (7300HQ, Full-HD) | |
| HP Pavilion 15t-X7P42AV | |
| HP Pavilion 17t-ab200 | |
| MSI PE60 6QE-056XUS | |
| HP Pavilion 15 UHD T9Y85AV | |
| Asus N552VX-FY103T | |
| HP Spectre x360 15-bl002xx | |
| 1920x1080 Ice Storm Extreme Graphics | |
| HP Pavilion 15t-X7P42AV | |
| MSI PE60 6QE-056XUS | |
| HP Pavilion 15 UHD T9Y85AV | |
| HP Spectre x360 15-bl002xx | |
| 3DMark 11 Performance | 7706 points | |
| 3DMark Ice Storm Standard Score | 87227 points | |
| 3DMark Cloud Gate Standard Score | 19978 points | |
| 3DMark Fire Strike Score | 5528 points | |
| 3DMark Fire Strike Extreme Score | 2653 points | |
Help | ||
| low | med. | high | ultra | |
|---|---|---|---|---|
| Dirt 3 (2011) | 176.1 | 161 | 152.9 | 102 |
| Tomb Raider (2013) | 106.5 | 87.6 | 75.6 | 42.3 |
| BioShock Infinite (2013) | 205.3 | 162.6 | 150.2 | 64.8 |
| Metro: Last Light (2013) | 135.2 | 126 | 83.1 | 43.9 |
| GRID 2 (2013) | 161.5 | 131.8 | 123 | 75.1 |
| Company of Heroes 2 (2013) | 65.6 | 61.7 | 58.8 | 45.2 |
| GRID: Autosport (2014) | 220.8 | 135.3 | 121.3 | 78.3 |
| Middle-earth: Shadow of Mordor (2014) | 169.7 | 105.8 | 58.7 | 45.2 |
| The Witcher 3 (2015) | 120.4 | 70.1 | 39.9 | 21.4 |
Noise level
| Idle |
| 32.3 / 32.3 / 32.4 dB(A) |
| Load |
| 44.4 / 49.2 dB(A) |
 | ||
30 dB silent 40 dB(A) audible 50 dB(A) loud |
||
min: | ||
| HP Pavilion 15t-X7P42AV GeForce GTX 1050 Mobile, i7-7700HQ, Samsung CM871a MZNTY128HDHP | Dell XPS 15 2017 9560 (7300HQ, Full-HD) GeForce GTX 1050 Mobile, i5-7300HQ, WDC WD10SPCX-75KHST0 + SanDisk Z400s M.2 2242 32 GB Cache | Lenovo IdeaPad 510-15IKB 80SV0087GE GeForce 940MX, i7-7500U, Liteonit CV3-DE256 | MSI PE60 6QE-056XUS GeForce GTX 960M, 6700HQ, Intel SSD 535 SSDSCKJW120H6 | HP Pavilion 15 UHD T9Y85AV GeForce GTX 960M, 6700HQ, SanDisk Z400s SD8SNAT-128G | HP Pavilion 17t-ab200 GeForce GTX 1050 Mobile, i7-7700HQ, Samsung CM871a MZNTY128HDHP | |
|---|---|---|---|---|---|---|
| Noise | -1% | 6% | 1% | 1% | -7% | |
| off / environment * (dB) | 29.3 | 30.3 -3% | 31.6 -8% | 29.3 -0% | 29.5 -1% | 30.8 -5% |
| Idle Minimum * (dB) | 32.3 | 31.6 2% | 32.6 -1% | 32.4 -0% | 32.3 -0% | 35.3 -9% |
| Idle Average * (dB) | 32.3 | 31.6 2% | 32.6 -1% | 32.4 -0% | 32.4 -0% | 35.4 -10% |
| Idle Maximum * (dB) | 32.4 | 33.4 -3% | 32.6 -1% | 35.4 -9% | 32.4 -0% | 35.4 -9% |
| Load Average * (dB) | 44.4 | 47.8 -8% | 35.3 20% | 40.5 9% | 40.5 9% | 48.6 -9% |
| Load Maximum * (dB) | 49.2 | 47.8 3% | 37.1 25% | 45.3 8% | 50.3 -2% | 49.8 -1% |
* ... smaller is better
(±) The maximum temperature on the upper side is 41.8 °C / 107 F, compared to the average of 36.8 °C / 98 F, ranging from 21 to 71 °C for the class Multimedia.
(+) The bottom heats up to a maximum of 33.4 °C / 92 F, compared to the average of 39.1 °C / 102 F
(+) In idle usage, the average temperature for the upper side is 22.5 °C / 73 F, compared to the device average of 31.3 °C / 88 F.
(+) Playing The Witcher 3, the average temperature for the upper side is 28.9 °C / 84 F, compared to the device average of 31.3 °C / 88 F.
(±) The palmrests and touchpad can get very hot to the touch with a maximum of 37.6 °C / 99.7 F.
(-) The average temperature of the palmrest area of similar devices was 28.7 °C / 83.7 F (-8.9 °C / -16 F).
| Off / Standby | |
| Idle | |
| Load |
|
Key:
min: | |
| HP Pavilion 15t-X7P42AV i7-7700HQ, GeForce GTX 1050 Mobile, Samsung CM871a MZNTY128HDHP, IPS, 1920x1080, 15.6" | Dell XPS 15 2017 9560 (7300HQ, Full-HD) i5-7300HQ, GeForce GTX 1050 Mobile, WDC WD10SPCX-75KHST0 + SanDisk Z400s M.2 2242 32 GB Cache, LED IGZO IPS InfinityEdge, 1920x1080, 15.6" | Lenovo IdeaPad 510-15IKB 80SV0087GE i7-7500U, GeForce 940MX, Liteonit CV3-DE256, IPS, 1920x1080, 15.6" | MSI PE60 6QE-056XUS 6700HQ, GeForce GTX 960M, Intel SSD 535 SSDSCKJW120H6, TN LED, 1920x1080, 15.6" | HP Pavilion 15 UHD T9Y85AV 6700HQ, GeForce GTX 960M, SanDisk Z400s SD8SNAT-128G, IPS, 3840x2160, 15.6" | HP Pavilion 17t-ab200 i7-7700HQ, GeForce GTX 1050 Mobile, Samsung CM871a MZNTY128HDHP, IPS, 1920x1080, 17.3" | Asus N552VX-FY103T 6700HQ, GeForce GTX 950M, Toshiba MQ02ABD100H, AH-IPS, 1920x1080, 15.6" | HP Spectre x360 15-bl002xx i7-7500U, GeForce 940MX, Toshiba XG4 NVMe (THNSN5512GPUK), IPS, 3840x2160, 15.6" | |
|---|---|---|---|---|---|---|---|---|
| Power Consumption | 4% | 38% | -37% | -22% | -4% | -1% | 9% | |
| Idle Minimum * (Watt) | 8.29 | 6.6 20% | 3.9 53% | 9.7 -17% | 8.3 -0% | 8.2 1% | 7 16% | 8.14 2% |
| Idle Average * (Watt) | 8.9 | 9 -1% | 7.4 17% | 13.1 -47% | 14.8 -66% | 11 -24% | 10.9 -22% | 10.91 -23% |
| Idle Maximum * (Watt) | 10.2 | 10.7 -5% | 9.5 7% | 23.2 -127% | 16.8 -65% | 11.1 -9% | 12.9 -26% | 12.26 -20% |
| Load Average * (Watt) | 77.1 | 77.5 -1% | 41 47% | 79.1 -3% | 71 8% | 77 -0% | 72 7% | 45.67 41% |
| Load Maximum * (Watt) | 136.6 | 130 5% | 48 65% | 122.9 10% | 119.2 13% | 116.9 14% | 109 20% | 74.94 45% |
* ... smaller is better
| HP Pavilion 15t-X7P42AV i7-7700HQ, GeForce GTX 1050 Mobile, 63.3 Wh | Dell XPS 15 2017 9560 (7300HQ, Full-HD) i5-7300HQ, GeForce GTX 1050 Mobile, 56 Wh | MSI PE60 6QE-056XUS 6700HQ, GeForce GTX 960M, 42 Wh | HP Pavilion 15 UHD T9Y85AV 6700HQ, GeForce GTX 960M, 61.5 Wh | HP Pavilion 17t-ab200 i7-7700HQ, GeForce GTX 1050 Mobile, 62 Wh | Asus N552VX-FY103T 6700HQ, GeForce GTX 950M, 44 Wh | HP Spectre x360 15-bl002xx i7-7500U, GeForce 940MX, 79.2 Wh | |
|---|---|---|---|---|---|---|---|
| Battery runtime | -27% | -52% | -32% | -11% | -45% | 20% | |
| Reader / Idle (h) | 16 | 9.4 -41% | 5.7 -64% | 8.5 -47% | 11.5 -28% | 6 -62% | 14.4 -10% |
| WiFi v1.3 (h) | 6.5 | 5.6 -14% | 3 -54% | 4.4 -32% | 6.8 5% | 4.5 -31% | 8.9 37% |
| Load (h) | 1.9 | 1.4 -26% | 1.2 -37% | 1.6 -16% | 1.7 -11% | 1.1 -42% | 2.5 32% |
Pros
Cons

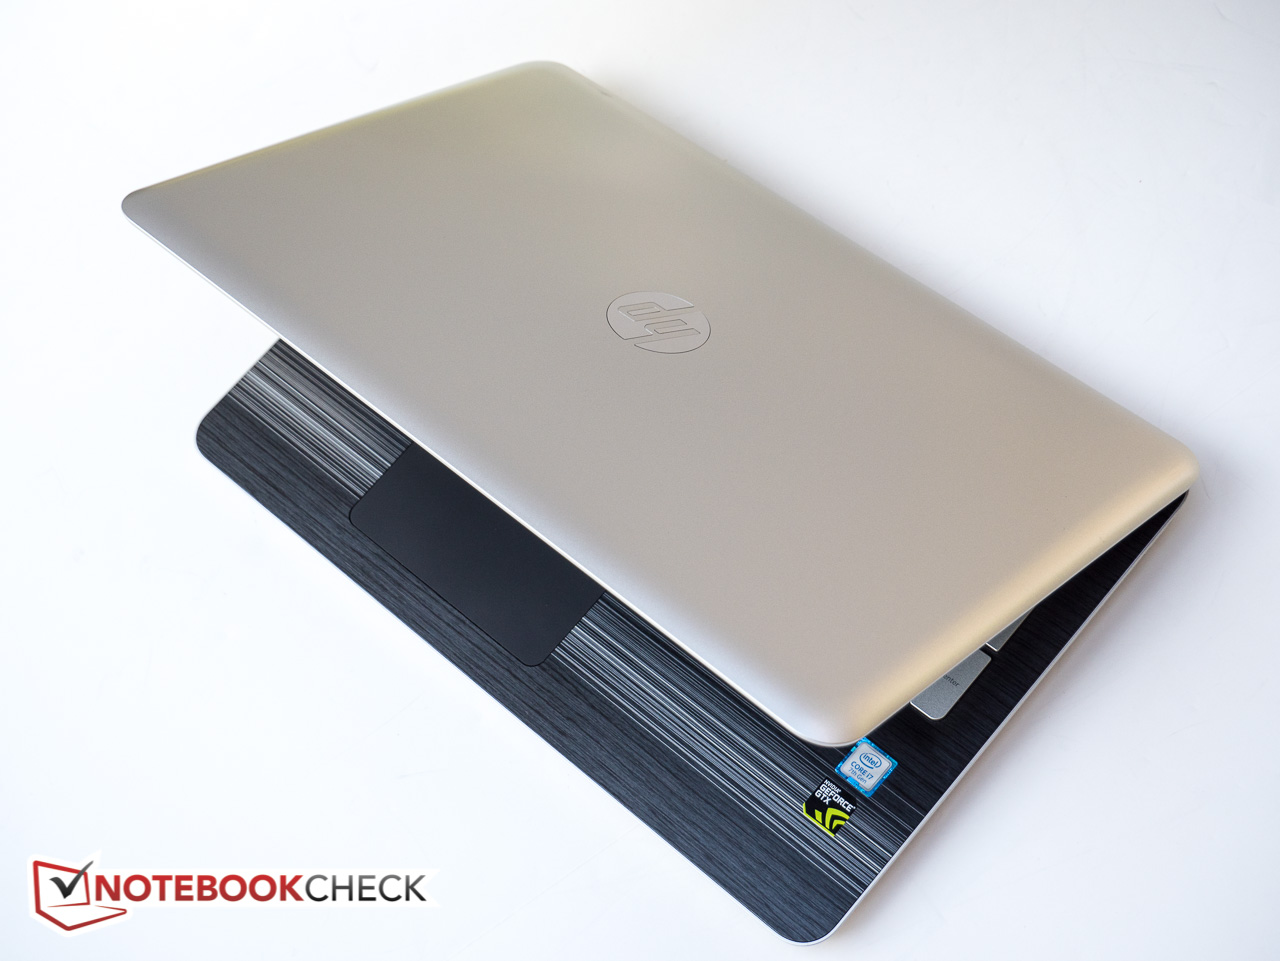
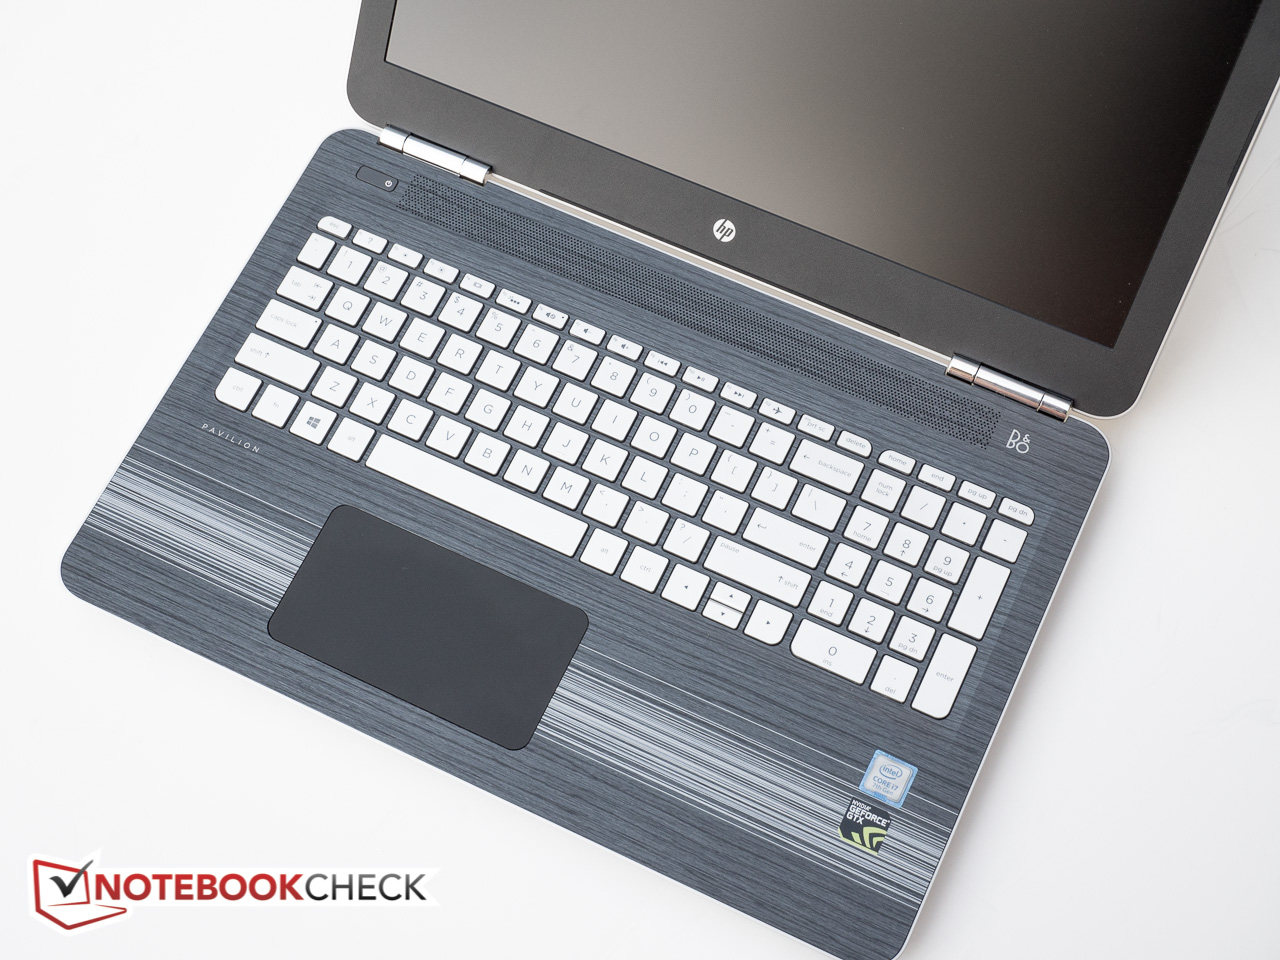
惠普 Pavilion 15t X7P44AV 在合理的价格上提供了出色的性能。全塑料制外壳无法让人产生信心且难以吸引那些希望拥有更高阶设计(铝制外壳)的用户。但其配备的硬件绝对使人震惊:高端四核CPU,16GB内存,双机械硬盘,以及一块GeForce GTX 1050显卡,系统能够很轻松地应对日常工作。那些希望有着更加全面表现的用户会对其游戏性能感到满意,X744AV能够轻松地在性能上超越那些搭载 GeForce 940MX的更加入门级的竞品。
就通常的情况来说,笔记本所搭载的屏幕通常是其的短板。这块昏暗的面板的峰值亮度才刚刚超过190尼特,其色域的覆盖差强人意,对于颜色的还原也谈不上精准。尽管电池续航对于上一代的四核处理器版本来说有所提升,但是由于屏幕面板的原因,在户外使用它依然会是一大挑战。尽管可选的超高解析度面板很有可能会消耗更多的能源并且对显卡带来更大的压力,但如果这块面板能够提供更高的亮度,它依然有很大的可能性成为我们的推荐选择
配备四核处理器的 Pavilions 系列最大的优势在于相对较低的价格:搭载英特尔酷睿 i5-7300HQ 处理器,8GB内存,GeForce GTX 1050(仅有 2GB 显存)以及单个256GB PCIe NVMe M.2 固态硬盘的型号,售价仅为800美金。
作为一台为了游戏而生的廉价多媒体设备,惠普 Pavilion 是一个出色的选择——在用户了解其缺点的前提下。
注:本文是基于完整评测的缩减版本,阅读完整的英文评测,请点击这里。
HP Pavilion 15t-X7P42AV
- 03/28/2017 v6 (old)
Bernhard Pechlaner
Price comparison
