惠普 Pavilion 15 UHD T9Y85AV 笔记本电脑简短评测


| SD Card Reader | |
| average JPG Copy Test (av. of 3 runs) | |
| Dell XPS 13 2016 9350 (FHD, i7-6560U) | |
| HP Pavilion 15-bk001ng x360 | |
| Apple MacBook Pro Retina 13 inch 2013-10 | |
| HP Pavilion 15 UHD T9Y85AV | |
| maximum AS SSD Seq Read Test (1GB) | |
| Dell XPS 13 2016 9350 (FHD, i7-6560U) | |
| HP Pavilion 15 UHD T9Y85AV | |
| HP Pavilion 15-bk001ng x360 | |
| Networking | |
| iperf Server (receive) TCP 1 m | |
| Apple MacBook 12 (Early 2016) 1.1 GHz | |
| Asus ZenPad 8.0 Z380M-6B026A | |
| iperf Client (transmit) TCP 1 m | |
| Apple MacBook 12 (Early 2016) 1.1 GHz | |
| Asus ZenPad 8.0 Z380M-6B026A | |
| |||||||||||||||||||||||||
Brightness Distribution: 87 %
Center on Battery: 336.2 cd/m²
Contrast: 534:1 (Black: 0.629 cd/m²)
ΔE ColorChecker Calman: 3.32 | ∀{0.5-29.43 Ø4.71}
ΔE Greyscale Calman: 2.88 | ∀{0.09-98 Ø4.96}
85.5% sRGB (Argyll 1.6.3 3D)
55.3% AdobeRGB 1998 (Argyll 1.6.3 3D)
61.8% AdobeRGB 1998 (Argyll 3D)
85.8% sRGB (Argyll 3D)
60% Display P3 (Argyll 3D)
Gamma: 2.34
CCT: 6279 K
| HP Pavilion 15 UHD T9Y85AV SDC5958, IPS, 15.6", 3840x2160 | HP Pavilion 15-ak003ng Samsung SDC5544, IPS, 15.6", 1920x1080 | MSI GL62-6QFi781H11 CMN N156HGE-EAL (CMN15D2), TN LED, 15.6", 1920x1080 | Asus ZenBook Pro UX501VW-DS71T IPS, 15.6", 3840x2160 | HP Omen 15-ax007ng LGD0519, IPS, 15.6", 1920x1080 | |
|---|---|---|---|---|---|
| Display | -27% | 32% | 6% | -16% | |
| Display P3 Coverage (%) | 60 | 43.03 -28% | 85.8 43% | 64.3 7% | 59.9 0% 40.34 -33% |
| sRGB Coverage (%) | 85.8 | 64.7 -25% | 99.8 16% | 89.9 5% | 85.9 0% 60.3 -30% |
| AdobeRGB 1998 Coverage (%) | 61.8 | 44.47 -28% | 84.1 36% | 65.4 6% | 61.6 0% 41.73 -32% |
| Response Times | -12% | 3% | -5% | -27% | |
| Response Time Grey 50% / Grey 80% * (ms) | 39.6 ? | 48 ? -21% | 43 ? -9% | 43.2 ? -9% | 55 ? -39% |
| Response Time Black / White * (ms) | 27.2 ? | 28 ? -3% | 23 ? 15% | 27.2 ? -0% | 31 ? -14% |
| PWM Frequency (Hz) | 1282 ? | 1000 ? | |||
| Screen | 4% | -63% | -22% | -29% | |
| Brightness middle (cd/m²) | 336.2 | 254 -24% | 216 -36% | 252.9 -25% | 214 -36% |
| Brightness (cd/m²) | 323 | 241 -25% | 202 -37% | 250 -23% | 203 -37% |
| Brightness Distribution (%) | 87 | 78 -10% | 83 -5% | 89 2% | 79 -9% |
| Black Level * (cd/m²) | 0.629 | 0.27 57% | 0.48 24% | 0.5 21% | 0.28 55% |
| Contrast (:1) | 534 | 941 76% | 450 -16% | 506 -5% | 764 43% |
| Colorchecker dE 2000 * | 3.32 | 3.54 -7% | 9.98 -201% | 5.22 -57% | 6.04 -82% |
| Colorchecker dE 2000 max. * | 7.4 | 17.12 -131% | 8.33 -13% | 12 -62% | |
| Greyscale dE 2000 * | 2.88 | 2.29 20% | 10.91 -279% | 6.74 -134% | 5.91 -105% |
| Gamma | 2.34 94% | 2.5 88% | 2.31 95% | 2.45 90% | 2.44 90% |
| CCT | 6279 104% | 6698 97% | 13185 49% | 6026 108% | 7362 88% |
| Color Space (Percent of AdobeRGB 1998) (%) | 55.3 | 41 -26% | 75 36% | 58.4 6% | 38 -31% |
| Color Space (Percent of sRGB) (%) | 85.5 | 64 -25% | 100 17% | 89.7 5% | 60 -30% |
| Total Average (Program / Settings) | -12% /
-5% | -9% /
-35% | -7% /
-14% | -24% /
-25% |
* ... smaller is better
Display Response Times
| ↔ Response Time Black to White | ||
|---|---|---|
| 27.2 ms ... rise ↗ and fall ↘ combined | ↗ 7.6 ms rise | 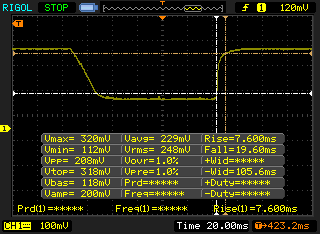 |
| ↘ 19.6 ms fall | ||
| The screen shows relatively slow response rates in our tests and may be too slow for gamers. In comparison, all tested devices range from 0.1 (minimum) to 240 (maximum) ms. » 69 % of all devices are better. This means that the measured response time is worse than the average of all tested devices (19.8 ms). | ||
| ↔ Response Time 50% Grey to 80% Grey | ||
| 39.6 ms ... rise ↗ and fall ↘ combined | ↗ 18.4 ms rise | 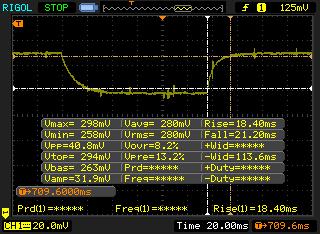 |
| ↘ 21.2 ms fall | ||
| The screen shows slow response rates in our tests and will be unsatisfactory for gamers. In comparison, all tested devices range from 0.165 (minimum) to 636 (maximum) ms. » 61 % of all devices are better. This means that the measured response time is worse than the average of all tested devices (31 ms). | ||
Screen Flickering / PWM (Pulse-Width Modulation)
| Screen flickering / PWM detected | 1282 Hz | ≤ 59 % brightness setting | 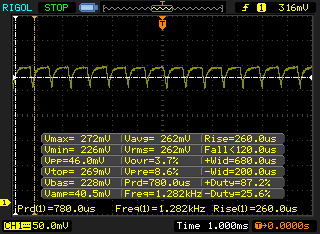 |
The display backlight flickers at 1282 Hz (worst case, e.g., utilizing PWM) Flickering detected at a brightness setting of 59 % and below. There should be no flickering or PWM above this brightness setting. The frequency of 1282 Hz is quite high, so most users sensitive to PWM should not notice any flickering. In comparison: 52 % of all tested devices do not use PWM to dim the display. If PWM was detected, an average of 7757 (minimum: 5 - maximum: 343500) Hz was measured. | |||
| Cinebench R10 | |
| Rendering Multiple CPUs 32Bit (sort by value) | |
| HP Pavilion 15 UHD T9Y85AV | |
| DogHouse Systems Mobius SS | |
| Asus G701VO-CS74K | |
| MSI PX60 QD-034US | |
| Lenovo IdeaPad Y50 | |
| HP Spectre 13 | |
| Rendering Single 32Bit (sort by value) | |
| HP Pavilion 15 UHD T9Y85AV | |
| DogHouse Systems Mobius SS | |
| Asus G701VO-CS74K | |
| MSI PX60 QD-034US | |
| Lenovo IdeaPad Y50 | |
| HP Spectre 13 | |
| wPrime 2.10 - 1024m (sort by value) | |
| HP Pavilion 15 UHD T9Y85AV | |
| DogHouse Systems Mobius SS | |
| Asus G701VO-CS74K | |
| MSI PX60 QD-034US | |
| Lenovo IdeaPad Y50 | |
| HP Spectre 13 | |
| Super Pi Mod 1.5 XS 32M - 32M (sort by value) | |
| HP Pavilion 15 UHD T9Y85AV | |
| DogHouse Systems Mobius SS | |
| Asus G701VO-CS74K | |
| MSI PX60 QD-034US | |
| Lenovo IdeaPad Y50 | |
| HP Spectre 13 | |
* ... smaller is better
| PCMark 8 | |
| Home Score Accelerated v2 (sort by value) | |
| HP Pavilion 15 UHD T9Y85AV | |
| HP Omen 15-ax007ng | |
| MSI GL62-6QFi781H11 | |
| HP Pavilion 15-ak003ng | |
| Asus ZenBook Pro UX501VW-DS71T | |
| Work Score Accelerated v2 (sort by value) | |
| HP Pavilion 15 UHD T9Y85AV | |
| HP Omen 15-ax007ng | |
| MSI GL62-6QFi781H11 | |
| HP Pavilion 15-ak003ng | |
| Asus ZenBook Pro UX501VW-DS71T | |
| Creative Score Accelerated v2 (sort by value) | |
| HP Pavilion 15 UHD T9Y85AV | |
| HP Omen 15-ax007ng | |
| MSI GL62-6QFi781H11 | |
| HP Pavilion 15-ak003ng | |
| Asus ZenBook Pro UX501VW-DS71T | |
| PCMark 8 Home Score Accelerated v2 | 3101 points | |
| PCMark 8 Creative Score Accelerated v2 | 4648 points | |
| PCMark 8 Work Score Accelerated v2 | 3717 points | |
Help | ||
| HP Pavilion 15 UHD T9Y85AV SanDisk Z400s SD8SNAT-128G | HP Pavilion 15-ak003ng Samsung CM871 MZNLF128HCHP | MSI GL62-6QFi781H11 Toshiba HG6 THNSNJ128G8NY | Asus ZenBook Pro UX501VW-DS71T Samsung SM951 MZVPV512HDGL m.2 PCI-e | HP Omen 15-ax007ng Adata IM2S3138E-128GM-B | |
|---|---|---|---|---|---|
| CrystalDiskMark 3.0 | -38% | 51% | 321% | 17% | |
| Read Seq (MB/s) | 484.6 | 465.8 -4% | 530 9% | 1633 237% | 475.7 -2% |
| Write Seq (MB/s) | 185.2 | 120.2 -35% | 442.7 139% | 1579 753% | 169.2 -9% |
| Read 512 (MB/s) | 307.6 | 314.1 2% | 409.1 33% | 1068 247% | 327.6 7% |
| Write 512 (MB/s) | 180 | 75.9 -58% | 417.3 132% | 1570 772% | 169.6 -6% |
| Read 4k (MB/s) | 22.08 | 18.49 -16% | 21.81 -1% | 50.4 128% | 33.14 50% |
| Write 4k (MB/s) | 77.7 | 21.18 -73% | 93 20% | 128.6 66% | 81.4 5% |
| Read 4k QD32 (MB/s) | 143.7 | 94.8 -34% | 257 79% | 534 272% | 276.8 93% |
| Write 4k QD32 (MB/s) | 177.6 | 21.66 -88% | 168.3 -5% | 344 94% | 168 -5% |

| 3DMark 11 | |
| 1280x720 Performance GPU (sort by value) | |
| HP Pavilion 15 UHD T9Y85AV | |
| Asus Strix GL502VY-DS71 | |
| Asus Strix GL502VT-DS74 | |
| HP Omen 15-ax007ng | |
| MSI GL62-6QFi781H11 | |
| HP Envy 17-n107ng | |
| Dell Inspiron 17 7778 | |
| 1280x720 Performance Combined (sort by value) | |
| HP Pavilion 15 UHD T9Y85AV | |
| Asus Strix GL502VY-DS71 | |
| Asus Strix GL502VT-DS74 | |
| HP Omen 15-ax007ng | |
| MSI GL62-6QFi781H11 | |
| HP Envy 17-n107ng | |
| Dell Inspiron 17 7778 | |
| 3DMark | |
| 1280x720 Cloud Gate Standard Graphics (sort by value) | |
| HP Pavilion 15 UHD T9Y85AV | |
| Asus Strix GL502VY-DS71 | |
| Asus Strix GL502VT-DS74 | |
| HP Omen 15-ax007ng | |
| MSI GL62-6QFi781H11 | |
| HP Envy 17-n107ng | |
| Dell Inspiron 17 7778 | |
| 1920x1080 Fire Strike Graphics (sort by value) | |
| HP Pavilion 15 UHD T9Y85AV | |
| Asus Strix GL502VY-DS71 | |
| Asus Strix GL502VT-DS74 | |
| HP Omen 15-ax007ng | |
| MSI GL62-6QFi781H11 | |
| HP Envy 17-n107ng | |
| Dell Inspiron 17 7778 | |
| Fire Strike Extreme Graphics (sort by value) | |
| HP Pavilion 15 UHD T9Y85AV | |
| Asus Strix GL502VY-DS71 | |
| Asus Strix GL502VT-DS74 | |
| 3840x2160 Fire Strike Ultra Graphics (sort by value) | |
| HP Pavilion 15 UHD T9Y85AV | |
| Asus Strix GL502VY-DS71 | |
| 3DMark 11 Performance | 5775 points | |
| 3DMark Ice Storm Standard Score | 37758 points | |
| 3DMark Cloud Gate Standard Score | 16612 points | |
| 3DMark Fire Strike Score | 3954 points | |
| 3DMark Fire Strike Extreme Score | 1990 points | |
Help | ||
| low | med. | high | ultra | 4K | |
|---|---|---|---|---|---|
| Sleeping Dogs (2012) | 91.2 | 24.1 | |||
| BioShock Infinite (2013) | 110 | 45.8 | |||
| Metro: Last Light (2013) | 58.4 | 31.4 | |||
| Thief (2014) | 55 | 28.2 | |||
| Batman: Arkham Knight (2015) | 34 | 22 | |||
| Metal Gear Solid V (2015) | 45.9 | 32.1 | 14.5 | ||
| Fallout 4 (2015) | 29.9 | 24.1 | |||
| Rise of the Tomb Raider (2016) | 29.6 | 23.5 | |||
| Overwatch (2016) | 66.8 | 40.2 | 19.8 |
| Rise of the Tomb Raider - 1920x1080 Very High Preset AA:FX AF:16x | |
| Asus Strix GL502VY-DS71 | |
| Asus Strix GL502VT-DS74 | |
| HP Omen 15-ax007ng | |
| HP Pavilion 15 UHD T9Y85AV | |
| Dell XPS 15 9550 i7 FHD | |
| Medion Erazer P6661 MD 99873 | |
| BioShock Infinite - 1920x1080 Ultra Preset, DX11 (DDOF) | |
| Asus Strix GL502VY-DS71 | |
| Asus Strix GL502VT-DS74 | |
| HP Pavilion 15 UHD T9Y85AV | |
| Dell XPS 15 9550 i7 FHD | |
| Medion Erazer P6661 MD 99873 | |
| Sleeping Dogs - 1920x1080 Extreme Preset AA:Extreme | |
| Asus Strix GL502VY-DS71 | |
| Asus Strix GL502VT-DS74 | |
| HP Pavilion 15 UHD T9Y85AV | |
| Dell XPS 15 9550 i7 FHD | |
| Metro: Last Light - 1920x1080 Very High (DX11) AF:16x | |
| Asus Strix GL502VT-DS74 | |
| HP Pavilion 15 UHD T9Y85AV | |
| Dell XPS 15 9550 i7 FHD | |
| Medion Erazer P6661 MD 99873 | |
| Thief - 1920x1080 Very High Preset AA:FXAA & High SS AF:8x | |
| Asus Strix GL502VY-DS71 | |
| Asus Strix GL502VT-DS74 | |
| HP Pavilion 15 UHD T9Y85AV | |
| Dell XPS 15 9550 i7 FHD | |
| Medion Erazer P6661 MD 99873 | |
| Batman: Arkham Knight - 1920x1080 High / On AA:SM AF:16x | |
| Asus Strix GL502VT-DS74 | |
| Medion Erazer P6661 MD 99873 | |
| HP Pavilion 15 UHD T9Y85AV | |
| Dell XPS 15 9550 i7 FHD | |
| Metal Gear Solid V - 1920x1080 Extra High / On | |
| Asus Strix GL502VT-DS74 | |
| Asus Strix GL502VY-DS71 | |
| Dell XPS 15 9550 i7 FHD | |
| HP Pavilion 15 UHD T9Y85AV | |
| Fallout 4 - 1920x1080 Ultra Preset AA:T AF:16x | |
| Asus Strix GL502VY-DS71 | |
| Asus Strix GL502VT-DS74 | |
| Dell XPS 15 9550 i7 FHD | |
| HP Pavilion 15 UHD T9Y85AV | |
| Overwatch - 1920x1080 Epic (Render Scale 100 %) AA:SM AF:16x | |
| Asus Strix GL502VY-DS71 | |
| HP Omen 15-ax007ng | |
| HP Pavilion 15 UHD T9Y85AV | |
Noise level
| Idle |
| 32.3 / 32.4 / 32.4 dB(A) |
| Load |
| 40.5 / 50.3 dB(A) |
 | ||
30 dB silent 40 dB(A) audible 50 dB(A) loud |
||
min: | ||
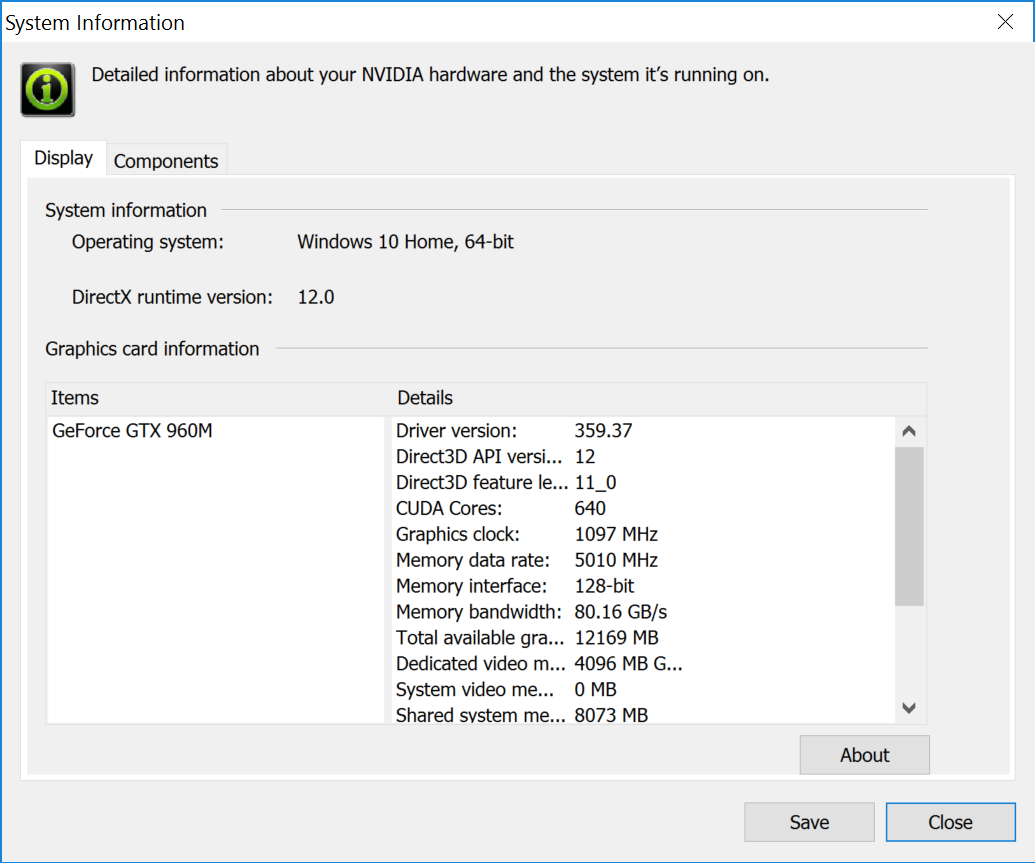
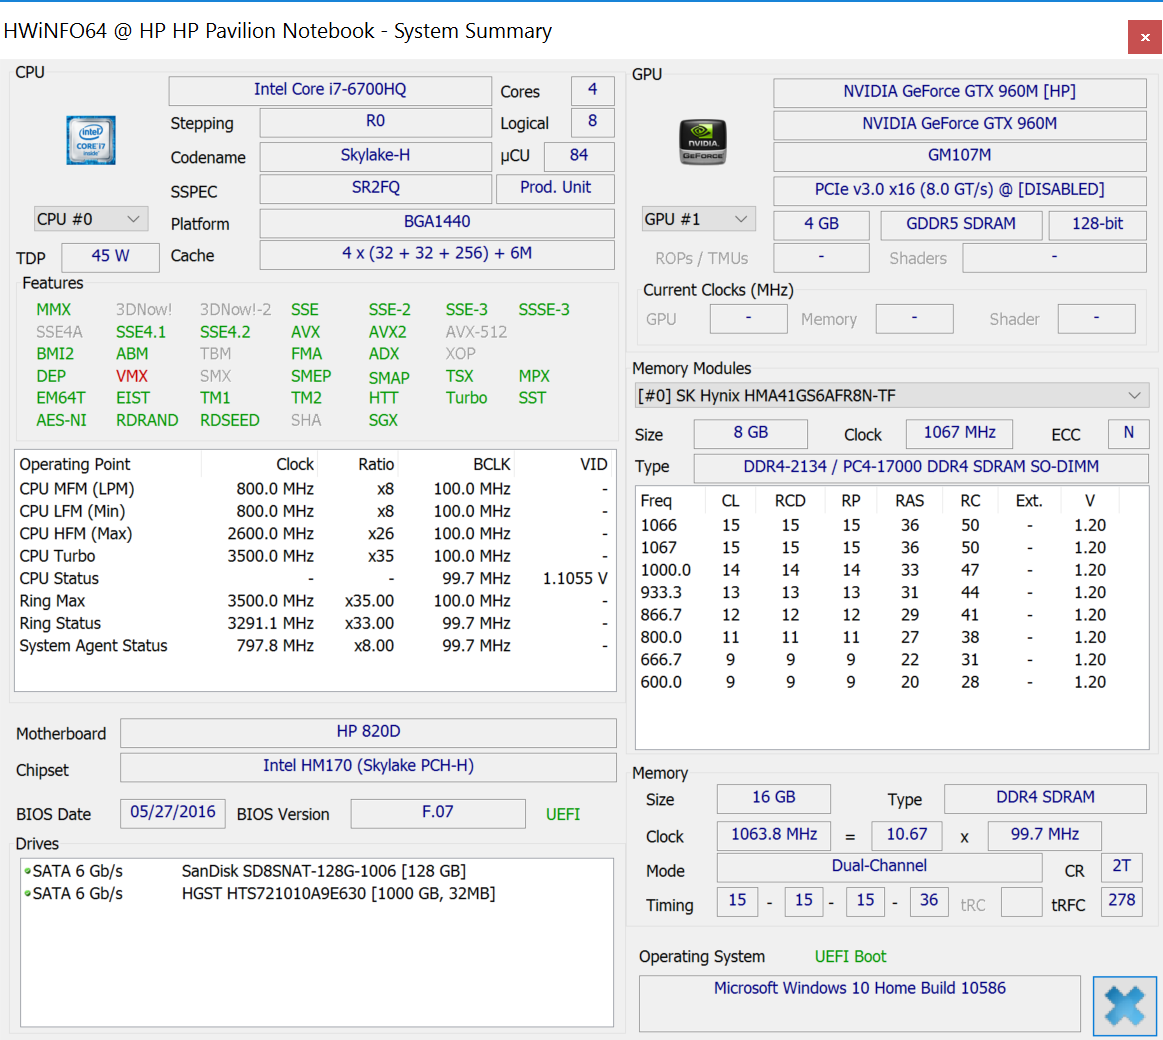
| HP Pavilion 15 UHD T9Y85AV GeForce GTX 960M, 6700HQ, SanDisk Z400s SD8SNAT-128G | HP Pavilion 15-ak003ng GeForce GTX 950M, 6700HQ, Samsung CM871 MZNLF128HCHP | MSI GL62-6QFi781H11 GeForce GTX 960M, 6700HQ, Toshiba HG6 THNSNJ128G8NY | Asus ZenBook Pro UX501VW-DS71T GeForce GTX 960M, 6700HQ, Samsung SM951 MZVPV512HDGL m.2 PCI-e | HP Omen 15-ax007ng GeForce GTX 965M, 6700HQ, Adata IM2S3138E-128GM-B | |
|---|---|---|---|---|---|
| Noise | -7% | -5% | 8% | -3% | |
| off / environment * (dB) | 29.5 | 30 -2% | 30 -2% | ||
| Idle Minimum * (dB) | 32.3 | 34 -5% | 35 -8% | 28.9 11% | 32 1% |
| Idle Average * (dB) | 32.4 | 35 -8% | 36 -11% | 28.9 11% | 33 -2% |
| Idle Maximum * (dB) | 32.4 | 36 -11% | 37 -14% | 30.2 7% | 36 -11% |
| Load Average * (dB) | 40.5 | 44 -9% | 41 -1% | 41.8 -3% | 43 -6% |
| Load Maximum * (dB) | 50.3 | 51 -1% | 46 9% | 43.9 13% | 49 3% |
* ... smaller is better
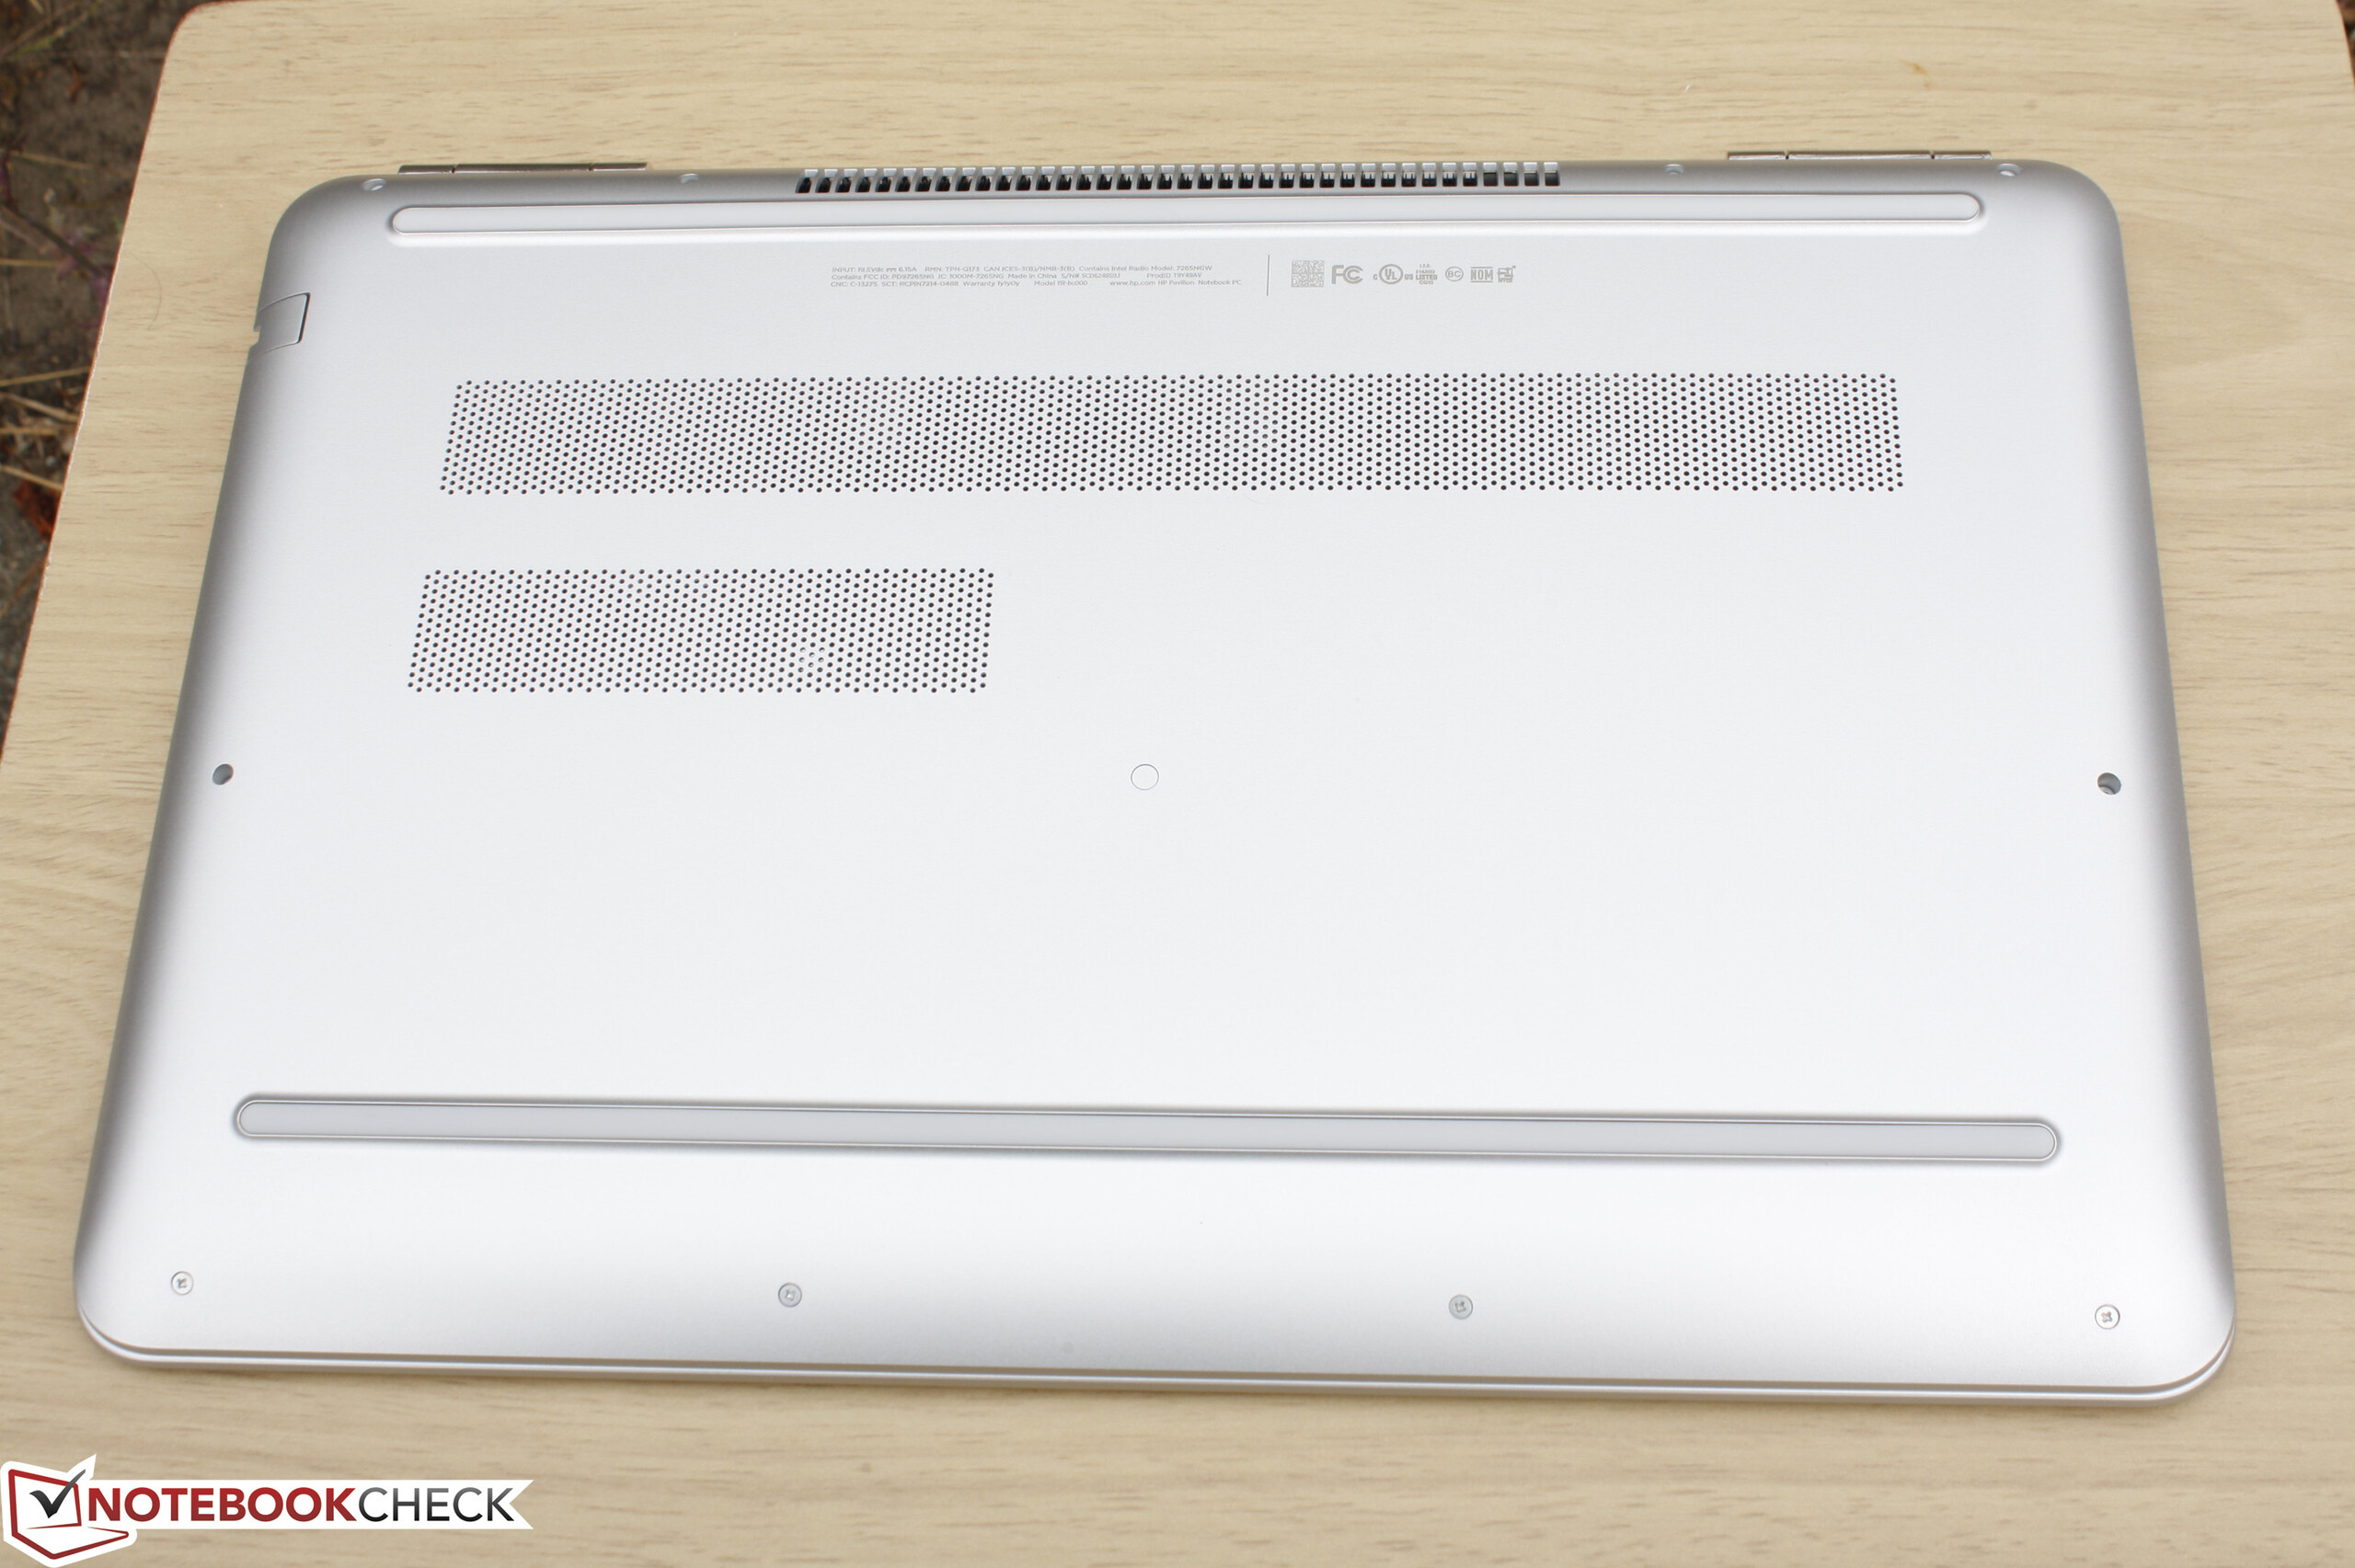
(±) The maximum temperature on the upper side is 41 °C / 106 F, compared to the average of 40.4 °C / 105 F, ranging from 21.2 to 68.8 °C for the class Gaming.
(±) The bottom heats up to a maximum of 42.6 °C / 109 F, compared to the average of 43.2 °C / 110 F
(+) In idle usage, the average temperature for the upper side is 23.7 °C / 75 F, compared to the device average of 33.9 °C / 93 F.
(±) The palmrests and touchpad can get very hot to the touch with a maximum of 37.2 °C / 99 F.
(-) The average temperature of the palmrest area of similar devices was 28.8 °C / 83.8 F (-8.4 °C / -15.2 F).
HP Pavilion 15 UHD T9Y85AV audio analysis
(-) | not very loud speakers (64 dB)
Analysis not possible as minimum curve is missing or too high
Apple MacBook 12 (Early 2016) 1.1 GHz audio analysis
(+) | speakers can play relatively loud (83.6 dB)
Bass 100 - 315 Hz
(±) | reduced bass - on average 11.3% lower than median
(±) | linearity of bass is average (14.2% delta to prev. frequency)
Mids 400 - 2000 Hz
(+) | balanced mids - only 2.4% away from median
(+) | mids are linear (5.5% delta to prev. frequency)
Highs 2 - 16 kHz
(+) | balanced highs - only 2% away from median
(+) | highs are linear (4.5% delta to prev. frequency)
Overall 100 - 16.000 Hz
(+) | overall sound is linear (10.2% difference to median)
Compared to same class
» 7% of all tested devices in this class were better, 2% similar, 90% worse
» The best had a delta of 5%, average was 18%, worst was 53%
Compared to all devices tested
» 5% of all tested devices were better, 1% similar, 94% worse
» The best had a delta of 4%, average was 23%, worst was 134%
Schenker F516 Flex audio analysis
(-) | not very loud speakers (69 dB)
Analysis not possible as minimum curve is missing or too high
| Off / Standby | |
| Idle | |
| Load |
|
Key:
min: | |
| HP Pavilion 15 UHD T9Y85AV 6700HQ, GeForce GTX 960M, SanDisk Z400s SD8SNAT-128G, IPS, 3840x2160, 15.6" | HP Pavilion 15-ak003ng 6700HQ, GeForce GTX 950M, Samsung CM871 MZNLF128HCHP, IPS, 1920x1080, 15.6" | MSI GL62-6QFi781H11 6700HQ, GeForce GTX 960M, Toshiba HG6 THNSNJ128G8NY, TN LED, 1920x1080, 15.6" | Asus Zenbook Pro UX501JW-FI218H 4720HQ, GeForce GTX 960M, SanDisk SD7SN3Q128G1002, IPS, 3840x2160, 15.6" | HP Omen 15-ax007ng 6700HQ, GeForce GTX 965M, Adata IM2S3138E-128GM-B, IPS, 1920x1080, 15.6" | |
|---|---|---|---|---|---|
| Power Consumption | 14% | -8% | -24% | 4% | |
| Idle Minimum * (Watt) | 8.3 | 7 16% | 10 -20% | 15.6 -88% | 7 16% |
| Idle Average * (Watt) | 14.8 | 11 26% | 14 5% | 20.5 -39% | 11 26% |
| Idle Maximum * (Watt) | 16.8 | 17 -1% | 19 -13% | 21.2 -26% | 19 -13% |
| Load Average * (Watt) | 71 | 69 3% | 82 -15% | 75.8 -7% | 79 -11% |
| Load Maximum * (Watt) | 119.2 | 89 25% | 118 1% | 72.9 39% | 119 -0% |
* ... smaller is better
| HP Pavilion 15 UHD T9Y85AV 6700HQ, GeForce GTX 960M, 61.5 Wh | HP Pavilion 15-ak003ng 6700HQ, GeForce GTX 950M, 48 Wh | MSI GL62-6QFi781H11 6700HQ, GeForce GTX 960M, 41.4 Wh | Asus ZenBook Pro UX501VW-DS71T 6700HQ, GeForce GTX 960M, 96 Wh | HP Omen 15-ax007ng 6700HQ, GeForce GTX 965M, 61.5 Wh | |
|---|---|---|---|---|---|
| Battery runtime | -3% | -33% | 34% | -2% | |
| Reader / Idle (h) | 8.5 | 9.5 12% | 5.7 -33% | 11.5 35% | 7.8 -8% |
| WiFi v1.3 (h) | 4.4 | 5.1 16% | 2.6 -41% | 6.3 43% | 4.5 2% |
| Load (h) | 1.6 | 1 -37% | 1.2 -25% | 2 25% | 1.6 0% |
Pros
Cons
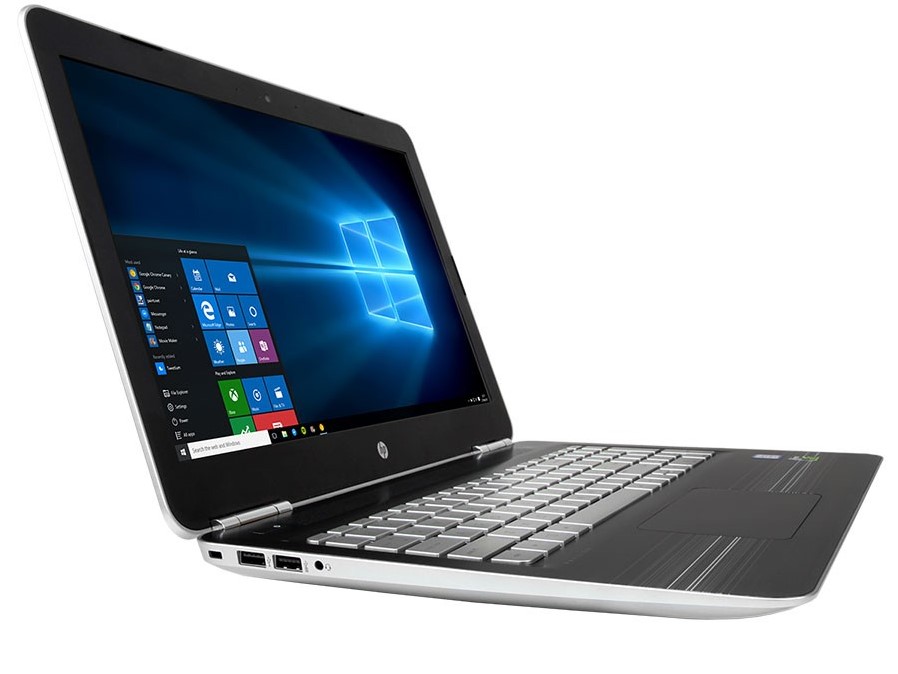

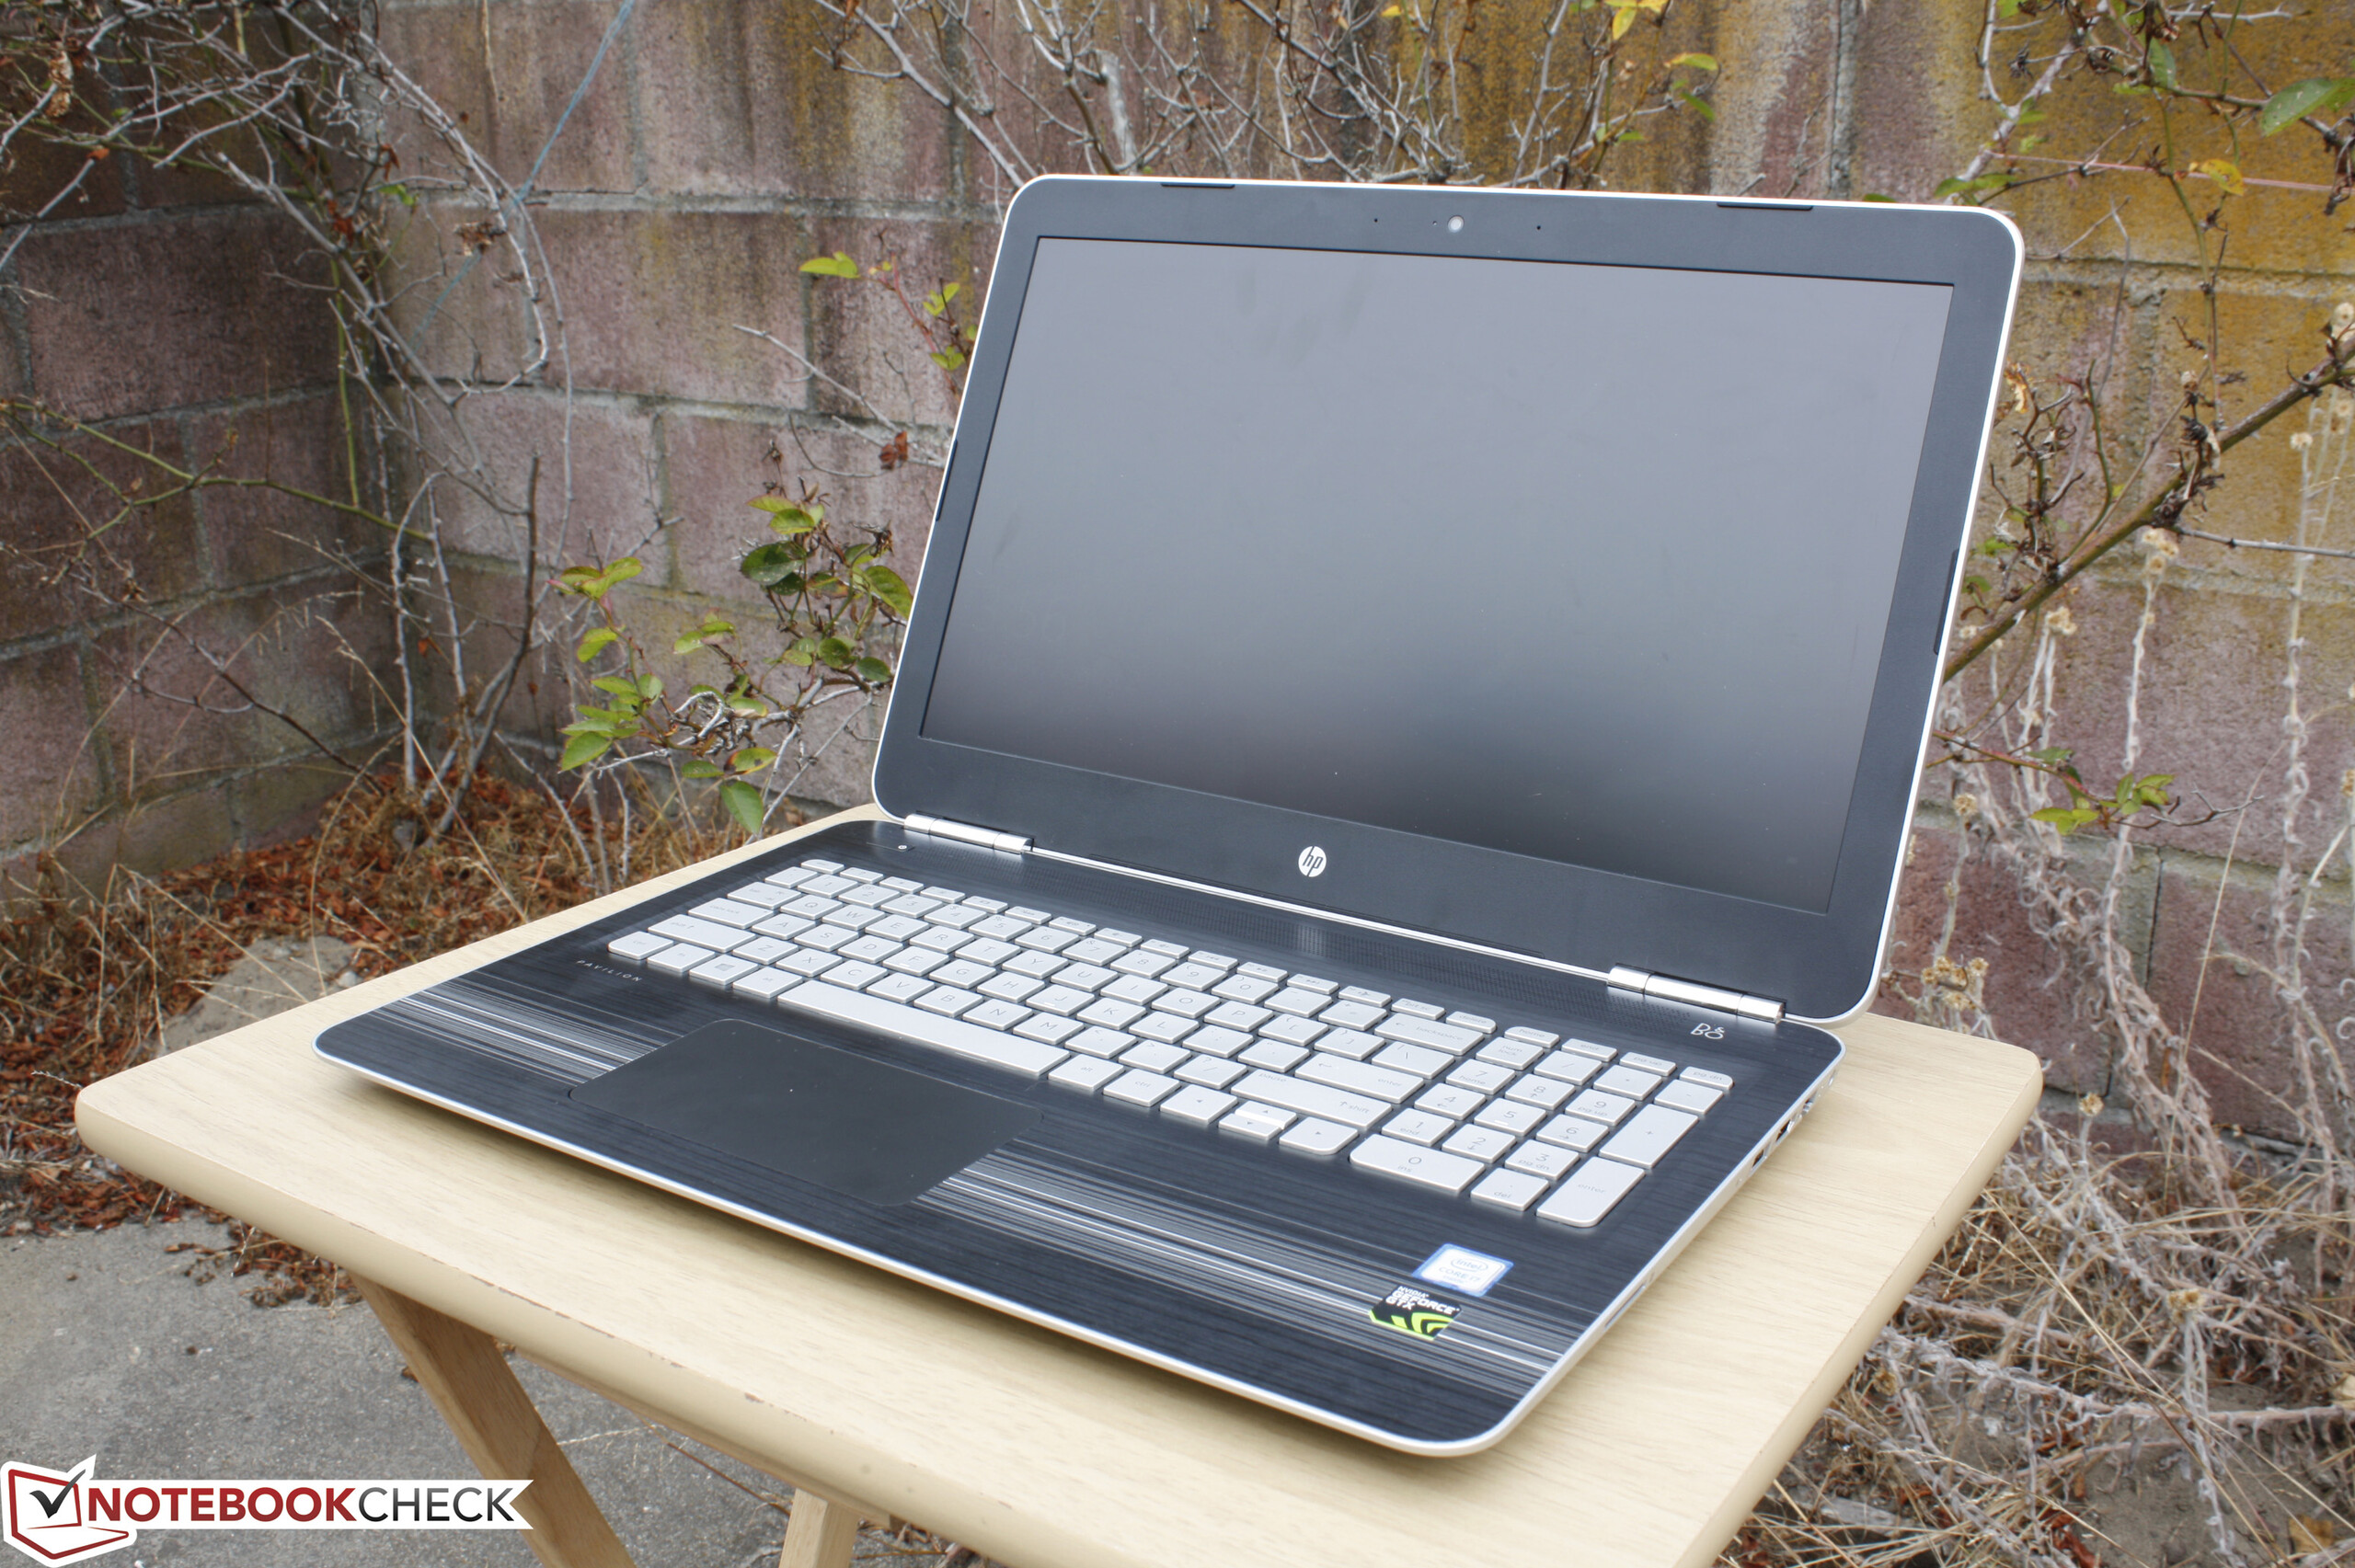
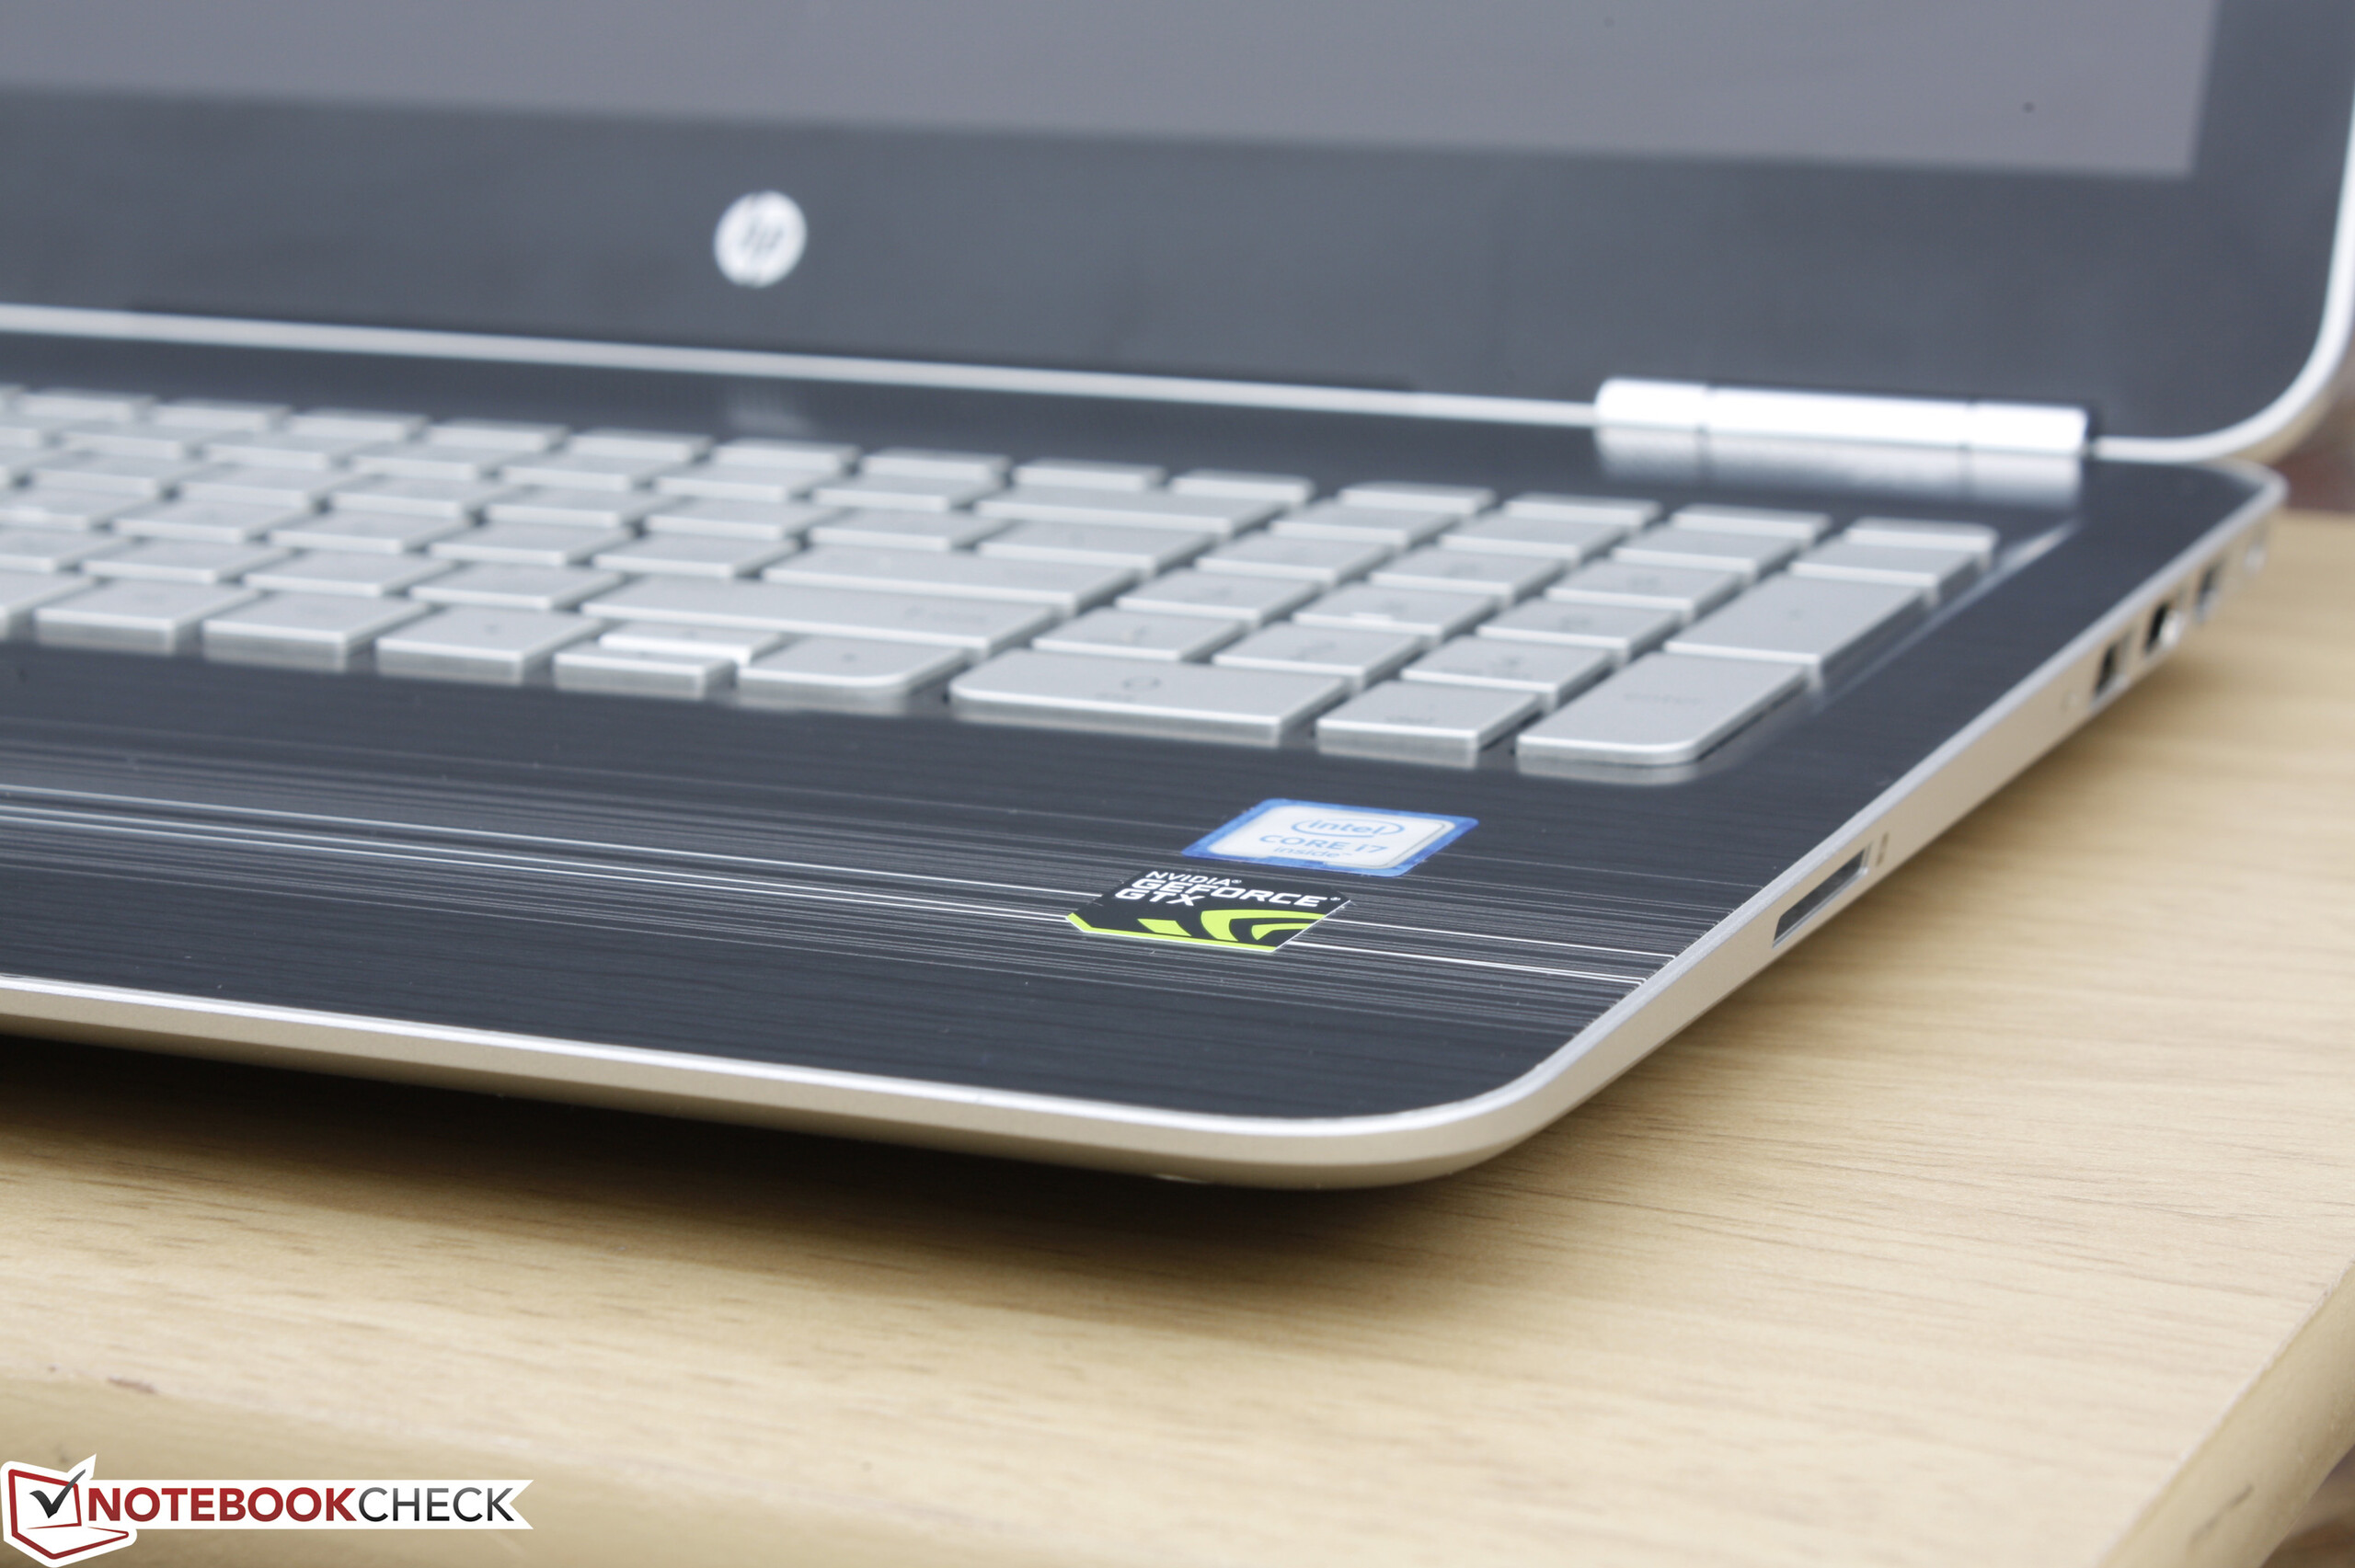
新的Pavilion 15配置介于搭配GTX 950M的2015年Pavilion 15机型和几周前发布的搭配GTX 965M的Omen 15之间。因此,它的定价也比显卡性能更强的Omen 15低几百美元。因为除此之外这两个机型几乎相同,Pavilion 15对于预算在1000美元左右希望得到出色1080p游戏体验的用户是一个更有吸引力更实惠的选择。实际上它也是一台同时可以适合工作与娱乐的机型。
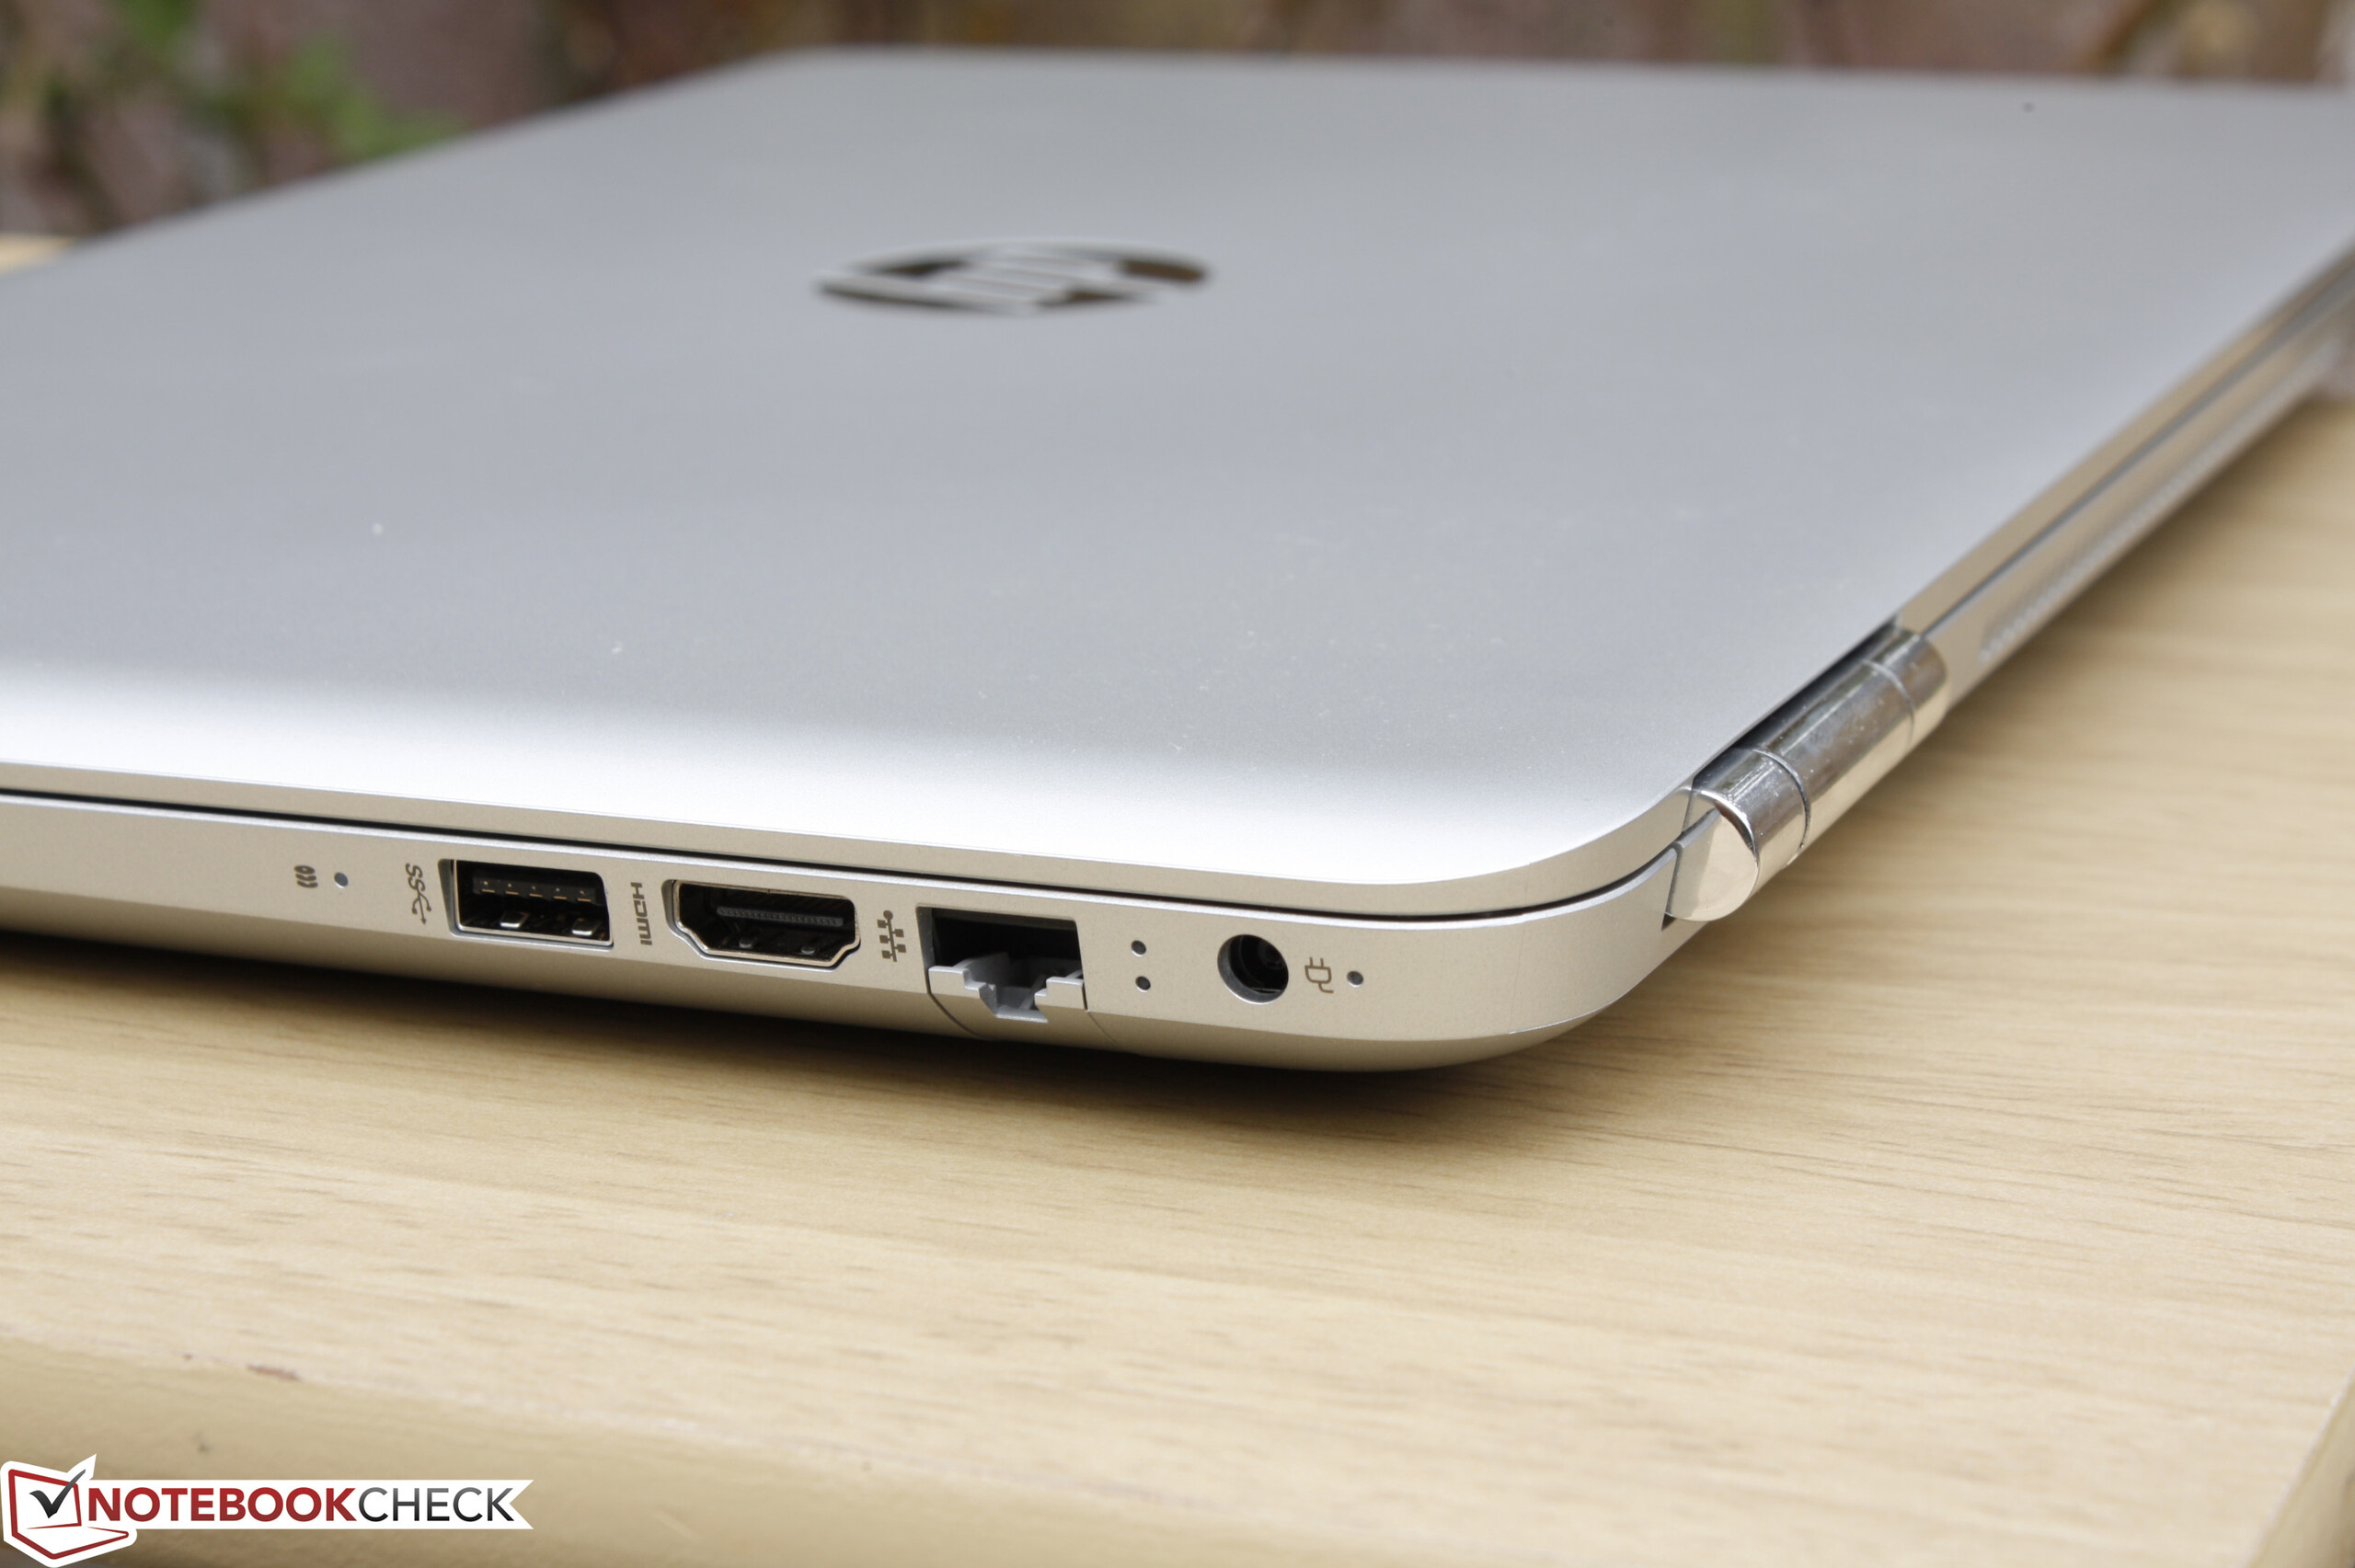
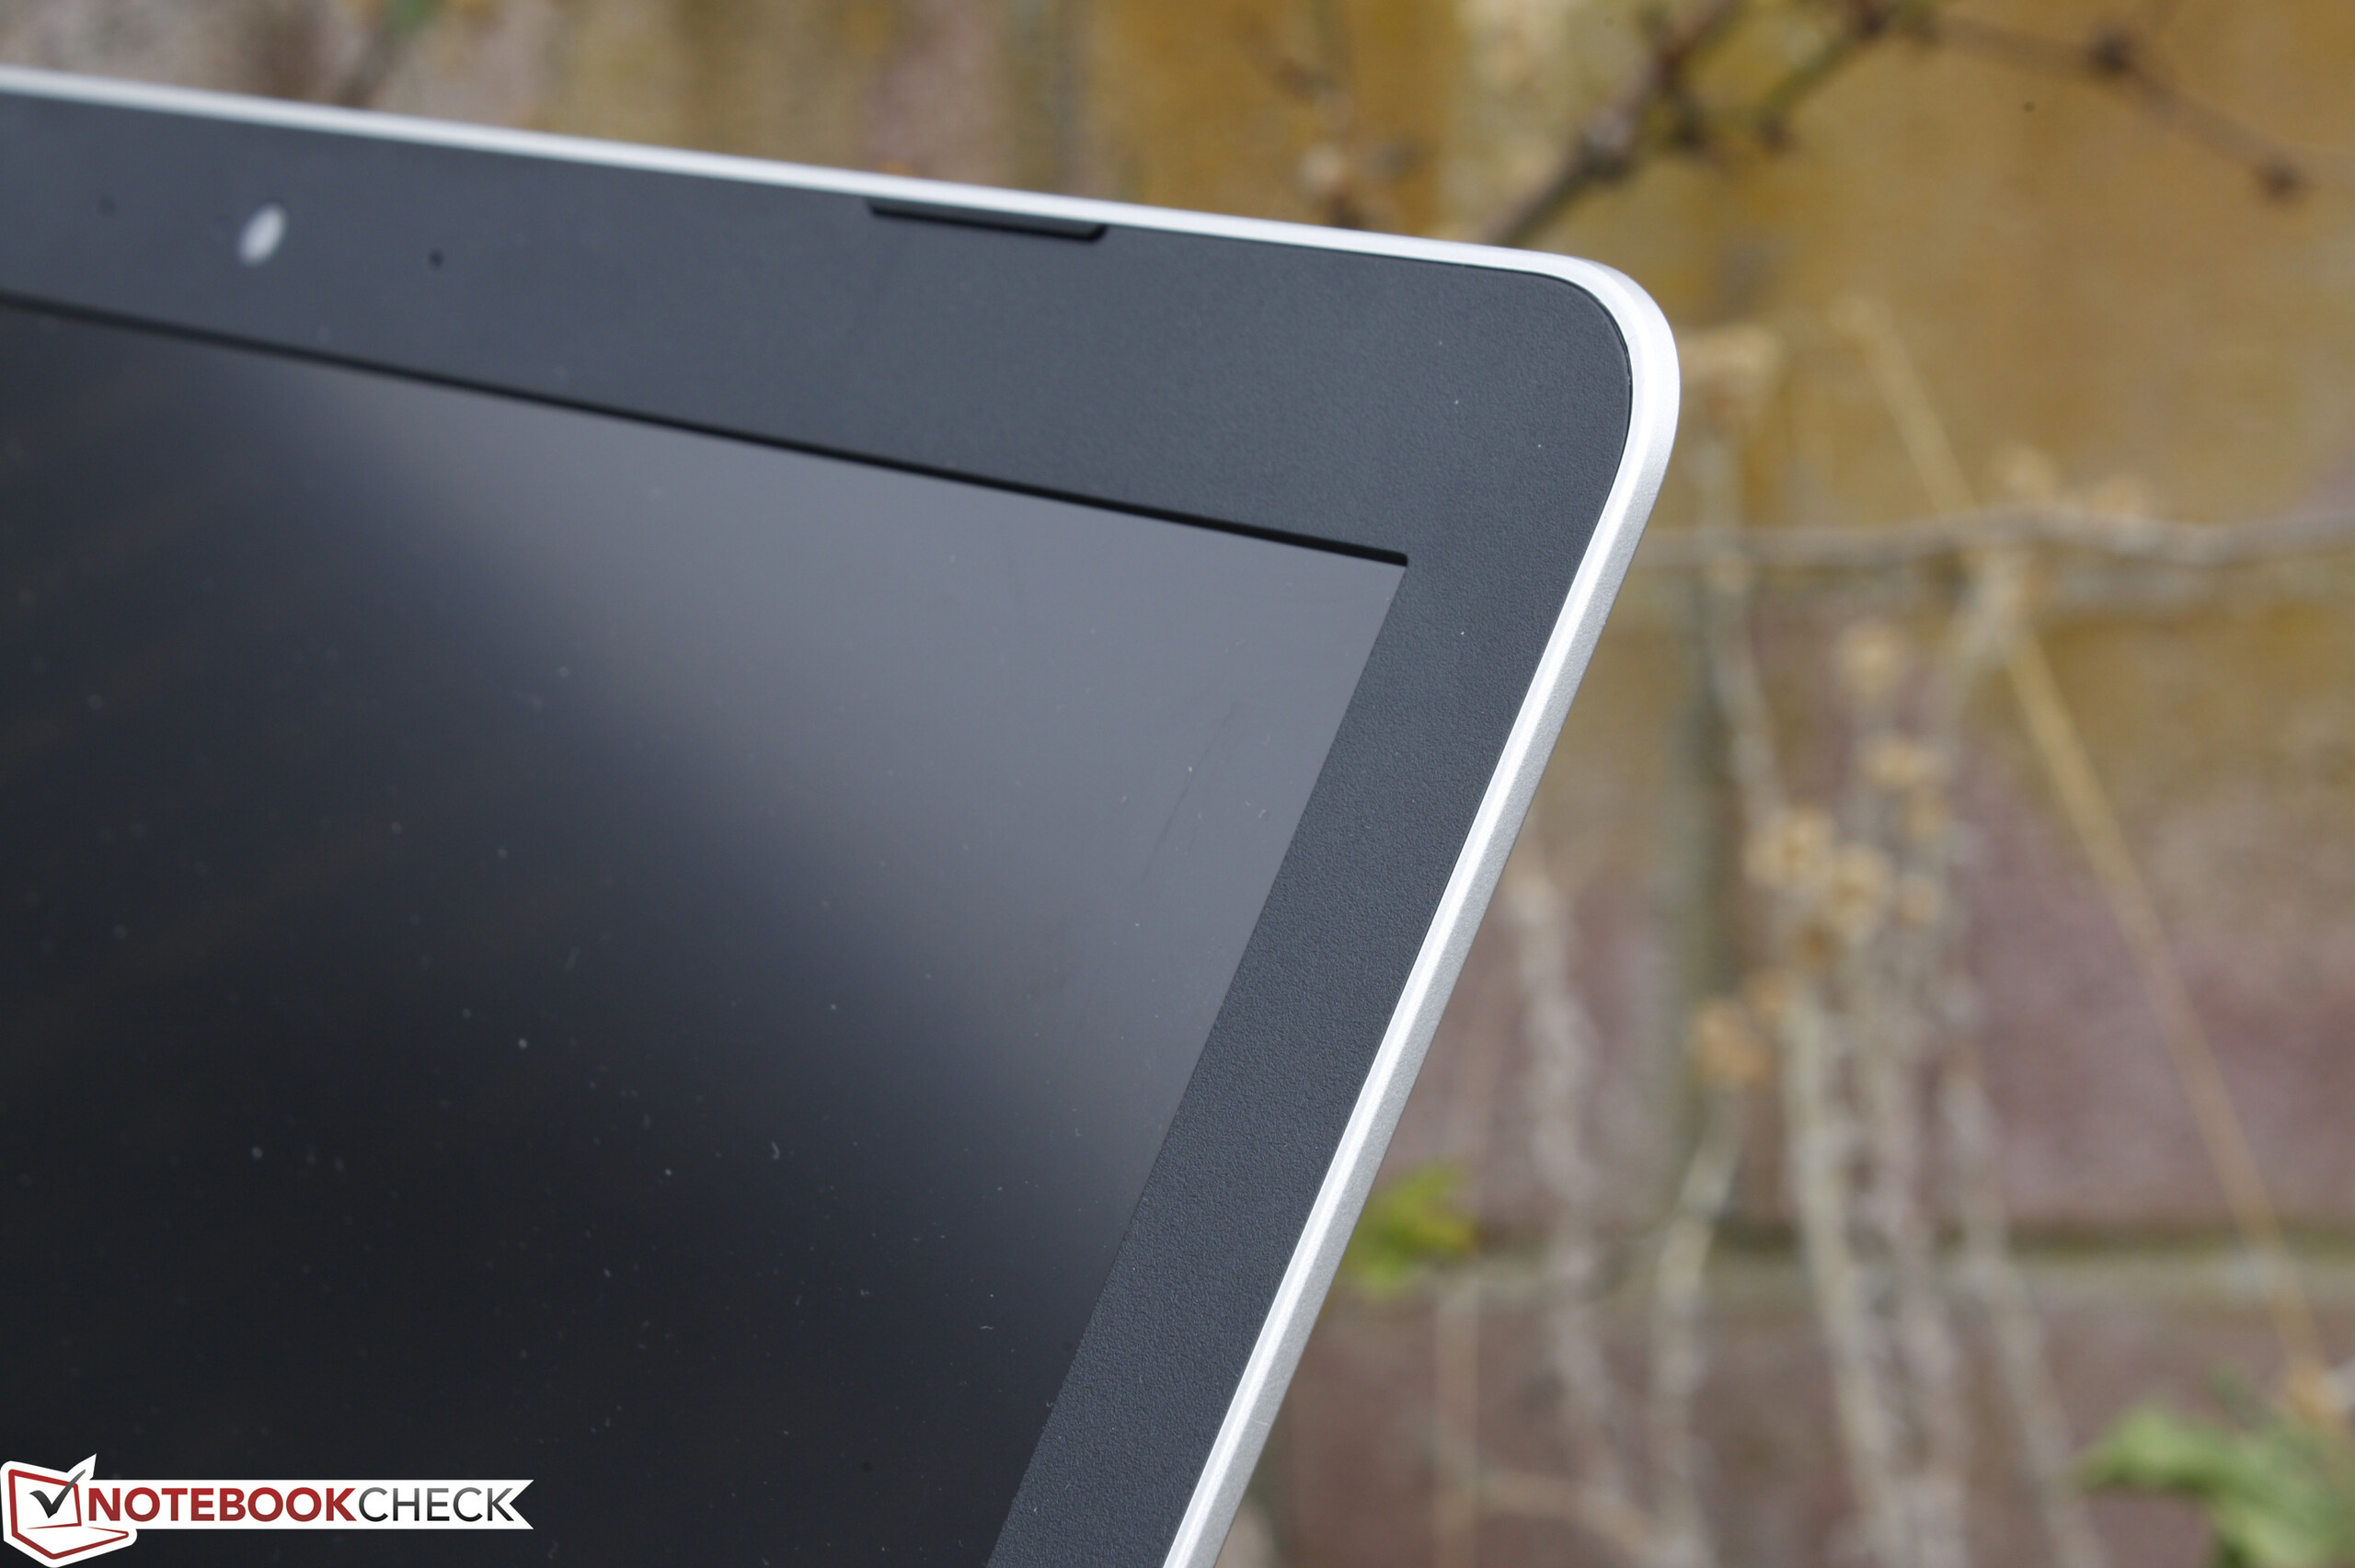
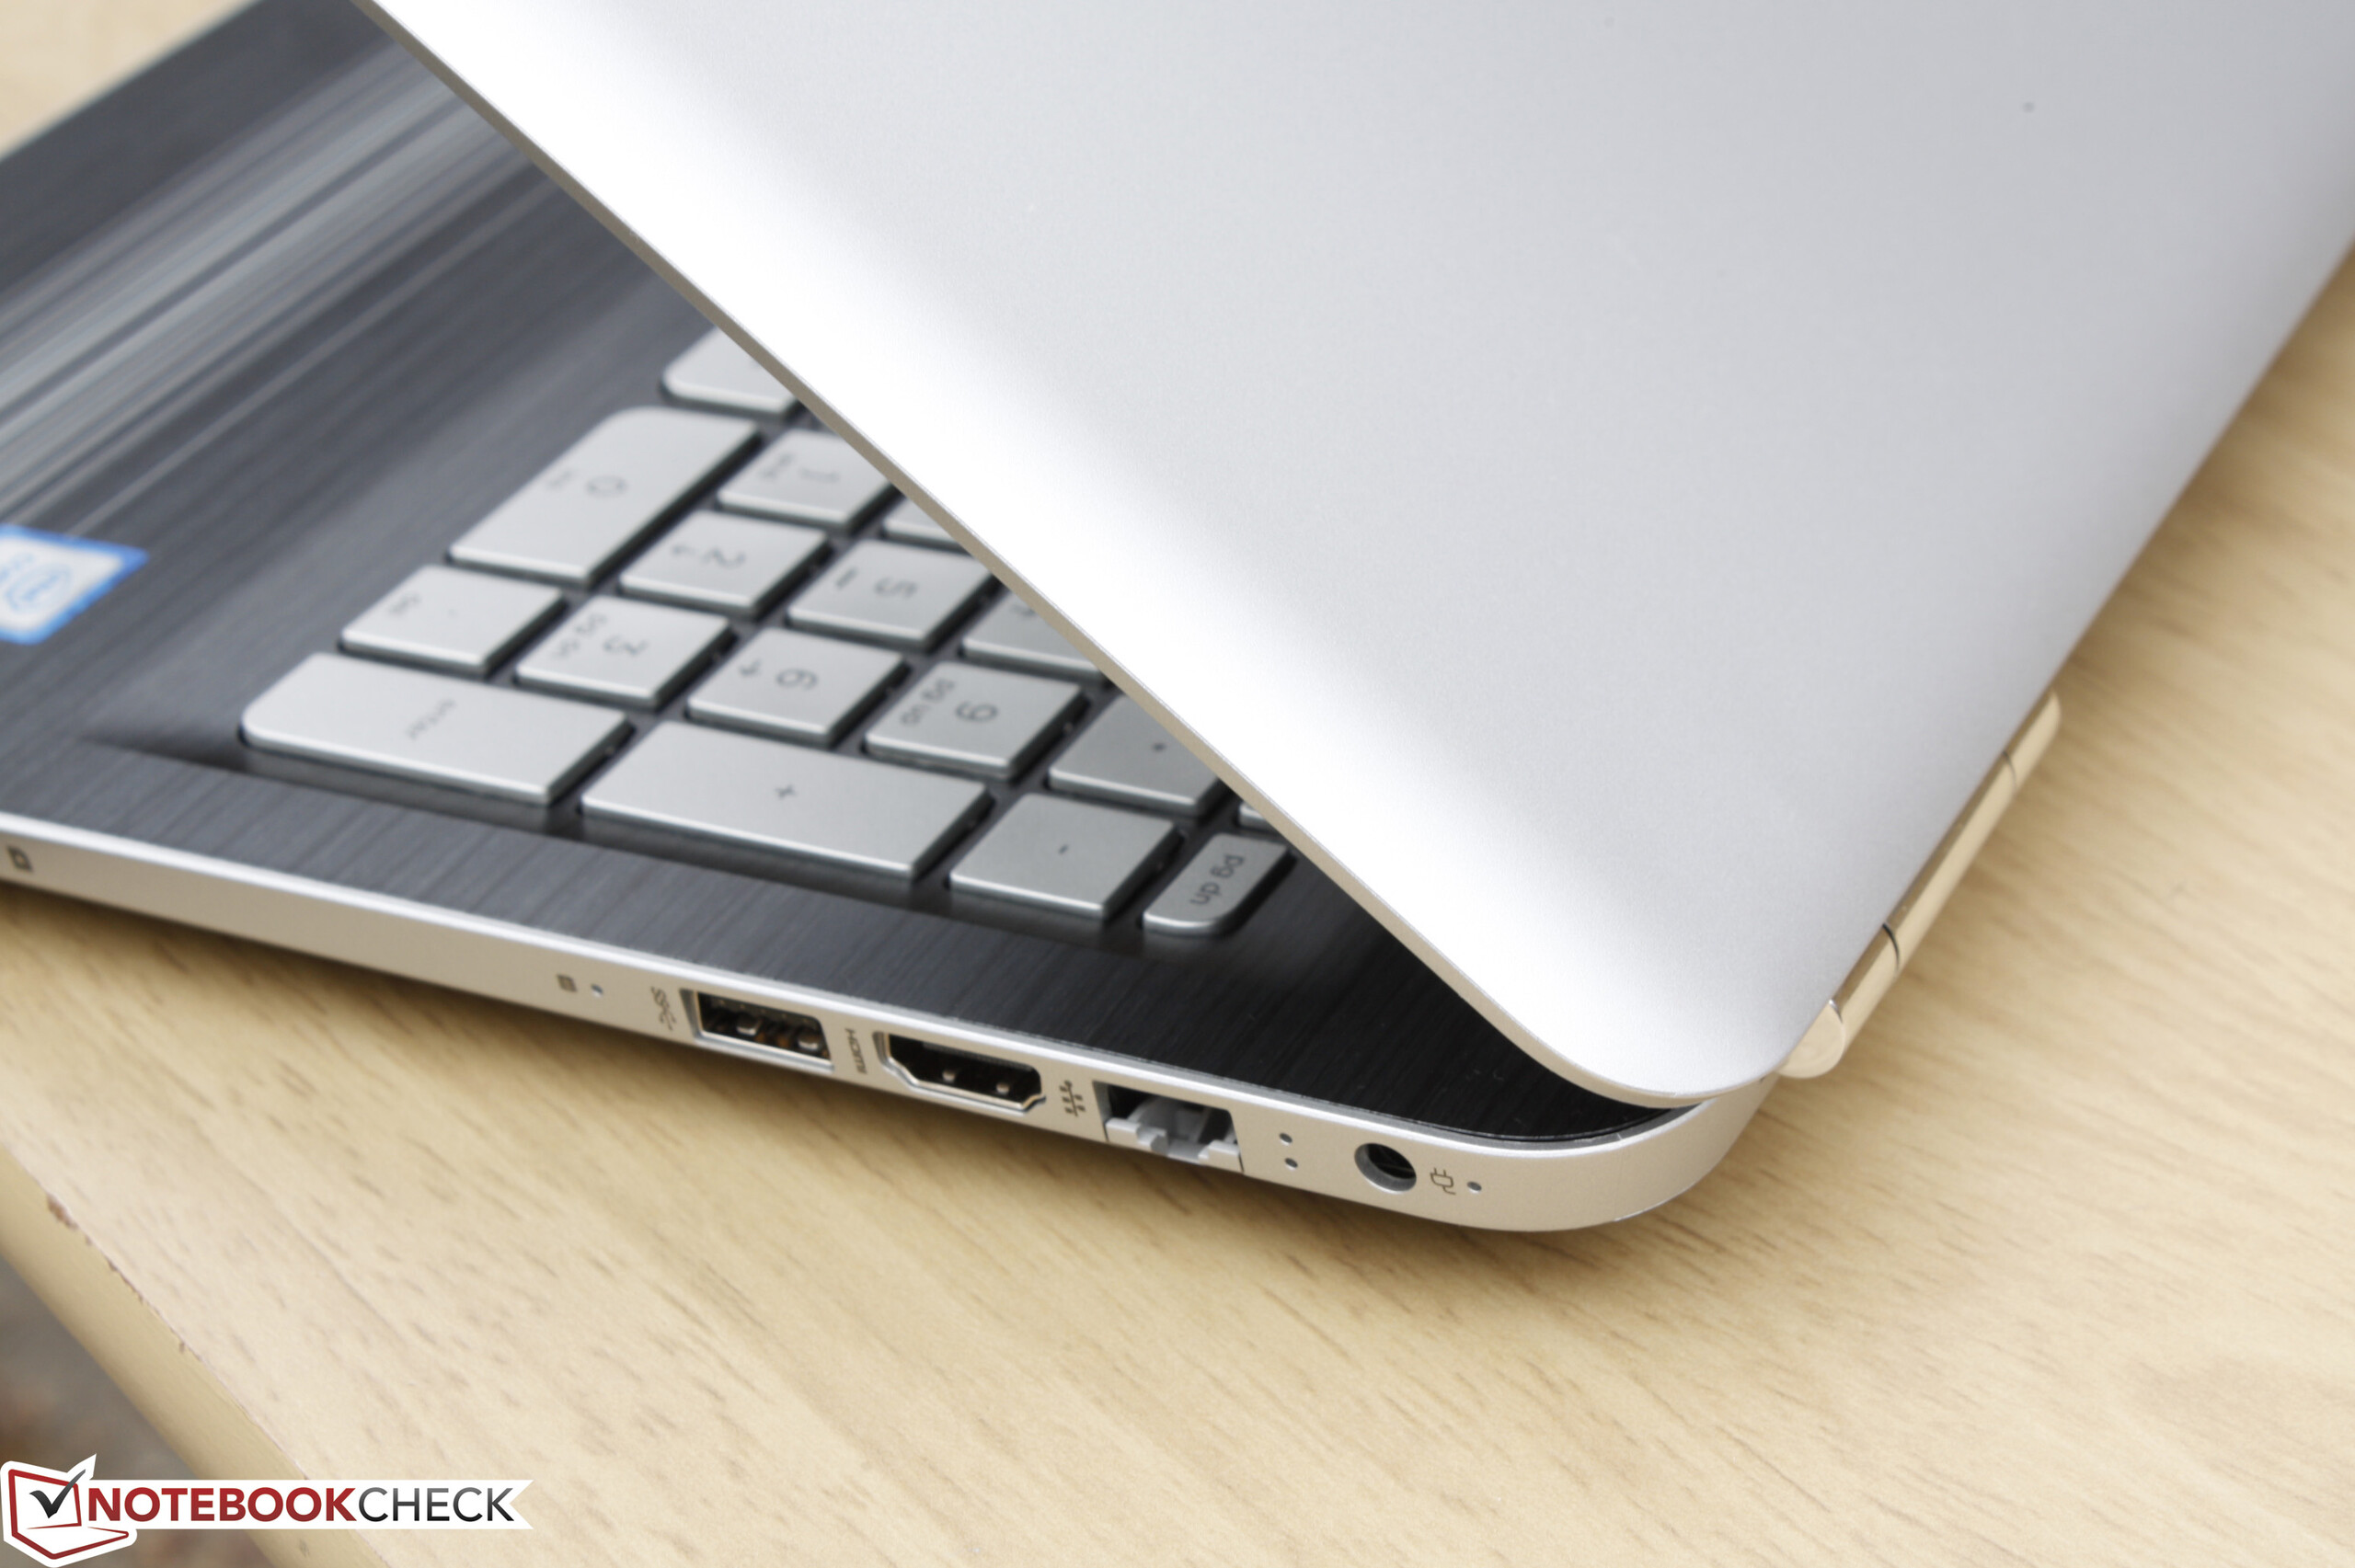
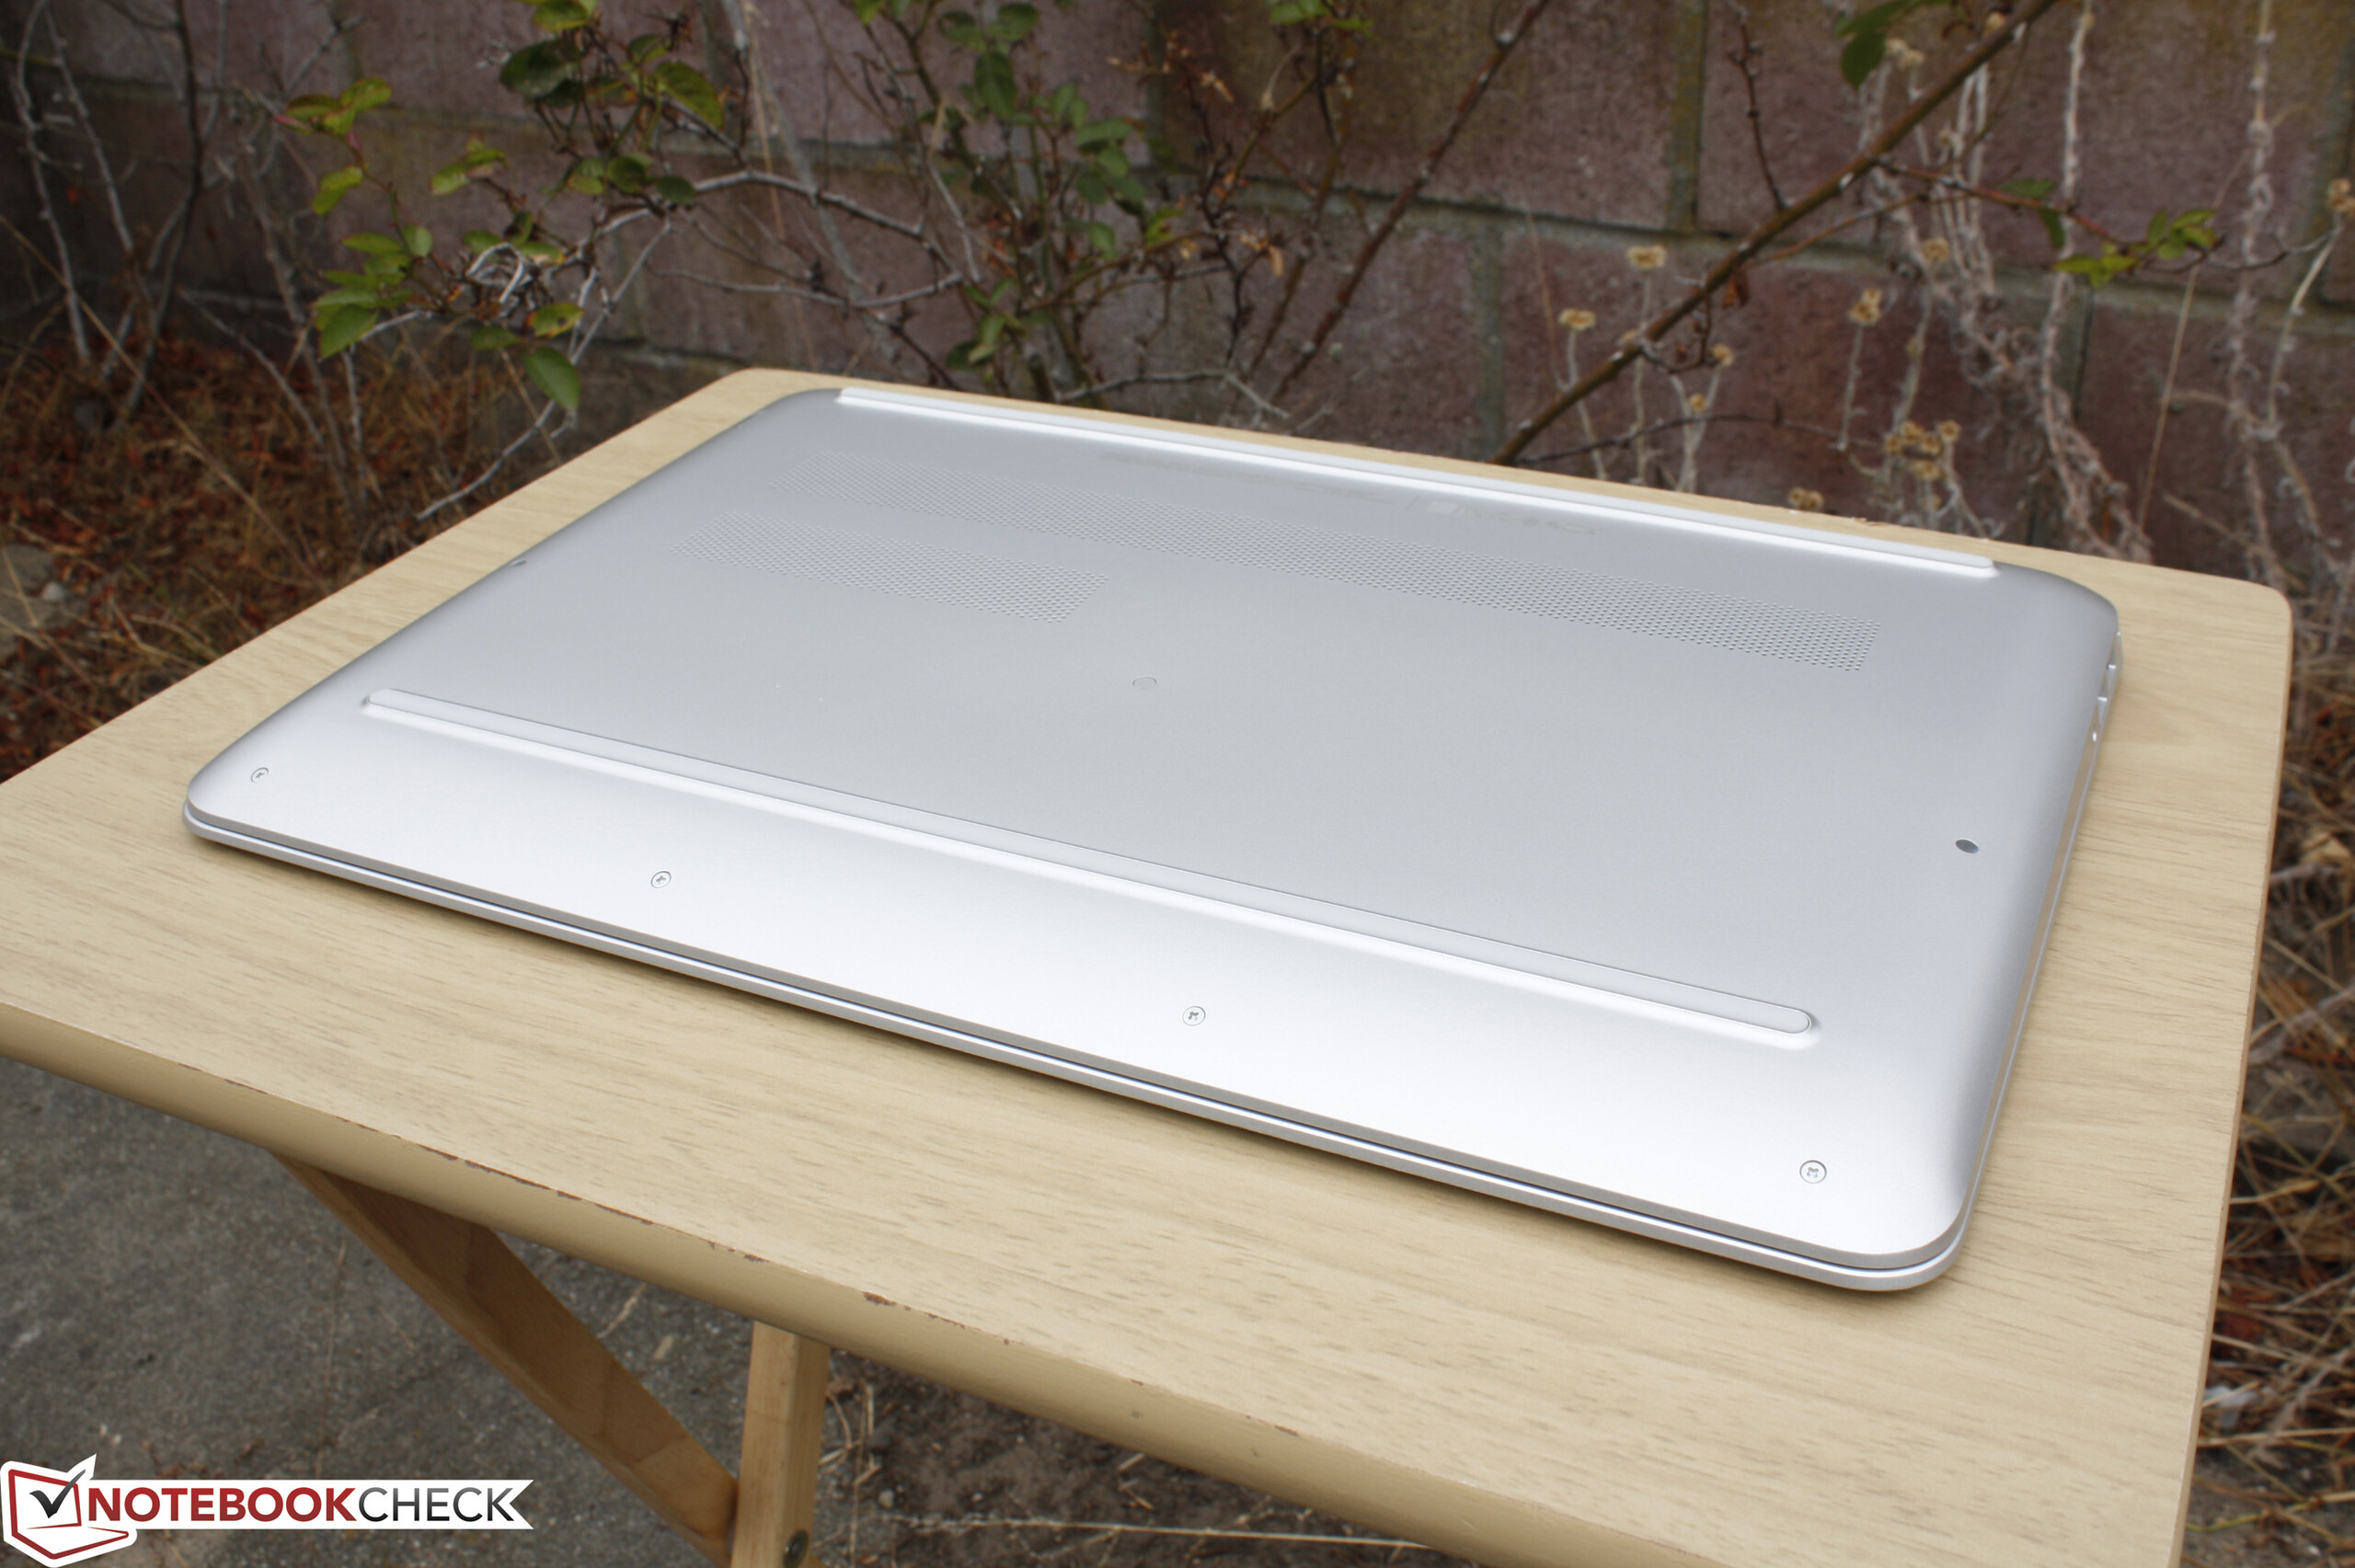
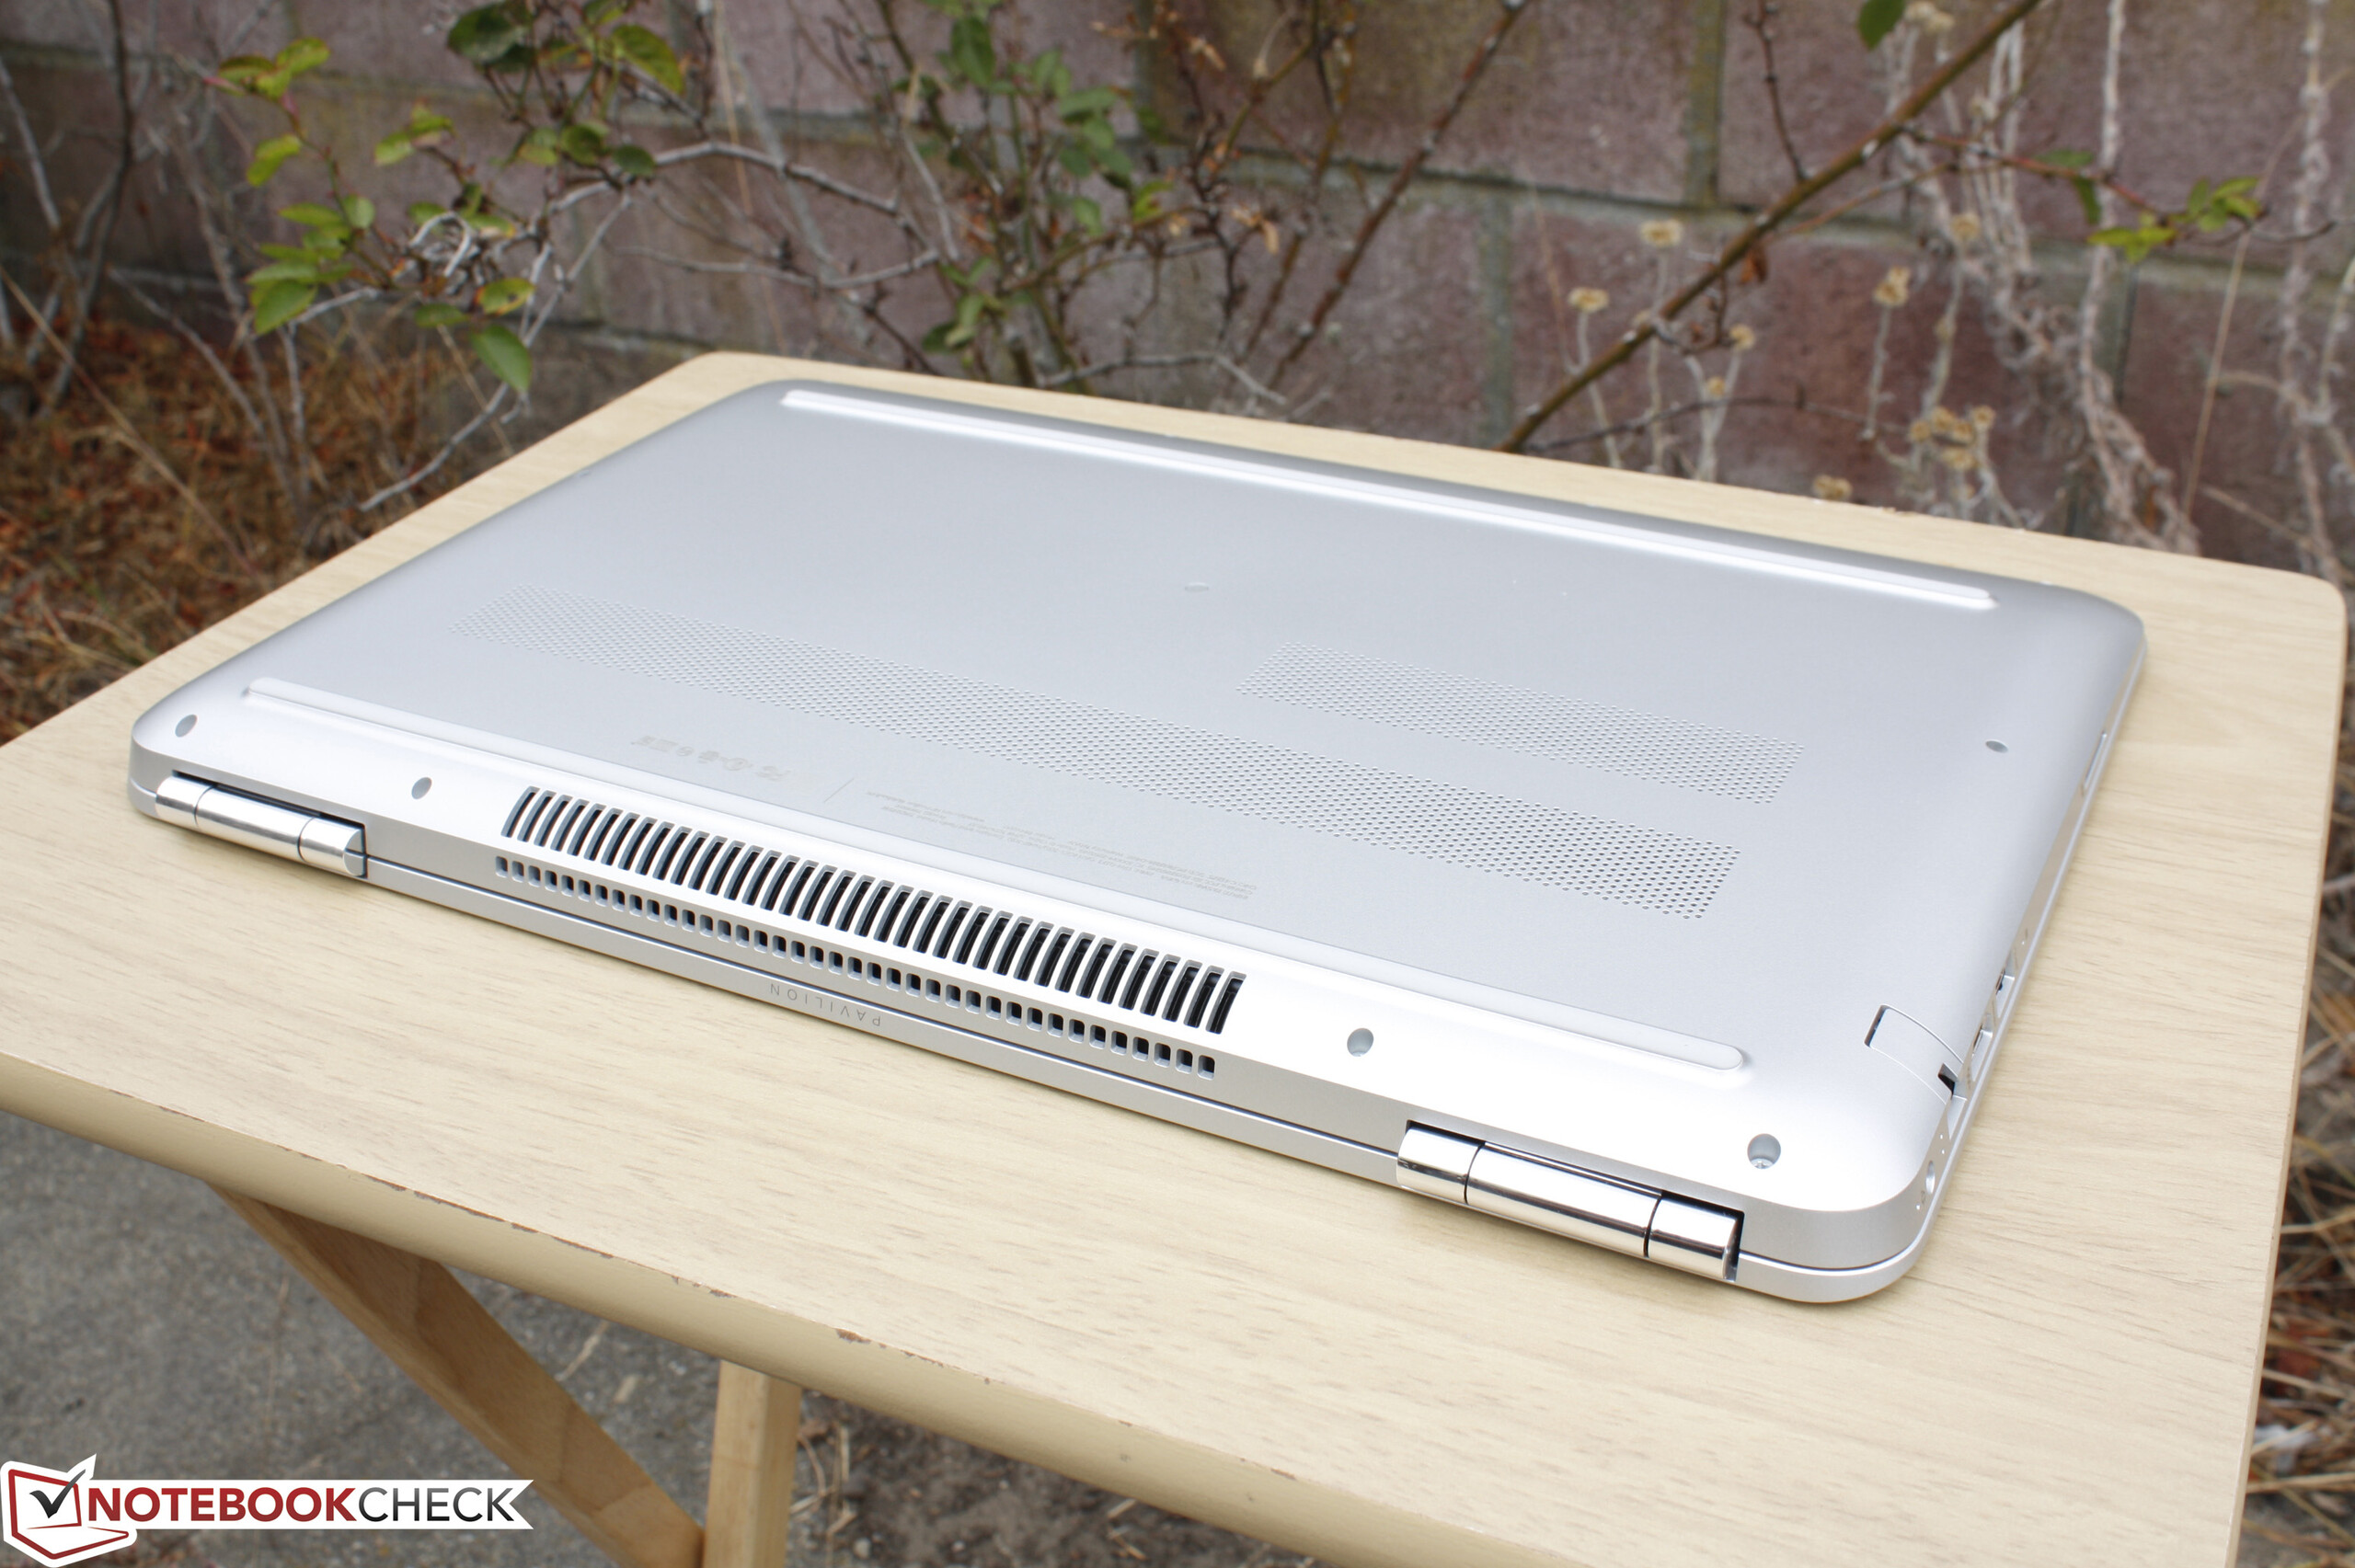
尽管性能不弱,最新Pavilion 15机身相比前代机型变化很小,没有什么出众的特点。如果不是因为华硕 UX501或戴尔 XPS 15,这也不会是个问题,它们都搭配了更坚固的机身和性能更高的GTX 960M显卡。XPS 15明显更轻更便携,它的强大存在让我们很难向读者推荐惠普的这台新机型。在这个层面上,Pavilion 15的最大优势是较低的售价和搭配显卡性能放弃超高清搭配全高清屏幕的选择。
它是一台比同类产品更实惠的多媒体游戏准系统。它的硬件配置和功能相比竞争对手都较为单薄,不过在核心性能上可以吸引预算有限的游戏玩家或其他需要全能型产品的用户。
注:本文是基于完整评测的缩减版本,阅读完整的英文评测,请点击这里。
HP Pavilion 15 UHD T9Y85AV
- 08/05/2016 v5.1 (old)
Allen Ngo
Price comparison
