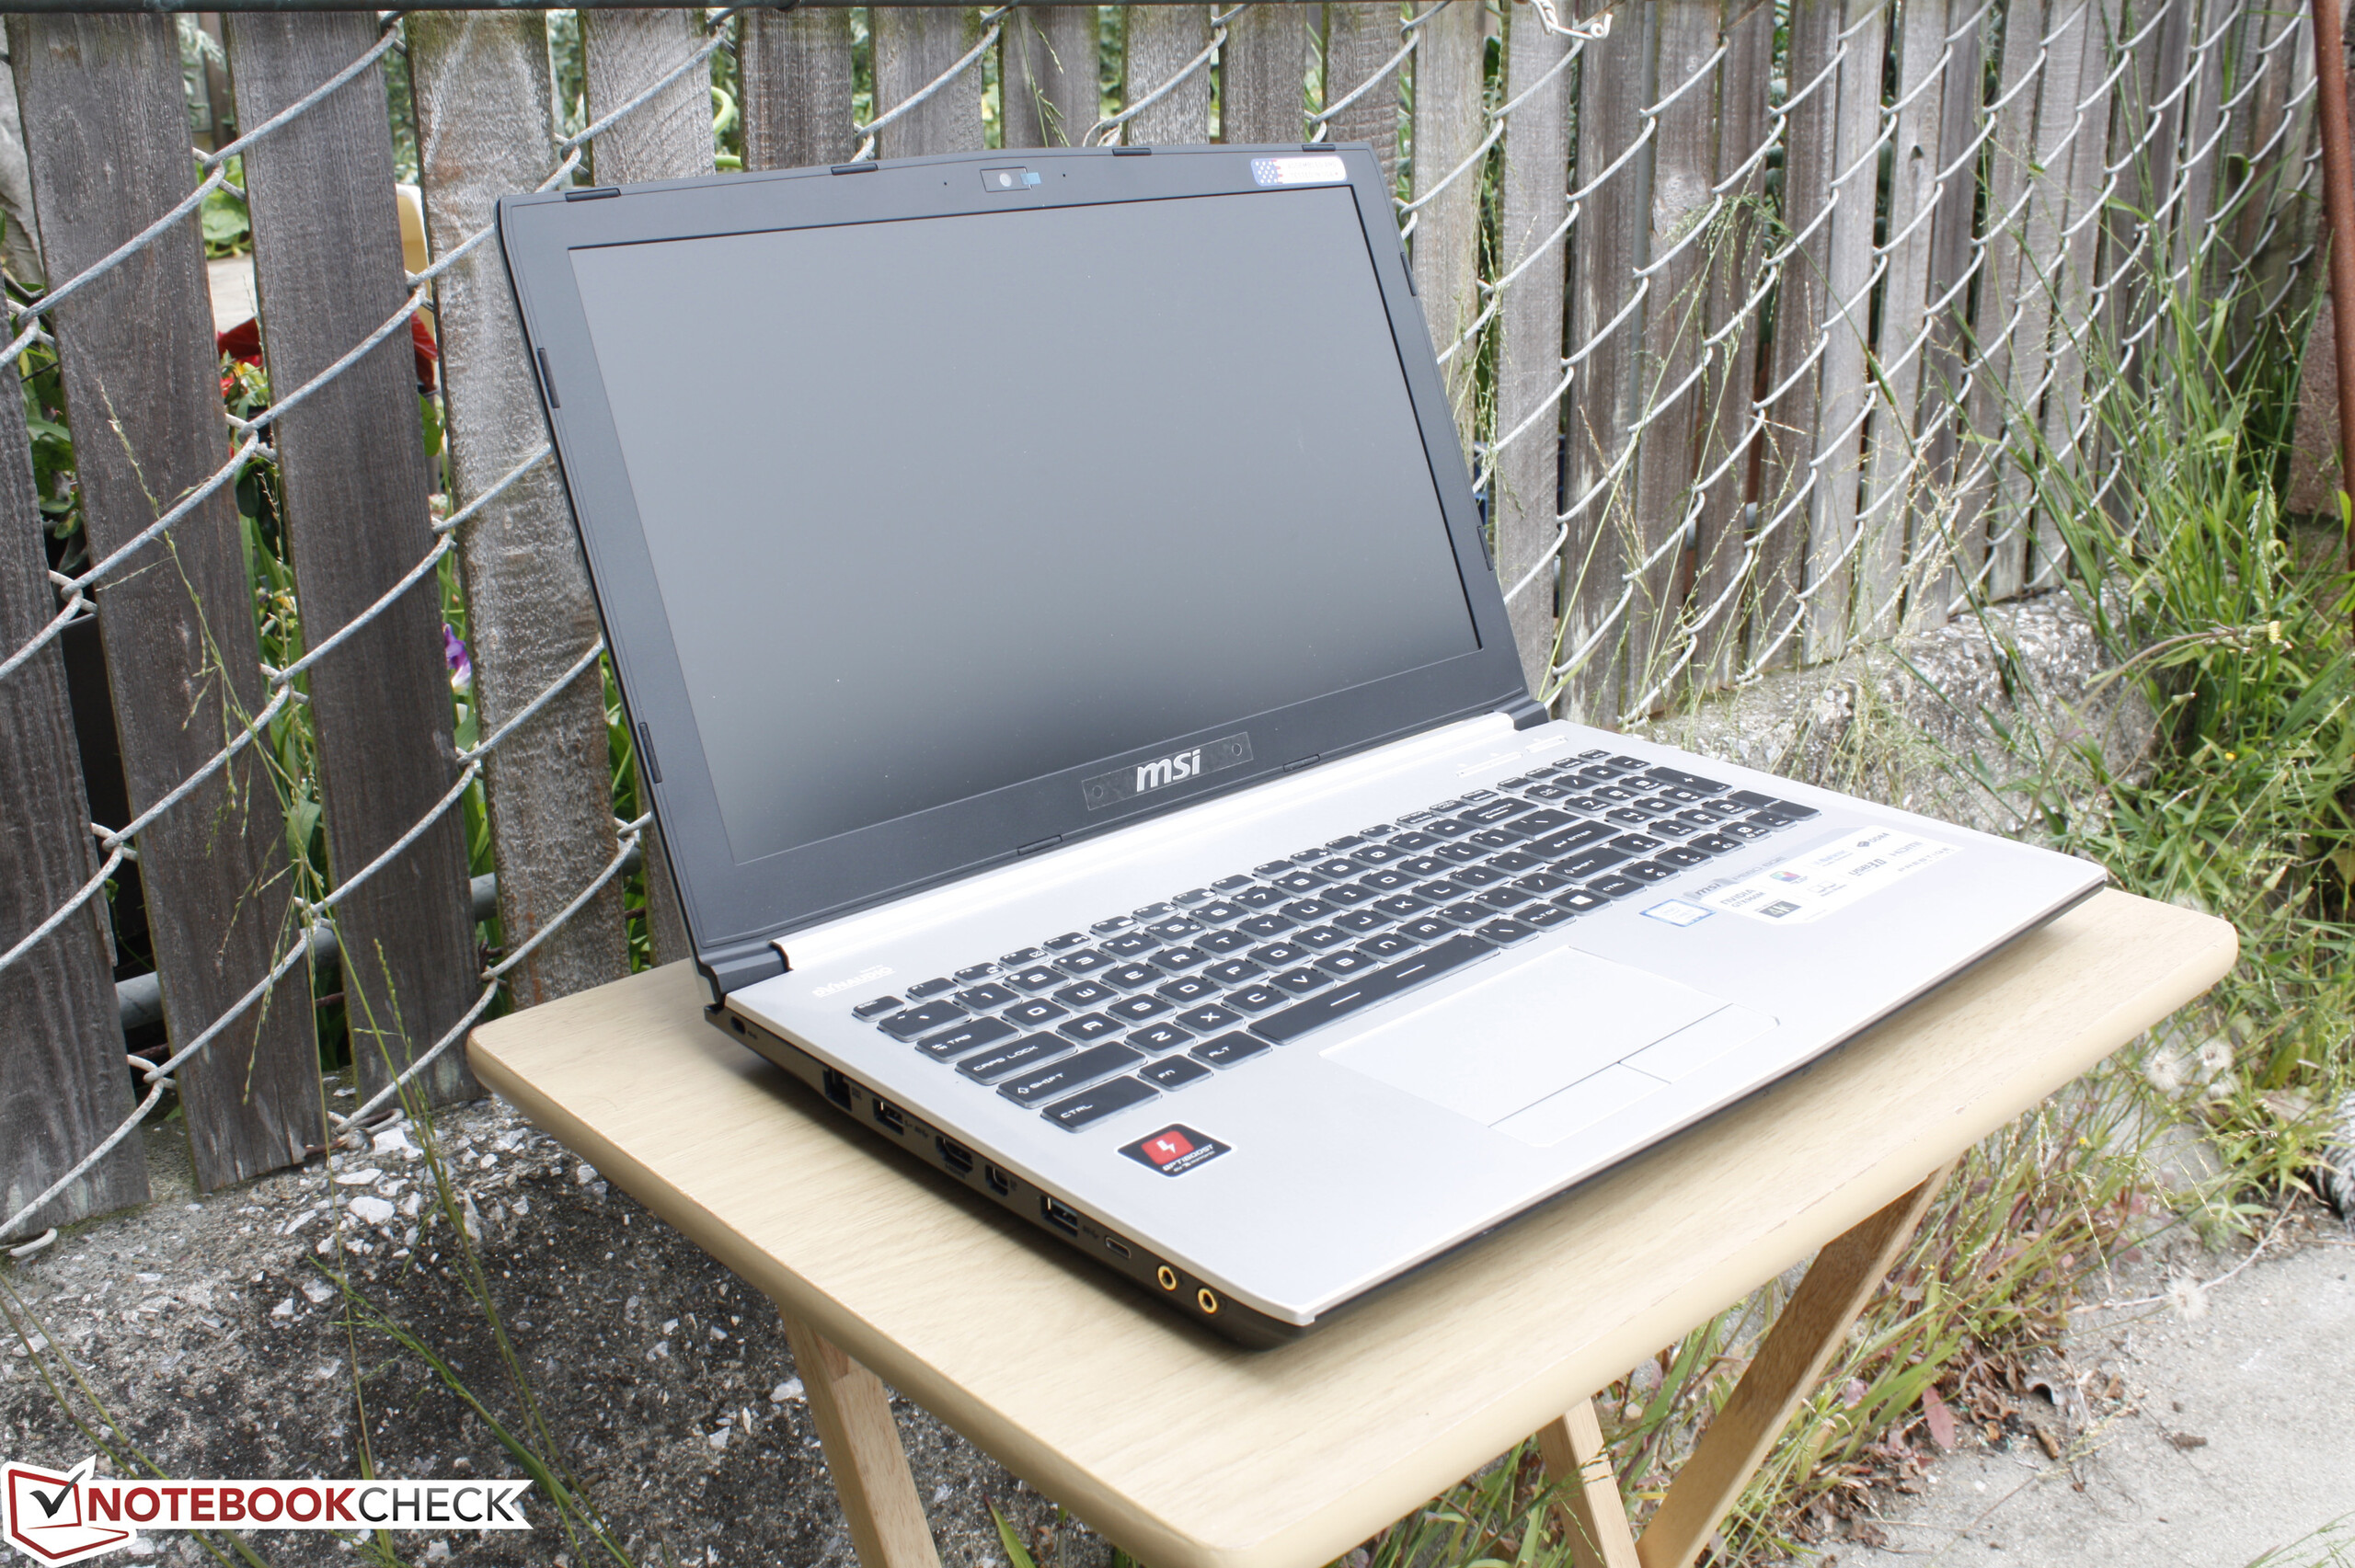
微星 PE60 6QE Prestige iBuyPower Edition 笔记本电脑简短评测


| |||||||||||||||||||||||||
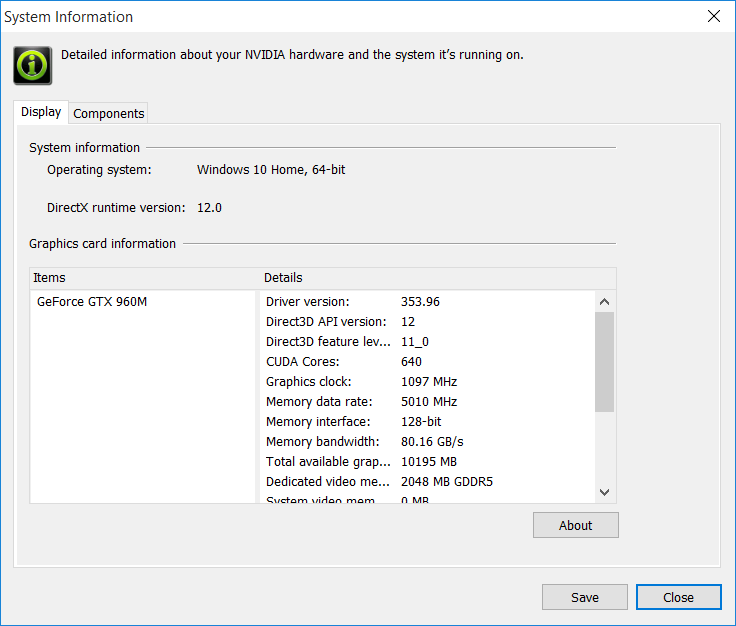
Brightness Distribution: 86 %
Center on Battery: 200.1 cd/m²
Contrast: 466:1 (Black: 0.429 cd/m²)
ΔE ColorChecker Calman: 10.63 | ∀{0.5-29.43 Ø4.71}
ΔE Greyscale Calman: 11.51 | ∀{0.09-98 Ø4.96}
99.8% sRGB (Argyll 1.6.3 3D)
74.6% AdobeRGB 1998 (Argyll 1.6.3 3D)
84.2% AdobeRGB 1998 (Argyll 3D)
99.8% sRGB (Argyll 3D)
86% Display P3 (Argyll 3D)
Gamma: 2.23
CCT: 14492 K
| MSI PE60 6QE-056XUS 15.6", 1920x1080 | HP ZBook 15 G3 15.6", 1920x1080 | Lenovo Ideapad Y700 15ISK 80NW 15.6", 1920x1080 | Asus G501VW-FY081T 15.6", 1920x1080 | Dell XPS 15 9550 i7 FHD 15.6", 1920x1080 | |
|---|---|---|---|---|---|
| Display | -15% | -50% | -15% | -13% | |
| Display P3 Coverage (%) | 86 | 66.8 -22% | 38.55 -55% | 66.8 -22% | 68.5 -20% |
| sRGB Coverage (%) | 99.8 | 95.5 -4% | 57.6 -42% | 97.3 -3% | 97.2 -3% |
| AdobeRGB 1998 Coverage (%) | 84.2 | 69 -18% | 39.86 -53% | 68.6 -19% | 70.4 -16% |
| Response Times | -27% | 10% | -28% | -64% | |
| Response Time Grey 50% / Grey 80% * (ms) | 43.6 ? | 54 ? -24% | 40.8 ? 6% | 50 ? -15% | 64 ? -47% |
| Response Time Black / White * (ms) | 27.6 ? | 35.6 ? -29% | 24 ? 13% | 39 ? -41% | 50 ? -81% |
| PWM Frequency (Hz) | 1000 ? | 198 ? | 58.1 | 200 ? | |
| Screen | 33% | 18% | 44% | 54% | |
| Brightness middle (cd/m²) | 200.1 | 306 53% | 258.6 29% | 341 70% | 371.5 86% |
| Brightness (cd/m²) | 194 | 289 49% | 242 25% | 312 61% | 356 84% |
| Brightness Distribution (%) | 86 | 85 -1% | 88 2% | 83 -3% | 92 7% |
| Black Level * (cd/m²) | 0.429 | 0.34 21% | 0.277 35% | 0.32 25% | 0.252 41% |
| Contrast (:1) | 466 | 900 93% | 934 100% | 1066 129% | 1474 216% |
| Colorchecker dE 2000 * | 10.63 | 5.1 52% | 8.1 24% | 4.23 60% | 5.55 48% |
| Colorchecker dE 2000 max. * | 18.19 | 9.9 46% | 8.02 56% | 10.95 40% | |
| Greyscale dE 2000 * | 11.51 | 7.4 36% | 7.23 37% | 4.69 59% | 7.1 38% |
| Gamma | 2.23 99% | 2.37 93% | 1.99 111% | 2.53 87% | 2.1 105% |
| CCT | 14492 45% | 7263 89% | 6567 99% | 7549 86% | |
| Color Space (Percent of AdobeRGB 1998) (%) | 74.6 | 63 -16% | 36.5 -51% | 63 -16% | 63.4 -15% |
| Color Space (Percent of sRGB) (%) | 99.8 | 95 -5% | 57.2 -43% | 97 -3% | 97.9 -2% |
| Total Average (Program / Settings) | -3% /
15% | -7% /
2% | 0% /
23% | -8% /
25% |
* ... smaller is better
Display Response Times
| ↔ Response Time Black to White | ||
|---|---|---|
| 27.6 ms ... rise ↗ and fall ↘ combined | ↗ 10 ms rise | 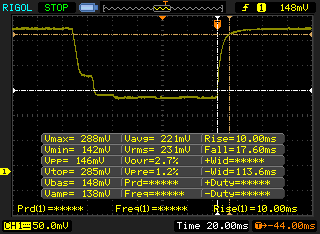 |
| ↘ 17.6 ms fall | ||
| The screen shows relatively slow response rates in our tests and may be too slow for gamers. In comparison, all tested devices range from 0.1 (minimum) to 240 (maximum) ms. » 70 % of all devices are better. This means that the measured response time is worse than the average of all tested devices (19.8 ms). | ||
| ↔ Response Time 50% Grey to 80% Grey | ||
| 43.6 ms ... rise ↗ and fall ↘ combined | ↗ 22 ms rise | 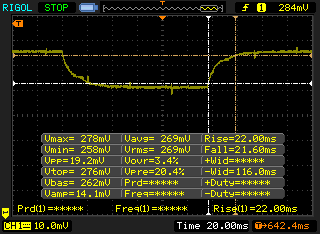 |
| ↘ 21.6 ms fall | ||
| The screen shows slow response rates in our tests and will be unsatisfactory for gamers. In comparison, all tested devices range from 0.165 (minimum) to 636 (maximum) ms. » 73 % of all devices are better. This means that the measured response time is worse than the average of all tested devices (30.9 ms). | ||
Screen Flickering / PWM (Pulse-Width Modulation)
| Screen flickering / PWM detected | 1000 Hz | ≤ 99 % brightness setting | 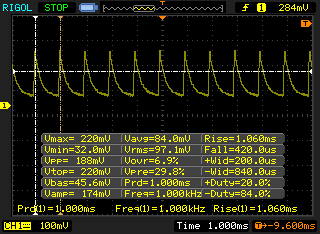 |
The display backlight flickers at 1000 Hz (worst case, e.g., utilizing PWM) Flickering detected at a brightness setting of 99 % and below. There should be no flickering or PWM above this brightness setting. The frequency of 1000 Hz is quite high, so most users sensitive to PWM should not notice any flickering. In comparison: 52 % of all tested devices do not use PWM to dim the display. If PWM was detected, an average of 7748 (minimum: 5 - maximum: 343500) Hz was measured. | |||
| Cinebench R15 | |
| CPU Single 64Bit (sort by value) | |
| MSI PE60 6QE-056XUS | |
| DogHouse Systems Mobius SS | |
| Lenovo ThinkPad P70 | |
| Gigabyte P55 V4 | |
| Asus G750JM-T4014H | |
| CPU Multi 64Bit (sort by value) | |
| MSI PE60 6QE-056XUS | |
| DogHouse Systems Mobius SS | |
| Lenovo ThinkPad P70 | |
| Gigabyte P55 V4 | |
| Asus G750JM-T4014H | |
| Cinebench R11.5 | |
| CPU Single 64Bit (sort by value) | |
| MSI PE60 6QE-056XUS | |
| DogHouse Systems Mobius SS | |
| Lenovo ThinkPad P70 | |
| Gigabyte P55 V4 | |
| Asus G750JM-T4014H | |
| CPU Multi 64Bit (sort by value) | |
| MSI PE60 6QE-056XUS | |
| DogHouse Systems Mobius SS | |
| Lenovo ThinkPad P70 | |
| Gigabyte P55 V4 | |
| Asus G750JM-T4014H | |
| Cinebench R10 | |
| Rendering Single 32Bit (sort by value) | |
| MSI PE60 6QE-056XUS | |
| DogHouse Systems Mobius SS | |
| Lenovo ThinkPad P70 | |
| Gigabyte P55 V4 | |
| Rendering Multiple CPUs 32Bit (sort by value) | |
| MSI PE60 6QE-056XUS | |
| DogHouse Systems Mobius SS | |
| Lenovo ThinkPad P70 | |
| Gigabyte P55 V4 | |
| wPrime 2.10 - 1024m (sort by value) | |
| MSI PE60 6QE-056XUS | |
| DogHouse Systems Mobius SS | |
| Lenovo ThinkPad P70 | |
| Gigabyte P55 V4 | |
| Super Pi Mod 1.5 XS 32M - 32M (sort by value) | |
| MSI PE60 6QE-056XUS | |
| DogHouse Systems Mobius SS | |
| Lenovo ThinkPad P70 | |
| Gigabyte P55 V4 | |
* ... smaller is better
| PCMark 8 | |
| Home Score Accelerated v2 (sort by value) | |
| MSI PE60 6QE-056XUS | |
| MSI PE60-2QEi581 | |
| Lenovo Ideapad Y700 15ISK 80NW | |
| Dell XPS 15 9550 i7 FHD | |
| Asus G501VW-FY081T | |
| Work Score Accelerated v2 (sort by value) | |
| MSI PE60 6QE-056XUS | |
| MSI PE60-2QEi581 | |
| Lenovo Ideapad Y700 15ISK 80NW | |
| Dell XPS 15 9550 i7 FHD | |
| Asus G501VW-FY081T | |
| Creative Score Accelerated v2 (sort by value) | |
| MSI PE60 6QE-056XUS | |
| Lenovo Ideapad Y700 15ISK 80NW | |
| Dell XPS 15 9550 i7 FHD | |
| Asus G501VW-FY081T | |
| PCMark 8 Home Score Accelerated v2 | 3766 points | |
| PCMark 8 Creative Score Accelerated v2 | 4735 points | |
| PCMark 8 Work Score Accelerated v2 | 4827 points | |
Help | ||
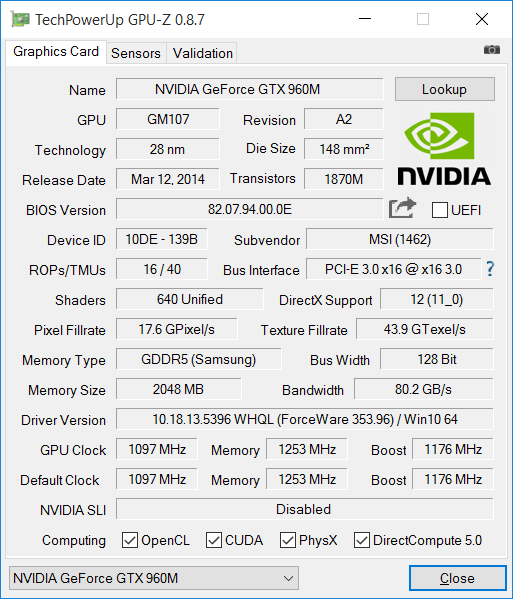
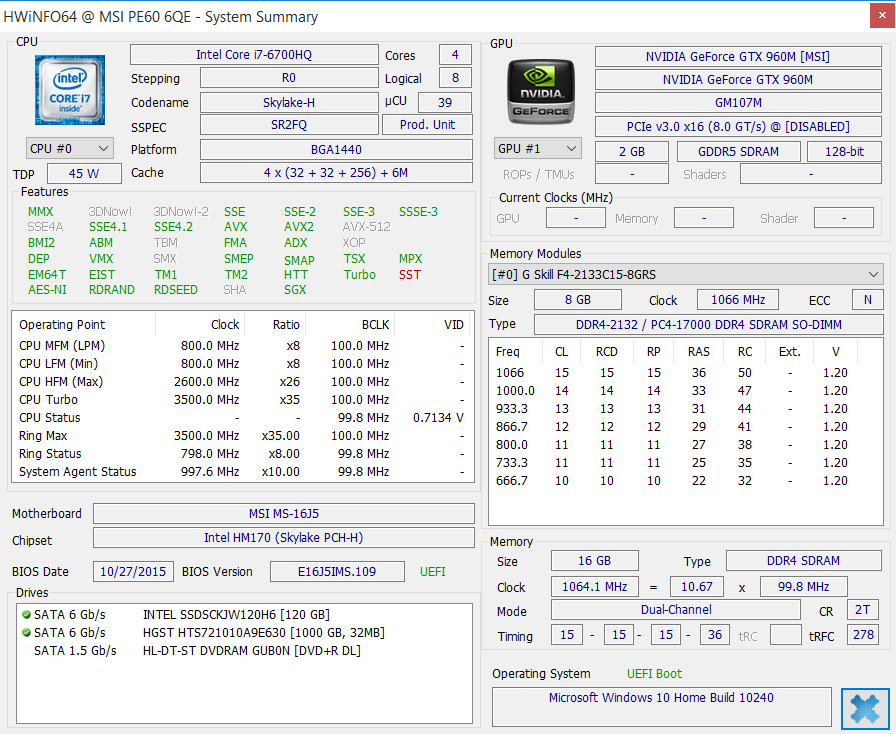
| MSI PE60 6QE-056XUS GeForce GTX 960M, 6700HQ, Intel SSD 535 SSDSCKJW120H6 | MSI PE60-2QEi78H11 SSD/4720HQ GeForce GTX 960M, 4720HQ, Toshiba HG6 THNSNJ128G8NU | HP ZBook 15 G3 Quadro M2000M, E3-1505M v5, Samsung SM951 MZVPV512HDGL m.2 PCI-e | Asus G501VW-FY081T GeForce GTX 960M, 6700HQ, Samsung CM871 MZNLF128HCHP | Dell XPS 15 9550 i7 FHD GeForce GTX 960M, 6700HQ, Samsung PM951 NVMe 512 GB | |
|---|---|---|---|---|---|
| AS SSD | 28% | 268% | -44% | 211% | |
| Copy Game MB/s (MB/s) | 307.1 | 261.9 -15% | 1023 233% | 141.5 -54% | 805 162% |
| Copy Program MB/s (MB/s) | 187.5 | 154.9 -17% | 585 212% | 99.9 -47% | 325.3 73% |
| Copy ISO MB/s (MB/s) | 280 | 353.4 26% | 1494 434% | 163 -42% | 1127 303% |
| Score Total (Points) | 588 | 865 47% | 2495 324% | 269 -54% | 2410 310% |
| Score Write (Points) | 293 | 207 -29% | 548 87% | 63 -78% | 675 130% |
| Score Read (Points) | 198 | 434 119% | 1302 558% | 152 -23% | 1180 496% |
| Access Time Write * (ms) | 0.196 | 0.056 71% | 0.024 88% | 0.225 -15% | 0.035 82% |
| Access Time Read * (ms) | 0.148 | 0.191 -29% | 0.031 79% | 0.207 -40% | 0.038 74% |
| 4K-64 Write (MB/s) | 180.2 | 99.9 -45% | 257 43% | 19.4 -89% | 513 185% |
| 4K-64 Read (MB/s) | 128.9 | 362.6 181% | 1066 727% | 87.6 -32% | 990 668% |
| 4K Write (MB/s) | 91 | 59.5 -35% | 173.1 90% | 30.66 -66% | 105.4 16% |
| 4K Read (MB/s) | 22.59 | 19.79 -12% | 52.5 132% | 13.87 -39% | 31.86 41% |
| Seq Write (MB/s) | 215.9 | 473.6 119% | 1181 447% | 126.9 -41% | 570 164% |
| Seq Read (MB/s) | 460.3 | 514 12% | 1841 300% | 504 9% | 1579 243% |
* ... smaller is better

| 3DMark 11 | |
| 1280x720 Performance (sort by value) | |
| MSI PE60 6QE-056XUS | |
| Gigabyte P55W v5 | |
| Asus G501VW-FY081T | |
| MSI PE60 2QD | |
| Acer TravelMate P278-MG-76L2 | |
| 1280x720 Performance Combined (sort by value) | |
| MSI PE60 6QE-056XUS | |
| Gigabyte P55W v5 | |
| Asus G501VW-FY081T | |
| MSI PE60 2QD | |
| Acer TravelMate P278-MG-76L2 | |
| 1280x720 Performance Physics (sort by value) | |
| MSI PE60 6QE-056XUS | |
| Gigabyte P55W v5 | |
| Asus G501VW-FY081T | |
| MSI PE60 2QD | |
| Acer TravelMate P278-MG-76L2 | |
| 1280x720 Performance GPU (sort by value) | |
| MSI PE60 6QE-056XUS | |
| Gigabyte P55W v5 | |
| Asus G501VW-FY081T | |
| MSI PE60 2QD | |
| Acer TravelMate P278-MG-76L2 | |
| 3DMark | |
| 1920x1080 Fire Strike Score (sort by value) | |
| MSI PE60 6QE-056XUS | |
| Gigabyte P55W v5 | |
| Asus G501VW-FY081T | |
| MSI PE60 2QD | |
| Acer TravelMate P278-MG-76L2 | |
| 1920x1080 Fire Strike Combined (sort by value) | |
| MSI PE60 6QE-056XUS | |
| Gigabyte P55W v5 | |
| Asus G501VW-FY081T | |
| MSI PE60 2QD | |
| Acer TravelMate P278-MG-76L2 | |
| 1920x1080 Fire Strike Graphics (sort by value) | |
| MSI PE60 6QE-056XUS | |
| Gigabyte P55W v5 | |
| Asus G501VW-FY081T | |
| MSI PE60 2QD | |
| Acer TravelMate P278-MG-76L2 | |
| Fire Strike Extreme Physics (sort by value) | |
| MSI PE60 6QE-056XUS | |
| Acer TravelMate P278-MG-76L2 | |
| 3DMark 11 Performance | 5774 points | |
| 3DMark Ice Storm Standard Score | 85812 points | |
| 3DMark Cloud Gate Standard Score | 17782 points | |
| 3DMark Fire Strike Score | 4088 points | |
| 3DMark Fire Strike Extreme Score | 2046 points | |
Help | ||
| BioShock Infinite - 1920x1080 Ultra Preset, DX11 (DDOF) | |
| Aorus X5S v5 | |
| Aorus X3 Plus v5 | |
| MSI PE60 6QE-056XUS | |
| MSI PX60 QD-034US | |
| Lenovo ThinkPad T460p-20FXS05500 | |
| Metro: Last Light - 1920x1080 Very High (DX11) AF:16x | |
| Aorus X5S v5 | |
| Aorus X3 Plus v5 | |
| MSI PE60 6QE-056XUS | |
| MSI PX60 QD-034US | |
| Lenovo ThinkPad T460p-20FXS05500 | |
| Thief - 1920x1080 Very High Preset AA:FXAA & High SS AF:8x | |
| Aorus X5S v5 | |
| Aorus X3 Plus v5 | |
| MSI PE60 6QE-056XUS | |
| MSI PX60 QD-034US | |
| Lenovo ThinkPad T460p-20FXS05500 | |
| Metal Gear Solid V - 1920x1080 Extra High / On | |
| Aorus X5S v5 | |
| Aorus X3 Plus v5 | |
| MSI PE60 6QE-056XUS | |
| MSI PX60 QD-034US | |
| Fallout 4 - 1920x1080 Ultra Preset AA:T AF:16x | |
| Aorus X5S v5 | |
| Aorus X3 Plus v5 | |
| MSI PE60 6QE-056XUS | |
| Rise of the Tomb Raider - 1920x1080 Very High Preset AA:FX AF:16x | |
| Aorus X5S v5 | |
| MSI PE60 6QE-056XUS | |
| low | med. | high | ultra | |
|---|---|---|---|---|
| BioShock Infinite (2013) | 130 | 117.4 | 45.8 | |
| Metro: Last Light (2013) | 100.3 | 59.9 | 31.7 | |
| Thief (2014) | 65.3 | 55.3 | 27.9 | |
| Batman: Arkham Knight (2015) | 60 | 32 | ||
| Metal Gear Solid V (2015) | 60 | 58 | 39.1 | |
| Fallout 4 (2015) | 57.5 | 31.6 | 24.9 | |
| Rise of the Tomb Raider (2016) | 53.7 | 30.3 | 23 |
| MSI PE60 6QE-056XUS GeForce GTX 960M, 6700HQ, Intel SSD 535 SSDSCKJW120H6 | MSI PE60-2QEi581 GeForce GTX 960M, 4210H, HGST Travelstar 7K1000 HTS721010A9E630 | HP ZBook 15 G3 Quadro M2000M, E3-1505M v5, Samsung SM951 MZVPV512HDGL m.2 PCI-e | Asus G501VW-FY081T GeForce GTX 960M, 6700HQ, Samsung CM871 MZNLF128HCHP | Dell XPS 15 9550 i7 FHD GeForce GTX 960M, 6700HQ, Samsung PM951 NVMe 512 GB | |
|---|---|---|---|---|---|
| Noise | -2% | 1% | 0% | 8% | |
| off / environment * (dB) | 29.3 | 30 -2% | 31.2 -6% | ||
| Idle Minimum * (dB) | 32.4 | 32.8 -1% | 30 7% | 32.1 1% | 29.2 10% |
| Idle Average * (dB) | 32.4 | 32.8 -1% | 30 7% | 32.1 1% | 29.3 10% |
| Idle Maximum * (dB) | 35.4 | 35.4 -0% | 30 15% | 32.1 9% | 29.5 17% |
| Load Average * (dB) | 40.5 | 42.3 -4% | 45.3 -12% | 43.3 -7% | 36.5 10% |
| Load Maximum * (dB) | 45.3 | 47.4 -5% | 49.7 -10% | 44.3 2% | 47.7 -5% |
* ... smaller is better
Noise level
| Idle |
| 32.4 / 32.4 / 35.4 dB(A) |
| DVD |
| / 38.9 dB(A) |
| Load |
| 40.5 / 45.3 dB(A) |
 | ||
30 dB silent 40 dB(A) audible 50 dB(A) loud |
||
min: | ||
(±) The maximum temperature on the upper side is 43.2 °C / 110 F, compared to the average of 36.8 °C / 98 F, ranging from 21 to 71 °C for the class Multimedia.
(-) The bottom heats up to a maximum of 49 °C / 120 F, compared to the average of 39.1 °C / 102 F
(+) In idle usage, the average temperature for the upper side is 25.5 °C / 78 F, compared to the device average of 31.3 °C / 88 F.
(-) The palmrests and touchpad can get very hot to the touch with a maximum of 40.6 °C / 105.1 F.
(-) The average temperature of the palmrest area of similar devices was 28.7 °C / 83.7 F (-11.9 °C / -21.4 F).
| MSI PE60 6QE-056XUS GeForce GTX 960M, 6700HQ, Intel SSD 535 SSDSCKJW120H6 | MSI PE60-2QEi581 GeForce GTX 960M, 4210H, HGST Travelstar 7K1000 HTS721010A9E630 | HP ZBook 15 G3 Quadro M2000M, E3-1505M v5, Samsung SM951 MZVPV512HDGL m.2 PCI-e | Asus G501VW-FY081T GeForce GTX 960M, 6700HQ, Samsung CM871 MZNLF128HCHP | Lenovo Y700-15 80NV004LPB GeForce GTX 960M, 6700HQ, Samsung SSD 850 EVO 250GB | Dell XPS 15 2016 9550 GeForce GTX 960M, 6300HQ, WDC WD10SPCX-75KHST0 + LiteON CS1-SP32-11 M.2 2242 32GB | |
|---|---|---|---|---|---|---|
| Power Consumption | -50% | 15% | 22% | 4% | 10% | |
| Idle Minimum * (Watt) | 9.7 | 21.8 -125% | 5.7 41% | 6.9 29% | 4.2 57% | 9.9 -2% |
| Idle Average * (Watt) | 13.1 | 26.1 -99% | 12.2 7% | 10.7 18% | 10.5 20% | 12.6 4% |
| Idle Maximum * (Watt) | 23.2 | 26.6 -15% | 12.6 46% | 13.2 43% | 28.5 -23% | 16.8 28% |
| Load Average * (Watt) | 79.1 | 88.5 -12% | 83.1 -5% | 82 -4% | 113 -43% | 70 12% |
| Load Maximum * (Watt) | 122.9 | 119.7 3% | 138.2 -12% | 94 24% | 114.2 7% | 114 7% |
* ... smaller is better
| Off / Standby | |
| Idle | |
| Load |
|
Key:
min: | |
| MSI PE60 6QE-056XUS 42 Wh | MSI PE60-2QEi581 42 Wh | HP ZBook 15 G3 90 Wh | Asus G501VW-FY081T 60 Wh | Lenovo Ideapad Y700 15ISK 80NW 60 Wh | Dell XPS 15 9550 i7 FHD 84 Wh | |
|---|---|---|---|---|---|---|
| Battery runtime | 4% | 101% | 51% | 68% | 146% | |
| Reader / Idle (h) | 5.7 | 5.8 2% | 13.7 140% | 10.2 79% | 10.3 81% | 16.3 186% |
| WiFi v1.3 (h) | 3 | 2.8 -7% | 6.4 113% | 5.5 83% | 5.9 97% | 9.1 203% |
| Load (h) | 1.2 | 1.4 17% | 1.8 50% | 1.1 -8% | 1.5 25% | 1.8 50% |
Pros
Cons
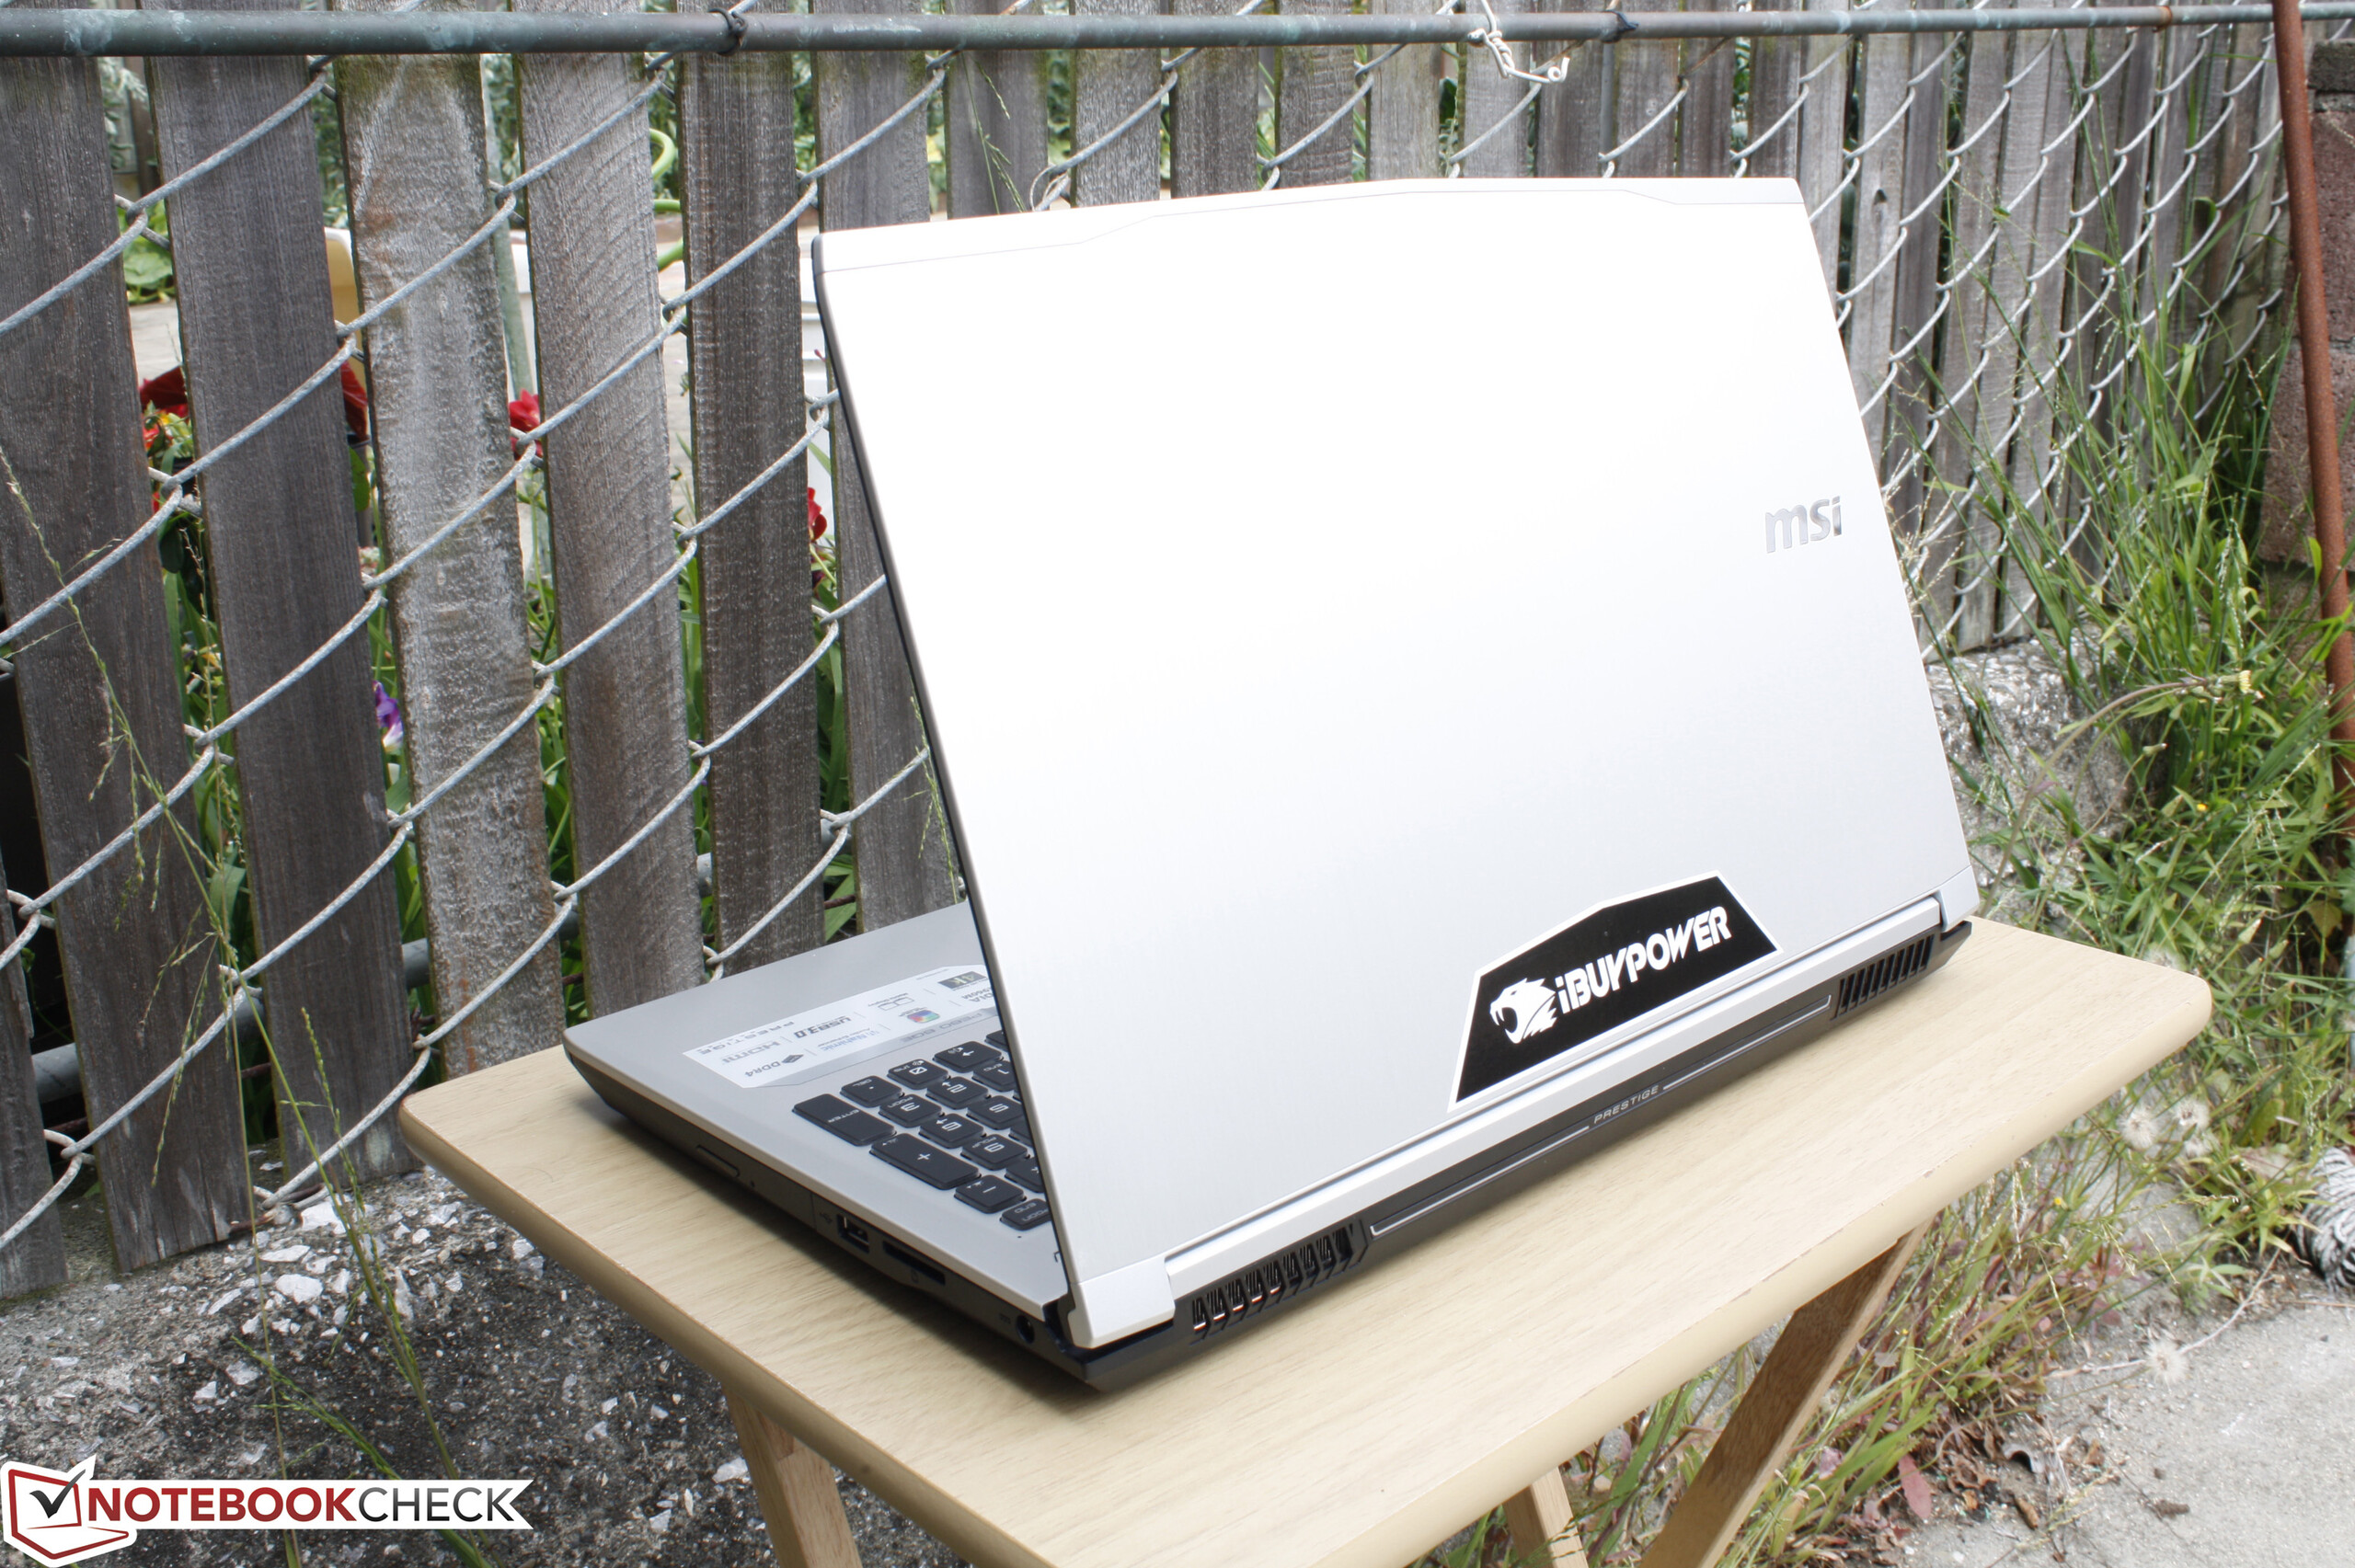
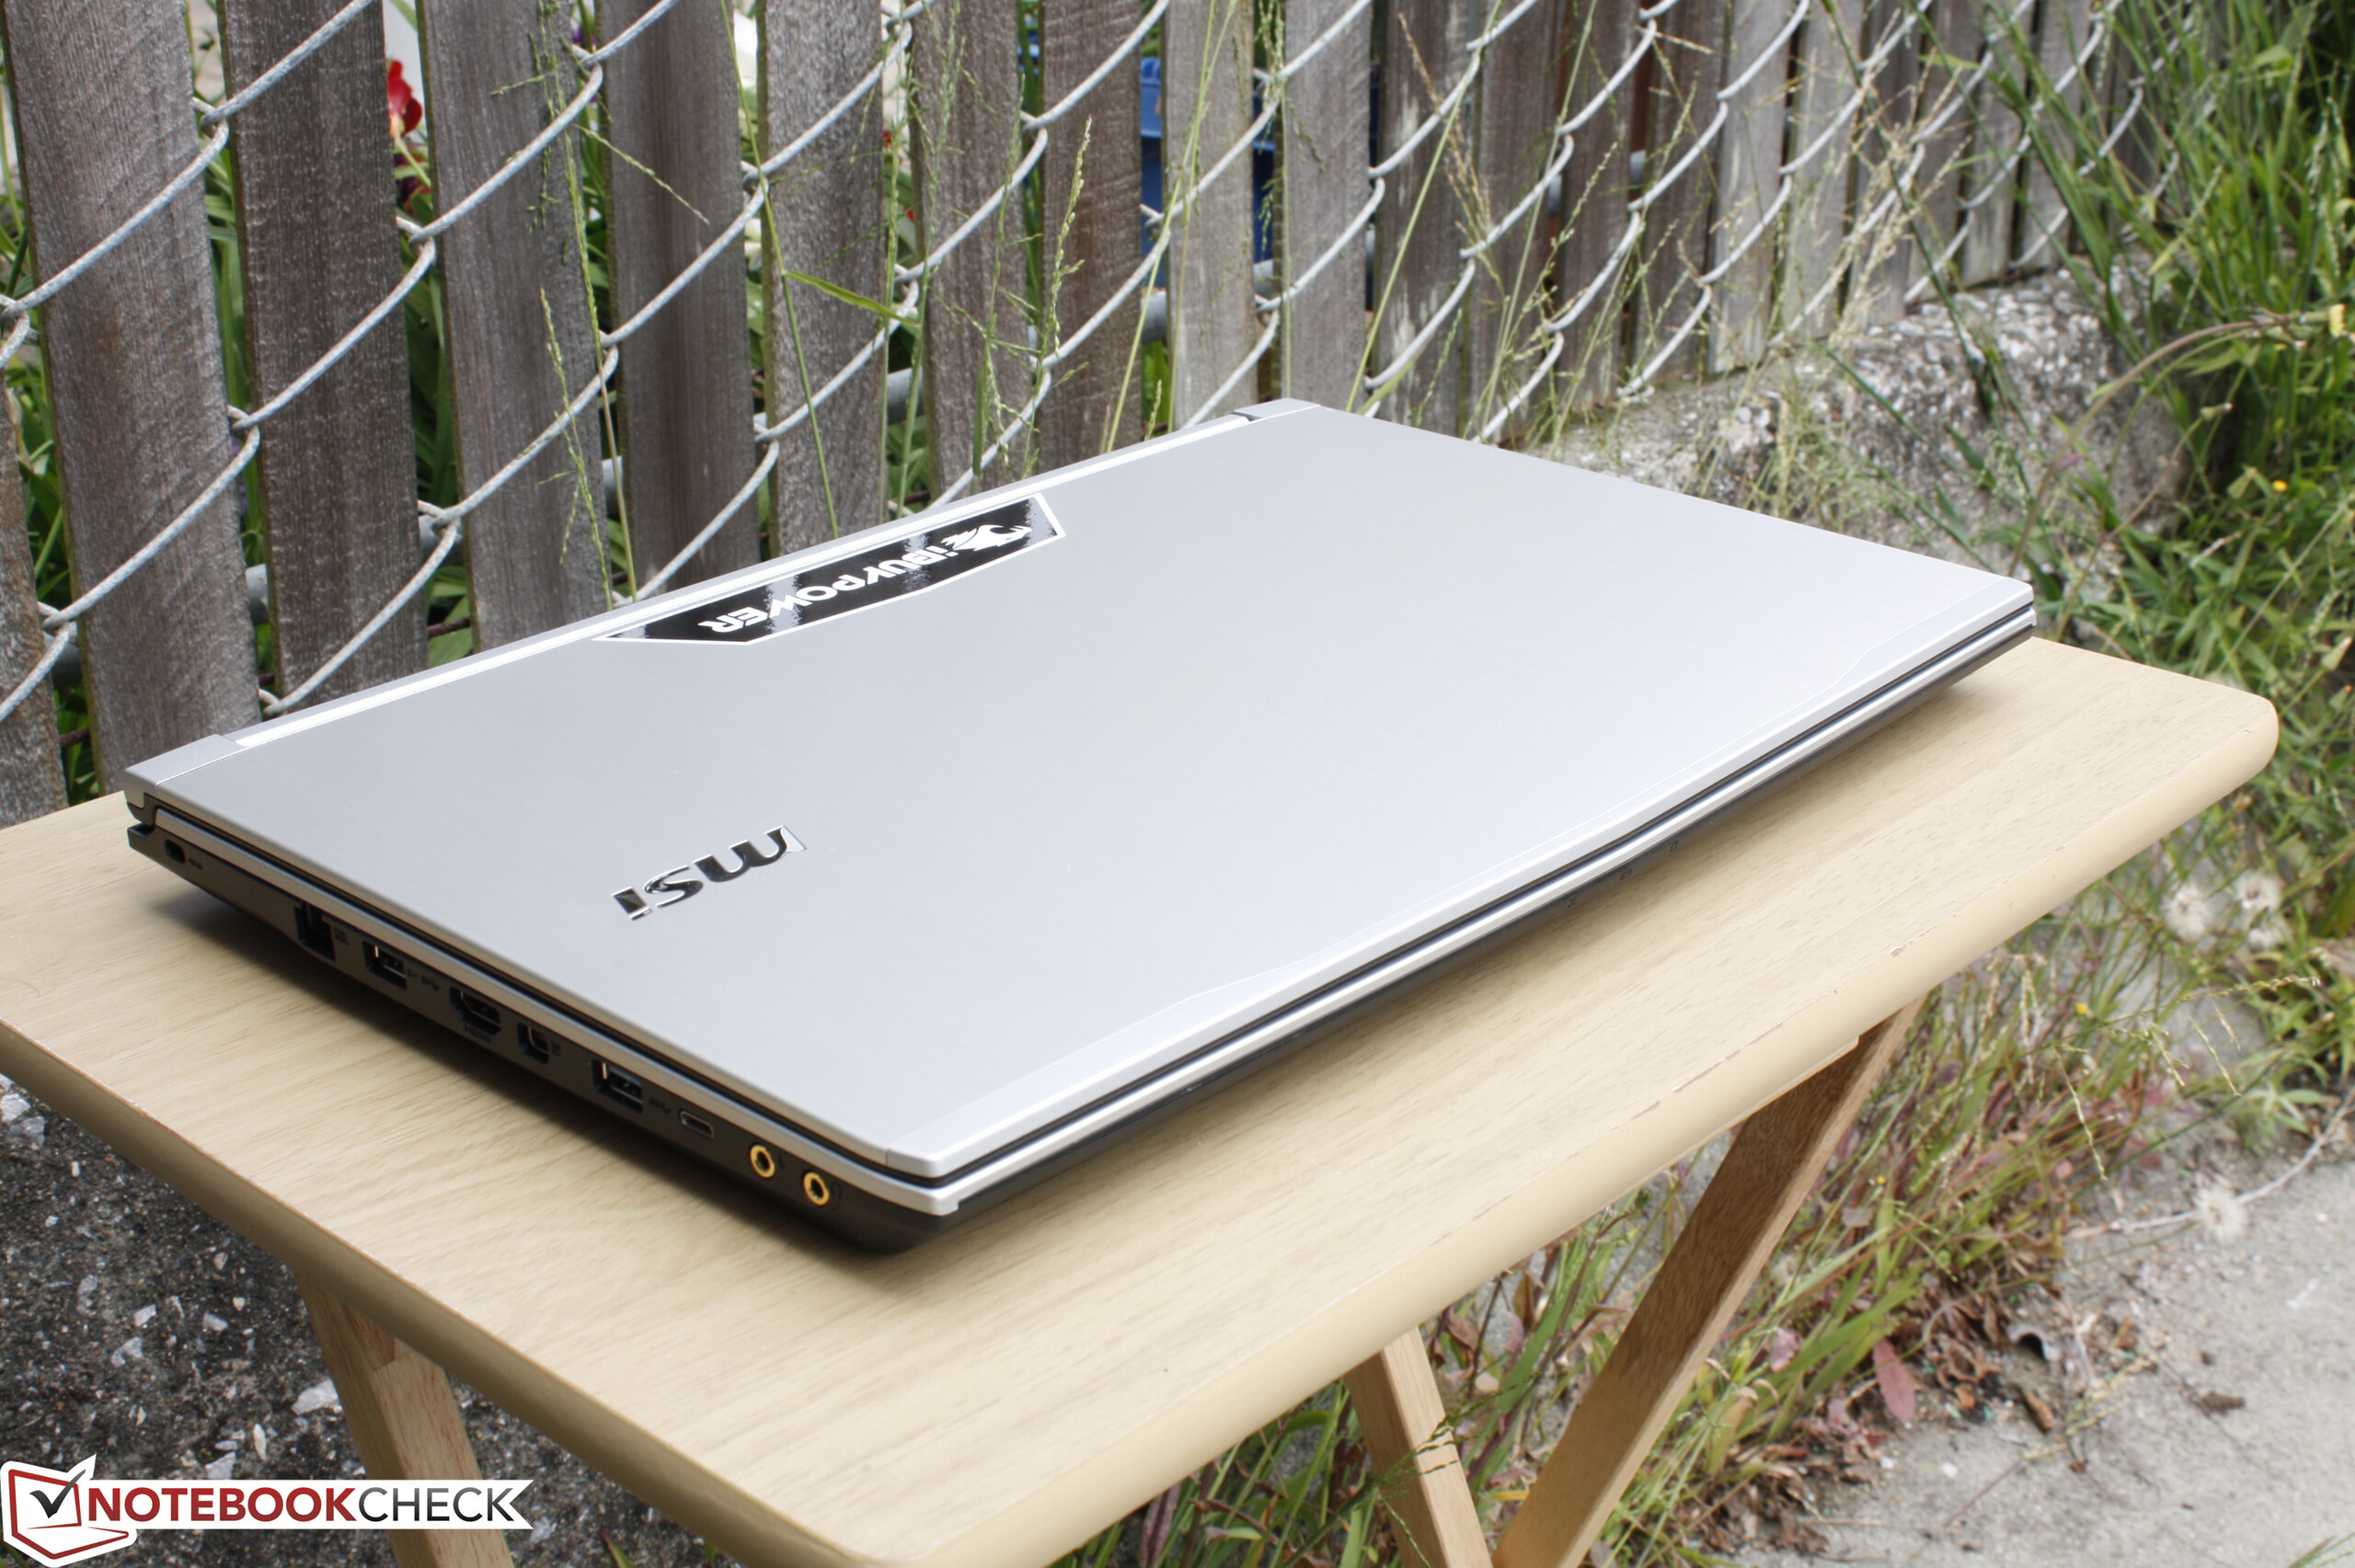
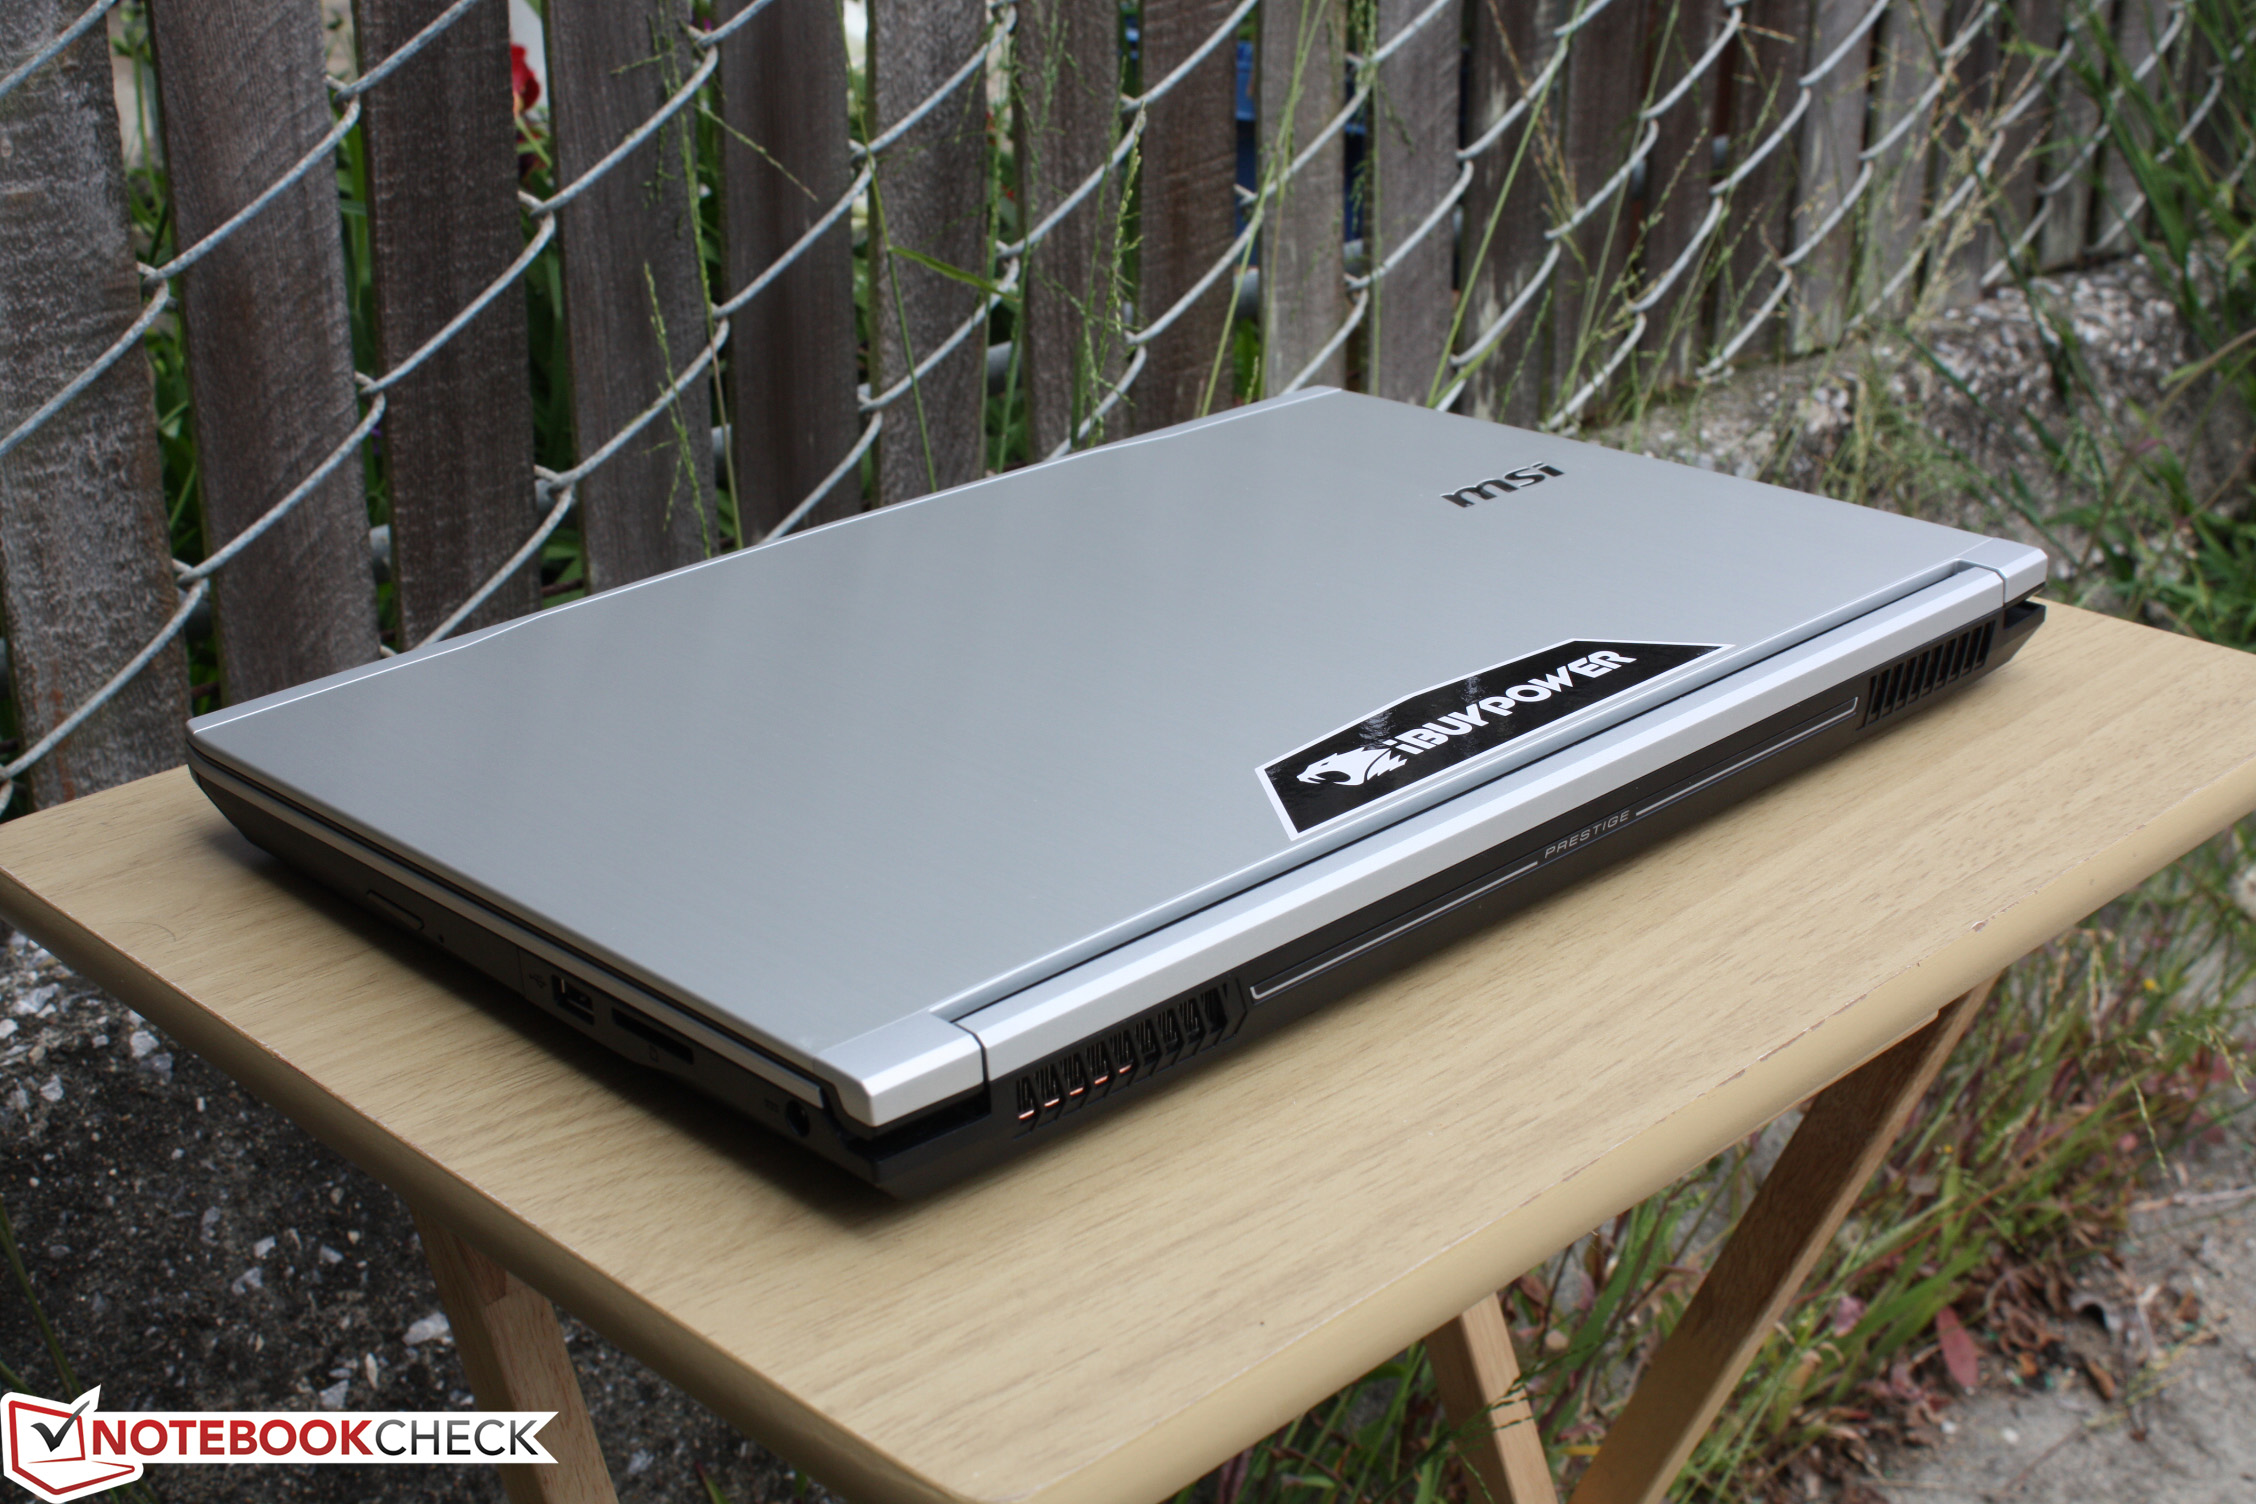
实际上,微星PE60 Prestige是穿上新衣服、换了新名字的GE62,面向商务和多媒体用户。这意味着PE60只是披上伪装的游戏本,对商务用户来说并不是个好消息。除了屏幕在校对后可以覆盖丰富的色彩,它并没有什么可以吸引消费者的优势。最新的XPS 15凭更长的电池续航,更轻薄的设计,更明亮的屏幕,更快的NVMe固态硬盘,支持Thunderbolt 3的USB-C型接口,更坚固的机身以及相同的处理器和显卡,可以轻松战胜这台微星笔记本。
PE60 Prestige在宣传中面相专业用途,但微星需要为它增加更多商务用户所需要的功能,而不是简单的给已有游戏系列换个外观。它更适合被称作是“专业游戏笔记本电脑”,但在同价位上既有更适合商务用户的设备,也有更适合骨灰级游戏玩家的设备。
注:本文是基于完整评测的缩减版本,阅读完整的英文评测,请点击这里。
MSI PE60 6QE-056XUS
- 12/09/2016 v6 (old)
Allen Ngo
Price comparison
