惠普光影精灵4代(i7-8750H, GTX 1050 Ti, 傲腾内存, FHD)
| SD Card Reader | |
| average JPG Copy Test (av. of 3 runs) | |
| Average of class Gaming (20.9 - 210, n=54, last 2 years) | |
| Acer Nitro 5 AN515-52-74DR (Toshiba Exceria Pro SDXC 64 GB UHS-II) | |
| HP Pavilion Gaming 15t-cx0000 (Toshiba Exceria Pro SDXC 64 GB UHS-II) | |
| Medion Erazer P6705-MD61131 (Toshiba Exceria Pro SDXC 64 GB UHS-II) | |
| HP Pavilion Gaming 15-cx0003ng (Toshiba Exceria Pro SDXC 64 GB UHS-II) | |
| Acer Nitro 5 AN515-42-R6V0 (Toshiba Exceria Pro SDXC 64 GB UHS-II) | |
| maximum AS SSD Seq Read Test (1GB) | |
| Average of class Gaming (25.5 - 261, n=51, last 2 years) | |
| Medion Erazer P6705-MD61131 (Toshiba Exceria Pro SDXC 64 GB UHS-II) | |
| Acer Nitro 5 AN515-52-74DR (Toshiba Exceria Pro SDXC 64 GB UHS-II) | |
| Acer Nitro 5 AN515-42-R6V0 (Toshiba Exceria Pro SDXC 64 GB UHS-II) | |
| HP Pavilion Gaming 15t-cx0000 (Toshiba Exceria Pro SDXC 64 GB UHS-II) | |
| HP Pavilion Gaming 15-cx0003ng (Toshiba Exceria Pro SDXC 64 GB UHS-II) | |
| Networking | |
| iperf3 transmit AX12 | |
| Acer Nitro 5 AN515-52-74DR | |
| HP Pavilion Gaming 15-cx0003ng | |
| Medion Erazer P6705-MD61131 | |
| Lenovo Legion Y530-15ICH | |
| HP Pavilion Gaming 15t-cx0000 | |
| Acer Nitro 5 AN515-42-R6V0 | |
| iperf3 receive AX12 | |
| Medion Erazer P6705-MD61131 | |
| Acer Nitro 5 AN515-42-R6V0 | |
| HP Pavilion Gaming 15t-cx0000 | |
| Acer Nitro 5 AN515-52-74DR | |
| Lenovo Legion Y530-15ICH | |
| HP Pavilion Gaming 15-cx0003ng | |
| |||||||||||||||||||||||||
Brightness Distribution: 75 %
Center on Battery: 208 cd/m²
Contrast: 1607:1 (Black: 0.15 cd/m²)
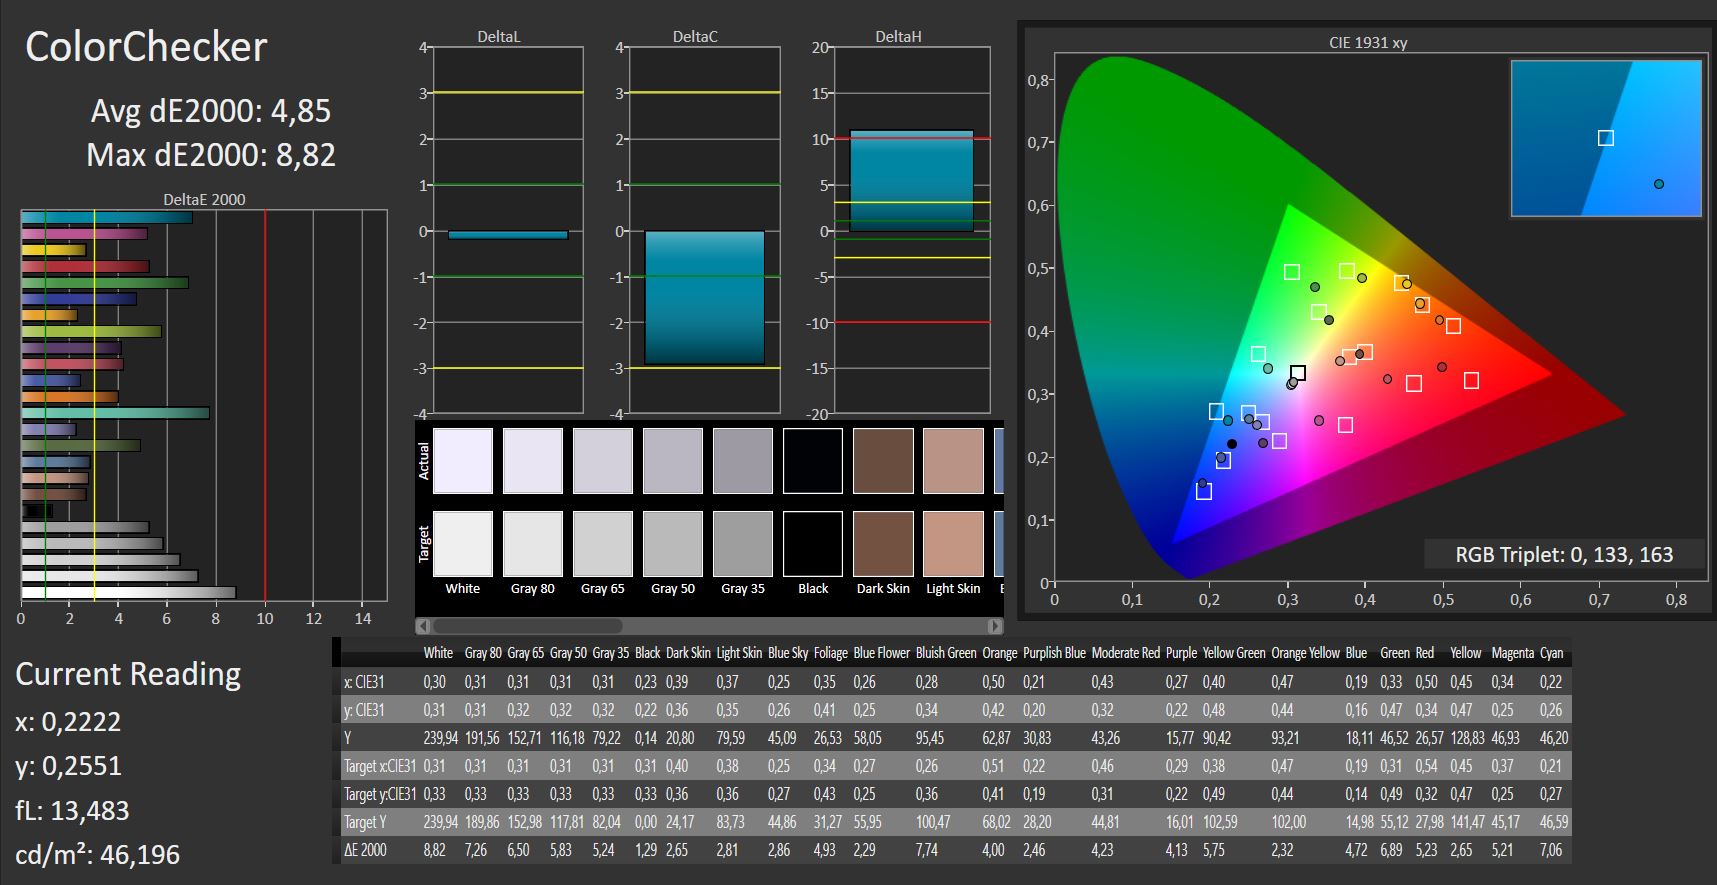
ΔE ColorChecker Calman: 4.85 | ∀{0.5-29.43 Ø4.71}
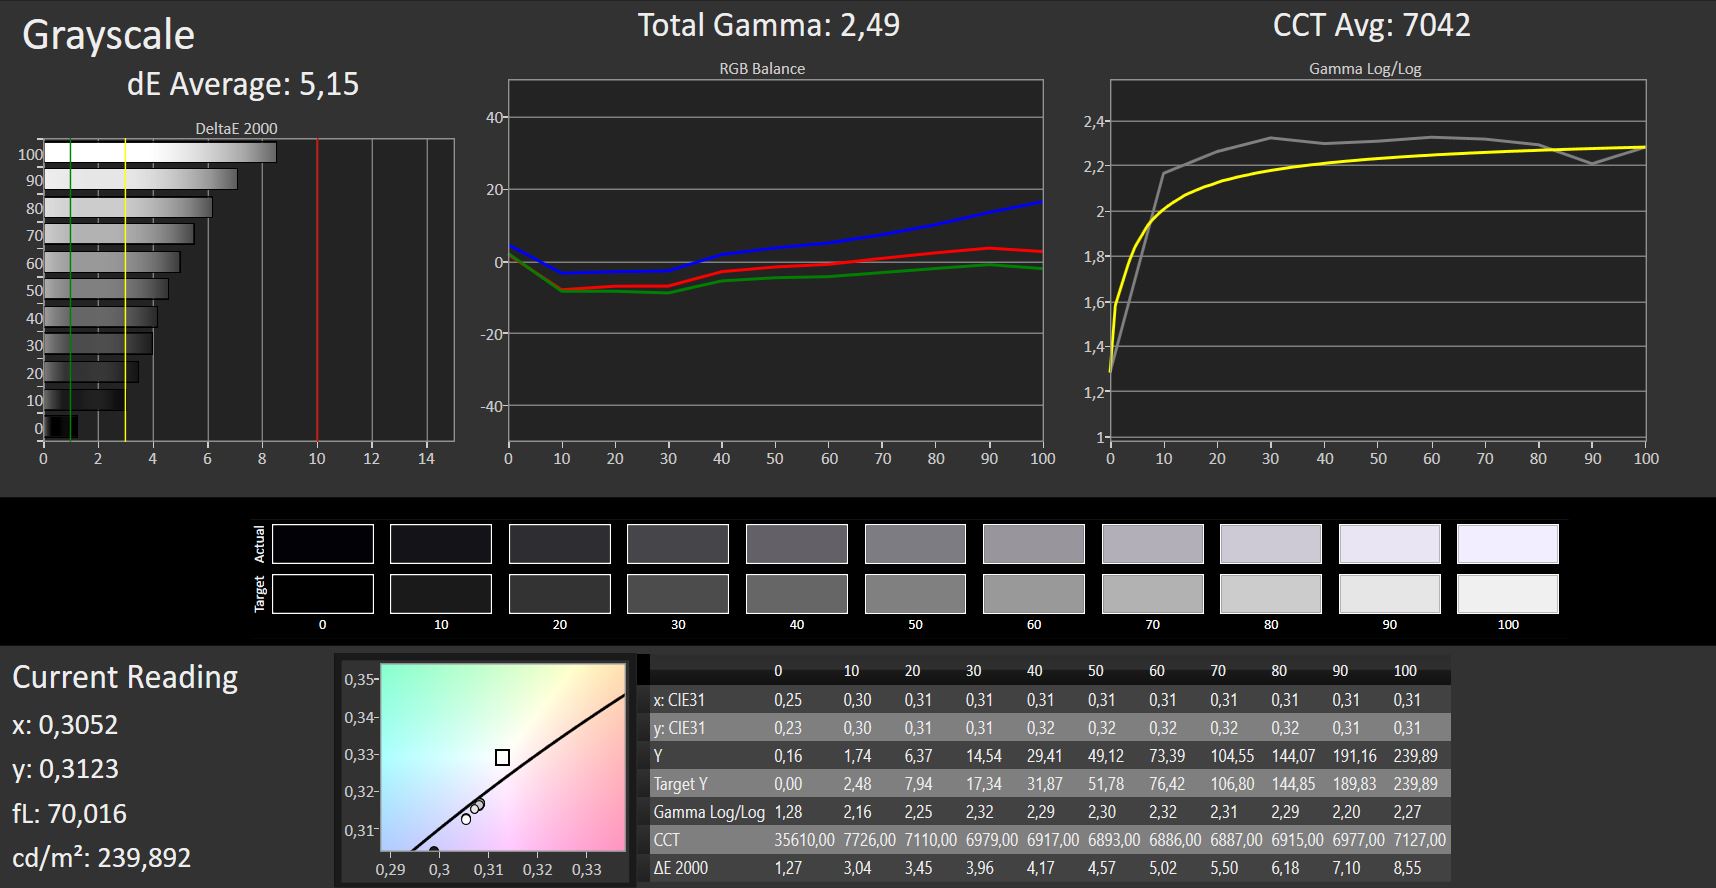
ΔE Greyscale Calman: 5.15 | ∀{0.09-98 Ø4.96}
59% sRGB (Argyll 1.6.3 3D)
38% AdobeRGB 1998 (Argyll 1.6.3 3D)
41.04% AdobeRGB 1998 (Argyll 3D)
59.3% sRGB (Argyll 3D)
39.72% Display P3 (Argyll 3D)
Gamma: 2.49
CCT: 7042 K
| HP Pavilion Gaming 15-cx0003ng IPS, 1920x1080, 15.6" | Acer Nitro 5 AN515-42-R6V0 IPS, 1920x1080, 15.6" | Acer Nitro 5 AN515-52-74DR IPS, 1920x1080, 15.6" | HP Pavilion Gaming 15t-cx0000 IPS, 1920x1080, 15.6" | Medion Erazer P6705-MD61131 TN, 1920x1080, 15.6" | Lenovo Legion Y530-15ICH IPS, 1920x1080, 15.6" | |
|---|---|---|---|---|---|---|
| Display | 54% | 0% | 62% | -8% | -4% | |
| Display P3 Coverage (%) | 39.72 | 63.4 60% | 39.59 0% | 66.5 67% | 36.4 -8% | 38.31 -4% |
| sRGB Coverage (%) | 59.3 | 87.4 47% | 59.5 0% | 91.7 55% | 54.8 -8% | 57.3 -3% |
| AdobeRGB 1998 Coverage (%) | 41.04 | 64 56% | 40.92 0% | 67.1 63% | 37.61 -8% | 39.58 -4% |
| Response Times | -5% | 24% | 64% | 27% | 1% | |
| Response Time Grey 50% / Grey 80% * (ms) | 47 ? | 48.4 ? -3% | 38 ? 19% | 17.6 ? 63% | 44.8 ? 5% | 43.6 ? 7% |
| Response Time Black / White * (ms) | 31 ? | 32.8 ? -6% | 22 ? 29% | 11.2 ? 64% | 16 ? 48% | 32.4 ? -5% |
| PWM Frequency (Hz) | 208 ? | |||||
| Screen | 10% | 1% | 11% | -68% | -28% | |
| Brightness middle (cd/m²) | 241 | 299 24% | 252 5% | 357.5 48% | 200 -17% | 282.8 17% |
| Brightness (cd/m²) | 236 | 284 20% | 237 0% | 351 49% | 186 -21% | 264 12% |
| Brightness Distribution (%) | 75 | 88 17% | 86 15% | 85 13% | 85 13% | 88 17% |
| Black Level * (cd/m²) | 0.15 | 0.24 -60% | 0.21 -40% | 0.36 -140% | 0.43 -187% | 0.42 -180% |
| Contrast (:1) | 1607 | 1246 -22% | 1200 -25% | 993 -38% | 465 -71% | 673 -58% |
| Colorchecker dE 2000 * | 4.85 | 4.98 -3% | 4.42 9% | 4.19 14% | 11.39 -135% | 4.93 -2% |
| Colorchecker dE 2000 max. * | 8.82 | 7.67 13% | 7.21 18% | 6.97 21% | 19.36 -120% | 17.65 -100% |
| Greyscale dE 2000 * | 5.15 | 4.58 11% | 3.74 27% | 3.5 32% | 11.73 -128% | 3.8 26% |
| Gamma | 2.49 88% | 2.55 86% | 2.34 94% | 2.324 95% | 1.97 112% | 2.449 90% |
| CCT | 7042 92% | 6397 102% | 7291 89% | 7028 92% | 12614 52% | 6112 106% |
| Color Space (Percent of AdobeRGB 1998) (%) | 38 | 57 50% | 38 0% | 60 58% | 35 -8% | 36 -5% |
| Color Space (Percent of sRGB) (%) | 59 | 87 47% | 59 0% | 91 54% | 55 -7% | 57 -3% |
| Colorchecker dE 2000 calibrated * | 3.7 | 3.08 | 3.2 | 3.05 | 4.07 | |
| Total Average (Program / Settings) | 20% /
17% | 8% /
4% | 46% /
28% | -16% /
-43% | -10% /
-19% |
* ... smaller is better
Screen Flickering / PWM (Pulse-Width Modulation)
| Screen flickering / PWM detected | 208 Hz | ≤ 90 % brightness setting | 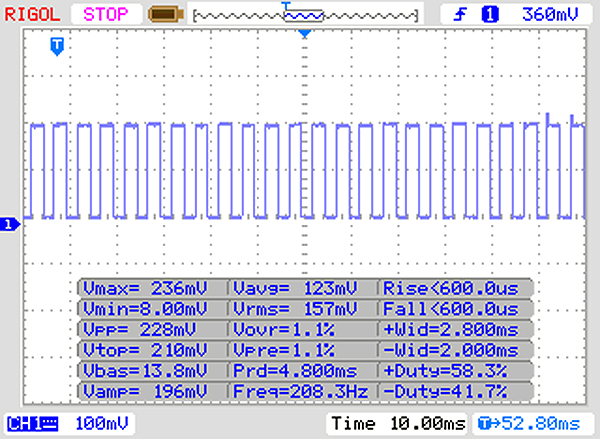 |
The display backlight flickers at 208 Hz (worst case, e.g., utilizing PWM) Flickering detected at a brightness setting of 90 % and below. There should be no flickering or PWM above this brightness setting. The frequency of 208 Hz is relatively low, so sensitive users will likely notice flickering and experience eyestrain at the stated brightness setting and below. In comparison: 52 % of all tested devices do not use PWM to dim the display. If PWM was detected, an average of 7754 (minimum: 5 - maximum: 343500) Hz was measured. | |||
Display Response Times
| ↔ Response Time Black to White | ||
|---|---|---|
| 31 ms ... rise ↗ and fall ↘ combined | ↗ 17 ms rise | 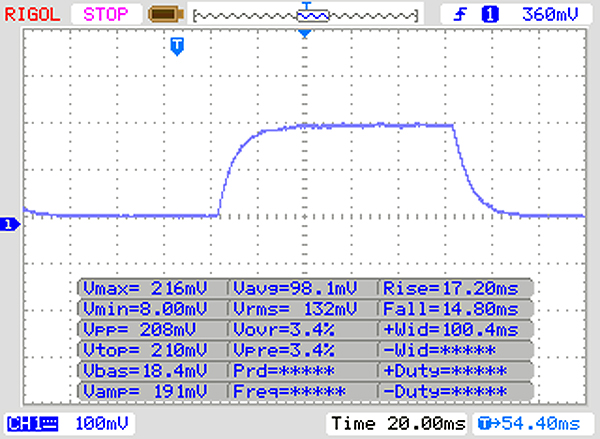 |
| ↘ 14 ms fall | ||
| The screen shows slow response rates in our tests and will be unsatisfactory for gamers. In comparison, all tested devices range from 0.1 (minimum) to 240 (maximum) ms. » 84 % of all devices are better. This means that the measured response time is worse than the average of all tested devices (19.8 ms). | ||
| ↔ Response Time 50% Grey to 80% Grey | ||
| 47 ms ... rise ↗ and fall ↘ combined | ↗ 23 ms rise |  |
| ↘ 24 ms fall | ||
| The screen shows slow response rates in our tests and will be unsatisfactory for gamers. In comparison, all tested devices range from 0.165 (minimum) to 636 (maximum) ms. » 81 % of all devices are better. This means that the measured response time is worse than the average of all tested devices (31 ms). | ||
| Cinebench R15 | |
| CPU Single 64Bit | |
| Average of class Gaming (188.8 - 350, n=106, last 2 years) | |
| Acer Nitro 5 AN515-52-74DR | |
| HP Pavilion Gaming 15t-cx0000 | |
| Medion Erazer P6705-MD61131 | |
| HP Pavilion Gaming 15-cx0003ng | |
| Average Intel Core i7-8750H (163 - 177, n=86) | |
| Lenovo Legion Y530-15ICH | |
| Acer Nitro 5 AN515-42-R6V0 | |
| CPU Multi 64Bit | |
| Average of class Gaming (1578 - 6330, n=105, last 2 years) | |
| Medion Erazer P6705-MD61131 | |
| Average Intel Core i7-8750H (863 - 1251, n=93) | |
| Acer Nitro 5 AN515-52-74DR | |
| HP Pavilion Gaming 15-cx0003ng | |
| HP Pavilion Gaming 15t-cx0000 | |
| Lenovo Legion Y530-15ICH | |
| Acer Nitro 5 AN515-42-R6V0 | |
| Cinebench R11.5 | |
| CPU Multi 64Bit | |
| Average of class Gaming (29.8 - 76.7, n=9, last 2 years) | |
| Acer Nitro 5 AN515-52-74DR | |
| Average Intel Core i7-8750H (9.54 - 13.5, n=41) | |
| Medion Erazer P6705-MD61131 | |
| HP Pavilion Gaming 15-cx0003ng | |
| HP Pavilion Gaming 15t-cx0000 | |
| Acer Nitro 5 AN515-42-R6V0 | |
| CPU Single 64Bit | |
| Average of class Gaming (3.3 - 4.16, n=9, last 2 years) | |
| Acer Nitro 5 AN515-52-74DR | |
| HP Pavilion Gaming 15t-cx0000 | |
| HP Pavilion Gaming 15-cx0003ng | |
| Average Intel Core i7-8750H (1.89 - 2, n=40) | |
| Medion Erazer P6705-MD61131 | |
| Acer Nitro 5 AN515-42-R6V0 | |
| Cinebench R10 | |
| Rendering Multiple CPUs 32Bit | |
| Average of class Gaming (42932 - 102066, n=9, last 2 years) | |
| Average Intel Core i7-8750H (29664 - 35307, n=25) | |
| HP Pavilion Gaming 15-cx0003ng | |
| Rendering Single 32Bit | |
| Average of class Gaming (7457 - 12575, n=9, last 2 years) | |
| HP Pavilion Gaming 15-cx0003ng | |
| Average Intel Core i7-8750H (6236 - 6645, n=25) | |
| Geekbench 3 | |
| 32 Bit Multi-Core Score | |
| Average Intel Core i7-8750H (20725 - 22665, n=13) | |
| HP Pavilion Gaming 15-cx0003ng | |
| 32 Bit Single-Core Score | |
| Average Intel Core i7-8750H (3734 - 4163, n=13) | |
| HP Pavilion Gaming 15-cx0003ng | |
| Geekbench 4.0 | |
| 64 Bit Multi-Core Score | |
| Average of class Gaming (40469 - 76142, n=4, last 2 years) | |
| Average Intel Core i7-8750H (17048 - 22006, n=8) | |
| HP Pavilion Gaming 15-cx0003ng | |
| 64 Bit Single-Core Score | |
| Average of class Gaming (7589 - 9053, n=4, last 2 years) | |
| HP Pavilion Gaming 15-cx0003ng | |
| Average Intel Core i7-8750H (4548 - 4997, n=8) | |
| Geekbench 4.4 | |
| 64 Bit Multi-Core Score | |
| Average of class Gaming (89200 - 101054, n=3, last 2 years) | |
| Average Intel Core i7-8750H (17709 - 23313, n=17) | |
| HP Pavilion Gaming 15-cx0003ng | |
| 64 Bit Single-Core Score | |
| Average of class Gaming (9335 - 9775, n=3, last 2 years) | |
| HP Pavilion Gaming 15-cx0003ng | |
| Average Intel Core i7-8750H (4669 - 5146, n=17) | |
| Mozilla Kraken 1.1 - Total | |
| Average Intel Core i7-8750H (695 - 1272, n=50) | |
| HP Pavilion Gaming 15-cx0003ng | |
| Lenovo Legion Y530-15ICH (Microsoft Edge 42.17134.1.0) | |
| Average of class Gaming (391 - 590, n=100, last 2 years) | |
| Octane V2 - Total Score | |
| Average of class Gaming (93292 - 139447, n=27, last 2 years) | |
| HP Pavilion Gaming 15-cx0003ng | |
| Lenovo Legion Y530-15ICH (Microsoft Edge 42.17134.1.0) | |
| Average Intel Core i7-8750H (27460 - 44549, n=47) | |
| JetStream 1.1 - 1.1 Total | |
| Average of class Gaming (549 - 647, n=3, last 2 years) | |
| Lenovo Legion Y530-15ICH (Microsoft Edge 42.17134.1.0) | |
| HP Pavilion Gaming 15-cx0003ng (Edge 44) | |
| Average Intel Core i7-8750H (205 - 299, n=49) | |
* ... smaller is better
| PCMark 7 Score | 6418 points | |
| PCMark 8 Home Score Accelerated v2 | 4259 points | |
| PCMark 8 Creative Score Accelerated v2 | 4820 points | |
| PCMark 8 Work Score Accelerated v2 | 5249 points | |
| PCMark 10 Score | 4732 points | |
Help | ||
| PCMark 8 | |
| Home Score Accelerated v2 | |
| Average of class Gaming (n=1last 2 years) | |
| HP Pavilion Gaming 15t-cx0000 | |
| Acer Nitro 5 AN515-52-74DR | |
| HP Pavilion Gaming 15-cx0003ng | |
| Average Intel Core i7-8750H, NVIDIA GeForce GTX 1050 Ti Mobile (3894 - 4371, n=10) | |
| Lenovo Legion Y530-15ICH | |
| Medion Erazer P6705-MD61131 | |
| Acer Nitro 5 AN515-42-R6V0 | |
| Work Score Accelerated v2 | |
| Acer Nitro 5 AN515-52-74DR | |
| Lenovo Legion Y530-15ICH | |
| Medion Erazer P6705-MD61131 | |
| Average Intel Core i7-8750H, NVIDIA GeForce GTX 1050 Ti Mobile (4973 - 5461, n=10) | |
| HP Pavilion Gaming 15t-cx0000 | |
| HP Pavilion Gaming 15-cx0003ng | |
| Acer Nitro 5 AN515-42-R6V0 | |
| Average of class Gaming (n=1last 2 years) | |

| HP Pavilion Gaming 15-cx0003ng Intel Optane 16 GB MEMPEK1J016GAH + HGST HTS721010A9E630 1 TB HDD | Acer Nitro 5 AN515-42-R6V0 SK Hynix HFS128G39TND | Acer Nitro 5 AN515-52-74DR Intel SSD 600p SSDPEKKW512G7 | HP Pavilion Gaming 15t-cx0000 Samsung SSD PM981 MZVLB512HAJQ | Medion Erazer P6705-MD61131 Samsung SSD PM981 MZVLB256HAHQ | Lenovo Legion Y530-15ICH Toshiba KBG30ZMT128G | Average Intel Optane 16 GB MEMPEK1J016GAH + HGST HTS721010A9E630 1 TB HDD | |
|---|---|---|---|---|---|---|---|
| CrystalDiskMark 5.2 / 6 | -25% | 80% | 298% | 266% | 9% | 0% | |
| Write 4K (MB/s) | 59.2 | 73 23% | 78.8 33% | 129.5 119% | 107 81% | 71.8 21% | 59.2 ? 0% |
| Read 4K (MB/s) | 91.3 | 29.16 -68% | 29.51 -68% | 44.61 -51% | 39.91 -56% | 41.03 -55% | 91.3 ? 0% |
| Write Seq (MB/s) | 158.3 | 135.9 -14% | 581 267% | 1268 701% | 1439 809% | 349 120% | 158.3 ? 0% |
| Read Seq (MB/s) | 880 | 498.5 -43% | 934 6% | 992 13% | 2011 129% | 736 -16% | 880 ? 0% |
| Write 4K Q32T1 (MB/s) | 161.8 | 135.4 -16% | 280.8 74% | 535 231% | 282.1 74% | 105.3 -35% | 161.8 ? 0% |
| Read 4K Q32T1 (MB/s) | 286.5 | 215.6 -25% | 335.6 17% | 601 110% | 326.6 14% | 308 8% | 287 ? 0% |
| Write Seq Q32T1 (MB/s) | 159.8 | 135.7 -15% | 571 257% | 1938 1113% | 1441 802% | 151.4 -5% | 159.8 ? 0% |
| Read Seq Q32T1 (MB/s) | 929 | 512 -45% | 1389 50% | 2306 148% | 3516 278% | 1262 36% | 929 ? 0% |
| AS SSD | -17% | 217% | 649% | 310% | 21% | 0% | |
| Seq Read (MB/s) | 854 | 470.8 -45% | 1321 55% | 1235 45% | 2724 219% | 1231 44% | 854 ? 0% |
| Seq Write (MB/s) | 147 | 126.8 -14% | 554 277% | 1829 1144% | 1365 829% | 131.6 -10% | 147 ? 0% |
| 4K Read (MB/s) | 105.1 | 23.64 -78% | 32.38 -69% | 35.03 -67% | 46.14 -56% | 38.71 -63% | 105.1 ? 0% |
| 4K Write (MB/s) | 59.5 | 54.5 -8% | 94.5 59% | 95.9 61% | 102.6 72% | 35.74 -40% | 59.5 ? 0% |
| 4K-64 Read (MB/s) | 42.09 | 203.1 383% | 505 1100% | 1160 2656% | 567 1247% | 335.3 697% | 42.1 ? 0% |
| 4K-64 Write (MB/s) | 137.3 | 127.1 -7% | 511 272% | 1808 1217% | 459.8 235% | 78.9 -43% | 137.3 ? 0% |
| Access Time Read * (ms) | 14.99 | 0.121 99% | 0.12 99% | 0.051 100% | 0.08 99% | 0.626 96% | 15 ? -0% |
| Access Time Write * (ms) | 0.043 | 0.269 -526% | 0.039 9% | 0.038 12% | 0.037 14% | 0.287 -567% | 0.043 ? -0% |
| Score Read (Points) | 233 | 274 18% | 670 188% | 1319 466% | 886 280% | 497 113% | 233 ? 0% |
| Score Write (Points) | 211 | 194 -8% | 661 213% | 2087 889% | 699 231% | 128 -39% | 211 ? 0% |
| Score Total (Points) | 577 | 600 4% | 1643 185% | 4113 613% | 1983 244% | 838 45% | 577 ? 0% |
| Copy ISO MB/s (MB/s) | 110.1 | 110.1 ? 0% | |||||
| Copy Program MB/s (MB/s) | 94.1 | 94.1 ? 0% | |||||
| Copy Game MB/s (MB/s) | 81.7 | 81.7 ? 0% | |||||
| Total Average (Program / Settings) | -21% /
-20% | 149% /
159% | 474% /
501% | 288% /
292% | 15% /
16% | 0% /
0% |
* ... smaller is better
| 3DMark 06 Standard Score | 33957 points | |
| 3DMark 11 Performance | 8501 points | |
| 3DMark Ice Storm Standard Score | 87964 points | |
| 3DMark Cloud Gate Standard Score | 25570 points | |
| 3DMark Fire Strike Score | 6286 points | |
| 3DMark Time Spy Score | 2196 points | |
Help | ||
| 3DMark 11 - 1280x720 Performance GPU | |
| Average of class Gaming (21841 - 80022, n=104, last 2 years) | |
| HP Pavilion Gaming 15t-cx0000 | |
| Lenovo Legion Y530-15ICH | |
| Average NVIDIA GeForce GTX 1050 Ti Mobile (8304 - 10402, n=36) | |
| Acer Nitro 5 AN515-52-74DR | |
| Medion Erazer P6705-MD61131 | |
| Acer Nitro 5 AN515-42-R6V0 | |
| HP Pavilion Gaming 15-cx0003ng | |
| 3DMark | |
| 1280x720 Cloud Gate Standard Graphics | |
| Average of class Gaming (86886 - 223650, n=60, last 2 years) | |
| HP Pavilion Gaming 15t-cx0000 | |
| Acer Nitro 5 AN515-52-74DR | |
| Lenovo Legion Y530-15ICH | |
| Average NVIDIA GeForce GTX 1050 Ti Mobile (43721 - 53978, n=37) | |
| Medion Erazer P6705-MD61131 | |
| HP Pavilion Gaming 15-cx0003ng | |
| Acer Nitro 5 AN515-42-R6V0 | |
| 1920x1080 Fire Strike Graphics | |
| Average of class Gaming (12242 - 62849, n=115, last 2 years) | |
| HP Pavilion Gaming 15t-cx0000 | |
| Average NVIDIA GeForce GTX 1050 Ti Mobile (6792 - 8376, n=38) | |
| Lenovo Legion Y530-15ICH | |
| Acer Nitro 5 AN515-52-74DR | |
| Medion Erazer P6705-MD61131 | |
| HP Pavilion Gaming 15-cx0003ng | |
| Acer Nitro 5 AN515-42-R6V0 | |
| 2560x1440 Time Spy Graphics | |
| Average of class Gaming (5012 - 26212, n=115, last 2 years) | |
| Average NVIDIA GeForce GTX 1050 Ti Mobile (1990 - 2536, n=16) | |
| HP Pavilion Gaming 15-cx0003ng | |
| low | med. | high | ultra | |
|---|---|---|---|---|
| Tomb Raider (2013) | 326.3 | 237.1 | 174.7 | 80 |
| BioShock Infinite (2013) | 259.7 | 200.5 | 180.5 | 71.9 |
| The Witcher 3 (2015) | 116 | 69.7 | 40 | 23.1 |
| Rainbow Six Siege (2015) | 95.9 | 92 | 74.9 | 69.3 |
| Call of Duty Black Ops 4 (2018) | 107.8 | 47.6 | 47.5 | 44 |
| Hitman 2 (2018) | 60.8 | 43.1 | 37.8 | 33.4 |
| Fallout 76 (2018) | 60 | 50.3 | 44.1 | 43.1 |
| Battlefield V (2018) | 65.8 | 53.2 | 44.5 | 39.5 |
| Farming Simulator 19 (2018) | 163.1 | 124.8 | 79.1 | 60.1 |
| Darksiders III (2018) | 116.6 | 60.2 | 44.7 | 38.9 |
| Just Cause 4 (2018) | 65.6 | 40.9 | 34.6 | 33.2 |
| BioShock Infinite - 1920x1080 Ultra Preset, DX11 (DDOF) | |
| HP Pavilion Gaming 15t-cx0000 | |
| Average NVIDIA GeForce GTX 1050 Ti Mobile (61 - 97, n=23) | |
| HP Pavilion Gaming 15-cx0003ng | |
| Lenovo Legion Y530-15ICH | |
| The Witcher 3 - 1920x1080 High Graphics & Postprocessing (Nvidia HairWorks Off) | |
| Average of class Gaming (341 - 404, n=2, last 2 years) | |
| HP Pavilion Gaming 15t-cx0000 | |
| MSI GE72 7RE-046 | |
| Acer Nitro 5 AN515-52-74DR | |
| Average NVIDIA GeForce GTX 1050 Ti Mobile (21.3 - 51.9, n=26) | |
| Medion Erazer P6705-MD61131 | |
| HP Pavilion Gaming 15-cx0003ng | |
| Acer Nitro 5 AN515-42-R6V0 | |
| Farming Simulator 19 - 1920x1080 Very High Preset | |
| HP Pavilion Gaming 15-cx0003ng | |
| Average NVIDIA GeForce GTX 1050 Ti Mobile (59.3 - 60.1, n=2) | |
| MSI GE72 7RE | |
| Acer Nitro 5 AN515-42-R6V0 | |
| Just Cause 4 - 1920x1080 Medium / Off AF:4x | |
| MSI GE72 7RE | |
| Average NVIDIA GeForce GTX 1050 Ti Mobile (40.9 - 54, n=3) | |
| HP Pavilion Gaming 15-cx0003ng | |
| Call of Duty Black Ops 4 - 1920x1080 Very High / On | |
| HP Pavilion Gaming 15-cx0003ng | |
| Average NVIDIA GeForce GTX 1050 Ti Mobile (35.5 - 47.7, n=4) | |
| Medion Erazer P6705-MD61131 | |
| MSI GE72 7RE-046 | |
| Acer Nitro 5 AN515-42-R6V0 | |
Noise level
| Idle |
| 30.6 / 30.6 / 33.2 dB(A) |
| DVD |
| 0 / dB(A) |
| Load |
| 42.8 / 43 dB(A) |
 | ||
30 dB silent 40 dB(A) audible 50 dB(A) loud |
||
min: | ||
| HP Pavilion Gaming 15-cx0003ng i7-8750H, GeForce GTX 1050 Ti Mobile | Acer Nitro 5 AN515-42-R6V0 R7 2700U, Radeon RX 560X (Laptop) | Acer Nitro 5 AN515-52-74DR i7-8750H, GeForce GTX 1050 Ti Mobile | HP Pavilion Gaming 15t-cx0000 i7-8750H, GeForce GTX 1060 Max-Q | Medion Erazer P6705-MD61131 i7-8750H, GeForce GTX 1050 Ti Mobile | Lenovo Legion Y530-15ICH i5-8300H, GeForce GTX 1050 Ti Mobile | Average NVIDIA GeForce GTX 1050 Ti Mobile | Average of class Gaming | |
|---|---|---|---|---|---|---|---|---|
| Noise | 2% | -3% | -2% | -7% | 7% | -1% | 5% | |
| off / environment * (dB) | 30.6 | 29 5% | 30 2% | 28.3 8% | 29 5% | 28 8% | 29.4 ? 4% | 24.1 ? 21% |
| Idle Minimum * (dB) | 30.6 | 29 5% | 30 2% | 32.2 -5% | 29 5% | 28 8% | 30.7 ? -0% | 26 ? 15% |
| Idle Average * (dB) | 30.6 | 31 -1% | 32 -5% | 32.4 -6% | 34 -11% | 28 8% | 31.7 ? -4% | 27.4 ? 10% |
| Idle Maximum * (dB) | 33.2 | 32 4% | 33 1% | 32.4 2% | 43 -30% | 28.5 14% | 33.8 ? -2% | 30.1 ? 9% |
| Load Average * (dB) | 42.8 | 36 16% | 42 2% | 40.2 6% | 44 -3% | 34.9 18% | 41.3 ? 4% | 43.6 ? -2% |
| Witcher 3 ultra * (dB) | 42.1 | 44 -5% | 46 -9% | 45 -7% | 44 -5% | 40 5% | ||
| Load Maximum * (dB) | 43 | 46 -7% | 49 -14% | 47.2 -10% | 48 -12% | 49.6 -15% | 47.2 ? -10% | 54.2 ? -26% |
* ... smaller is better
(±) The maximum temperature on the upper side is 44.1 °C / 111 F, compared to the average of 40.4 °C / 105 F, ranging from 21.2 to 68.8 °C for the class Gaming.
(-) The bottom heats up to a maximum of 53.8 °C / 129 F, compared to the average of 43.2 °C / 110 F
(+) In idle usage, the average temperature for the upper side is 24.1 °C / 75 F, compared to the device average of 33.9 °C / 93 F.
(±) Playing The Witcher 3, the average temperature for the upper side is 35.2 °C / 95 F, compared to the device average of 33.9 °C / 93 F.
(+) The palmrests and touchpad are cooler than skin temperature with a maximum of 30.6 °C / 87.1 F and are therefore cool to the touch.
(±) The average temperature of the palmrest area of similar devices was 28.8 °C / 83.8 F (-1.8 °C / -3.3 F).
| HP Pavilion Gaming 15-cx0003ng i7-8750H, GeForce GTX 1050 Ti Mobile | Acer Nitro 5 AN515-42-R6V0 R7 2700U, Radeon RX 560X (Laptop) | Acer Nitro 5 AN515-52-74DR i7-8750H, GeForce GTX 1050 Ti Mobile | HP Pavilion Gaming 15t-cx0000 i7-8750H, GeForce GTX 1060 Max-Q | Medion Erazer P6705-MD61131 i7-8750H, GeForce GTX 1050 Ti Mobile | Lenovo Legion Y530-15ICH i5-8300H, GeForce GTX 1050 Ti Mobile | Average NVIDIA GeForce GTX 1050 Ti Mobile | Average of class Gaming | |
|---|---|---|---|---|---|---|---|---|
| Heat | -4% | -22% | -11% | 5% | -18% | -5% | -11% | |
| Maximum Upper Side * (°C) | 44.1 | 47 -7% | 52 -18% | 46 -4% | 45 -2% | 42.8 3% | 46.5 ? -5% | 45.2 ? -2% |
| Maximum Bottom * (°C) | 53.8 | 44 18% | 55 -2% | 52 3% | 43 20% | 52 3% | 48.4 ? 10% | 48.1 ? 11% |
| Idle Upper Side * (°C) | 24.6 | 30 -22% | 36 -46% | 29 -18% | 25 -2% | 32 -30% | 28.6 ? -16% | 31 ? -26% |
| Idle Bottom * (°C) | 26.7 | 28 -5% | 32 -20% | 33 -24% | 26 3% | 39.4 -48% | 28.9 ? -8% | 34.2 ? -28% |
* ... smaller is better
HP Pavilion Gaming 15-cx0003ng audio analysis
(-) | not very loud speakers (70.4 dB)
Bass 100 - 315 Hz
(-) | nearly no bass - on average 25.4% lower than median
(±) | linearity of bass is average (10.3% delta to prev. frequency)
Mids 400 - 2000 Hz
(+) | balanced mids - only 2.3% away from median
(+) | mids are linear (6.9% delta to prev. frequency)
Highs 2 - 16 kHz
(+) | balanced highs - only 1.8% away from median
(+) | highs are linear (4.7% delta to prev. frequency)
Overall 100 - 16.000 Hz
(±) | linearity of overall sound is average (21.1% difference to median)
Compared to same class
» 76% of all tested devices in this class were better, 4% similar, 20% worse
» The best had a delta of 6%, average was 18%, worst was 132%
Compared to all devices tested
» 58% of all tested devices were better, 7% similar, 34% worse
» The best had a delta of 4%, average was 23%, worst was 134%
Apple MacBook 12 (Early 2016) 1.1 GHz audio analysis
(+) | speakers can play relatively loud (83.6 dB)
Bass 100 - 315 Hz
(±) | reduced bass - on average 11.3% lower than median
(±) | linearity of bass is average (14.2% delta to prev. frequency)
Mids 400 - 2000 Hz
(+) | balanced mids - only 2.4% away from median
(+) | mids are linear (5.5% delta to prev. frequency)
Highs 2 - 16 kHz
(+) | balanced highs - only 2% away from median
(+) | highs are linear (4.5% delta to prev. frequency)
Overall 100 - 16.000 Hz
(+) | overall sound is linear (10.2% difference to median)
Compared to same class
» 7% of all tested devices in this class were better, 2% similar, 90% worse
» The best had a delta of 5%, average was 18%, worst was 53%
Compared to all devices tested
» 5% of all tested devices were better, 1% similar, 94% worse
» The best had a delta of 4%, average was 23%, worst was 134%
| Off / Standby | |
| Idle | |
| Load |
|
Key:
min: | |
| HP Pavilion Gaming 15-cx0003ng i7-8750H, GeForce GTX 1050 Ti Mobile | Acer Nitro 5 AN515-42-R6V0 R7 2700U, Radeon RX 560X (Laptop) | Acer Nitro 5 AN515-52-74DR i7-8750H, GeForce GTX 1050 Ti Mobile | HP Pavilion Gaming 15t-cx0000 i7-8750H, GeForce GTX 1060 Max-Q | Medion Erazer P6705-MD61131 i7-8750H, GeForce GTX 1050 Ti Mobile | Lenovo Legion Y530-15ICH i5-8300H, GeForce GTX 1050 Ti Mobile | Average NVIDIA GeForce GTX 1050 Ti Mobile | Average of class Gaming | |
|---|---|---|---|---|---|---|---|---|
| Power Consumption | -14% | 5% | -10% | 12% | -4% | -19% | -93% | |
| Idle Minimum * (Watt) | 5.5 | 7 -27% | 5 9% | 6 -9% | 4 27% | 4.5 18% | 7.92 ? -44% | 13 ? -136% |
| Idle Average * (Watt) | 8.5 | 10 -18% | 7 18% | 11.2 -32% | 7 18% | 10 -18% | 11.9 ? -40% | 19 ? -124% |
| Idle Maximum * (Watt) | 11.9 | 18 -51% | 11 8% | 13.3 -12% | 11 8% | 13.8 -16% | 15.4 ? -29% | 24.6 ? -107% |
| Load Average * (Watt) | 94 | 79 16% | 91 3% | 89.2 5% | 72 23% | 92.5 2% | 85.1 ? 9% | 110.7 ? -18% |
| Witcher 3 ultra * (Watt) | 86 | 98 -14% | 97 -13% | 101.9 -18% | 79 8% | 108.1 -26% | ||
| Load Maximum * (Watt) | 144 | 128 11% | 137 5% | 134.5 7% | 158 -10% | 123.2 14% | 130.5 ? 9% | 259 ? -80% |
* ... smaller is better
| HP Pavilion Gaming 15-cx0003ng i7-8750H, GeForce GTX 1050 Ti Mobile, 52.5 Wh | Acer Nitro 5 AN515-42-R6V0 R7 2700U, Radeon RX 560X (Laptop), 48 Wh | Acer Nitro 5 AN515-52-74DR i7-8750H, GeForce GTX 1050 Ti Mobile, 48 Wh | HP Pavilion Gaming 15t-cx0000 i7-8750H, GeForce GTX 1060 Max-Q, 70 Wh | Medion Erazer P6705-MD61131 i7-8750H, GeForce GTX 1050 Ti Mobile, 62 Wh | Lenovo Legion Y530-15ICH i5-8300H, GeForce GTX 1050 Ti Mobile, 52.5 Wh | Average of class Gaming | |
|---|---|---|---|---|---|---|---|
| Battery runtime | 8% | 27% | 2% | 29% | -23% | 25% | |
| Reader / Idle (h) | 10.8 | 12.5 16% | 8 -26% | 8.9 -18% | 8.27 ? -23% | ||
| H.264 (h) | 4.6 | 7.1 54% | 8.32 ? 81% | ||||
| WiFi v1.3 (h) | 5.3 | 5.7 8% | 7 32% | 6.3 19% | 6.7 26% | 4.1 -23% | 7.11 ? 34% |
| Load (h) | 1.4 | 1.5 7% | 1.6 14% | 2.5 79% | 1.502 ? 7% |
Pros
Cons
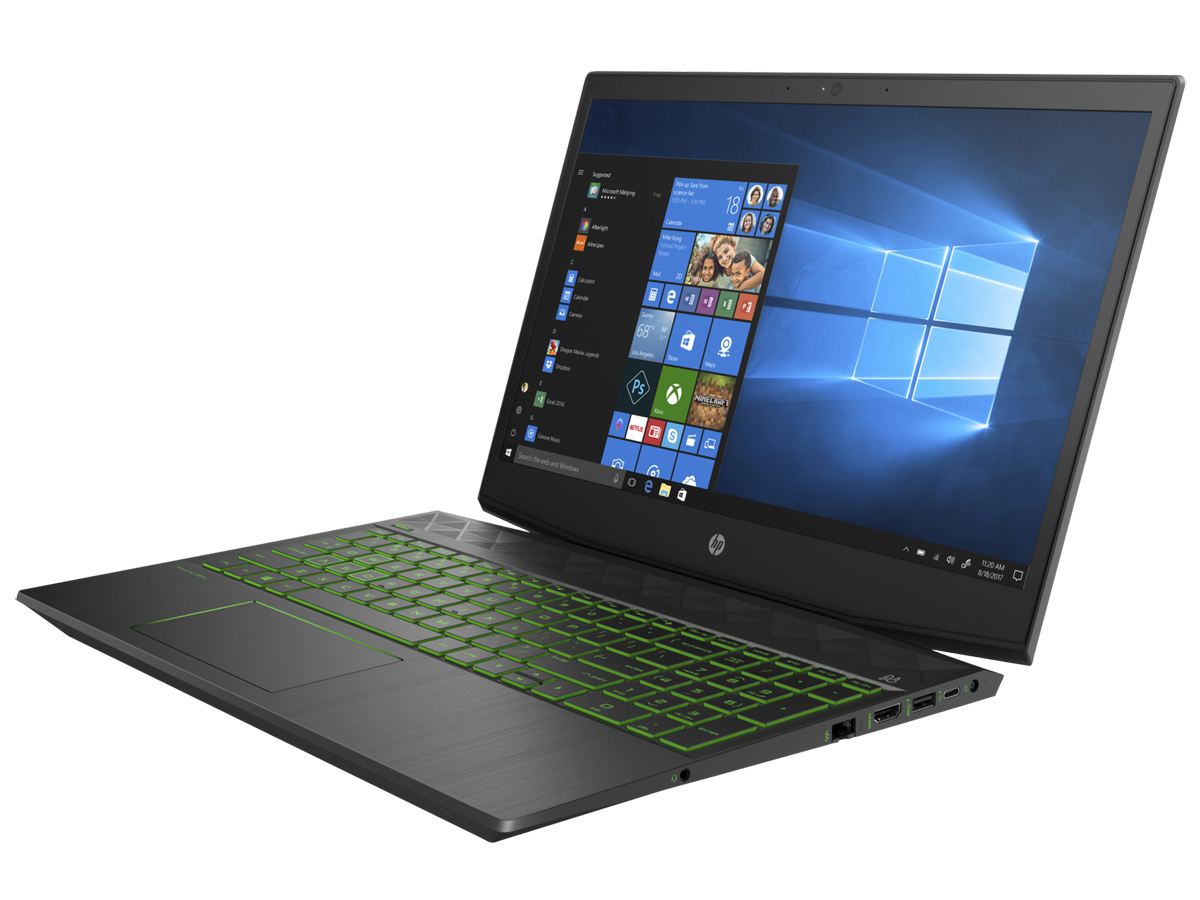
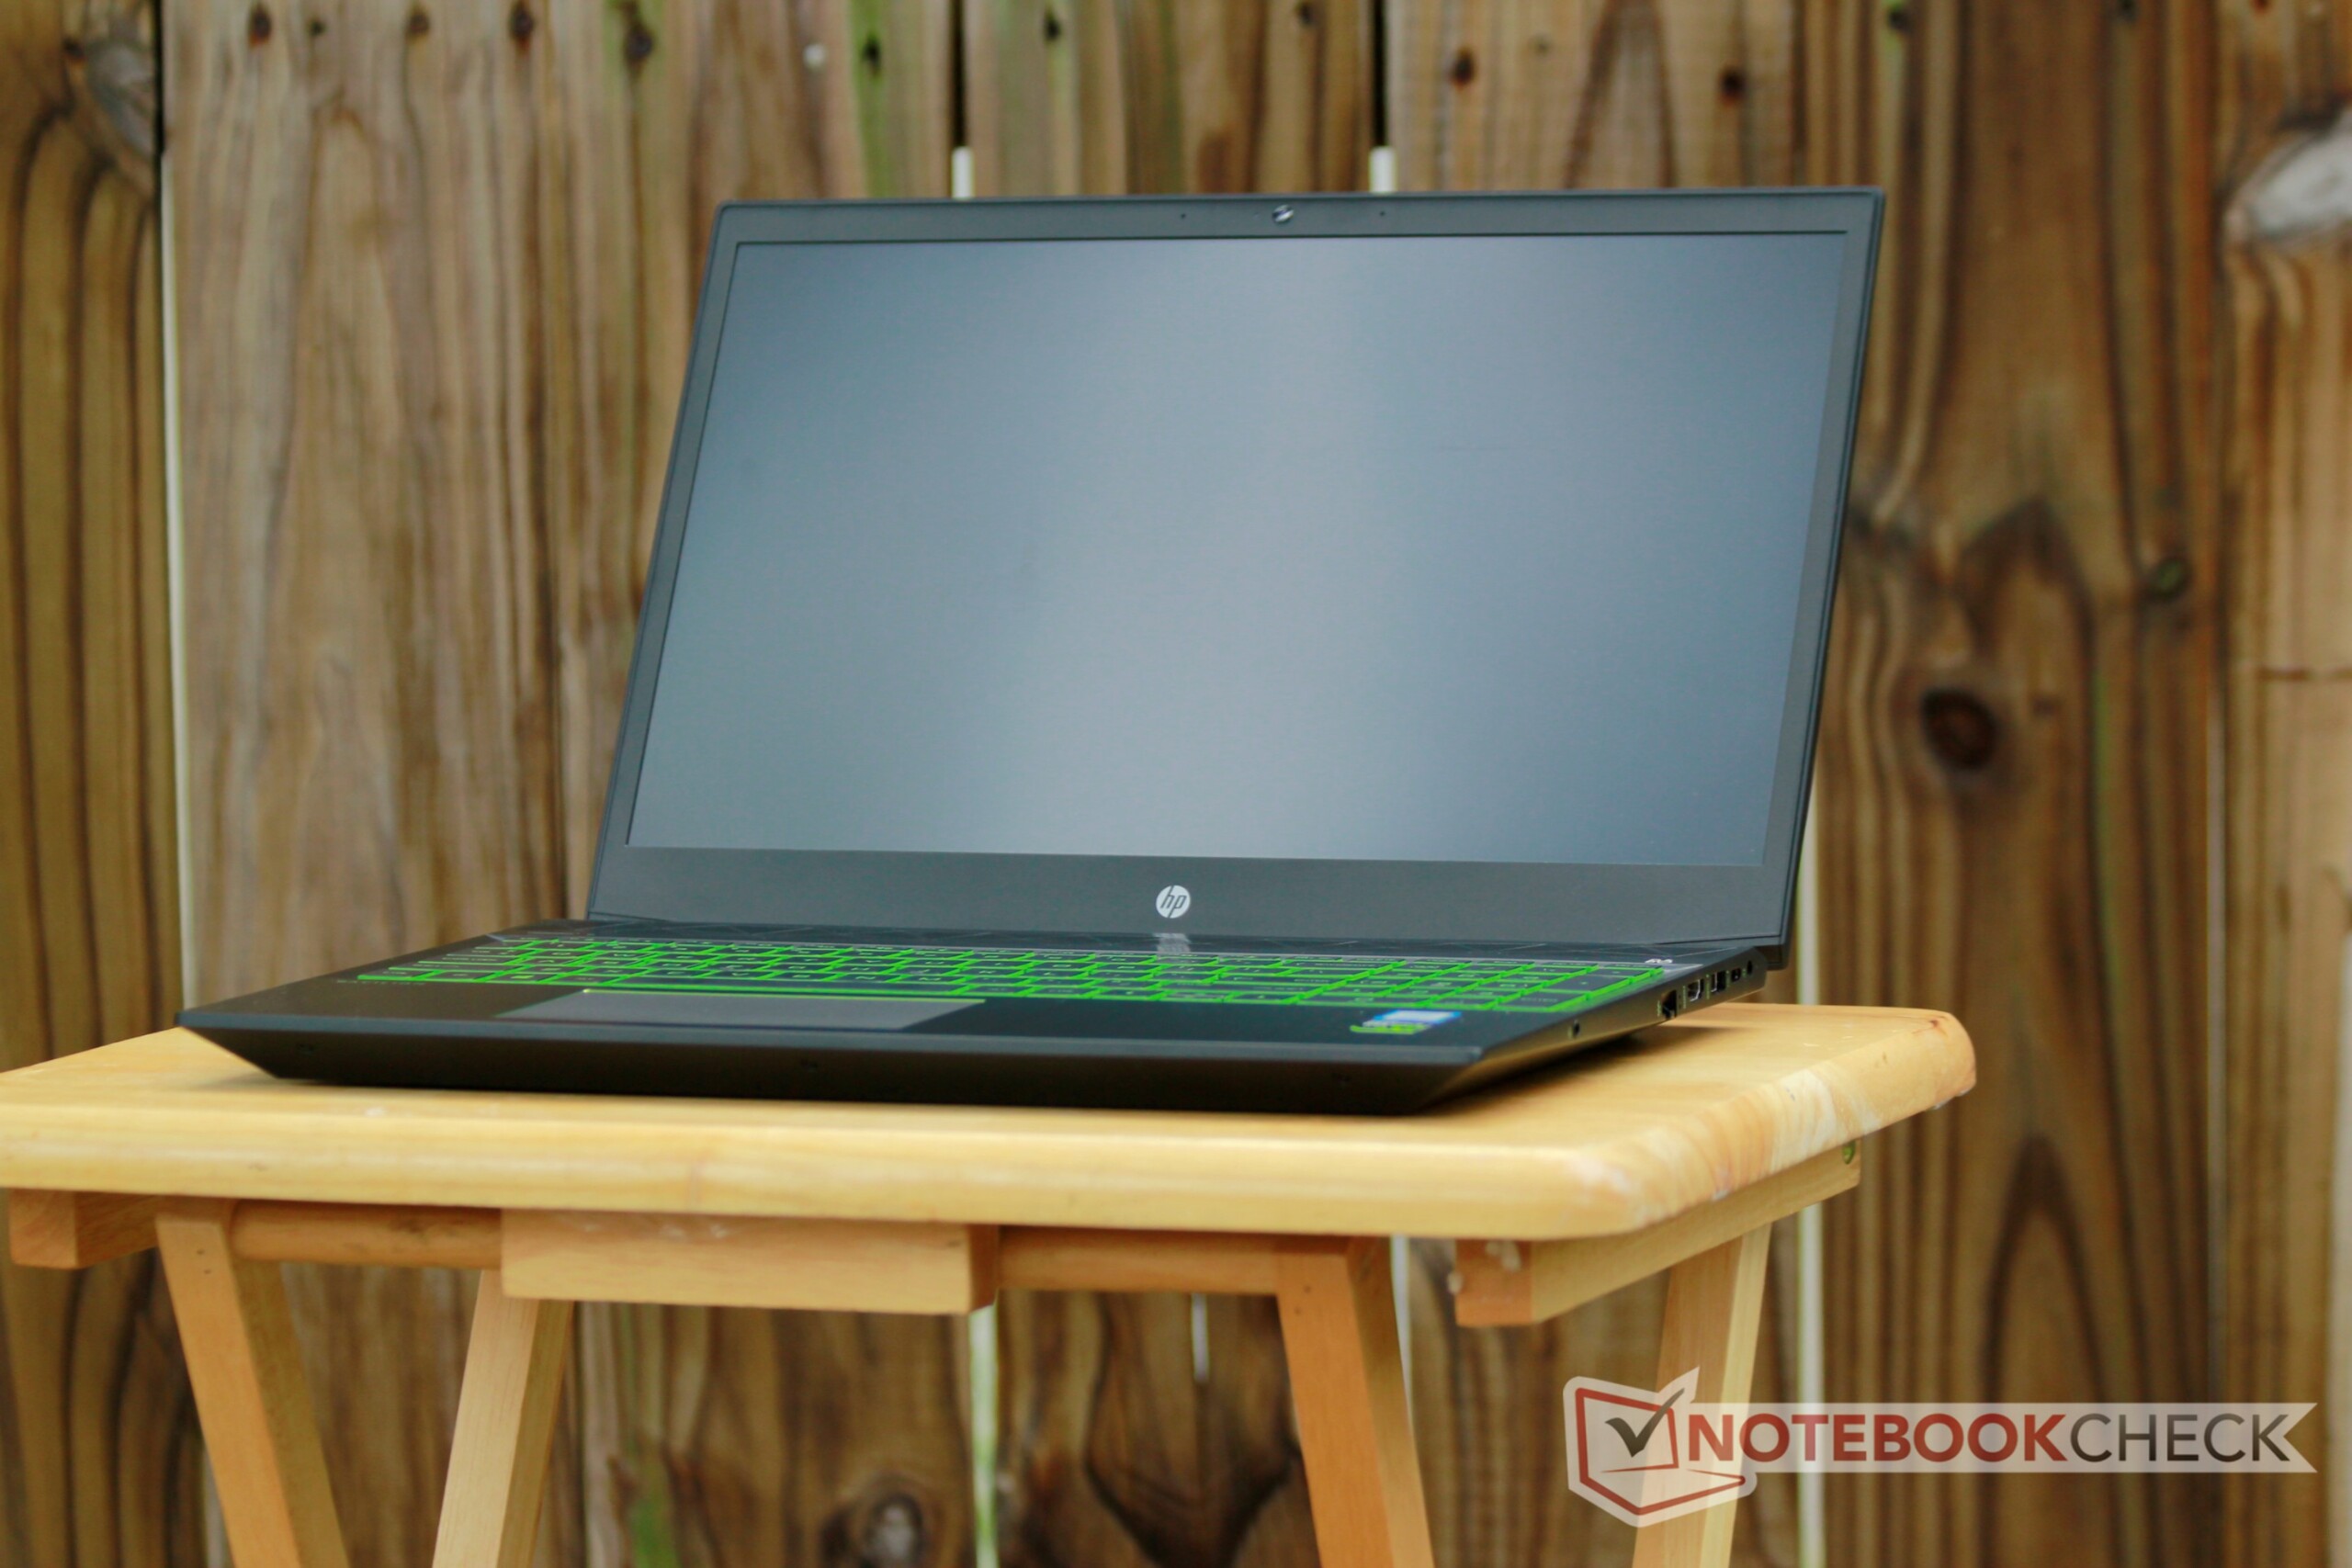
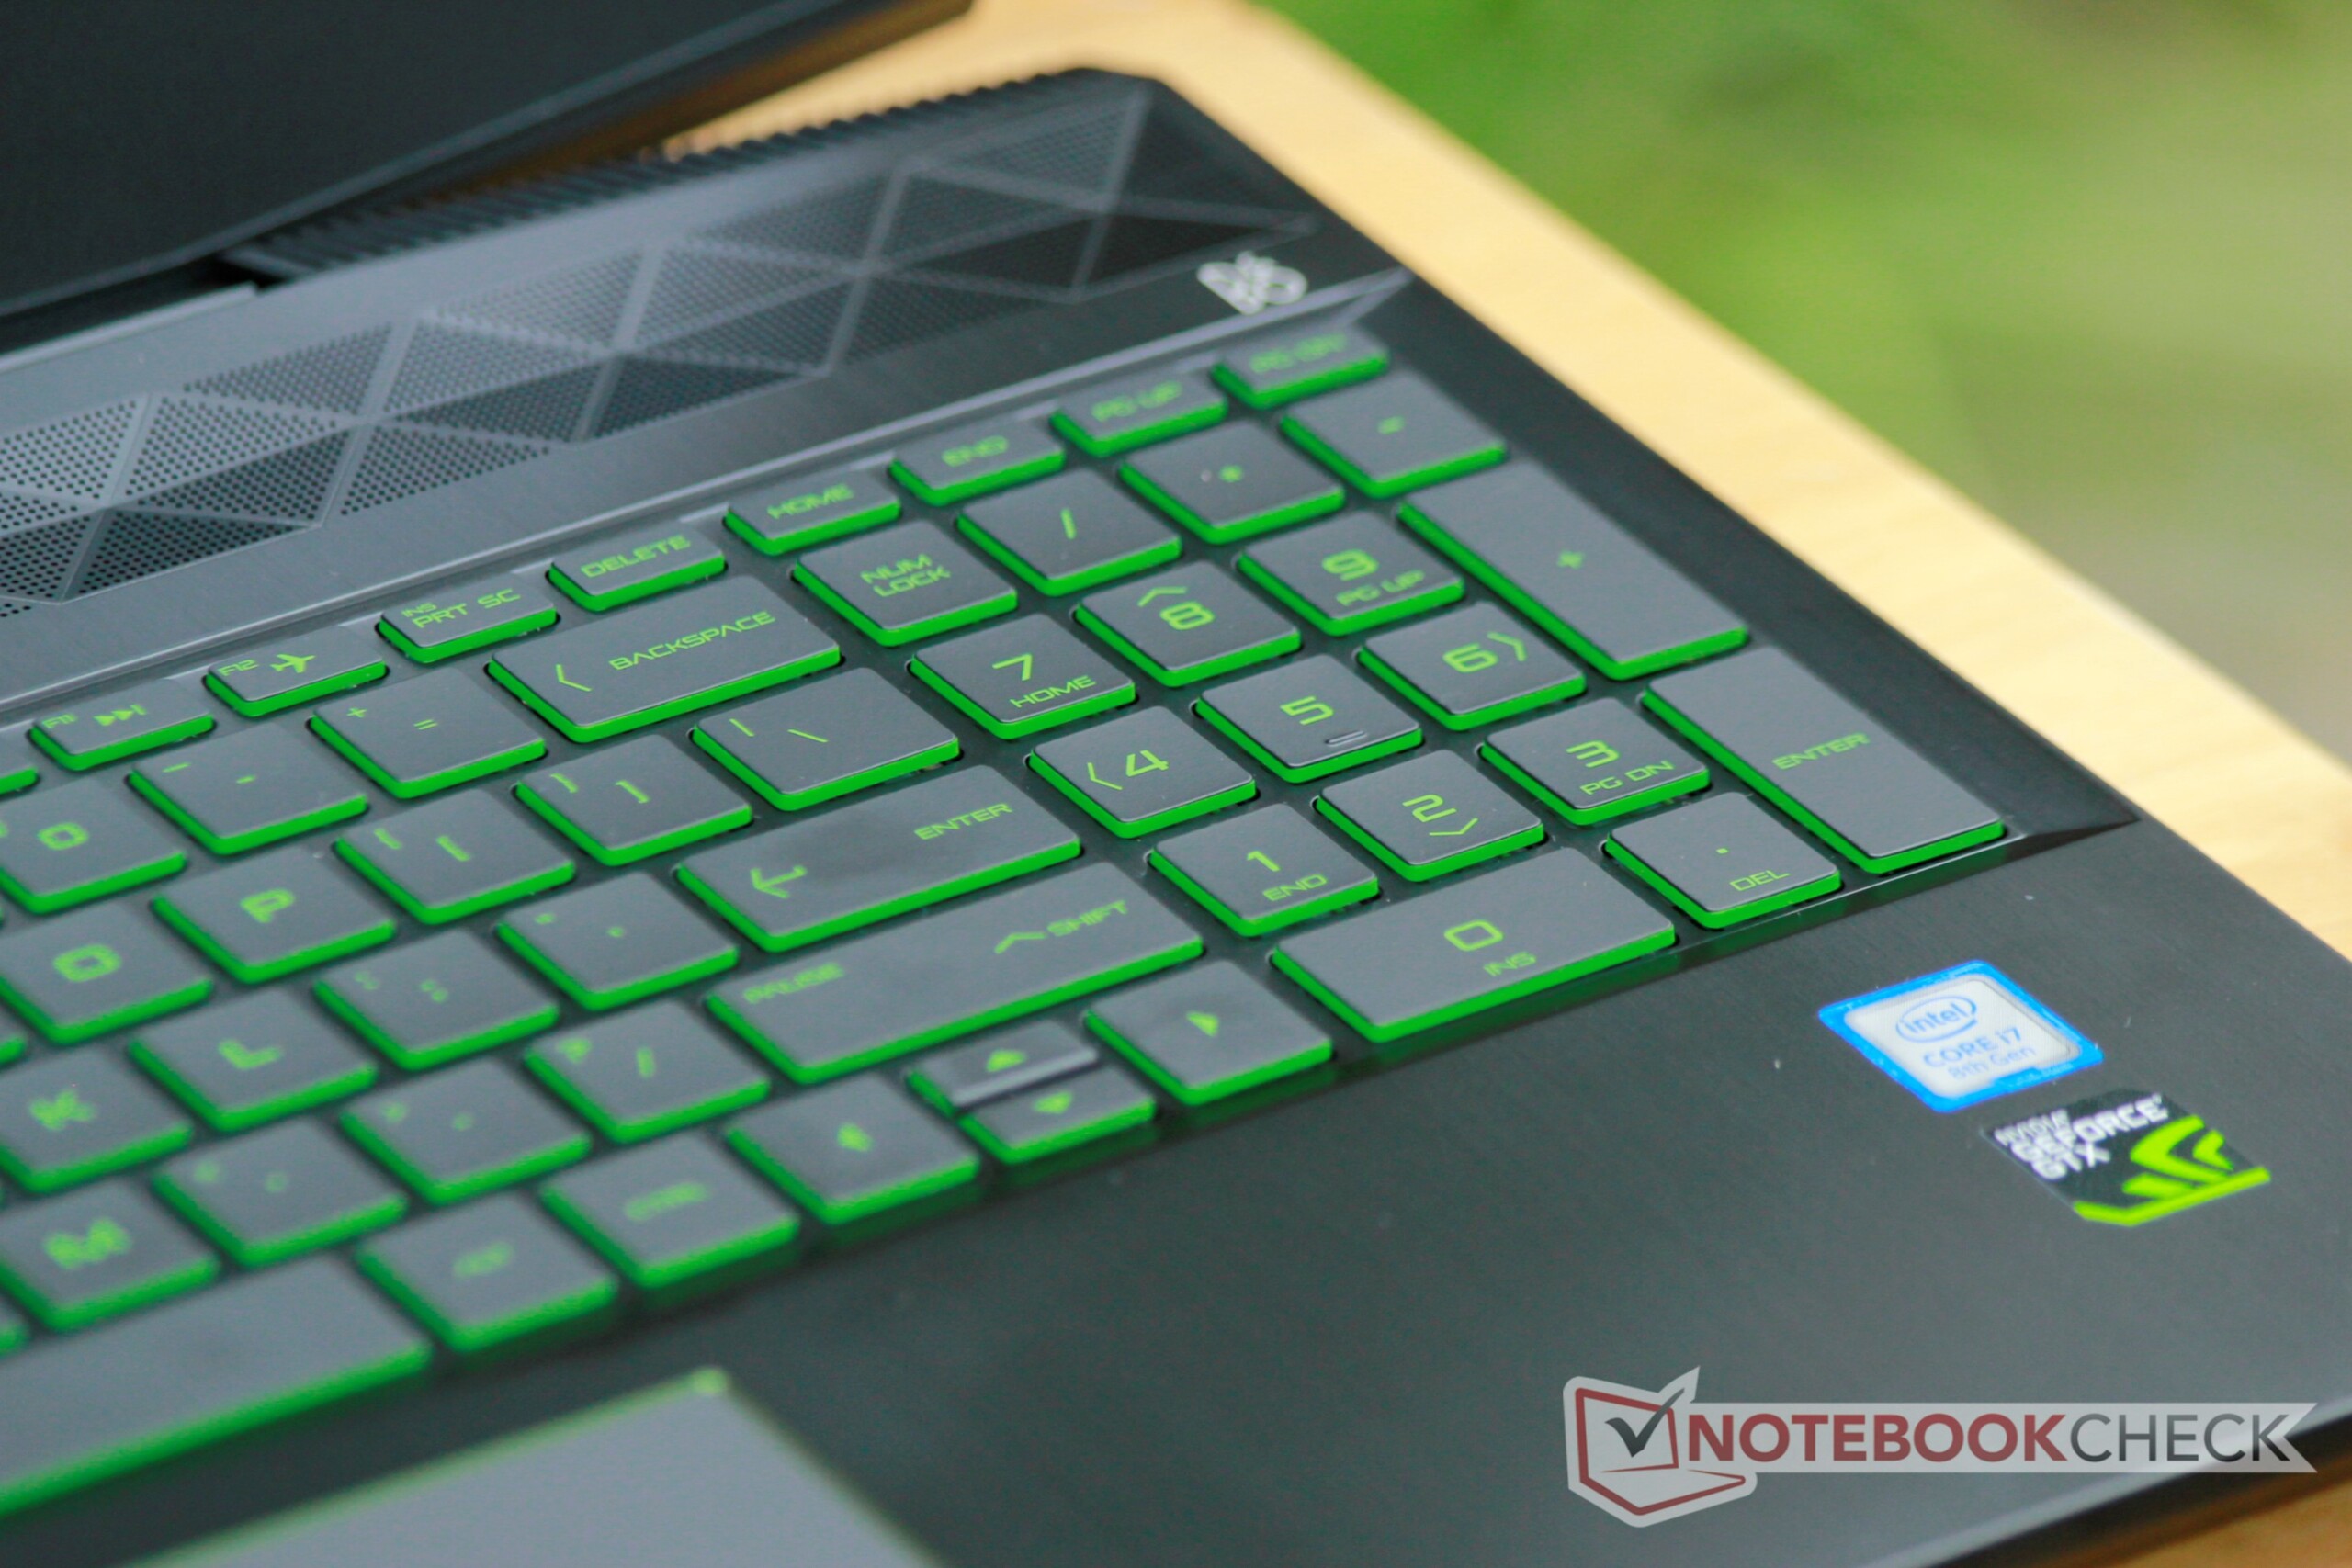
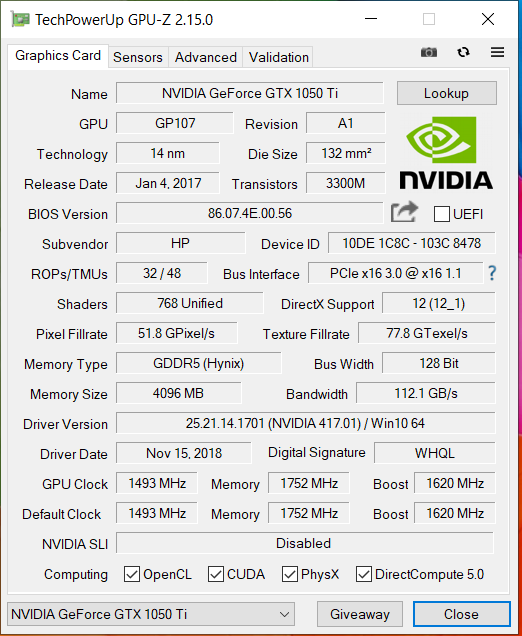
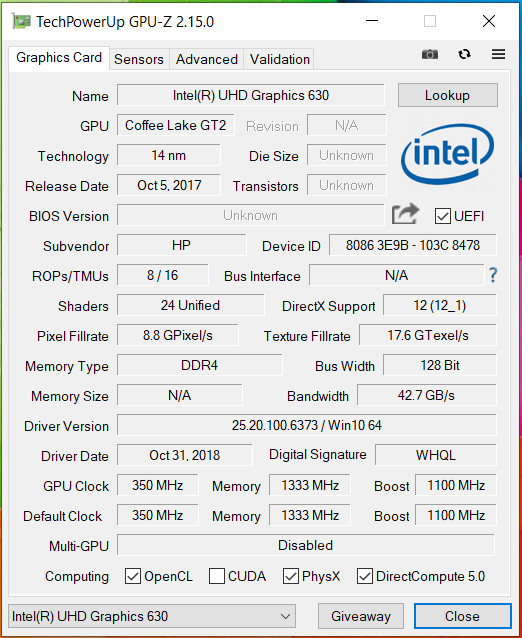
光影精灵4是一款15.6英寸中档游戏本。i7-8750H处理器和GeForce GTX 1050 Ti显卡的组合可以流畅的运行我们数据库中的所有游戏。但是,要求最高的新游戏应该在只能较低的设置下进行。六核处理器还为除了游戏以外的应用提供足够的处理能力。如果您不需要六核处理器或想节省一些预算,您应该看看配备四核Core i5-8300H的型号。
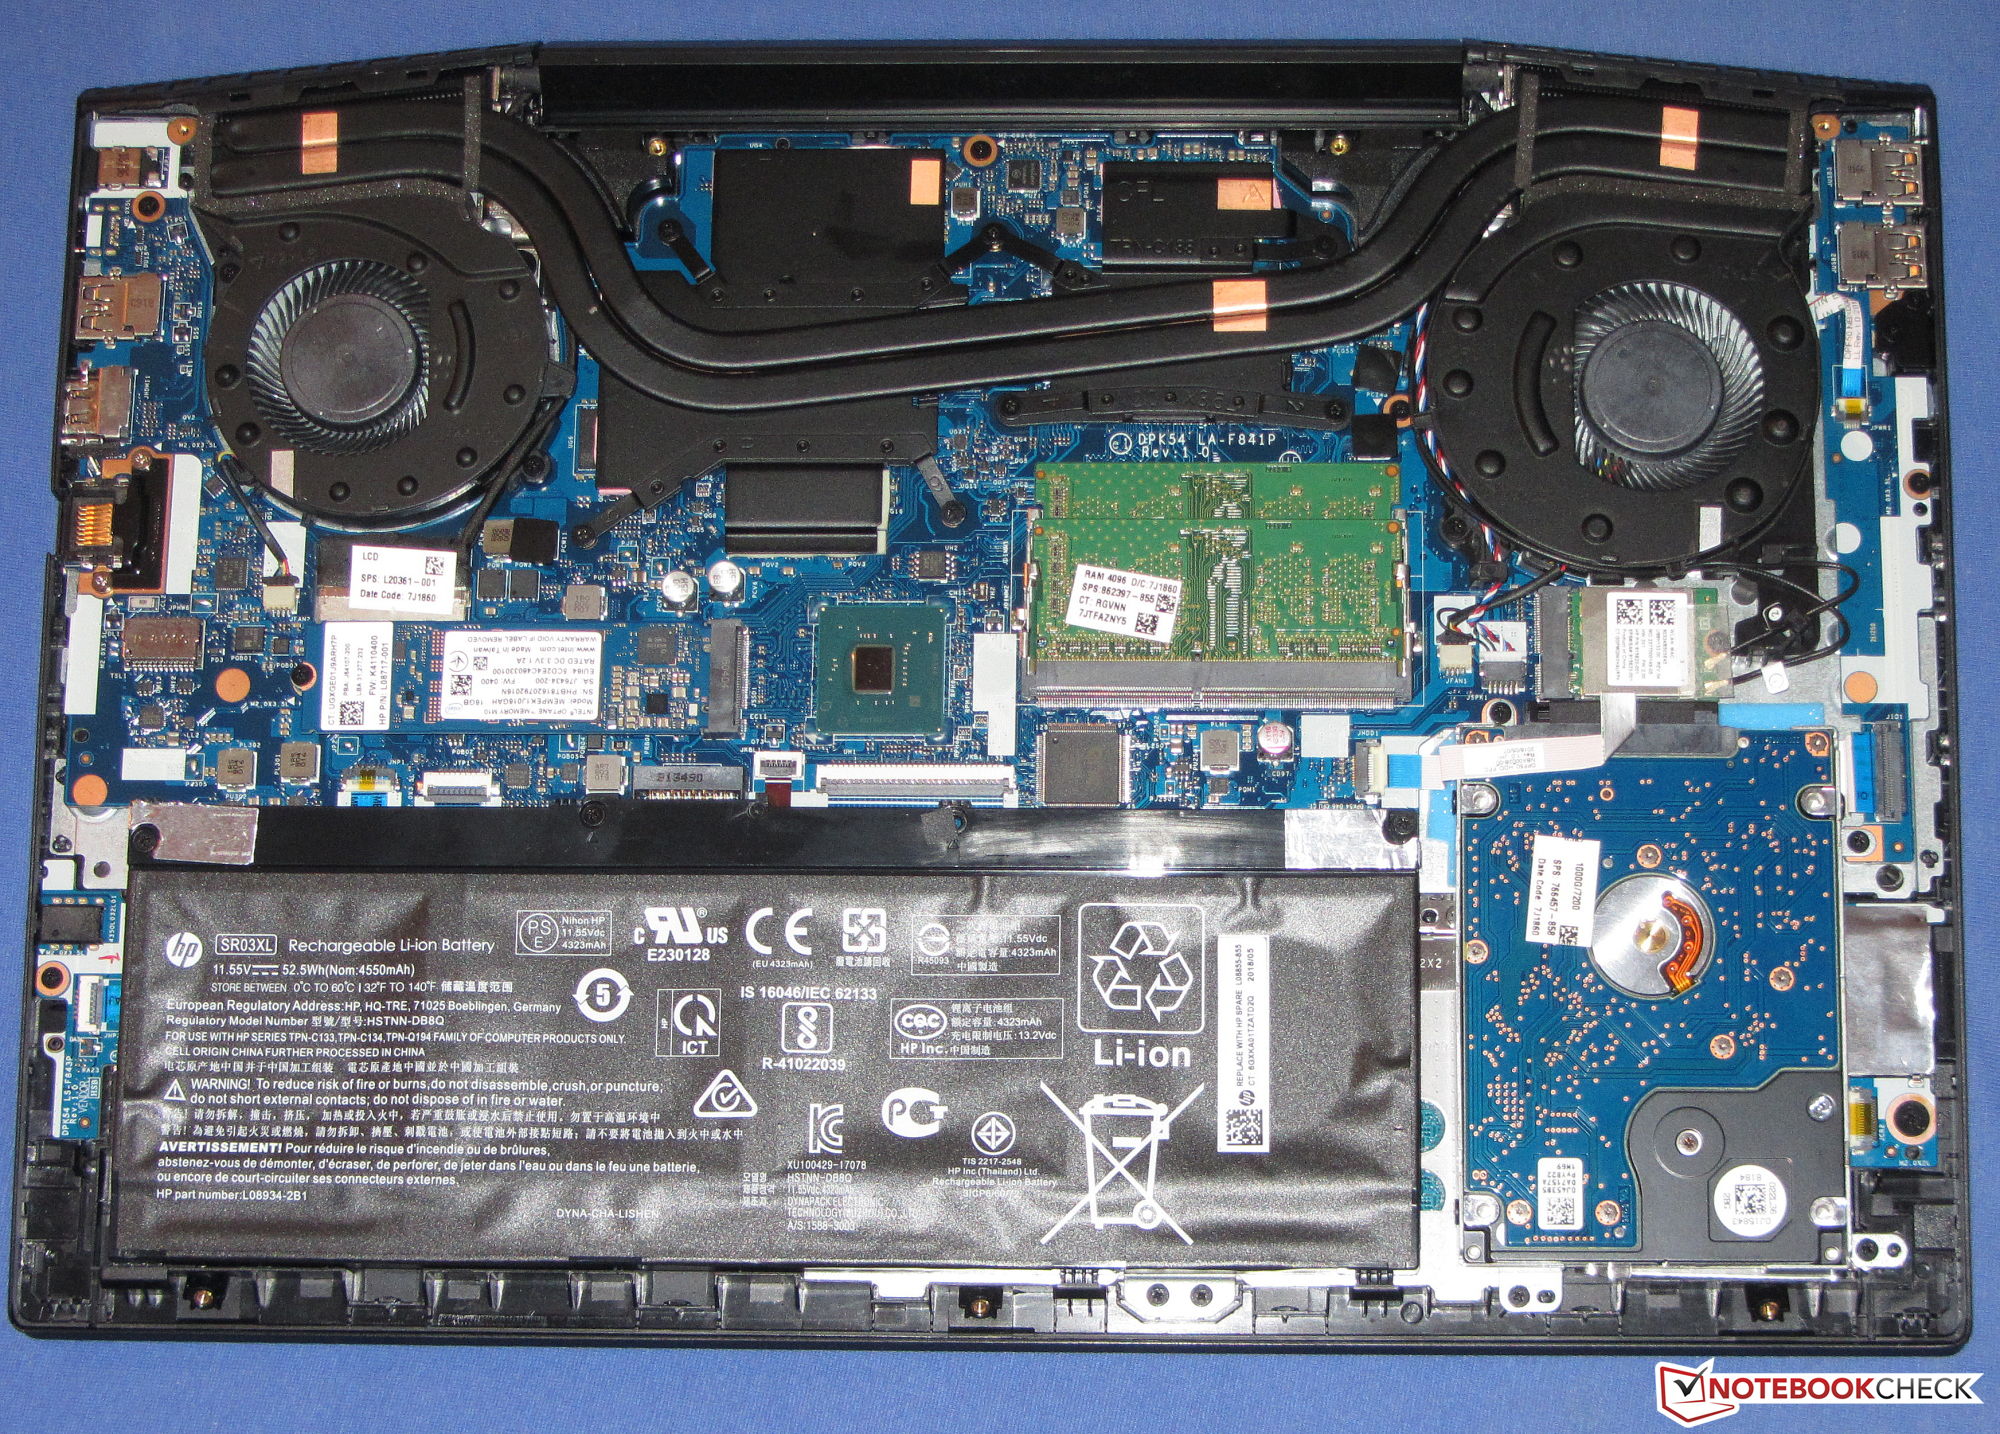
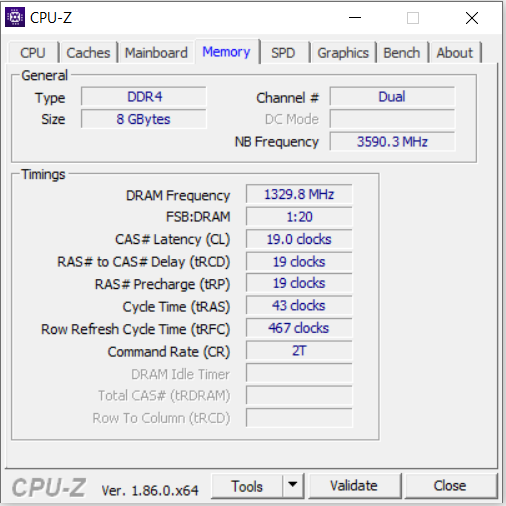
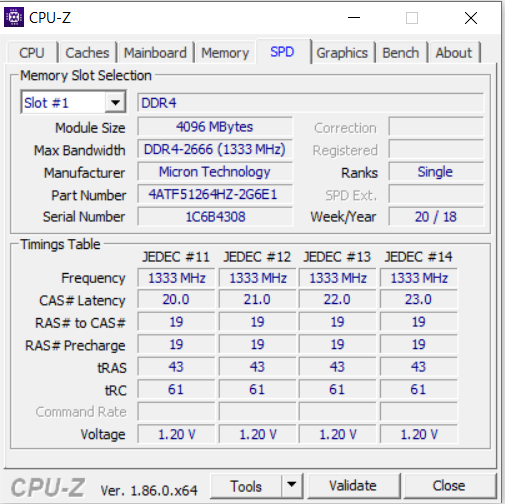
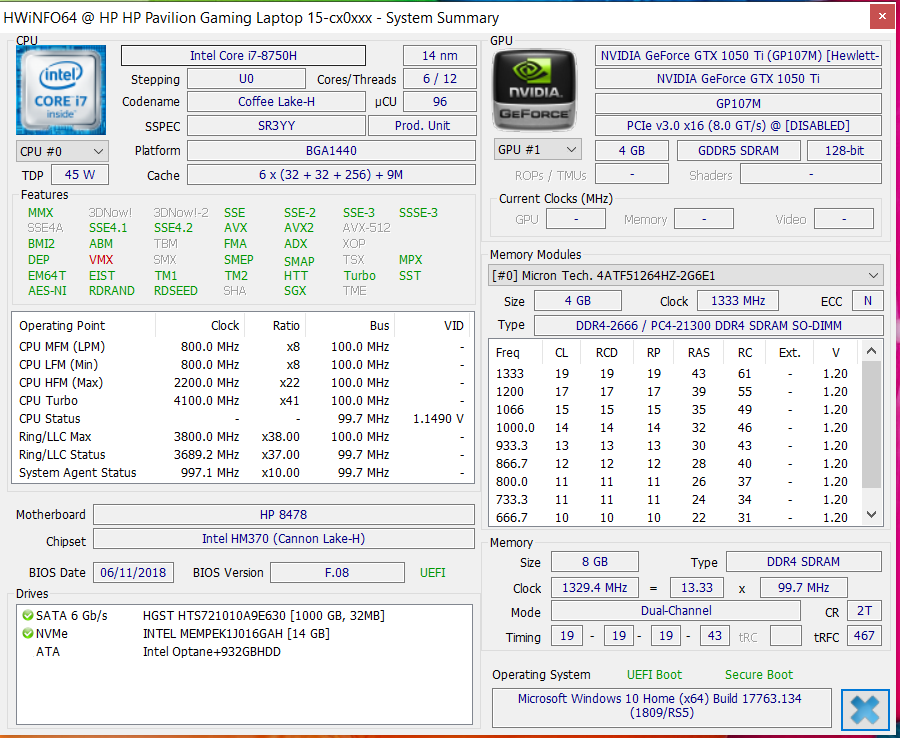
英特尔傲腾内存组合包括1 TB硬盘和16 GB NVMe SSD,可确保快速运行的系统。傲腾的是可选的。缓存SSD可以由来自不同制造商的NVMe设备替换,然后可以将其用作系统盘,而HDD仅用于数据存储。
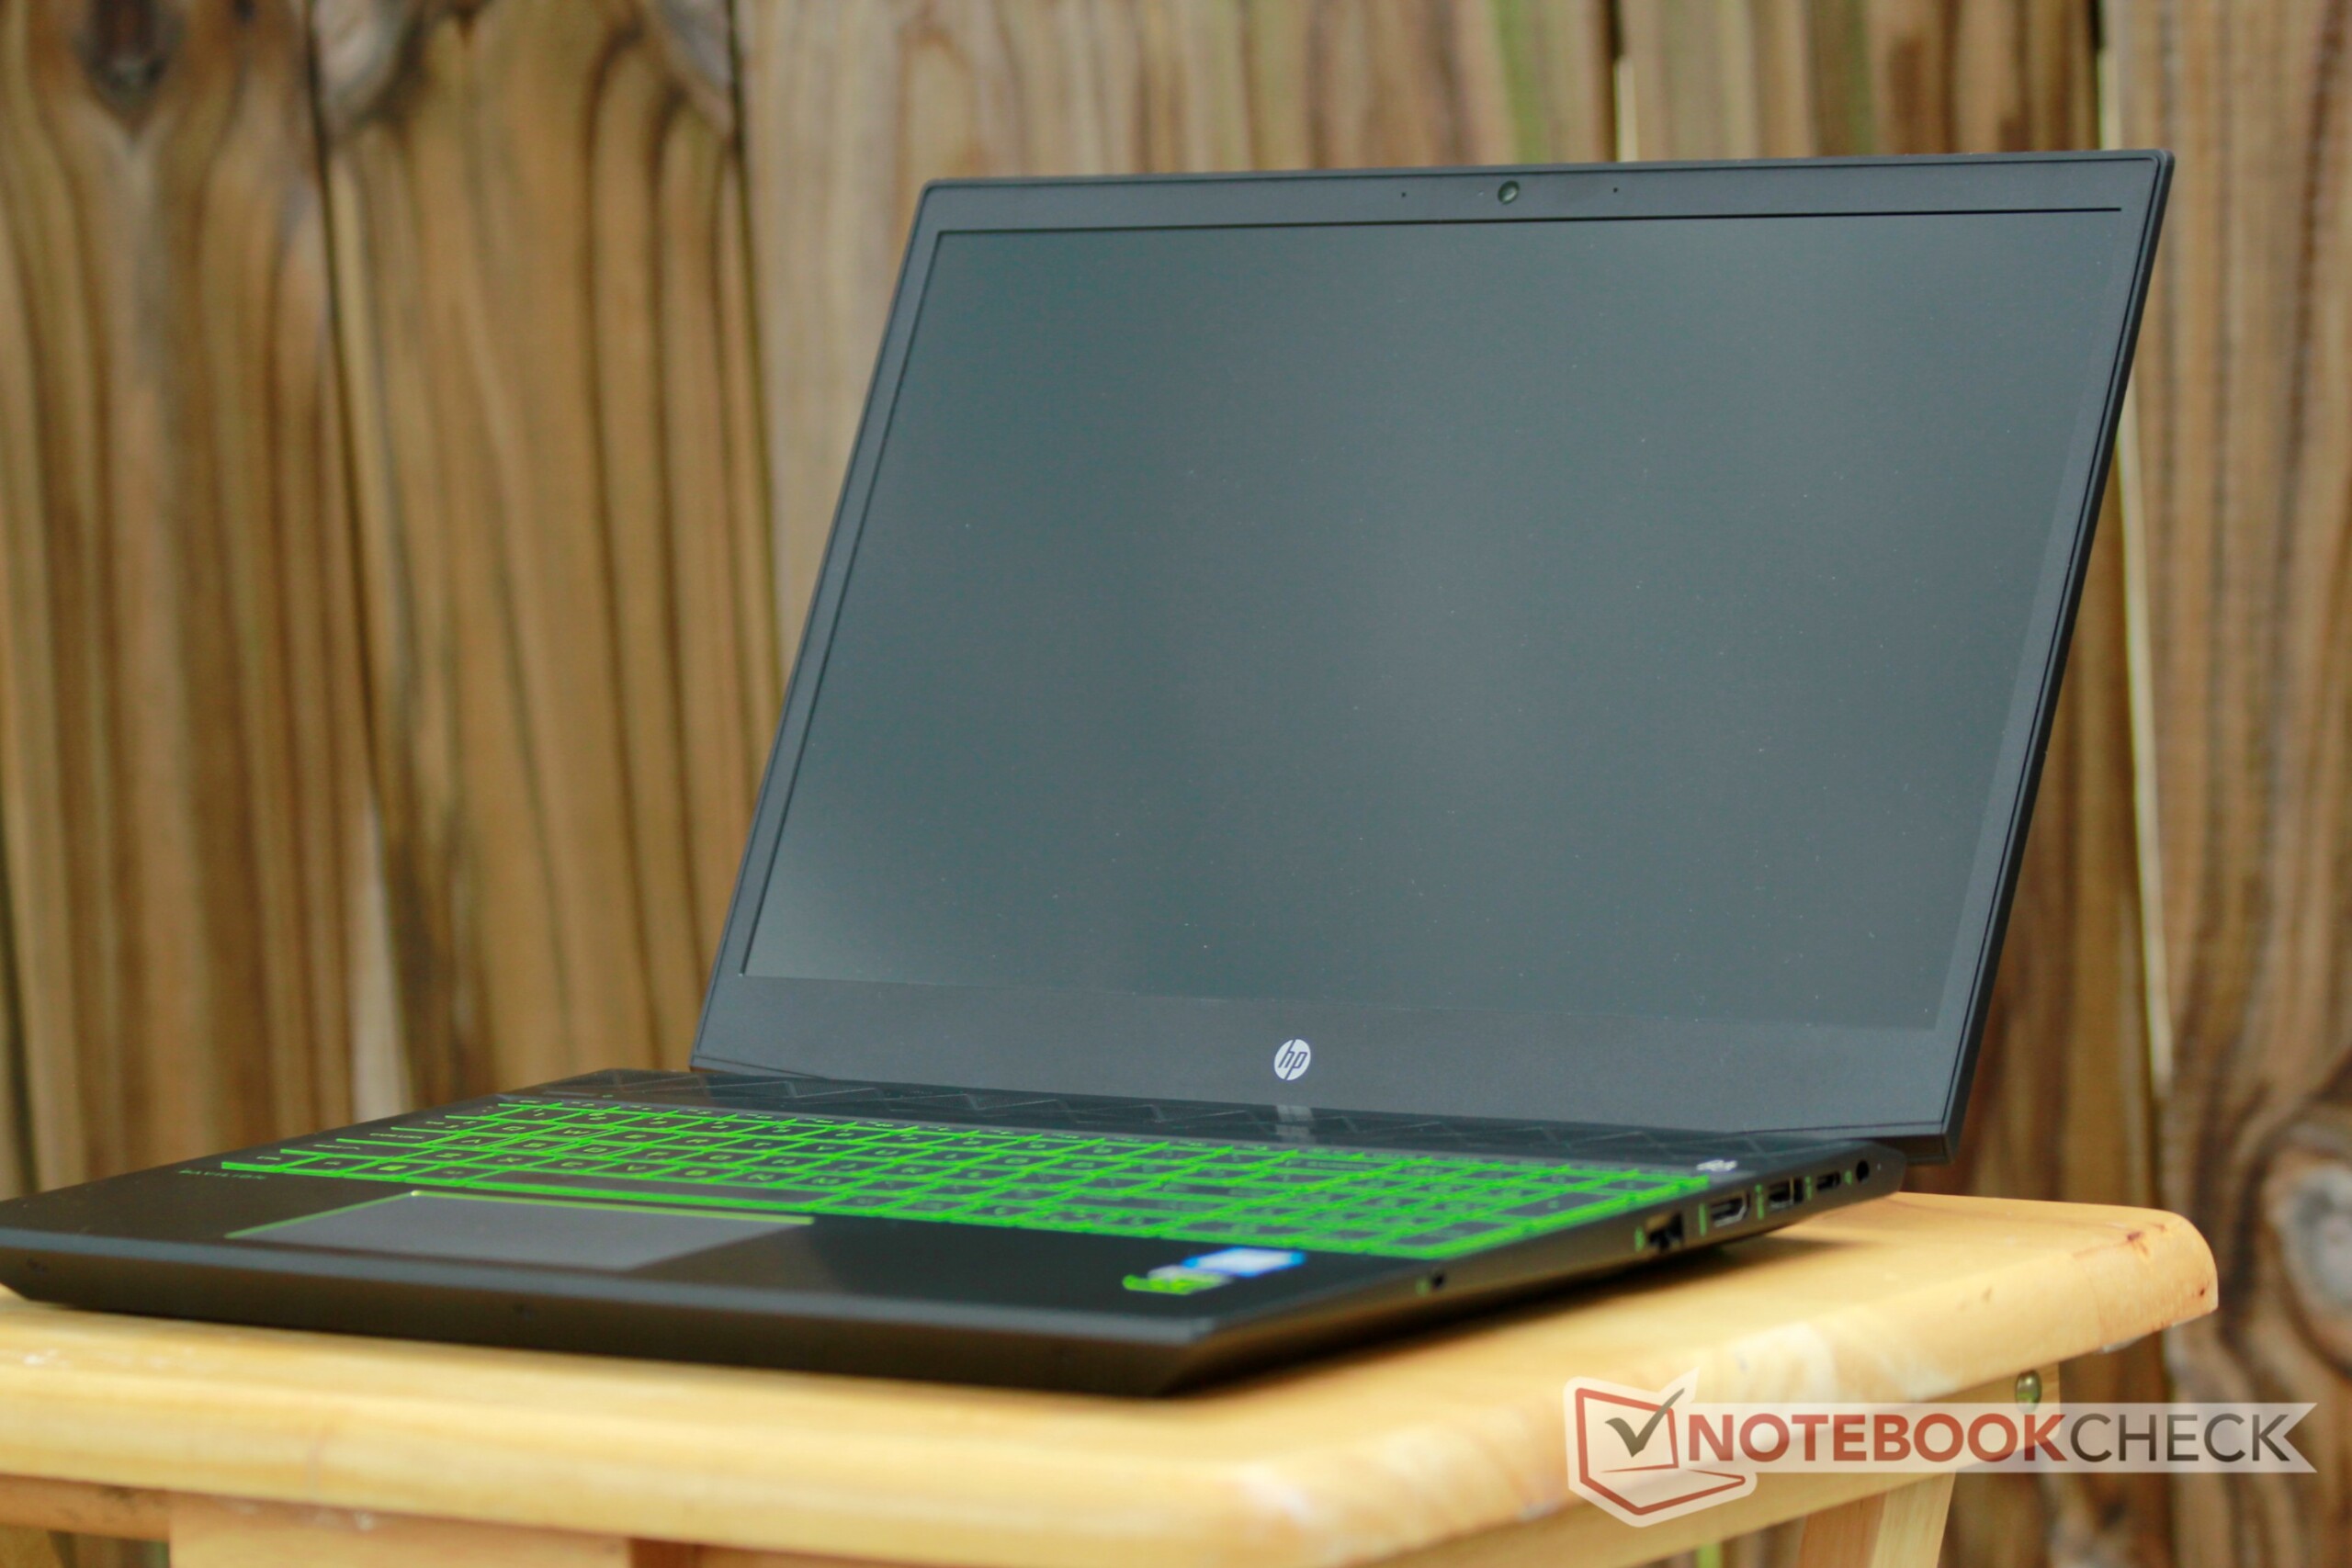
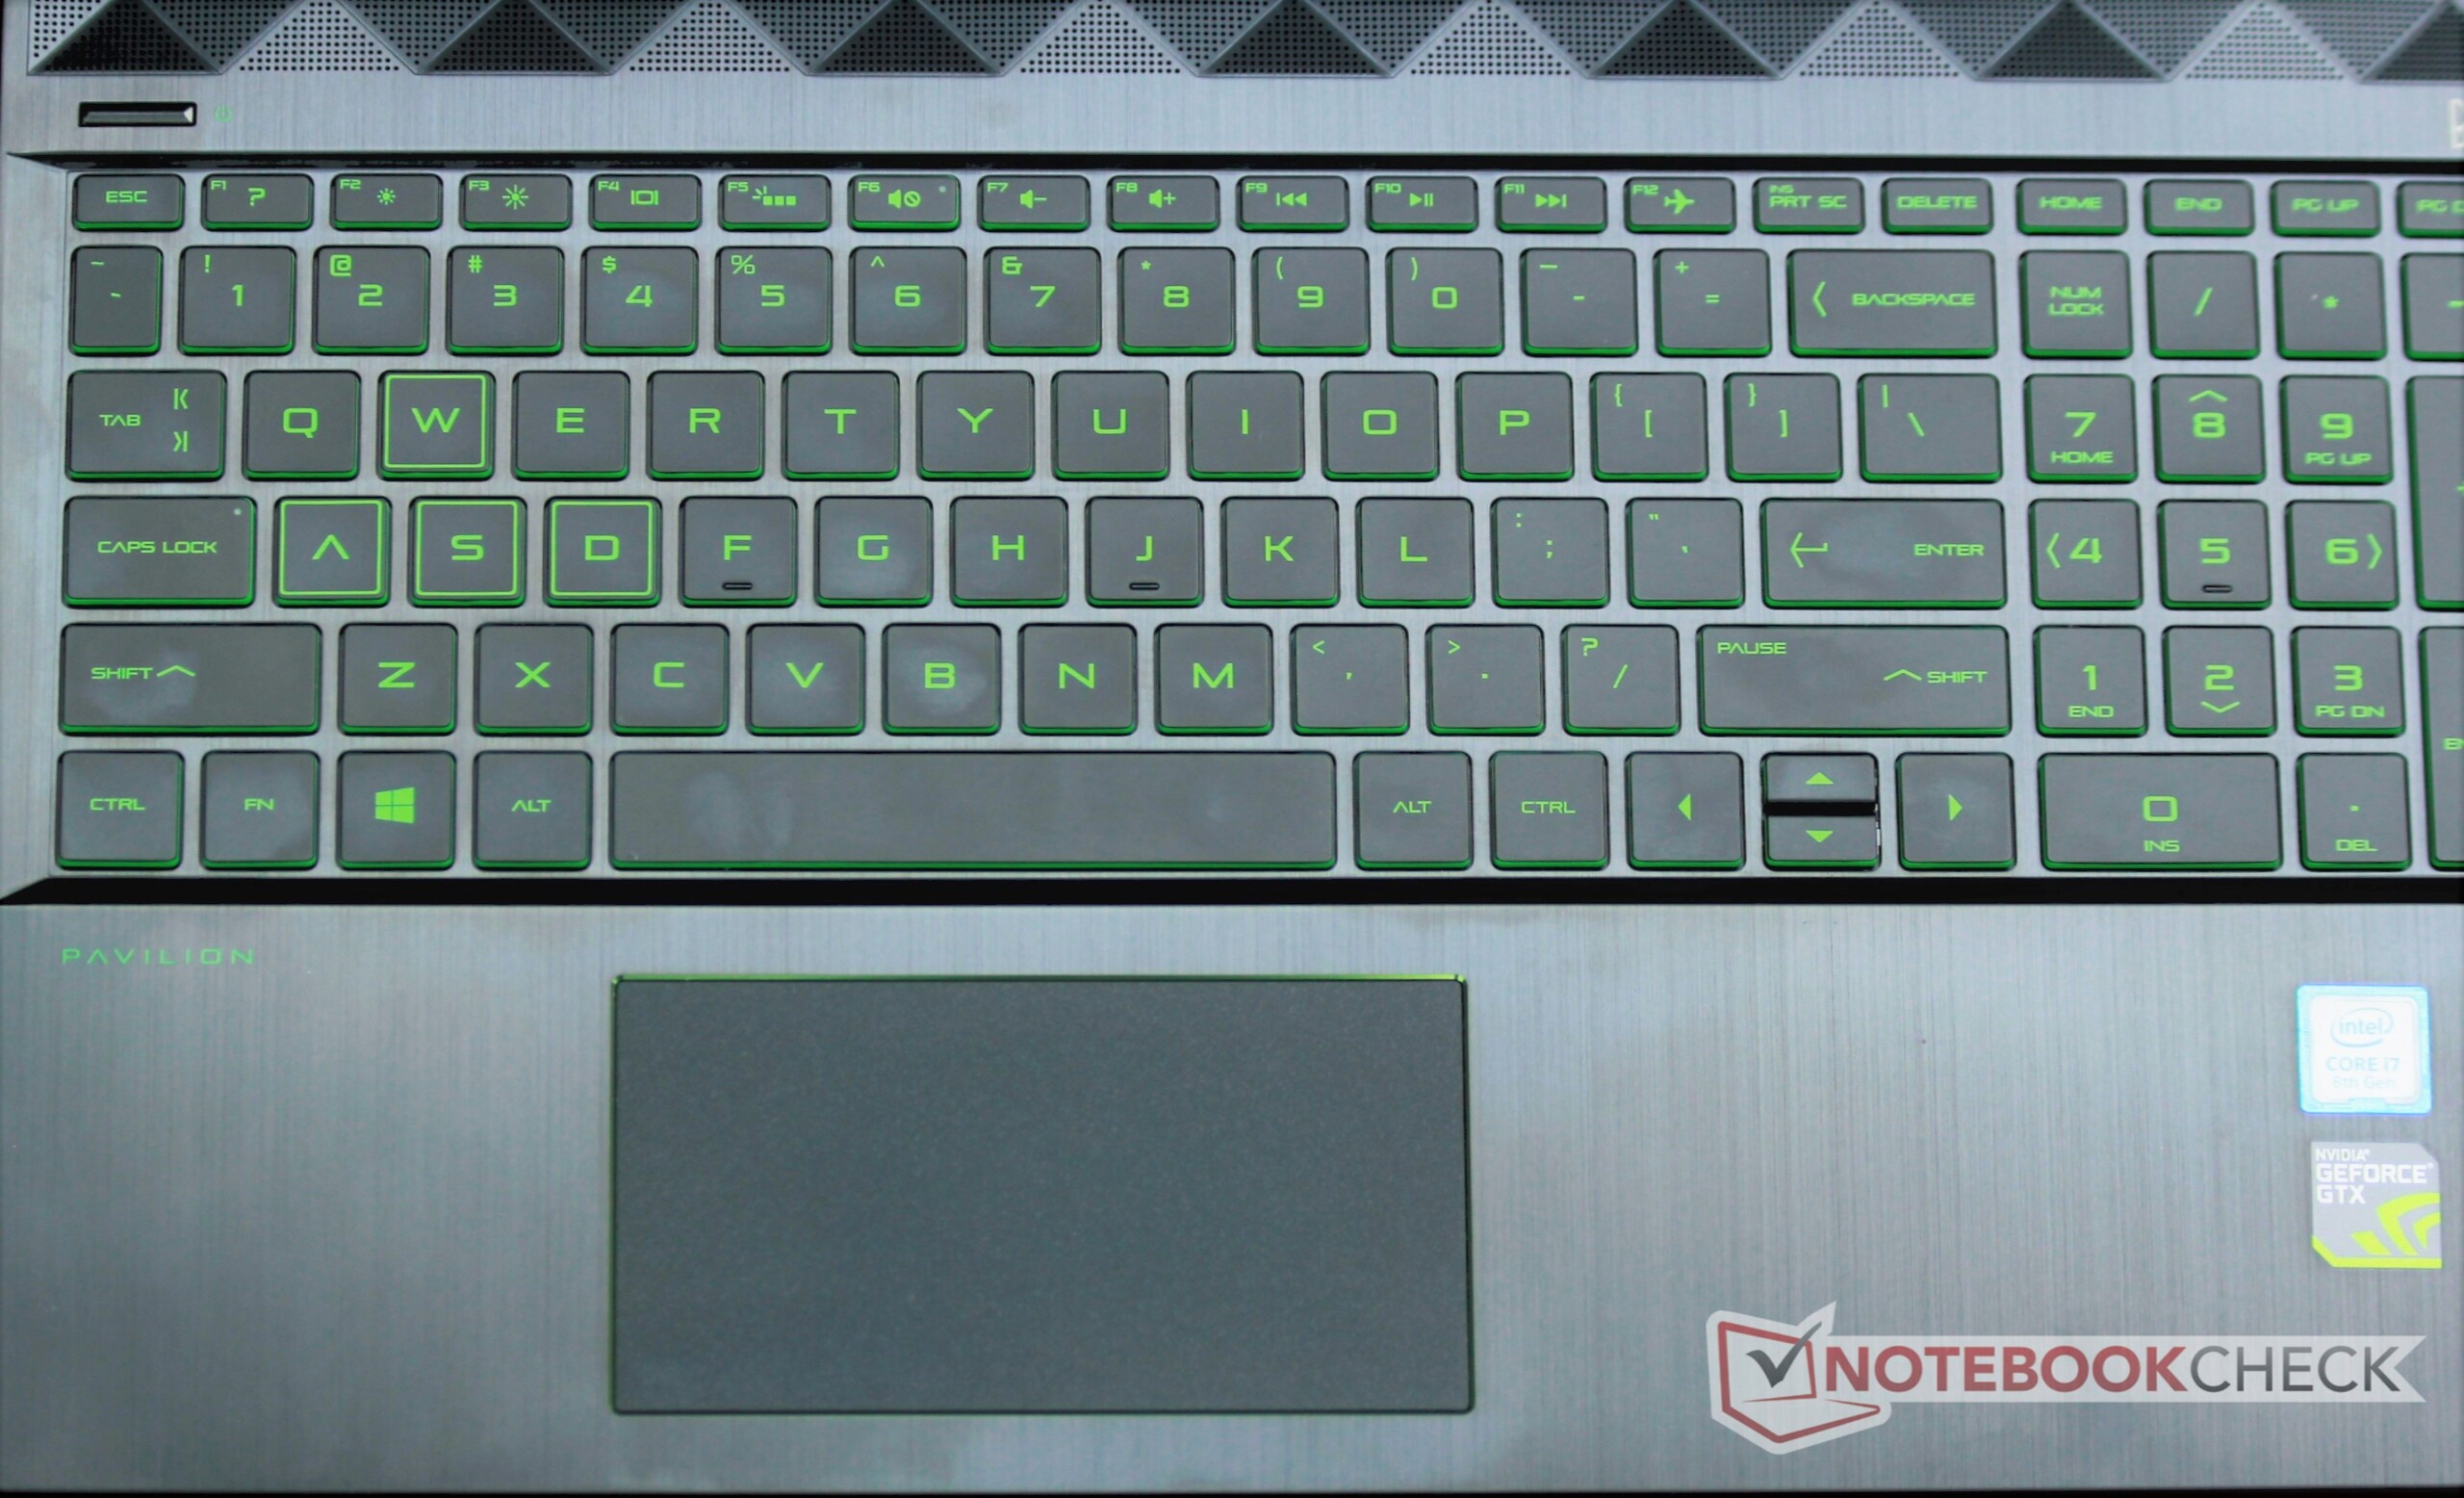
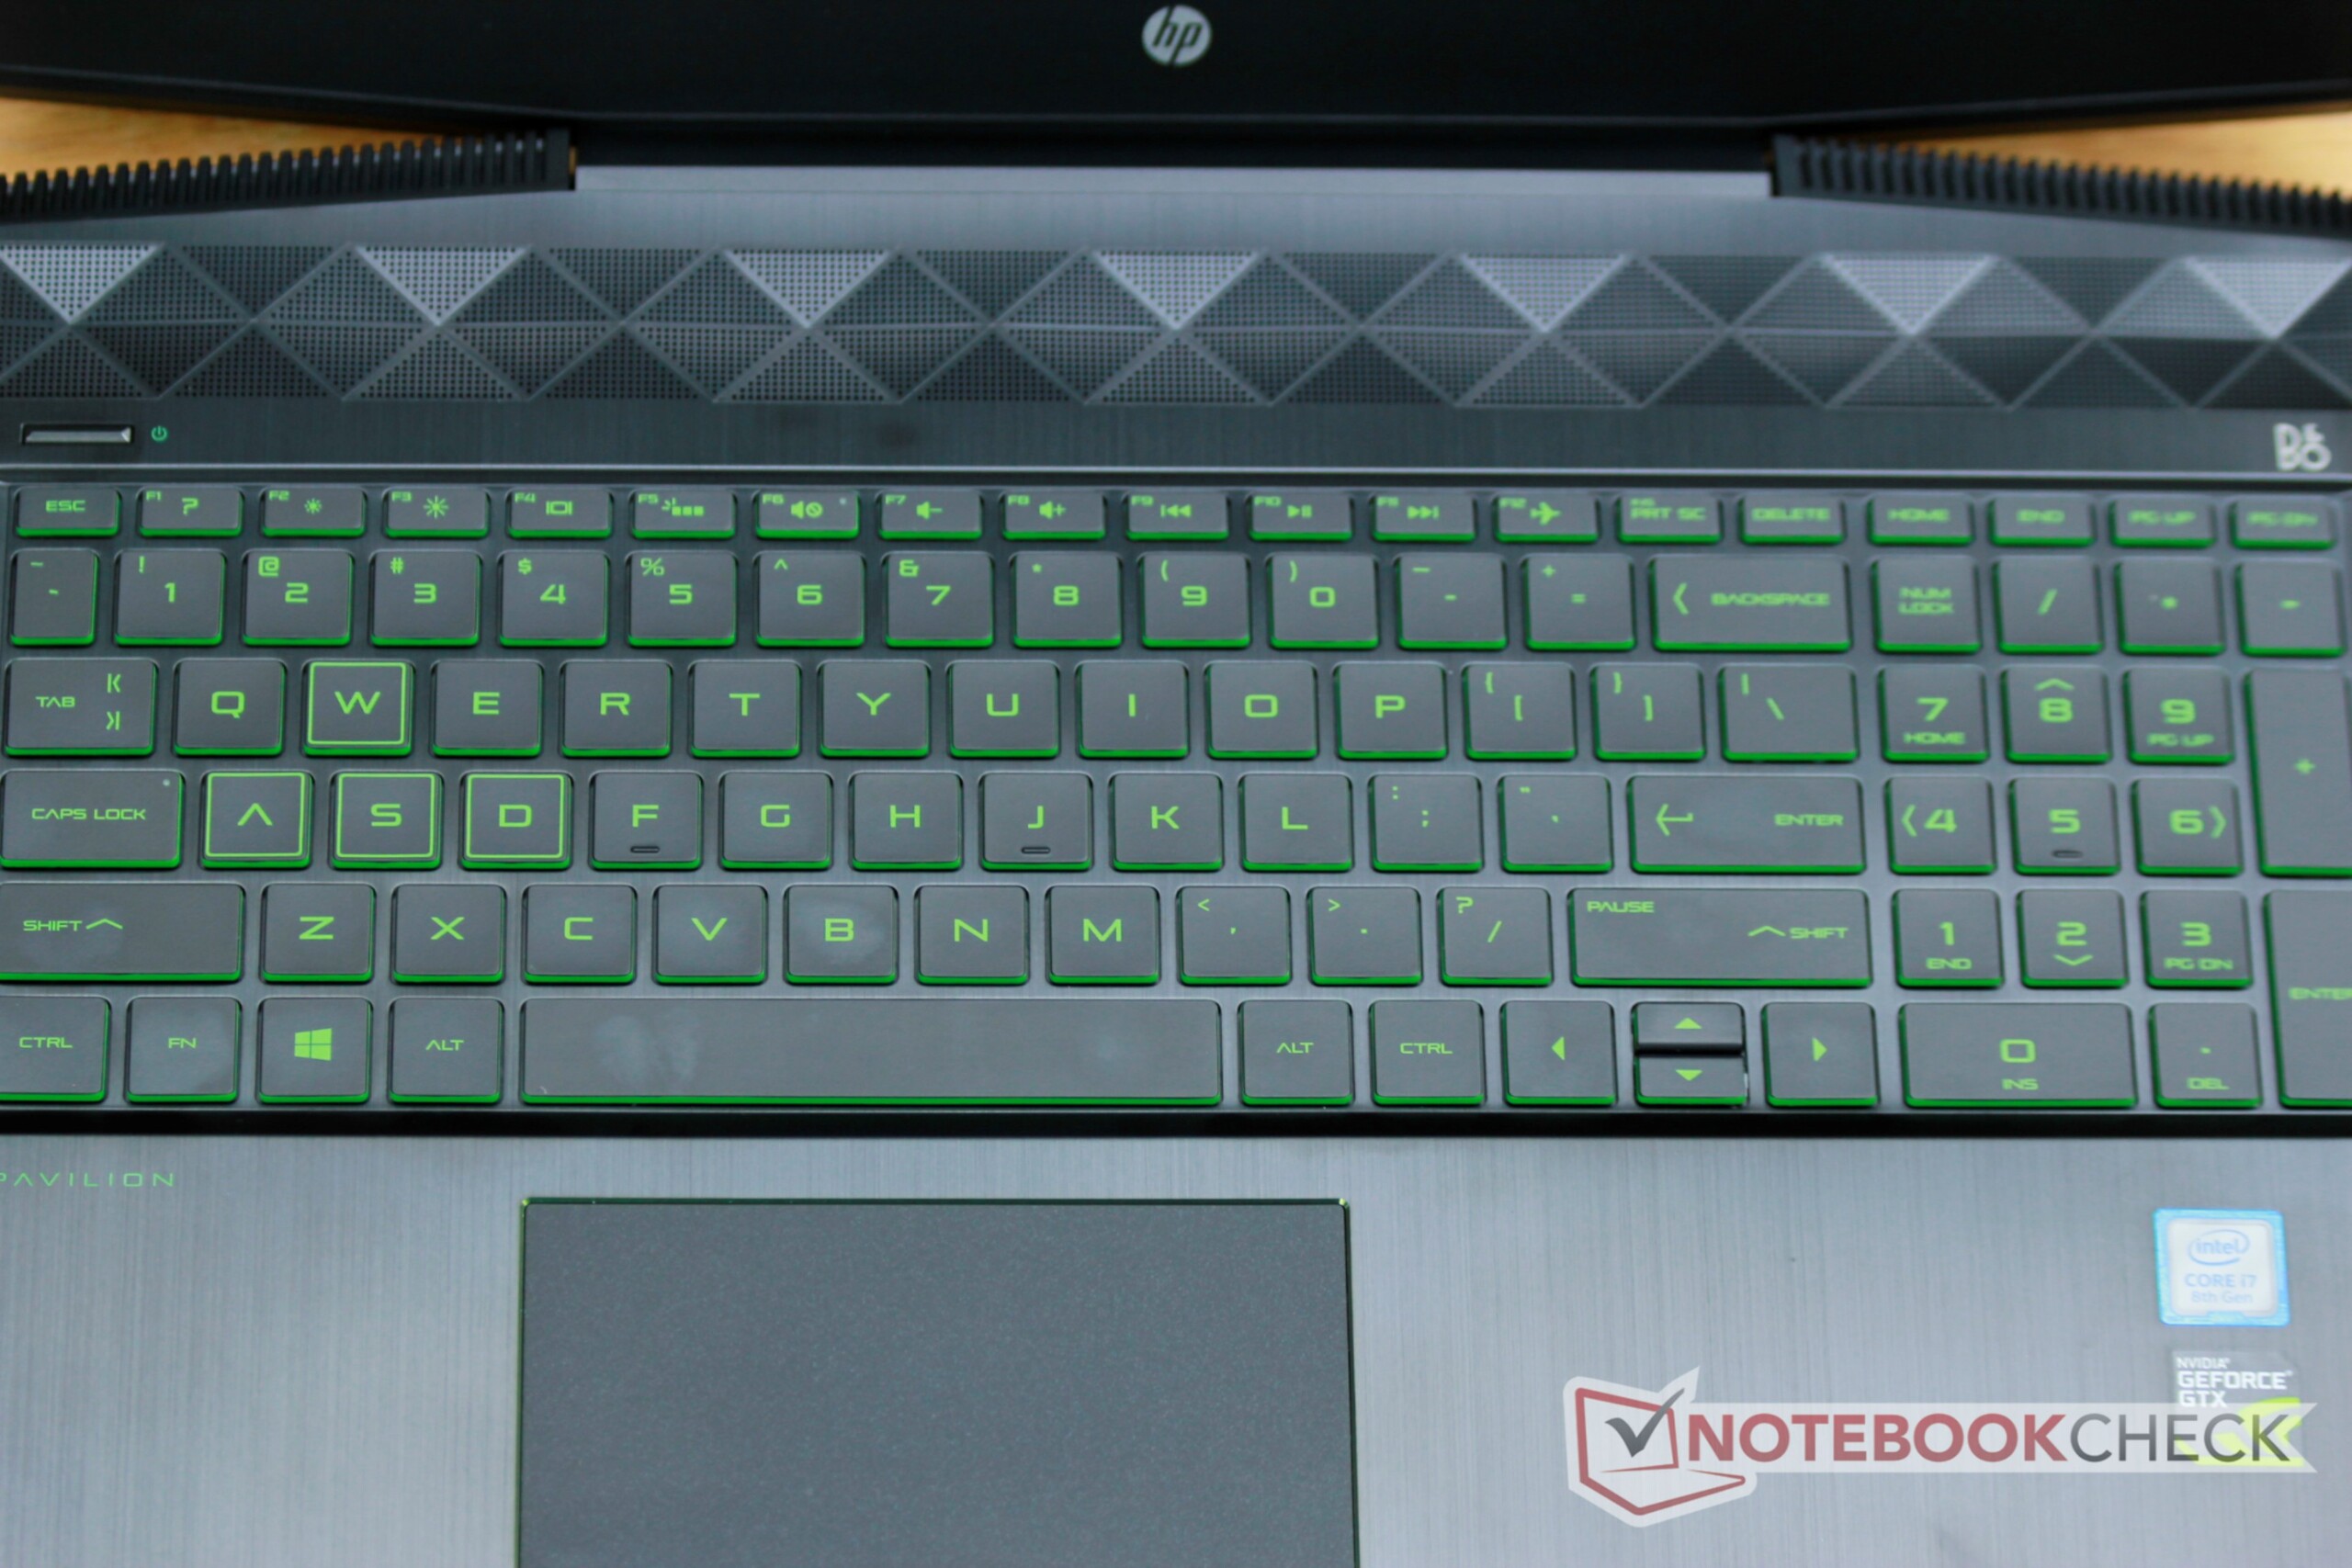
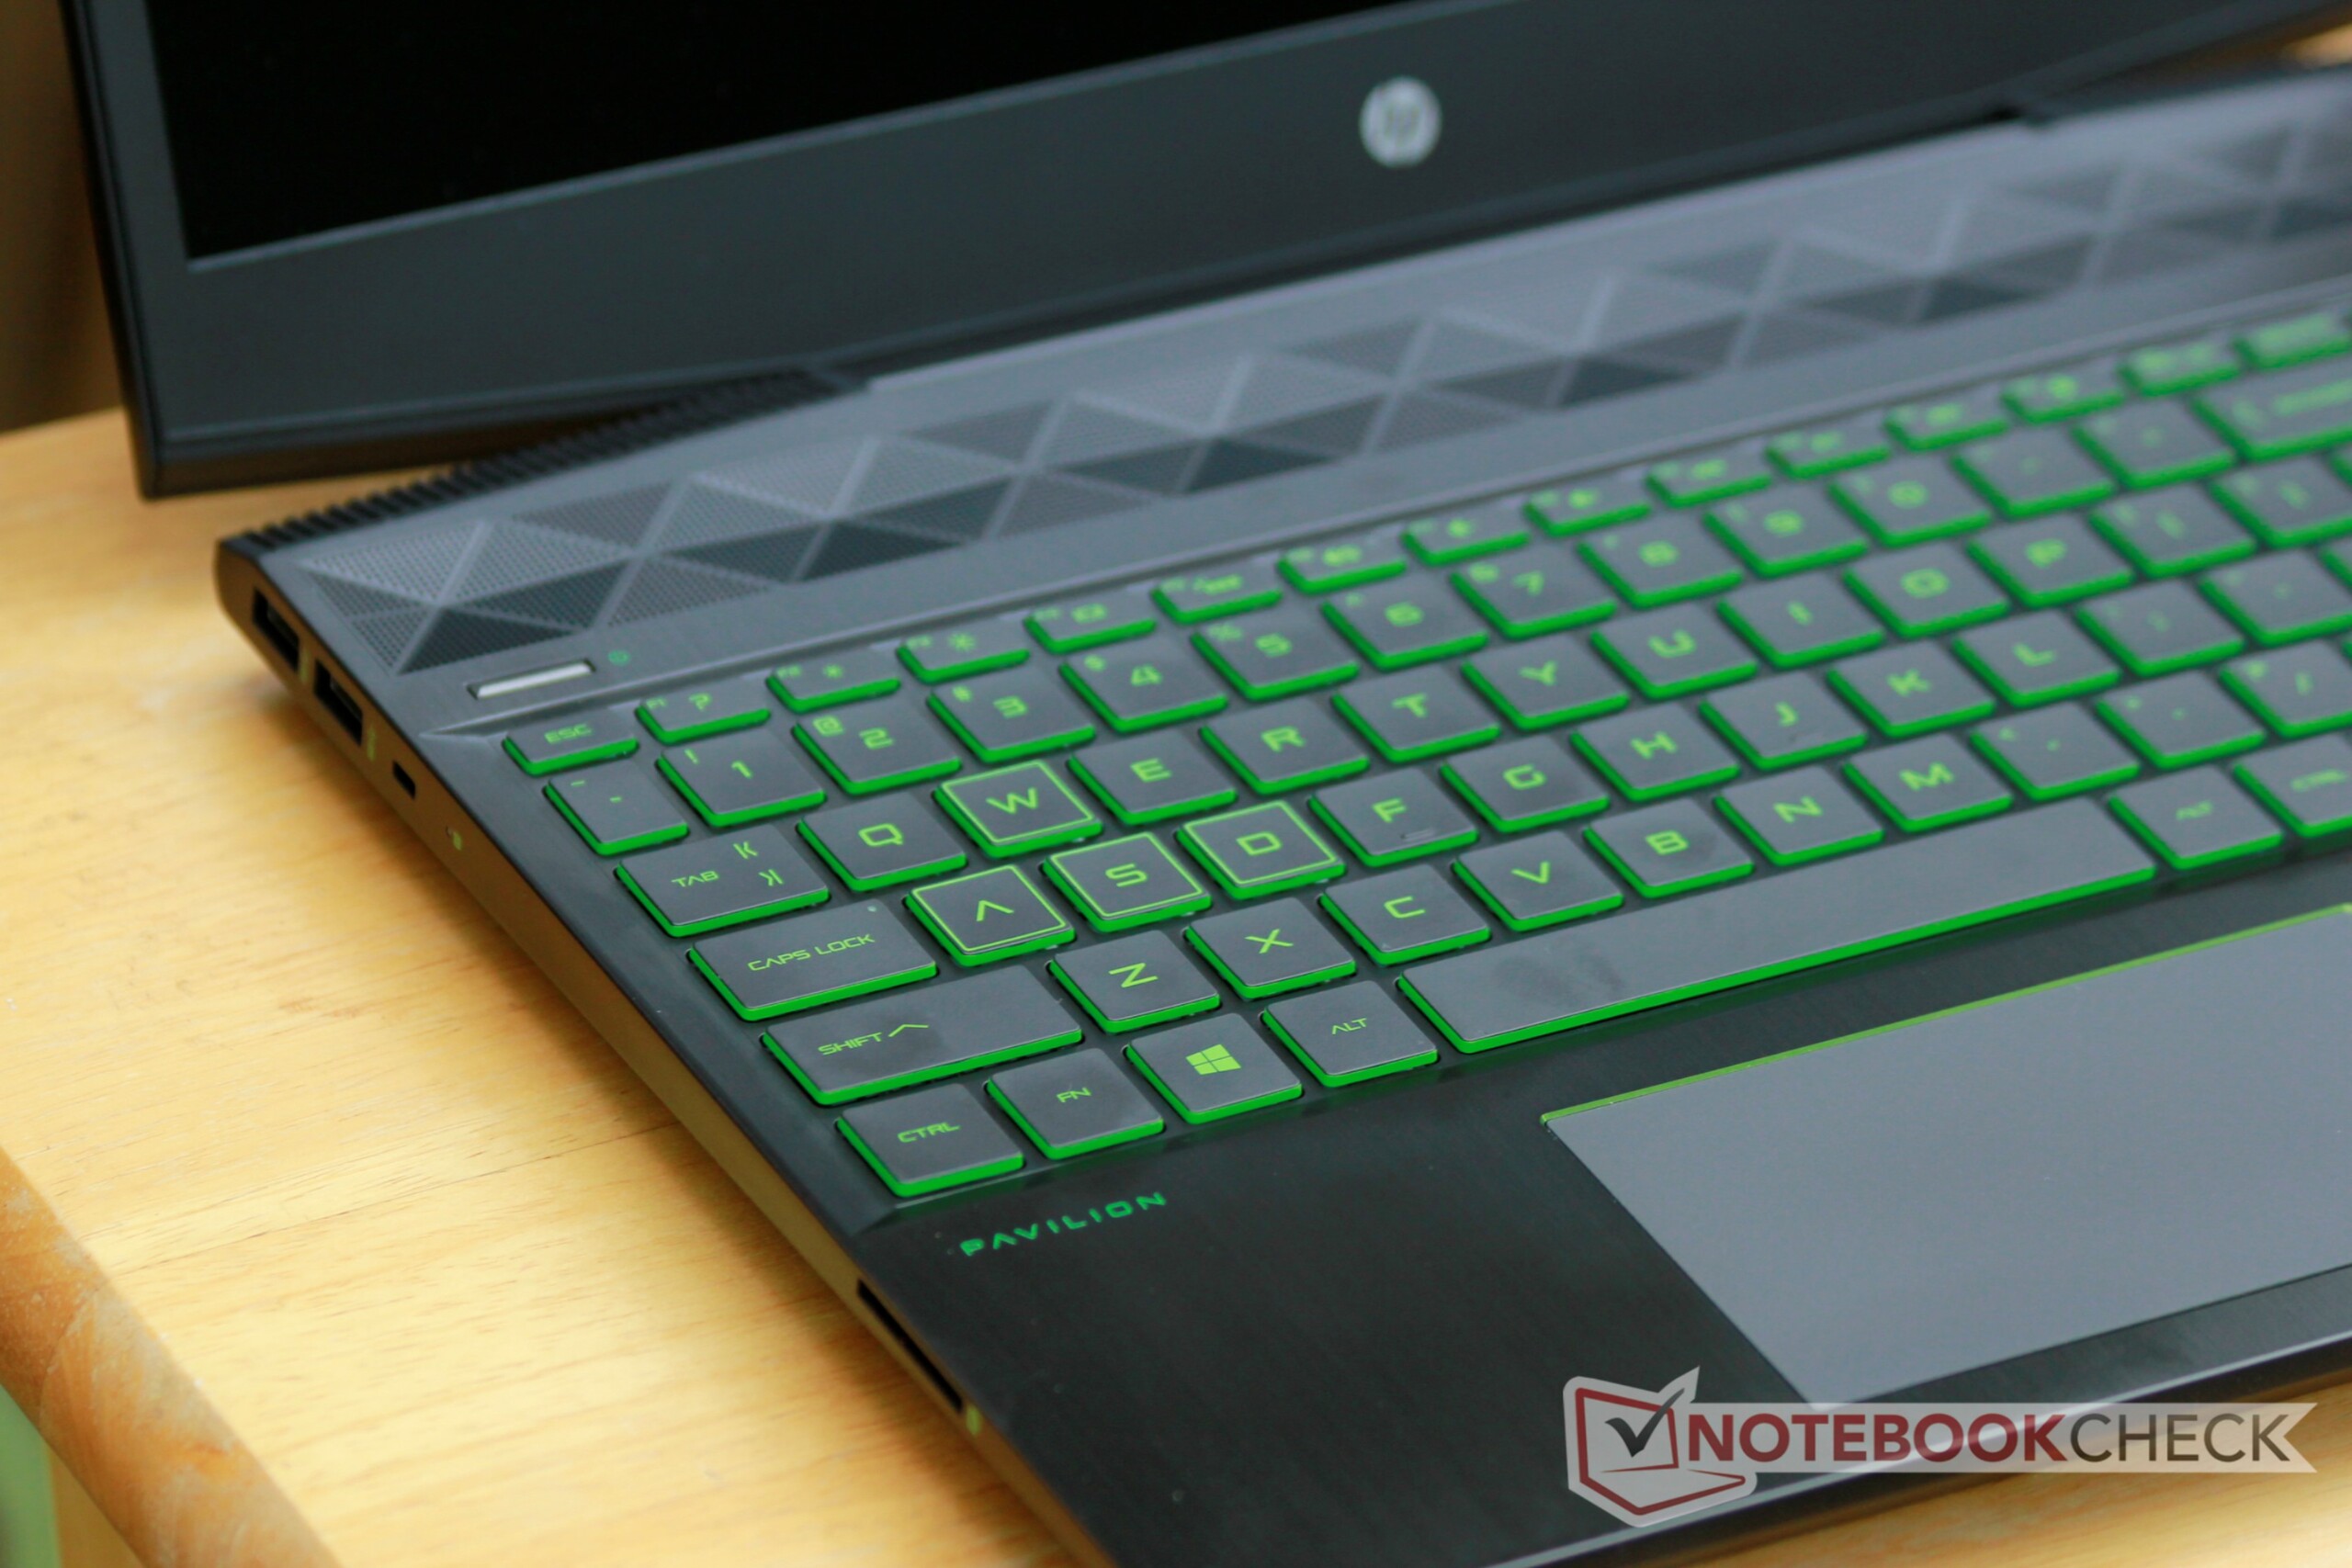
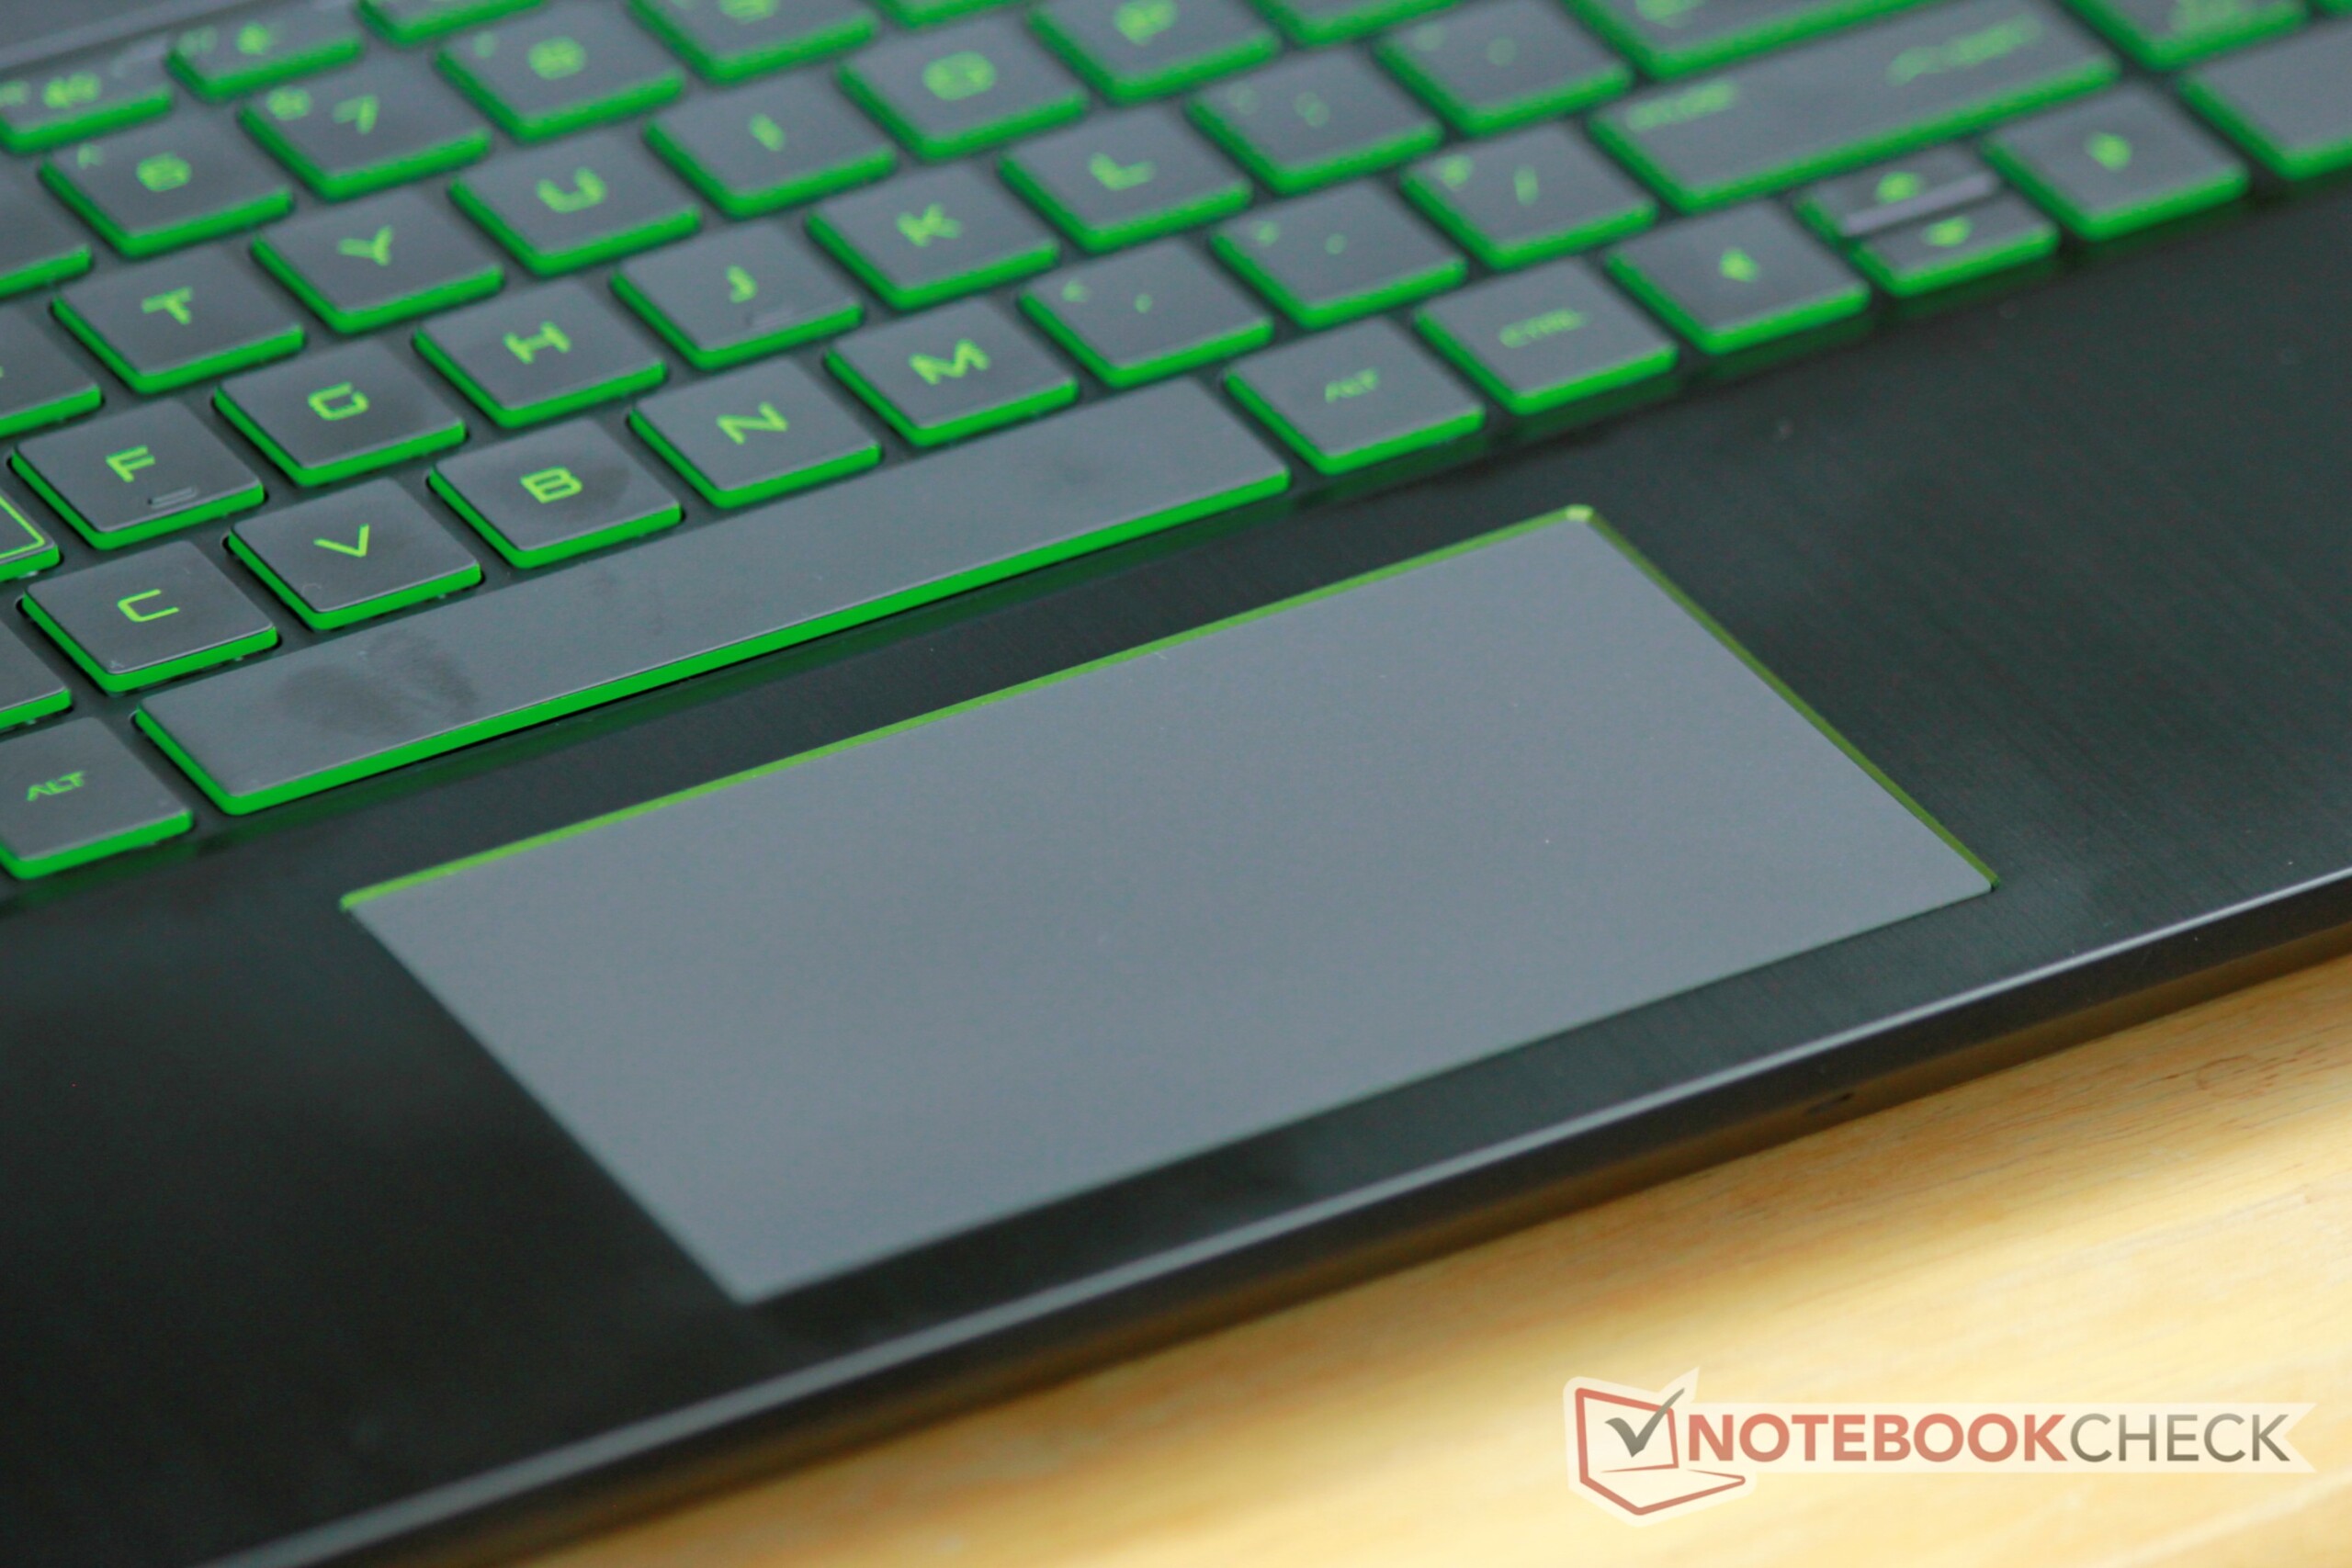
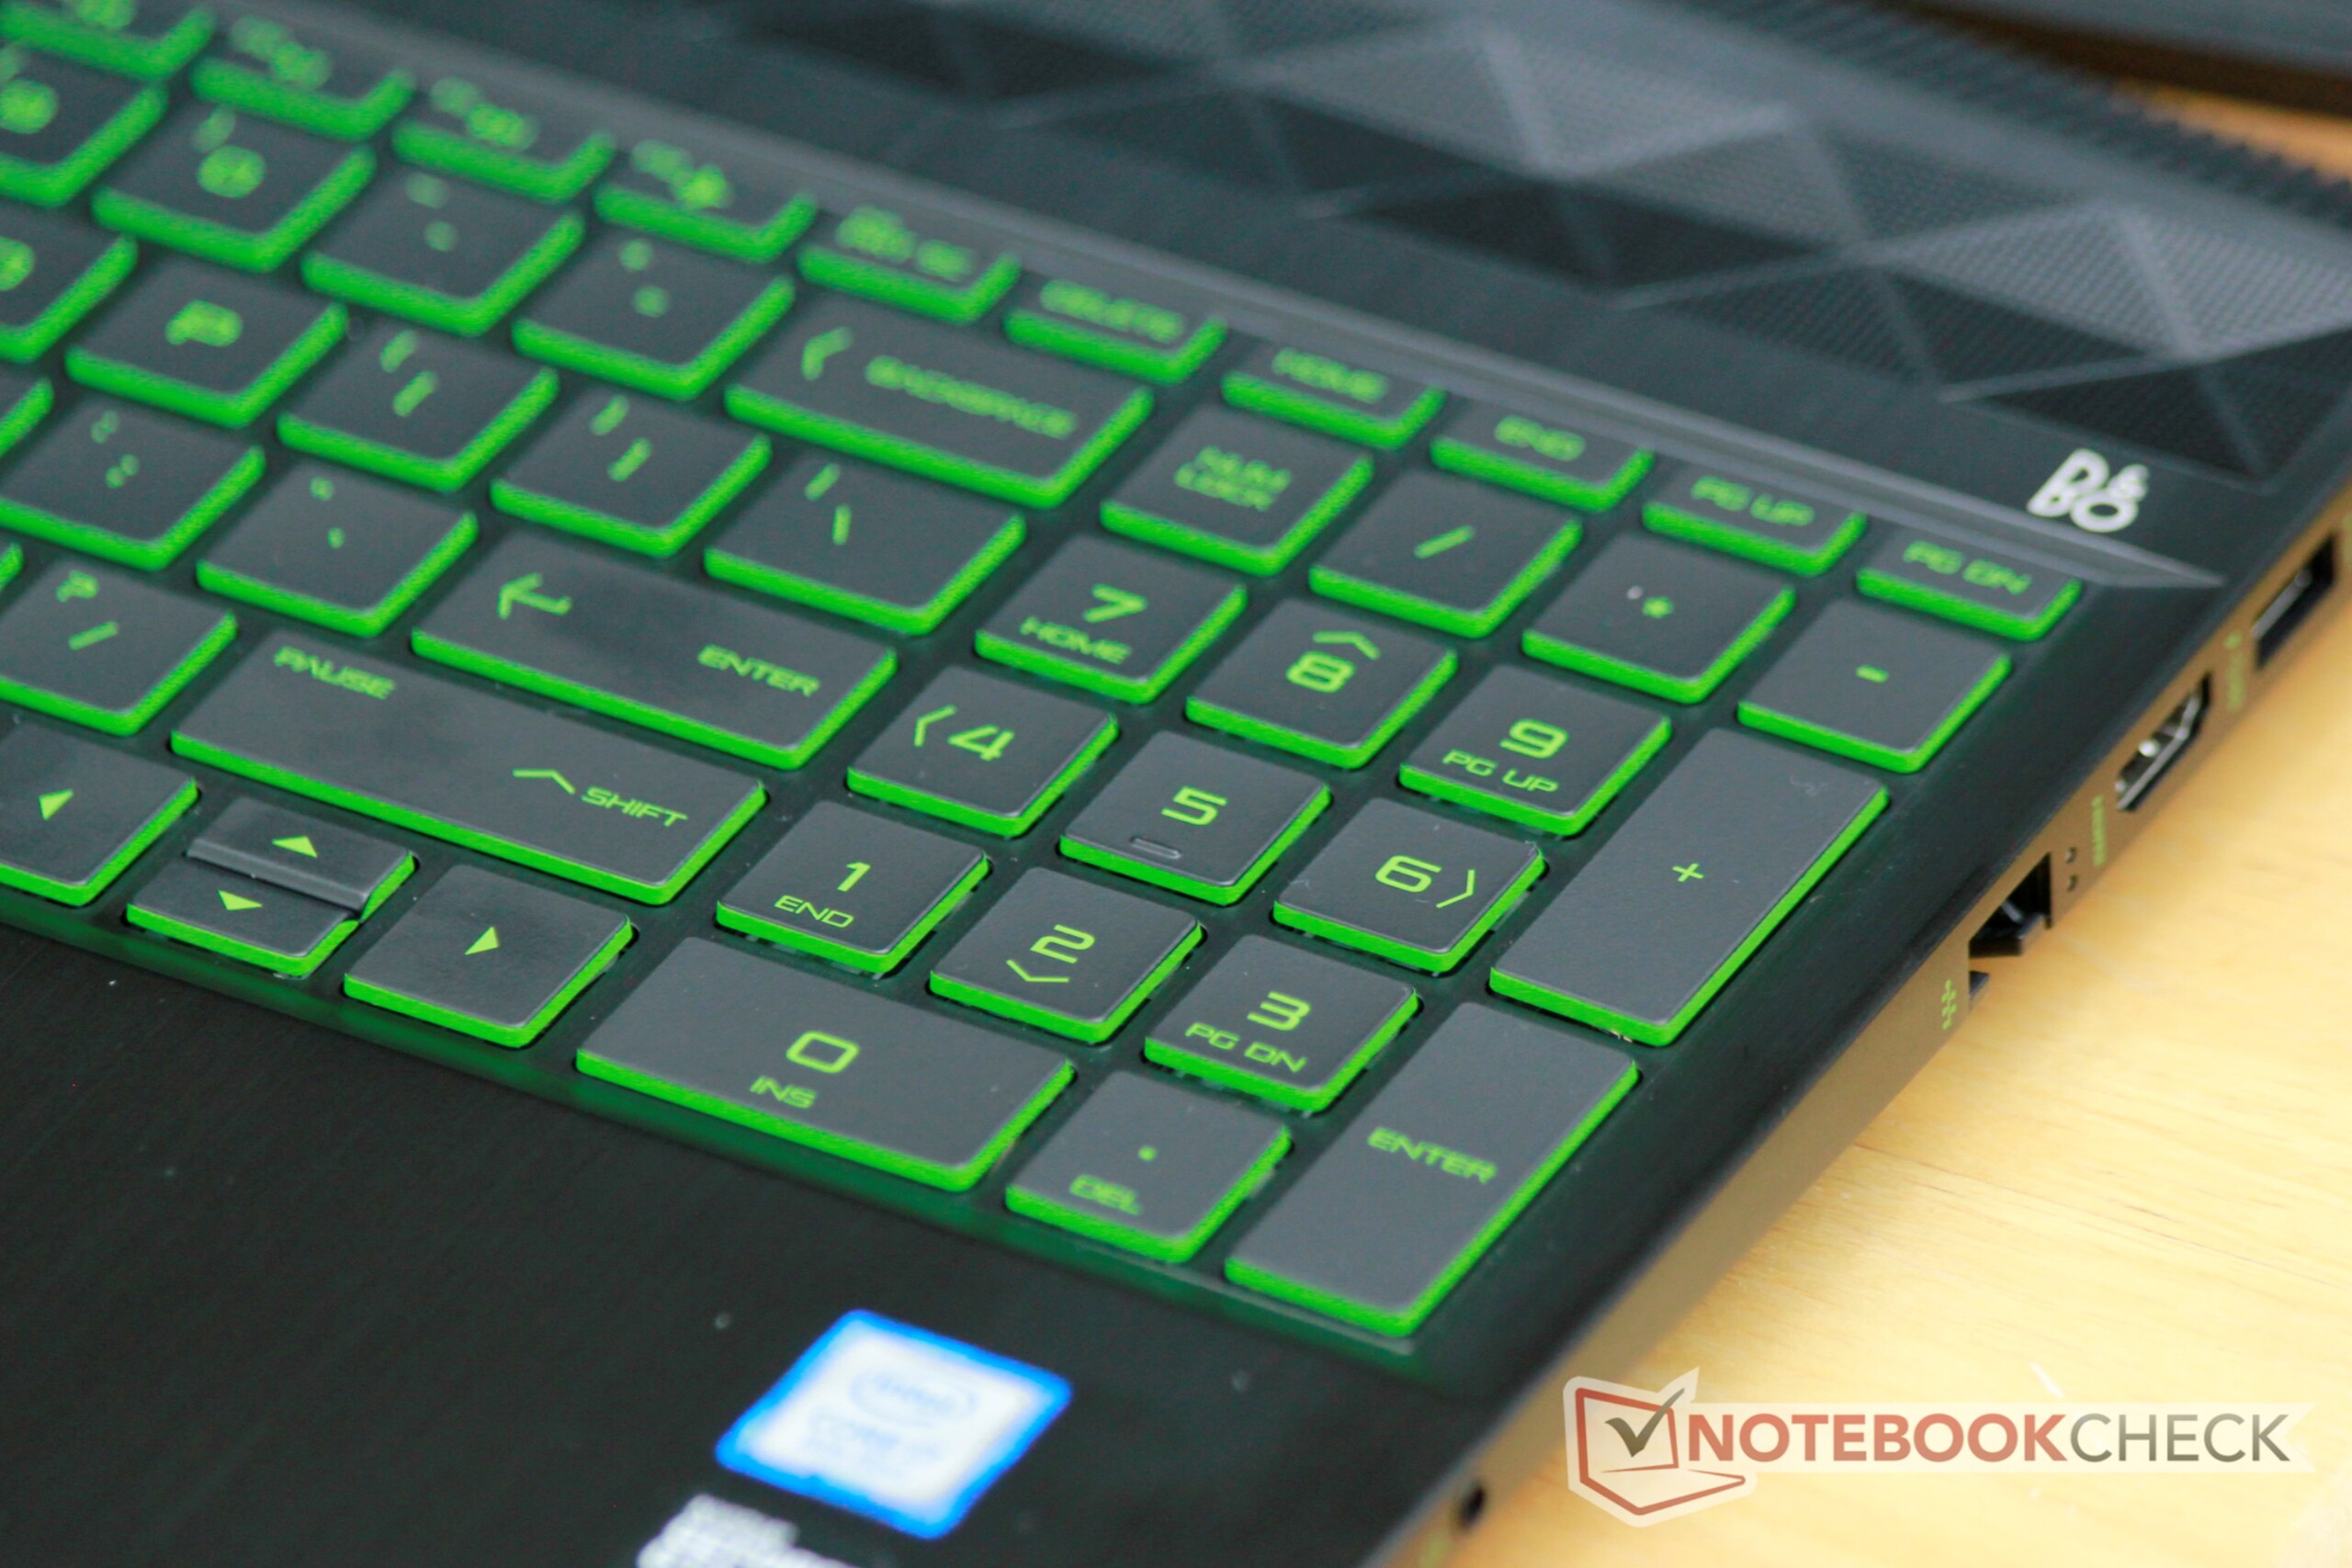
光影精灵的全高清IPS显示屏提供稳定的视角和良好的对比度。不过在此价格范围内,这块屏幕的亮度太低。它的续航时间类似于一般游戏笔记本,尽管一些竞争对手可以提供更长续航。键盘对于游戏笔记本来说非常好。
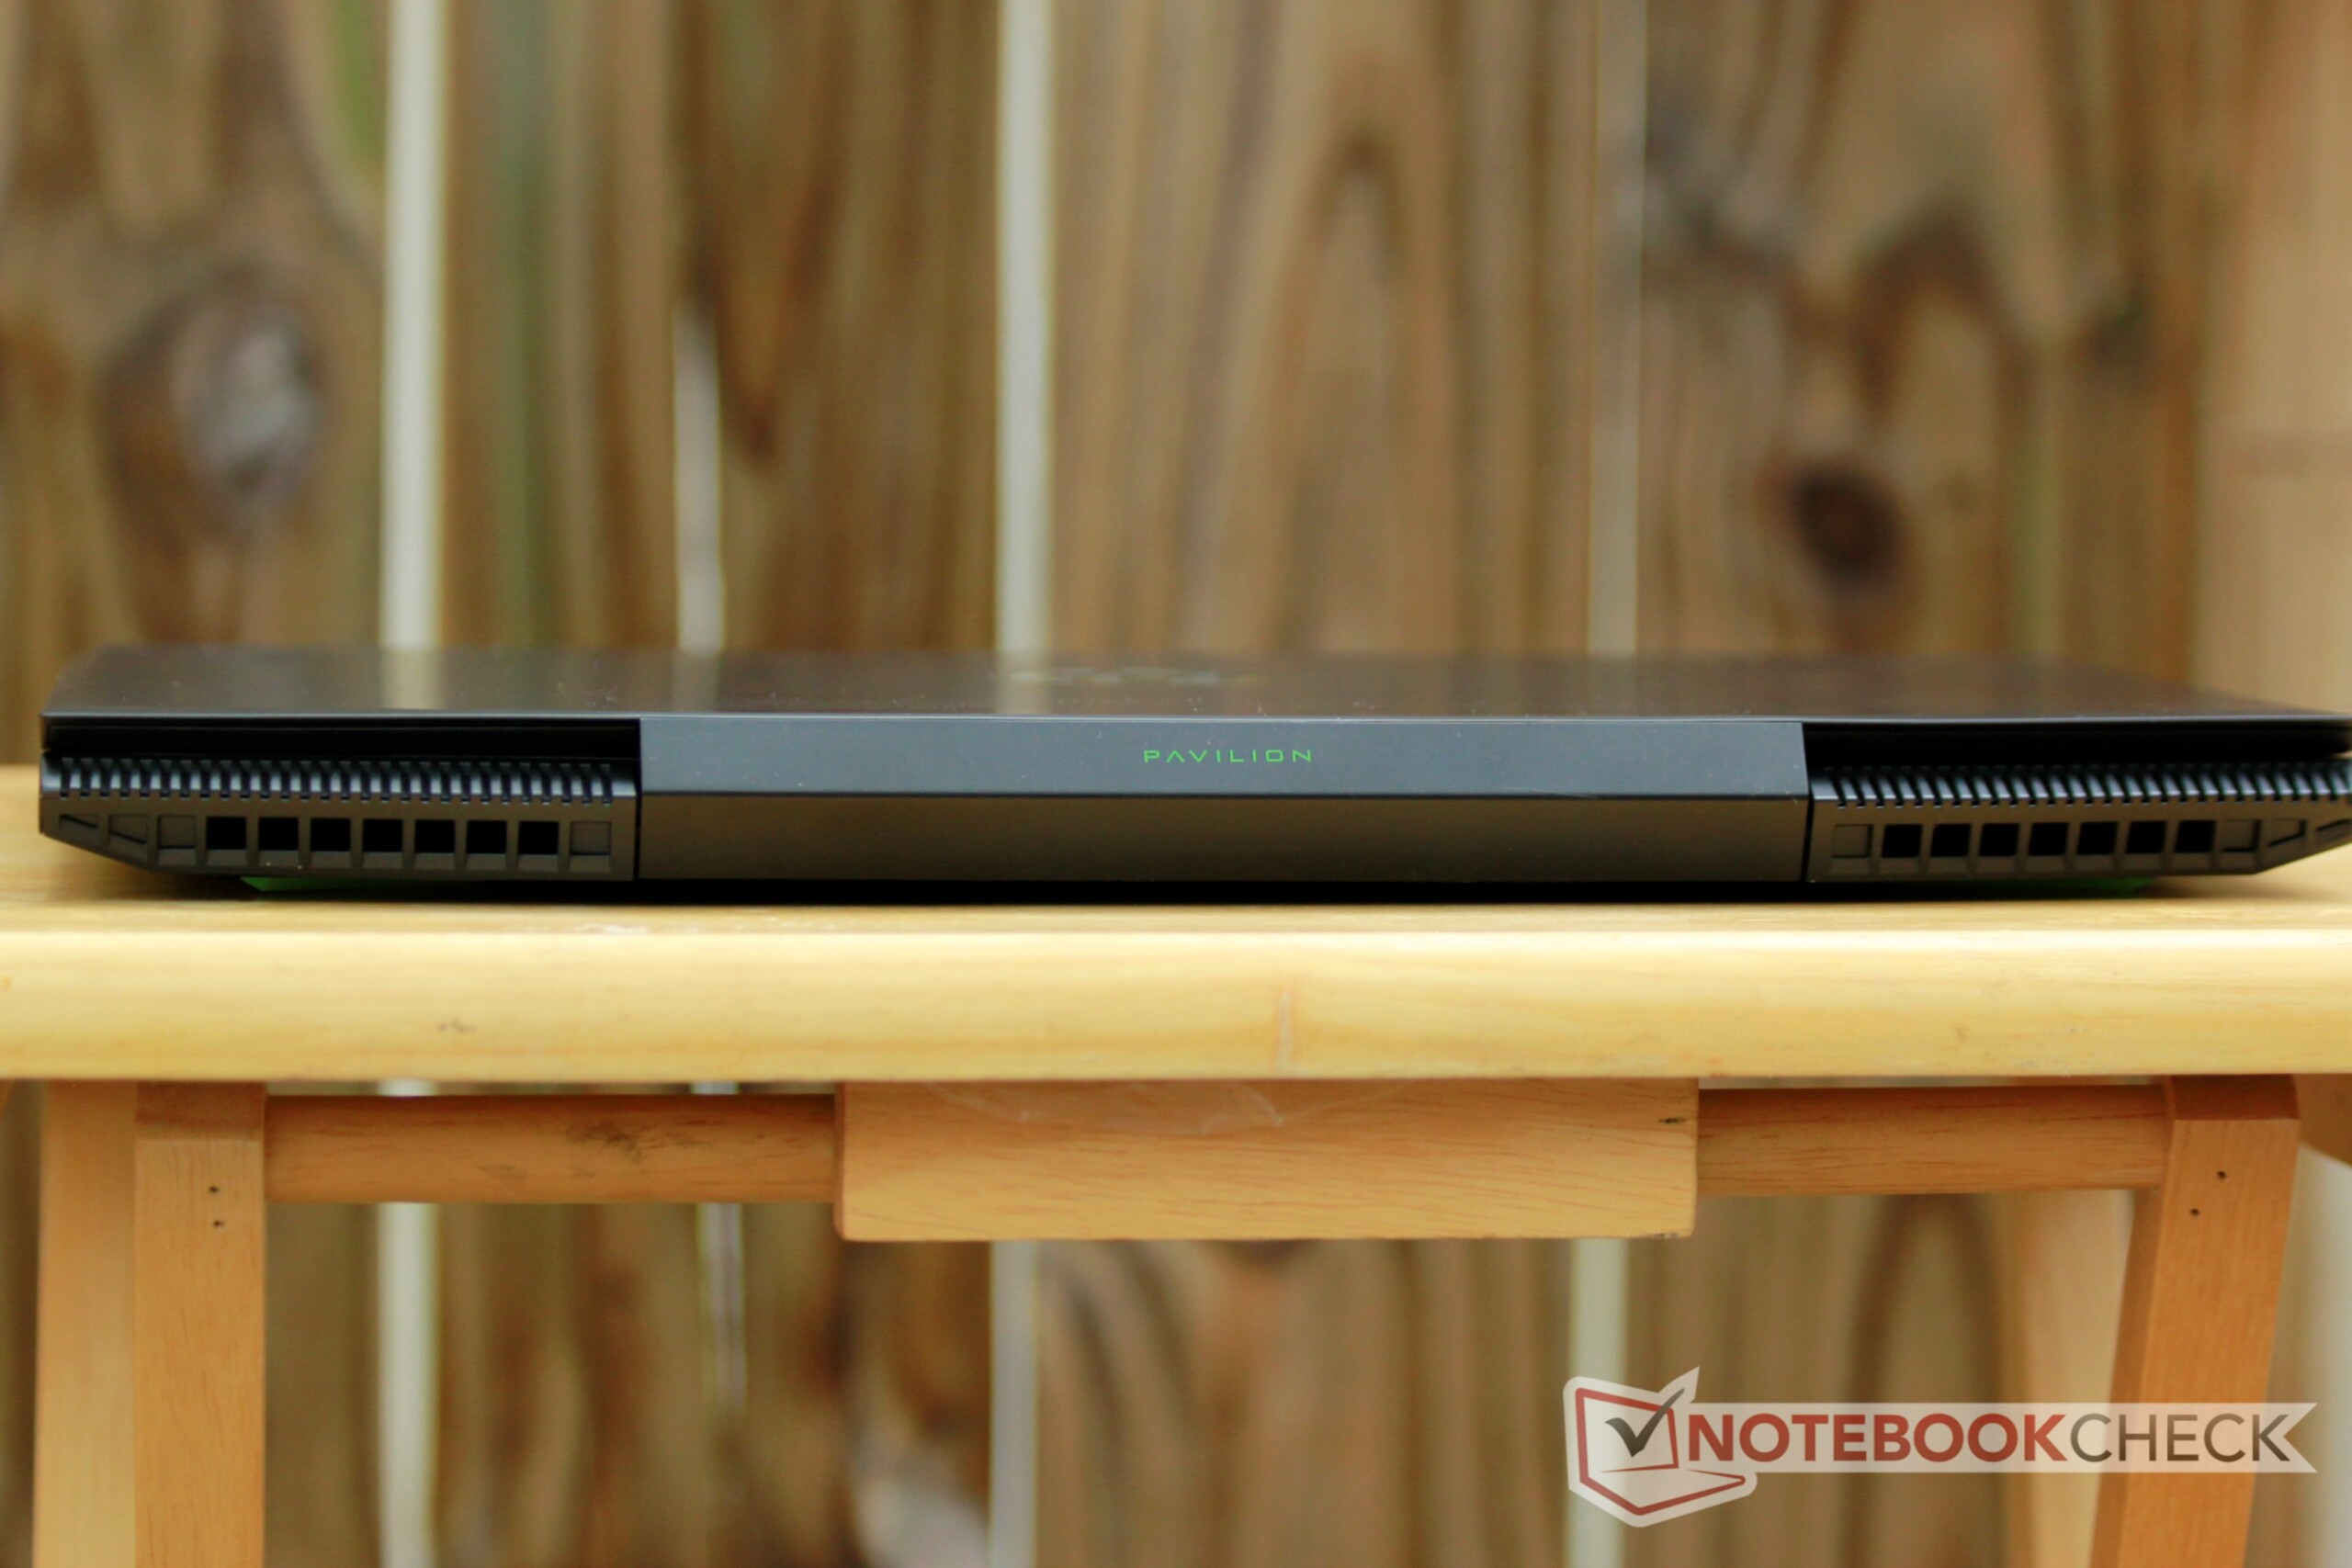
“惠普已经创建了一系列位于暗影精灵系列之下的游戏本。 这些设备以相对较低的价格提供尽可能多的游戏性能。虽然这台电脑实现了这一目标,但它并没有给人以激情。”
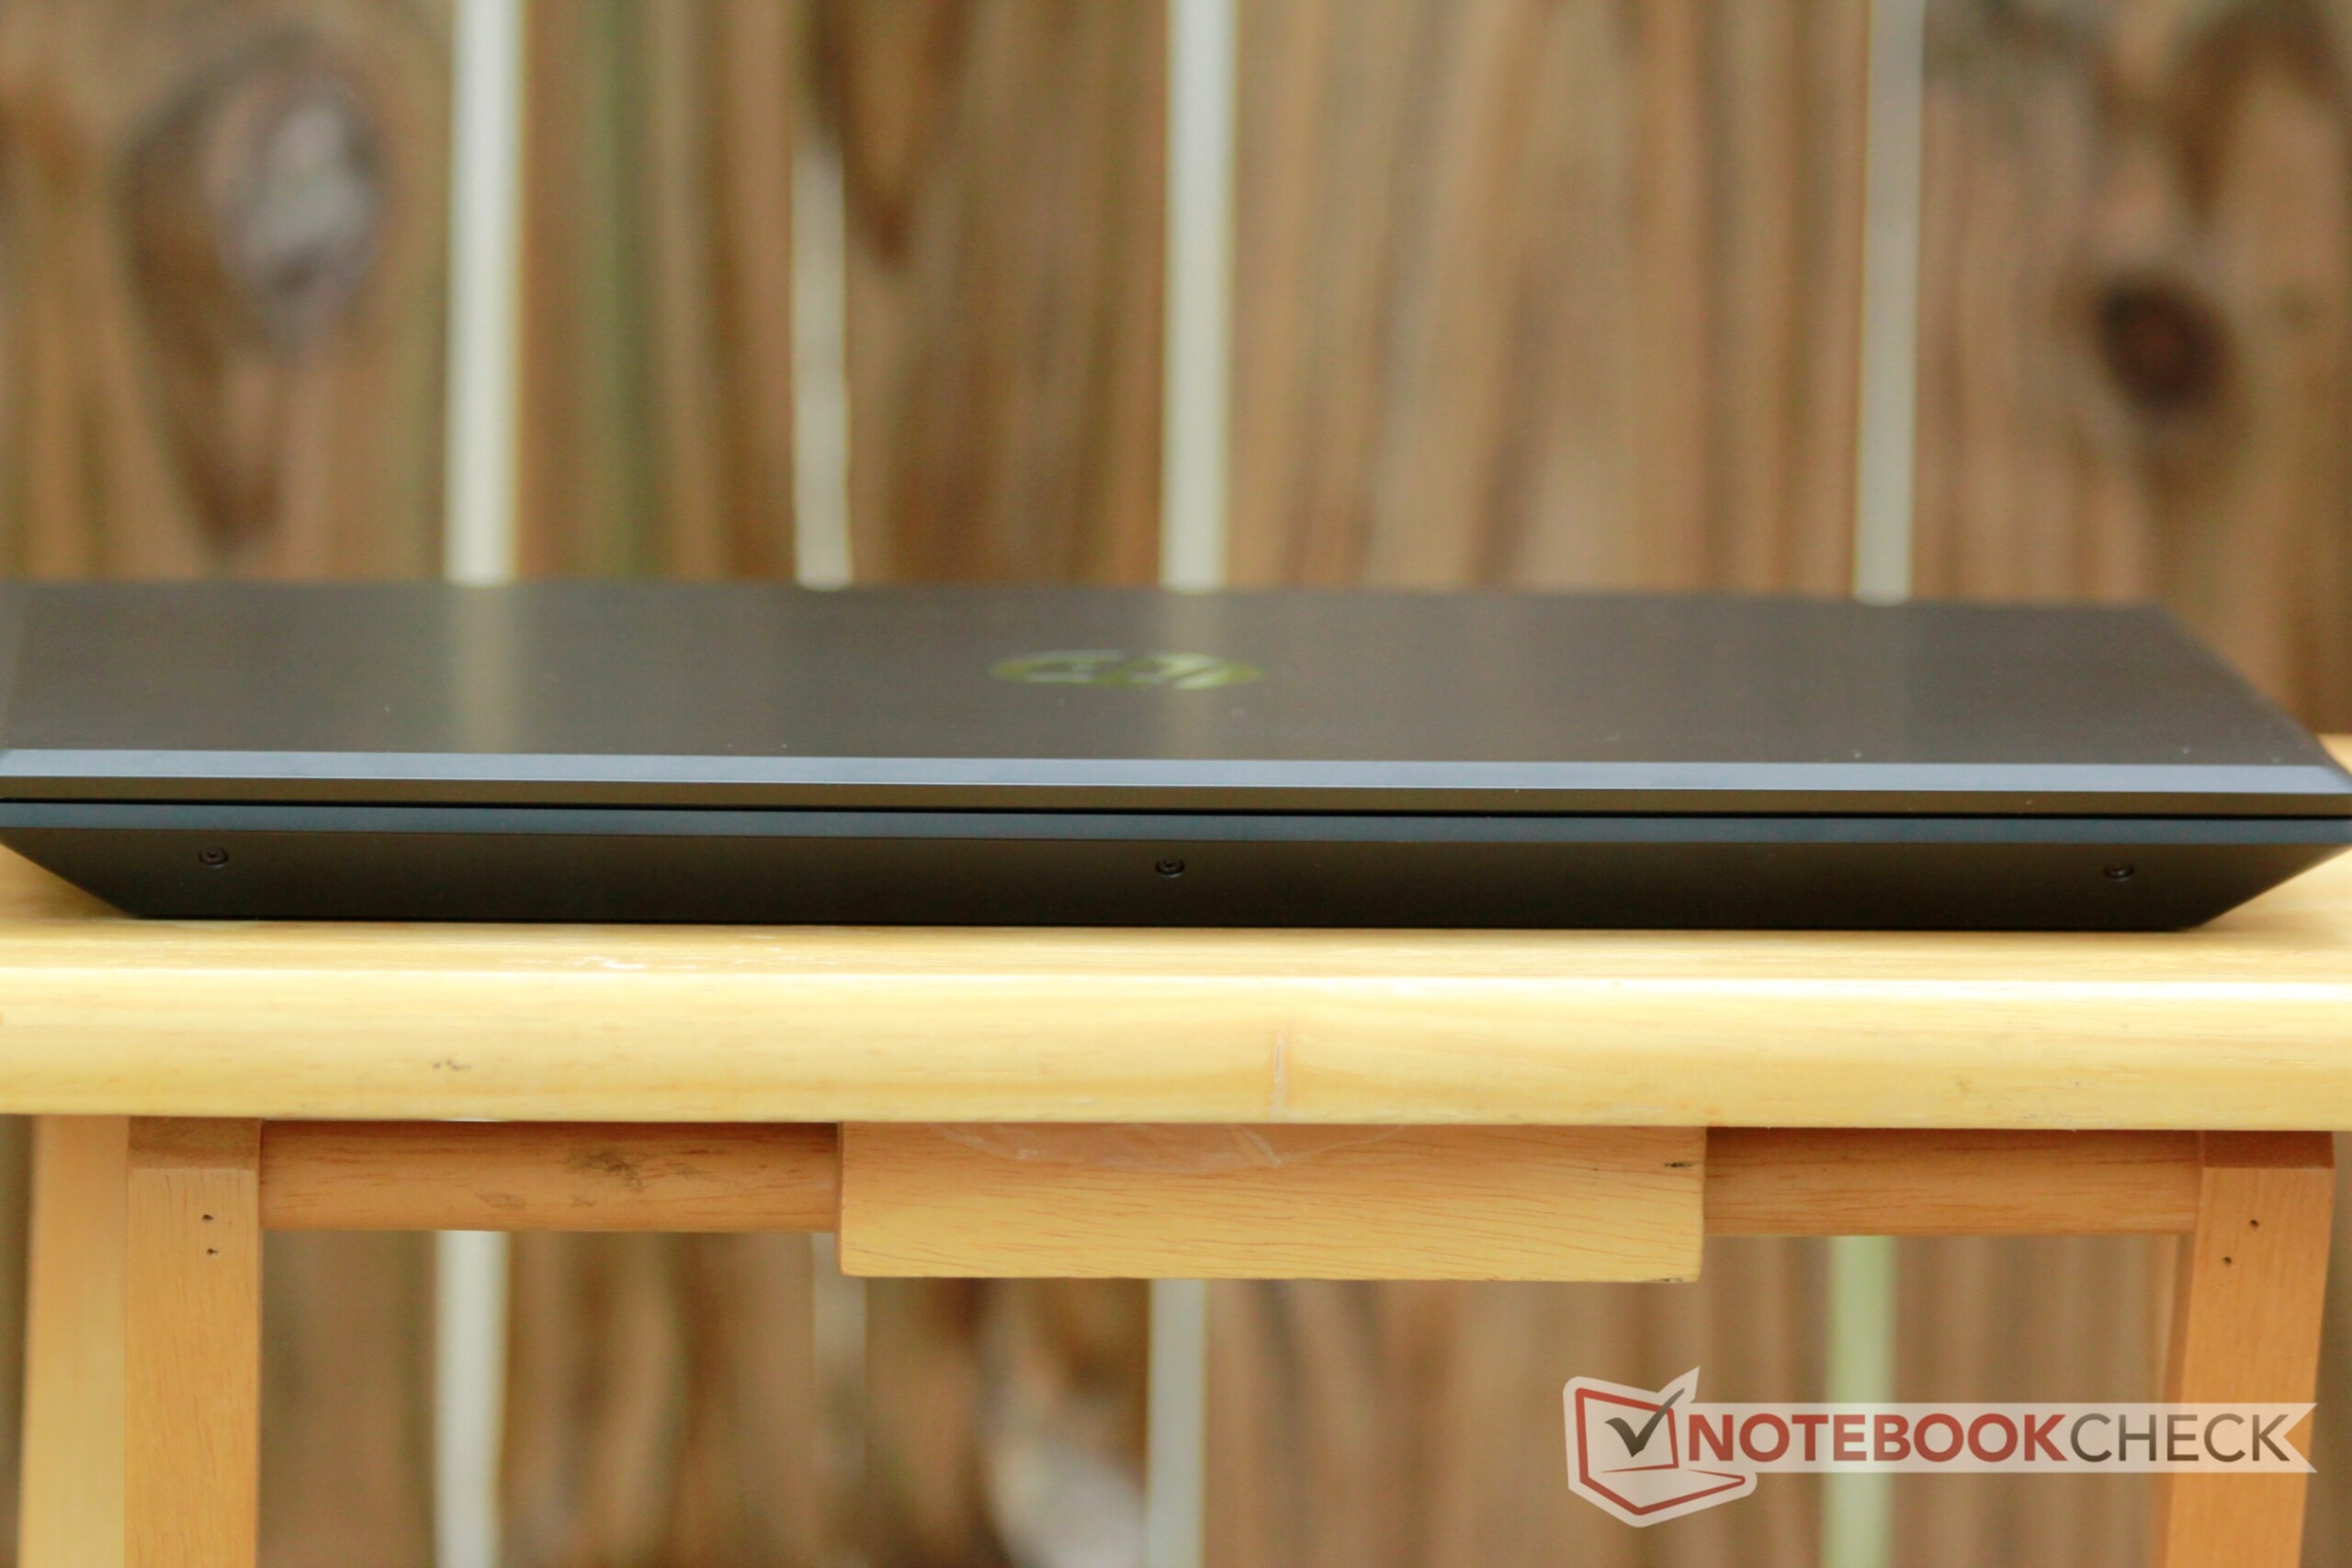
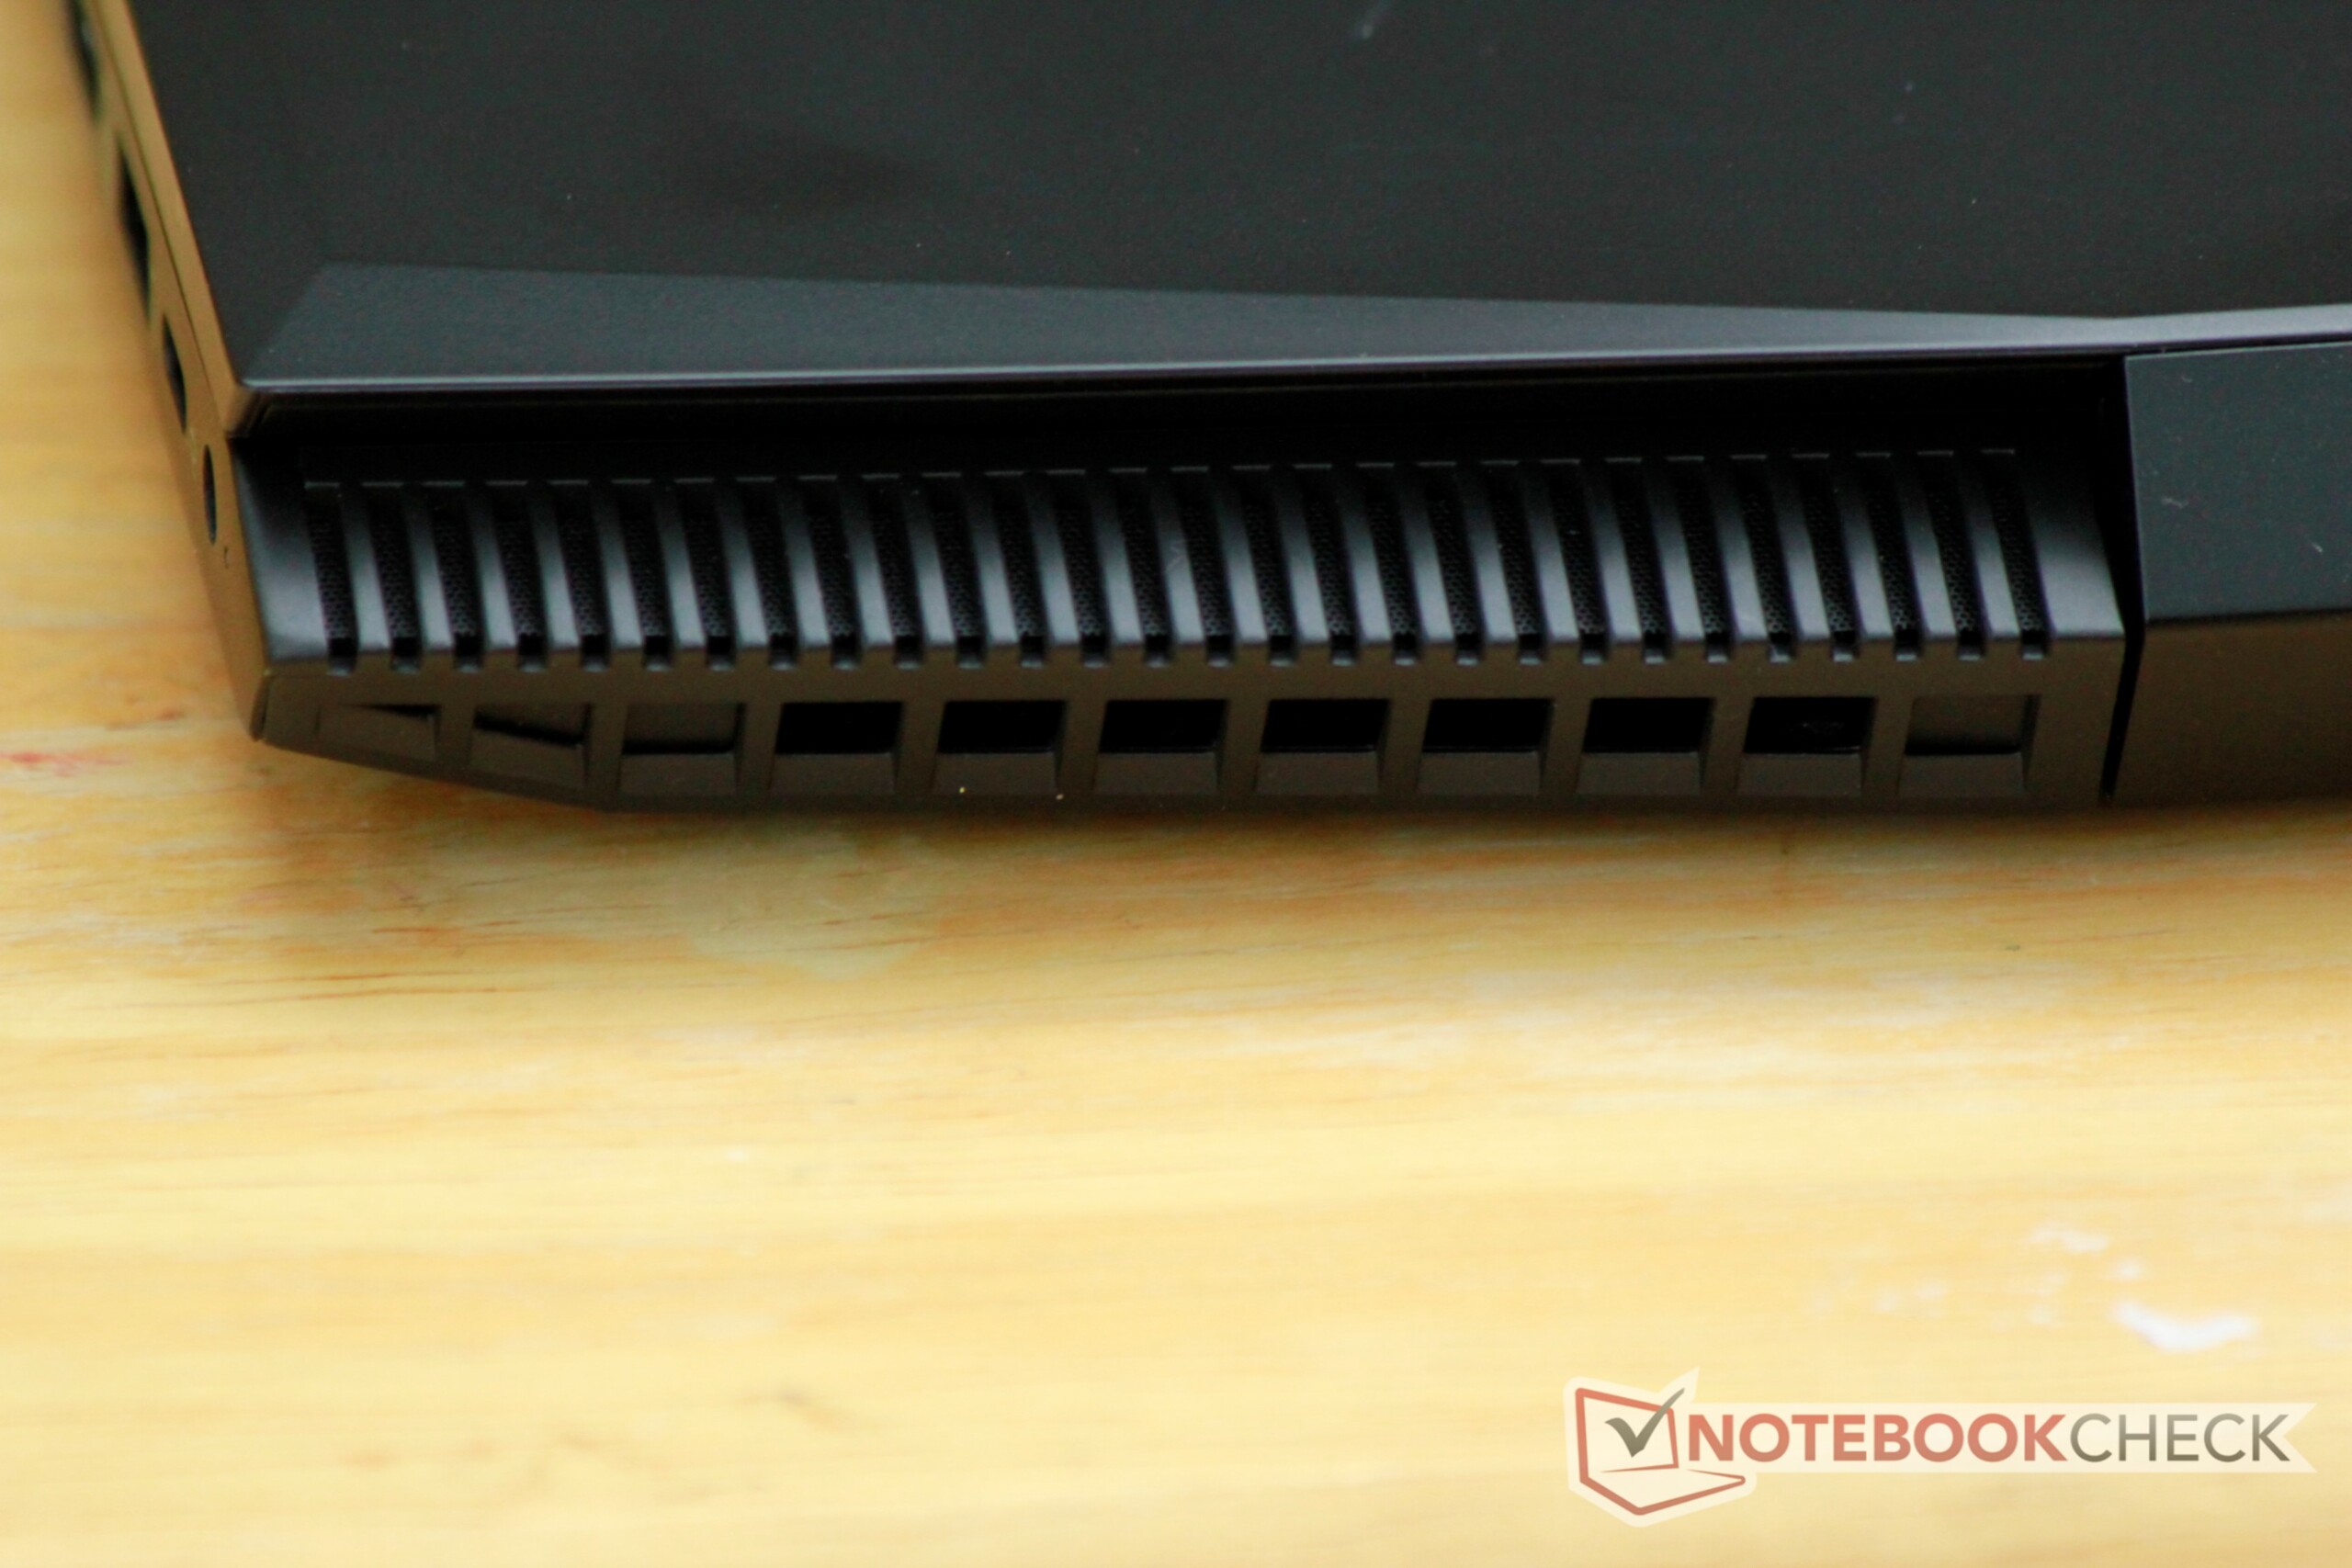
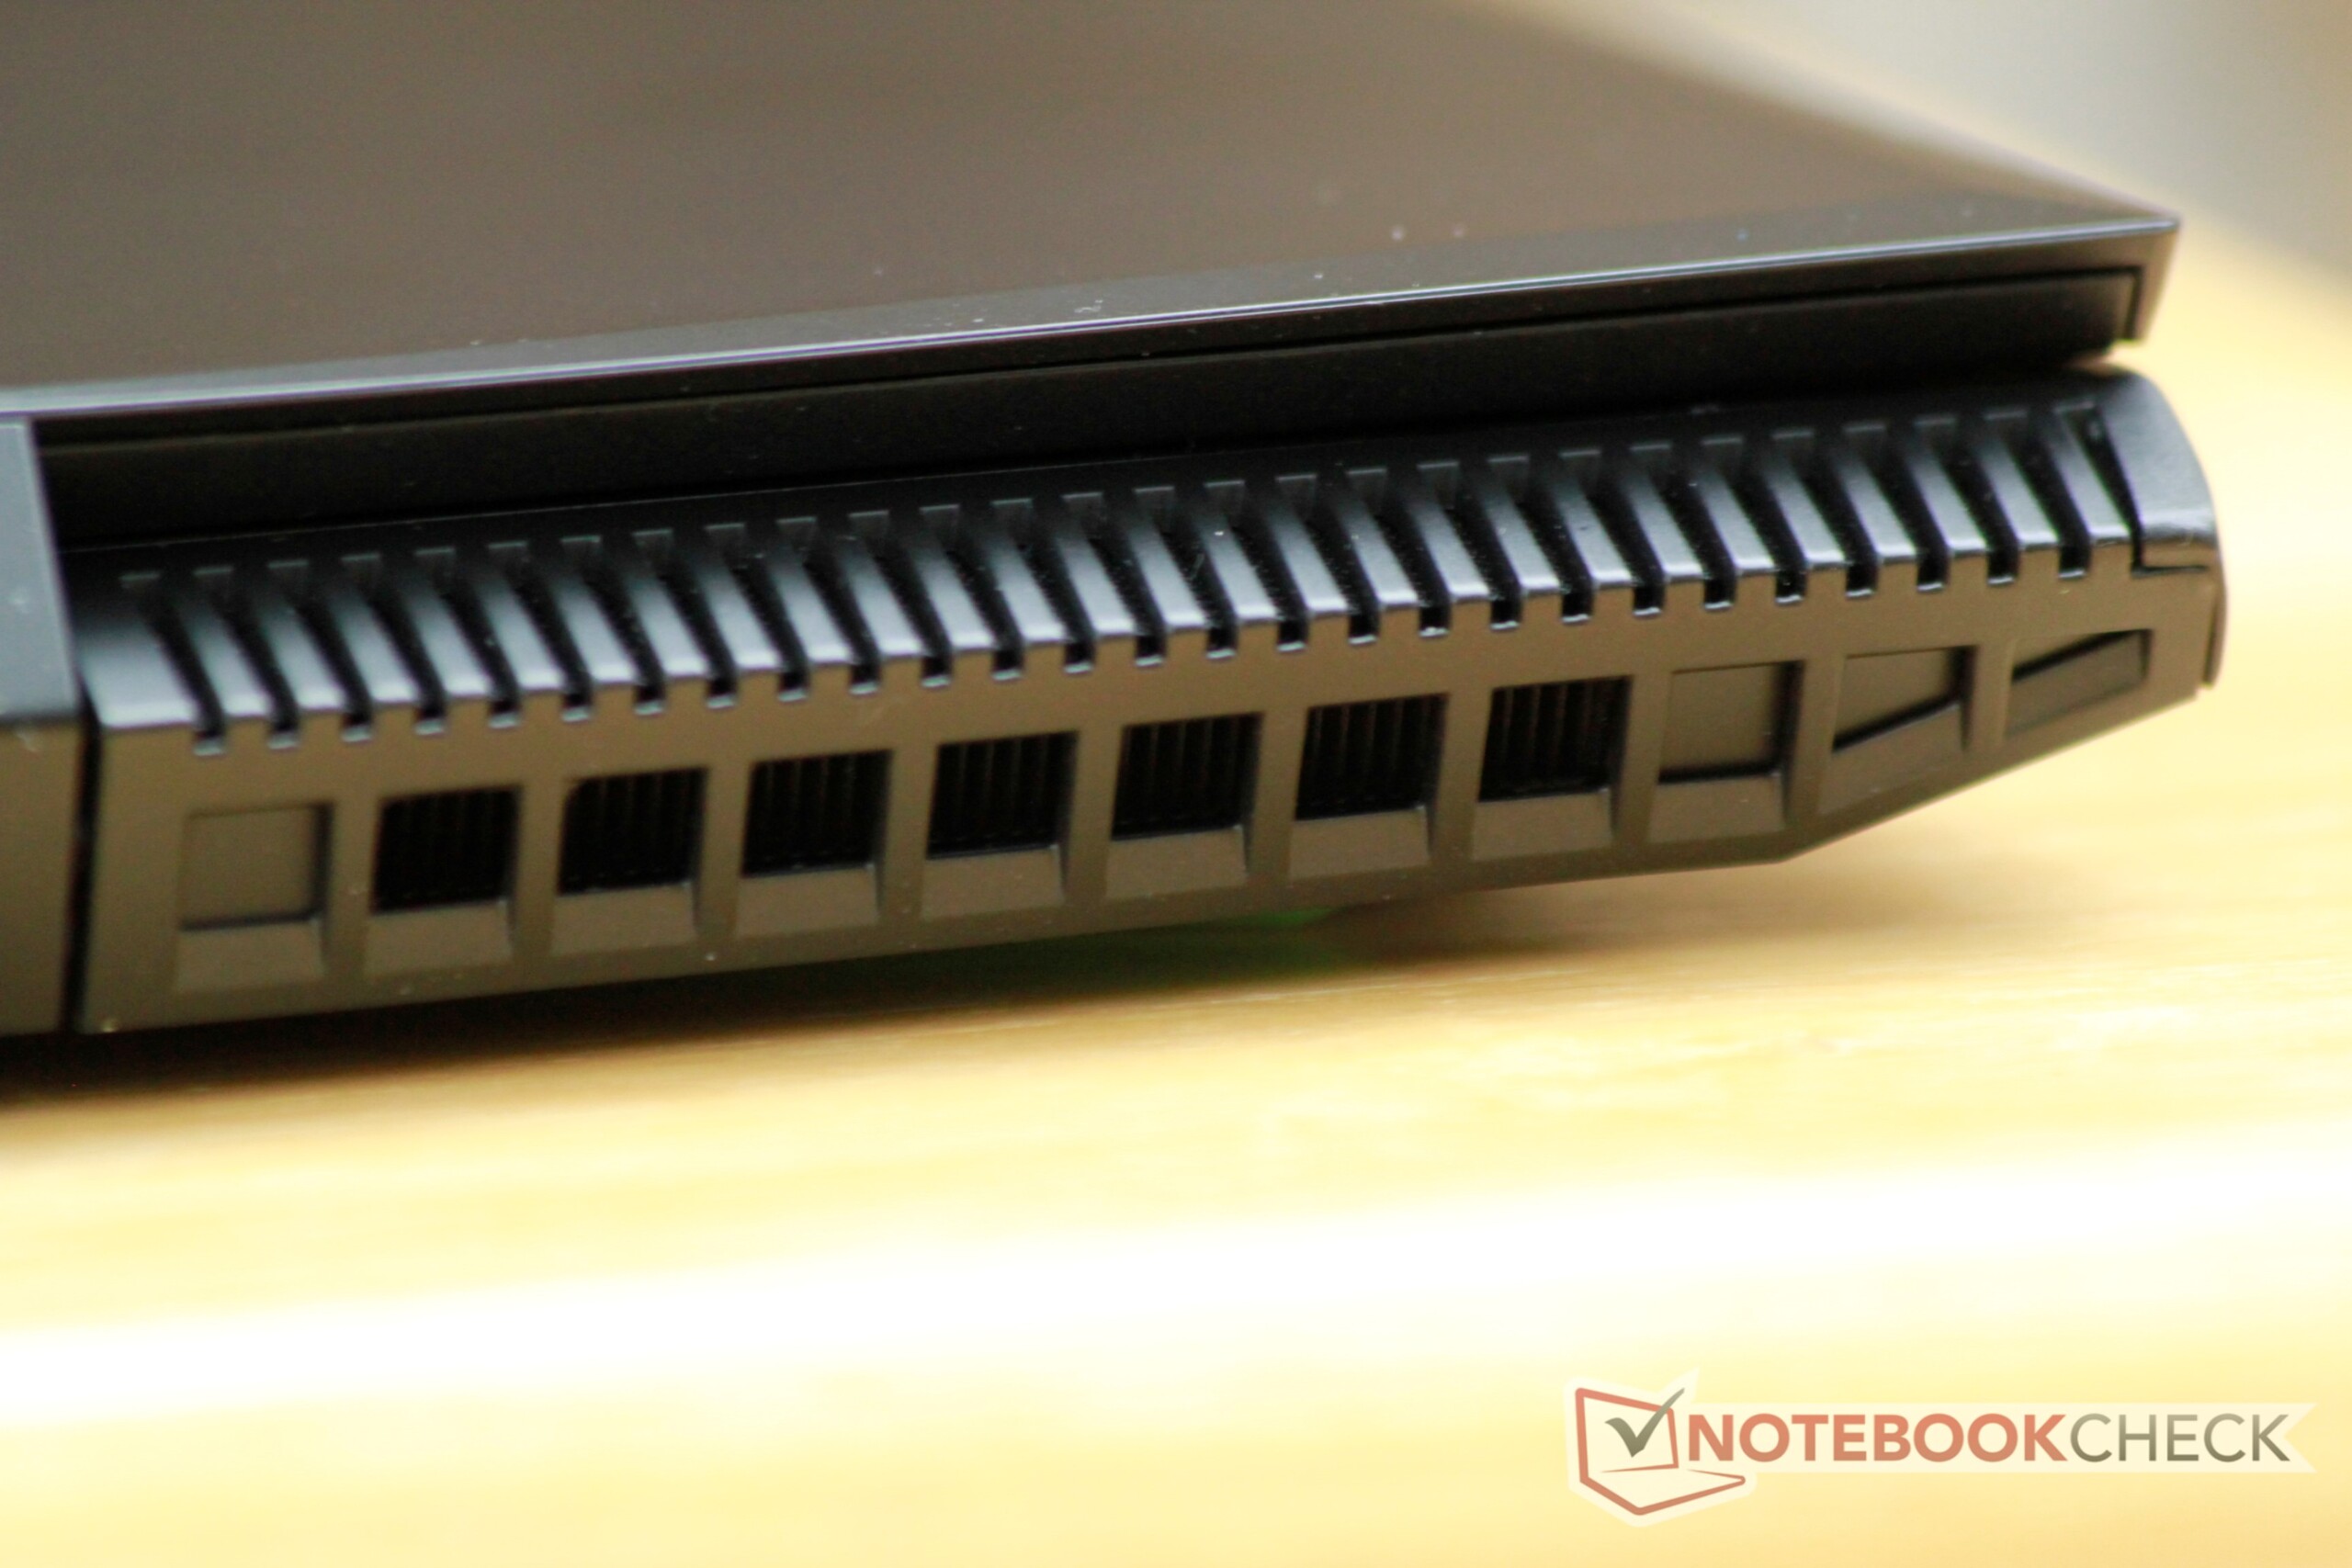
我们测试的电脑风扇表现一般,它们会产生很大噪音。最重要的是,机身并不像我们希望的那样稳定。例如,不稳定的显示屏盖表明大部分成本被花在了设备的内部而不是外部。宏碁暗影骑士3配备了相同的CPU / GPU组合,但可以获得更高的性能,同时提供明显更好的电池运行时间。
HP Pavilion Gaming 15-cx0003ng
- 12/12/2018 v6 (old)
Sascha Mölck
Price comparison

