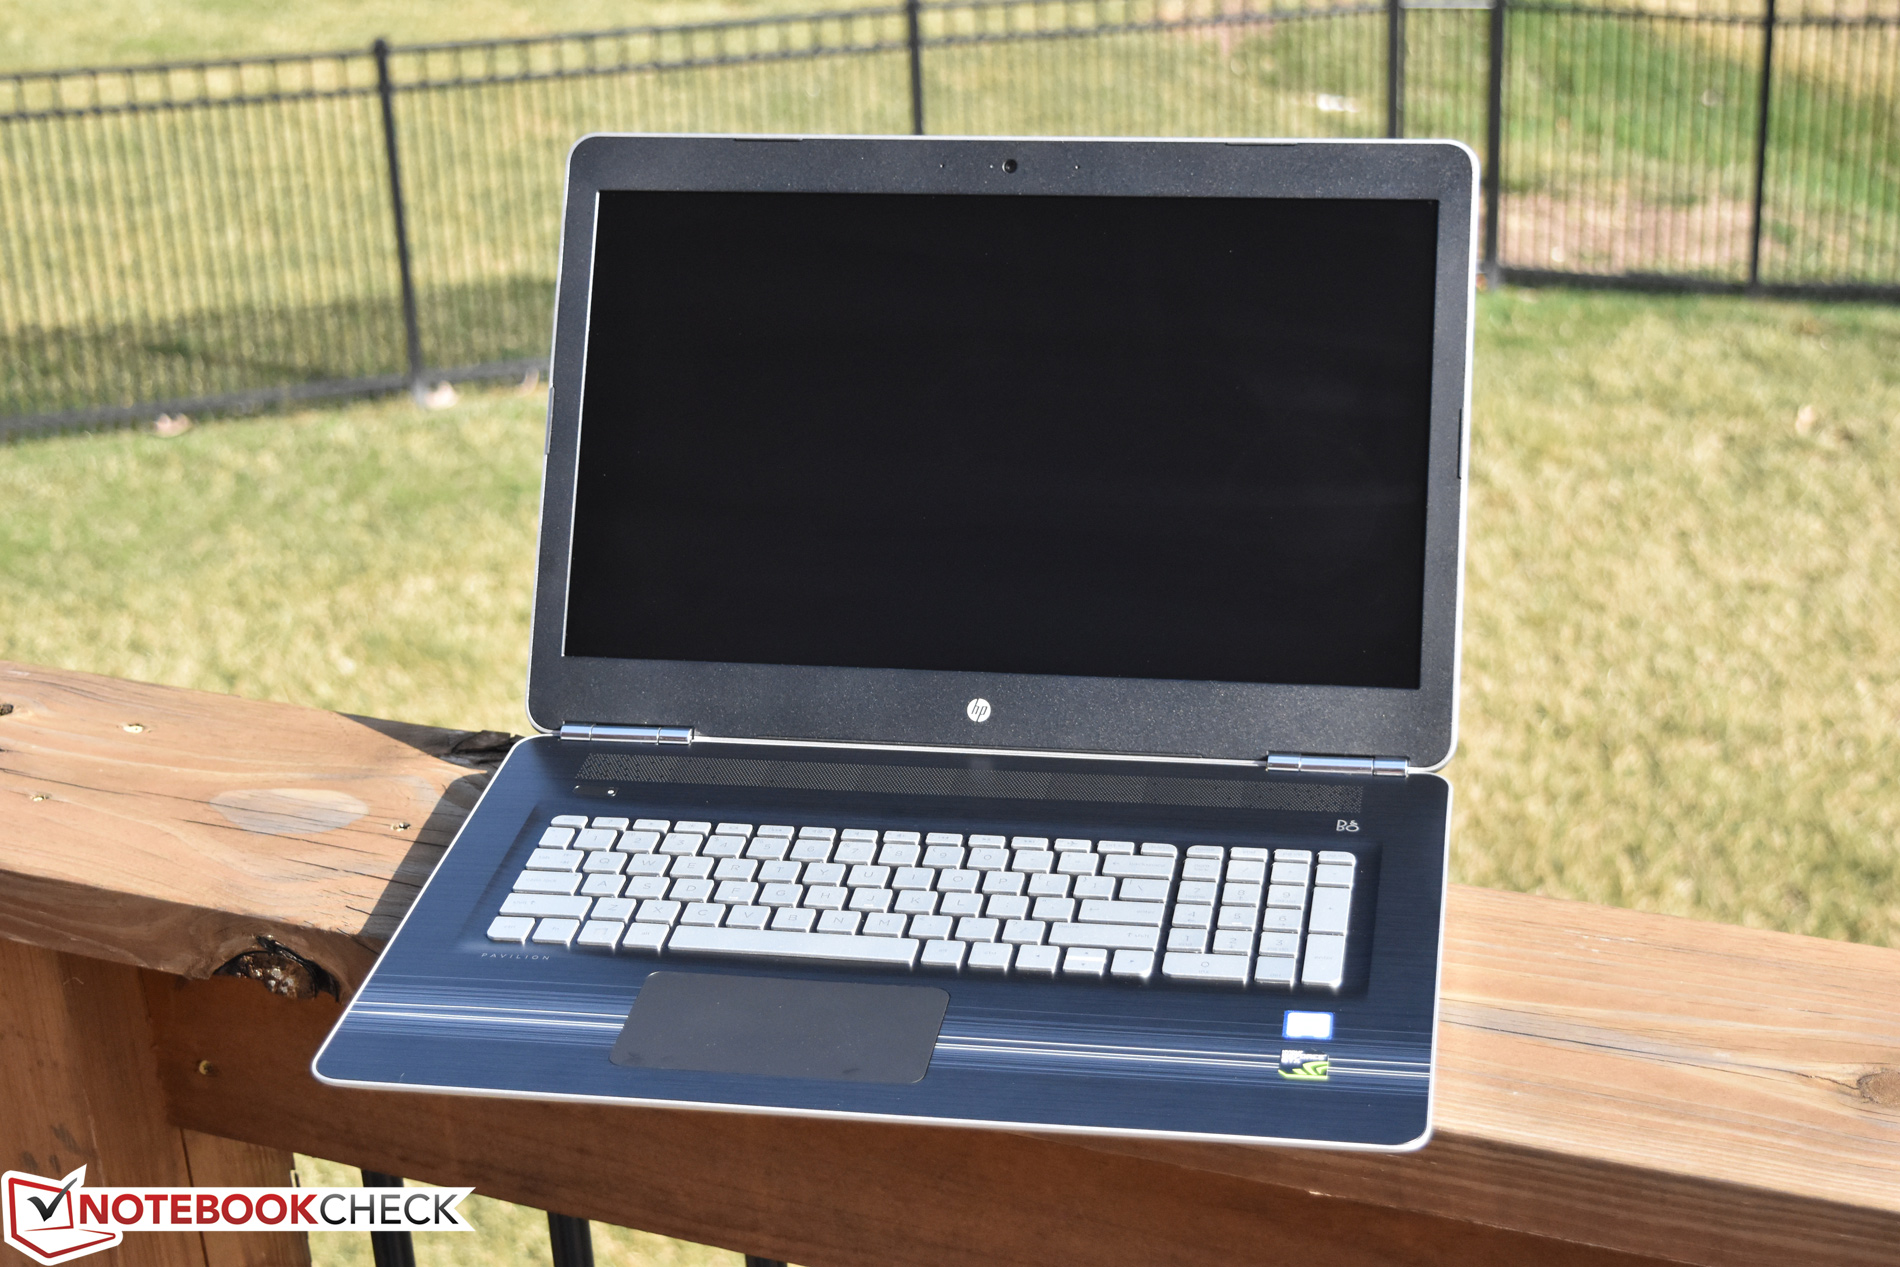
惠普 Pavilion 17t-ab200 笔记本电脑简短评测
| SD Card Reader | |
| average JPG Copy Test (av. of 3 runs) | |
| Gigabyte P57X v7 | |
| Asus Strix GL753VD-GC045T | |
| HP Omen 17-w100ng | |
| HP Pavilion 17 FHD V3A33AV | |
| HP Pavilion 17t-ab200 | |
| MSI GE72 7RE-046 | |
| maximum AS SSD Seq Read Test (1GB) | |
| HP Pavilion 17t-ab200 | |
| Gigabyte P57X v7 | |
| HP Omen 17-w100ng | |
| Asus Strix GL753VD-GC045T | |
| HP Pavilion 17 FHD V3A33AV | |
| MSI GE72 7RE-046 | |
| Networking | |
| iperf3 transmit AX12 | |
| Asus Strix GL753VD-GC045T | |
| HP Pavilion 17t-ab200 | |
| HP Omen 17-w100ng | |
| MSI GE72 7RE-046 | |
| iperf3 receive AX12 | |
| HP Omen 17-w100ng | |
| Asus Strix GL753VD-GC045T | |
| HP Pavilion 17t-ab200 | |
| MSI GE72 7RE-046 | |
| |||||||||||||||||||||||||
Brightness Distribution: 91 %
Center on Battery: 278.8 cd/m²
Contrast: 996:1 (Black: 0.28 cd/m²)
ΔE ColorChecker Calman: 5.8 | ∀{0.5-29.43 Ø4.71}
ΔE Greyscale Calman: 8.3 | ∀{0.09-98 Ø4.96}
87% sRGB (Argyll 1.6.3 3D)
57% AdobeRGB 1998 (Argyll 1.6.3 3D)
64.1% AdobeRGB 1998 (Argyll 3D)
87.6% sRGB (Argyll 3D)
65.2% Display P3 (Argyll 3D)
Gamma: 2.1
CCT: 5723 K
| HP Pavilion 17t-ab200 AUO109D, IPS, 17.3", 1920x1080 | HP Pavilion 17 FHD V3A33AV IPS, 17.3", 1920x1080 | Gigabyte P57X v7 SHP145E, IPS, 17.3", 3840x2160 | HP Omen 17-w100ng LG Philips LGD046E, IPS, 17.3", 1920x1080 | MSI GE72 7RE-046 N173HHE-G32 (CMN1747), TN LED, 17.3", 1920x1080 | |
|---|---|---|---|---|---|
| Display | 0% | 34% | 0% | 29% | |
| Display P3 Coverage (%) | 65.2 | 64.3 -1% | 87.8 35% | 67.2 3% | 90.7 39% |
| sRGB Coverage (%) | 87.6 | 88.1 1% | 100 14% | 86.6 -1% | 99.9 14% |
| AdobeRGB 1998 Coverage (%) | 64.1 | 64.4 0% | 98.9 54% | 63.3 -1% | 85.2 33% |
| Response Times | 6% | -59% | 8% | 48% | |
| Response Time Grey 50% / Grey 80% * (ms) | 36.8 | 31.2 ? 15% | 55.6 ? -51% | 35 ? 5% | 27 ? 27% |
| Response Time Black / White * (ms) | 28 | 29.2 ? -4% | 46.8 ? -67% | 25 ? 11% | 9 ? 68% |
| PWM Frequency (Hz) | 1000 ? | ||||
| Screen | 20% | 19% | 13% | 7% | |
| Brightness middle (cd/m²) | 278.8 | 327.2 17% | 441.3 58% | 342 23% | 253 -9% |
| Brightness (cd/m²) | 265 | 297 12% | 408 54% | 331 25% | 230 -13% |
| Brightness Distribution (%) | 91 | 86 -5% | 86 -5% | 84 -8% | 86 -5% |
| Black Level * (cd/m²) | 0.28 | 0.29 -4% | 0.44 -57% | 0.32 -14% | 0.24 14% |
| Contrast (:1) | 996 | 1128 13% | 1003 1% | 1069 7% | 1054 6% |
| Colorchecker dE 2000 * | 5.8 | 3.03 48% | 5.1 12% | 4.35 25% | 5.01 14% |
| Colorchecker dE 2000 max. * | 10.6 | 6.87 35% | 9.8 8% | 9.24 13% | 10.4 2% |
| Greyscale dE 2000 * | 8.3 | 1.8 78% | 4.3 48% | 3.73 55% | 7.26 13% |
| Gamma | 2.1 105% | 2.17 101% | 2.08 106% | 2.23 99% | 2.09 105% |
| CCT | 5723 114% | 6633 98% | 7345 88% | 6801 96% | 6329 103% |
| Color Space (Percent of AdobeRGB 1998) (%) | 57 | 57.2 0% | 87 53% | 57 0% | 76 33% |
| Color Space (Percent of sRGB) (%) | 87 | 87.6 1% | 100 15% | 86 -1% | 100 15% |
| Total Average (Program / Settings) | 9% /
14% | -2% /
11% | 7% /
9% | 28% /
17% |
* ... smaller is better
Display Response Times
| ↔ Response Time Black to White | ||
|---|---|---|
| 28 ms ... rise ↗ and fall ↘ combined | ↗ ms rise | 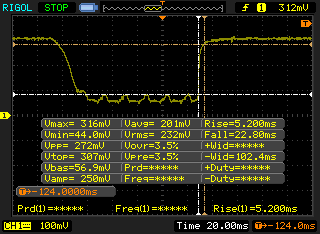 |
| ↘ ms fall | ||
| The screen shows relatively slow response rates in our tests and may be too slow for gamers. In comparison, all tested devices range from 0.1 (minimum) to 240 (maximum) ms. » 71 % of all devices are better. This means that the measured response time is worse than the average of all tested devices (19.8 ms). | ||
| ↔ Response Time 50% Grey to 80% Grey | ||
| 36.8 ms ... rise ↗ and fall ↘ combined | ↗ ms rise | 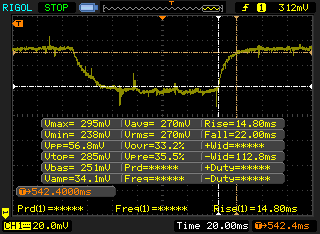 |
| ↘ ms fall | ||
| The screen shows slow response rates in our tests and will be unsatisfactory for gamers. In comparison, all tested devices range from 0.165 (minimum) to 636 (maximum) ms. » 53 % of all devices are better. This means that the measured response time is worse than the average of all tested devices (31 ms). | ||
Screen Flickering / PWM (Pulse-Width Modulation)
| Screen flickering / PWM not detected | 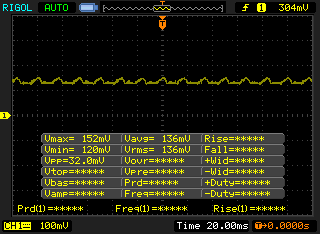 | ||
In comparison: 52 % of all tested devices do not use PWM to dim the display. If PWM was detected, an average of 7754 (minimum: 5 - maximum: 343500) Hz was measured. | |||
| Cinebench R11.5 | |
| CPU Single 64Bit | |
| Gigabyte P57X v7 | |
| HP Pavilion 17t-ab200 | |
| MSI GE72 7RE-046 | |
| HP Pavilion 17 FHD V3A33AV | |
| HP Omen 17-w100ng | |
| CPU Multi 64Bit | |
| HP Pavilion 17t-ab200 | |
| MSI GE72 7RE-046 | |
| Gigabyte P57X v7 | |
| HP Pavilion 17 FHD V3A33AV | |
| HP Omen 17-w100ng | |
| wPrime 2.10 - 1024m | |
| Gigabyte P57X v7 | |
| HP Pavilion 17t-ab200 | |
* ... smaller is better
| PCMark 8 | |
| Home Score Accelerated v2 | |
| HP Omen 17-w100ng | |
| HP Pavilion 17t-ab200 | |
| Asus Strix GL753VD-GC045T | |
| Gigabyte P57X v7 | |
| HP Pavilion 17 FHD V3A33AV | |
| Work Score Accelerated v2 | |
| HP Omen 17-w100ng | |
| HP Pavilion 17t-ab200 | |
| HP Pavilion 17 FHD V3A33AV | |
| Gigabyte P57X v7 | |
| Creative Score Accelerated v2 | |
| HP Omen 17-w100ng | |
| HP Pavilion 17t-ab200 | |
| Gigabyte P57X v7 | |
| HP Pavilion 17 FHD V3A33AV | |
| PCMark 8 Home Score Accelerated v2 | 4212 points | |
| PCMark 8 Creative Score Accelerated v2 | 5310 points | |
| PCMark 8 Work Score Accelerated v2 | 5214 points | |
Help | ||
| HP Pavilion 17t-ab200 Samsung CM871a MZNTY128HDHP | HP Pavilion 17 FHD V3A33AV SanDisk Z400s SD8SNAT-128G | Gigabyte P57X v7 Transcend MTS800 256GB M.2 (TS256GMTS800) | HP Omen 17-w100ng SanDisk Z400s SD8SNAT-128G | MSI GE72 7RE-046 Toshiba HG6 THNSNJ256G8NY | |
|---|---|---|---|---|---|
| CrystalDiskMark 3.0 | -13% | 25% | -14% | 53% | |
| Read Seq (MB/s) | 520 | 517 -1% | 517 -1% | 495 -5% | 540 4% |
| Write Seq (MB/s) | 353.6 | 185.1 -48% | 305.7 -14% | 180.2 -49% | 495.7 40% |
| Read 512 (MB/s) | 376.2 | 319.3 -15% | 315 -16% | 315.5 -16% | 455.1 21% |
| Write 512 (MB/s) | 118.5 | 179.5 51% | 306.1 158% | 172.4 45% | 481.4 306% |
| Read 4k (MB/s) | 32.7 | 20.99 -36% | 26.04 -20% | 20.25 -38% | 22.7 -31% |
| Write 4k (MB/s) | 85.3 | 68.3 -20% | 82.3 -4% | 76.1 -11% | 112.9 32% |
| Read 4k QD32 (MB/s) | 399 | 144.6 -64% | 281.3 -29% | 141.6 -65% | 372.5 -7% |
| Write 4k QD32 (MB/s) | 132.5 | 169.8 28% | 296 123% | 170.8 29% | 212.9 61% |

| 3DMark | |
| 1280x720 Cloud Gate Standard Graphics | |
| Gigabyte P57X v7 | |
| HP Omen 17-w100ng | |
| MSI GE72 7RE-046 | |
| HP Pavilion 17t-ab200 | |
| Asus Strix GL753VD-GC045T | |
| HP Pavilion 17 FHD V3A33AV | |
| Acer Aspire V17 Nitro BE VN7-793G-706L | |
| 1920x1080 Fire Strike Graphics | |
| Gigabyte P57X v7 | |
| HP Omen 17-w100ng | |
| Acer Aspire V17 Nitro BE VN7-793G-706L | |
| MSI GE72 7RE-046 | |
| HP Pavilion 17t-ab200 | |
| Asus Strix GL753VD-GC045T | |
| Asus Strix GL753VD-GC045T | |
| HP Pavilion 17 FHD V3A33AV | |
| 1920x1080 Ice Storm Extreme Graphics | |
| HP Omen 17-w100ng | |
| Gigabyte P57X v7 | |
| HP Pavilion 17 FHD V3A33AV | |
| 3DMark 06 Standard Score | 27027 points | |
| 3DMark 11 Performance | 7794 points | |
| 3DMark Ice Storm Standard Score | 82555 points | |
| 3DMark Cloud Gate Standard Score | 19749 points | |
| 3DMark Fire Strike Score | 5415 points | |
| 3DMark Fire Strike Extreme Score | 2675 points | |
Help | ||
| BioShock Infinite | |
| 1280x720 Very Low Preset (sort by value) | |
| HP Pavilion 17t-ab200 | |
| HP Omen 17-w100ng | |
| 1366x768 Medium Preset (sort by value) | |
| HP Pavilion 17t-ab200 | |
| HP Omen 17-w100ng | |
| 1366x768 High Preset (sort by value) | |
| HP Pavilion 17t-ab200 | |
| HP Pavilion 17 FHD V3A33AV | |
| HP Omen 17-w100ng | |
| 1920x1080 Ultra Preset, DX11 (DDOF) (sort by value) | |
| HP Pavilion 17t-ab200 | |
| HP Pavilion 17 FHD V3A33AV | |
| Gigabyte P57X v7 | |
| HP Omen 17-w100ng | |
| Mafia 2 - 1920x1080 high AA:0x AF:16x (sort by value) | |
| HP Pavilion 17t-ab200 | |
| Gigabyte P57X v7 | |
| Batman: Arkham Knight | |
| 1920x1080 High / On (Interactive Smoke & Paper Debris Off) AA:SM AF:8x (sort by value) | |
| HP Pavilion 17t-ab200 | |
| HP Pavilion 17 FHD V3A33AV | |
| MSI GE72 7RE-046 | |
| 1920x1080 High / On AA:SM AF:16x (sort by value) | |
| HP Pavilion 17t-ab200 | |
| HP Pavilion 17 FHD V3A33AV | |
| MSI GE72 7RE-046 | |
| Fallout 4 | |
| 1280x720 Low Preset AA:FX (sort by value) | |
| HP Pavilion 17t-ab200 | |
| Asus Strix GL753VD-GC045T | |
| Acer Aspire V17 Nitro BE VN7-793G-706L | |
| 1366x768 Medium Preset AA:T AF:16x (sort by value) | |
| HP Pavilion 17t-ab200 | |
| Asus Strix GL753VD-GC045T | |
| Acer Aspire V17 Nitro BE VN7-793G-706L | |
| 1920x1080 High Preset AA:T AF:16x (sort by value) | |
| HP Pavilion 17t-ab200 | |
| HP Pavilion 17 FHD V3A33AV | |
| MSI GE72 7RE-046 | |
| Asus Strix GL753VD-GC045T | |
| Acer Aspire V17 Nitro BE VN7-793G-706L | |
| 1920x1080 Ultra Preset AA:T AF:16x (sort by value) | |
| HP Pavilion 17t-ab200 | |
| HP Pavilion 17 FHD V3A33AV | |
| MSI GE72 7RE-046 | |
| Asus Strix GL753VD-GC045T | |
| Acer Aspire V17 Nitro BE VN7-793G-706L | |
| Rise of the Tomb Raider | |
| 1024x768 Lowest Preset (sort by value) | |
| HP Pavilion 17t-ab200 | |
| Asus Strix GL753VD-GC045T | |
| Acer Aspire V17 Nitro BE VN7-793G-706L | |
| 1366x768 Medium Preset AF:2x (sort by value) | |
| HP Pavilion 17t-ab200 | |
| Asus Strix GL753VD-GC045T | |
| Acer Aspire V17 Nitro BE VN7-793G-706L | |
| 1920x1080 High Preset AA:FX AF:4x (sort by value) | |
| HP Pavilion 17t-ab200 | |
| HP Pavilion 17 FHD V3A33AV | |
| MSI GE72 7RE-046 | |
| Asus Strix GL753VD-GC045T | |
| Acer Aspire V17 Nitro BE VN7-793G-706L | |
| 1920x1080 Very High Preset AA:FX AF:16x (sort by value) | |
| HP Pavilion 17t-ab200 | |
| HP Pavilion 17 FHD V3A33AV | |
| MSI GE72 7RE-046 | |
| Asus Strix GL753VD-GC045T | |
| Acer Aspire V17 Nitro BE VN7-793G-706L | |
| low | med. | high | ultra | |
|---|---|---|---|---|
| Mafia 2 (2010) | 152 | 152 | 66.1 | |
| BioShock Infinite (2013) | 207 | 155 | 143 | 59 |
| Batman: Arkham Knight (2015) | 90 | 78 | 45 | 42 |
| Fallout 4 (2015) | 108 | 70 | 38 | 31 |
| Rise of the Tomb Raider (2016) | 105 | 62 | 34 | 27 |
Noise level
| Idle |
| 35.3 / 35.4 / 35.4 dB(A) |
| Load |
| 48.6 / 49.8 dB(A) |
 | ||
30 dB silent 40 dB(A) audible 50 dB(A) loud |
||
min: | ||
| HP Pavilion 17t-ab200 GeForce GTX 1050 Mobile, i7-7700HQ, Samsung CM871a MZNTY128HDHP | HP Pavilion 17 FHD V3A33AV GeForce GTX 960M, 6700HQ, SanDisk Z400s SD8SNAT-128G | Gigabyte P57X v7 GeForce GTX 1070 Mobile, i7-7700HQ, Transcend MTS800 256GB M.2 (TS256GMTS800) | HP Omen 17-w100ng GeForce GTX 1060 Mobile, 6300HQ, SanDisk Z400s SD8SNAT-128G | MSI GE72 7RE-046 GeForce GTX 1050 Ti Mobile, i7-7700HQ, Toshiba HG6 THNSNJ256G8NY | |
|---|---|---|---|---|---|
| Noise | 2% | 7% | -1% | 4% | |
| off / environment * (dB) | 30.8 | 29 6% | 29 6% | 31 -1% | 30 3% |
| Idle Minimum * (dB) | 35.3 | 34.6 2% | 30.4 14% | 35 1% | 34 4% |
| Idle Average * (dB) | 35.4 | 34.8 2% | 32.1 9% | 36 -2% | 35 1% |
| Idle Maximum * (dB) | 35.4 | 35.5 -0% | 32.1 9% | 37 -5% | 36 -2% |
| Load Average * (dB) | 48.6 | 45.4 7% | 45.6 6% | 44 9% | 41 16% |
| Load Maximum * (dB) | 49.8 | 52.3 -5% | 51.5 -3% | 54 -8% | 49 2% |
* ... smaller is better
(-) The maximum temperature on the upper side is 45.8 °C / 114 F, compared to the average of 36.8 °C / 98 F, ranging from 21 to 71 °C for the class Multimedia.
(+) The bottom heats up to a maximum of 37 °C / 99 F, compared to the average of 39.1 °C / 102 F
(+) In idle usage, the average temperature for the upper side is 21.8 °C / 71 F, compared to the device average of 31.3 °C / 88 F.
(+) The palmrests and touchpad are cooler than skin temperature with a maximum of 30 °C / 86 F and are therefore cool to the touch.
(±) The average temperature of the palmrest area of similar devices was 28.7 °C / 83.7 F (-1.3 °C / -2.3 F).
HP Pavilion 17t-ab200 audio analysis
(±) | speaker loudness is average but good (73.9 dB)
Bass 100 - 315 Hz
(-) | nearly no bass - on average 15.9% lower than median
(±) | linearity of bass is average (11.8% delta to prev. frequency)
Mids 400 - 2000 Hz
(+) | balanced mids - only 3.1% away from median
(+) | mids are linear (6.6% delta to prev. frequency)
Highs 2 - 16 kHz
(+) | balanced highs - only 3.4% away from median
(±) | linearity of highs is average (9% delta to prev. frequency)
Overall 100 - 16.000 Hz
(±) | linearity of overall sound is average (26.5% difference to median)
Compared to same class
» 92% of all tested devices in this class were better, 1% similar, 6% worse
» The best had a delta of 5%, average was 17%, worst was 45%
Compared to all devices tested
» 82% of all tested devices were better, 4% similar, 15% worse
» The best had a delta of 4%, average was 23%, worst was 134%
HP Omen 17-w100ng audio analysis
(+) | speakers can play relatively loud (87 dB)
Bass 100 - 315 Hz
(-) | nearly no bass - on average 23.9% lower than median
(±) | linearity of bass is average (12.3% delta to prev. frequency)
Mids 400 - 2000 Hz
(+) | balanced mids - only 2.2% away from median
(+) | mids are linear (4.6% delta to prev. frequency)
Highs 2 - 16 kHz
(+) | balanced highs - only 4.6% away from median
(+) | highs are linear (4.5% delta to prev. frequency)
Overall 100 - 16.000 Hz
(±) | linearity of overall sound is average (16.6% difference to median)
Compared to same class
» 43% of all tested devices in this class were better, 7% similar, 50% worse
» The best had a delta of 6%, average was 18%, worst was 132%
Compared to all devices tested
» 29% of all tested devices were better, 6% similar, 65% worse
» The best had a delta of 4%, average was 23%, worst was 134%
| Off / Standby | |
| Idle | |
| Load |
|
Key:
min: | |
| HP Pavilion 17t-ab200 i7-7700HQ, GeForce GTX 1050 Mobile, Samsung CM871a MZNTY128HDHP, IPS, 1920x1080, 17.3" | HP Pavilion 17 FHD V3A33AV 6700HQ, GeForce GTX 960M, SanDisk Z400s SD8SNAT-128G, IPS, 1920x1080, 17.3" | Gigabyte P57X v7 i7-7700HQ, GeForce GTX 1070 Mobile, Transcend MTS800 256GB M.2 (TS256GMTS800), IPS, 3840x2160, 17.3" | HP Omen 17-w100ng 6300HQ, GeForce GTX 1060 Mobile, SanDisk Z400s SD8SNAT-128G, IPS, 1920x1080, 17.3" | MSI GE72 7RE-046 i7-7700HQ, GeForce GTX 1050 Ti Mobile, Toshiba HG6 THNSNJ256G8NY, TN LED, 1920x1080, 17.3" | |
|---|---|---|---|---|---|
| Power Consumption | 8% | -111% | -77% | -60% | |
| Idle Minimum * (Watt) | 8.2 | 5.3 35% | 15.7 -91% | 17 -107% | 14 -71% |
| Idle Average * (Watt) | 11 | 10.6 4% | 23.4 -113% | 22 -100% | 20 -82% |
| Idle Maximum * (Watt) | 11.1 | 11.8 -6% | 23.5 -112% | 29 -161% | 25 -125% |
| Load Average * (Watt) | 77 | 70.9 8% | 184.6 -140% | 72 6% | 82 -6% |
| Load Maximum * (Watt) | 116.9 | 119.8 -2% | 233.1 -99% | 141 -21% | 135 -15% |
* ... smaller is better
| HP Pavilion 17t-ab200 i7-7700HQ, GeForce GTX 1050 Mobile, 62 Wh | HP Pavilion 17 FHD V3A33AV 6700HQ, GeForce GTX 960M, 62 Wh | Gigabyte P57X v7 i7-7700HQ, GeForce GTX 1070 Mobile, 75.81 Wh | HP Omen 17-w100ng 6300HQ, GeForce GTX 1060 Mobile, 95.8 Wh | MSI GE72 7RE-046 i7-7700HQ, GeForce GTX 1050 Ti Mobile, 51.4 Wh | Asus Strix GL753VD-GC045T i7-7700HQ, GeForce GTX 1050 Mobile, 48 Wh | |
|---|---|---|---|---|---|---|
| Battery runtime | -1% | -44% | 3% | -54% | -38% | |
| Reader / Idle (h) | 11.5 | 12.5 9% | 4.3 -63% | 9.1 -21% | 8.6 -25% | |
| WiFi v1.3 (h) | 6.8 | 5.9 -13% | 2.6 -62% | 6.1 -10% | 3.1 -54% | 4.4 -35% |
| Load (h) | 1.7 | 1.7 0% | 1.6 -6% | 2.4 41% | 0.8 -53% |
Pros
Cons

Pavilion 17t与我们6个月前评测的一台机器非常相似,正因为如此,它保留了其前代大部分的优点和缺点。它仍然是一个台优秀的低到中档游戏本,它现在可以用更高的设置——原始分辨率(1080),处理最新的游戏。这要归功于其显卡(可敬低调的 GTX 1050)。此外,对比许多其他拥有同样屏幕尺寸的竞争对手,它更加便携......而它的屏幕,真的是相当不错。运行快速和整体优秀,特别是当设备处于高负荷时;它几乎没有卡顿,尽管它的冷却系统很简单。
如果价格和性能是最重要因素,而耐用性、人体工程学、以及维护/升级并不重要,那么Pavilion 17t-ab200还是不错的。
除此之外,它并没有真正的大作为。塑料外壳是重量轻的一个原因,但由于同样的原因,A面比我们预想的要脆弱。整体给人一种廉价感。输入设备处于中低档。同时,维护起来会遇到本可以避免的困难——有拆卸风险的塑料外壳和复杂装配方式的结合。端口选择仍然不多(仅仅带有HDMI视频输出,没有USB Type-C,和缺乏用来连接高端固态硬盘的NVMe)。它可能不能作为专业商务人士一个可行的选择。最后,在轻度使用情况下,它依然有响声。因为配备了比前代更高效的处理器和显卡,它的温度不会上升太多。
鉴于这些缺点,可能真的只有一种类型的用户才能使这台机器变得有意义——预算低的移动游戏玩家。如果价格和性能是至关重要的因素,并且耐用性、人体工程学和维护/升级可行性不重要,那么Pavilion 17t-ab200还不错。否则,当预算可以更多些时,我们很难推荐它。
注:本文是基于完整评测的缩减版本,阅读完整的英文评测,请点击这里。
HP Pavilion 17t-ab200
- 02/21/2017 v6 (old)
Steve Schardein
Price comparison
