技嘉科技 P56XT (7700HQ, GTX 1070, Full HD) 笔记本电脑简短评测
| SD Card Reader | |
| average JPG Copy Test (av. of 3 runs) | |
| Acer Predator 15 G9-593-751X (Toshiba Exceria Pro SDXC 64 GB UHS-II) | |
| Schenker XMG P507 PRO (Toshiba Exceria Pro SDXC 64 GB UHS-II) | |
| Gigabyte Aero 15 (Toshiba Exceria Pro SDXC 64 GB UHS-II) | |
| Gigabyte P56XT (Toshiba Exceria Pro SDXC 64 GB UHS-II) | |
| MSI GS63VR 7RF-228US (Toshiba Exceria Pro SDXC 64 GB UHS-II) | |
| Acer Aspire VN7-593G-73HP V15 Nitro BE | |
| maximum AS SSD Seq Read Test (1GB) | |
| Gigabyte Aero 15 (Toshiba Exceria Pro SDXC 64 GB UHS-II) | |
| Acer Predator 15 G9-593-751X (Toshiba Exceria Pro SDXC 64 GB UHS-II) | |
| Gigabyte P56XT (Toshiba Exceria Pro SDXC 64 GB UHS-II) | |
| Schenker XMG P507 PRO (Toshiba Exceria Pro SDXC 64 GB UHS-II) | |
| Acer Aspire VN7-593G-73HP V15 Nitro BE | |
| MSI GS63VR 7RF-228US (Toshiba Exceria Pro SDXC 64 GB UHS-II) | |
| |||||||||||||||||||||||||
Brightness Distribution: 87 %
Center on Battery: 301 cd/m²
Contrast: 941:1 (Black: 0.32 cd/m²)
ΔE ColorChecker Calman: 6.21 | ∀{0.5-29.43 Ø4.73}
ΔE Greyscale Calman: 6.08 | ∀{0.09-98 Ø4.97}
84% sRGB (Argyll 1.6.3 3D)
55% AdobeRGB 1998 (Argyll 1.6.3 3D)
61.8% AdobeRGB 1998 (Argyll 3D)
84.6% sRGB (Argyll 3D)
64.8% Display P3 (Argyll 3D)
Gamma: 2.31
CCT: 7375 K
| Gigabyte P56XT LG Philips LP156WF6 (LGD046F), 1920x1080 | Acer Predator 15 G9-593-751X LG Philips LP156WF6-SPP1 (LGD04D5), 1920x1080 | Schenker XMG P507 PRO AUO B156HTN05.2 (AUO52ED), 1920x1080 | MSI GS63VR 7RF-228US 3840x2160 | Acer Aspire VN7-593G-73HP V15 Nitro BE LG Display LP156WF6-SPP1, 1920x1080 | Gigabyte Aero 15 N156HCA-EA1 (CMN15D7), 1920x1080 | |
|---|---|---|---|---|---|---|
| Display | 1% | 4% | -20% | 1% | 6% | |
| Display P3 Coverage (%) | 64.8 | 65.4 1% | 66.4 2% | 48.21 -26% | 65.8 2% | 65.2 1% |
| sRGB Coverage (%) | 84.6 | 85.5 1% | 88.9 5% | 72.6 -14% | 85.1 1% | 92.5 9% |
| AdobeRGB 1998 Coverage (%) | 61.8 | 62.5 1% | 65.1 5% | 49.81 -19% | 62.2 1% | 66.5 8% |
| Response Times | -2% | 44% | 15% | -24% | -22% | |
| Response Time Grey 50% / Grey 80% * (ms) | 37.2 ? | 36 ? 3% | 24 ? 35% | 28 ? 25% | 41 ? -10% | 42.8 ? -15% |
| Response Time Black / White * (ms) | 24.8 ? | 26.4 ? -6% | 12 ? 52% | 23.6 ? 5% | 34 ? -37% | 32 ? -29% |
| PWM Frequency (Hz) | 20000 ? | 20830 ? | 1351 ? | 26000 ? | ||
| Screen | 6% | -19% | -23% | 9% | 6% | |
| Brightness middle (cd/m²) | 301 | 295 -2% | 357 19% | 274.2 -9% | 322 7% | 320 6% |
| Brightness (cd/m²) | 280 | 274 -2% | 365 30% | 263 -6% | 297 6% | 316 13% |
| Brightness Distribution (%) | 87 | 88 1% | 85 -2% | 92 6% | 86 -1% | 90 3% |
| Black Level * (cd/m²) | 0.32 | 0.32 -0% | 0.5 -56% | 0.44 -38% | 0.31 3% | 0.36 -13% |
| Contrast (:1) | 941 | 922 -2% | 714 -24% | 623 -34% | 1039 10% | 889 -6% |
| Colorchecker dE 2000 * | 6.21 | 4.59 26% | 9.93 -60% | 8 -29% | 4.73 24% | 4.62 26% |
| Colorchecker dE 2000 max. * | 10.78 | 11 -2% | 14.87 -38% | 14.6 -35% | 12.37 -15% | 9.75 10% |
| Greyscale dE 2000 * | 6.08 | 4.03 34% | 10.32 -70% | 9.1 -50% | 2.99 51% | 6 1% |
| Gamma | 2.31 95% | 2.3 96% | 2.11 104% | 2.24 98% | 2.32 95% | 2.46 89% |
| CCT | 7375 88% | 7229 90% | 10096 64% | 5020 129% | 6905 94% | 6761 96% |
| Color Space (Percent of AdobeRGB 1998) (%) | 55 | 56 2% | 58 5% | 45.7 -17% | 56 2% | 60 9% |
| Color Space (Percent of sRGB) (%) | 84 | 85 1% | 89 6% | 72.1 -14% | 85 1% | 92 10% |
| Total Average (Program / Settings) | 2% /
4% | 10% /
-6% | -9% /
-17% | -5% /
3% | -3% /
2% |
* ... smaller is better
Display Response Times
| ↔ Response Time Black to White | ||
|---|---|---|
| 24.8 ms ... rise ↗ and fall ↘ combined | ↗ 14 ms rise | 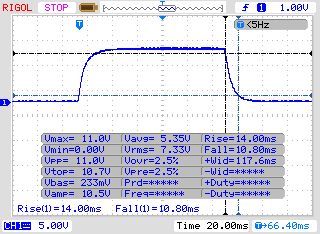 |
| ↘ 10.8 ms fall | ||
| The screen shows good response rates in our tests, but may be too slow for competitive gamers. In comparison, all tested devices range from 0.1 (minimum) to 240 (maximum) ms. » 58 % of all devices are better. This means that the measured response time is worse than the average of all tested devices (19.9 ms). | ||
| ↔ Response Time 50% Grey to 80% Grey | ||
| 37.2 ms ... rise ↗ and fall ↘ combined | ↗ 18.4 ms rise | 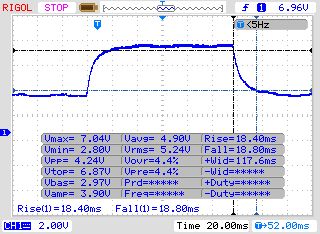 |
| ↘ 18.8 ms fall | ||
| The screen shows slow response rates in our tests and will be unsatisfactory for gamers. In comparison, all tested devices range from 0.165 (minimum) to 636 (maximum) ms. » 54 % of all devices are better. This means that the measured response time is worse than the average of all tested devices (31.1 ms). | ||
Screen Flickering / PWM (Pulse-Width Modulation)
| Screen flickering / PWM detected | 20000 Hz | ≤ 95 % brightness setting | 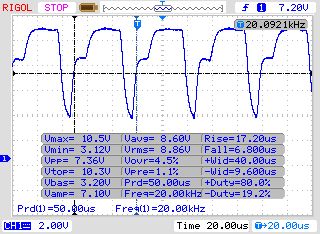 |
The display backlight flickers at 20000 Hz (worst case, e.g., utilizing PWM) Flickering detected at a brightness setting of 95 % and below. There should be no flickering or PWM above this brightness setting. The frequency of 20000 Hz is quite high, so most users sensitive to PWM should not notice any flickering. In comparison: 52 % of all tested devices do not use PWM to dim the display. If PWM was detected, an average of 7810 (minimum: 5 - maximum: 343500) Hz was measured. | |||
| PCMark 8 | |
| Home Score Accelerated v2 | |
| Acer Predator 15 G9-593-751X | |
| Schenker XMG P507 PRO | |
| Gigabyte Aero 15 | |
| Gigabyte P56XT | |
| MSI GS63VR 7RF-228US | |
| Work Score Accelerated v2 | |
| Acer Predator 15 G9-593-751X | |
| Gigabyte Aero 15 | |
| MSI GS63VR 7RF-228US | |
| Gigabyte P56XT | |
| Schenker XMG P507 PRO | |
| PCMark 10 - Score | |
| Gigabyte P56XT | |
| PCMark 8 Home Score Accelerated v2 | 4239 points | |
| PCMark 8 Work Score Accelerated v2 | 5261 points | |
| PCMark 10 Score | 5021 points | |
Help | ||
| Gigabyte P56XT LiteOn CX2-8B256 | Asus Zephyrus GX501 Samsung SSD SM961 1TB M.2 MZVKW1T0HMLH | Schenker XMG A517 Samsung SSD 960 Evo 500GB m.2 NVMe | |
|---|---|---|---|
| CrystalDiskMark 5.2 / 6 | 19% | 43% | |
| Read Seq Q32T1 (MB/s) | 2445 | 3445 41% | 3389 39% |
| Write Seq Q32T1 (MB/s) | 790 | 1848 134% | 1706 116% |
| Read 4K Q32T1 (MB/s) | 588 | 547 -7% | 627 7% |
| Write 4K Q32T1 (MB/s) | 455.5 | 463 2% | 591 30% |
| Read Seq (MB/s) | 1881 | 954 -49% | 1856 -1% |
| Write Seq (MB/s) | 797 | 1049 32% | 1652 107% |
| Read 4K (MB/s) | 46.69 | 45 -4% | 49 5% |
| Write 4K (MB/s) | 142.5 | 149 5% | 196 38% |

| 3DMark - 1920x1080 Fire Strike Graphics | |
| Acer Predator 15 G9-593-751X | |
| Schenker XMG P507 PRO | |
| Gigabyte P56XT | |
| Acer Aspire VN7-593G-73HP V15 Nitro BE | |
| MSI GS63VR 7RF-228US | |
| Gigabyte Aero 15 | |
| 3DMark 11 - 1280x720 Performance GPU | |
| Acer Predator 15 G9-593-751X | |
| Schenker XMG P507 PRO | |
| Gigabyte P56XT | |
| Acer Aspire VN7-593G-73HP V15 Nitro BE | |
| MSI GS63VR 7RF-228US | |
| Gigabyte Aero 15 | |
| Unigine Heaven 4.0 - Extreme Preset DX11 | |
| Schenker XMG P507 PRO | |
| Gigabyte P56XT | |
| Gigabyte Aero 15 | |
| 3DMark 11 Performance | 15625 points | |
| 3DMark Ice Storm Standard Score | 109939 points | |
| 3DMark Cloud Gate Standard Score | 26099 points | |
| 3DMark Fire Strike Score | 13179 points | |
Help | ||
| low | med. | high | ultra | |
|---|---|---|---|---|
| The Witcher 3 (2015) | 90.8 | 50.2 | ||
| Star Wars Battlefront (2015) | 120 | 109 | ||
| Assassin's Creed Syndicate (2015) | 81.6 | 39.7 | ||
| Rainbow Six Siege (2015) | 162 | 141 | ||
| Mass Effect Andromeda (2017) | 70.1 | 60.4 | ||
| Warhammer 40.000: Dawn of War III (2017) | 81.6 | 78.4 | ||
| Rocket League (2017) | 200 | |||
| Dirt 4 (2017) | 129 | 76.6 | ||
| Playerunknown's Battlegrounds (PUBG) (2017) | 75.2 | 70 |
Noise level
| Idle |
| 34 / 35 / 39 dB(A) |
| DVD |
| 42 / dB(A) |
| Load |
| 39 / 49 dB(A) |
 | ||
30 dB silent 40 dB(A) audible 50 dB(A) loud |
||
min: | ||
| Gigabyte P56XT i7-7700HQ, GeForce GTX 1070 Mobile | Acer Predator 15 G9-593-751X i7-7700HQ, GeForce GTX 1070 Mobile | Schenker XMG P507 PRO i7-7700HQ, GeForce GTX 1070 Mobile | MSI GS63VR 7RF-228US i7-7700HQ, GeForce GTX 1060 Mobile | Acer Aspire VN7-593G-73HP V15 Nitro BE i7-7700HQ, GeForce GTX 1060 Mobile | Gigabyte Aero 15 i7-7700HQ, GeForce GTX 1060 Mobile | |
|---|---|---|---|---|---|---|
| Noise | -0% | -6% | 5% | 7% | 4% | |
| off / environment * (dB) | 30 | 32 -7% | 31 -3% | 28.8 4% | 30.4 -1% | 31 -3% |
| Idle Minimum * (dB) | 34 | 34 -0% | 33 3% | 33.1 3% | 30.9 9% | 32 6% |
| Idle Average * (dB) | 35 | 36 -3% | 34 3% | 33.1 5% | 30.9 12% | 33 6% |
| Idle Maximum * (dB) | 39 | 38 3% | 44 -13% | 34 13% | 31.5 19% | 34 13% |
| Load Average * (dB) | 39 | 41 -5% | 46 -18% | 37.2 5% | 40.7 -4% | 39 -0% |
| Witcher 3 ultra * (dB) | 48 | 42 12% | 46.1 4% | 45.5 5% | 43 10% | |
| Load Maximum * (dB) | 49 | 50 -2% | 52 -6% | 47.1 4% | 43.9 10% | 50 -2% |
* ... smaller is better
(-) The maximum temperature on the upper side is 65 °C / 149 F, compared to the average of 40.4 °C / 105 F, ranging from 21.2 to 68.8 °C for the class Gaming.
(-) The bottom heats up to a maximum of 71 °C / 160 F, compared to the average of 43.2 °C / 110 F
(+) In idle usage, the average temperature for the upper side is 29.4 °C / 85 F, compared to the device average of 33.9 °C / 93 F.
(-) Playing The Witcher 3, the average temperature for the upper side is 45.7 °C / 114 F, compared to the device average of 33.9 °C / 93 F.
(+) The palmrests and touchpad are reaching skin temperature as a maximum (35 °C / 95 F) and are therefore not hot.
(-) The average temperature of the palmrest area of similar devices was 28.8 °C / 83.8 F (-6.2 °C / -11.2 F).
| Gigabyte P56XT i7-7700HQ, GeForce GTX 1070 Mobile | Acer Predator 15 G9-593-751X i7-7700HQ, GeForce GTX 1070 Mobile | Schenker XMG P507 PRO i7-7700HQ, GeForce GTX 1070 Mobile | MSI GS63VR 7RF-228US i7-7700HQ, GeForce GTX 1060 Mobile | Acer Aspire VN7-593G-73HP V15 Nitro BE i7-7700HQ, GeForce GTX 1060 Mobile | Gigabyte Aero 15 i7-7700HQ, GeForce GTX 1060 Mobile | |
|---|---|---|---|---|---|---|
| Heat | 28% | 9% | 10% | 16% | 19% | |
| Maximum Upper Side * (°C) | 65 | 42.3 35% | 49.2 24% | 51.9 20% | 56 14% | |
| Maximum Bottom * (°C) | 71 | 40.9 42% | 62 13% | 54.6 23% | 61 14% | |
| Idle Upper Side * (°C) | 35 | 28.4 19% | 32.4 7% | 28.4 19% | 29.1 17% | 25 29% |
| Idle Bottom * (°C) | 30 | 25.2 16% | 33 -10% | 29.6 1% | 29.3 2% | 24 20% |
* ... smaller is better
Gigabyte P56XT audio analysis
(±) | speaker loudness is average but good (81 dB)
Bass 100 - 315 Hz
(±) | reduced bass - on average 10.1% lower than median
(±) | linearity of bass is average (12.5% delta to prev. frequency)
Mids 400 - 2000 Hz
(±) | higher mids - on average 5.7% higher than median
(+) | mids are linear (3.4% delta to prev. frequency)
Highs 2 - 16 kHz
(+) | balanced highs - only 2.7% away from median
(+) | highs are linear (4.1% delta to prev. frequency)
Overall 100 - 16.000 Hz
(+) | overall sound is linear (13.8% difference to median)
Compared to same class
» 21% of all tested devices in this class were better, 7% similar, 72% worse
» The best had a delta of 6%, average was 18%, worst was 132%
Compared to all devices tested
» 15% of all tested devices were better, 4% similar, 81% worse
» The best had a delta of 4%, average was 24%, worst was 134%
Schenker XMG P507 PRO audio analysis
(±) | speaker loudness is average but good (75 dB)
Bass 100 - 315 Hz
(-) | nearly no bass - on average 20.2% lower than median
(±) | linearity of bass is average (7.6% delta to prev. frequency)
Mids 400 - 2000 Hz
(+) | balanced mids - only 2.2% away from median
(+) | mids are linear (5.9% delta to prev. frequency)
Highs 2 - 16 kHz
(+) | balanced highs - only 2.2% away from median
(+) | highs are linear (4.4% delta to prev. frequency)
Overall 100 - 16.000 Hz
(±) | linearity of overall sound is average (19.8% difference to median)
Compared to same class
» 69% of all tested devices in this class were better, 6% similar, 24% worse
» The best had a delta of 6%, average was 18%, worst was 132%
Compared to all devices tested
» 50% of all tested devices were better, 7% similar, 43% worse
» The best had a delta of 4%, average was 24%, worst was 134%
| Off / Standby | |
| Idle | |
| Load |
|
Key:
min: | |
| Gigabyte P56XT i7-7700HQ, GeForce GTX 1070 Mobile | Acer Predator 15 G9-593-751X i7-7700HQ, GeForce GTX 1070 Mobile | Schenker XMG P507 PRO i7-7700HQ, GeForce GTX 1070 Mobile | MSI GS63VR 7RF-228US i7-7700HQ, GeForce GTX 1060 Mobile | Acer Aspire VN7-593G-73HP V15 Nitro BE i7-7700HQ, GeForce GTX 1060 Mobile | Gigabyte Aero 15 i7-7700HQ, GeForce GTX 1060 Mobile | |
|---|---|---|---|---|---|---|
| Power Consumption | -21% | -4% | 3% | 26% | 14% | |
| Idle Minimum * (Watt) | 13 | 18 -38% | 14 -8% | 14.5 -12% | 7.2 45% | 12 8% |
| Idle Average * (Watt) | 17 | 23 -35% | 18 -6% | 17.3 -2% | 10.5 38% | 15 12% |
| Idle Maximum * (Watt) | 22 | 30 -36% | 24 -9% | 17.4 21% | 16 27% | 20 9% |
| Load Average * (Watt) | 85 | 89 -5% | 87 -2% | 93 -9% | 82 4% | 82 4% |
| Witcher 3 ultra * (Watt) | 154 | 168 -9% | 128.8 16% | 124 19% | 111 28% | |
| Load Maximum * (Watt) | 208 | 213 -2% | 201 3% | 155 25% | 161 23% |
* ... smaller is better
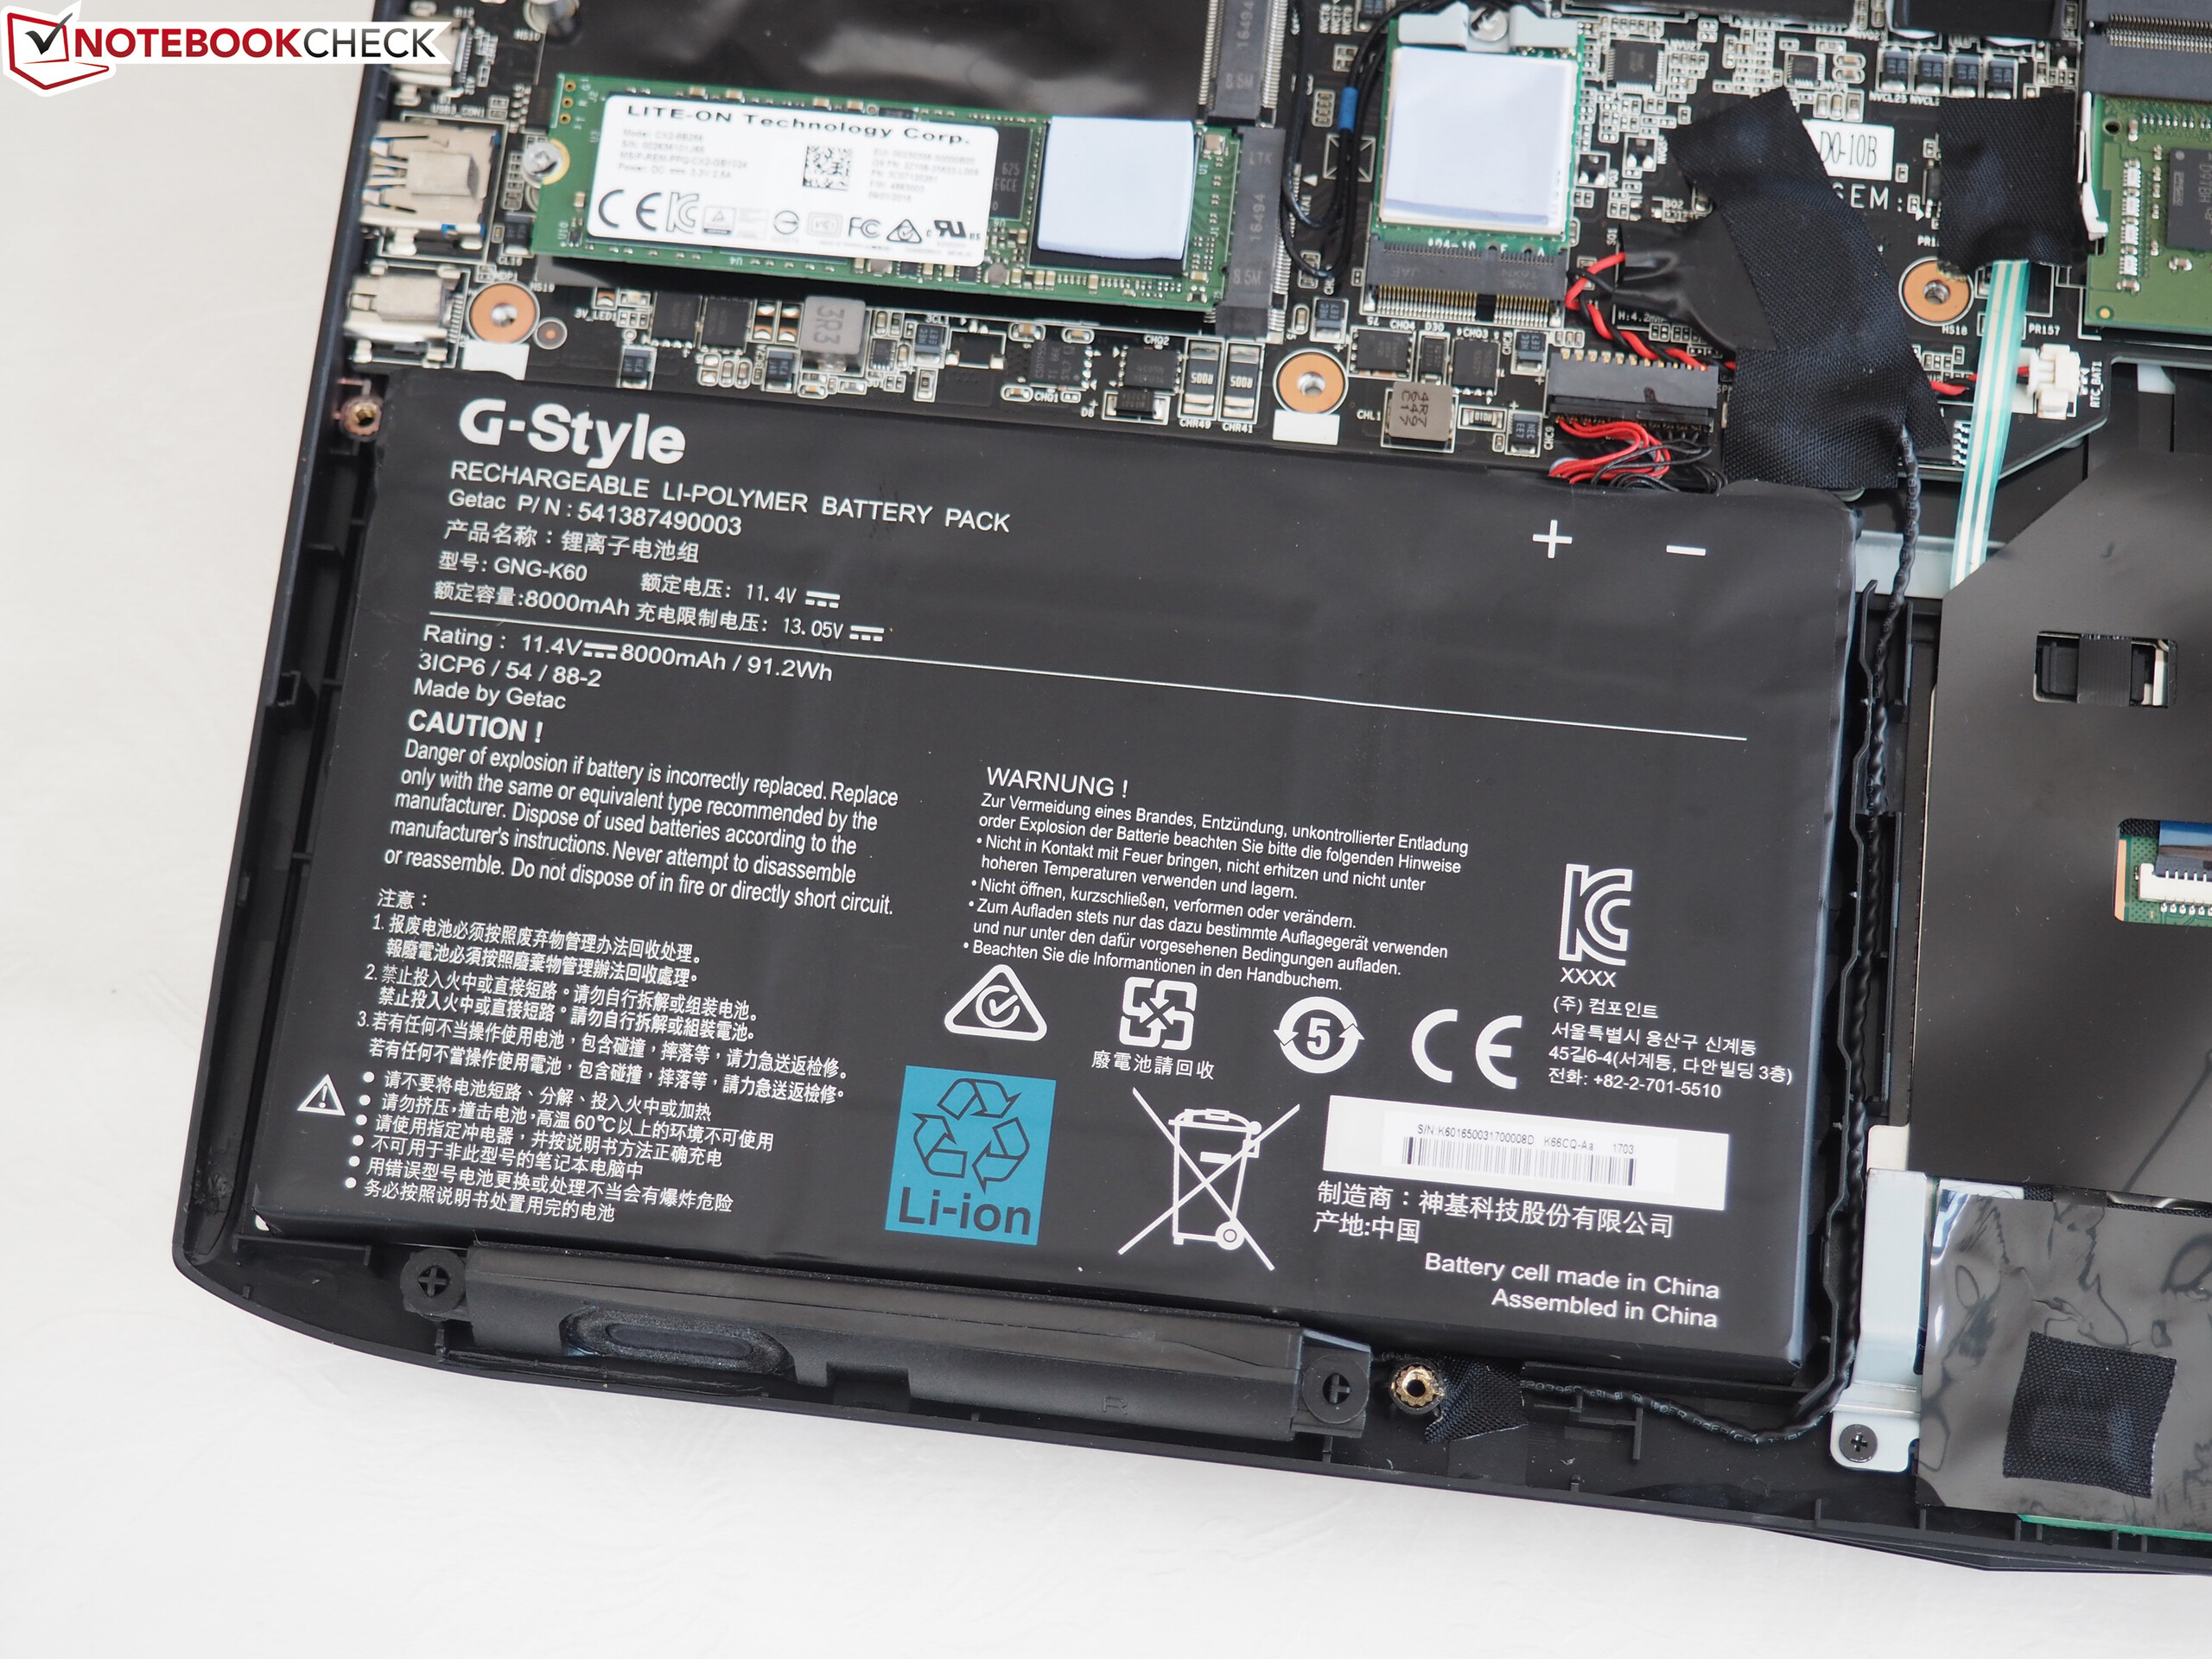
| Gigabyte P56XT i7-7700HQ, GeForce GTX 1070 Mobile, 91.2 Wh | Acer Predator 15 G9-593-751X i7-7700HQ, GeForce GTX 1070 Mobile, 90 Wh | Schenker XMG P507 PRO i7-7700HQ, GeForce GTX 1070 Mobile, 60 Wh | MSI GS63VR 7RF-228US i7-7700HQ, GeForce GTX 1060 Mobile, 65 Wh | Acer Aspire VN7-593G-73HP V15 Nitro BE i7-7700HQ, GeForce GTX 1060 Mobile, 69 Wh | Gigabyte Aero 15 i7-7700HQ, GeForce GTX 1060 Mobile, 94.24 Wh | |
|---|---|---|---|---|---|---|
| Battery runtime | -12% | -45% | -36% | 1% | 10% | |
| Reader / Idle (h) | 9.5 | 8.4 -12% | 6.4 -33% | 8.4 -12% | 10.6 12% | |
| H.264 (h) | 6.2 | 4.9 -21% | 3.6 -42% | 7.7 24% | ||
| WiFi v1.3 (h) | 6.4 | 5.5 -14% | 3.3 -48% | 3.9 -39% | 6 -6% | 7 9% |
| Load (h) | 2 | 2 0% | 1.3 -35% | 2.4 20% | 1.9 -5% |
Pros
Cons
除非我们搞明白我们的测试机是出现了故障还是冷却系统有问题,否则我们不能对P56XT进行最终评价。由于在3D测试期间,该15英寸游戏本达到了较高的显卡温度,所以机器的排放(系统噪声,温度)和性能(节流)都受到影响,目前意味着严重的失分。
假如没有这些问题,P56XT将是一个伟大的高端笔记本。除了优秀的电池续航,它在任何方面可能都不算非常出色 —— 但它提供了坚实的性能。
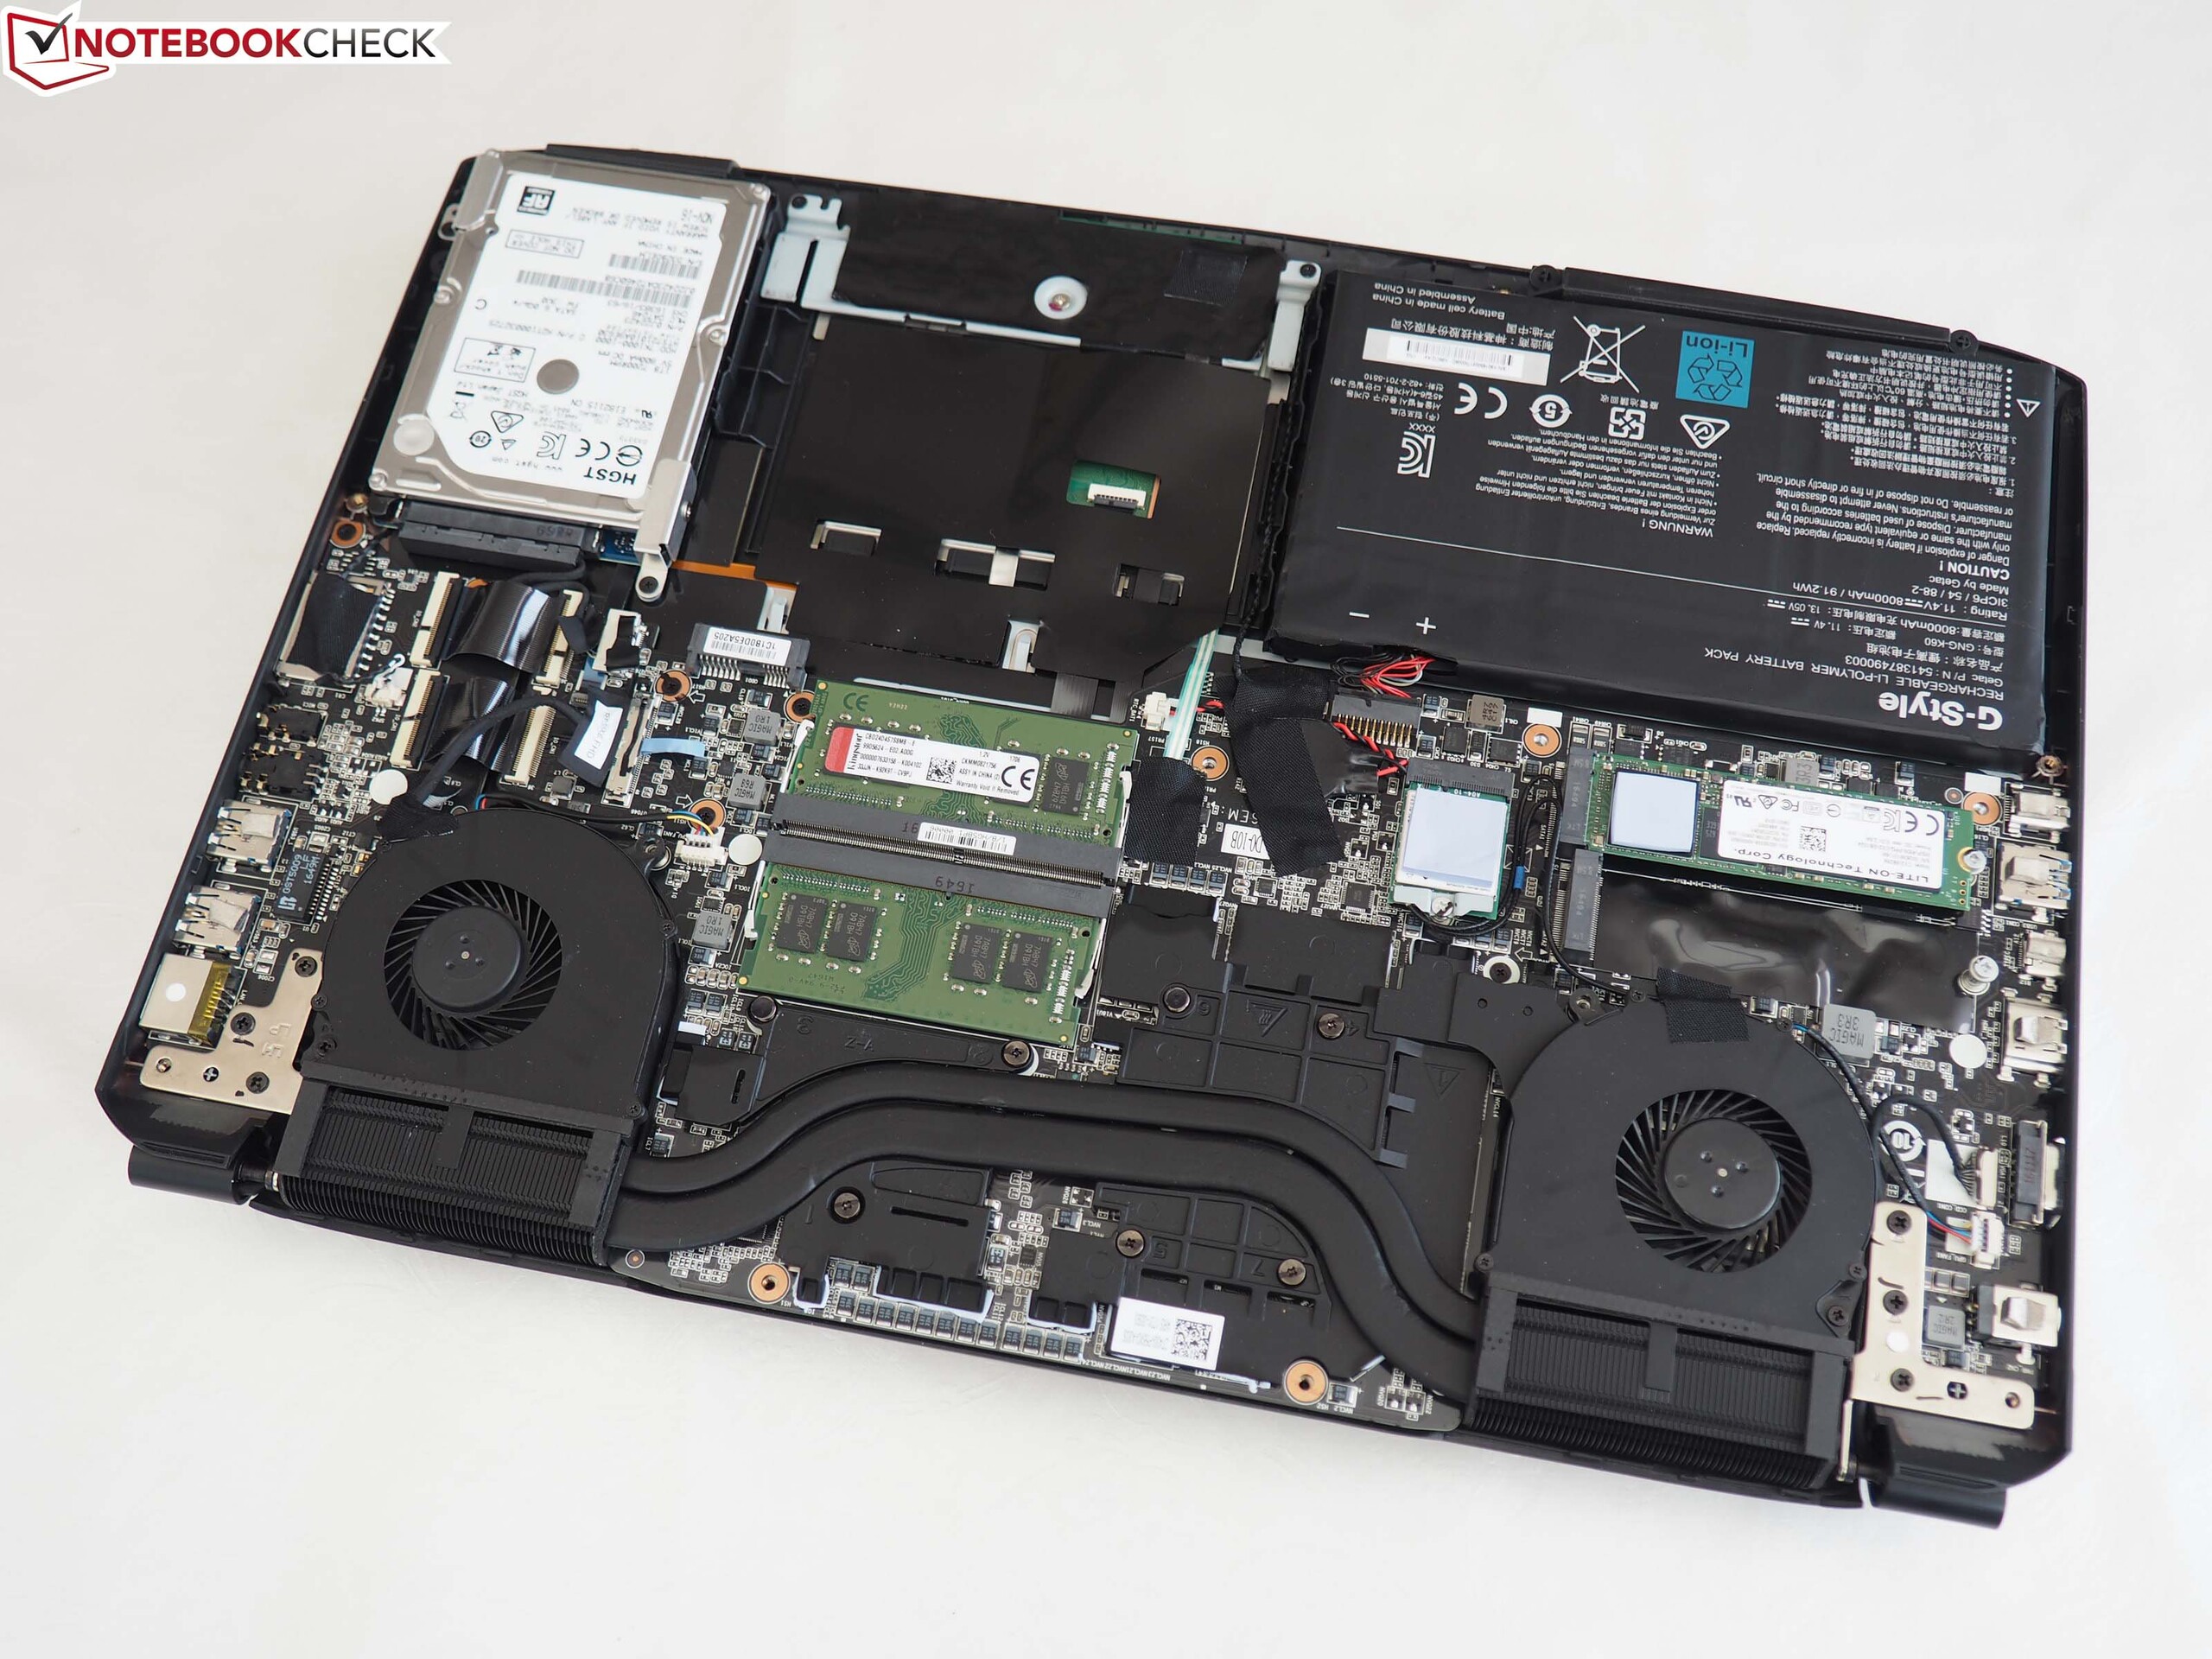
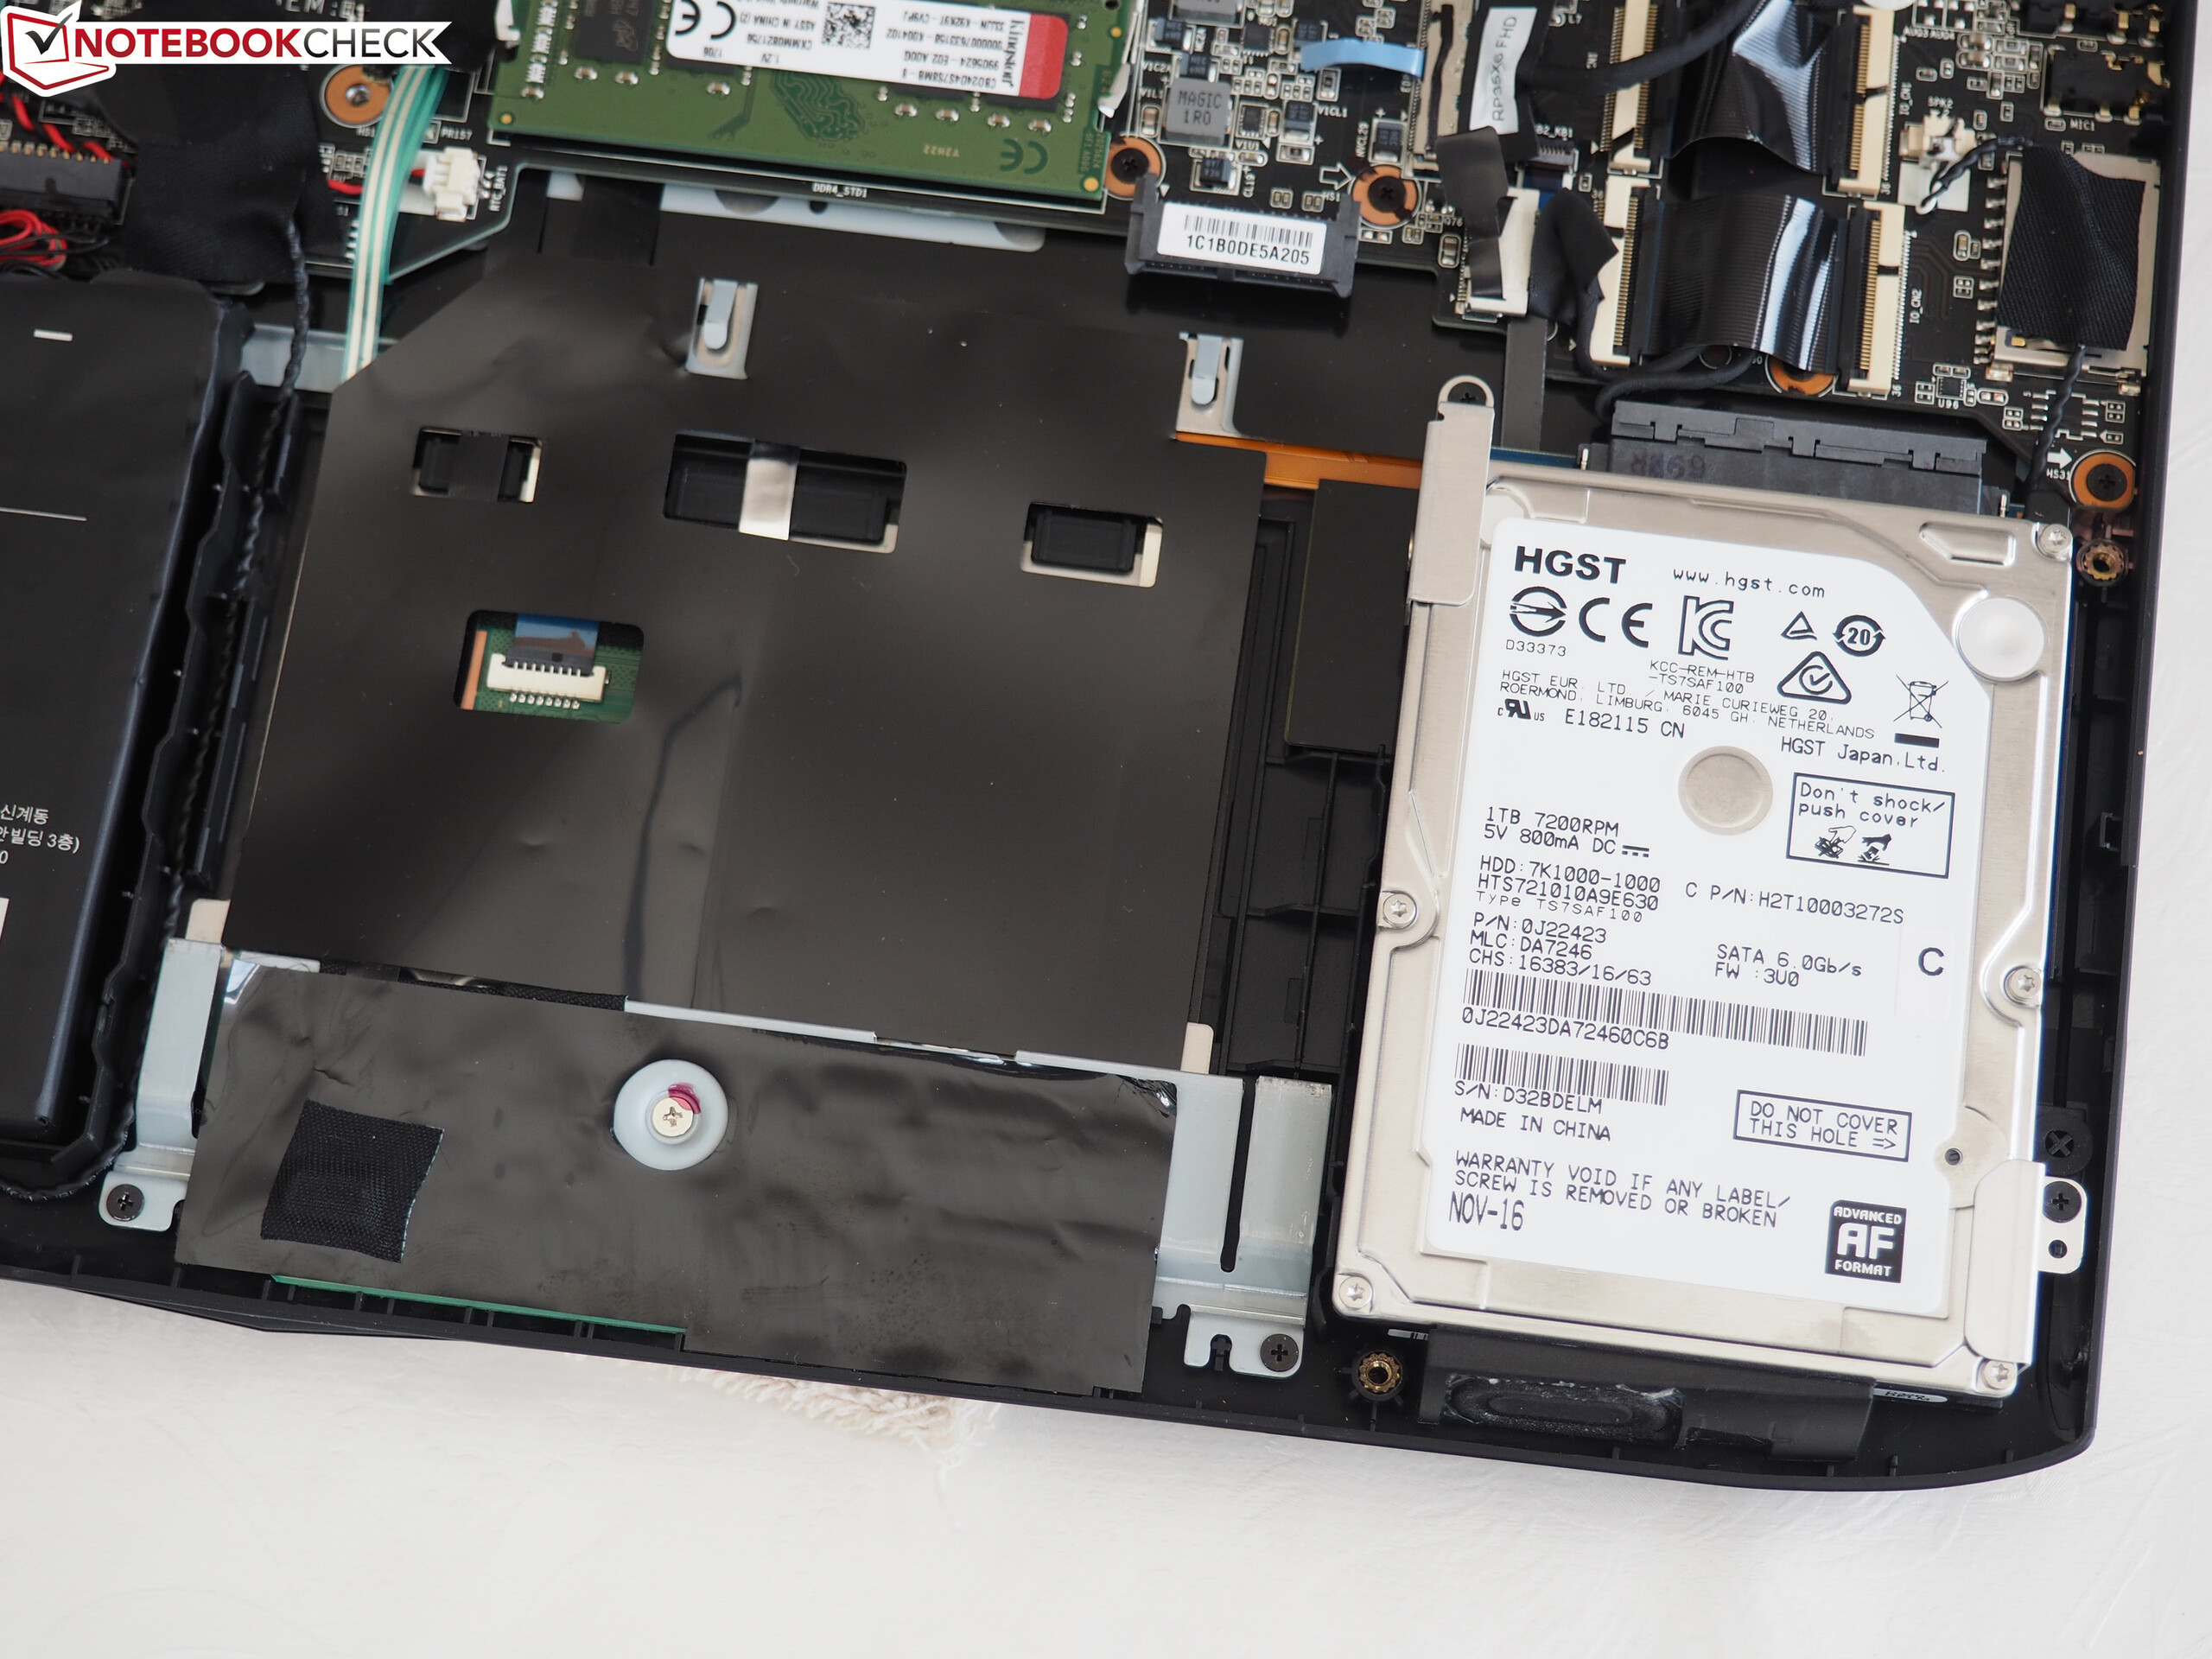
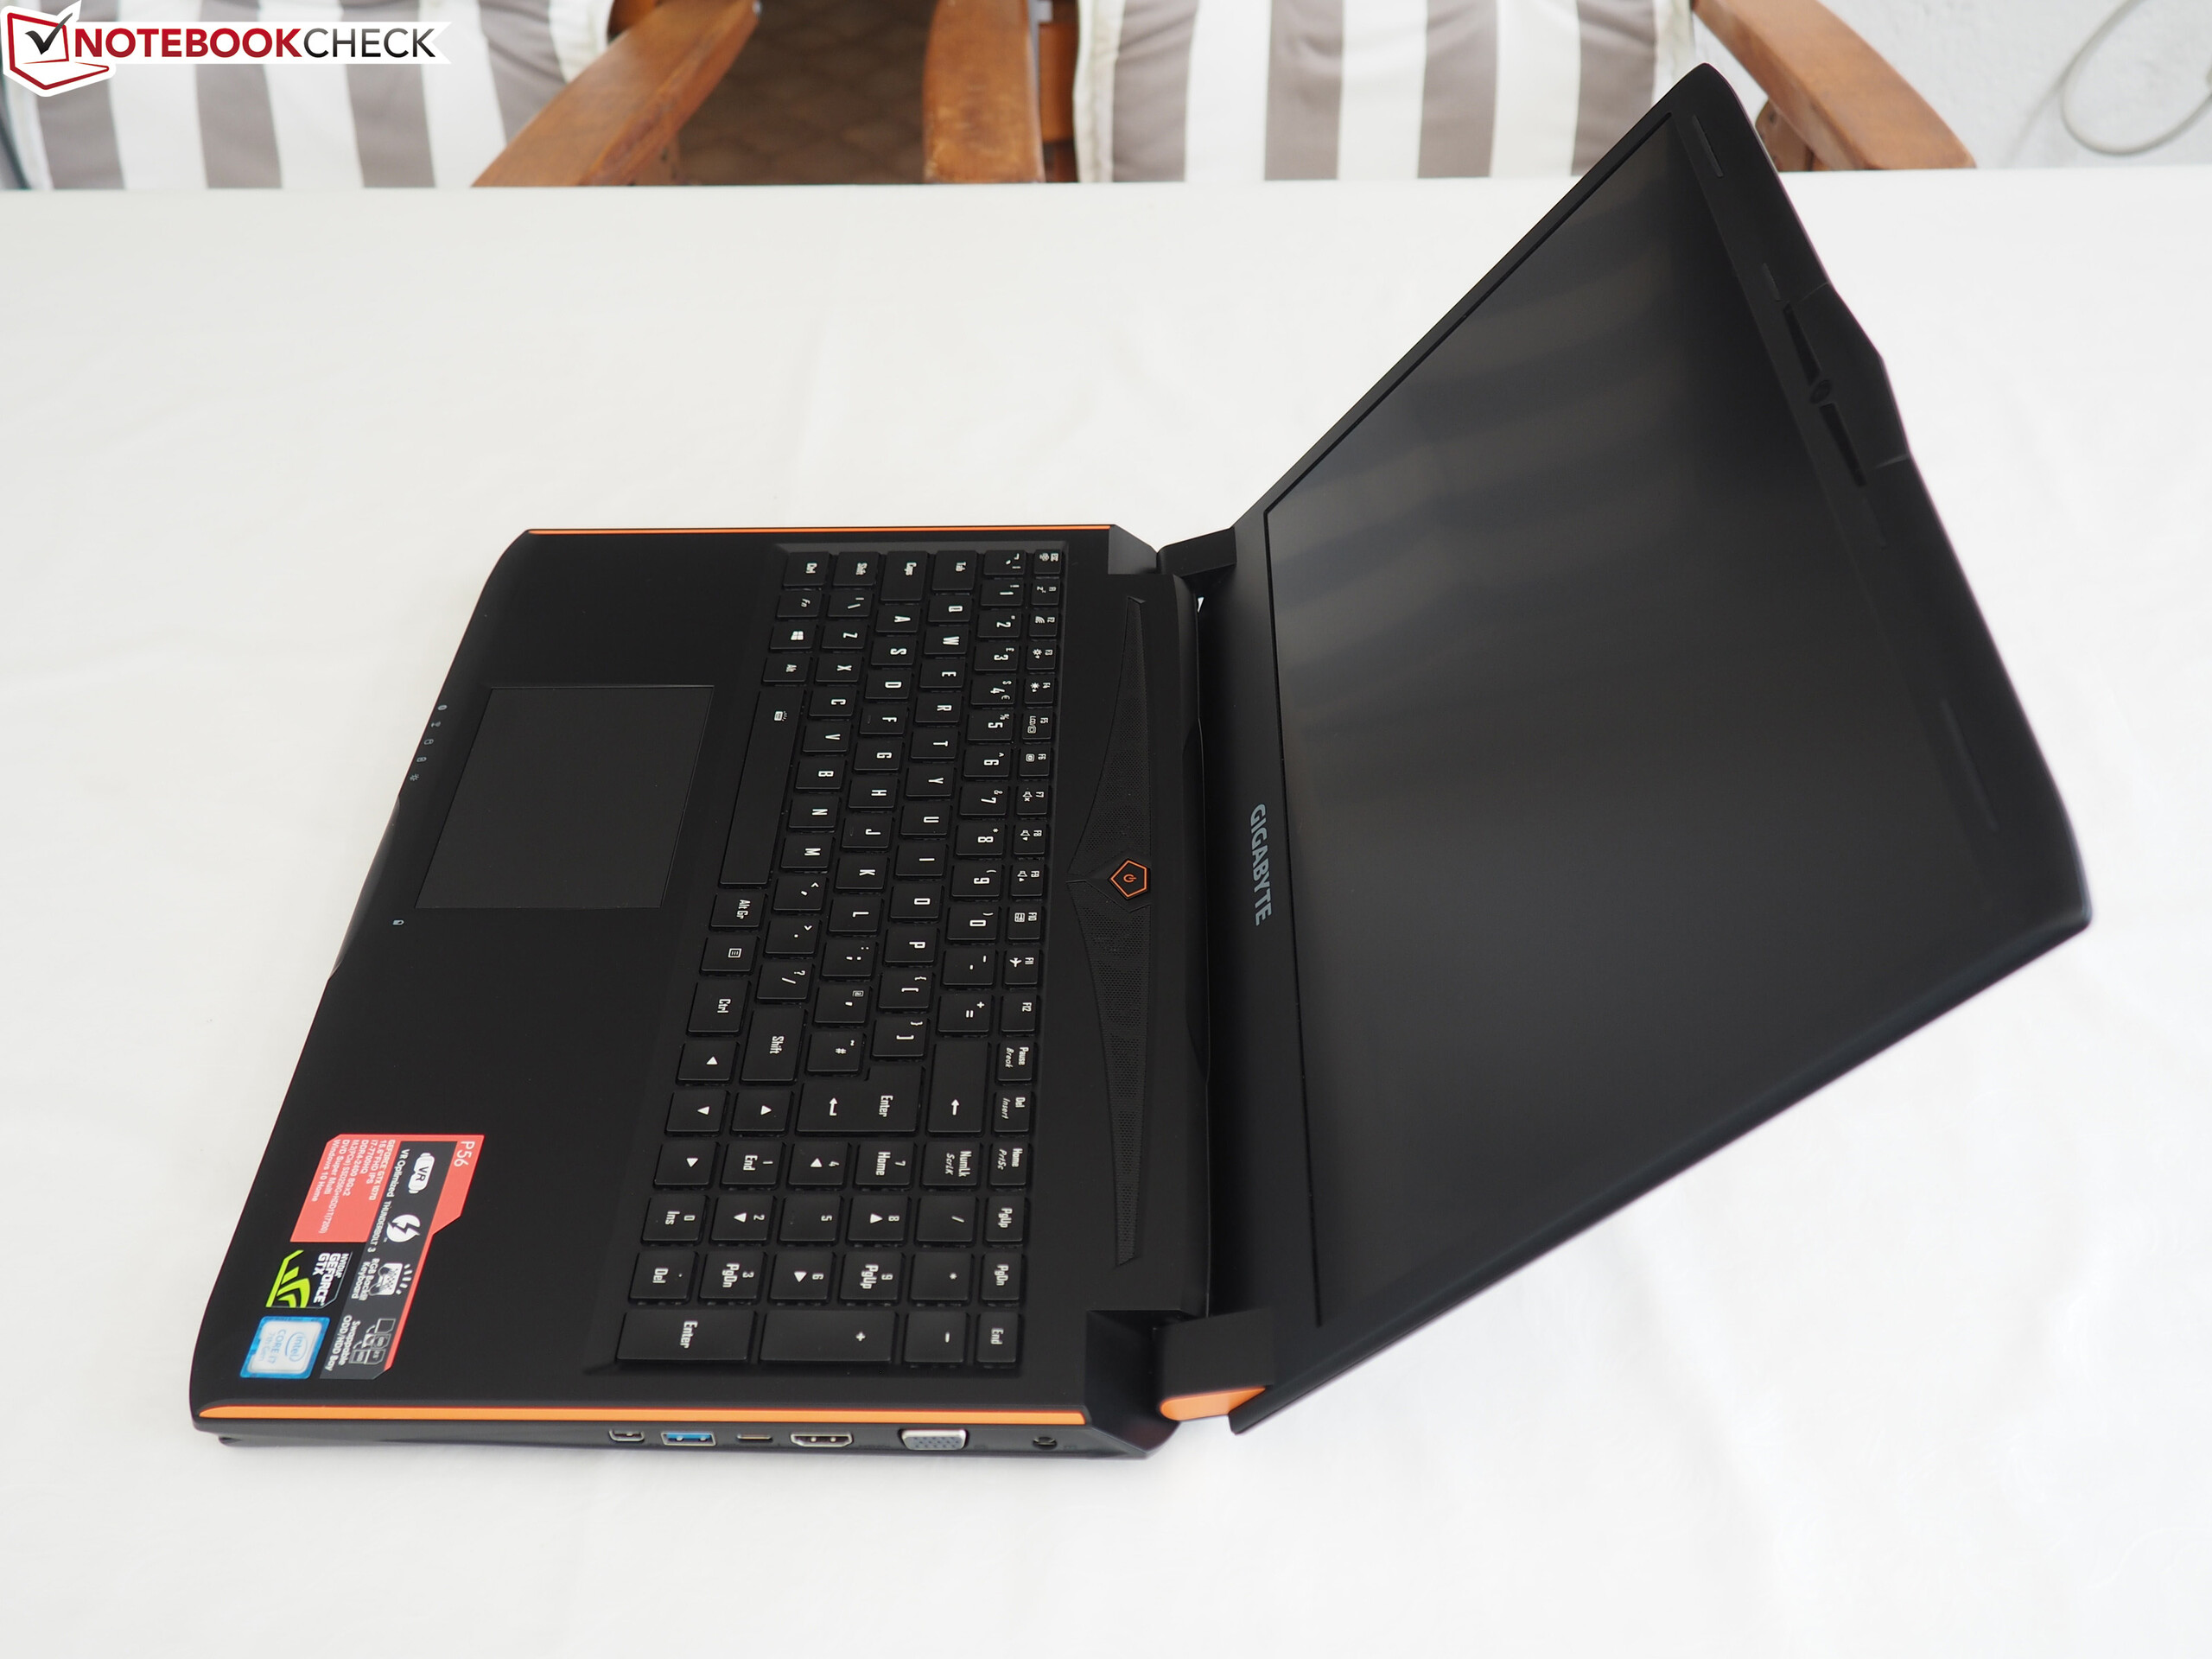
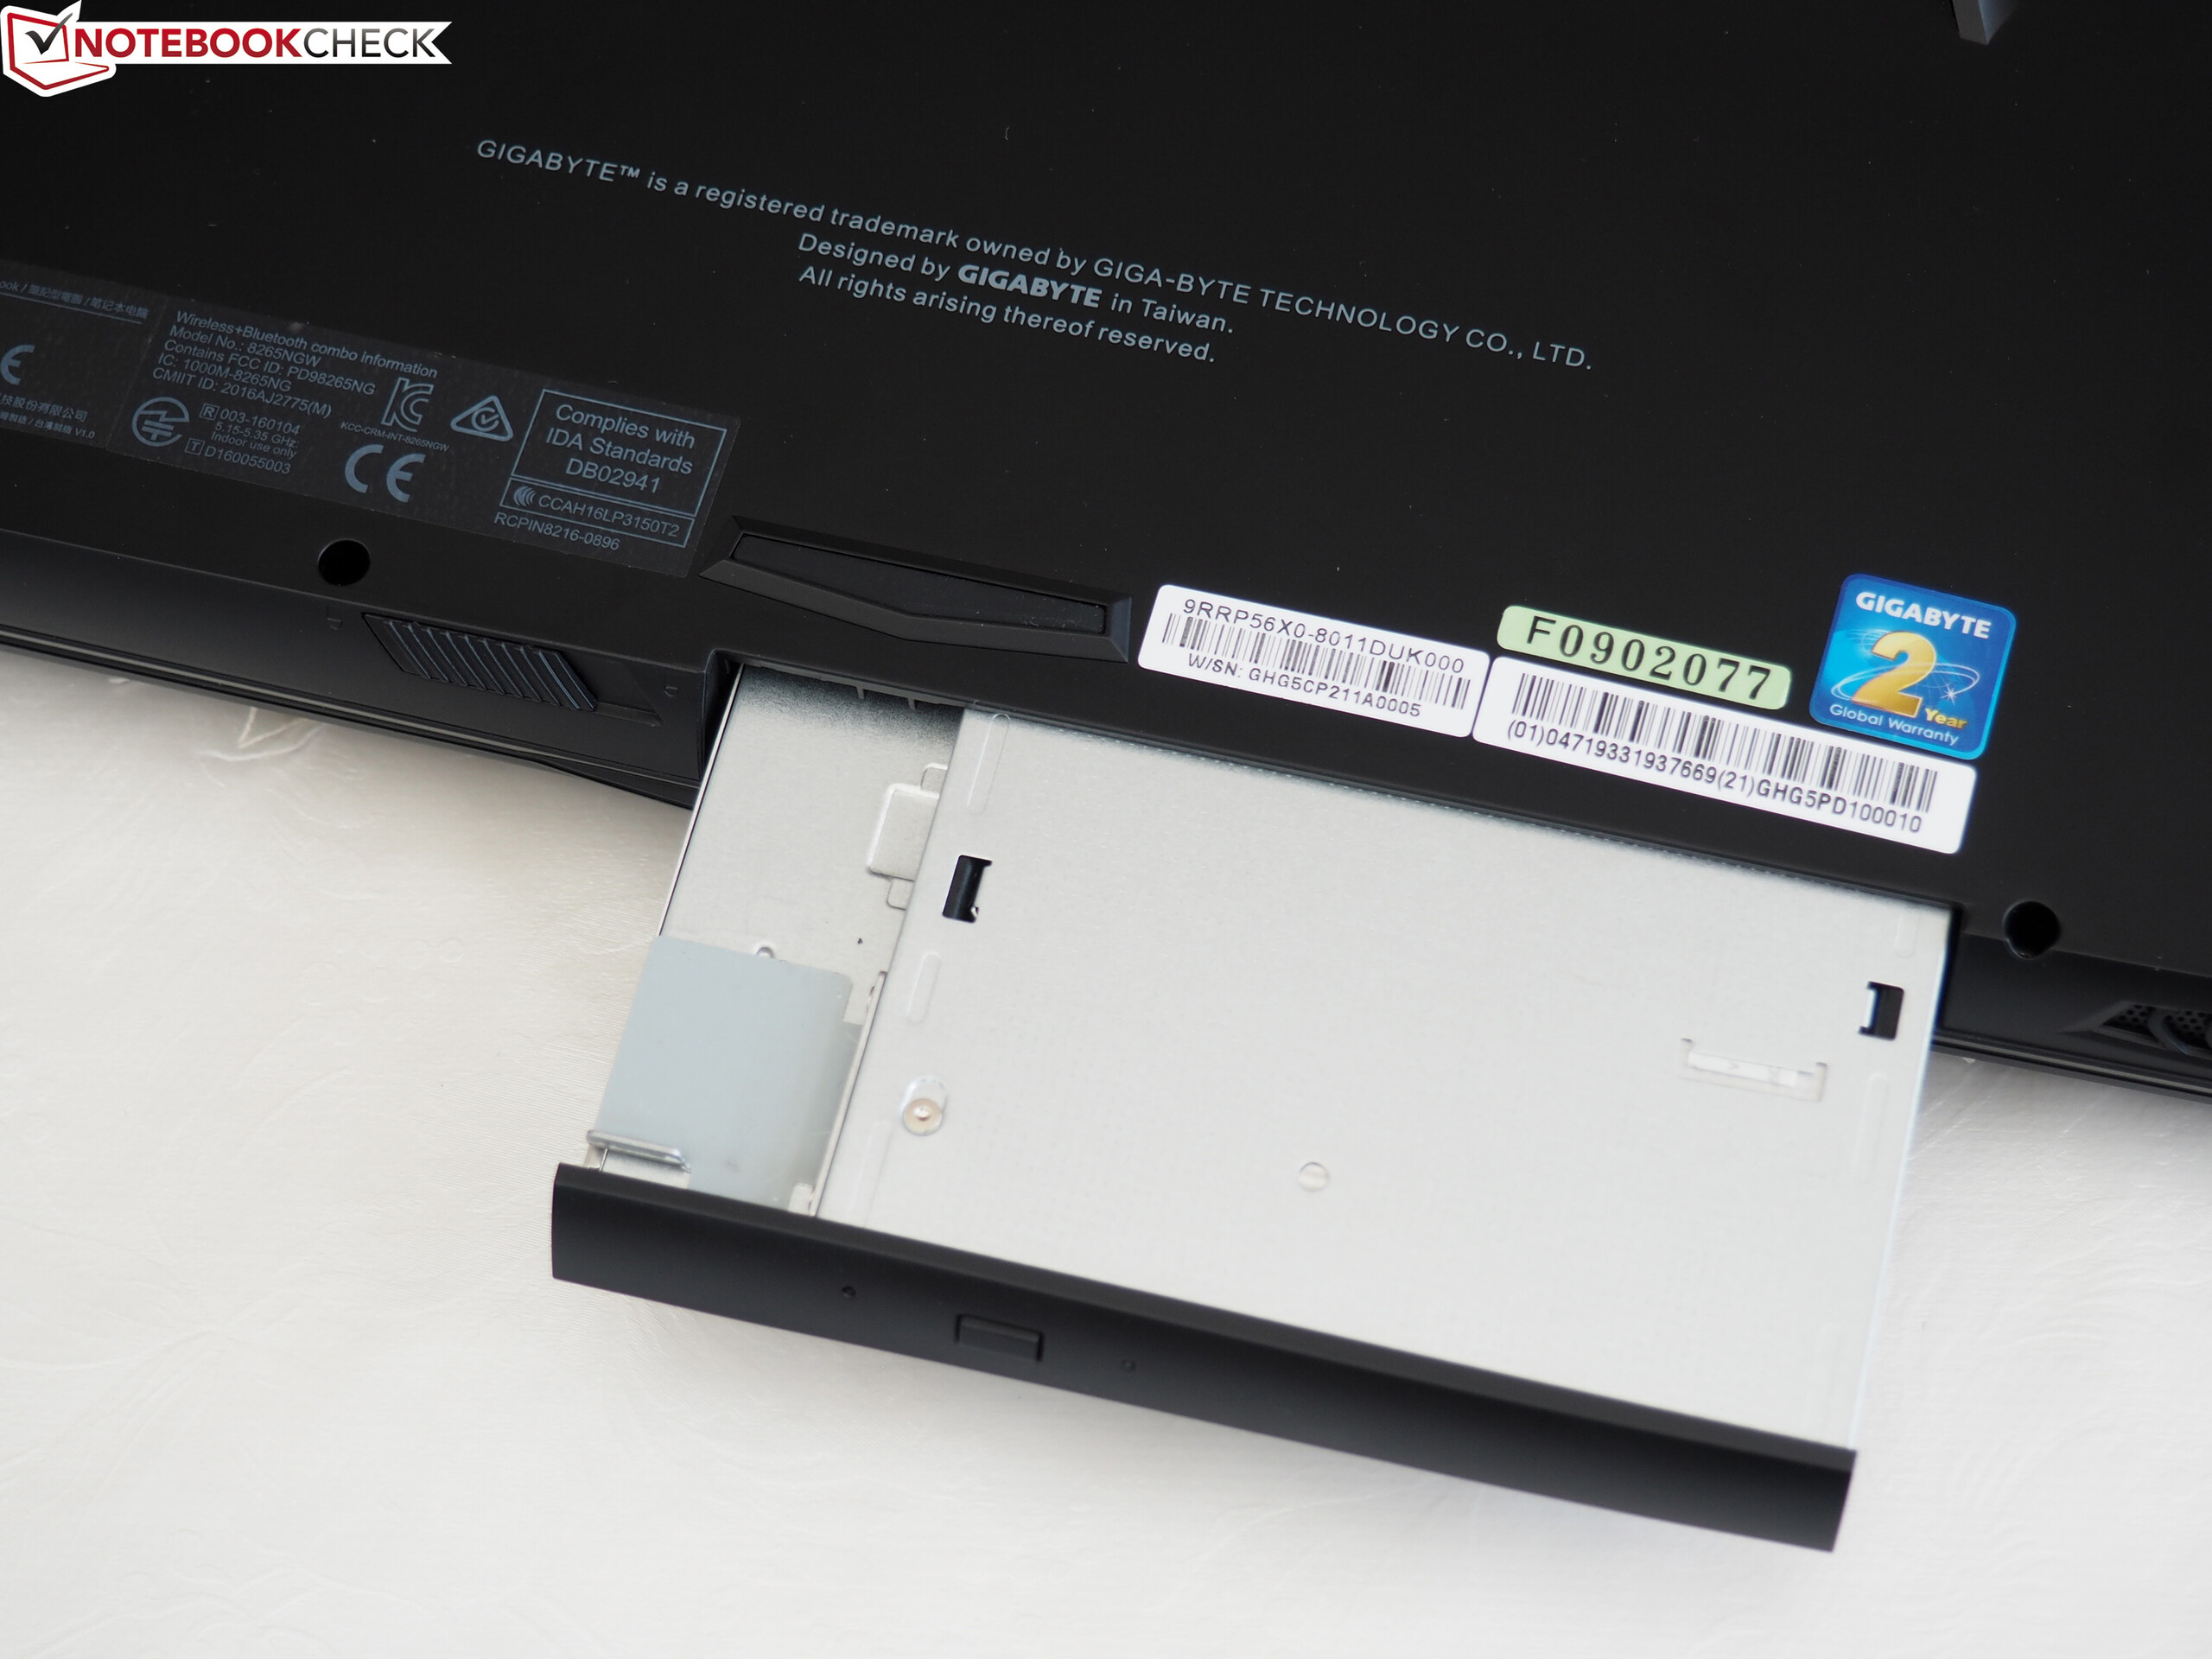
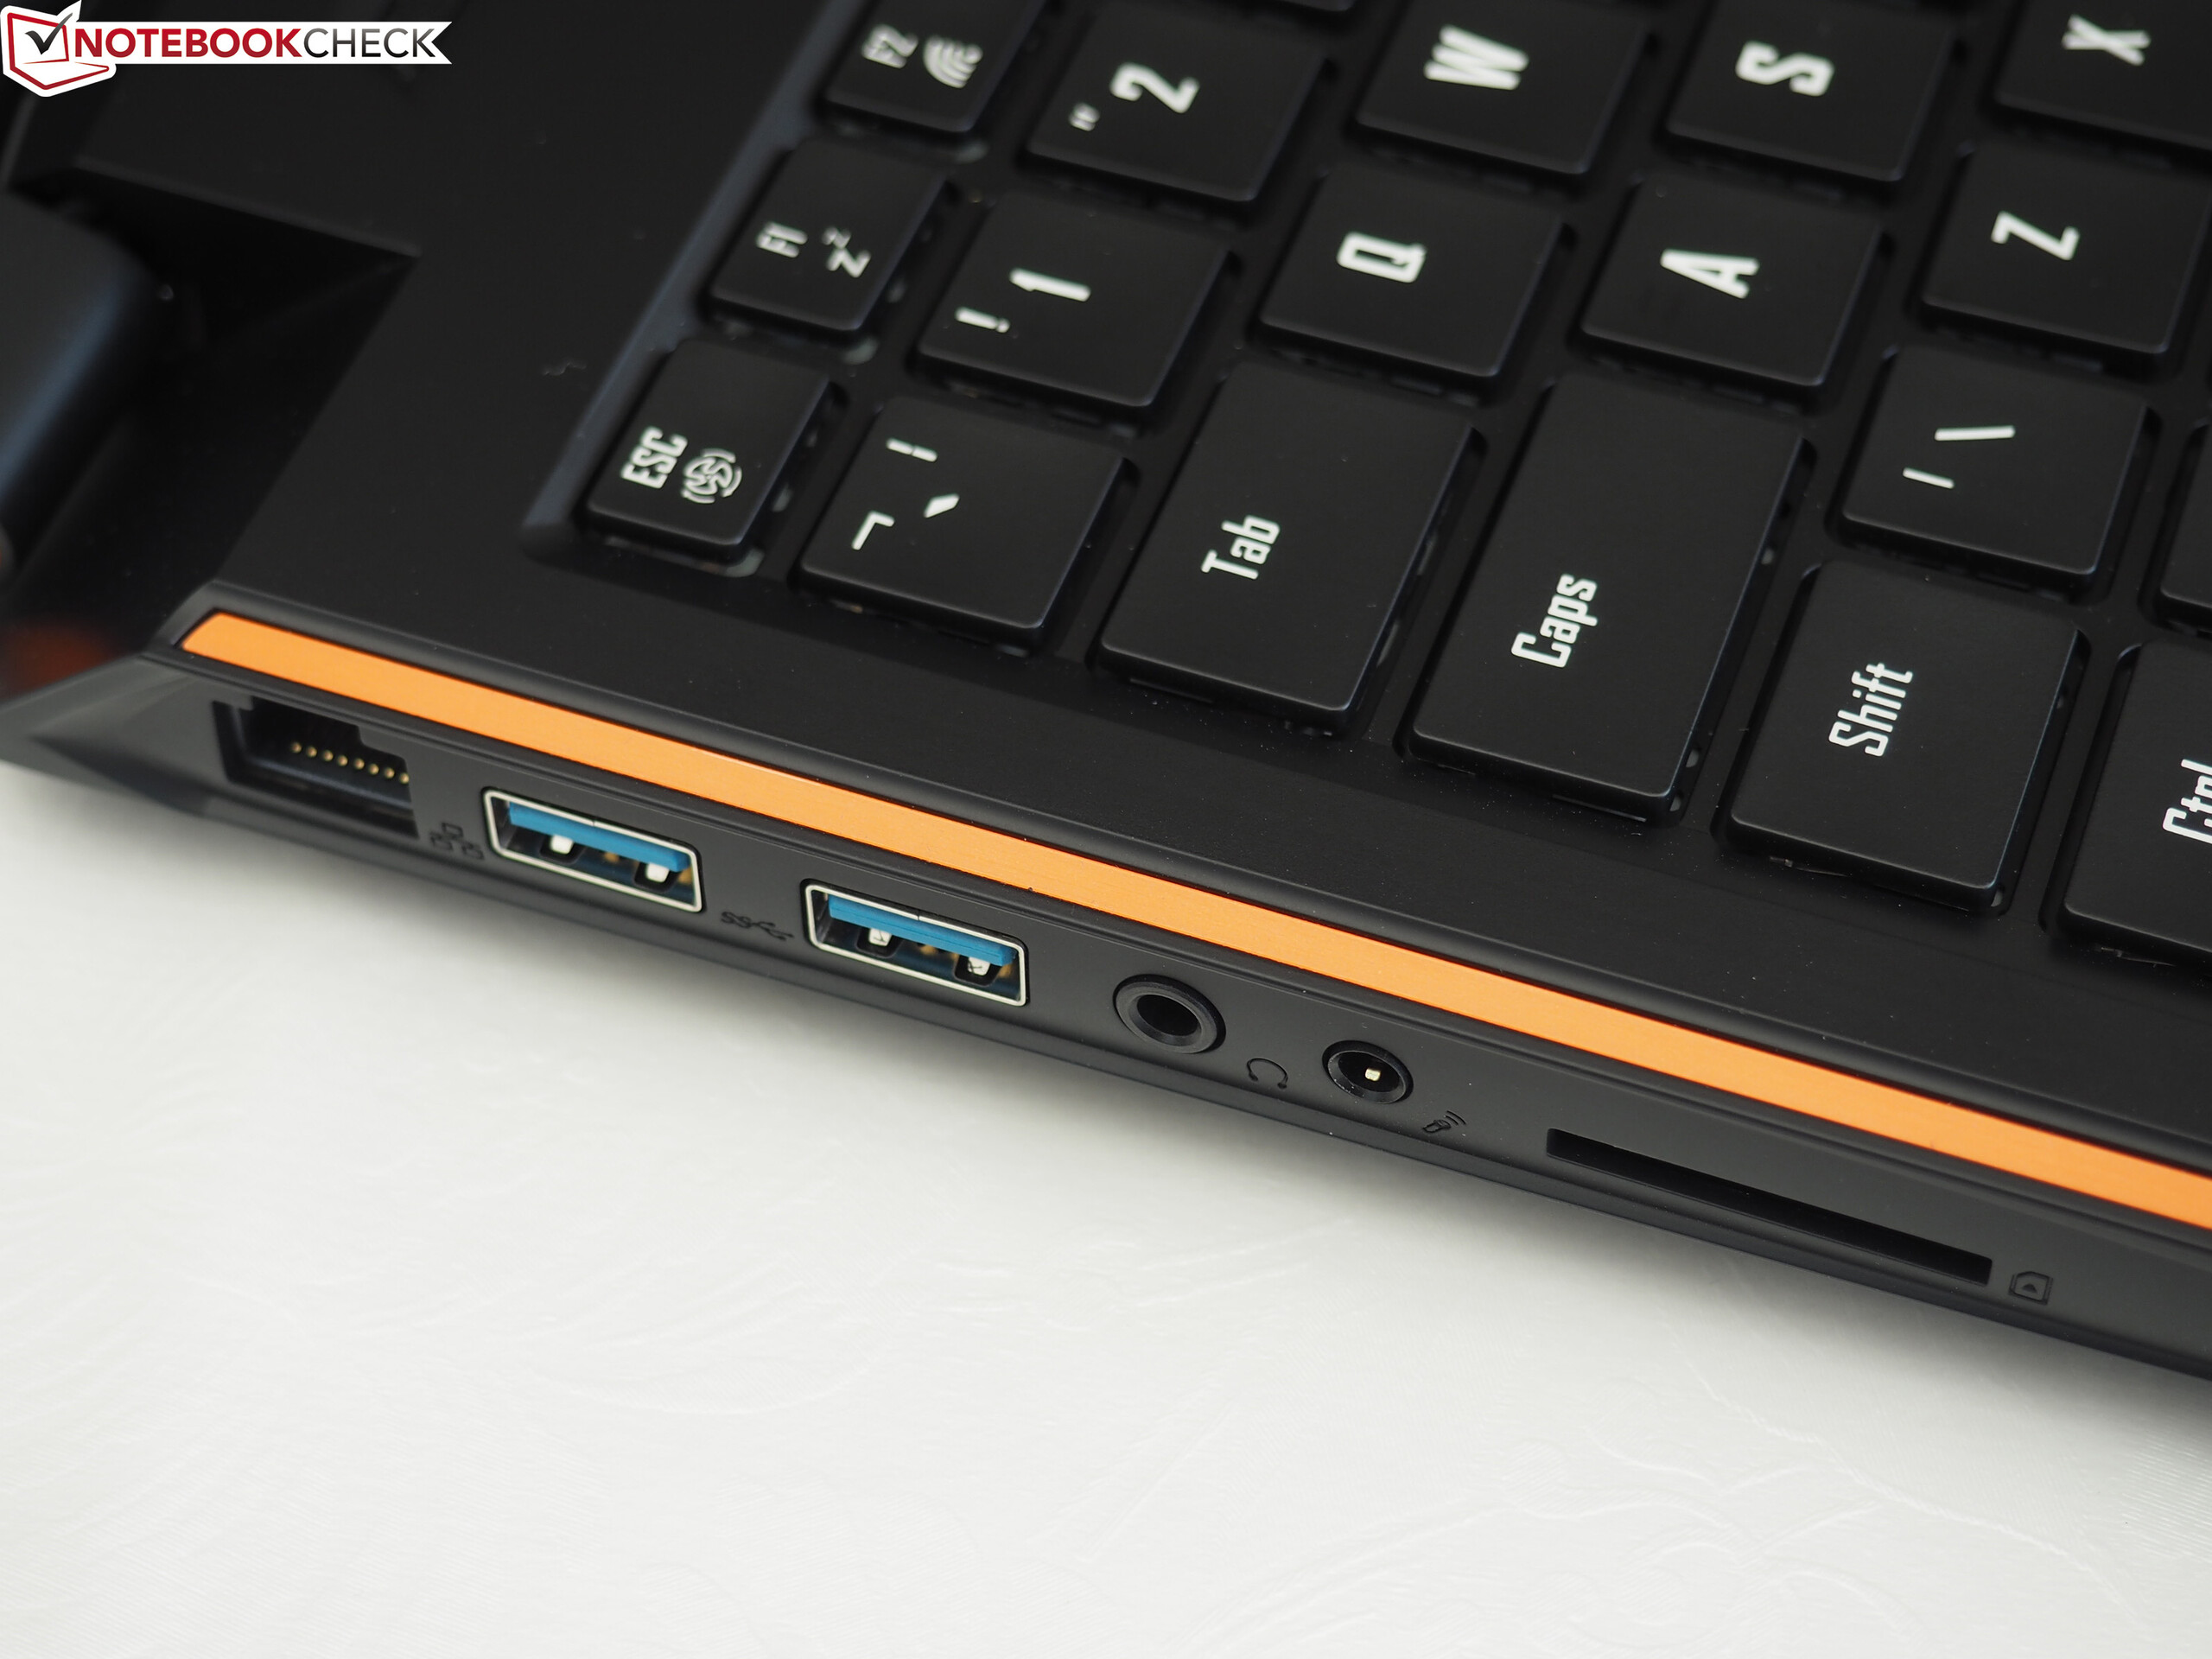
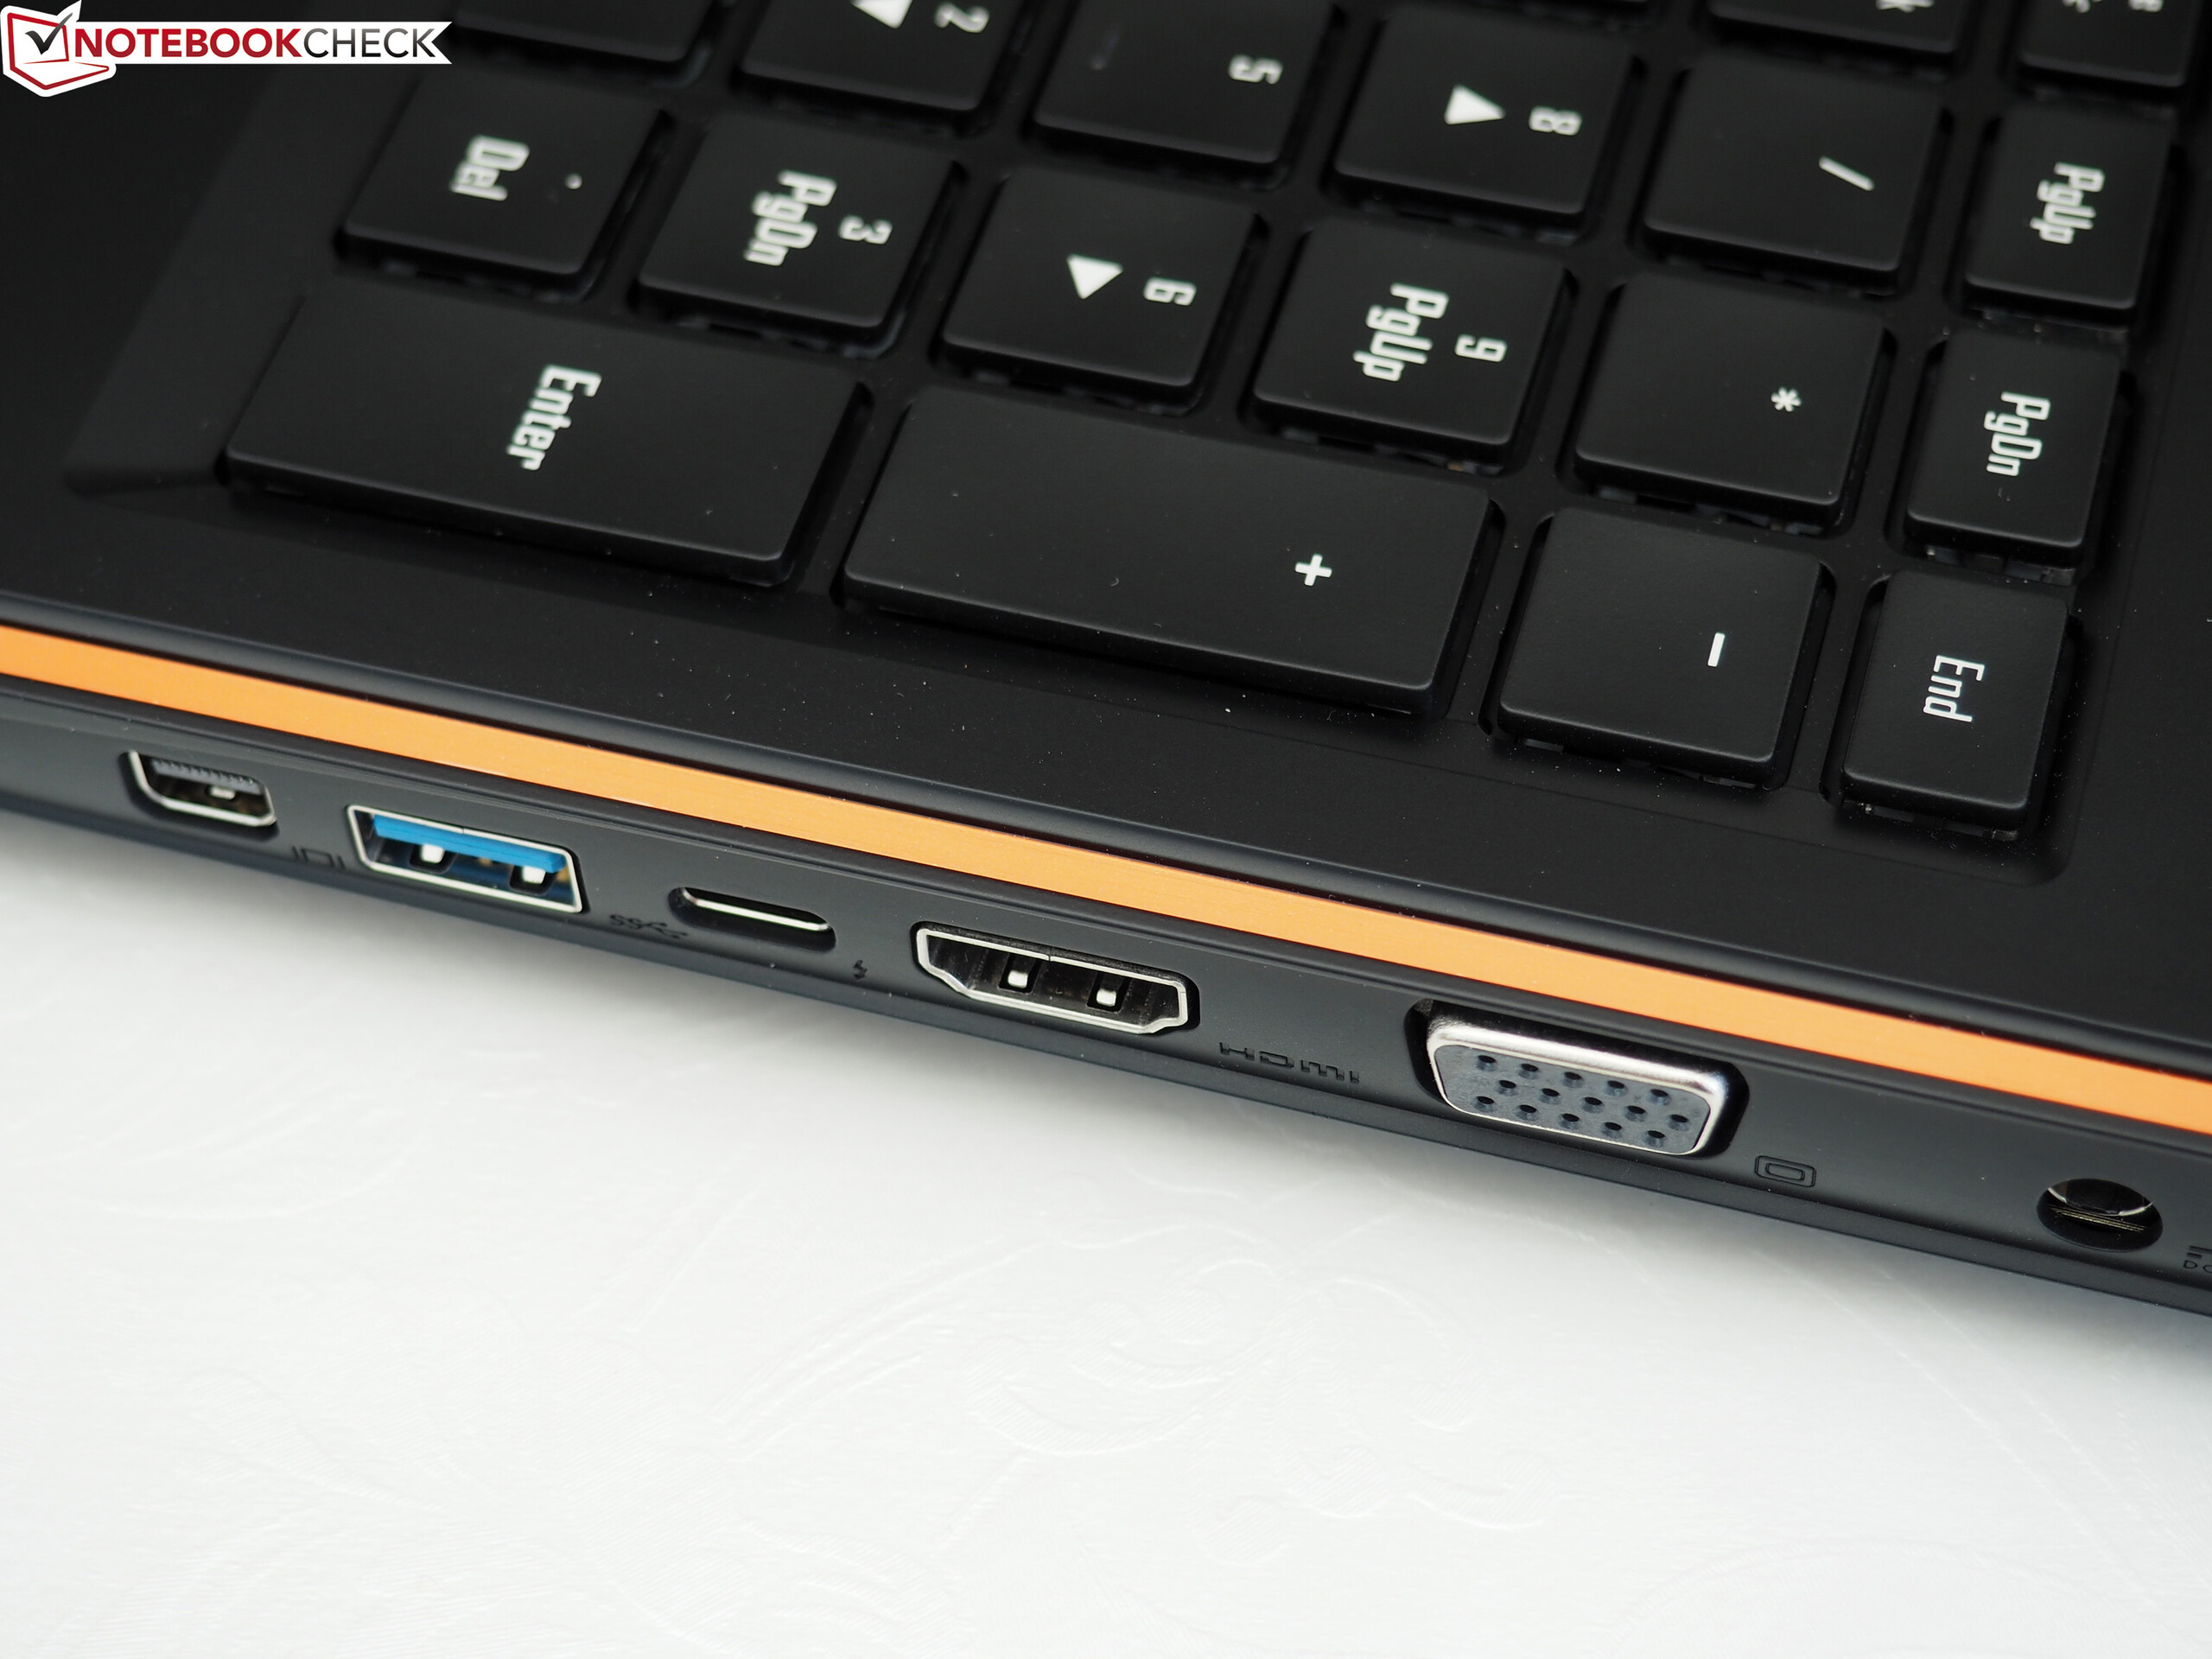
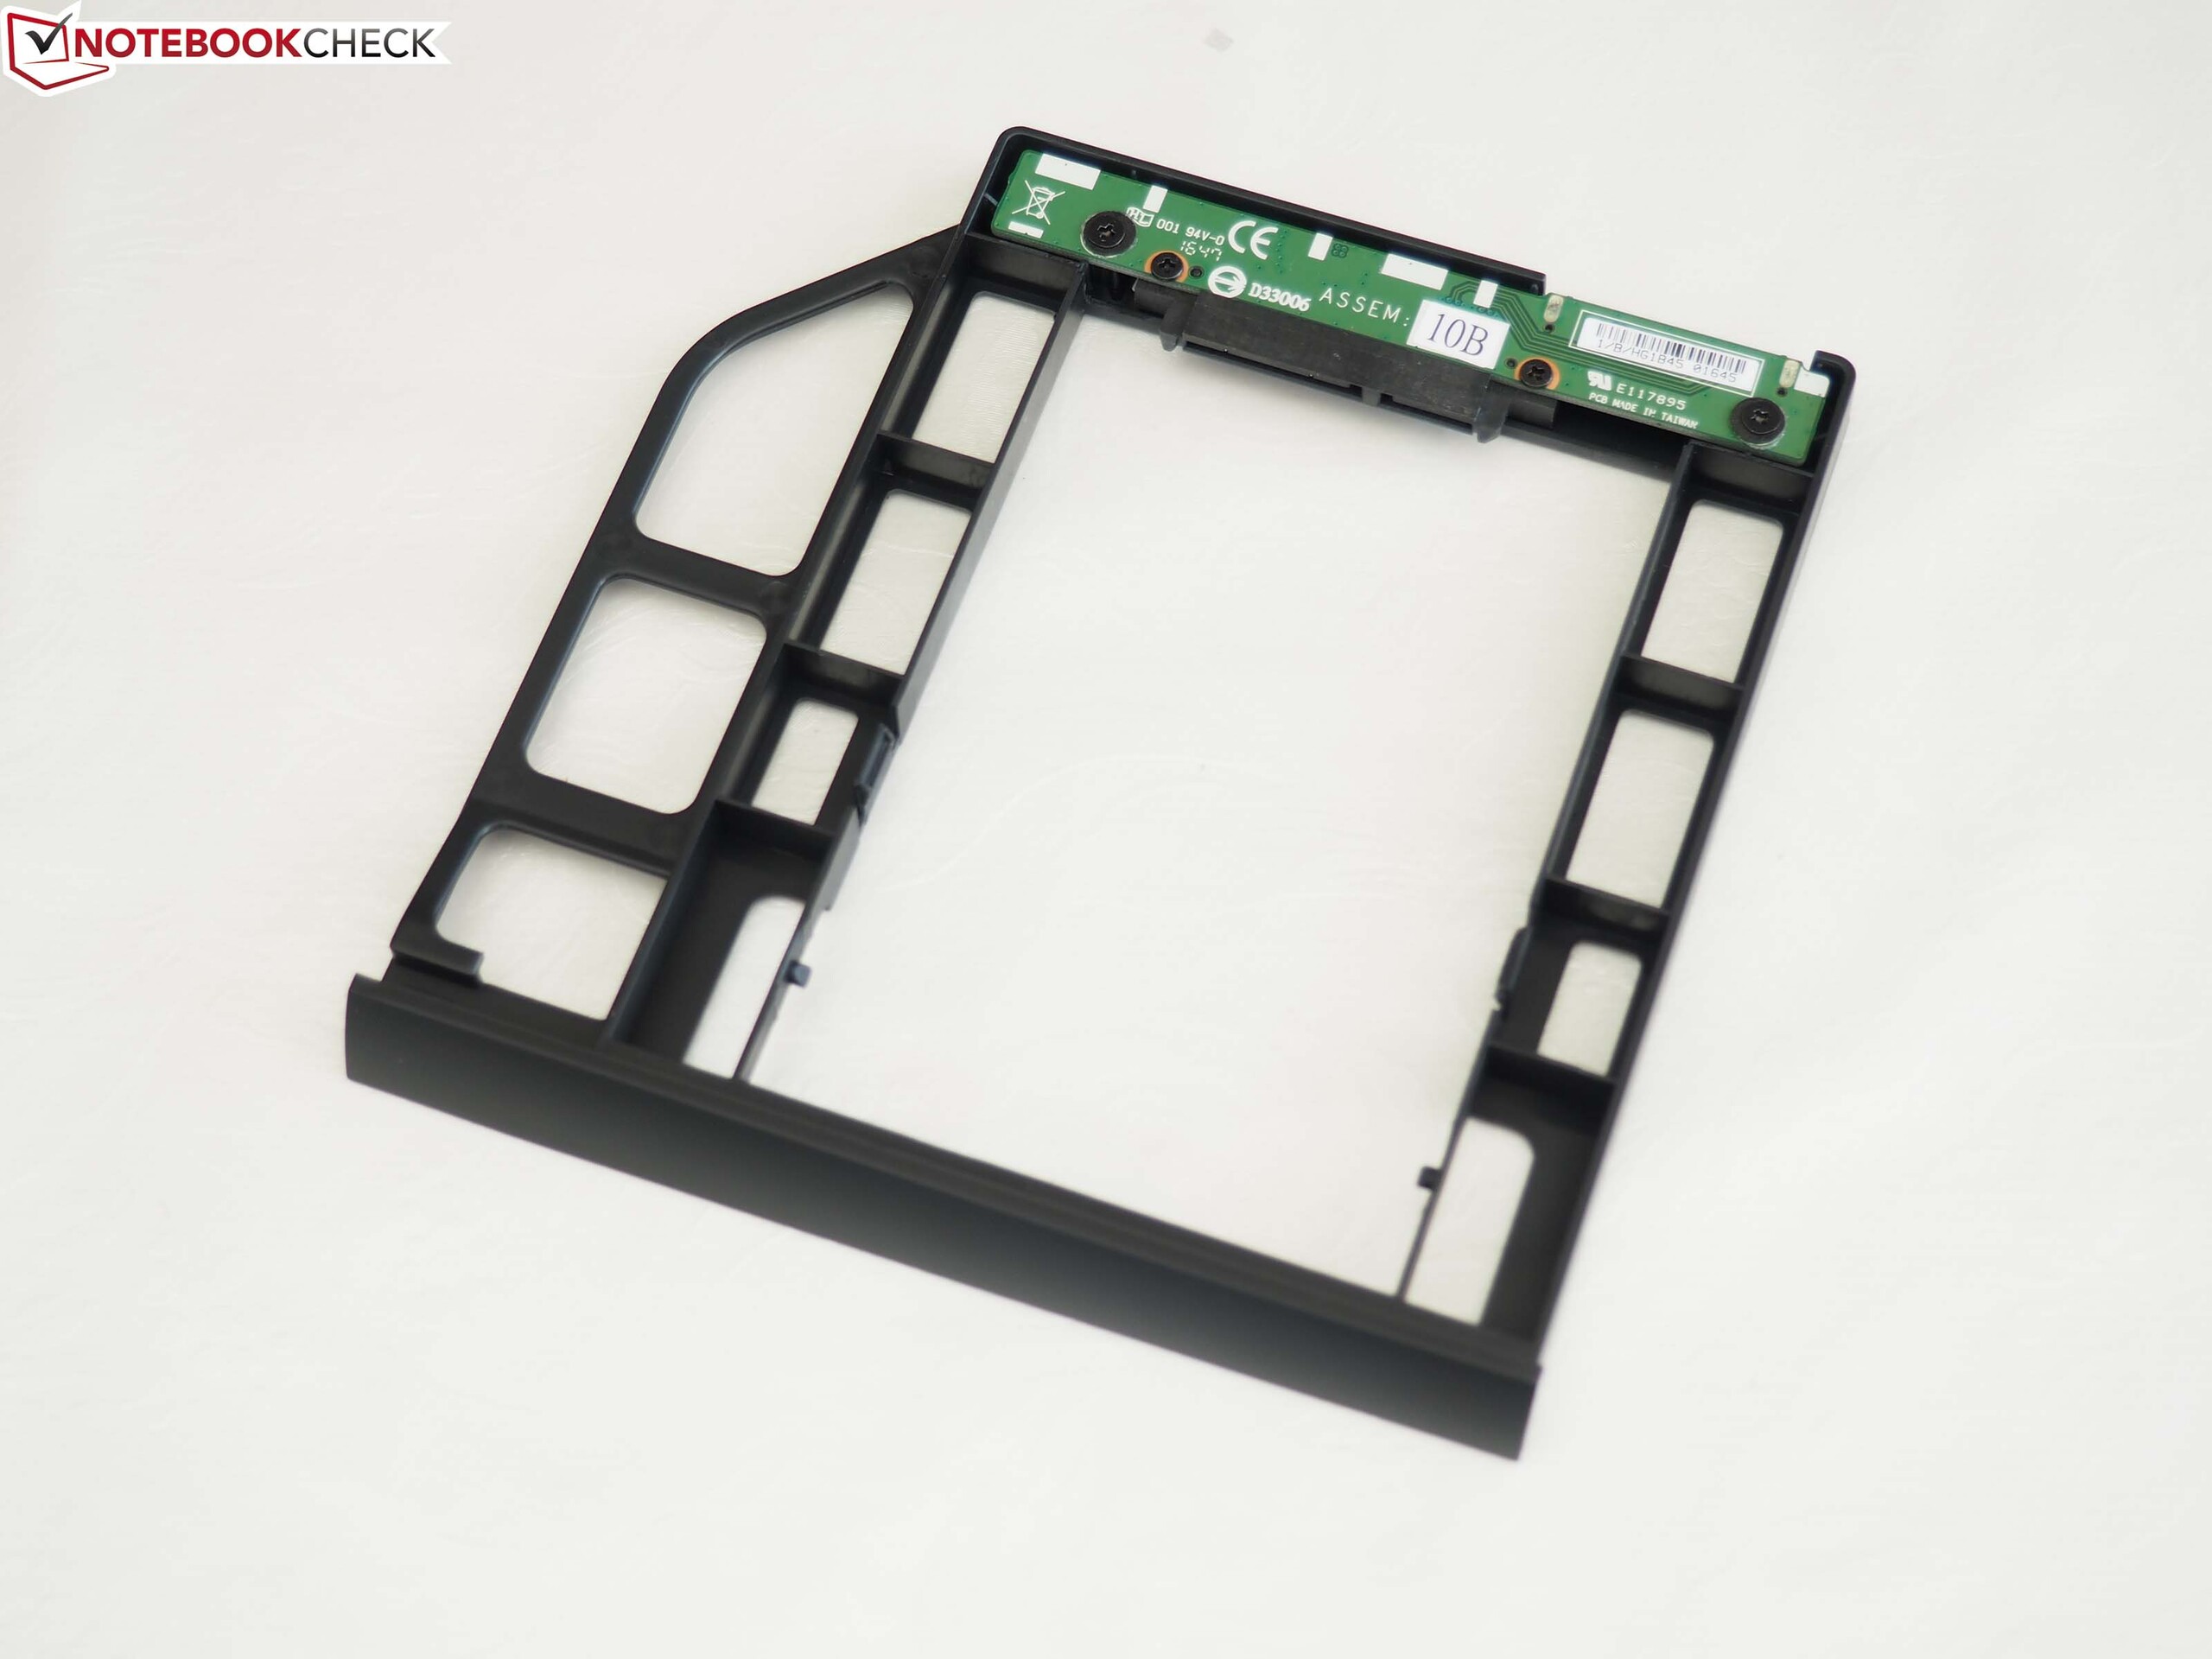
得益于热插拔概念(光驱或2.5英寸硬盘驱动器),P35和P55的结合体可以在质量上脱颖而出。
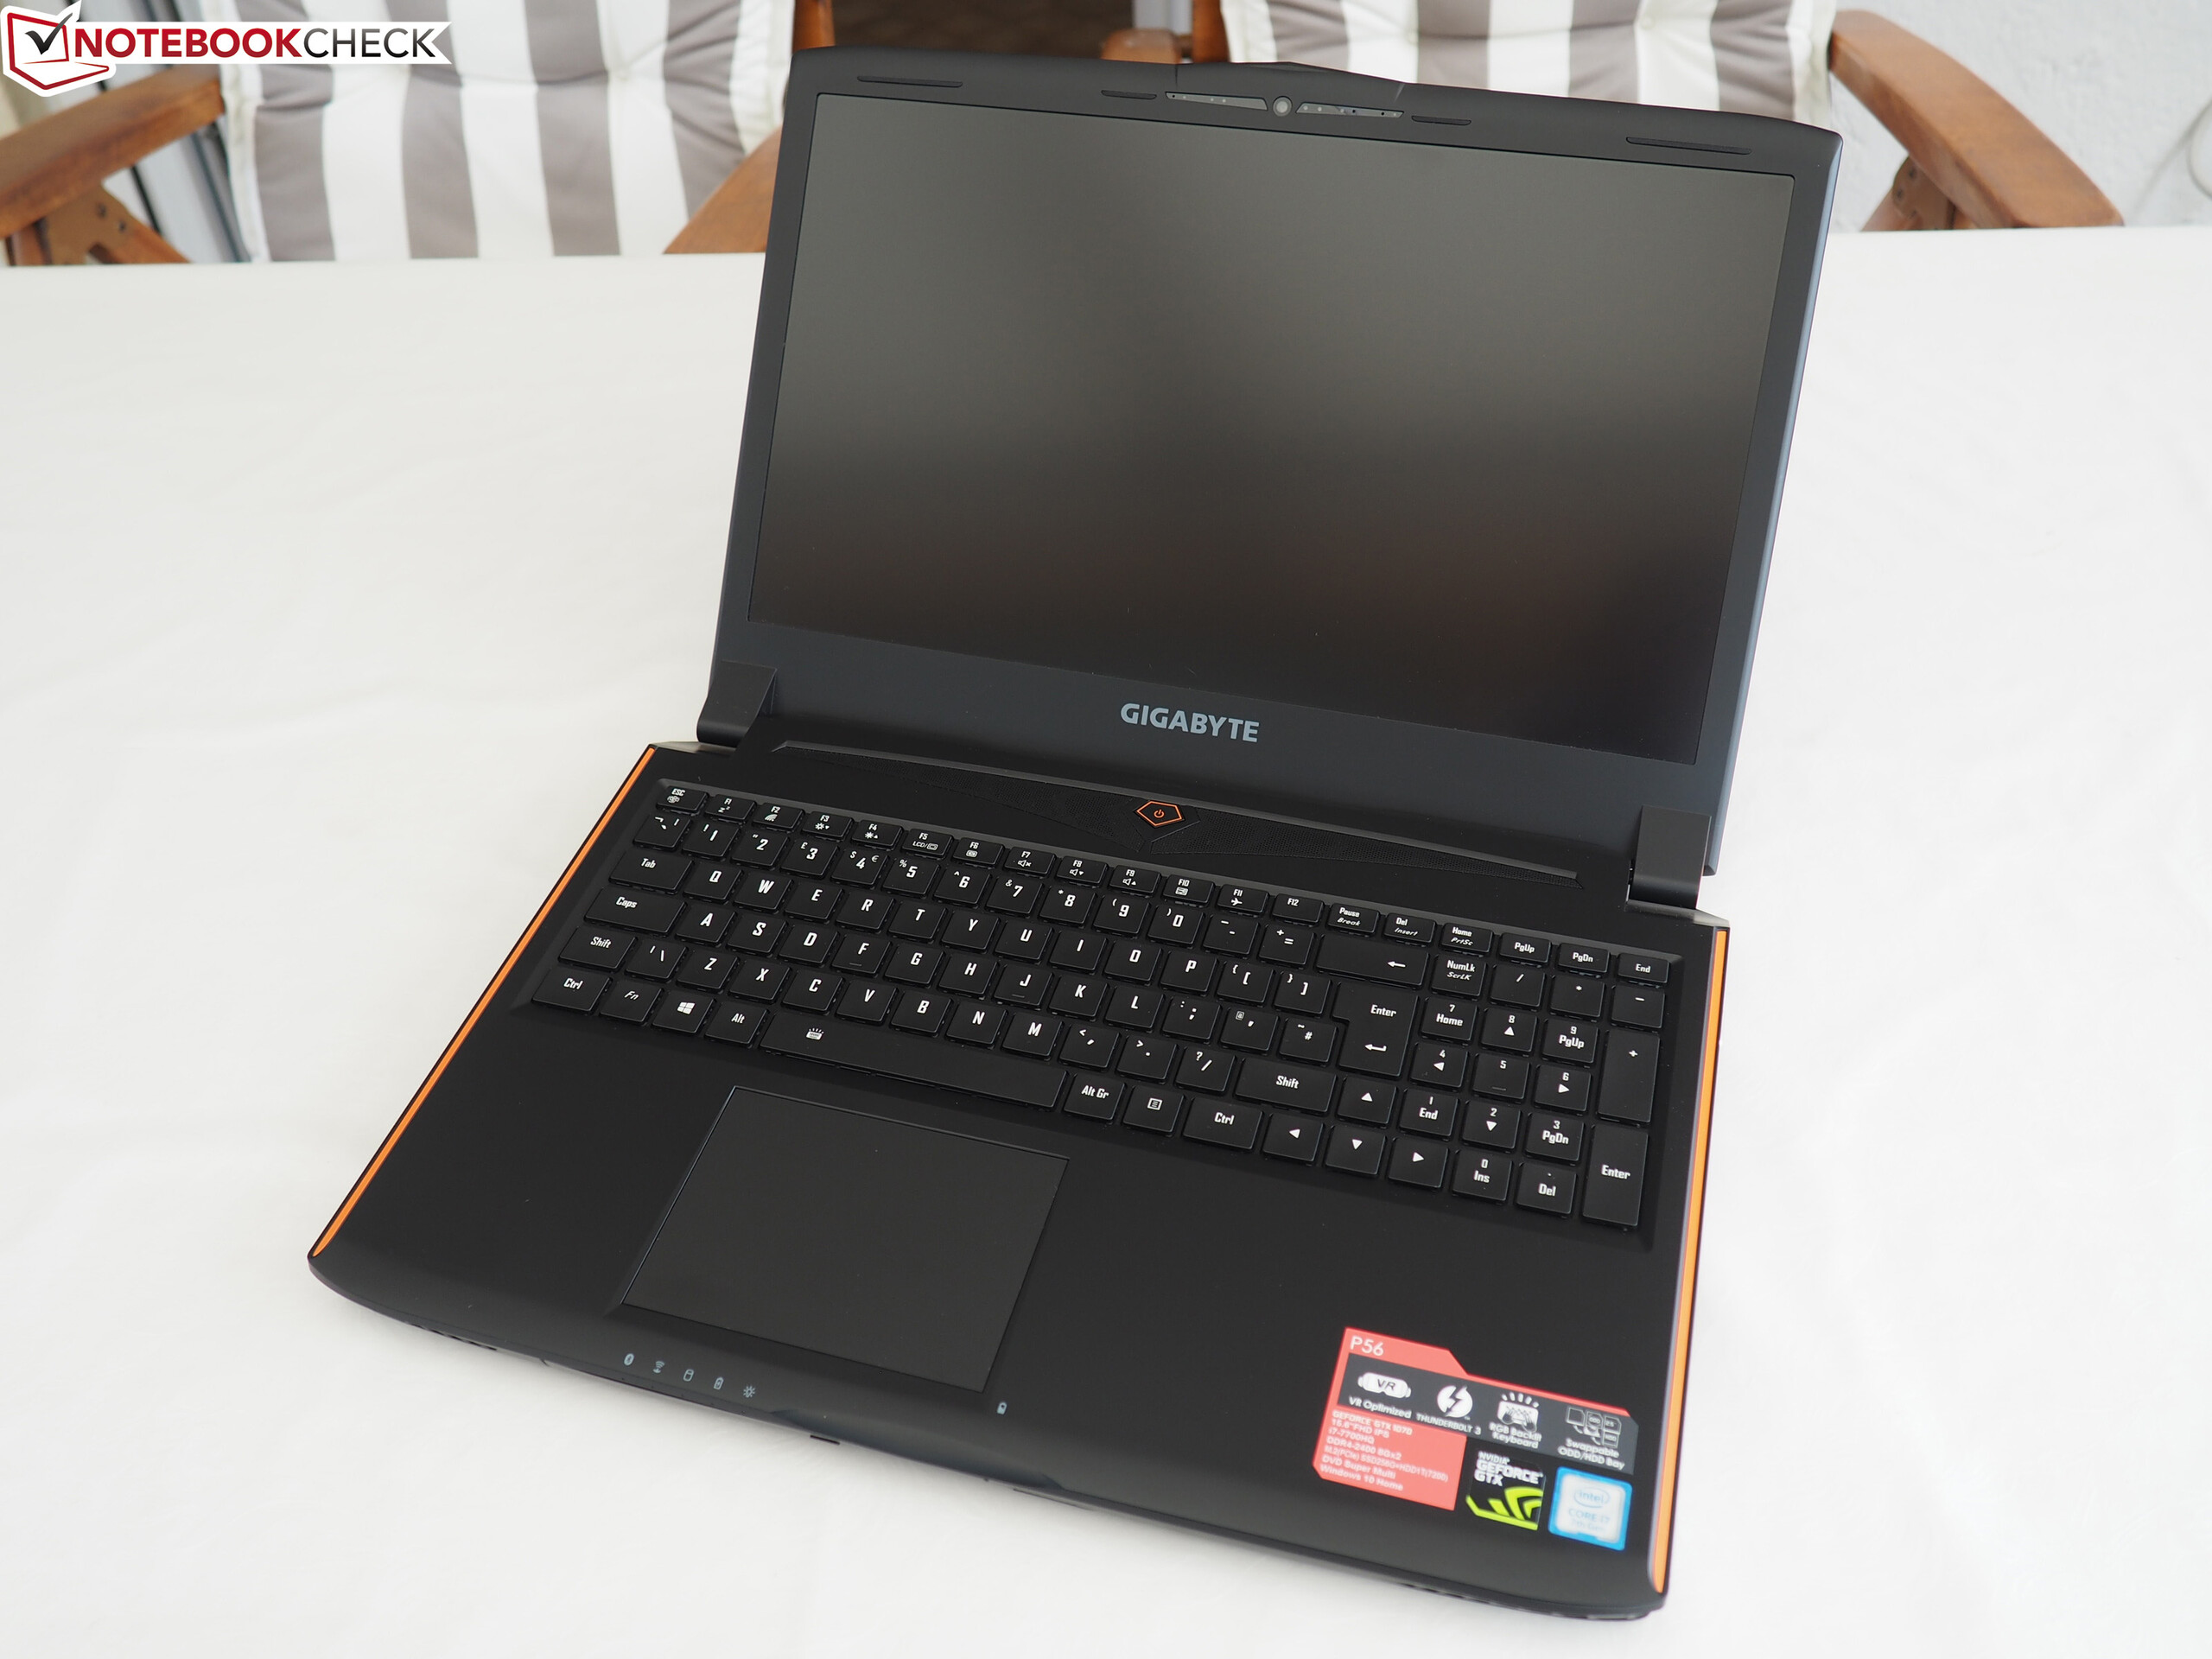
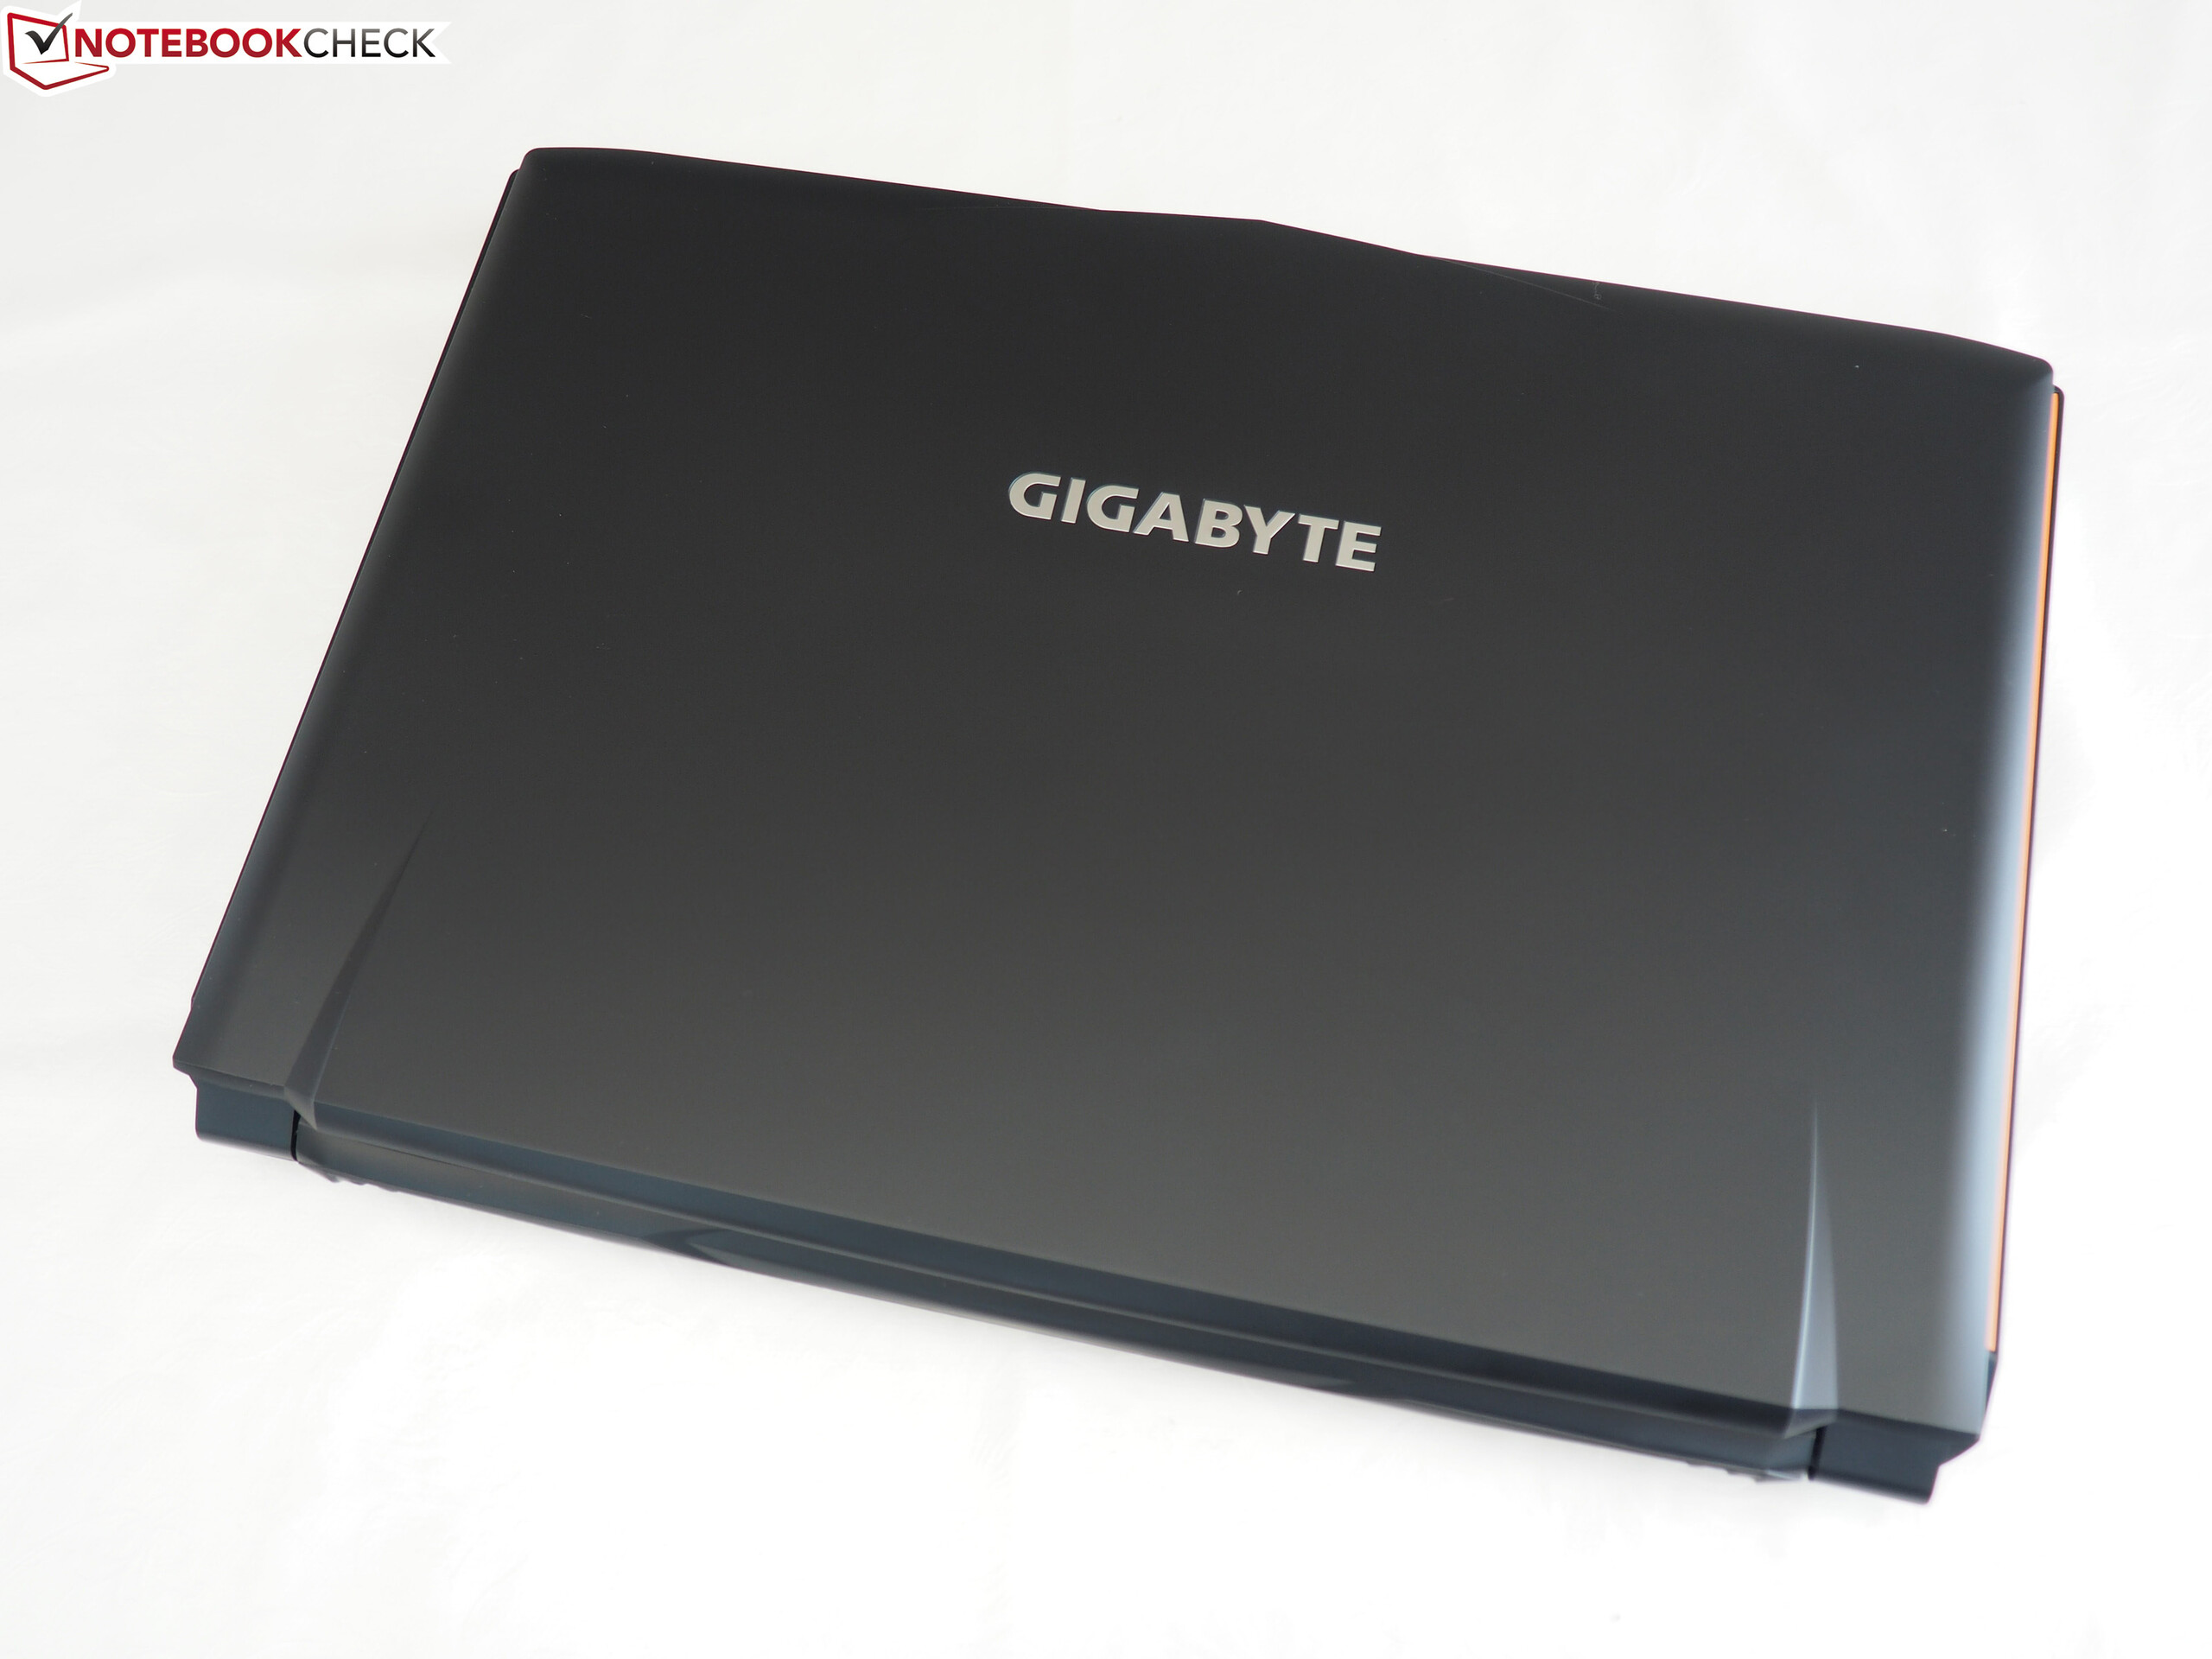
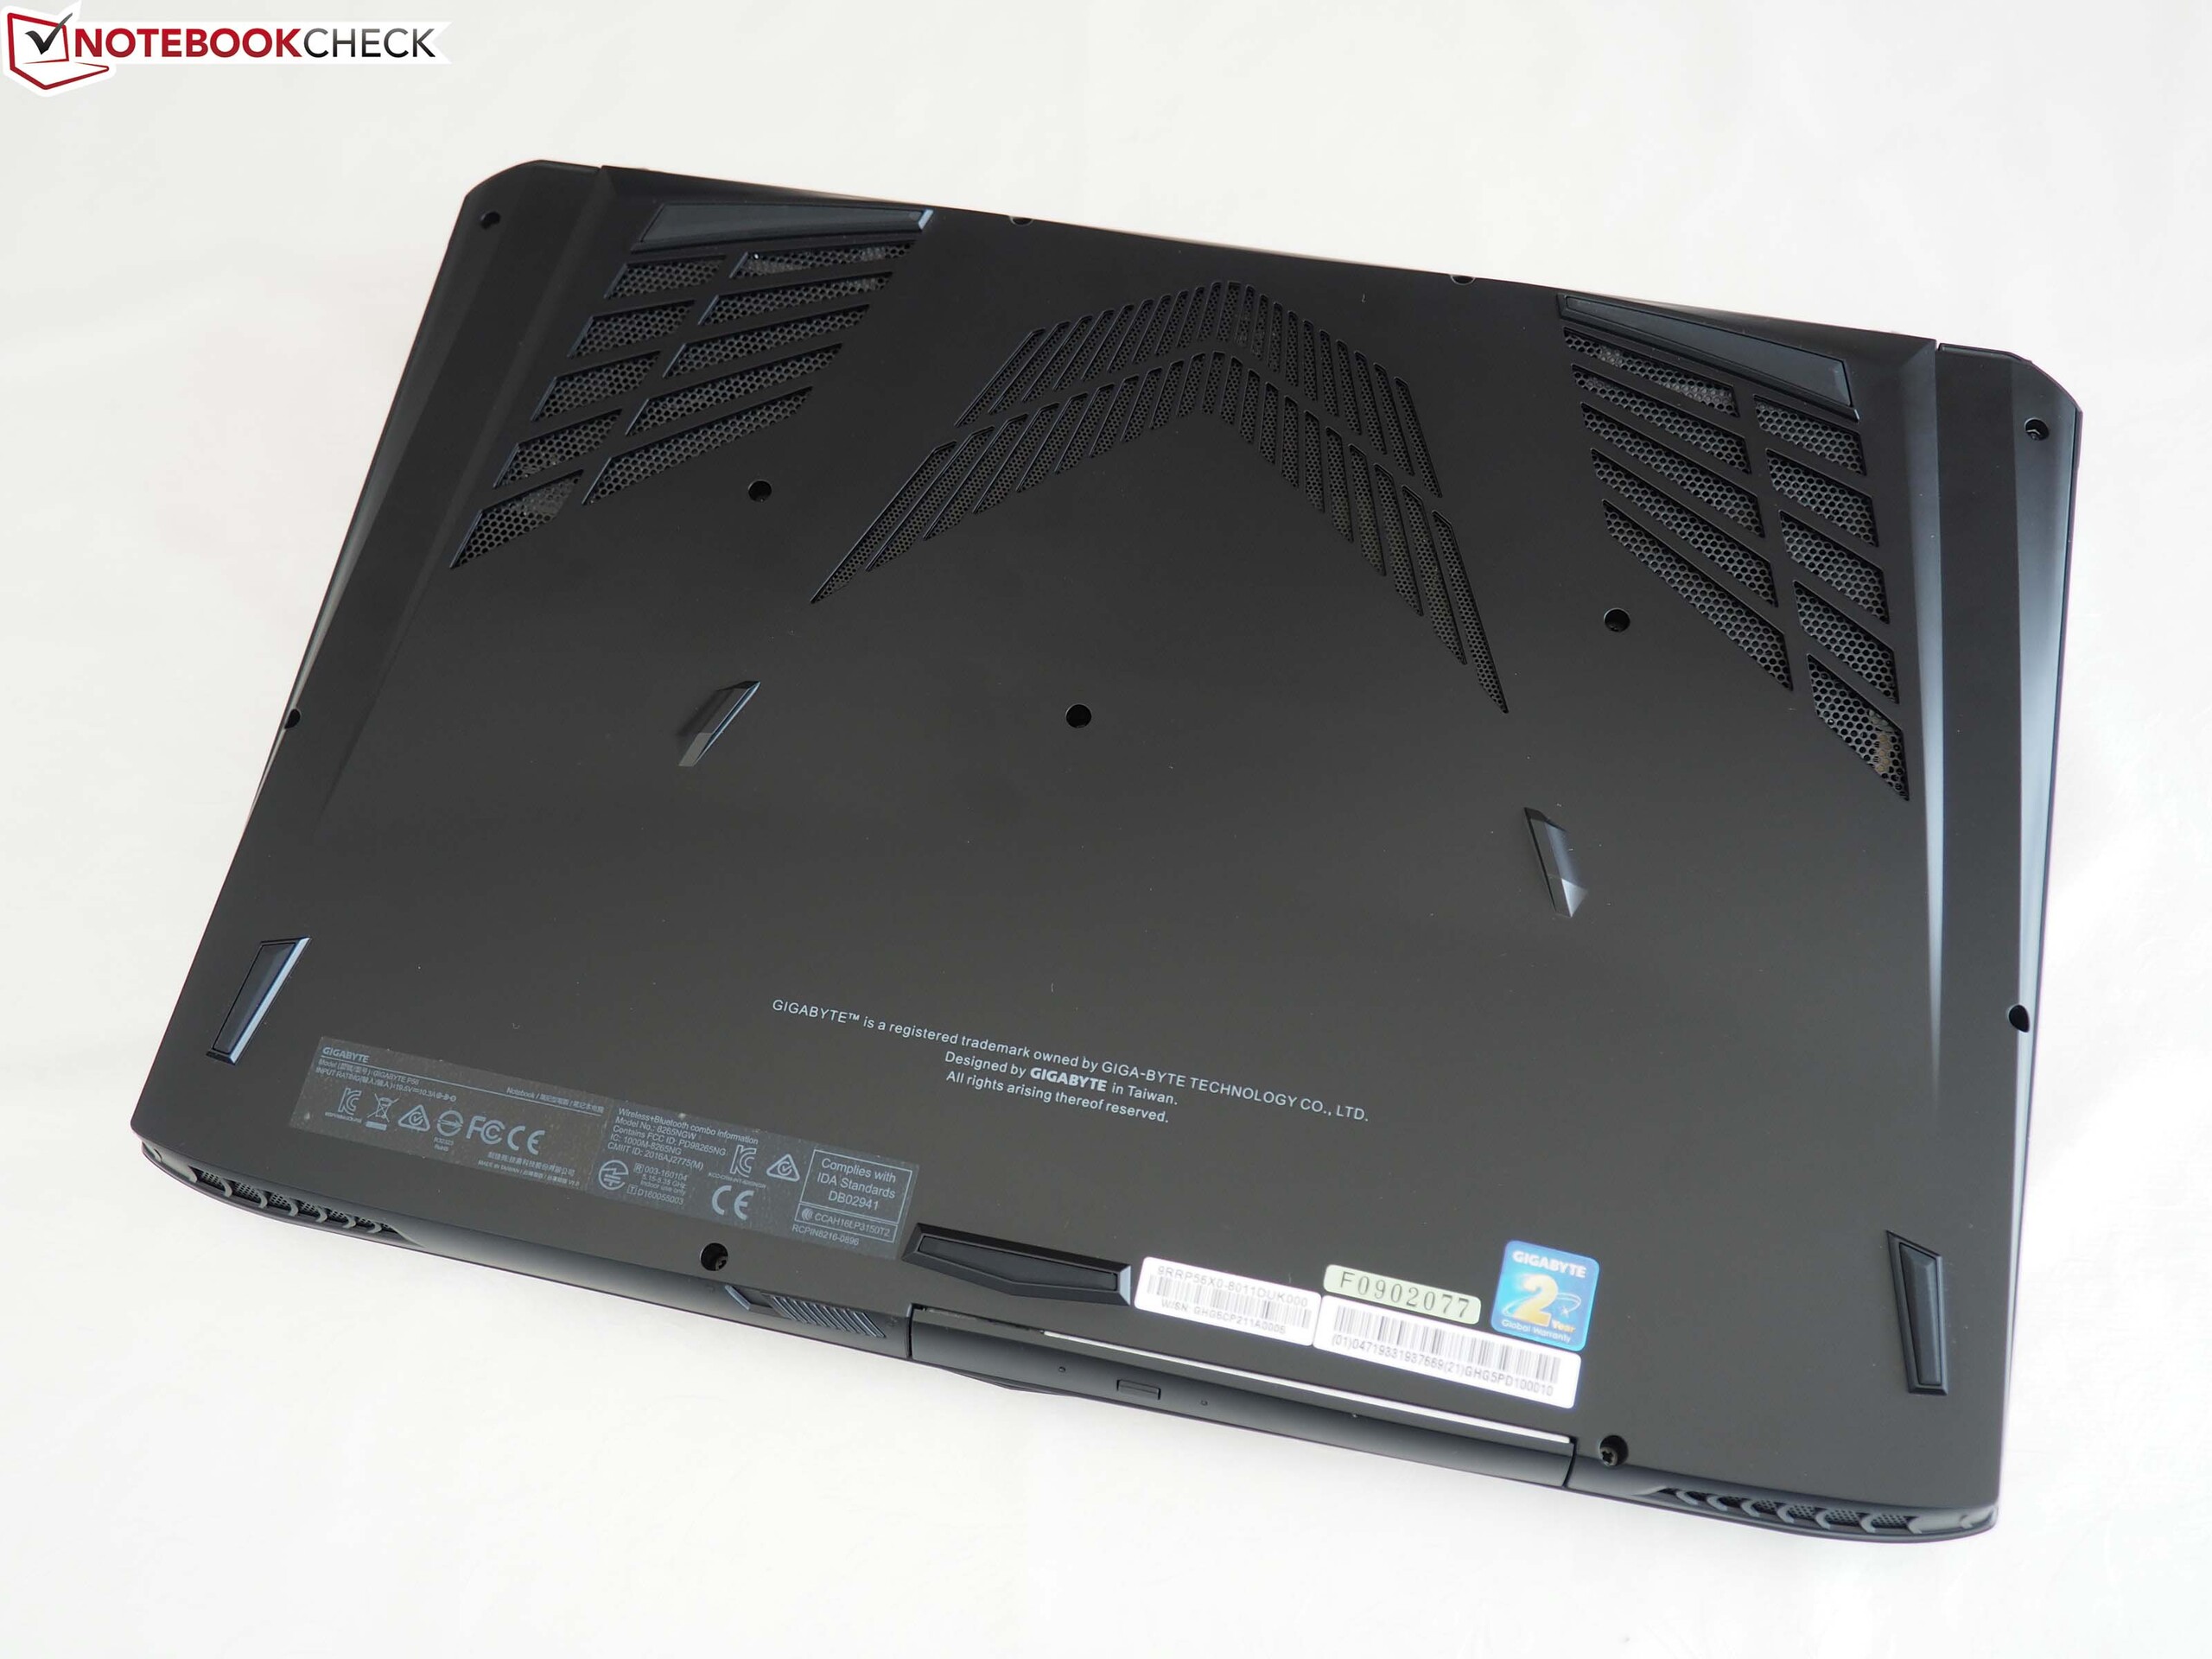
Gigabyte P56XT
- 07/27/2017 v6 (old)
Florian Glaser
Price comparison