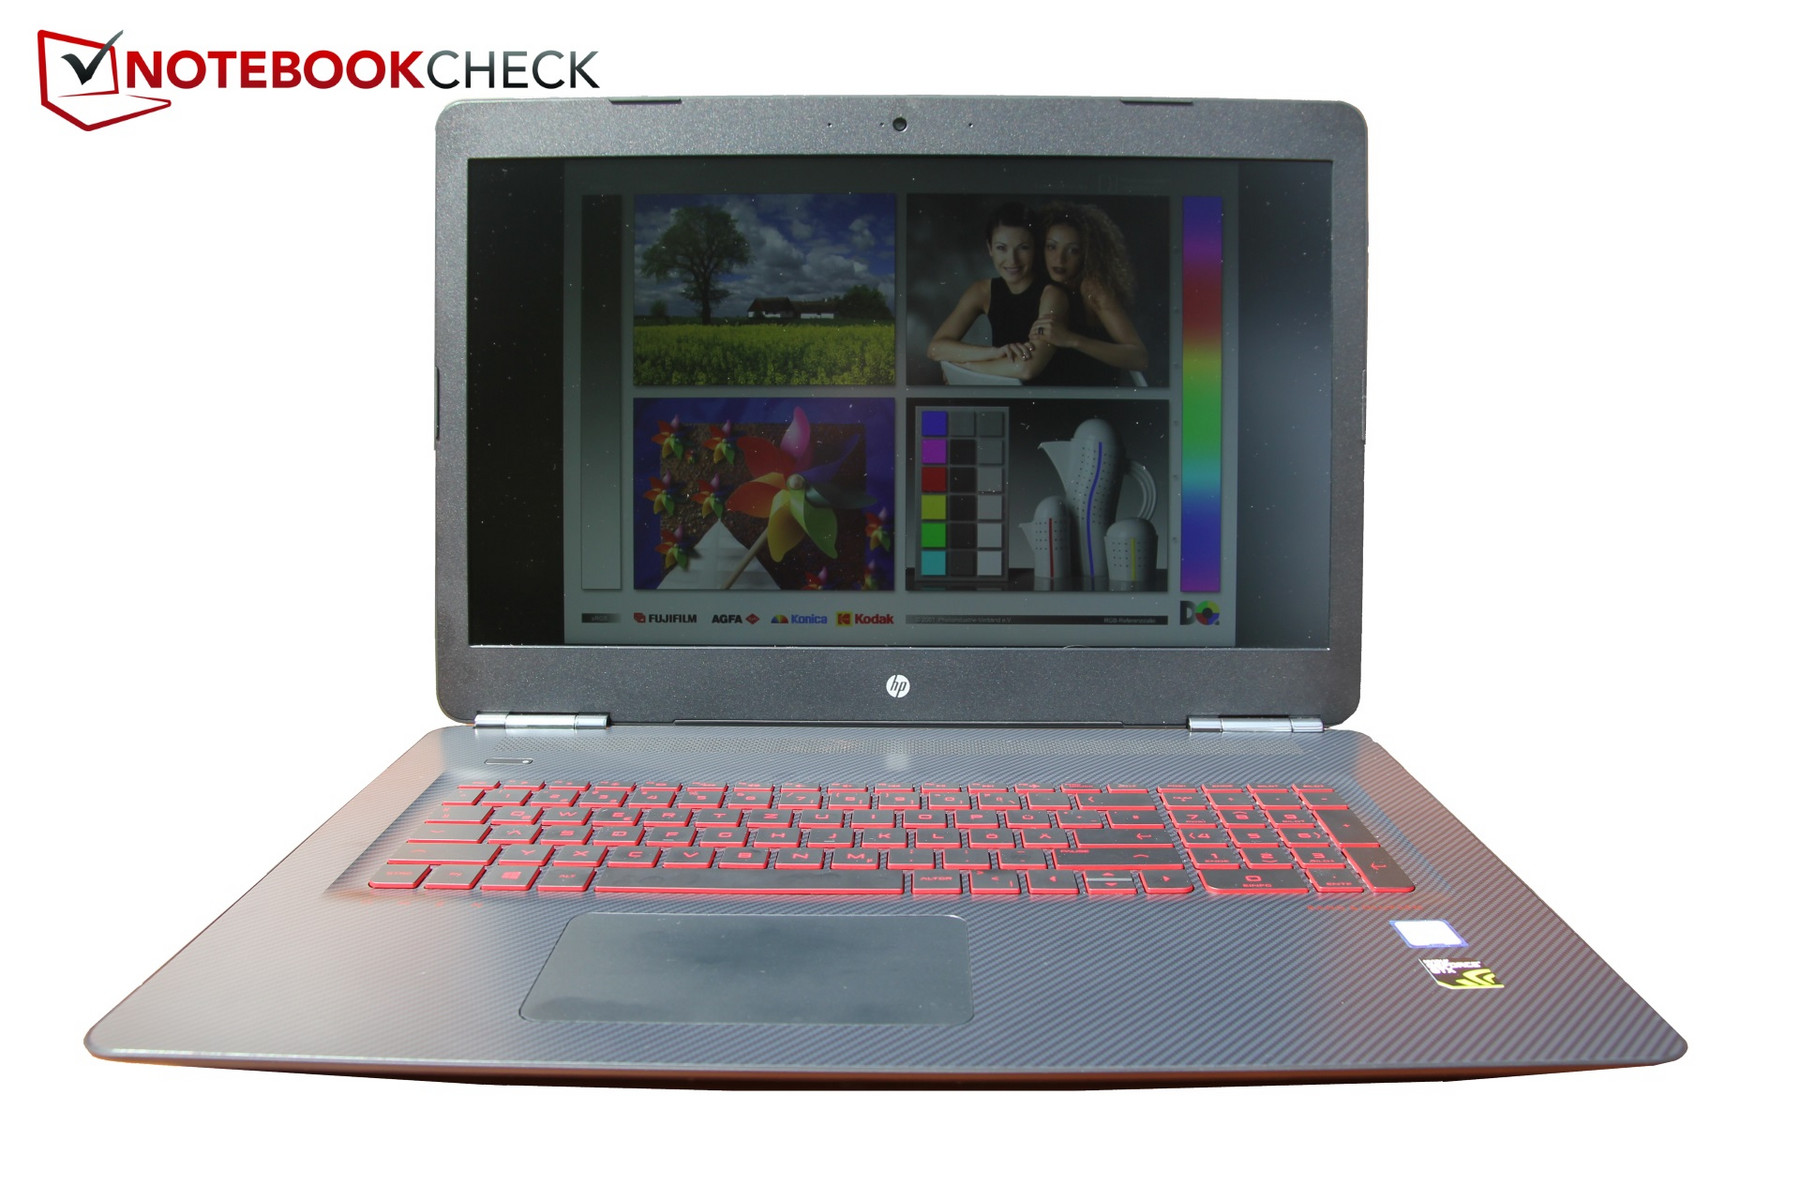
惠普 Omen 17 (7700HQ, GTX 1050 Ti, FHD) 笔记本电脑简短评测
| SD Card Reader | |
| average JPG Copy Test (av. of 3 runs) | |
| Nexoc G739 | |
| HP Omen 17-w110ng | |
| HP Omen 17-w206ng | |
| Asus GL753VE-DS74 | |
| MSI GE72 7RE-046 | |
| Acer Aspire Nitro BE VN7-793G-5811 | |
| maximum AS SSD Seq Read Test (1GB) | |
| Asus GL753VE-DS74 | |
| HP Omen 17-w110ng | |
| Nexoc G739 | |
| HP Omen 17-w206ng | |
| MSI GE72 7RE-046 | |
| Acer Aspire Nitro BE VN7-793G-5811 | |
| Networking | |
| iperf3 transmit AX12 | |
| Acer Aspire Nitro BE VN7-793G-5811 | |
| HP Omen 17-w206ng | |
| HP Omen 17-w110ng | |
| Asus GL753VE-DS74 | |
| Nexoc G739 | |
| MSI GE72 7RE-046 | |
| iperf3 receive AX12 | |
| HP Omen 17-w206ng | |
| HP Omen 17-w110ng | |
| Asus GL753VE-DS74 | |
| Acer Aspire Nitro BE VN7-793G-5811 | |
| Nexoc G739 | |
| MSI GE72 7RE-046 | |
| |||||||||||||||||||||||||
Brightness Distribution: 79 %
Center on Battery: 318 cd/m²
Contrast: 1272:1 (Black: 0.25 cd/m²)
ΔE ColorChecker Calman: 4.7 | ∀{0.5-29.43 Ø4.71}
ΔE Greyscale Calman: 5 | ∀{0.09-98 Ø4.96}
93% sRGB (Argyll 1.6.3 3D)
61% AdobeRGB 1998 (Argyll 1.6.3 3D)
67.4% AdobeRGB 1998 (Argyll 3D)
93.1% sRGB (Argyll 3D)
67.2% Display P3 (Argyll 3D)
Gamma: 2.28
CCT: 7374 K
| HP Omen 17-w206ng Chi Mei CMN1738, 1920x1080, 17.3" | Nexoc G739 CMN1738, 1920x1080, 17.3" | HP Omen 17-w110ng LG Philips LGD046E, 1920x1080, 17.3" | Acer Aspire Nitro BE VN7-793G-5811 AU Optronics, 1920x1080, 17.3" | Asus GL753VE-DS74 LG Philips LP173WF4-SPF3, 1920x1080, 17.3" | MSI GE72 7RE-046 N173HHE-G32 (CMN1747), 1920x1080, 17.3" | |
|---|---|---|---|---|---|---|
| Display | -1% | -7% | -6% | 23% | ||
| Display P3 Coverage (%) | 67.2 | 66.7 -1% | 66.6 -1% | 63.1 -6% | 90.7 35% | |
| sRGB Coverage (%) | 93.1 | 91 -2% | 84.1 -10% | 86.5 -7% | 99.9 7% | |
| AdobeRGB 1998 Coverage (%) | 67.4 | 66.4 -1% | 61.5 -9% | 63.3 -6% | 85.2 26% | |
| Response Times | -13% | 6% | -2% | 10% | 47% | |
| Response Time Grey 50% / Grey 80% * (ms) | 38 ? | 45 ? -18% | 37 ? 3% | 38 ? -0% | 36 ? 5% | 27 ? 29% |
| Response Time Black / White * (ms) | 26 ? | 28 ? -8% | 24 ? 8% | 27 ? -4% | 22 ? 15% | 9 ? 65% |
| PWM Frequency (Hz) | 200 ? | 450 ? | ||||
| Screen | 6% | 2% | -2% | 1% | -8% | |
| Brightness middle (cd/m²) | 318 | 312 -2% | 362 14% | 301 -5% | 366 15% | 253 -20% |
| Brightness (cd/m²) | 295 | 304 3% | 342 16% | 270 -8% | 348 18% | 230 -22% |
| Brightness Distribution (%) | 79 | 85 8% | 87 10% | 79 0% | 90 14% | 86 9% |
| Black Level * (cd/m²) | 0.25 | 0.23 8% | 0.31 -24% | 0.38 -52% | 0.35 -40% | 0.24 4% |
| Contrast (:1) | 1272 | 1357 7% | 1168 -8% | 792 -38% | 1046 -18% | 1054 -17% |
| Colorchecker dE 2000 * | 4.7 | 4.19 11% | 4.5 4% | 3.49 26% | 4.4 6% | 5.01 -7% |
| Colorchecker dE 2000 max. * | 8.8 | 8.7 1% | 9.31 -6% | 7.49 15% | 9.7 -10% | 10.4 -18% |
| Greyscale dE 2000 * | 5 | 3.72 26% | 3.48 30% | 1.88 62% | 3 40% | 7.26 -45% |
| Gamma | 2.28 96% | 2.29 96% | 2.23 99% | 2.35 94% | 2.1 105% | 2.09 105% |
| CCT | 7374 88% | 7104 91% | 6144 106% | 6587 99% | 6362 102% | 6329 103% |
| Color Space (Percent of AdobeRGB 1998) (%) | 61 | 59 -3% | 55 -10% | 56 -8% | 56 -8% | 76 25% |
| Color Space (Percent of sRGB) (%) | 93 | 91 -2% | 84 -10% | 86 -8% | 86 -8% | 100 8% |
| Total Average (Program / Settings) | -3% /
2% | 0% /
0% | -3% /
-3% | 6% /
2% | 21% /
5% |
* ... smaller is better
Display Response Times
| ↔ Response Time Black to White | ||
|---|---|---|
| 26 ms ... rise ↗ and fall ↘ combined | ↗ 15.6 ms rise | 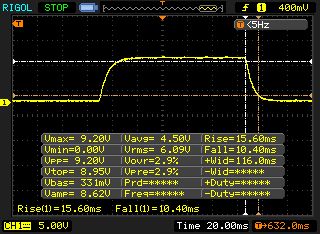 |
| ↘ 10.4 ms fall | ||
| The screen shows relatively slow response rates in our tests and may be too slow for gamers. In comparison, all tested devices range from 0.1 (minimum) to 240 (maximum) ms. » 63 % of all devices are better. This means that the measured response time is worse than the average of all tested devices (19.8 ms). | ||
| ↔ Response Time 50% Grey to 80% Grey | ||
| 38 ms ... rise ↗ and fall ↘ combined | ↗ 20 ms rise | 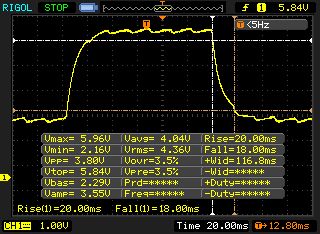 |
| ↘ 18 ms fall | ||
| The screen shows slow response rates in our tests and will be unsatisfactory for gamers. In comparison, all tested devices range from 0.165 (minimum) to 636 (maximum) ms. » 55 % of all devices are better. This means that the measured response time is worse than the average of all tested devices (31 ms). | ||
Screen Flickering / PWM (Pulse-Width Modulation)
| Screen flickering / PWM detected | 200 Hz | ≤ 95 % brightness setting | 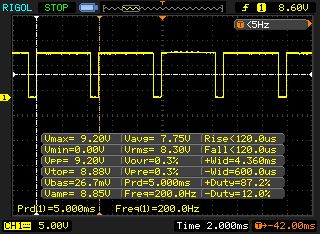 |
The display backlight flickers at 200 Hz (worst case, e.g., utilizing PWM) Flickering detected at a brightness setting of 95 % and below. There should be no flickering or PWM above this brightness setting. The frequency of 200 Hz is relatively low, so sensitive users will likely notice flickering and experience eyestrain at the stated brightness setting and below. In comparison: 52 % of all tested devices do not use PWM to dim the display. If PWM was detected, an average of 7754 (minimum: 5 - maximum: 343500) Hz was measured. | |||
| Cinebench R15 | |
| CPU Single 64Bit | |
| Nexoc G739 | |
| Asus GL753VE-DS74 | |
| HP Omen 17-w206ng | |
| HP Omen 17-w110ng | |
| MSI GE72 7RE-046 | |
| Acer Aspire Nitro BE VN7-793G-5811 | |
| CPU Multi 64Bit | |
| Nexoc G739 | |
| Asus GL753VE-DS74 | |
| MSI GE72 7RE-046 | |
| HP Omen 17-w206ng | |
| HP Omen 17-w110ng | |
| Acer Aspire Nitro BE VN7-793G-5811 | |
| Cinebench R11.5 | |
| CPU Single 64Bit | |
| Nexoc G739 | |
| HP Omen 17-w206ng | |
| HP Omen 17-w110ng | |
| MSI GE72 7RE-046 | |
| Asus GL753VE-DS74 | |
| CPU Multi 64Bit | |
| Nexoc G739 | |
| MSI GE72 7RE-046 | |
| HP Omen 17-w206ng | |
| Asus GL753VE-DS74 | |
| HP Omen 17-w110ng | |
| Cinebench R10 | |
| Rendering Single CPUs 64Bit | |
| HP Omen 17-w206ng | |
| HP Omen 17-w110ng | |
| Rendering Multiple CPUs 64Bit | |
| HP Omen 17-w206ng | |
| HP Omen 17-w110ng | |
| PCMark 8 - Home Score Accelerated v2 | |
| HP Omen 17-w110ng | |
| Nexoc G739 | |
| HP Omen 17-w206ng | |
| Acer Aspire Nitro BE VN7-793G-5811 | |
| Asus GL753VE-DS74 | |
| PCMark 8 Home Score Accelerated v2 | 4216 points | |
Help | ||
| HP Omen 17-w206ng Samsung PM961 MZVLW256HEHP | Nexoc G739 Samsung PM961 MZVLW256HEHP | HP Omen 17-w110ng Samsung PM951 NVMe MZVLV256 | MSI GE72 7RE-046 Toshiba HG6 THNSNJ256G8NY | Acer Aspire Nitro BE VN7-793G-5811 Seagate Mobile HDD 1TB ST1000LM035 | Asus GL753VE-DS74 Intel SSD 600p SSDPEKKW512G7 | |
|---|---|---|---|---|---|---|
| CrystalDiskMark 3.0 | 3% | -33% | -49% | -95% | -51% | |
| Read Seq (MB/s) | 1606 | 1666 4% | 1156 -28% | 540 -66% | 117.6 -93% | 1049 -35% |
| Write Seq (MB/s) | 1176 | 1192 1% | 294.9 -75% | 495.7 -58% | 109.1 -91% | 584 -50% |
| Read 512 (MB/s) | 846 | 857 1% | 616 -27% | 455.1 -46% | 39.93 -95% | 583 -31% |
| Write 512 (MB/s) | 805 | 827 3% | 294.7 -63% | 481.4 -40% | 98.6 -88% | 458 -43% |
| Read 4k (MB/s) | 59.9 | 60.7 1% | 42.7 -29% | 22.7 -62% | 0.435 -99% | 14.1 -76% |
| Write 4k (MB/s) | 155.6 | 154.5 -1% | 153.3 -1% | 112.9 -27% | 3.152 -98% | 108 -31% |
| Read 4k QD32 (MB/s) | 588 | 636 8% | 600 2% | 372.5 -37% | 1.008 -100% | 57.8 -90% |
| Write 4k QD32 (MB/s) | 505 | 544 8% | 295.3 -42% | 212.9 -58% | 4.705 -99% | 264 -48% |

| 3DMark 11 - 1280x720 Performance GPU | |
| HP Omen 17-w110ng | |
| Acer Aspire Nitro BE VN7-793G-5811 | |
| MSI GE72 7RE-046 | |
| Nexoc G739 | |
| HP Omen 17-w206ng | |
| 3DMark 11 Performance | 9245 points | |
Help | ||
| low | med. | high | ultra | |
|---|---|---|---|---|
| The Witcher 3 (2015) | 141.3 | 86 | 47.96 | 26 |
Noise level
| Idle |
| 34 / 35 / 36 dB(A) |
| DVD |
| 38 / dB(A) |
| Load |
| 47 / 52 dB(A) |
 | ||
30 dB silent 40 dB(A) audible 50 dB(A) loud |
||
min: | ||
| HP Omen 17-w206ng GeForce GTX 1050 Ti Mobile, i7-7700HQ | HP Omen 17-w110ng GeForce GTX 1070 Mobile, 6700HQ | Asus GL753VE-DS74 GeForce GTX 1050 Ti Mobile, i7-7700HQ | MSI GE72 7RE-046 GeForce GTX 1050 Ti Mobile, i7-7700HQ | Nexoc G739 GeForce GTX 1050 Ti Mobile, i7-7700HQ | Acer Aspire Nitro BE VN7-793G-5811 GeForce GTX 1050 Ti Mobile, i5-7300HQ | |
|---|---|---|---|---|---|---|
| Noise | 2% | 5% | 3% | 4% | 15% | |
| off / environment * (dB) | 30 | 30 -0% | 29.1 3% | 30 -0% | 30 -0% | 29.7 1% |
| Idle Minimum * (dB) | 34 | 33 3% | 33.3 2% | 34 -0% | 31 9% | 30.2 11% |
| Idle Average * (dB) | 35 | 34 3% | 33.3 5% | 35 -0% | 32 9% | 30.2 14% |
| Idle Maximum * (dB) | 36 | 35 3% | 33.4 7% | 36 -0% | 38 -6% | 30.6 15% |
| Load Average * (dB) | 47 | 45 4% | 42.6 9% | 41 13% | 44 6% | 33.8 28% |
| Witcher 3 ultra * (dB) | 48 | 46.8 2% | 39.5 18% | |||
| Load Maximum * (dB) | 52 | 52 -0% | 46.8 10% | 49 6% | 50 4% | 42.6 18% |
* ... smaller is better
(-) The maximum temperature on the upper side is 55.6 °C / 132 F, compared to the average of 36.8 °C / 98 F, ranging from 21 to 71 °C for the class Multimedia.
(-) The bottom heats up to a maximum of 57.7 °C / 136 F, compared to the average of 39.1 °C / 102 F
(+) In idle usage, the average temperature for the upper side is 29.2 °C / 85 F, compared to the device average of 31.3 °C / 88 F.
(-) Playing The Witcher 3, the average temperature for the upper side is 43.6 °C / 110 F, compared to the device average of 31.3 °C / 88 F.
(-) The palmrests and touchpad can get very hot to the touch with a maximum of 48.6 °C / 119.5 F.
(-) The average temperature of the palmrest area of similar devices was 28.7 °C / 83.7 F (-19.9 °C / -35.8 F).
| HP Omen 17-w206ng GeForce GTX 1050 Ti Mobile, i7-7700HQ | Asus GL753VE-DS74 GeForce GTX 1050 Ti Mobile, i7-7700HQ | MSI GE72 7RE-046 GeForce GTX 1050 Ti Mobile, i7-7700HQ | Nexoc G739 GeForce GTX 1050 Ti Mobile, i7-7700HQ | Acer Aspire Nitro BE VN7-793G-5811 GeForce GTX 1050 Ti Mobile, i5-7300HQ | HP Omen 17-w110ng GeForce GTX 1070 Mobile, 6700HQ | |
|---|---|---|---|---|---|---|
| Heat | 31% | 8% | 8% | 10% | 7% | |
| Maximum Upper Side * (°C) | 55.6 | 35.8 36% | 45.8 18% | 50.6 9% | 48 14% | 45 19% |
| Maximum Bottom * (°C) | 57.7 | 36.4 37% | 45.2 22% | 50.8 12% | 40.8 29% | 54.3 6% |
| Idle Upper Side * (°C) | 32.2 | 22.2 31% | 31.7 2% | 28.7 11% | 29.9 7% | 29.6 8% |
| Idle Bottom * (°C) | 27.2 | 22.2 18% | 29.9 -10% | 27.1 -0% | 29.8 -10% | 28.6 -5% |
* ... smaller is better
HP Omen 17-w206ng audio analysis
(±) | speaker loudness is average but good (80 dB)
Bass 100 - 315 Hz
(±) | reduced bass - on average 14.6% lower than median
(±) | linearity of bass is average (10.4% delta to prev. frequency)
Mids 400 - 2000 Hz
(+) | balanced mids - only 4.4% away from median
(+) | mids are linear (4.3% delta to prev. frequency)
Highs 2 - 16 kHz
(+) | balanced highs - only 4.7% away from median
(+) | highs are linear (5.1% delta to prev. frequency)
Overall 100 - 16.000 Hz
(±) | linearity of overall sound is average (19.1% difference to median)
Compared to same class
» 61% of all tested devices in this class were better, 7% similar, 32% worse
» The best had a delta of 5%, average was 17%, worst was 45%
Compared to all devices tested
» 46% of all tested devices were better, 7% similar, 47% worse
» The best had a delta of 4%, average was 23%, worst was 134%
Acer Aspire V17 Nitro BE VN7-793G-52XN audio analysis
(±) | speaker loudness is average but good (72 dB)
Bass 100 - 315 Hz
(±) | reduced bass - on average 5.7% lower than median
(+) | bass is linear (5% delta to prev. frequency)
Mids 400 - 2000 Hz
(+) | balanced mids - only 4.4% away from median
(+) | mids are linear (6% delta to prev. frequency)
Highs 2 - 16 kHz
(+) | balanced highs - only 3% away from median
(±) | linearity of highs is average (7.2% delta to prev. frequency)
Overall 100 - 16.000 Hz
(+) | overall sound is linear (12.5% difference to median)
Compared to same class
» 24% of all tested devices in this class were better, 3% similar, 73% worse
» The best had a delta of 5%, average was 17%, worst was 45%
Compared to all devices tested
» 11% of all tested devices were better, 2% similar, 86% worse
» The best had a delta of 4%, average was 23%, worst was 134%
| Off / Standby | |
| Idle | |
| Load |
|
Key:
min: | |
| HP Omen 17-w206ng GeForce GTX 1050 Ti Mobile, i7-7700HQ | Nexoc G739 GeForce GTX 1050 Ti Mobile, i7-7700HQ | HP Omen 17-w110ng GeForce GTX 1070 Mobile, 6700HQ | Acer Aspire Nitro BE VN7-793G-5811 GeForce GTX 1050 Ti Mobile, i5-7300HQ | Asus GL753VE-DS74 GeForce GTX 1050 Ti Mobile, i7-7700HQ | MSI GE72 7RE-046 GeForce GTX 1050 Ti Mobile, i7-7700HQ | |
|---|---|---|---|---|---|---|
| Power Consumption | 10% | -36% | 19% | 25% | -6% | |
| Idle Minimum * (Watt) | 11 | 7 36% | 19 -73% | 8.7 21% | 7.5 32% | 14 -27% |
| Idle Average * (Watt) | 18 | 14 22% | 25 -39% | 12.4 31% | 11.3 37% | 20 -11% |
| Idle Maximum * (Watt) | 24 | 23 4% | 31 -29% | 15.4 36% | 11.8 51% | 25 -4% |
| Load Average * (Watt) | 84 | 82 2% | 90 -7% | 73 13% | 82.1 2% | 82 2% |
| Witcher 3 ultra * (Watt) | 101 | 98 3% | 96.3 5% | |||
| Load Maximum * (Watt) | 146 | 163 -12% | 193 -32% | 130 11% | 116.6 20% | 135 8% |
* ... smaller is better
| HP Omen 17-w206ng GeForce GTX 1050 Ti Mobile, i7-7700HQ, 62 Wh | Nexoc G739 GeForce GTX 1050 Ti Mobile, i7-7700HQ, 62 Wh | HP Omen 17-w110ng GeForce GTX 1070 Mobile, 6700HQ, 95 Wh | Acer Aspire Nitro BE VN7-793G-5811 GeForce GTX 1050 Ti Mobile, i5-7300HQ, 52.5 Wh | Asus GL753VE-DS74 GeForce GTX 1050 Ti Mobile, i7-7700HQ, 48 Wh | MSI GE72 7RE-046 GeForce GTX 1050 Ti Mobile, i7-7700HQ, 51.4 Wh | |
|---|---|---|---|---|---|---|
| Battery runtime | -5% | -21% | -27% | -41% | -51% | |
| Reader / Idle (h) | 13.3 | 10.2 -23% | 7.2 -46% | 8.7 -35% | ||
| WiFi v1.3 (h) | 6.3 | 4.8 -24% | 4.1 -35% | 4.6 -27% | 3.9 -38% | 3.1 -51% |
| Load (h) | 1.6 | 2.1 31% | 1.9 19% | 0.8 -50% | ||
| H.264 (h) | 5.4 | 3.9 | 3.3 |
Pros
Cons
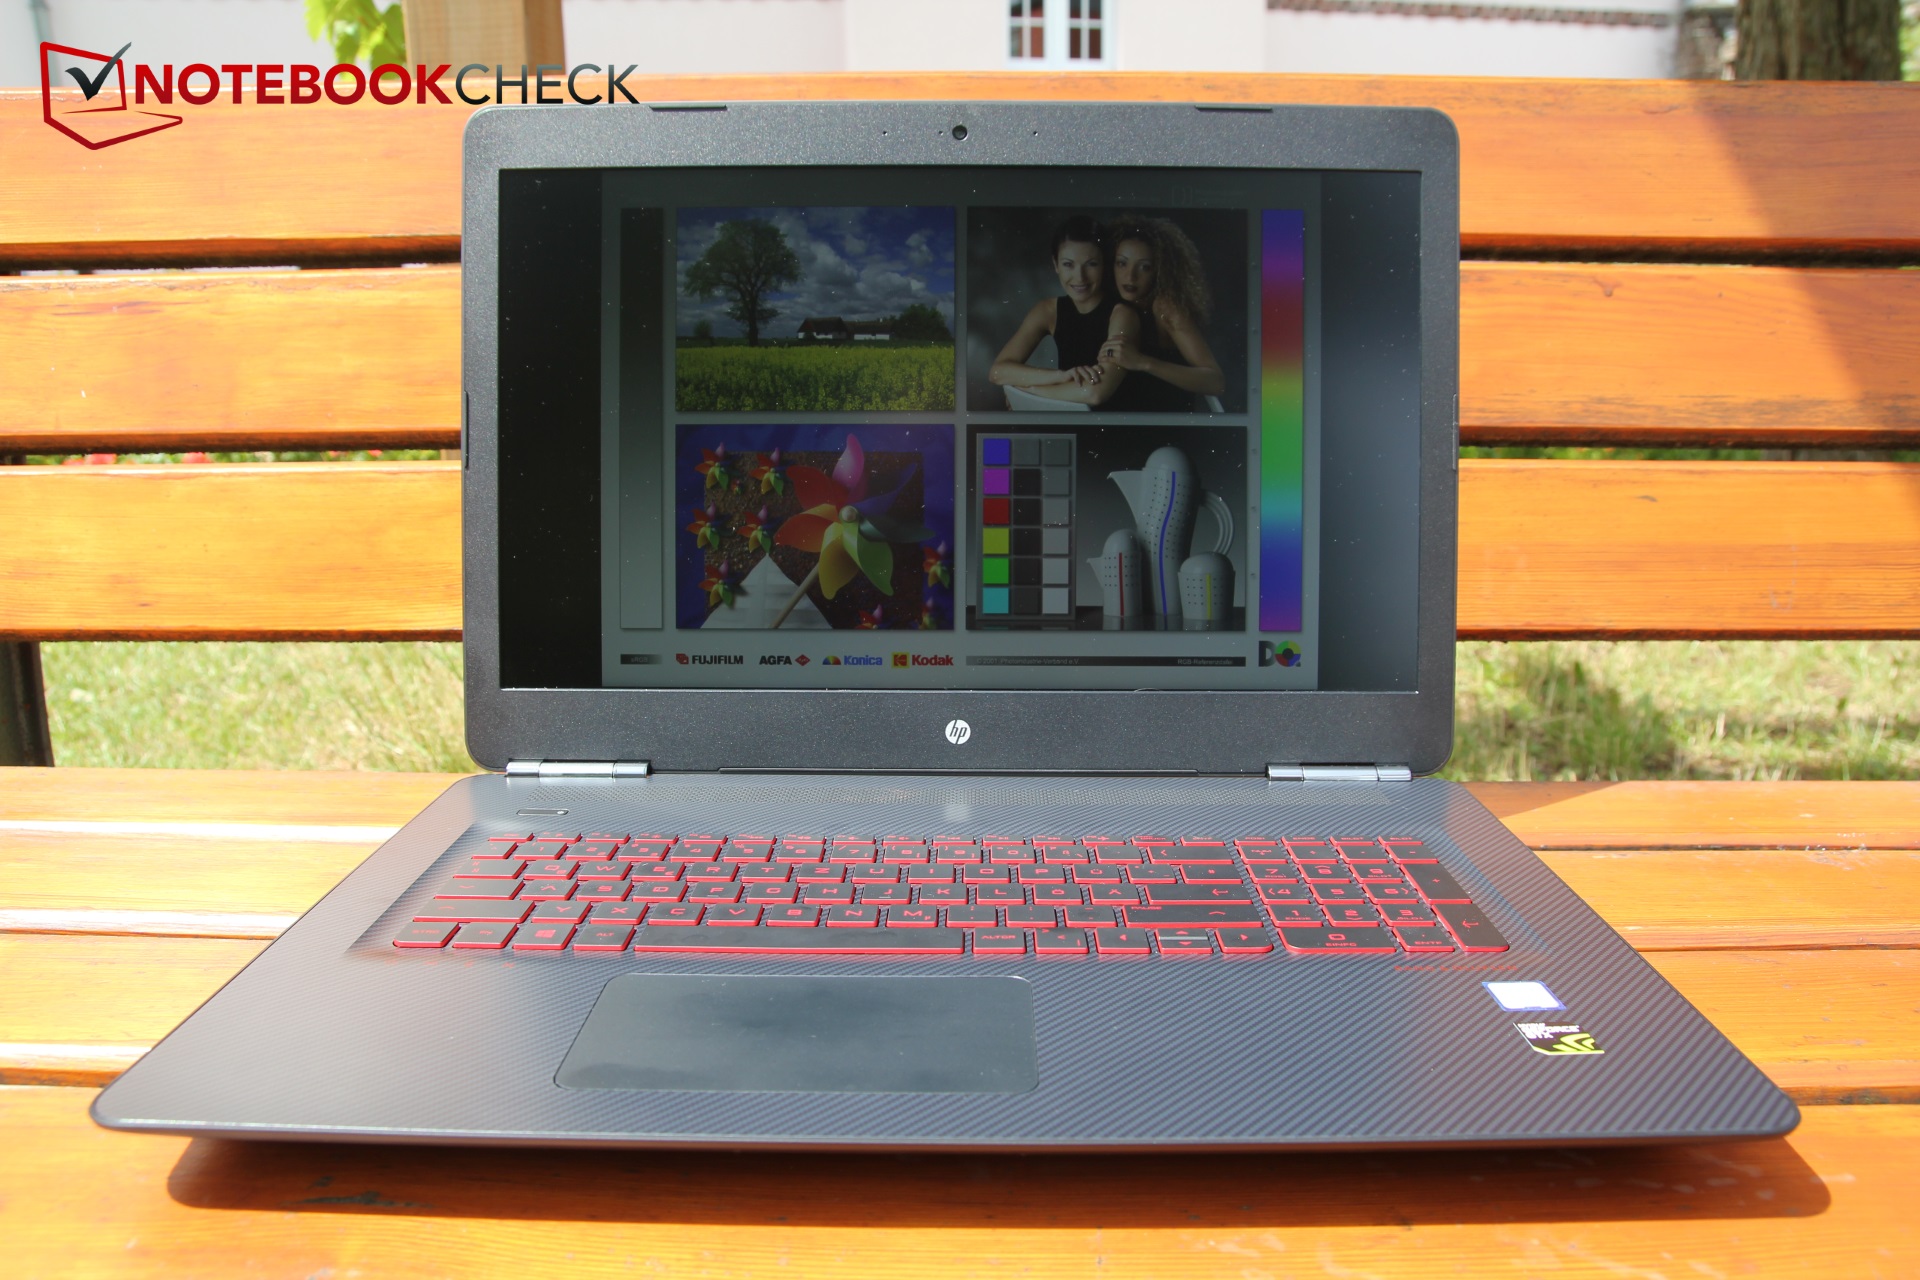
Omen 17-w206ng让我们有点震惊和失望。我们的直觉感觉告诉我们,如果只有惠普没有把事情搞砸,这可能是一个非常强大的笔记本电脑。
该机的设计整体令人愉快,其组件平衡而强大。理论上,我们会惊叹于非常快的处理器,16 GB运行内存,一个Pascal 图形处理器,一个快速固体硬盘和一个1 TB的硬盘硬盘。“理论上”,也就是说,在现实中,Omen并不表现出得很出彩。
屏幕漏光和闪烁;dpc延迟;容易产生噪音和热量。
这些严重的缺点实际上削弱了Omen 17的品质,因此,我们不能向任何人推荐该设备。这些缺点是可以避免,然而惠普的质量控制还是失败了。
该机在理论上是一个非常全面且优秀的设备。但是,它算不上优秀,也不能反悔潜在性能。
所以,我们不推荐任何人购买该机。
HP Omen 17-w206ng
- 07/02/2017 v6 (old)
Christian Hintze
Price comparison
