宏碁 Aspire VX5-591G (7700HQ, FHD, GTX 1050 Ti) 笔记本电脑简短评测

| SD Card Reader | |
| average JPG Copy Test (av. of 3 runs) | |
| Dell XPS 15 2017 9560 (7300HQ, Full-HD) | |
| Acer Aspire VX5-591G-75C4 VX15 | |
| Acer Aspire VN7-593G-73HP V15 Nitro BE | |
| Asus Zenbook UX510UW-CN044T | |
| maximum AS SSD Seq Read Test (1GB) | |
| Dell XPS 15 2017 9560 (7300HQ, Full-HD) | |
| Acer Aspire VX5-591G-75C4 VX15 | |
| Acer Aspire VN7-593G-73HP V15 Nitro BE | |
| Asus Zenbook UX510UW-CN044T | |
| |||||||||||||||||||||||||
Brightness Distribution: 85 %
Center on Battery: 281 cd/m²
Contrast: 878:1 (Black: 0.32 cd/m²)
ΔE ColorChecker Calman: 5.16 | ∀{0.5-29.43 Ø4.71}
ΔE Greyscale Calman: 4.57 | ∀{0.09-98 Ø4.96}
58% sRGB (Argyll 1.6.3 3D)
37% AdobeRGB 1998 (Argyll 1.6.3 3D)
40.2% AdobeRGB 1998 (Argyll 3D)
58.2% sRGB (Argyll 3D)
38.88% Display P3 (Argyll 3D)
Gamma: 2.59
CCT: 6931 K
| Acer Aspire VX5-591G-75C4 VX15 LG Philips LGD0550 / LP156WF6-SPK4, , 1920x1080, 15.6" | Acer Aspire VN7-593G-73HP V15 Nitro BE LG Display LP156WF6-SPP1, , 1920x1080, 15.6" | Dell XPS 15 2017 9560 (7300HQ, Full-HD) Sharp SHP1453 LQ156M1, , 1920x1080, 15.6" | Asus Zenbook UX510UW-CN044T LG Philips LP156WF6-SPB6, , 1920x1080, 15.6" | |
|---|---|---|---|---|
| Display | 57% | 74% | 47% | |
| Display P3 Coverage (%) | 38.88 | 65.8 69% | 68.9 77% | 61.5 58% |
| sRGB Coverage (%) | 58.2 | 85.1 46% | 98.9 70% | 80.4 38% |
| AdobeRGB 1998 Coverage (%) | 40.2 | 62.2 55% | 70.9 76% | 58.8 46% |
| Response Times | -67% | -137% | -48% | |
| Response Time Grey 50% / Grey 80% * (ms) | 22 ? | 41 ? -86% | 54 ? -145% | 40 ? -82% |
| Response Time Black / White * (ms) | 23 ? | 34 ? -48% | 52.4 ? -128% | 26 ? -13% |
| PWM Frequency (Hz) | ||||
| Screen | 16% | 27% | 7% | |
| Brightness middle (cd/m²) | 281 | 322 15% | 400 42% | 326 16% |
| Brightness (cd/m²) | 257 | 297 16% | 392 53% | 316 23% |
| Brightness Distribution (%) | 85 | 86 1% | 89 5% | 80 -6% |
| Black Level * (cd/m²) | 0.32 | 0.31 3% | 0.26 19% | 0.35 -9% |
| Contrast (:1) | 878 | 1039 18% | 1538 75% | 931 6% |
| Colorchecker dE 2000 * | 5.16 | 4.73 8% | 4.9 5% | 5.49 -6% |
| Colorchecker dE 2000 max. * | 9.09 | 12.37 -36% | 11 -21% | 11.36 -25% |
| Greyscale dE 2000 * | 4.57 | 2.99 35% | 7.2 -58% | 4.84 -6% |
| Gamma | 2.59 85% | 2.32 95% | 2.11 104% | 2.23 99% |
| CCT | 6931 94% | 6905 94% | 6911 94% | 5971 109% |
| Color Space (Percent of AdobeRGB 1998) (%) | 37 | 56 51% | 64.2 74% | 53 43% |
| Color Space (Percent of sRGB) (%) | 58 | 85 47% | 98.9 71% | 80 38% |
| Total Average (Program / Settings) | 2% /
13% | -12% /
14% | 2% /
8% |
* ... smaller is better
Display Response Times
| ↔ Response Time Black to White | ||
|---|---|---|
| 23 ms ... rise ↗ and fall ↘ combined | ↗ 13 ms rise | 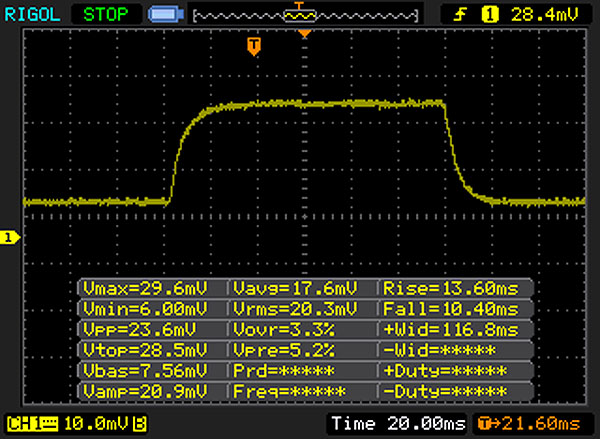 |
| ↘ 10 ms fall | ||
| The screen shows good response rates in our tests, but may be too slow for competitive gamers. In comparison, all tested devices range from 0.1 (minimum) to 240 (maximum) ms. » 52 % of all devices are better. This means that the measured response time is worse than the average of all tested devices (19.8 ms). | ||
| ↔ Response Time 50% Grey to 80% Grey | ||
| 22 ms ... rise ↗ and fall ↘ combined | ↗ 10 ms rise | 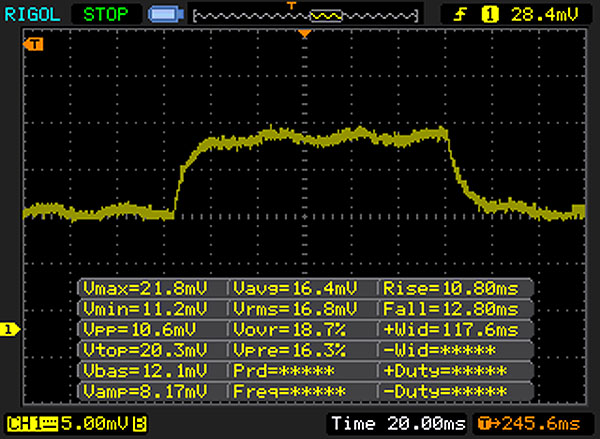 |
| ↘ 12 ms fall | ||
| The screen shows good response rates in our tests, but may be too slow for competitive gamers. In comparison, all tested devices range from 0.165 (minimum) to 636 (maximum) ms. » 34 % of all devices are better. This means that the measured response time is better than the average of all tested devices (31 ms). | ||
Screen Flickering / PWM (Pulse-Width Modulation)
| Screen flickering / PWM not detected | ||
In comparison: 52 % of all tested devices do not use PWM to dim the display. If PWM was detected, an average of 7754 (minimum: 5 - maximum: 343500) Hz was measured. | ||
| PCMark 8 | |
| Home Score Accelerated v2 | |
| Dell XPS 15 2017 9560 (7300HQ, Full-HD) | |
| Acer Aspire VX5-591G-75C4 VX15 | |
| Asus Zenbook UX510UW-CN044T | |
| Work Score Accelerated v2 | |
| Dell XPS 15 2017 9560 (7300HQ, Full-HD) | |
| Acer Aspire VX5-591G-75C4 VX15 | |
| Asus Zenbook UX510UW-CN044T | |
| PCMark 8 Home Score Accelerated v2 | 3565 points | |
| PCMark 8 Work Score Accelerated v2 | 4442 points | |
Help | ||
| Acer Aspire VX5-591G-75C4 VX15 Toshiba MQ01ABD100 | Acer Aspire VN7-593G-73HP V15 Nitro BE Seagate Mobile HDD 1TB ST1000LM035 | Dell XPS 15 2017 9560 (7300HQ, Full-HD) WDC WD10SPCX-75KHST0 + SanDisk Z400s M.2 2242 32 GB Cache | Asus Zenbook UX510UW-CN044T SanDisk SD8SNAT256G1002 | |
|---|---|---|---|---|
| CrystalDiskMark 3.0 | 28% | 1647% | 8078% | |
| Read Seq (MB/s) | 101.5 | 120.9 19% | 123 21% | 459.3 353% |
| Write Seq (MB/s) | 100.6 | 101.8 1% | 74.2 -26% | 325.5 224% |
| Read 512 (MB/s) | 28.33 | 37.83 34% | 101.7 259% | 279.2 886% |
| Write 512 (MB/s) | 28.31 | 84.4 198% | 42.51 50% | 280.1 889% |
| Read 4k (MB/s) | 0.327 | 0.473 45% | 10.84 3215% | 22.43 6759% |
| Write 4k (MB/s) | 0.846 | 0.313 -63% | 1.021 21% | 74.9 8753% |
| Read 4k QD32 (MB/s) | 0.718 | 1.133 58% | 69.8 9621% | 149 20652% |
| Write 4k QD32 (MB/s) | 0.893 | 0.274 -69% | 1.057 18% | 234 26104% |

| 3DMark 11 - 1280x720 Performance GPU | |
| Acer Aspire VN7-593G-73HP V15 Nitro BE | |
| Acer Aspire VX5-591G-75C4 VX15 | |
| Dell XPS 15 2017 9560 (7300HQ, Full-HD) | |
| Asus Zenbook UX510UW-CN044T | |
| 3DMark | |
| 1280x720 Cloud Gate Standard Graphics | |
| Acer Aspire VN7-593G-73HP V15 Nitro BE | |
| Acer Aspire VX5-591G-75C4 VX15 | |
| Dell XPS 15 2017 9560 (7300HQ, Full-HD) | |
| Asus Zenbook UX510UW-CN044T | |
| 1920x1080 Fire Strike Graphics | |
| Acer Aspire VN7-593G-73HP V15 Nitro BE | |
| Acer Aspire VX5-591G-75C4 VX15 | |
| Dell XPS 15 2017 9560 (7300HQ, Full-HD) | |
| Asus Zenbook UX510UW-CN044T | |
| 3DMark 11 Performance | 8674 points | |
| 3DMark Cloud Gate Standard Score | 20791 points | |
| 3DMark Fire Strike Score | 6774 points | |
Help | ||
| The Witcher 3 - 1920x1080 Ultra Graphics & Postprocessing (HBAO+) | |
| Acer Aspire VN7-593G-73HP V15 Nitro BE | |
| Acer Aspire VX5-591G-75C4 VX15 | |
| Dell XPS 15 2017 9560 (7300HQ, Full-HD) | |
| low | med. | high | ultra | |
|---|---|---|---|---|
| The Witcher 3 (2015) | 45.8 | 25.2 | ||
| The Division (2016) | 0 | 42.6 | 34.9 | |
| For Honor (2017) | 44.8 | 40.9 | 21.2 | |
| Ghost Recon Wildlands (2017) | 40.9 | 21.2 |
Noise level
| Idle |
| 31.4 / 31.4 / 31.4 dB(A) |
| HDD |
| 31.8 dB(A) |
| Load |
| 36.8 / 41.3 dB(A) |
 | ||
30 dB silent 40 dB(A) audible 50 dB(A) loud |
||
min: | ||
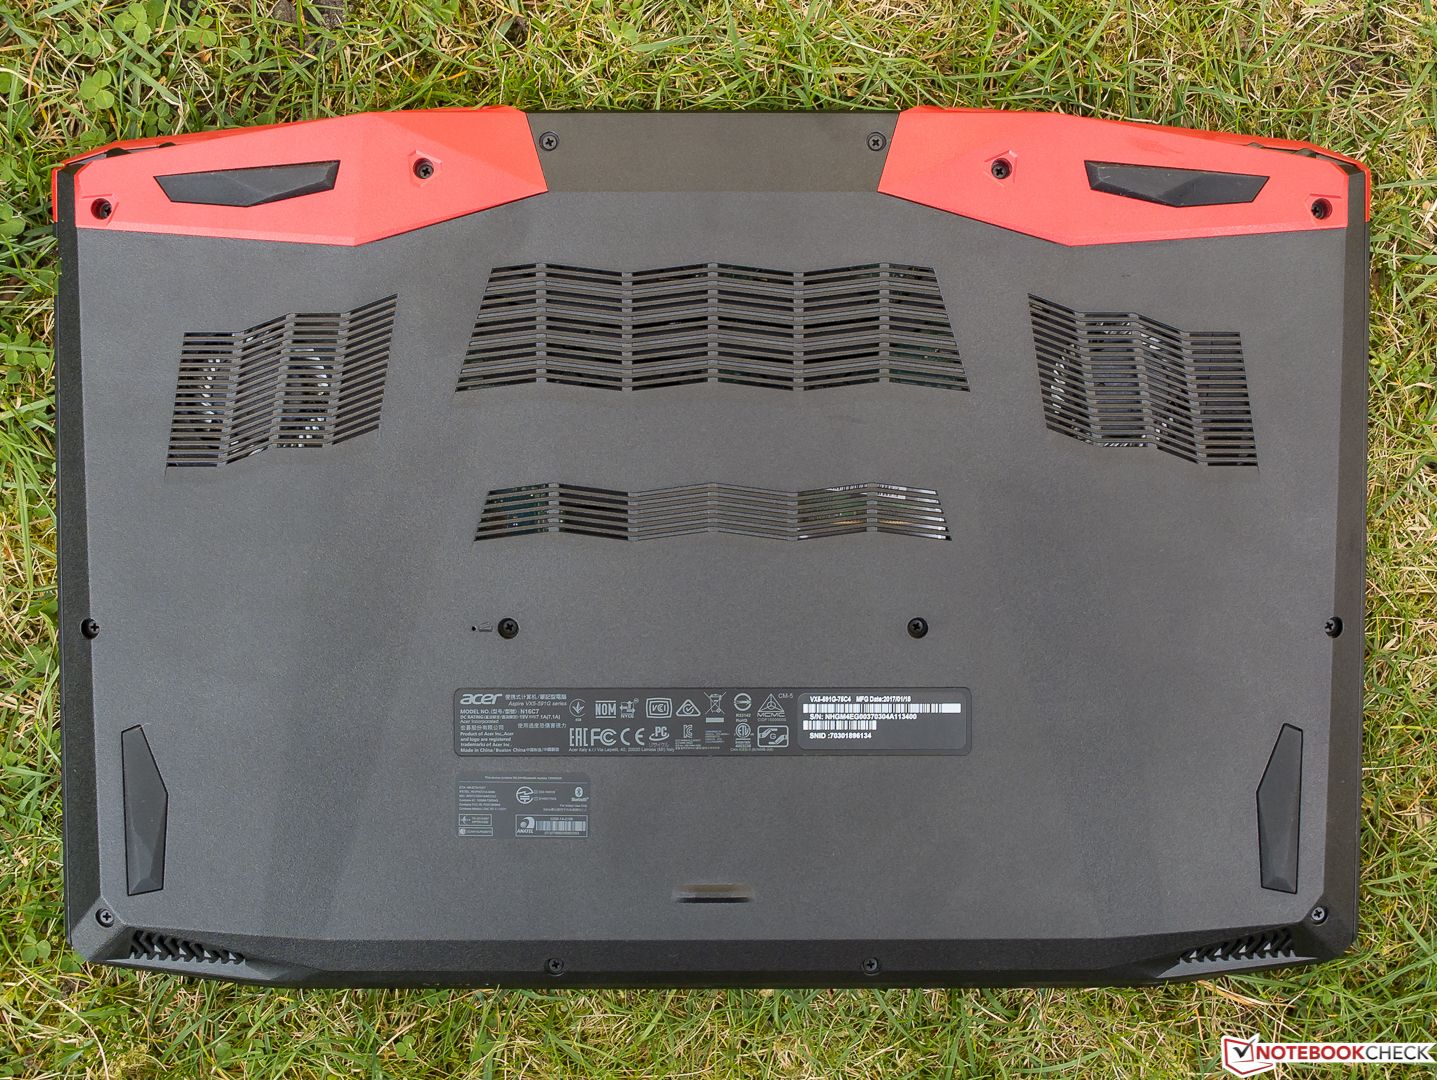
(-) The maximum temperature on the upper side is 47 °C / 117 F, compared to the average of 36.8 °C / 98 F, ranging from 21 to 71 °C for the class Multimedia.
(-) The bottom heats up to a maximum of 47 °C / 117 F, compared to the average of 39.1 °C / 102 F
(+) In idle usage, the average temperature for the upper side is 24.6 °C / 76 F, compared to the device average of 31.3 °C / 88 F.
(+) The palmrests and touchpad are cooler than skin temperature with a maximum of 29.3 °C / 84.7 F and are therefore cool to the touch.
(±) The average temperature of the palmrest area of similar devices was 28.7 °C / 83.7 F (-0.6 °C / -1 F).
Acer Aspire VX5-591G-75C4 VX15 audio analysis
(±) | speaker loudness is average but good (73 dB)
Bass 100 - 315 Hz
(-) | nearly no bass - on average 15% lower than median
(±) | linearity of bass is average (10.7% delta to prev. frequency)
Mids 400 - 2000 Hz
(+) | balanced mids - only 1.9% away from median
(+) | mids are linear (5.9% delta to prev. frequency)
Highs 2 - 16 kHz
(+) | balanced highs - only 4.8% away from median
(+) | highs are linear (2.2% delta to prev. frequency)
Overall 100 - 16.000 Hz
(+) | overall sound is linear (14.8% difference to median)
Compared to same class
» 35% of all tested devices in this class were better, 4% similar, 61% worse
» The best had a delta of 5%, average was 17%, worst was 45%
Compared to all devices tested
» 20% of all tested devices were better, 4% similar, 76% worse
» The best had a delta of 4%, average was 23%, worst was 134%
Acer Aspire VN7-593G-73HP V15 Nitro BE audio analysis
(±) | speaker loudness is average but good (80 dB)
Bass 100 - 315 Hz
(±) | reduced bass - on average 11.8% lower than median
(±) | linearity of bass is average (13.5% delta to prev. frequency)
Mids 400 - 2000 Hz
(±) | higher mids - on average 5.5% higher than median
(+) | mids are linear (6.6% delta to prev. frequency)
Highs 2 - 16 kHz
(+) | balanced highs - only 1.1% away from median
(+) | highs are linear (4% delta to prev. frequency)
Overall 100 - 16.000 Hz
(+) | overall sound is linear (14.6% difference to median)
Compared to same class
» 35% of all tested devices in this class were better, 4% similar, 61% worse
» The best had a delta of 5%, average was 17%, worst was 45%
Compared to all devices tested
» 19% of all tested devices were better, 4% similar, 77% worse
» The best had a delta of 4%, average was 23%, worst was 134%
Dell XPS 15 2017 9560 (7300HQ, Full-HD) audio analysis
(+) | speakers can play relatively loud (87 dB)
Bass 100 - 315 Hz
(-) | nearly no bass - on average 15.8% lower than median
(±) | linearity of bass is average (13.9% delta to prev. frequency)
Mids 400 - 2000 Hz
(+) | balanced mids - only 4.3% away from median
(±) | linearity of mids is average (7.1% delta to prev. frequency)
Highs 2 - 16 kHz
(+) | balanced highs - only 3.1% away from median
(±) | linearity of highs is average (7.9% delta to prev. frequency)
Overall 100 - 16.000 Hz
(+) | overall sound is linear (13.5% difference to median)
Compared to same class
» 29% of all tested devices in this class were better, 4% similar, 67% worse
» The best had a delta of 5%, average was 17%, worst was 45%
Compared to all devices tested
» 14% of all tested devices were better, 4% similar, 82% worse
» The best had a delta of 4%, average was 23%, worst was 134%
Asus Zenbook UX510UW-CN044T audio analysis
(±) | speaker loudness is average but good (73 dB)
Bass 100 - 315 Hz
(±) | reduced bass - on average 14.8% lower than median
(±) | linearity of bass is average (7.2% delta to prev. frequency)
Mids 400 - 2000 Hz
(+) | balanced mids - only 3% away from median
(+) | mids are linear (6.3% delta to prev. frequency)
Highs 2 - 16 kHz
(±) | higher highs - on average 6% higher than median
(+) | highs are linear (4.6% delta to prev. frequency)
Overall 100 - 16.000 Hz
(±) | linearity of overall sound is average (16.6% difference to median)
Compared to same class
» 44% of all tested devices in this class were better, 7% similar, 50% worse
» The best had a delta of 5%, average was 17%, worst was 45%
Compared to all devices tested
» 29% of all tested devices were better, 6% similar, 65% worse
» The best had a delta of 4%, average was 23%, worst was 134%
| Off / Standby | |
| Idle | |
| Load |
|
Key:
min: | |
| Acer Aspire VX5-591G-75C4 VX15 i7-7700HQ, GeForce GTX 1050 Ti Mobile, Toshiba MQ01ABD100, IPS, 1920x1080, 15.6" | Acer Aspire VN7-593G-73HP V15 Nitro BE i7-7700HQ, GeForce GTX 1060 Mobile, Seagate Mobile HDD 1TB ST1000LM035, AH-IPS, Normally Black, Transmissive, 1920x1080, 15.6" | Dell XPS 15 2017 9560 (7300HQ, Full-HD) i5-7300HQ, GeForce GTX 1050 Mobile, WDC WD10SPCX-75KHST0 + SanDisk Z400s M.2 2242 32 GB Cache, LED IGZO IPS InfinityEdge, 1920x1080, 15.6" | Asus Zenbook UX510UW-CN044T 6500U, GeForce GTX 960M, SanDisk SD8SNAT256G1002, IPS, 1920x1080, 15.6" | |
|---|---|---|---|---|
| Power Consumption | -9% | 8% | 23% | |
| Idle Minimum * (Watt) | 7 | 7.2 -3% | 6.6 6% | 5 29% |
| Idle Average * (Watt) | 10.2 | 10.5 -3% | 9 12% | 8.9 13% |
| Idle Maximum * (Watt) | 14 | 16 -14% | 10.7 24% | 11.8 16% |
| Load Average * (Watt) | 78 | 82 -5% | 77.5 1% | 55 29% |
| Load Maximum * (Watt) | 127 | 155 -22% | 130 -2% | 93 27% |
| Witcher 3 ultra * (Watt) | 124 |
* ... smaller is better
| Acer Aspire VX5-591G-75C4 VX15 i7-7700HQ, GeForce GTX 1050 Ti Mobile, 52.5 Wh | Acer Aspire VN7-593G-73HP V15 Nitro BE i7-7700HQ, GeForce GTX 1060 Mobile, 69 Wh | Dell XPS 15 2017 9560 (7300HQ, Full-HD) i5-7300HQ, GeForce GTX 1050 Mobile, 56 Wh | Asus Zenbook UX510UW-CN044T 6500U, GeForce GTX 960M, 48 Wh | |
|---|---|---|---|---|
| Battery runtime | 49% | 29% | 70% | |
| Reader / Idle (h) | 5.4 | 8.4 56% | 9.4 74% | 13.6 152% |
| WiFi v1.3 (h) | 5 | 6 20% | 5.6 12% | 7.2 44% |
| Load (h) | 1.4 | 2.4 71% | 1.4 0% | 1.6 14% |
| H.264 (h) | 7.1 |
Pros
Cons
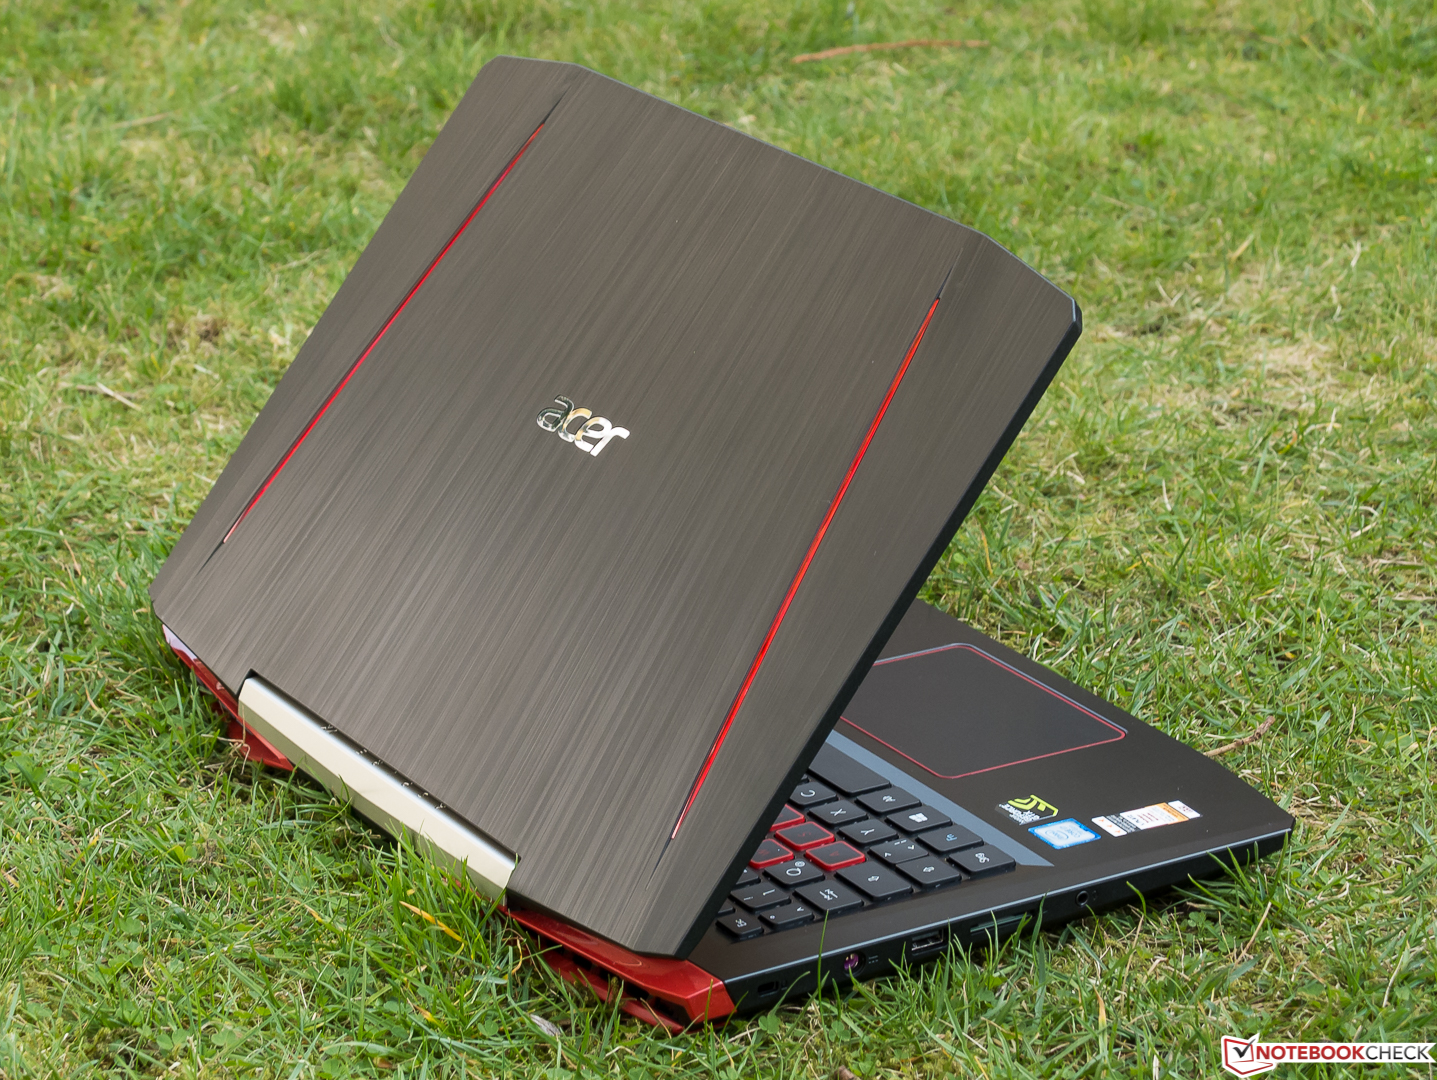
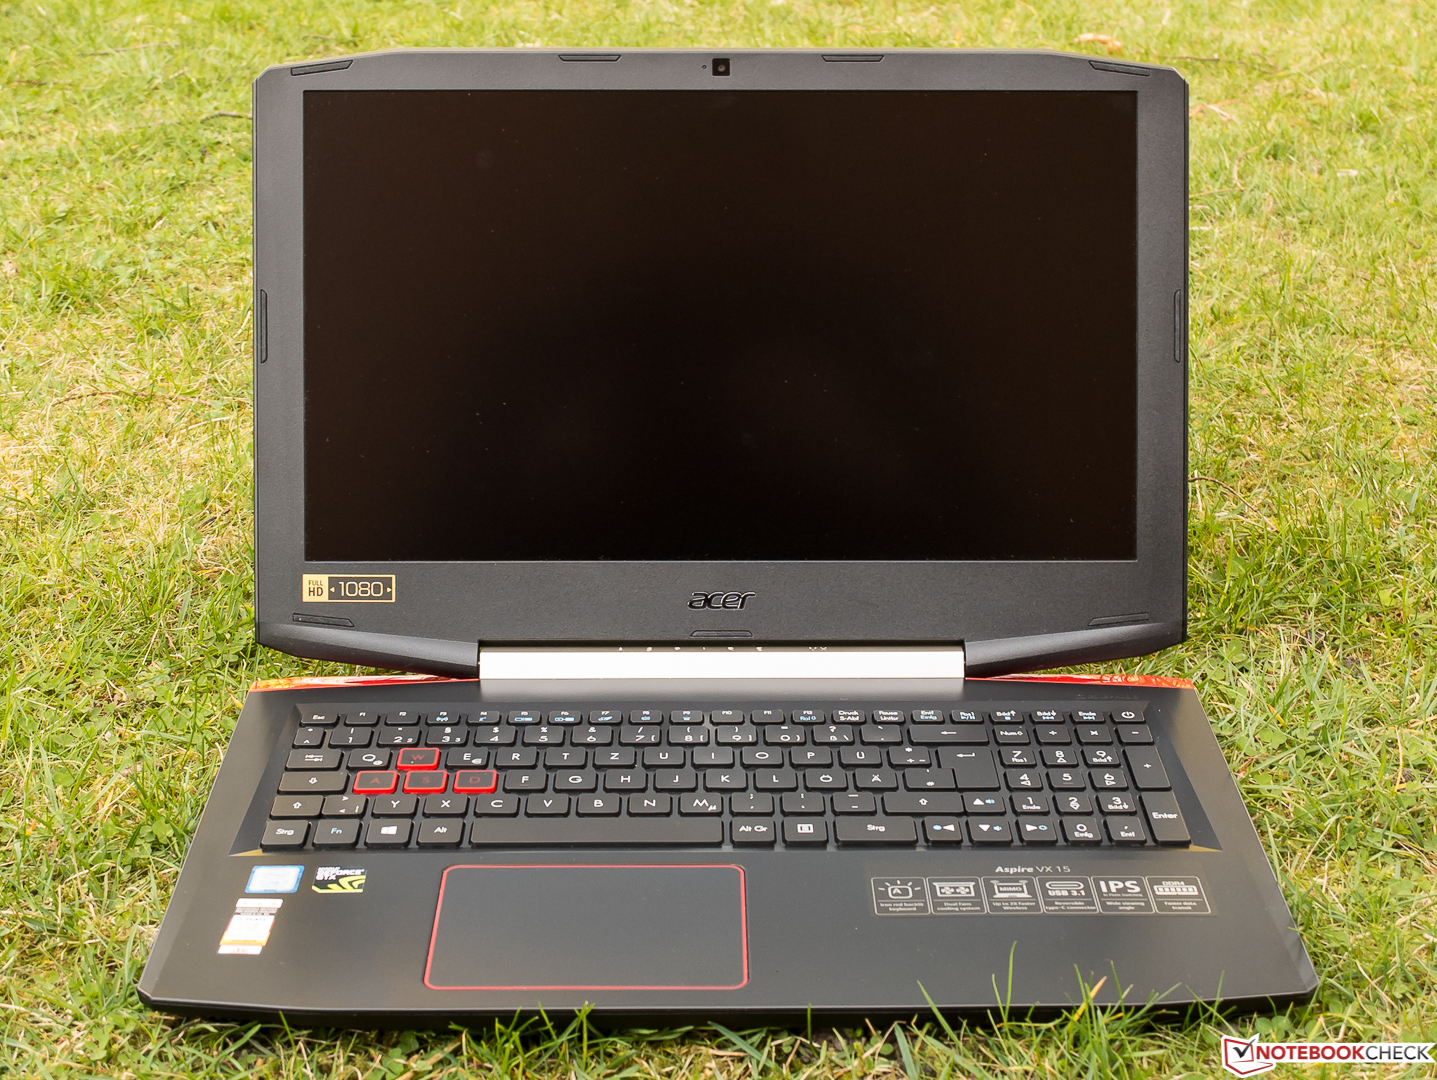
不算出众,但也无懈可击——宏碁的VX5-591G-75C4设计合理,表现优秀。
除了高速处理器,它的其他硬件也属于中高端配置,符合1000欧元(约7385人民币)的定价;搭配SSD的机型售价1200欧元(约8863人民币)。这也是它最大的弱点所在:如果希望成为一台值得推荐的成功多媒体设备,固态硬盘几乎不可或缺。对于需要更强游戏性能(如GTX 1060显卡)的用户,则需要在散热和噪音方面做出一些妥协,这台宏碁最新多媒体设备在运行中十分安静,也是它的优势之一。
注:本文是基于完整评测的缩减版本,阅读完整的英文评测,请点击这里。
Acer Aspire VX5-591G-75C4 VX15
- 04/11/2017 v6 (old)
Sven Kloevekorn