Schenker XMG P507 (Clevo P651HS-G) 笔记本电脑简短评测
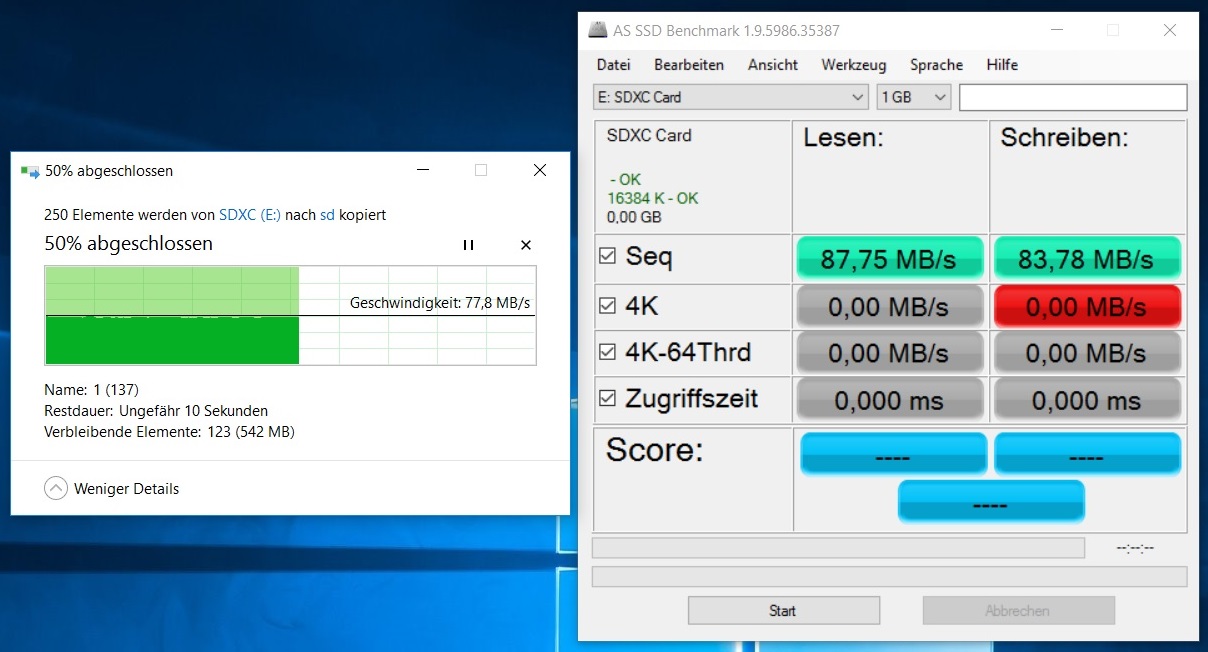
| SD Card Reader | |
| average JPG Copy Test (av. of 3 runs) | |
| MSI GT62VR-6RE16H21 | |
| Schenker XMG P507 PRO | |
| Schenker XMG P507 | |
| Asus Strix GL502VS-FY032T | |
| MSI GS63VR-6RF16H22 Stealth Pro | |
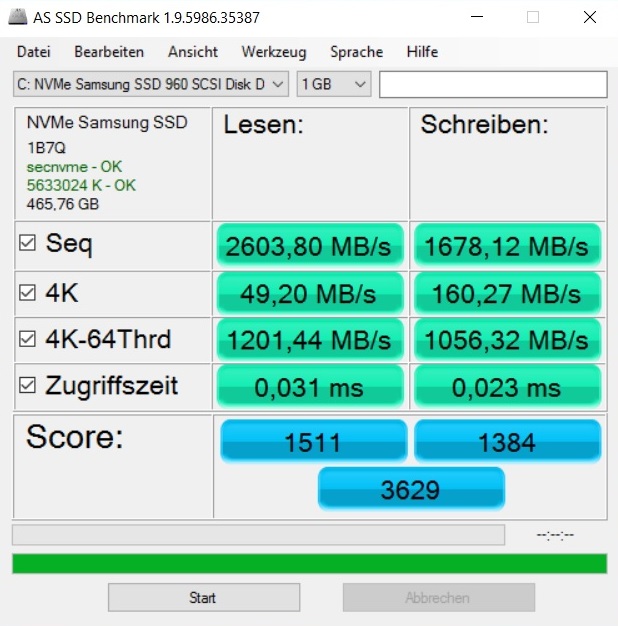
| maximum AS SSD Seq Read Test (1GB) | |
| MSI GT62VR-6RE16H21 | |
| Schenker XMG P507 PRO | |
| Schenker XMG P507 | |
| Asus Strix GL502VS-FY032T | |
| MSI GS63VR-6RF16H22 Stealth Pro | |
| Networking | |
| iperf3 transmit AX12 | |
| Schenker XMG P507 PRO | |
| iperf3 receive AX12 | |
| Schenker XMG P507 PRO | |
| |||||||||||||||||||||||||
Brightness Distribution: 85 %
Center on Battery: 357 cd/m²
Contrast: 714:1 (Black: 0.5 cd/m²)
ΔE ColorChecker Calman: 9.93 | ∀{0.5-29.43 Ø4.71}
ΔE Greyscale Calman: 10.32 | ∀{0.09-98 Ø4.96}
89% sRGB (Argyll 1.6.3 3D)
58% AdobeRGB 1998 (Argyll 1.6.3 3D)
65.1% AdobeRGB 1998 (Argyll 3D)
88.9% sRGB (Argyll 3D)
66.4% Display P3 (Argyll 3D)
Gamma: 2.11
CCT: 10096 K
| Schenker XMG P507 PRO AUO B156HTN05.2 (AUO52ED), 1920x1080 | Schenker XMG P507 LG Philips LP156WF6 (LGD046F), 1920x1080 | MSI GT62VR-6RE16H21 LG Philips LP156WF6 (LGD046F), 1920x1080 | MSI GS63VR-6RF16H22 Stealth Pro Samsung 156HL01-104 (SDC324C) , 1920x1080 | Asus Strix GL502VS-FY032T LG Philips LP156WF6-SPB6 (LGD046F), 1920x1080 | |
|---|---|---|---|---|---|
| Display | -5% | -4% | 6% | -6% | |
| Display P3 Coverage (%) | 66.4 | 64.5 -3% | 64.6 -3% | 67.8 2% | 64.5 -3% |
| sRGB Coverage (%) | 88.9 | 83.4 -6% | 84.6 -5% | 97.4 10% | 83.1 -7% |
| AdobeRGB 1998 Coverage (%) | 65.1 | 61 -6% | 61.8 -5% | 69.7 7% | 60.8 -7% |
| Response Times | -71% | -63% | -117% | -75% | |
| Response Time Grey 50% / Grey 80% * (ms) | 24 ? | 36 ? -50% | 34 ? -42% | 38 ? -58% | |
| Response Time Black / White * (ms) | 12 ? | 23 ? -92% | 22 ? -83% | 26 ? -117% | 23 ? -92% |
| PWM Frequency (Hz) | 202 ? | ||||
| Screen | 17% | 21% | 22% | 18% | |
| Brightness middle (cd/m²) | 357 | 288 -19% | 273 -24% | 293 -18% | 315 -12% |
| Brightness (cd/m²) | 365 | 292 -20% | 278 -24% | 279 -24% | 290 -21% |
| Brightness Distribution (%) | 85 | 87 2% | 88 4% | 84 -1% | 85 0% |
| Black Level * (cd/m²) | 0.5 | 0.3 40% | 0.27 46% | 0.33 34% | 0.32 36% |
| Contrast (:1) | 714 | 960 34% | 1011 42% | 888 24% | 984 38% |
| Colorchecker dE 2000 * | 9.93 | 5.1 49% | 3.67 63% | 3.59 64% | 4.88 51% |
| Colorchecker dE 2000 max. * | 14.87 | 9.44 37% | 8.33 44% | 5.79 61% | 8.88 40% |
| Greyscale dE 2000 * | 10.32 | 4.43 57% | 2.73 74% | 3.86 63% | 4.17 60% |
| Gamma | 2.11 104% | 2.46 89% | 2.49 88% | 2.53 87% | 2.53 87% |
| CCT | 10096 64% | 6687 97% | 7029 92% | 7229 90% | 6683 97% |
| Color Space (Percent of AdobeRGB 1998) (%) | 58 | 55 -5% | 55 -5% | 63 9% | 55 -5% |
| Color Space (Percent of sRGB) (%) | 89 | 83 -7% | 84 -6% | 97 9% | 83 -7% |
| Total Average (Program / Settings) | -20% /
1% | -15% /
5% | -30% /
9% | -21% /
1% |
* ... smaller is better
Display Response Times
| ↔ Response Time Black to White | ||
|---|---|---|
| 12 ms ... rise ↗ and fall ↘ combined | ↗ 4 ms rise | 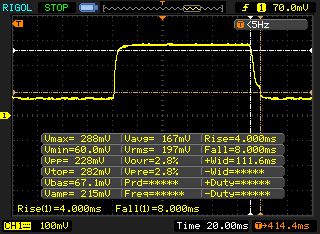 |
| ↘ 8 ms fall | ||
| The screen shows good response rates in our tests, but may be too slow for competitive gamers. In comparison, all tested devices range from 0.1 (minimum) to 240 (maximum) ms. » 32 % of all devices are better. This means that the measured response time is better than the average of all tested devices (19.8 ms). | ||
| ↔ Response Time 50% Grey to 80% Grey | ||
| 24 ms ... rise ↗ and fall ↘ combined | ↗ 12 ms rise | 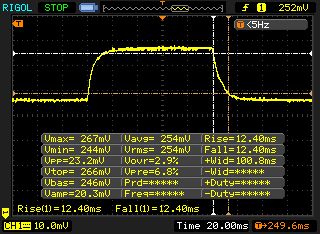 |
| ↘ 12 ms fall | ||
| The screen shows good response rates in our tests, but may be too slow for competitive gamers. In comparison, all tested devices range from 0.165 (minimum) to 636 (maximum) ms. » 35 % of all devices are better. This means that the measured response time is better than the average of all tested devices (30.9 ms). | ||
Screen Flickering / PWM (Pulse-Width Modulation)
| Screen flickering / PWM not detected | 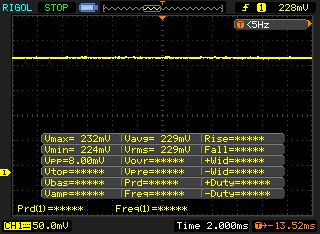 | ||
In comparison: 52 % of all tested devices do not use PWM to dim the display. If PWM was detected, an average of 7748 (minimum: 5 - maximum: 343500) Hz was measured. | |||
| PCMark 8 - Home Score Accelerated v2 | |
| Asus Strix GL502VS-FY032T | |
| MSI GT62VR-6RE16H21 | |
| Schenker XMG P507 PRO | |
| MSI GS63VR-6RF16H22 Stealth Pro | |
| PCMark 7 - Score | |
| Schenker XMG P507 PRO | |
| Schenker XMG P507 | |
| MSI GT62VR-6RE16H21 | |
| MSI GS63VR-6RF16H22 Stealth Pro | |
| PCMark 7 Score | 6390 points | |
| PCMark 8 Home Score Accelerated v2 | 4320 points | |
| PCMark 8 Creative Score Accelerated v2 | 5412 points | |
| PCMark 8 Work Score Accelerated v2 | 5180 points | |
Help | ||
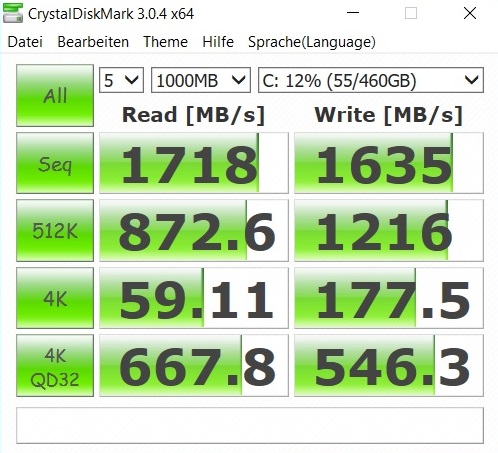
| Schenker XMG P507 PRO Samsung SSD 960 Evo 500GB m.2 NVMe | Schenker XMG P507 Samsung SM951 MZVPV256HDGL m.2 PCI-e | MSI GT62VR-6RE16H21 Toshiba HG6 THNSNJ256G8NY | MSI GS63VR-6RF16H22 Stealth Pro Samsung SM951 MZVPV256HDGL m.2 PCI-e | Asus Strix GL502VS-FY032T SanDisk SD8SNAT256G1002 | |
|---|---|---|---|---|---|
| AS SSD | -18% | -66% | -75% | ||
| Seq Read (MB/s) | 2604 | 1983 -24% | 502 -81% | 504 -81% | |
| Seq Write (MB/s) | 1678 | 1200 -28% | 455.5 -73% | 309.9 -82% | |
| 4K Read (MB/s) | 49.2 | 50 2% | 20.08 -59% | 16.31 -67% | |
| 4K Write (MB/s) | 160.3 | 144.1 -10% | 89.9 -44% | 65.5 -59% | |
| Score Total (Points) | 3629 | 2566 -29% | 915 -75% | 598 -84% |

| 3DMark - 1920x1080 Fire Strike Graphics | |
| MSI GT62VR-6RE16H21 | |
| Schenker XMG P507 PRO | |
| Asus Strix GL502VS-FY032T | |
| MSI GS63VR-6RF16H22 Stealth Pro | |
| Schenker XMG P507 | |
| 3DMark 11 - 1280x720 Performance GPU | |
| MSI GT62VR-6RE16H21 | |
| Asus Strix GL502VS-FY032T | |
| Schenker XMG P507 PRO | |
| MSI GS63VR-6RF16H22 Stealth Pro | |
| Schenker XMG P507 | |
| Unigine Heaven 4.0 - Extreme Preset DX11 | |
| Schenker XMG P507 PRO | |
| MSI GT62VR-6RE16H21 | |
| Schenker XMG P507 | |
| 3DMark 11 Performance | 16383 points | |
| 3DMark Ice Storm Standard Score | 91859 points | |
| 3DMark Cloud Gate Standard Score | 24365 points | |
| 3DMark Fire Strike Score | 13129 points | |
Help | ||
| XCOM 2 | |
| 1920x1080 Maximum Preset (8xMSAA instead of FXAA) AA:8xMS AF:16x | |
| Schenker XMG P507 PRO | |
| MSI GT62VR-6RE16H21 | |
| Schenker XMG P507 | |
| 1920x1080 High Preset AA:FX AF:8x | |
| Schenker XMG P507 PRO | |
| MSI GT62VR-6RE16H21 | |
| Schenker XMG P507 | |
| FIFA 17 | |
| 1920x1080 Ultra Preset AA:4xMS | |
| Schenker XMG P507 PRO | |
| 1920x1080 High Preset | |
| Schenker XMG P507 PRO | |
| Titanfall 2 | |
| 1920x1080 Very High (Insane Texture Quality) / Enabled AA:TS AF:16x | |
| Schenker XMG P507 PRO | |
| 1920x1080 High / Enabled AA:TS AF:8x | |
| Schenker XMG P507 PRO | |
| Call of Duty Infinite Warfare | |
| 1920x1080 Ultra / On AA:T2X SM | |
| Schenker XMG P507 PRO | |
| 1920x1080 High / On AA:FX | |
| Schenker XMG P507 PRO | |
| Dishonored 2 | |
| 1920x1080 Ultra Preset AA:TX | |
| Schenker XMG P507 PRO | |
| 1920x1080 High Preset AA:TX | |
| Schenker XMG P507 PRO | |
| Watch Dogs 2 | |
| 1920x1080 Ultra Preset | |
| Schenker XMG P507 PRO | |
| 1920x1080 High Preset | |
| Schenker XMG P507 PRO | |
| low | med. | high | ultra | |
|---|---|---|---|---|
| XCOM 2 (2016) | 71.3 | 41.7 | ||
| FIFA 17 (2016) | 200 | 196 | ||
| Titanfall 2 (2016) | 123 | 111 | ||
| Call of Duty Infinite Warfare (2016) | 114 | 112 | ||
| Dishonored 2 (2016) | 85.4 | 62.1 | ||
| Watch Dogs 2 (2016) | 75.3 | 55.1 |
Noise level
| Idle |
| 33 / 34 / 44 dB(A) |
| HDD |
| 34 dB(A) |
| Load |
| 46 / 52 dB(A) |
 | ||
30 dB silent 40 dB(A) audible 50 dB(A) loud |
||
min: | ||
| Schenker XMG P507 PRO GeForce GTX 1070 Mobile, i7-7700HQ | Schenker XMG P507 GeForce GTX 1060 Mobile, 6700HQ | MSI GT62VR-6RE16H21 GeForce GTX 1070 Mobile, 6700HQ | MSI GS63VR-6RF16H22 Stealth Pro GeForce GTX 1060 Mobile, 6700HQ | Asus Strix GL502VS-FY032T GeForce GTX 1070 Mobile, 6700HQ | |
|---|---|---|---|---|---|
| Noise | 6% | 10% | 11% | 8% | |
| off / environment * (dB) | 31 | 30 3% | 30 3% | 30 3% | 30 3% |
| Idle Minimum * (dB) | 33 | 31 6% | 32 3% | 32 3% | 32 3% |
| Idle Average * (dB) | 34 | 32 6% | 33 3% | 33 3% | 33 3% |
| Idle Maximum * (dB) | 44 | 38 14% | 34 23% | 34 23% | 34 23% |
| Load Average * (dB) | 46 | 46 -0% | 40 13% | 37 20% | 39 15% |
| Load Maximum * (dB) | 52 | 49 6% | 46 12% | 46 12% | 51 2% |
* ... smaller is better
(-) The maximum temperature on the upper side is 49.2 °C / 121 F, compared to the average of 40.4 °C / 105 F, ranging from 21.2 to 68.8 °C for the class Gaming.
(-) The bottom heats up to a maximum of 62 °C / 144 F, compared to the average of 43.2 °C / 110 F
(+) In idle usage, the average temperature for the upper side is 29.1 °C / 84 F, compared to the device average of 33.9 °C / 93 F.
(+) The palmrests and touchpad are cooler than skin temperature with a maximum of 31.6 °C / 88.9 F and are therefore cool to the touch.
(-) The average temperature of the palmrest area of similar devices was 28.8 °C / 83.8 F (-2.8 °C / -5.1 F).
| Schenker XMG P507 PRO GeForce GTX 1070 Mobile, i7-7700HQ | Schenker XMG P507 GeForce GTX 1060 Mobile, 6700HQ | MSI GT62VR-6RE16H21 GeForce GTX 1070 Mobile, 6700HQ | MSI GS63VR-6RF16H22 Stealth Pro GeForce GTX 1060 Mobile, 6700HQ | Asus Strix GL502VS-FY032T GeForce GTX 1070 Mobile, 6700HQ | |
|---|---|---|---|---|---|
| Heat | 6% | 13% | 12% | 8% | |
| Maximum Upper Side * (°C) | 49.2 | 49.3 -0% | 44 11% | 45.3 8% | 48 2% |
| Maximum Bottom * (°C) | 62 | 52.7 15% | 53.1 14% | 62.6 -1% | 46.8 25% |
| Idle Upper Side * (°C) | 32.4 | 32.6 -1% | 28.8 11% | 25.3 22% | 33.7 -4% |
| Idle Bottom * (°C) | 33 | 29.5 11% | 28.2 15% | 27.3 17% | 30.5 8% |
* ... smaller is better
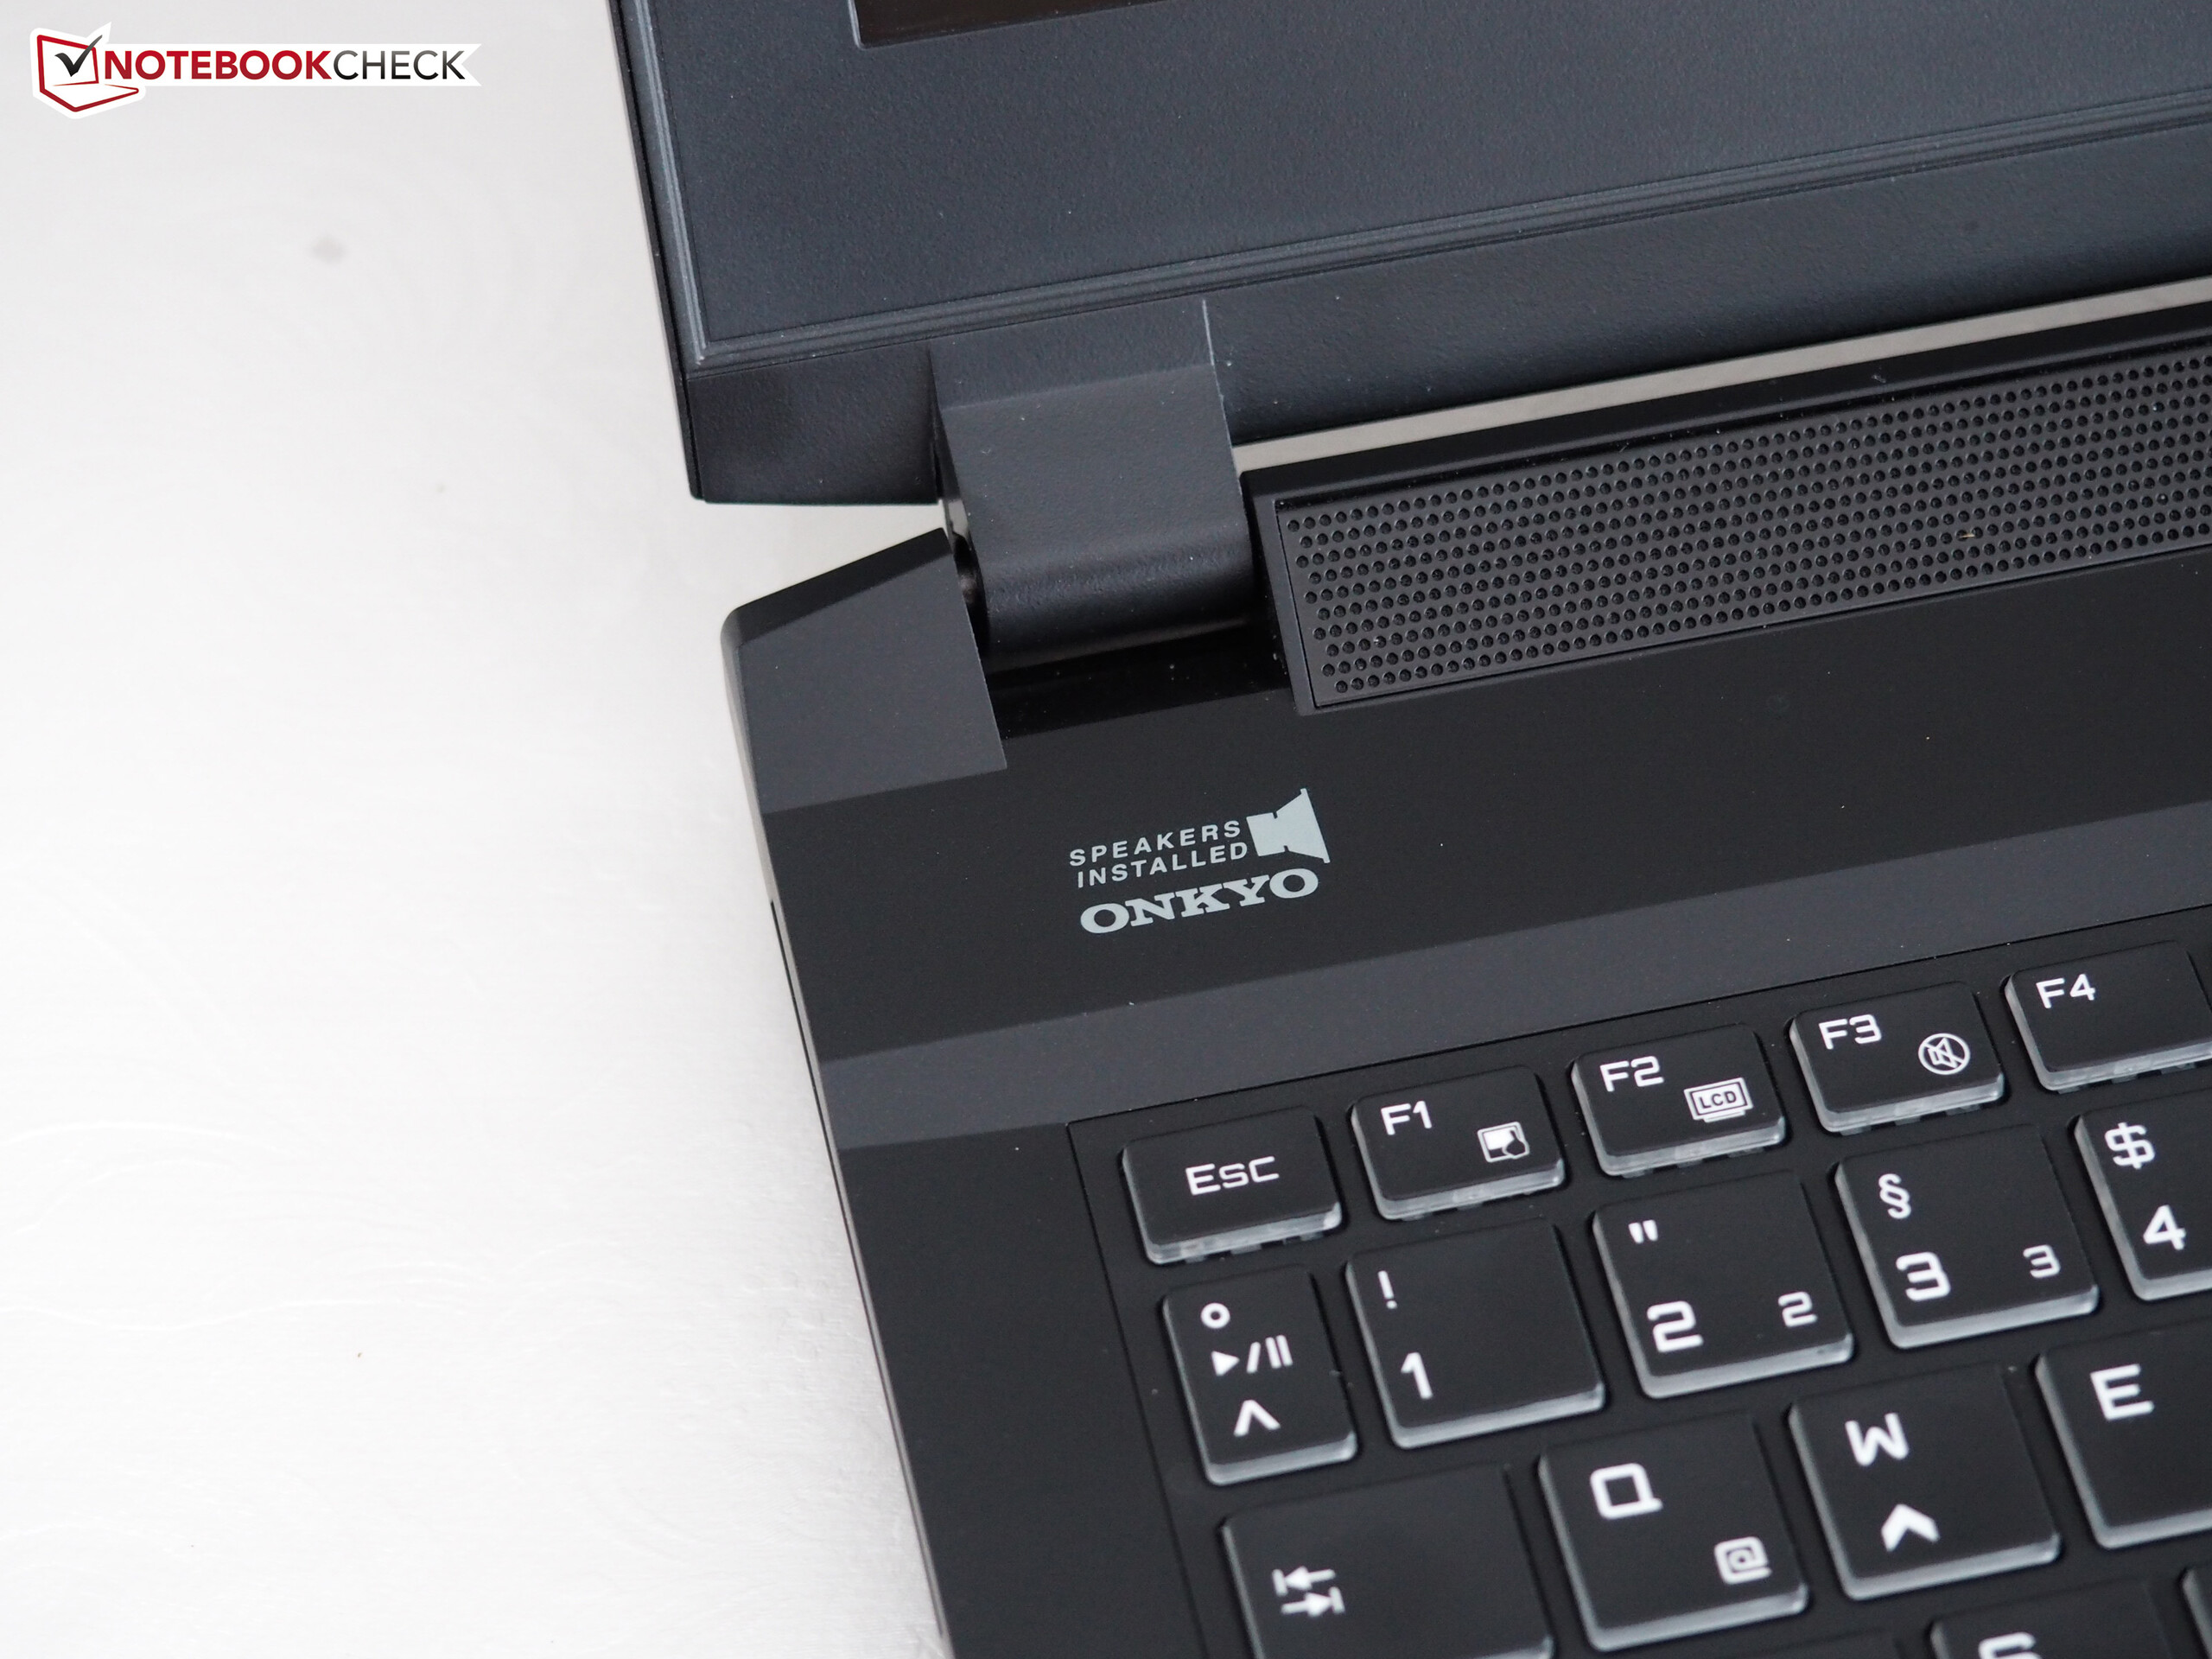
Schenker XMG P507 PRO audio analysis
(±) | speaker loudness is average but good (75 dB)
Bass 100 - 315 Hz
(-) | nearly no bass - on average 20.2% lower than median
(±) | linearity of bass is average (7.6% delta to prev. frequency)
Mids 400 - 2000 Hz
(+) | balanced mids - only 2.2% away from median
(+) | mids are linear (5.9% delta to prev. frequency)
Highs 2 - 16 kHz
(+) | balanced highs - only 2.2% away from median
(+) | highs are linear (4.4% delta to prev. frequency)
Overall 100 - 16.000 Hz
(±) | linearity of overall sound is average (19.8% difference to median)
Compared to same class
» 70% of all tested devices in this class were better, 6% similar, 24% worse
» The best had a delta of 6%, average was 18%, worst was 132%
Compared to all devices tested
» 51% of all tested devices were better, 7% similar, 42% worse
» The best had a delta of 4%, average was 23%, worst was 134%
Asus Strix GL502VS-FY032T audio analysis
(±) | speaker loudness is average but good (77 dB)
Bass 100 - 315 Hz
(-) | nearly no bass - on average 16.2% lower than median
(±) | linearity of bass is average (11.9% delta to prev. frequency)
Mids 400 - 2000 Hz
(+) | balanced mids - only 0.7% away from median
(+) | mids are linear (3.1% delta to prev. frequency)
Highs 2 - 16 kHz
(+) | balanced highs - only 3.5% away from median
(±) | linearity of highs is average (7.4% delta to prev. frequency)
Overall 100 - 16.000 Hz
(±) | linearity of overall sound is average (16.8% difference to median)
Compared to same class
» 44% of all tested devices in this class were better, 11% similar, 45% worse
» The best had a delta of 6%, average was 18%, worst was 132%
Compared to all devices tested
» 30% of all tested devices were better, 7% similar, 63% worse
» The best had a delta of 4%, average was 23%, worst was 134%
| Off / Standby | |
| Idle | |
| Load |
|
Key:
min: | |
| Schenker XMG P507 PRO GeForce GTX 1070 Mobile, i7-7700HQ | Schenker XMG P507 GeForce GTX 1060 Mobile, 6700HQ | MSI GT62VR-6RE16H21 GeForce GTX 1070 Mobile, 6700HQ | MSI GS63VR-6RF16H22 Stealth Pro GeForce GTX 1060 Mobile, 6700HQ | Asus Strix GL502VS-FY032T GeForce GTX 1070 Mobile, 6700HQ | |
|---|---|---|---|---|---|
| Power Consumption | 13% | -27% | -9% | -17% | |
| Idle Minimum * (Watt) | 14 | 11 21% | 20 -43% | 18 -29% | 20 -43% |
| Idle Average * (Watt) | 18 | 16 11% | 26 -44% | 22 -22% | 24 -33% |
| Idle Maximum * (Watt) | 24 | 21 12% | 32 -33% | 30 -25% | 29 -21% |
| Load Average * (Watt) | 87 | 80 8% | 100 -15% | 77 11% | 86 1% |
| Load Maximum * (Watt) | 201 | 174 13% | 202 -0% | 165 18% | 183 9% |
* ... smaller is better
| Schenker XMG P507 PRO GeForce GTX 1070 Mobile, i7-7700HQ, 60 Wh | Schenker XMG P507 GeForce GTX 1060 Mobile, 6700HQ, 60 Wh | MSI GT62VR-6RE16H21 GeForce GTX 1070 Mobile, 6700HQ, 75.24 Wh | MSI GS63VR-6RF16H22 Stealth Pro GeForce GTX 1060 Mobile, 6700HQ, 65 Wh | Asus Strix GL502VS-FY032T GeForce GTX 1070 Mobile, 6700HQ, 62 Wh | |
|---|---|---|---|---|---|
| Battery runtime | 39% | 24% | 16% | 0% | |
| H.264 (h) | 3.6 | 4.5 25% | |||
| WiFi v1.3 (h) | 3.3 | 4.6 39% | 4.1 24% | 3.5 6% | 3.3 0% |
Pros
Cons
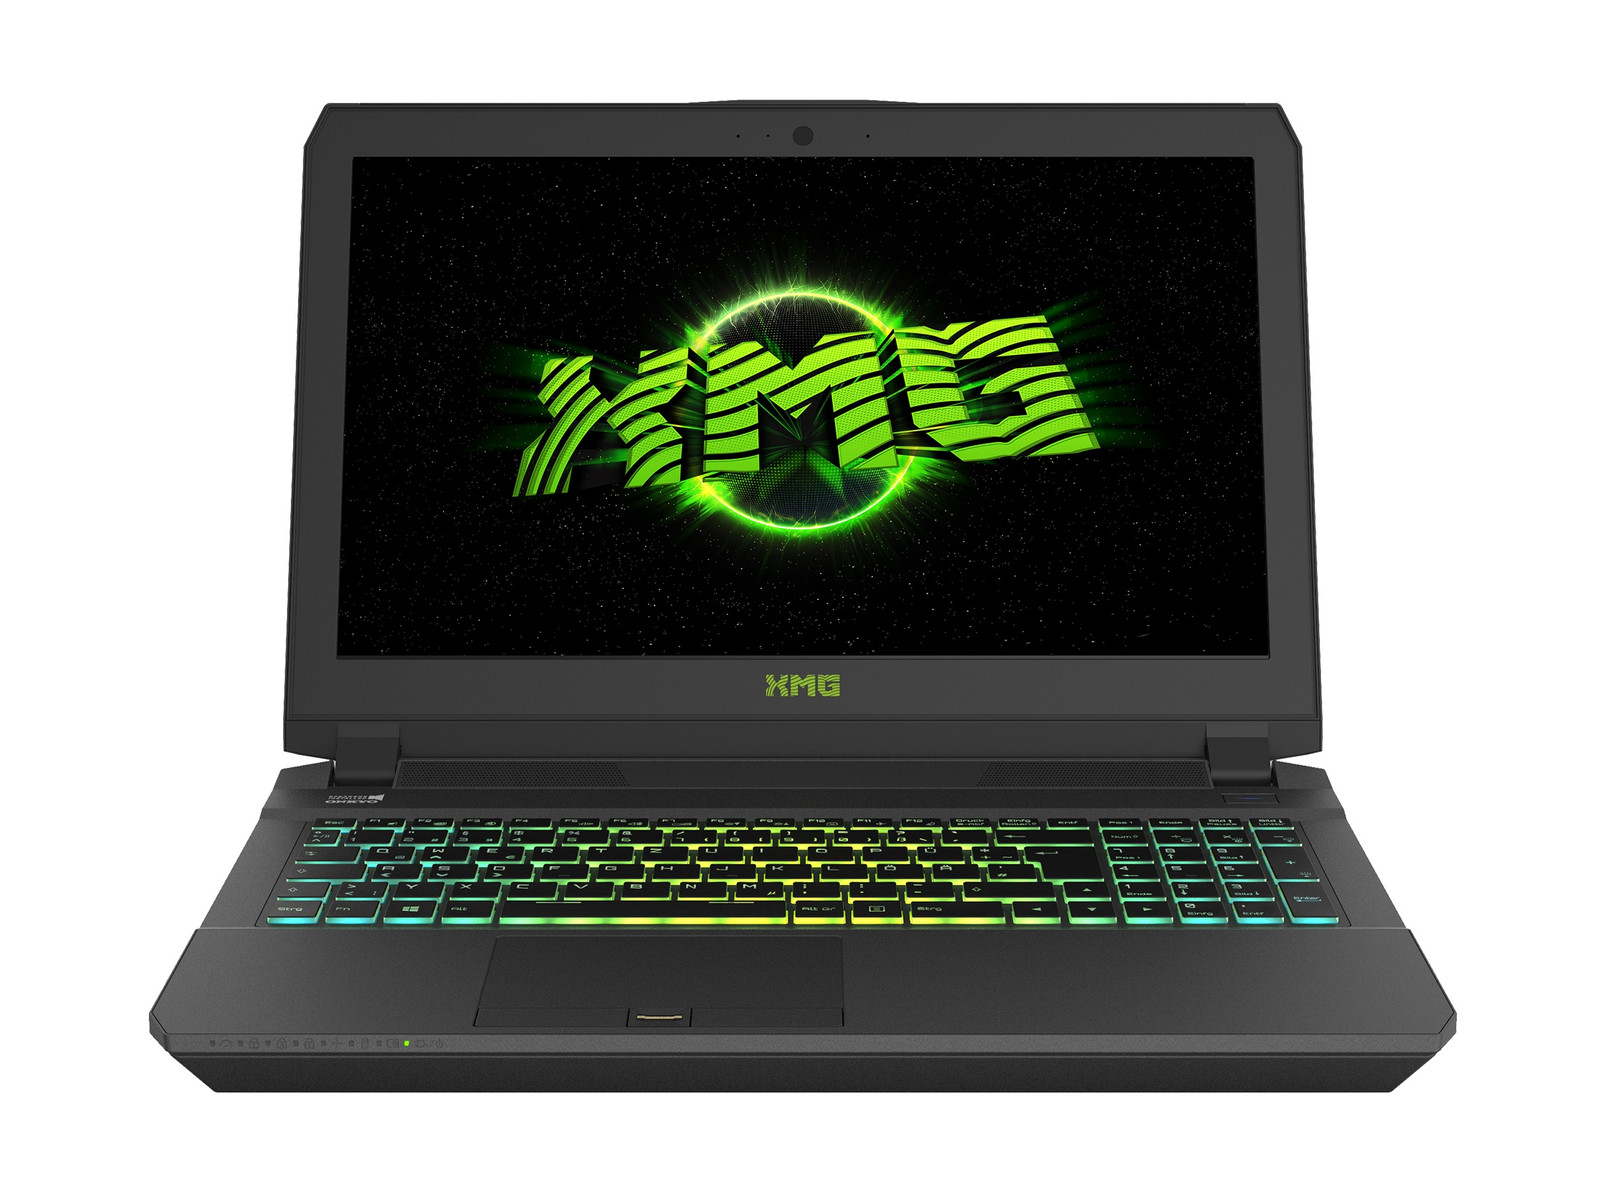
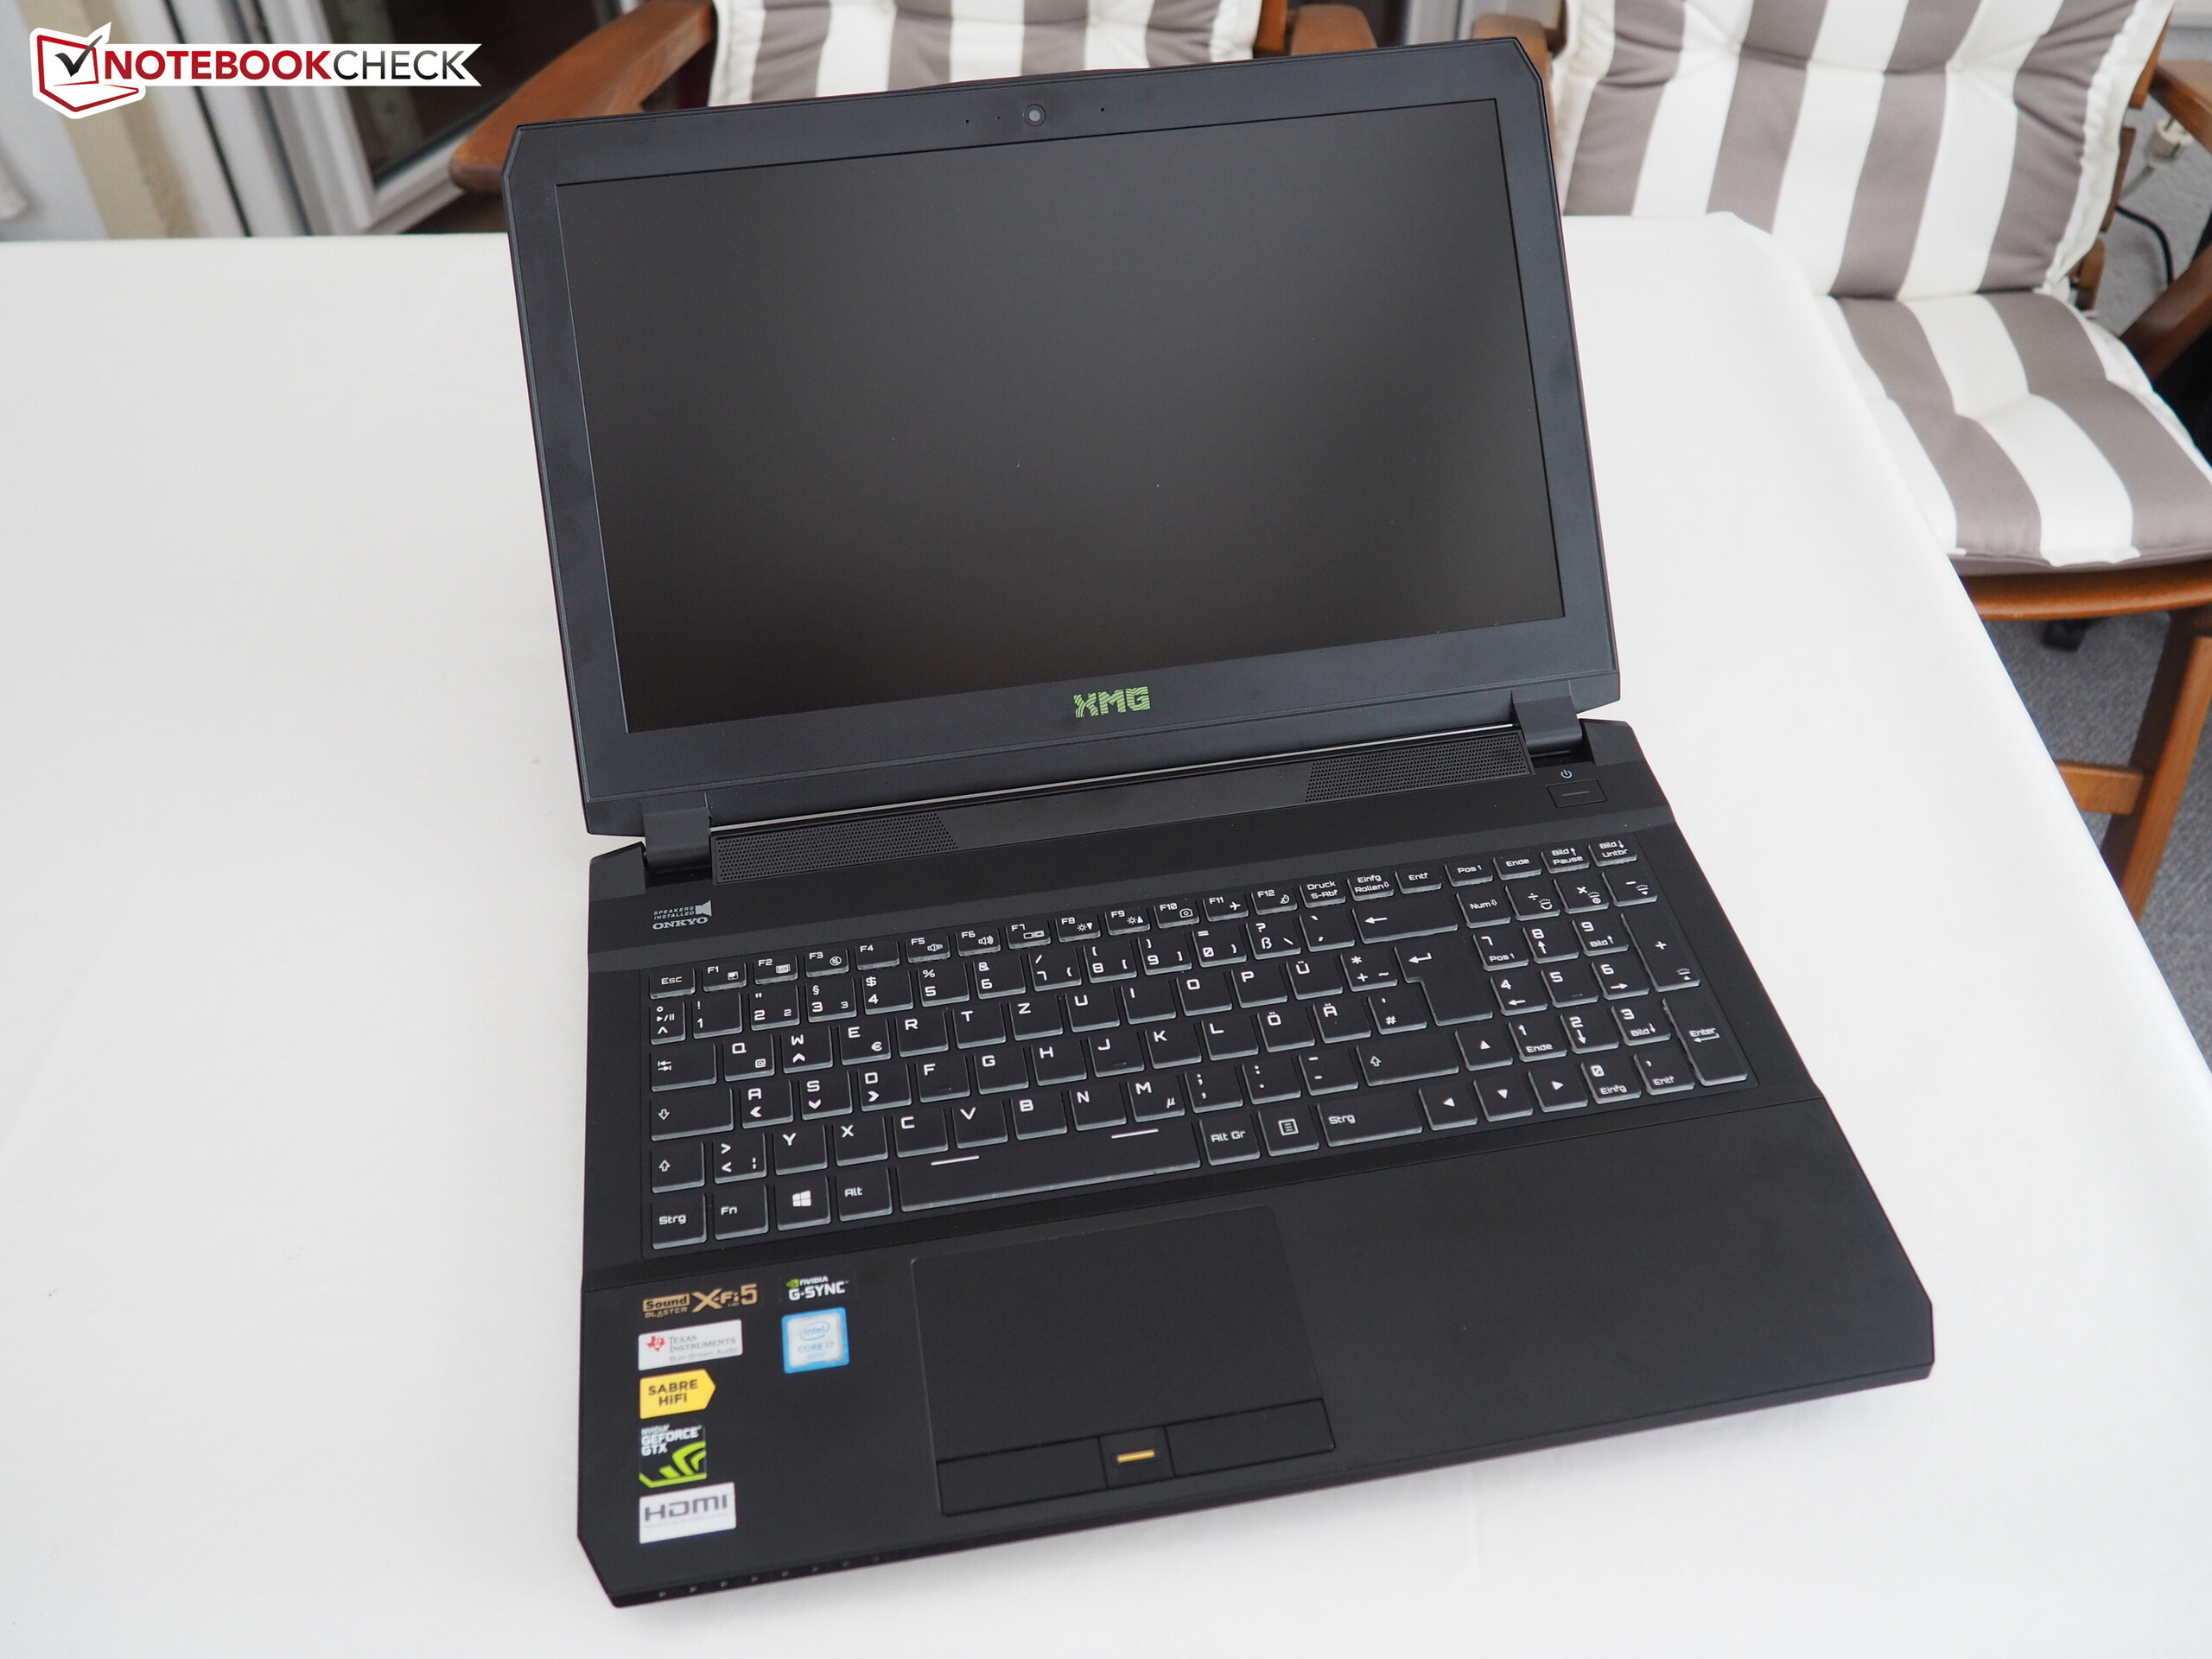
来自Schenker Technologies的XMG P507,是那些需要功能强大且结构相对紧凑的高端笔记本的主流玩家的不错选择。这个15英寸的设备在两个最重要的方面:组件和性能,都不令人失望。所有应用程序运行顺利由于NVMe-SSD和GeForce GTX 1070的存在,所有应用程序都运行顺利。
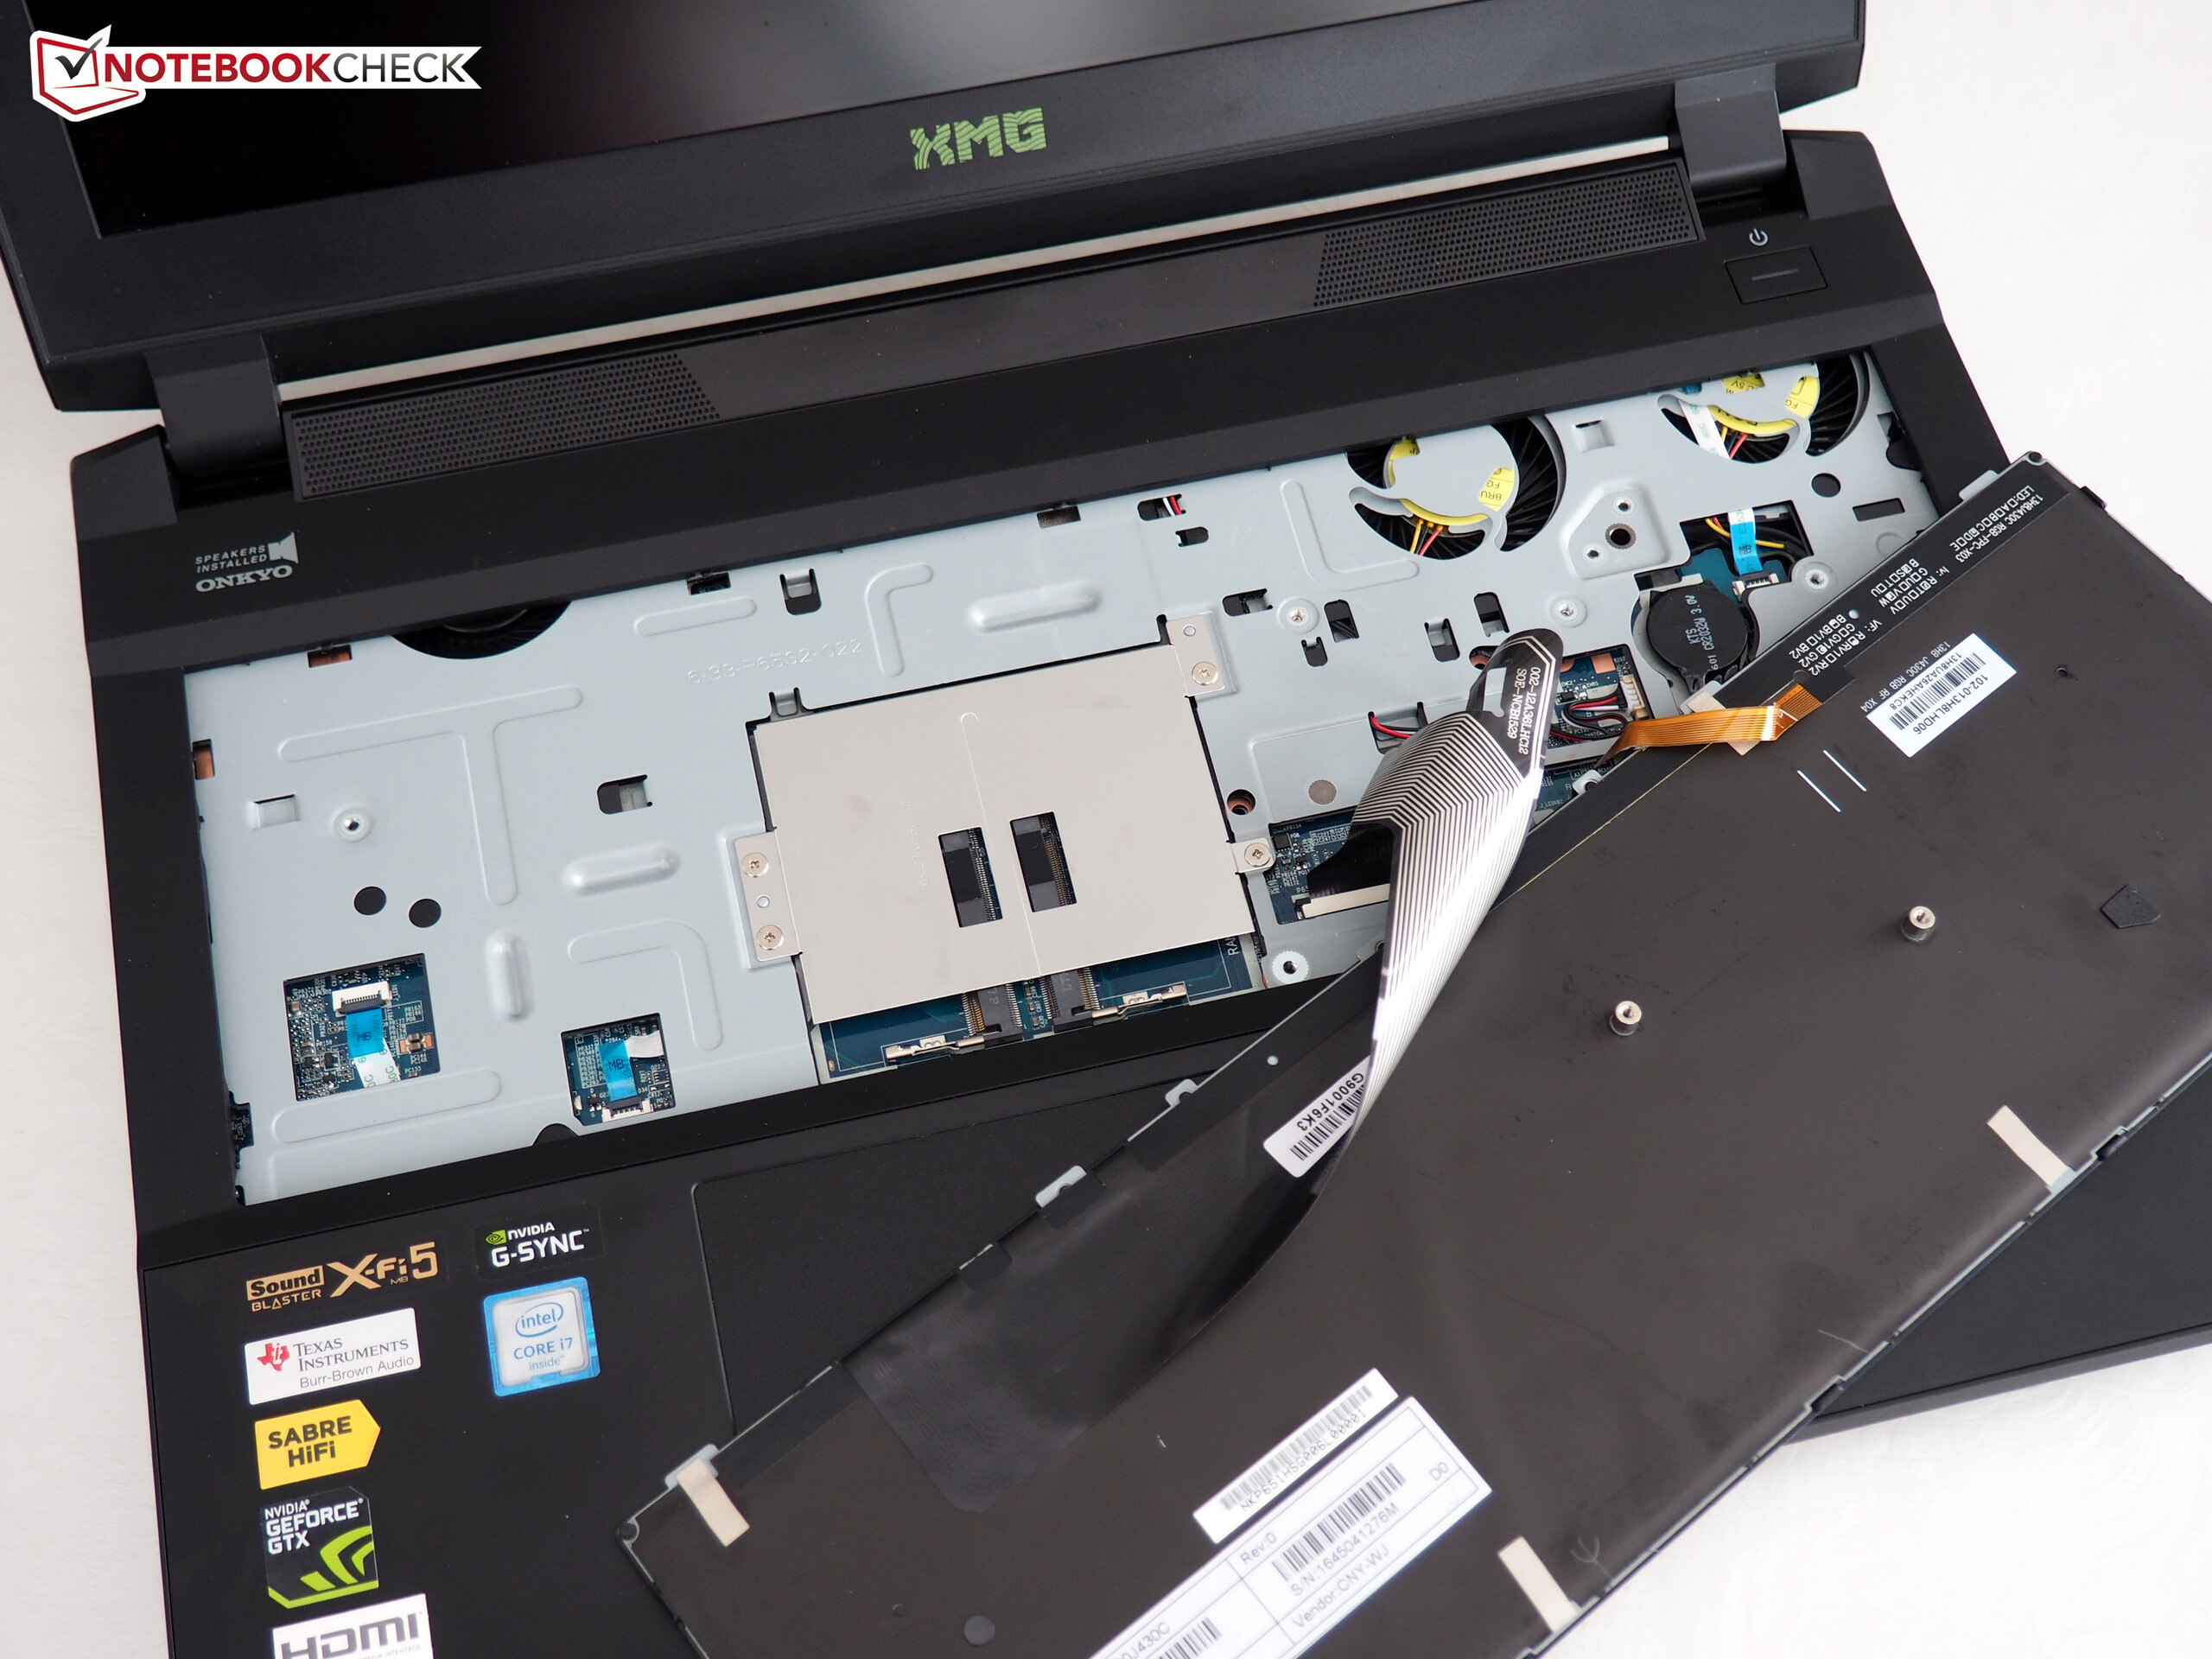
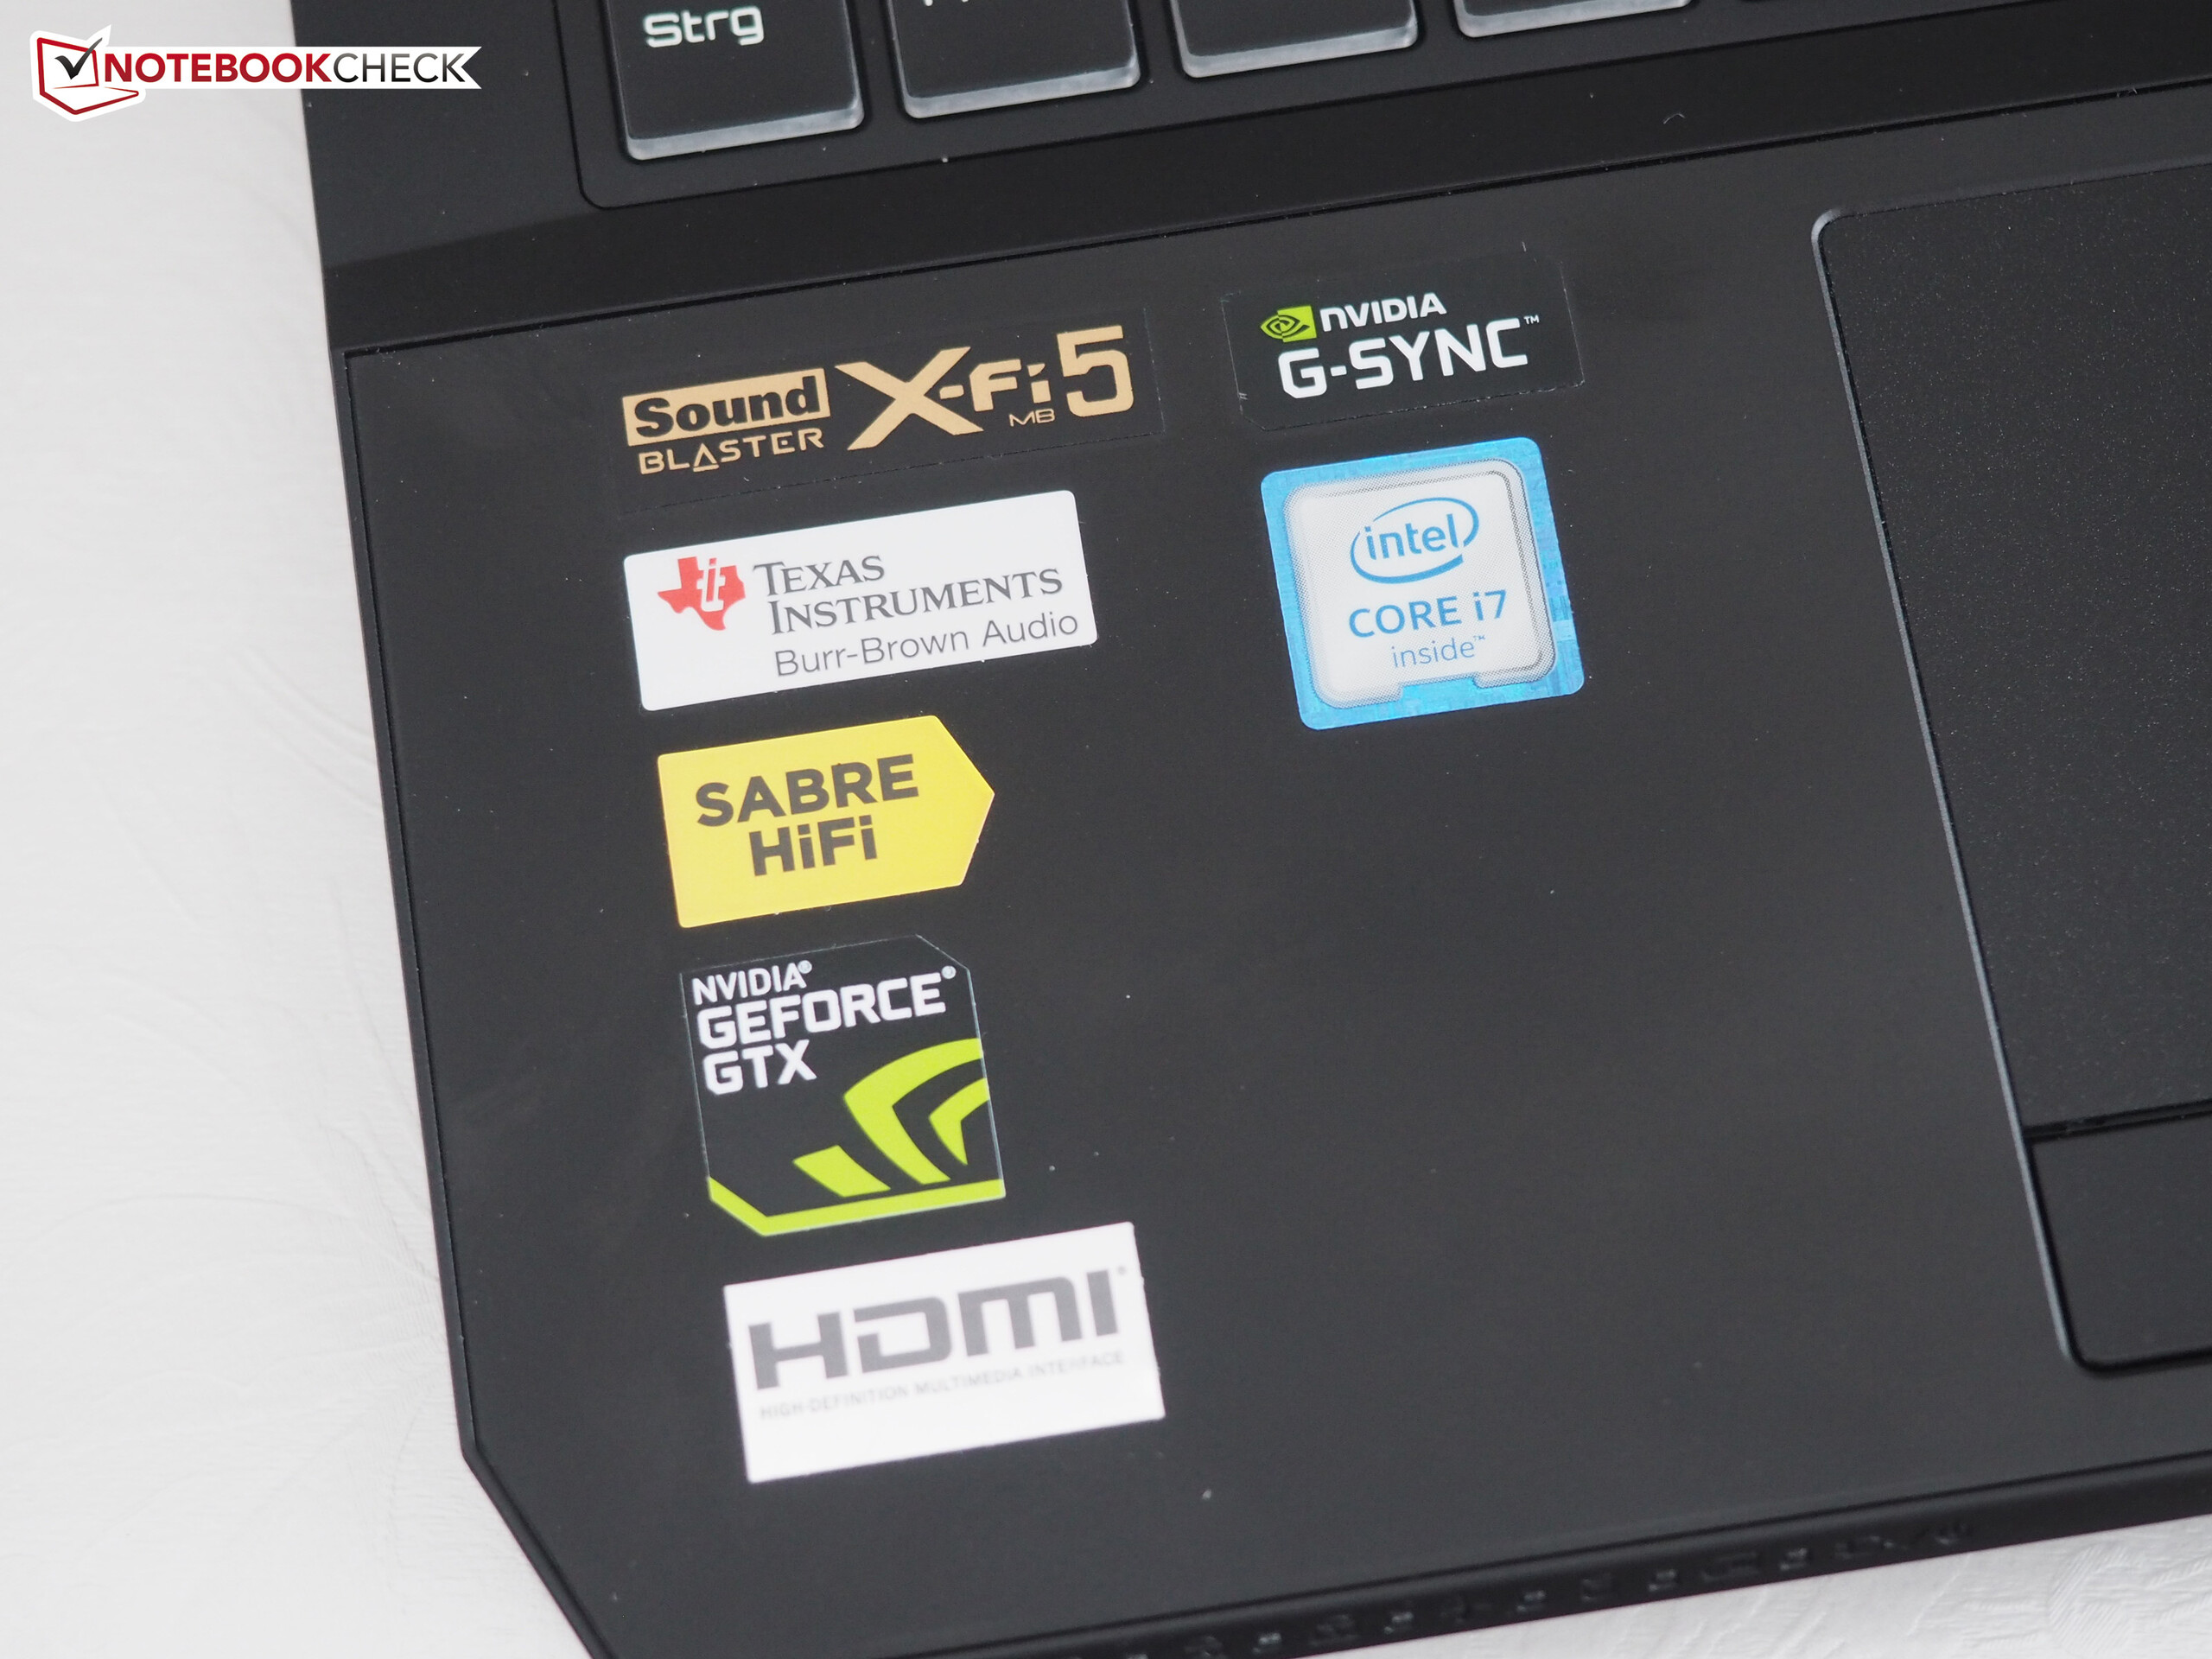
制造商还应用了G-Sync和120赫兹的组合,但是显示器还是无法满足我们的预期。除了黑色值,颜色精度和视角外,我们还必须批评它的对比度。另一个问题是严重的屏幕漏光,风扇空转,负载下的高噪声以及普通的电池续航时间。声音质量同样可以改善。
纵观全局,它的性能仍然足以在我们的Gaming-Top-10排名中获得好位置。
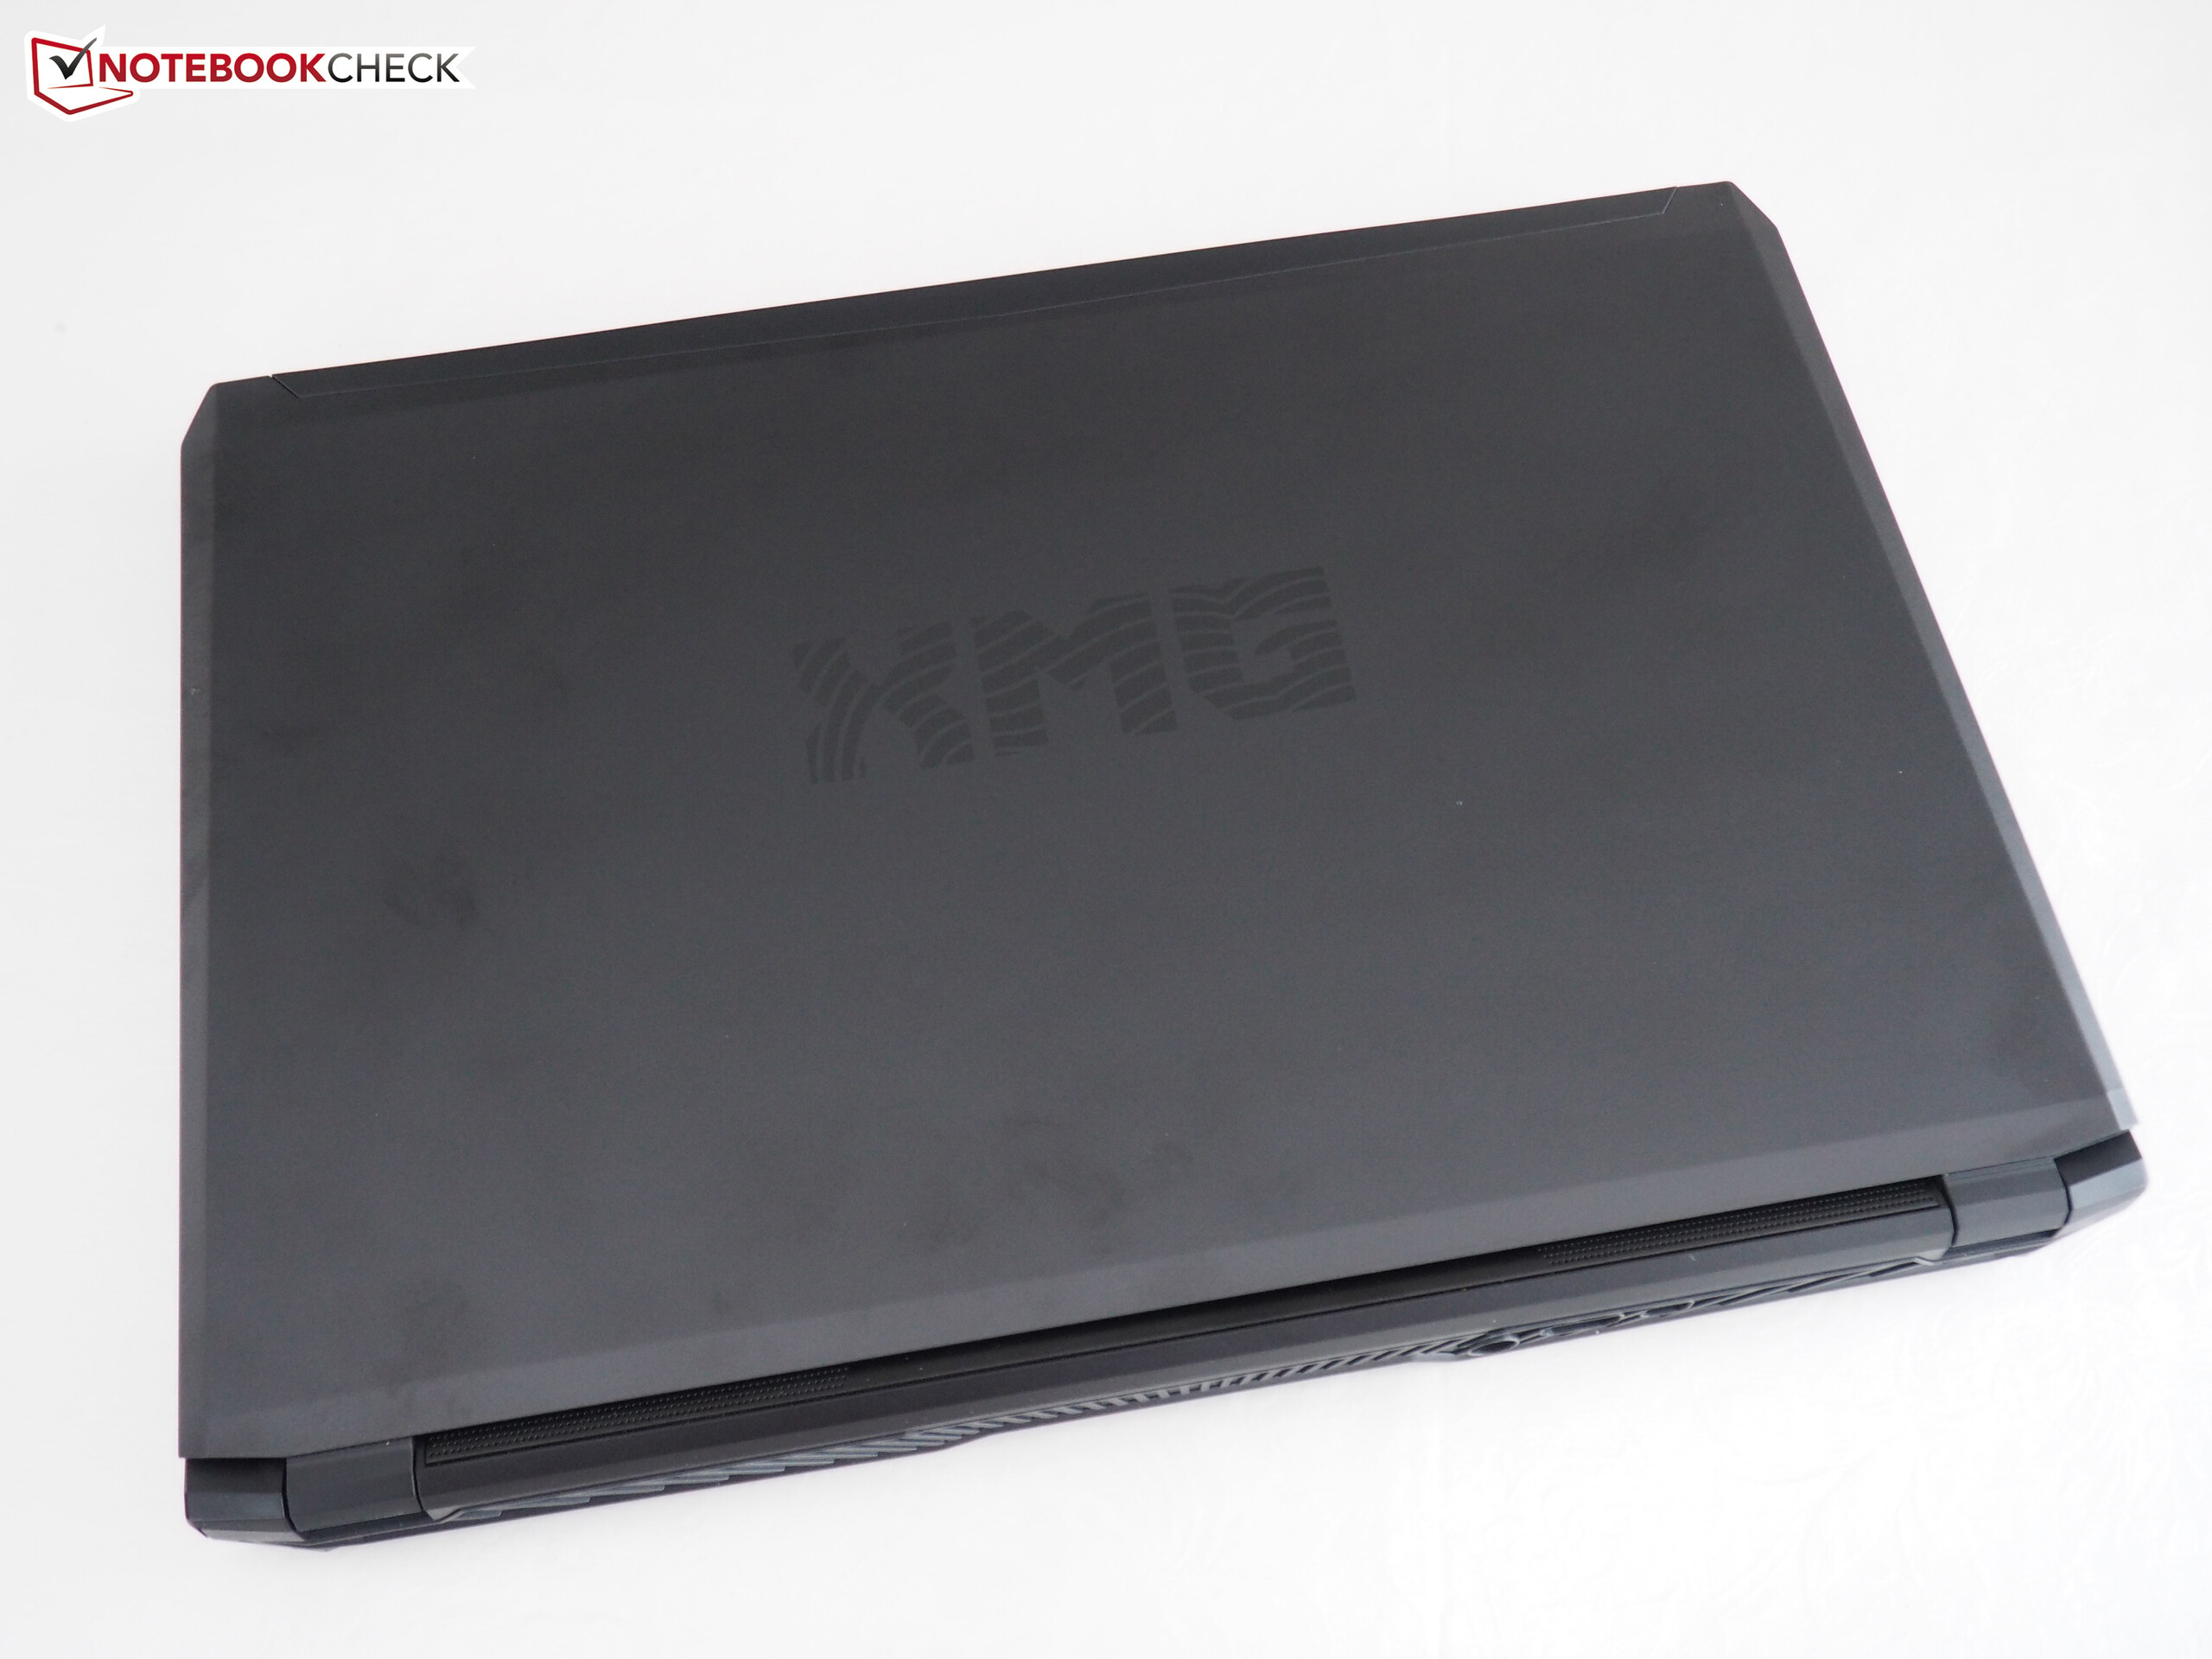
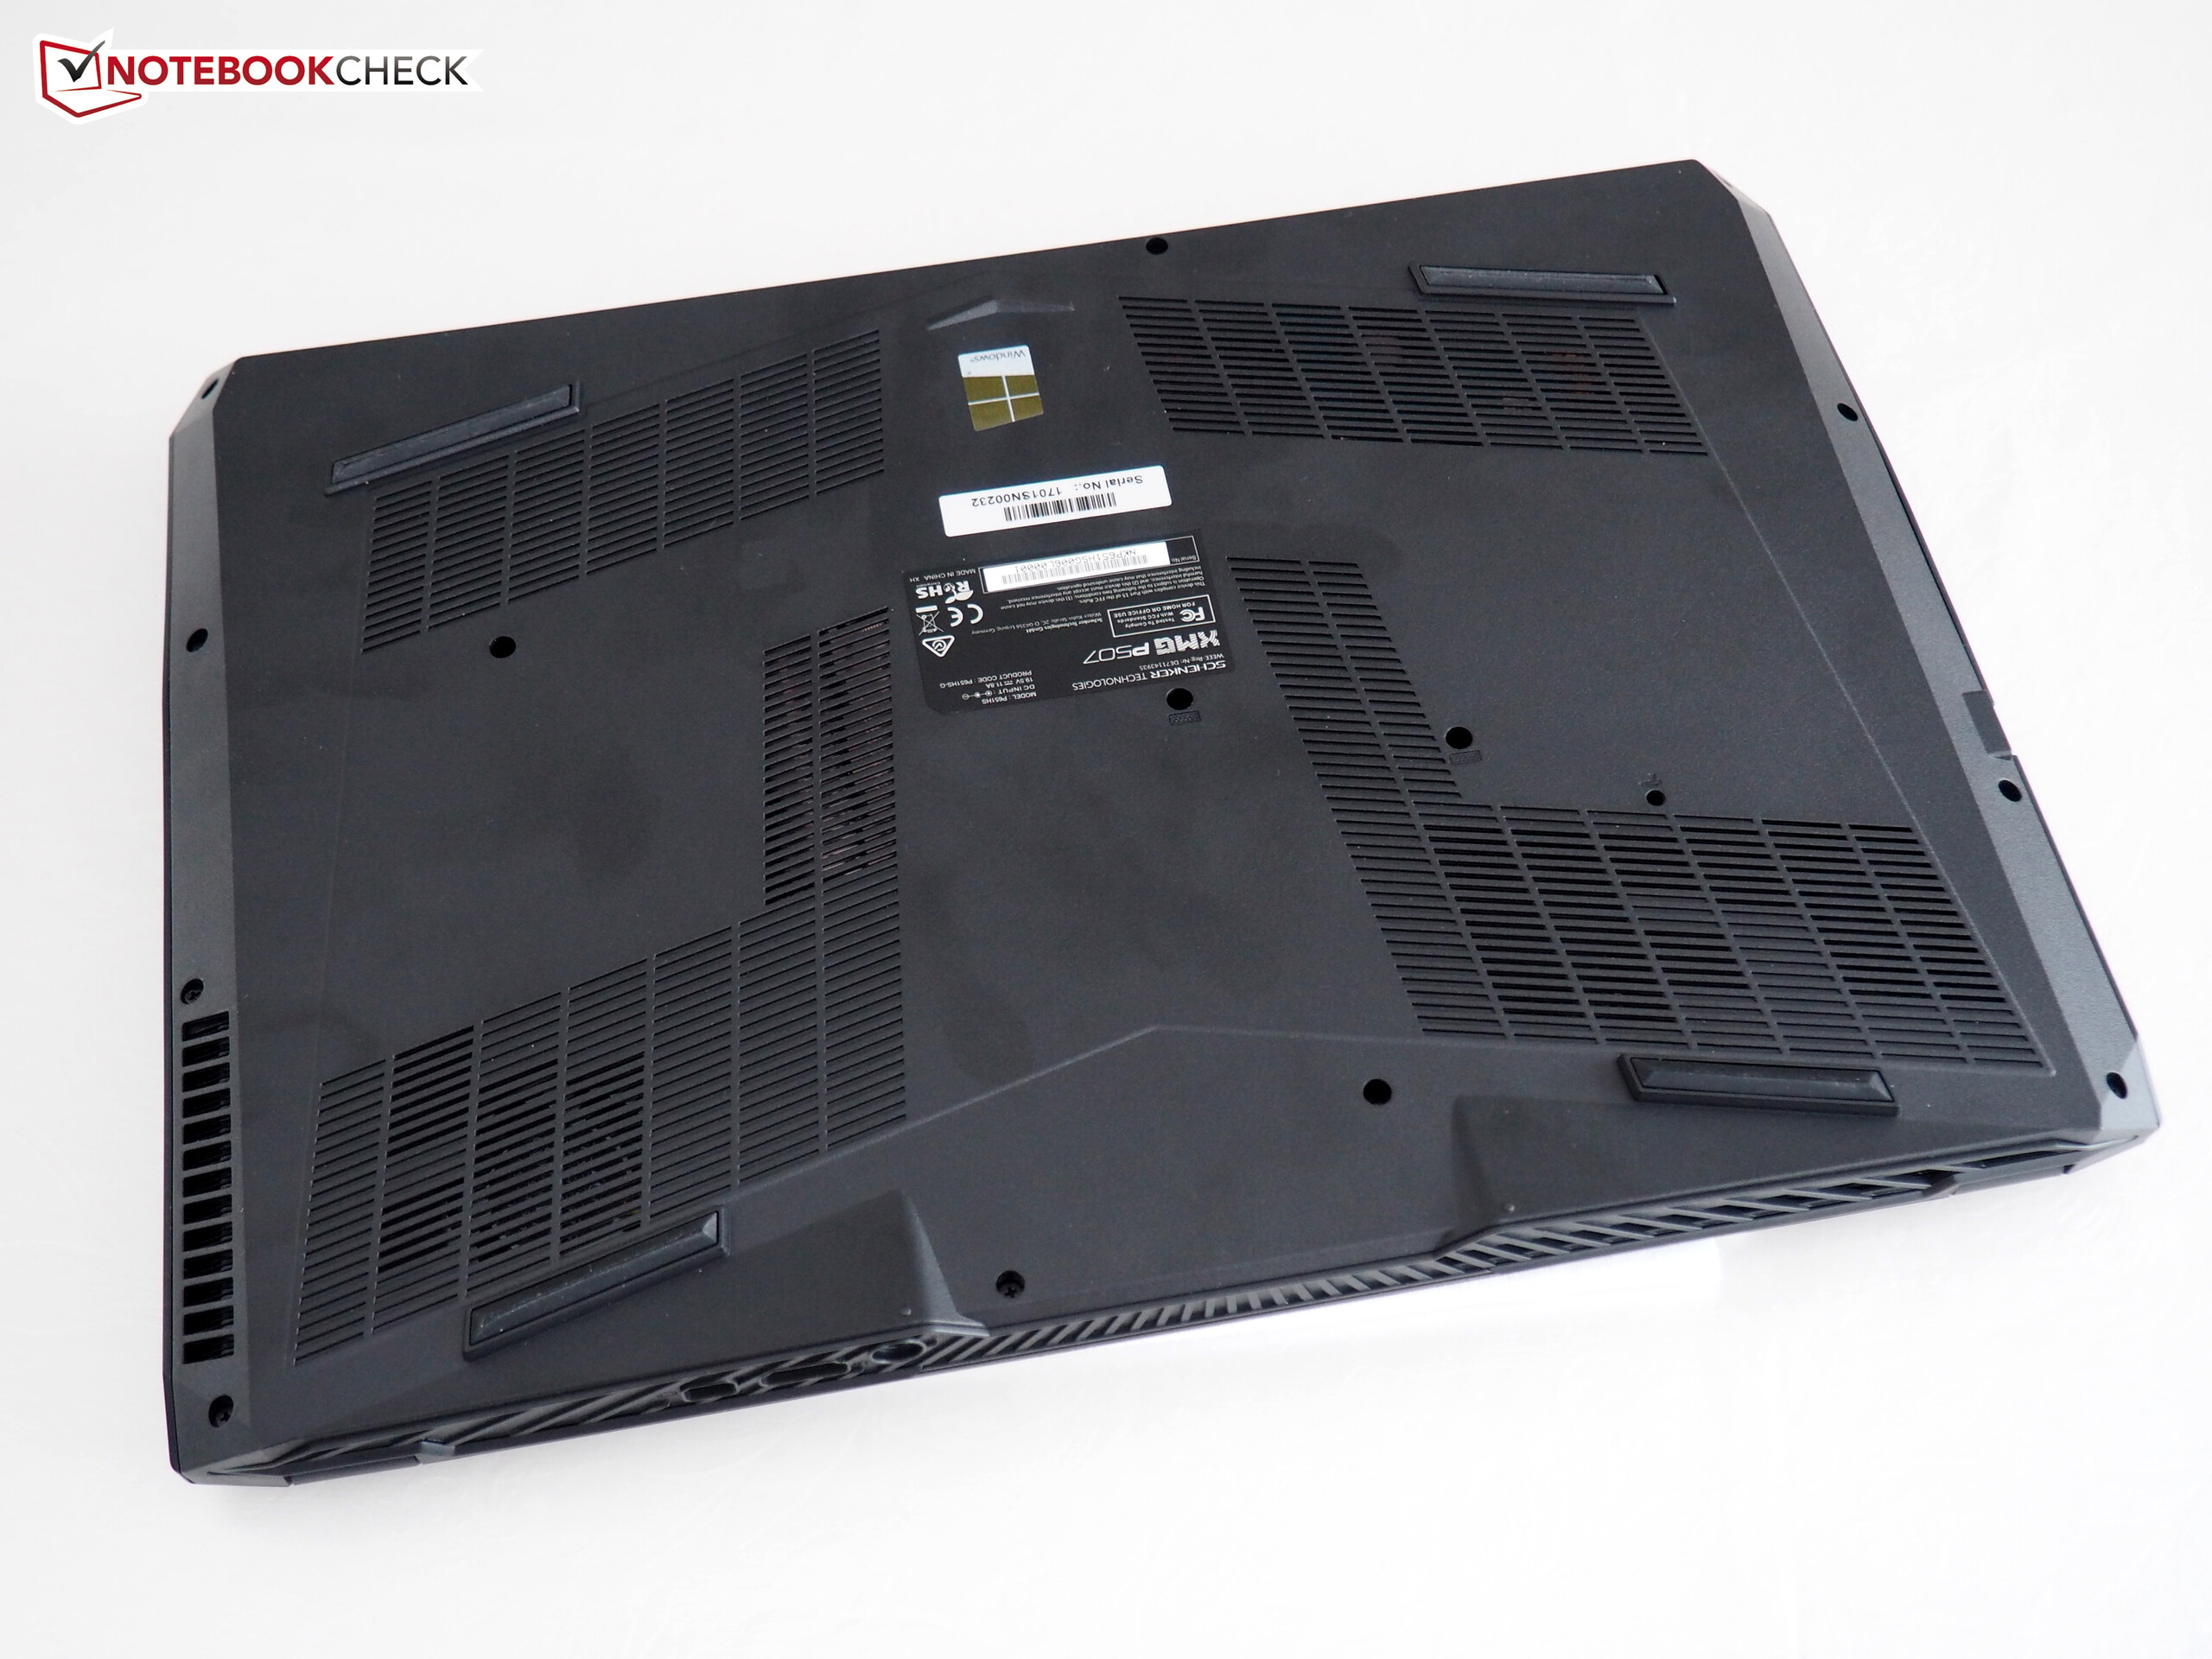
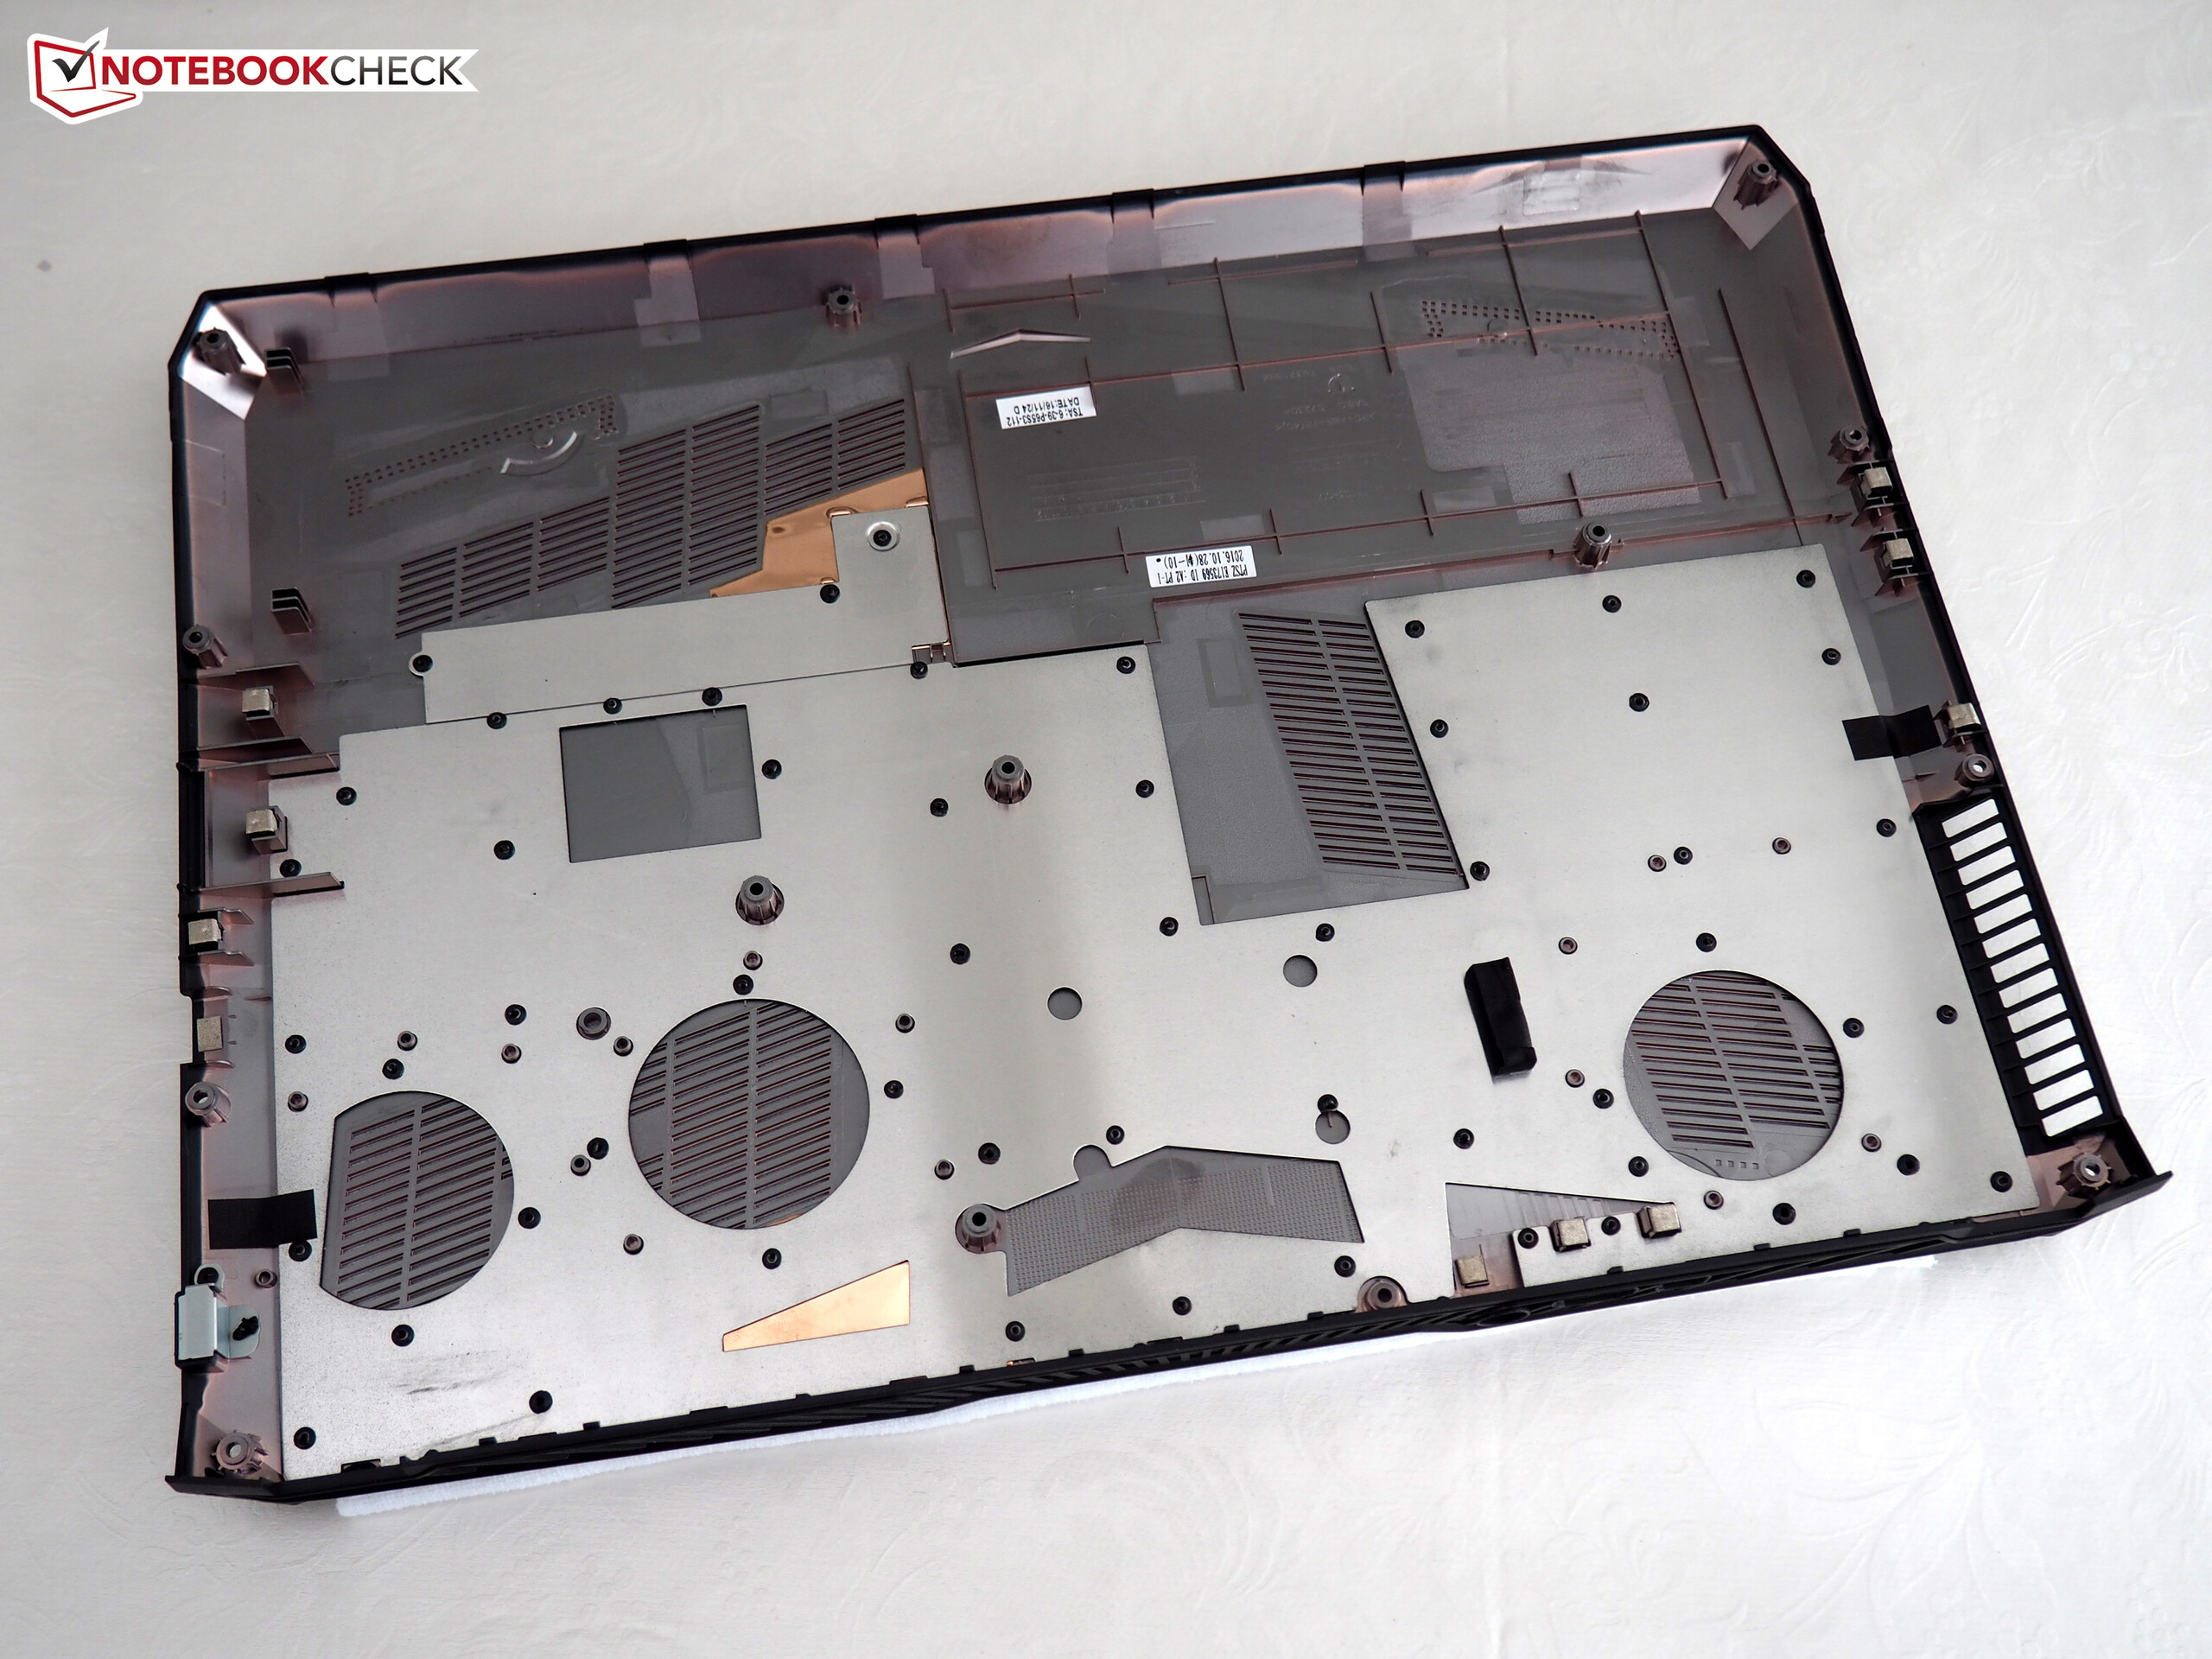
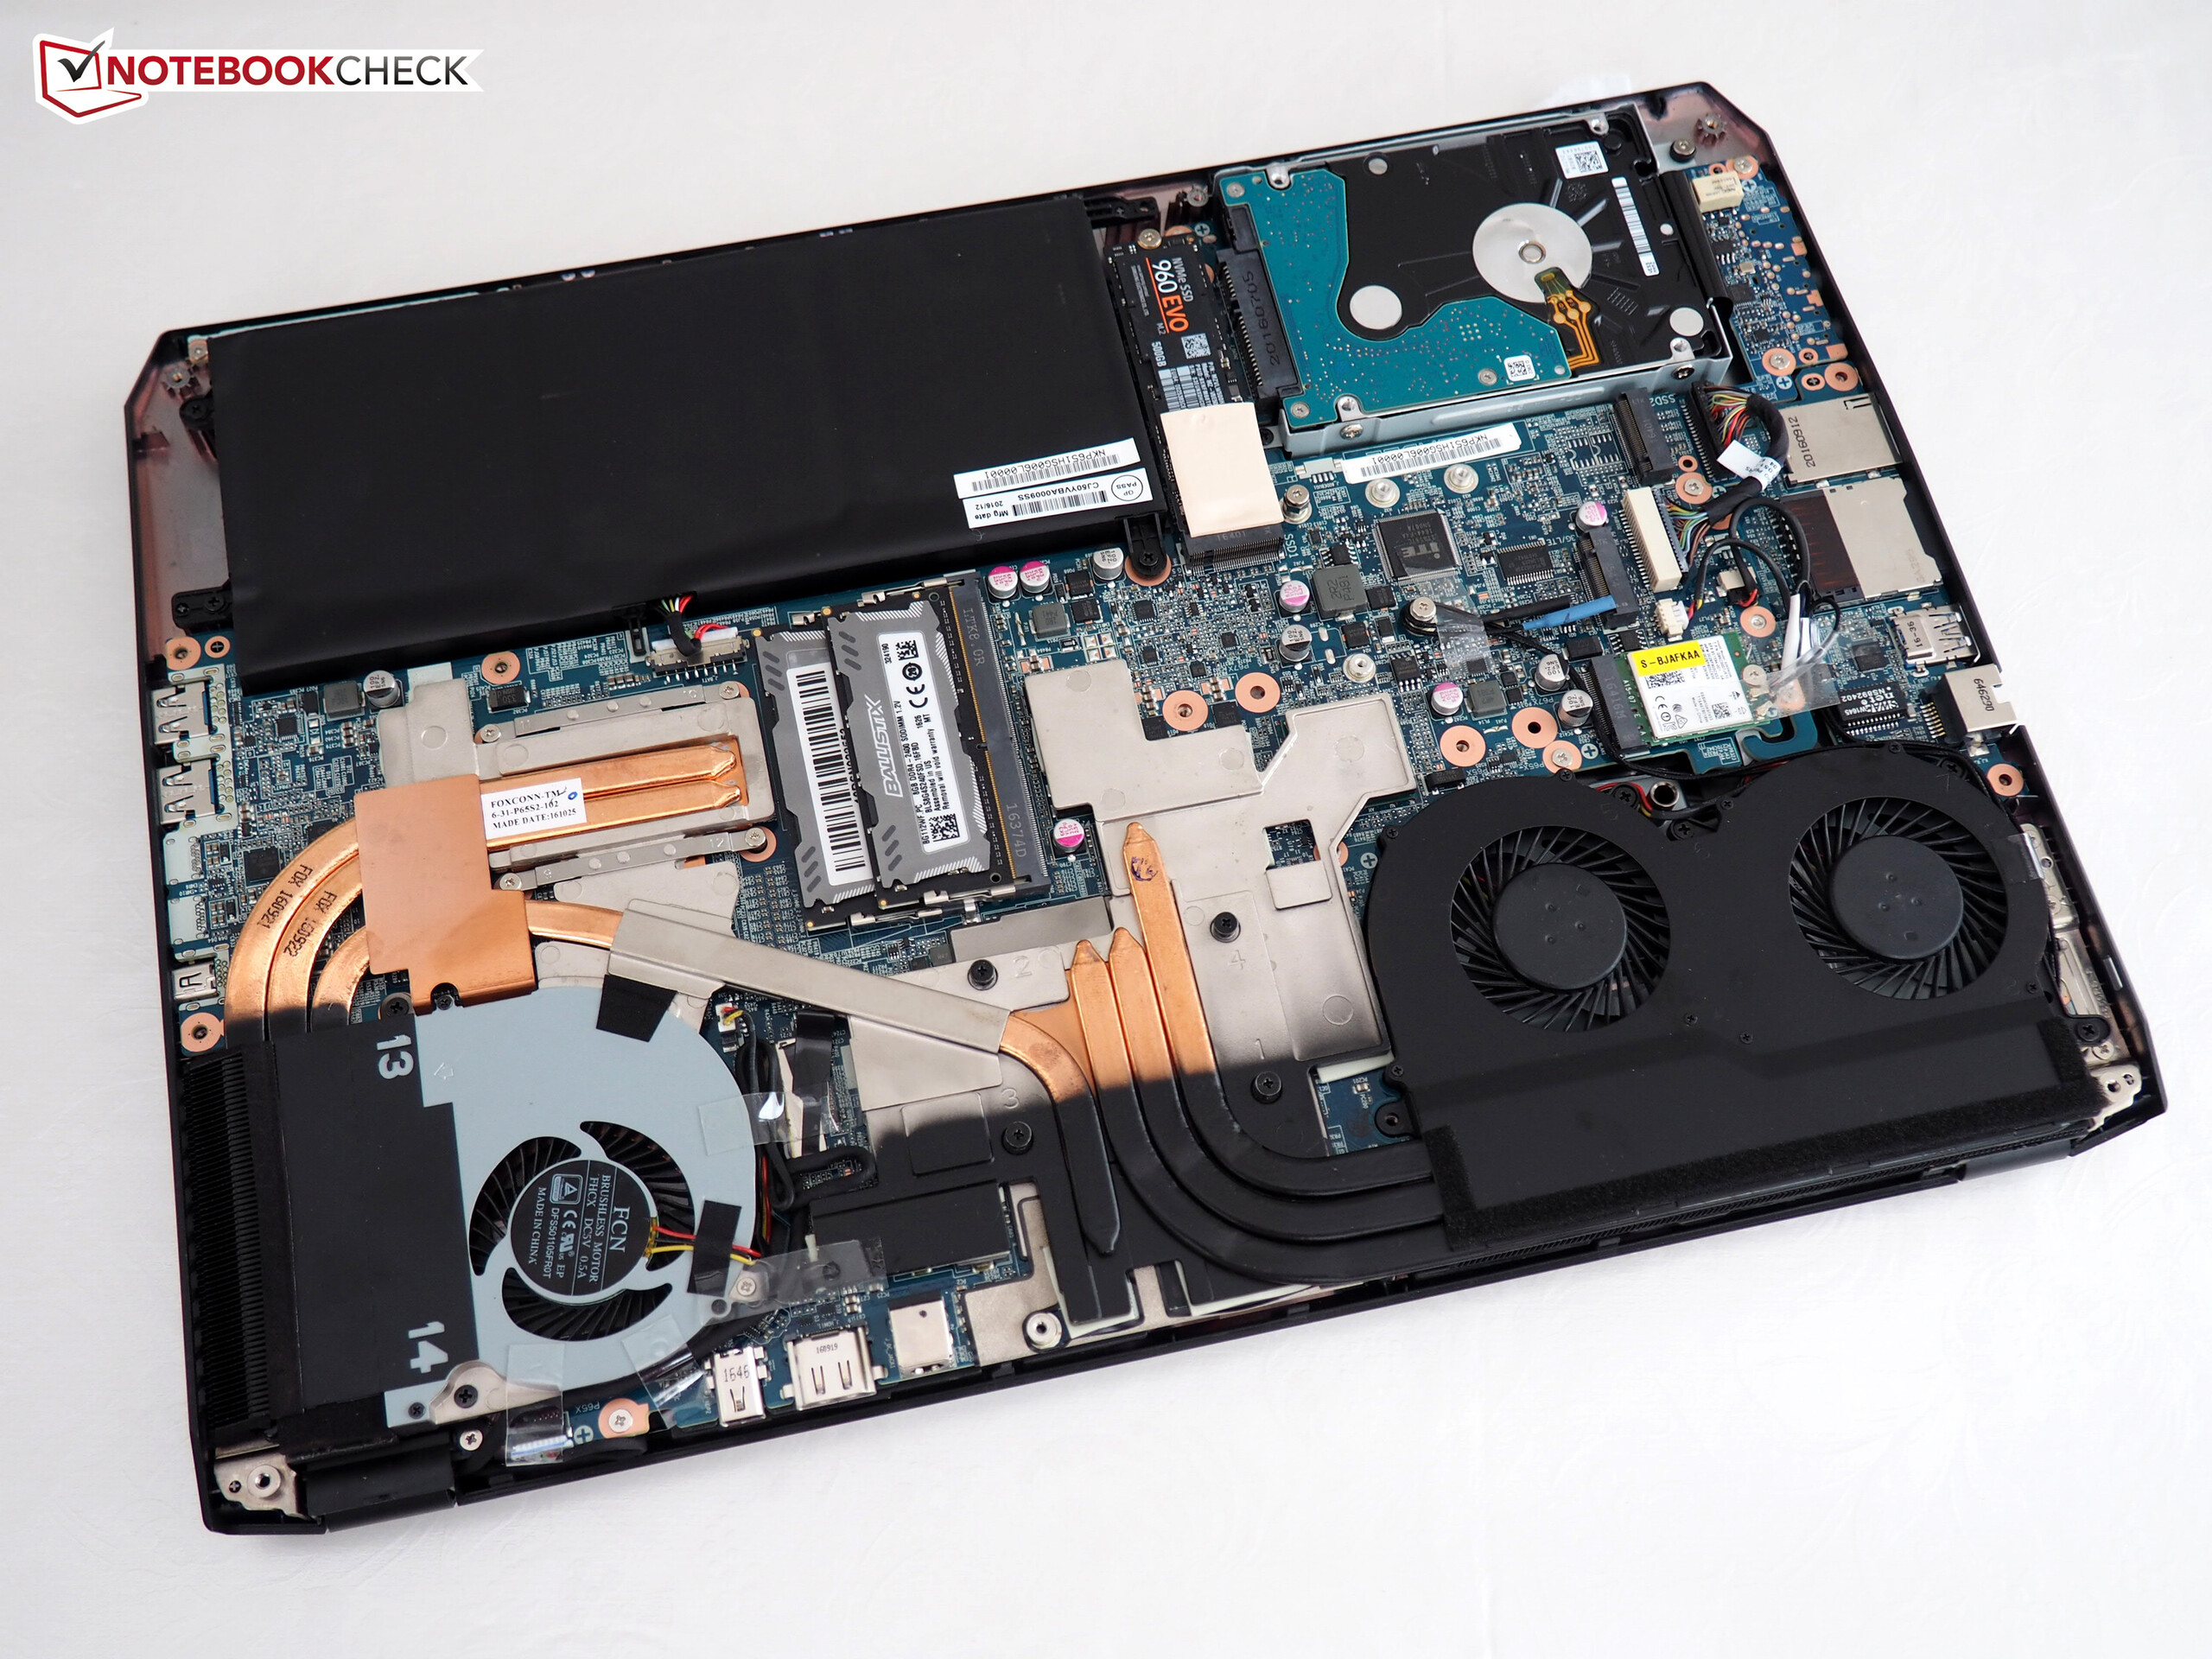
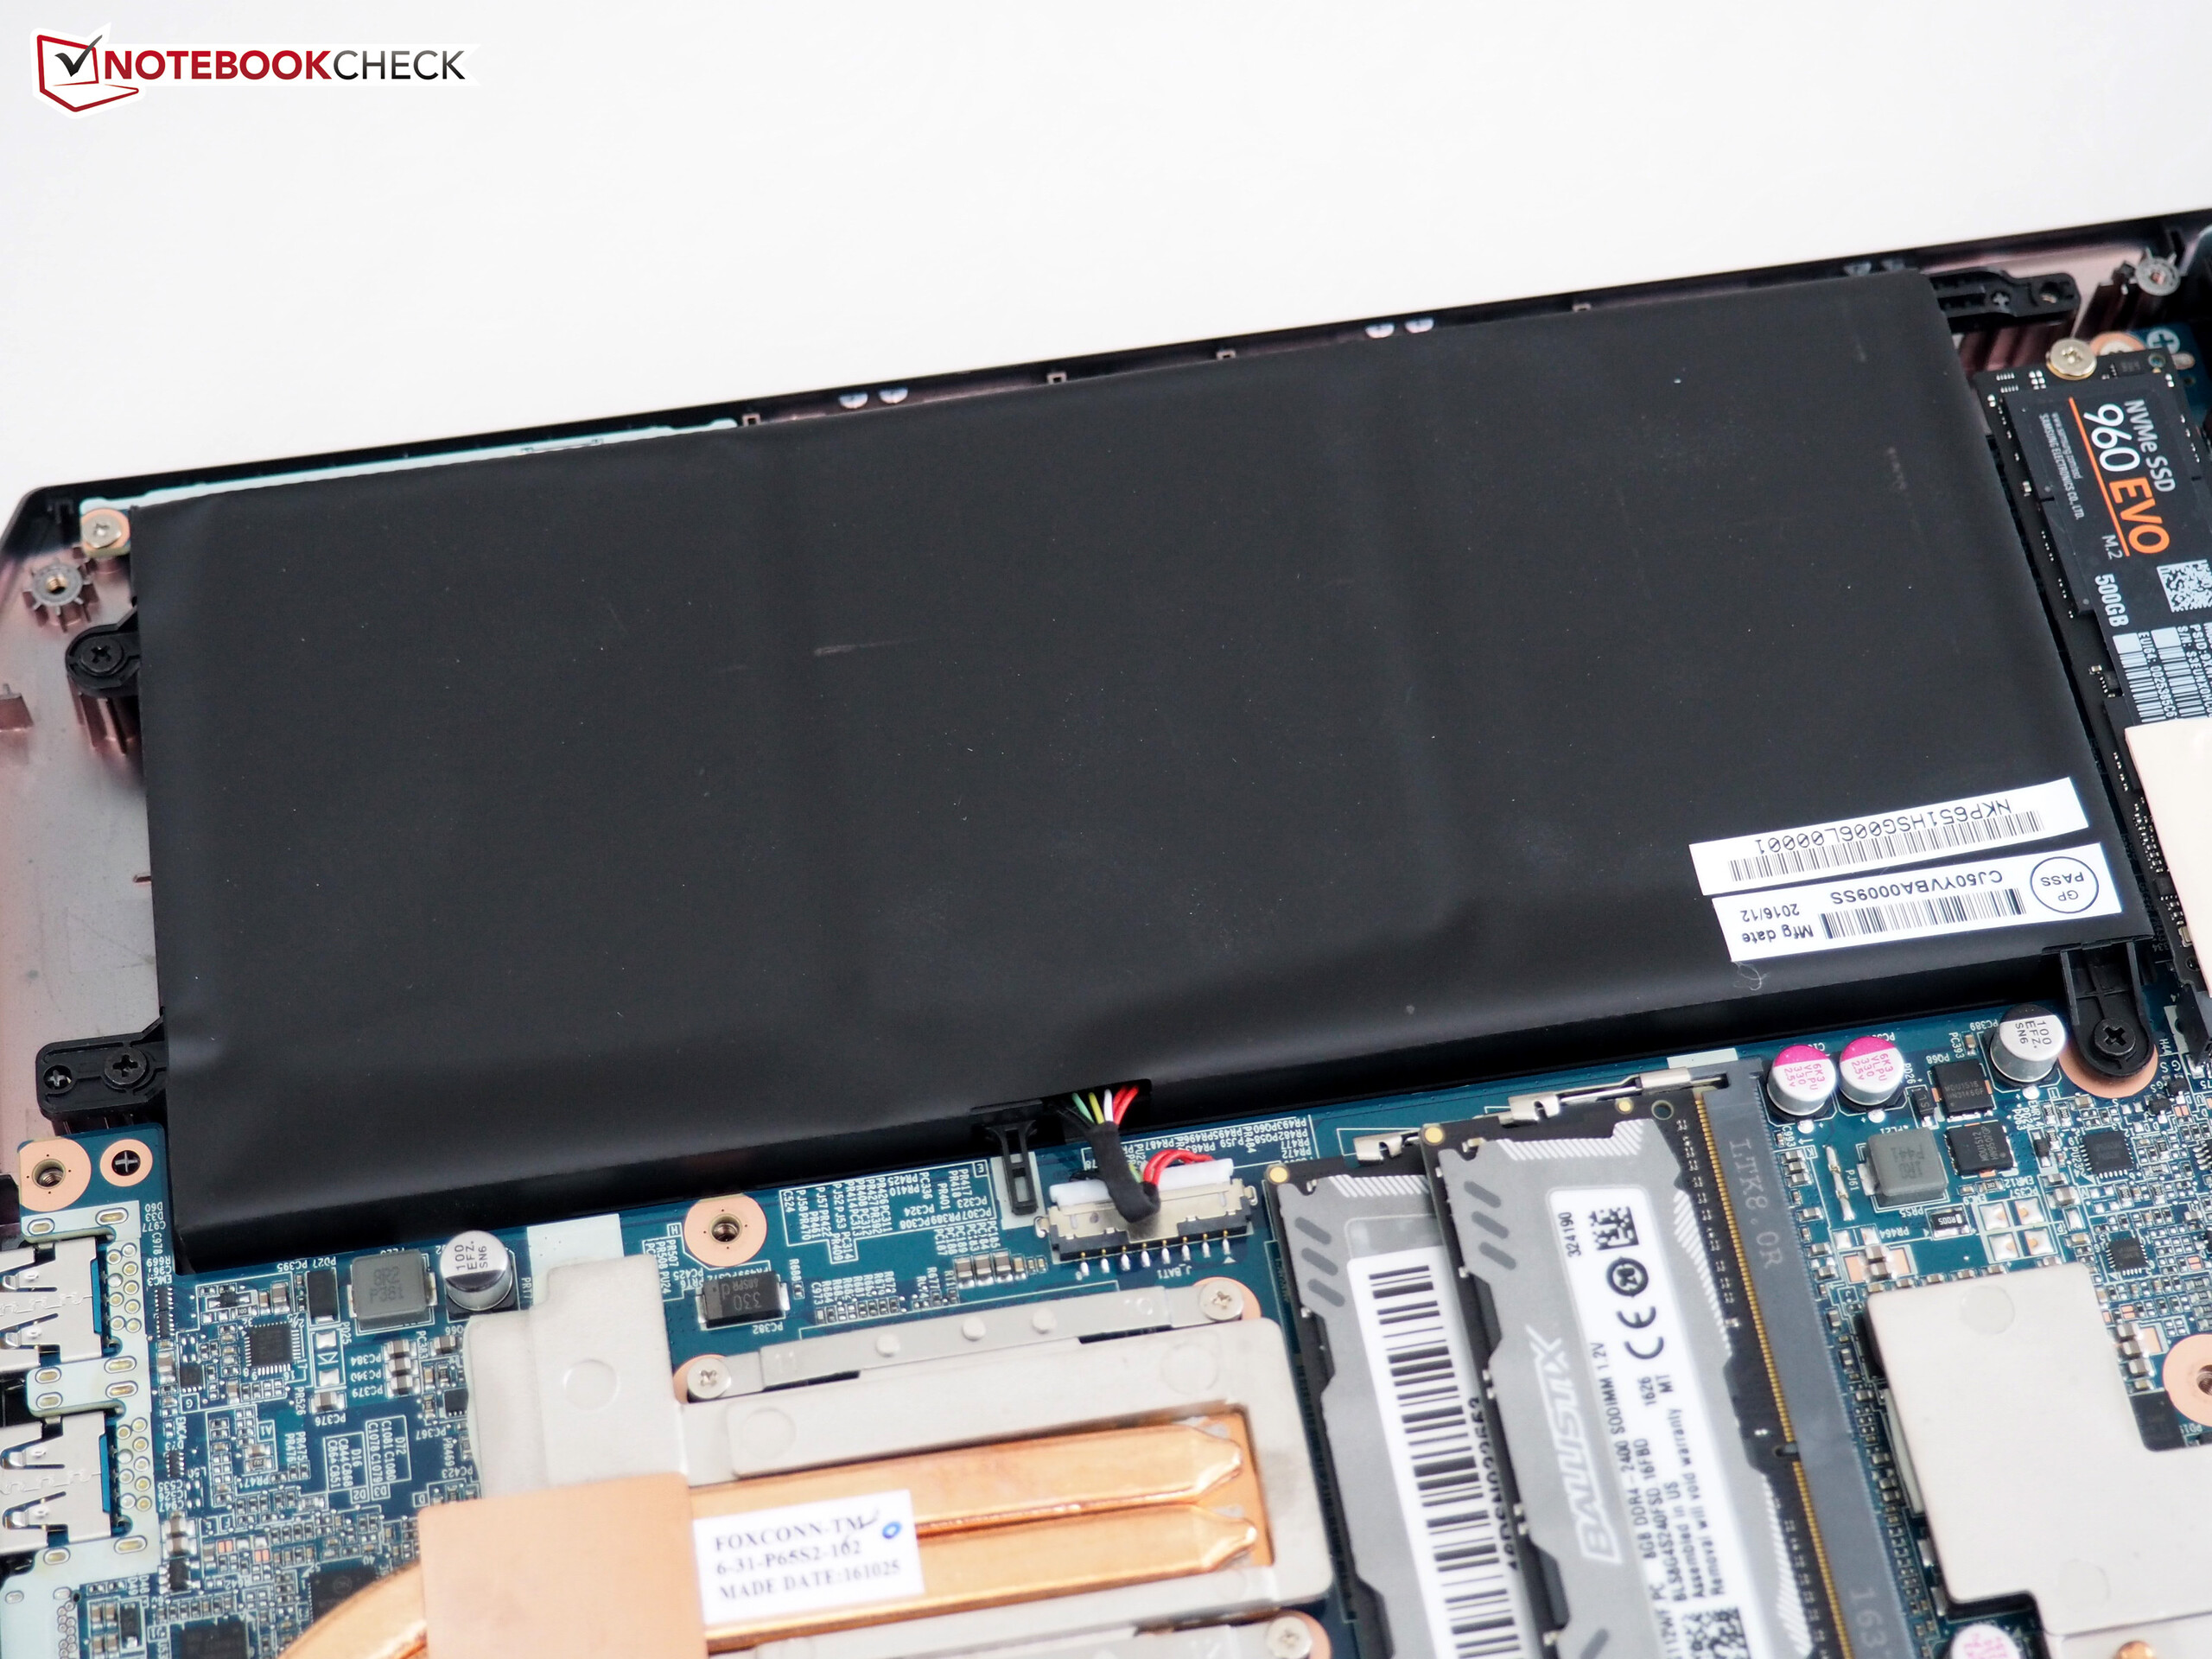
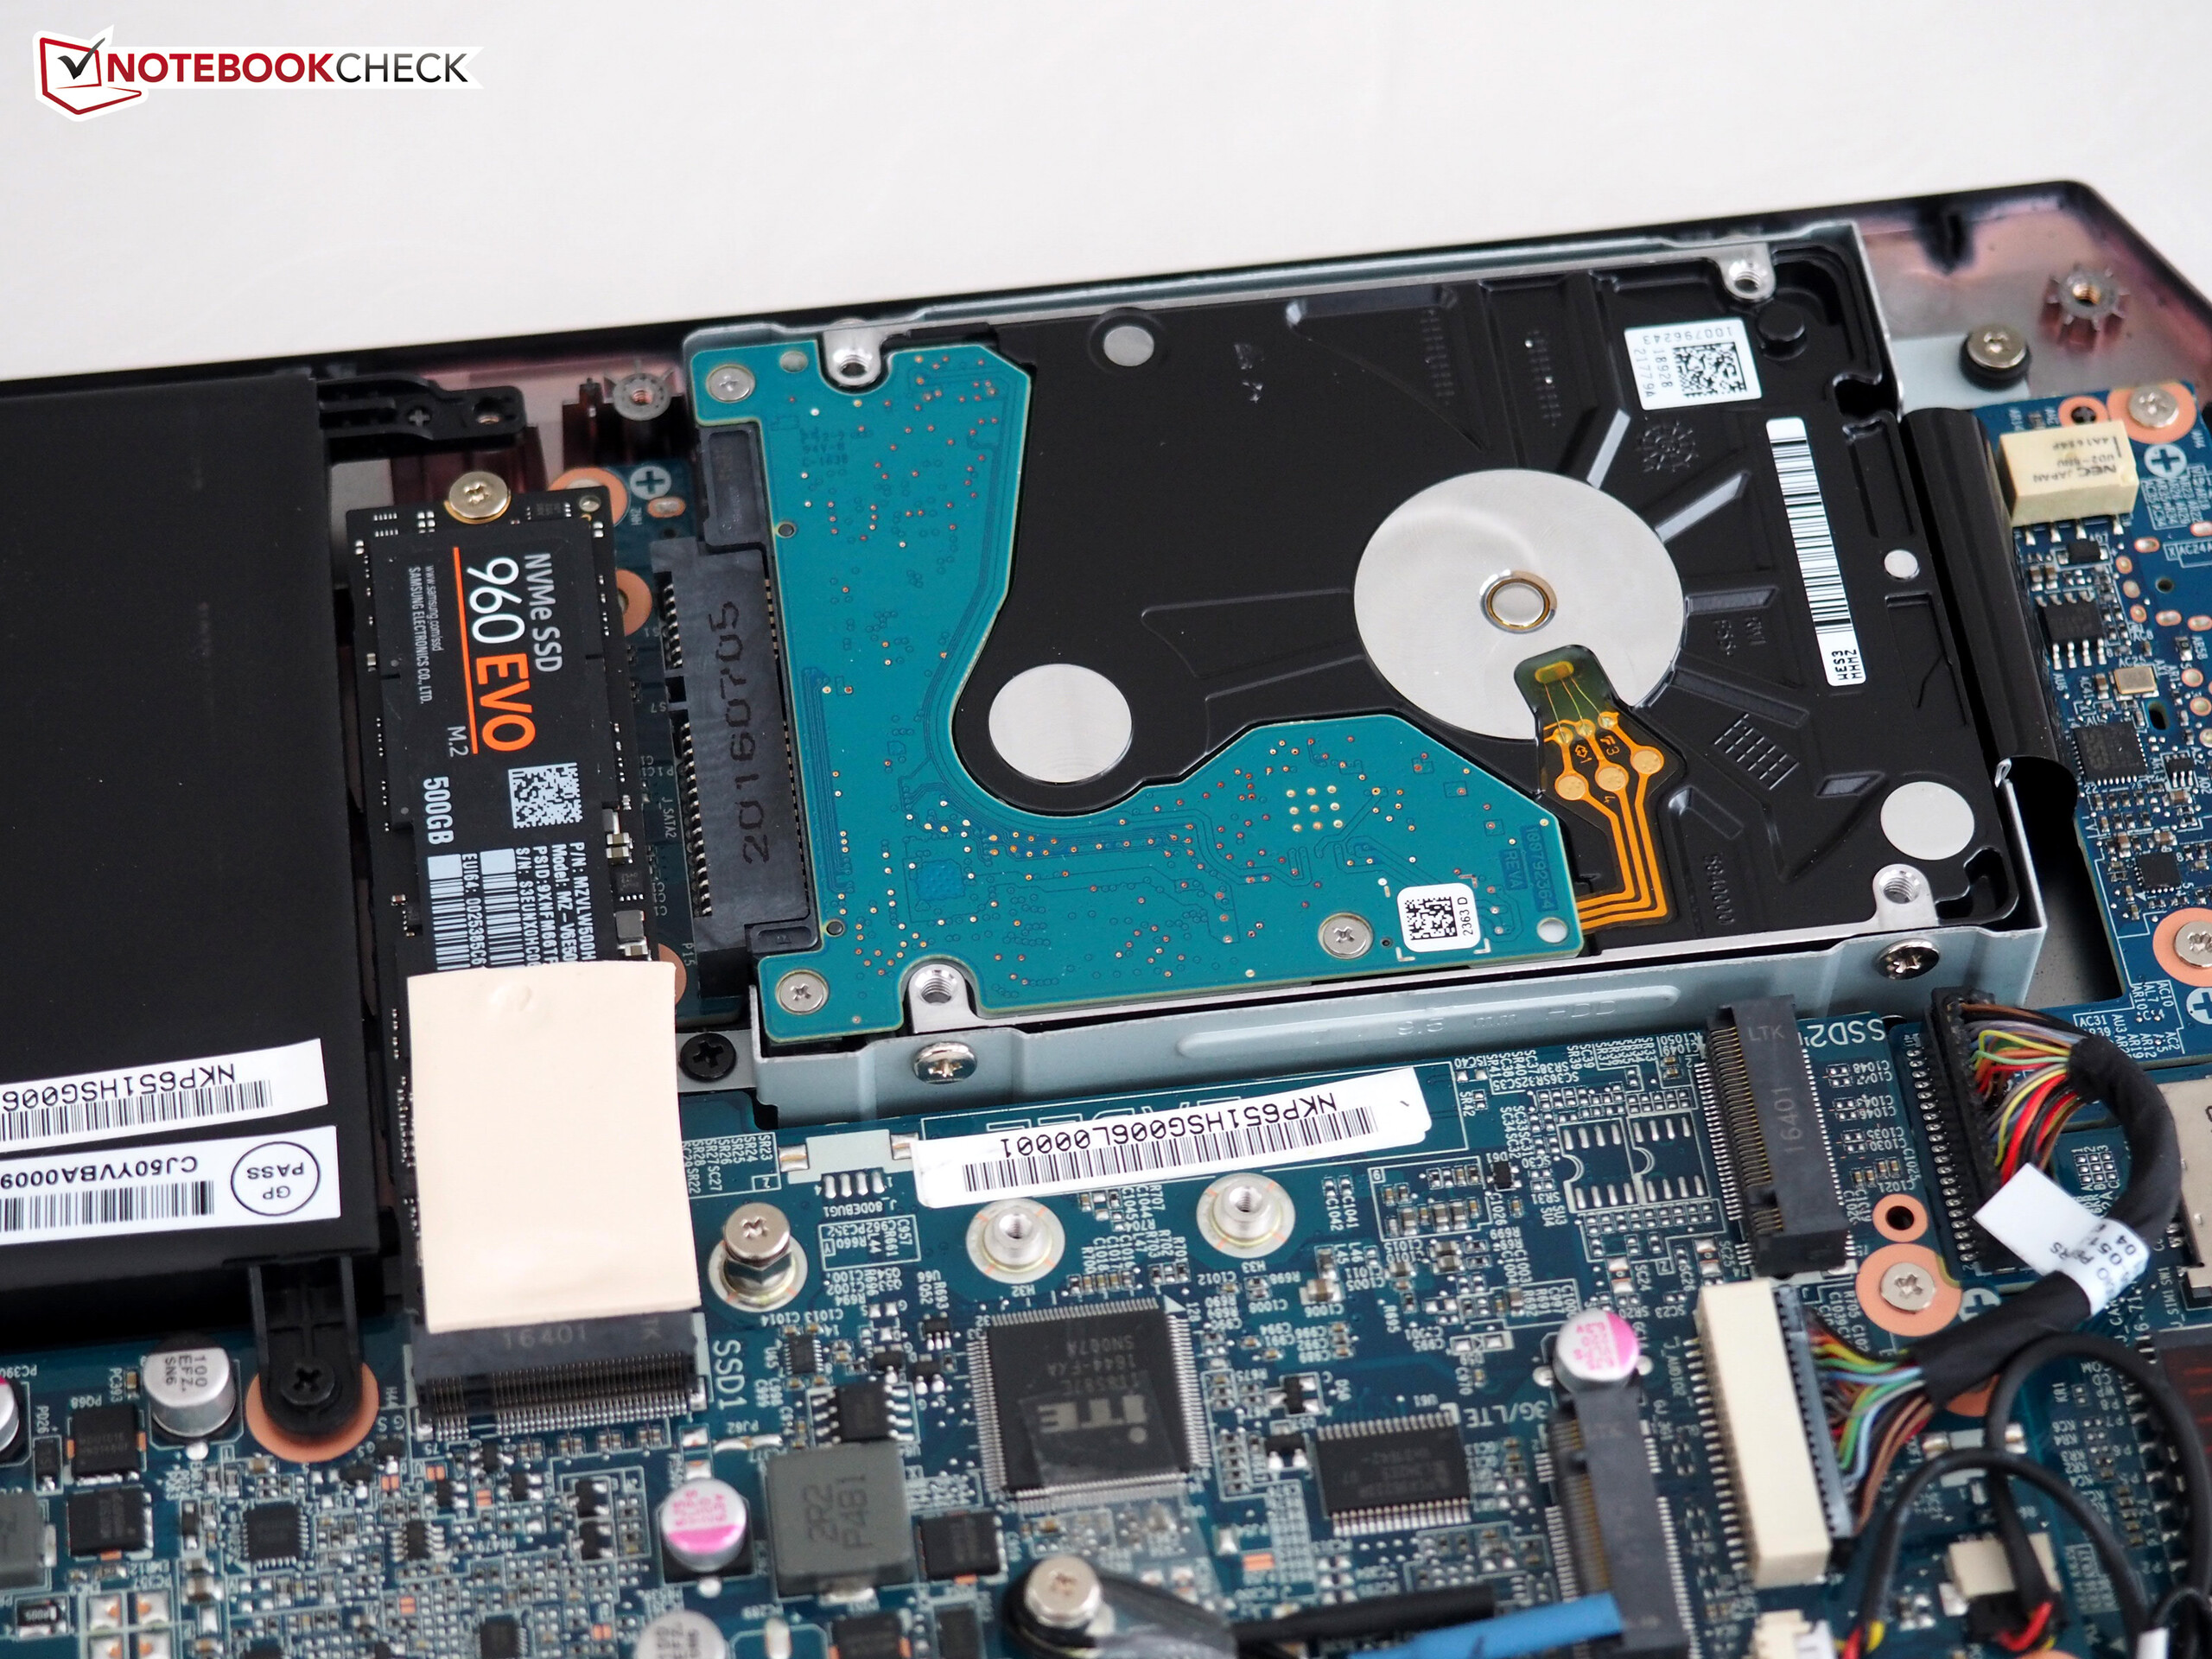
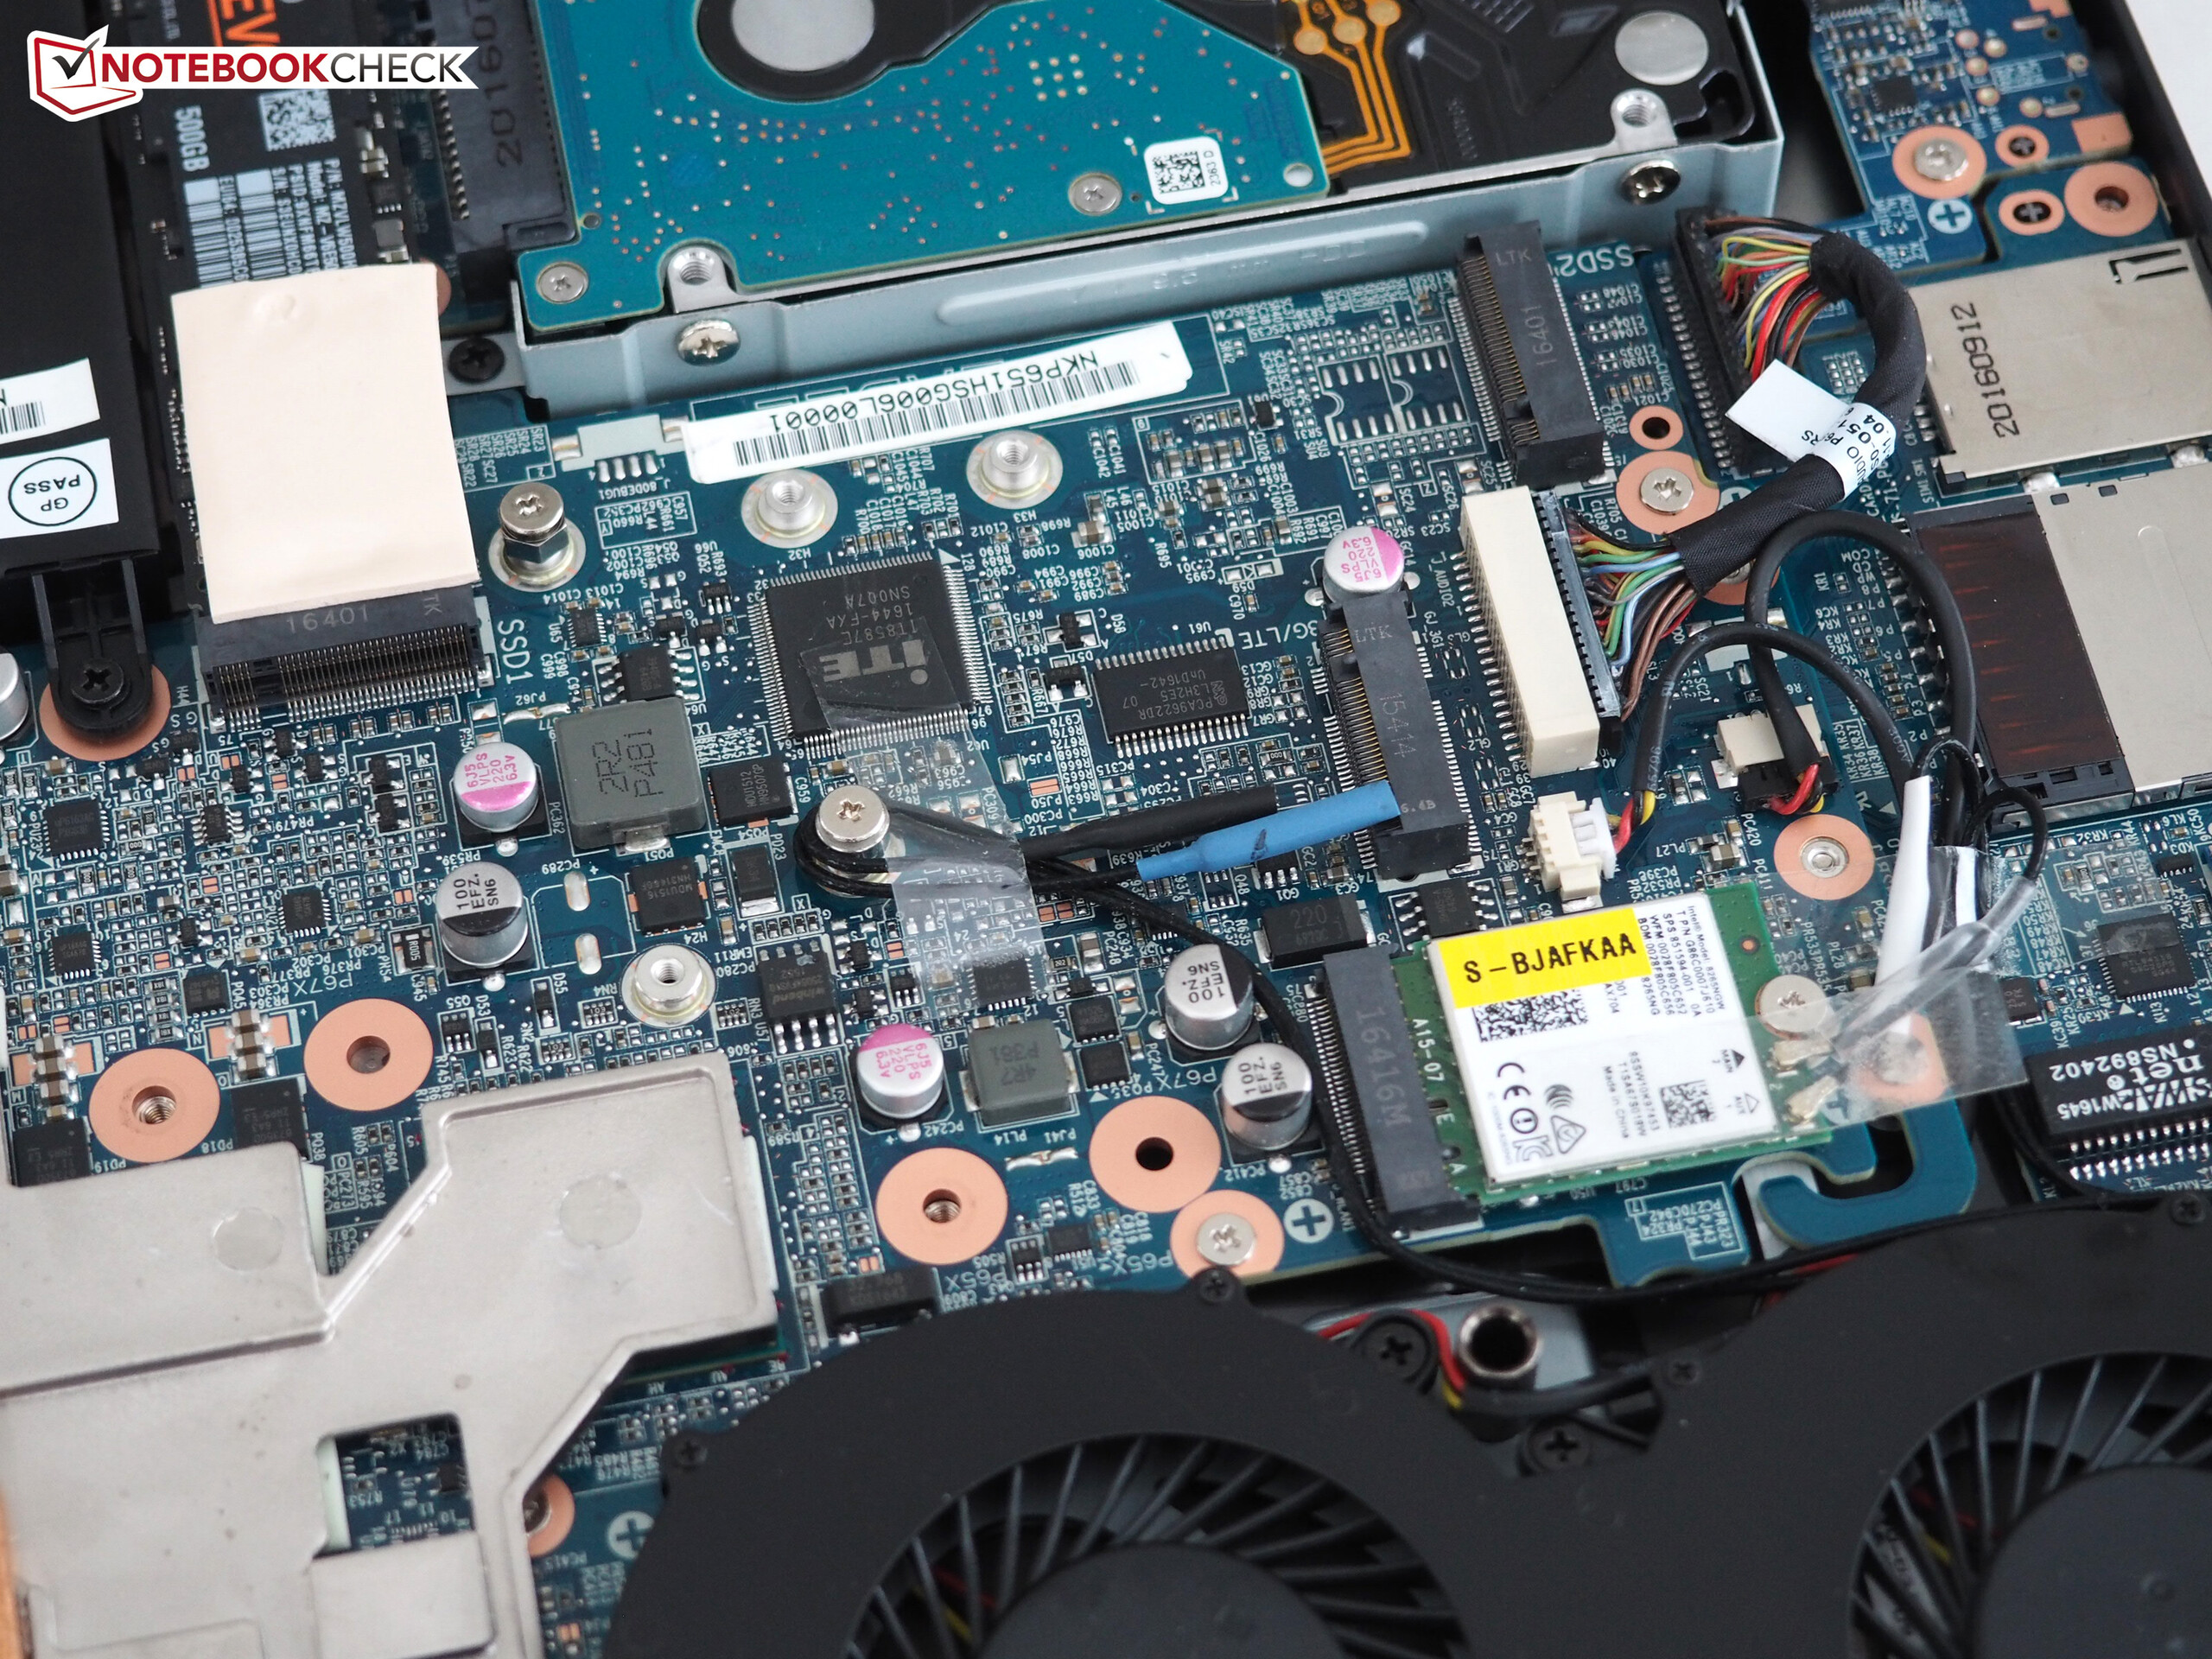
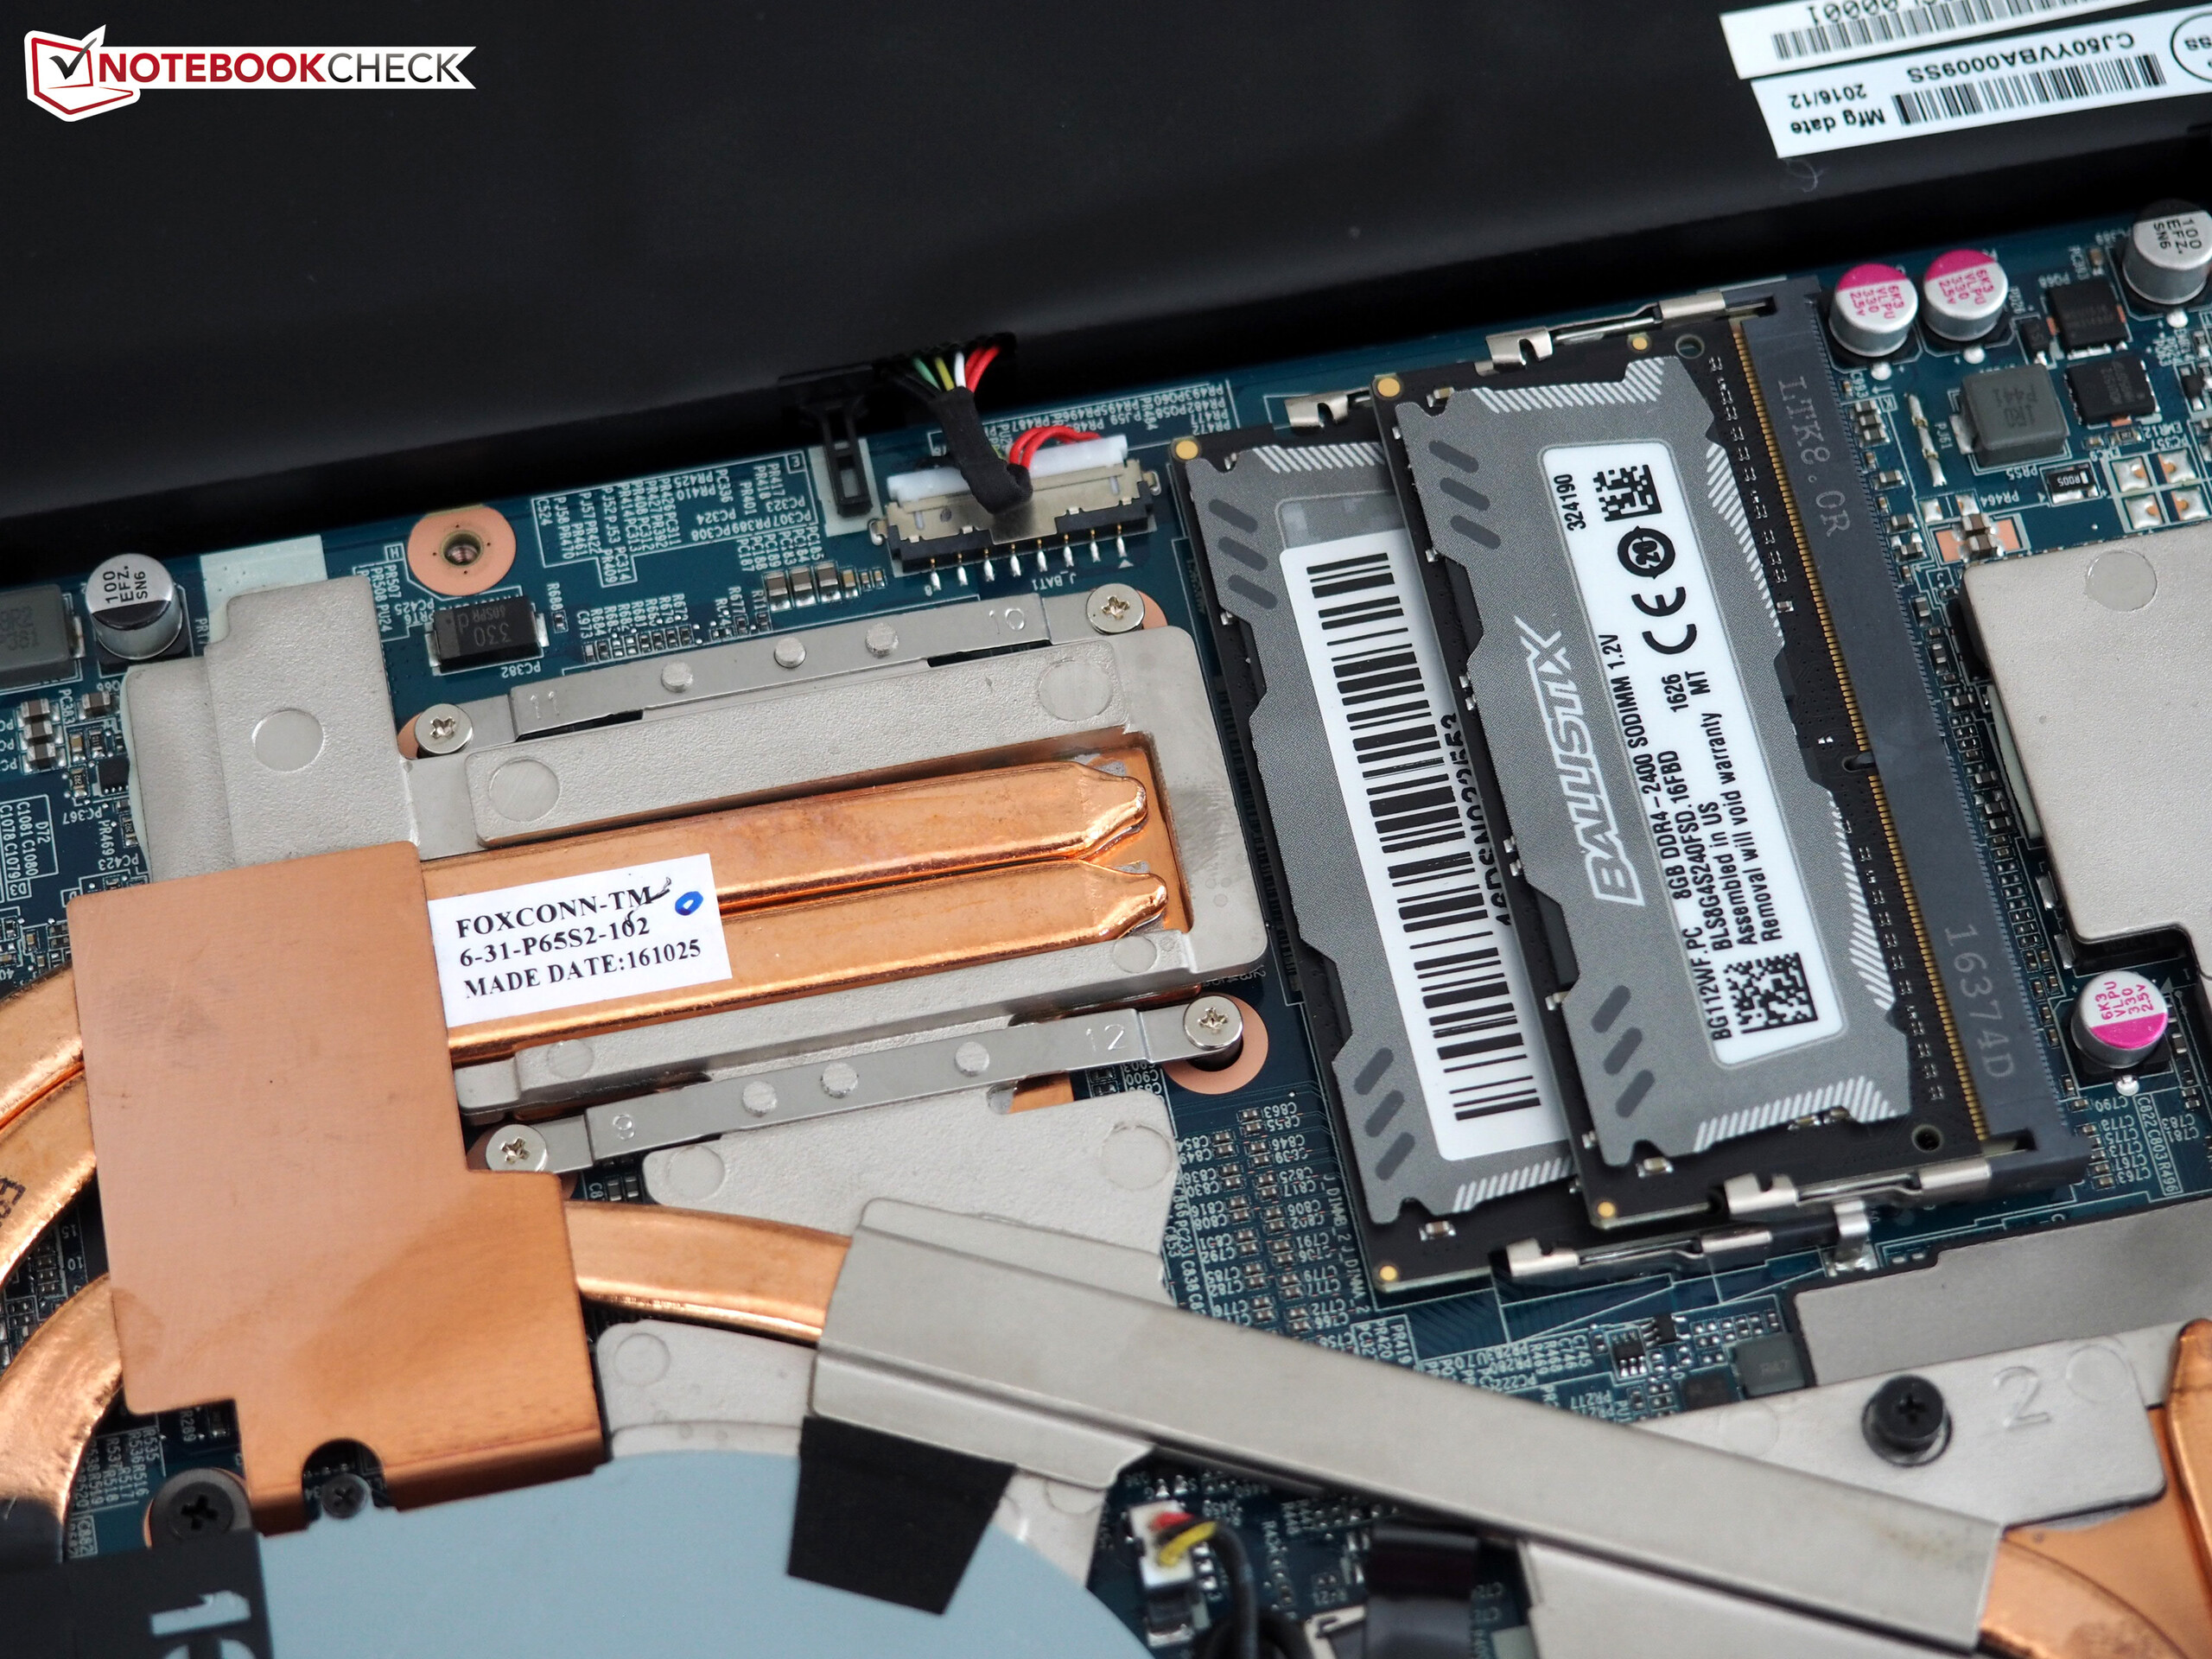
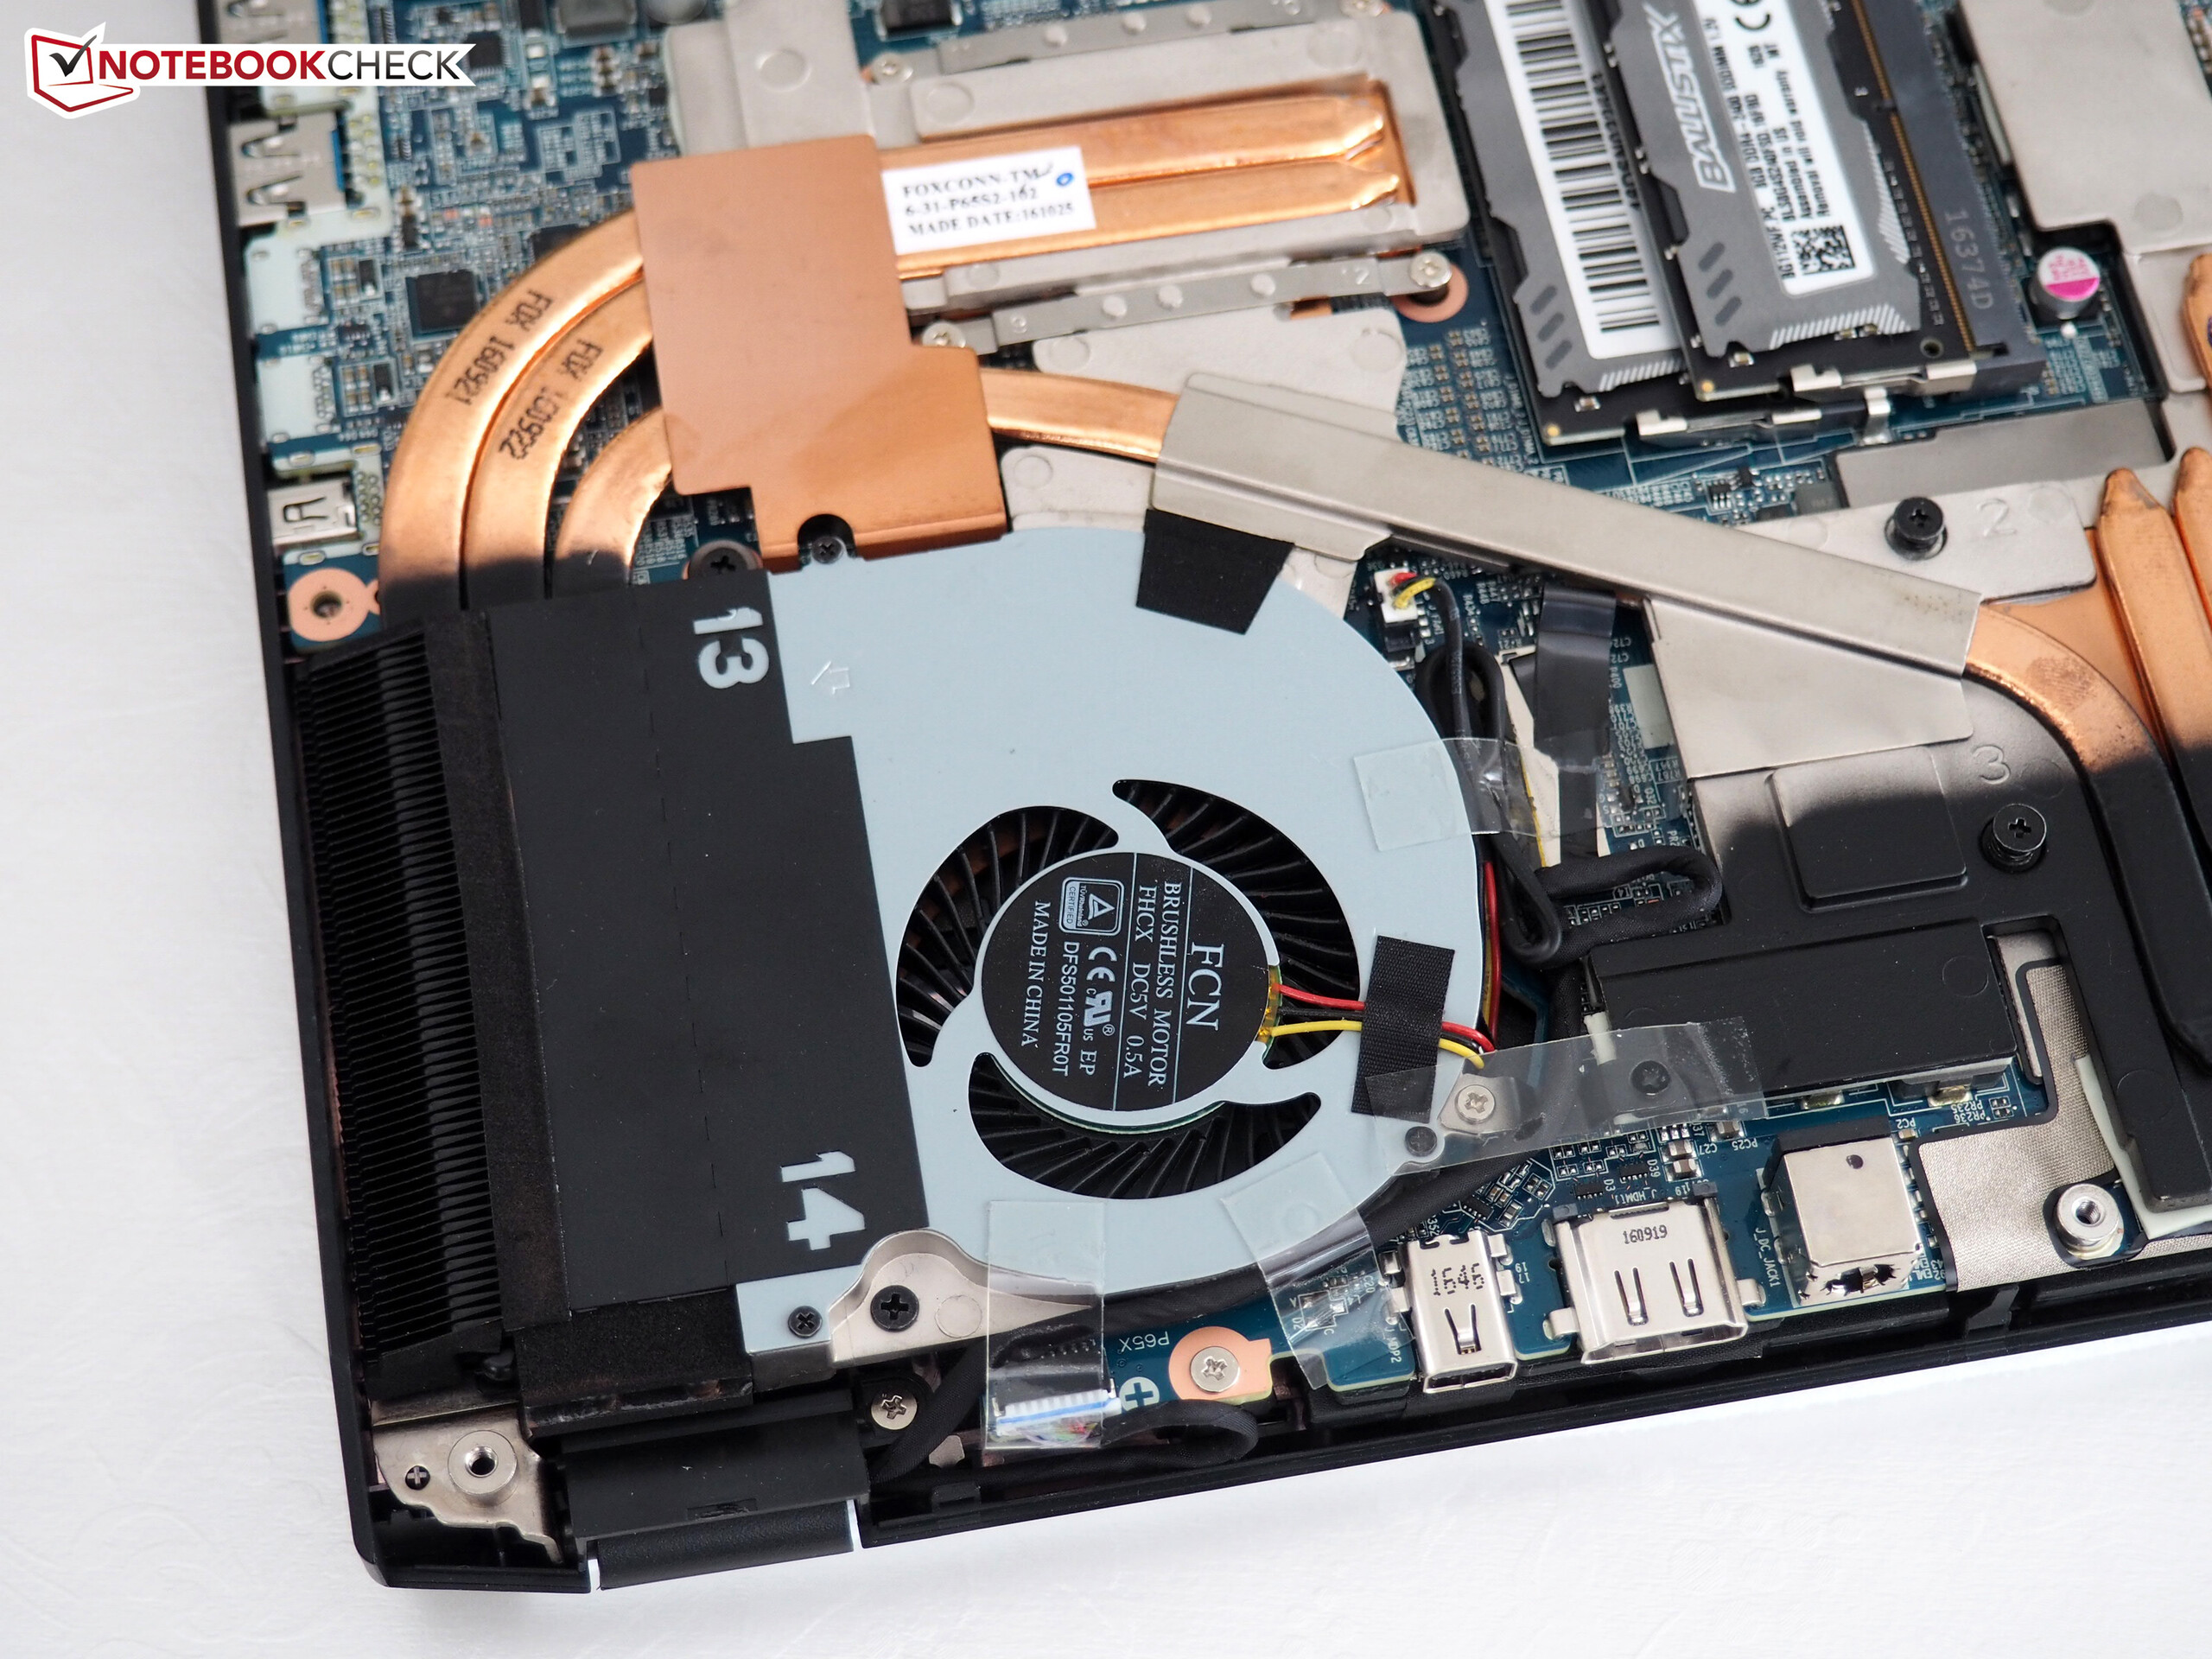
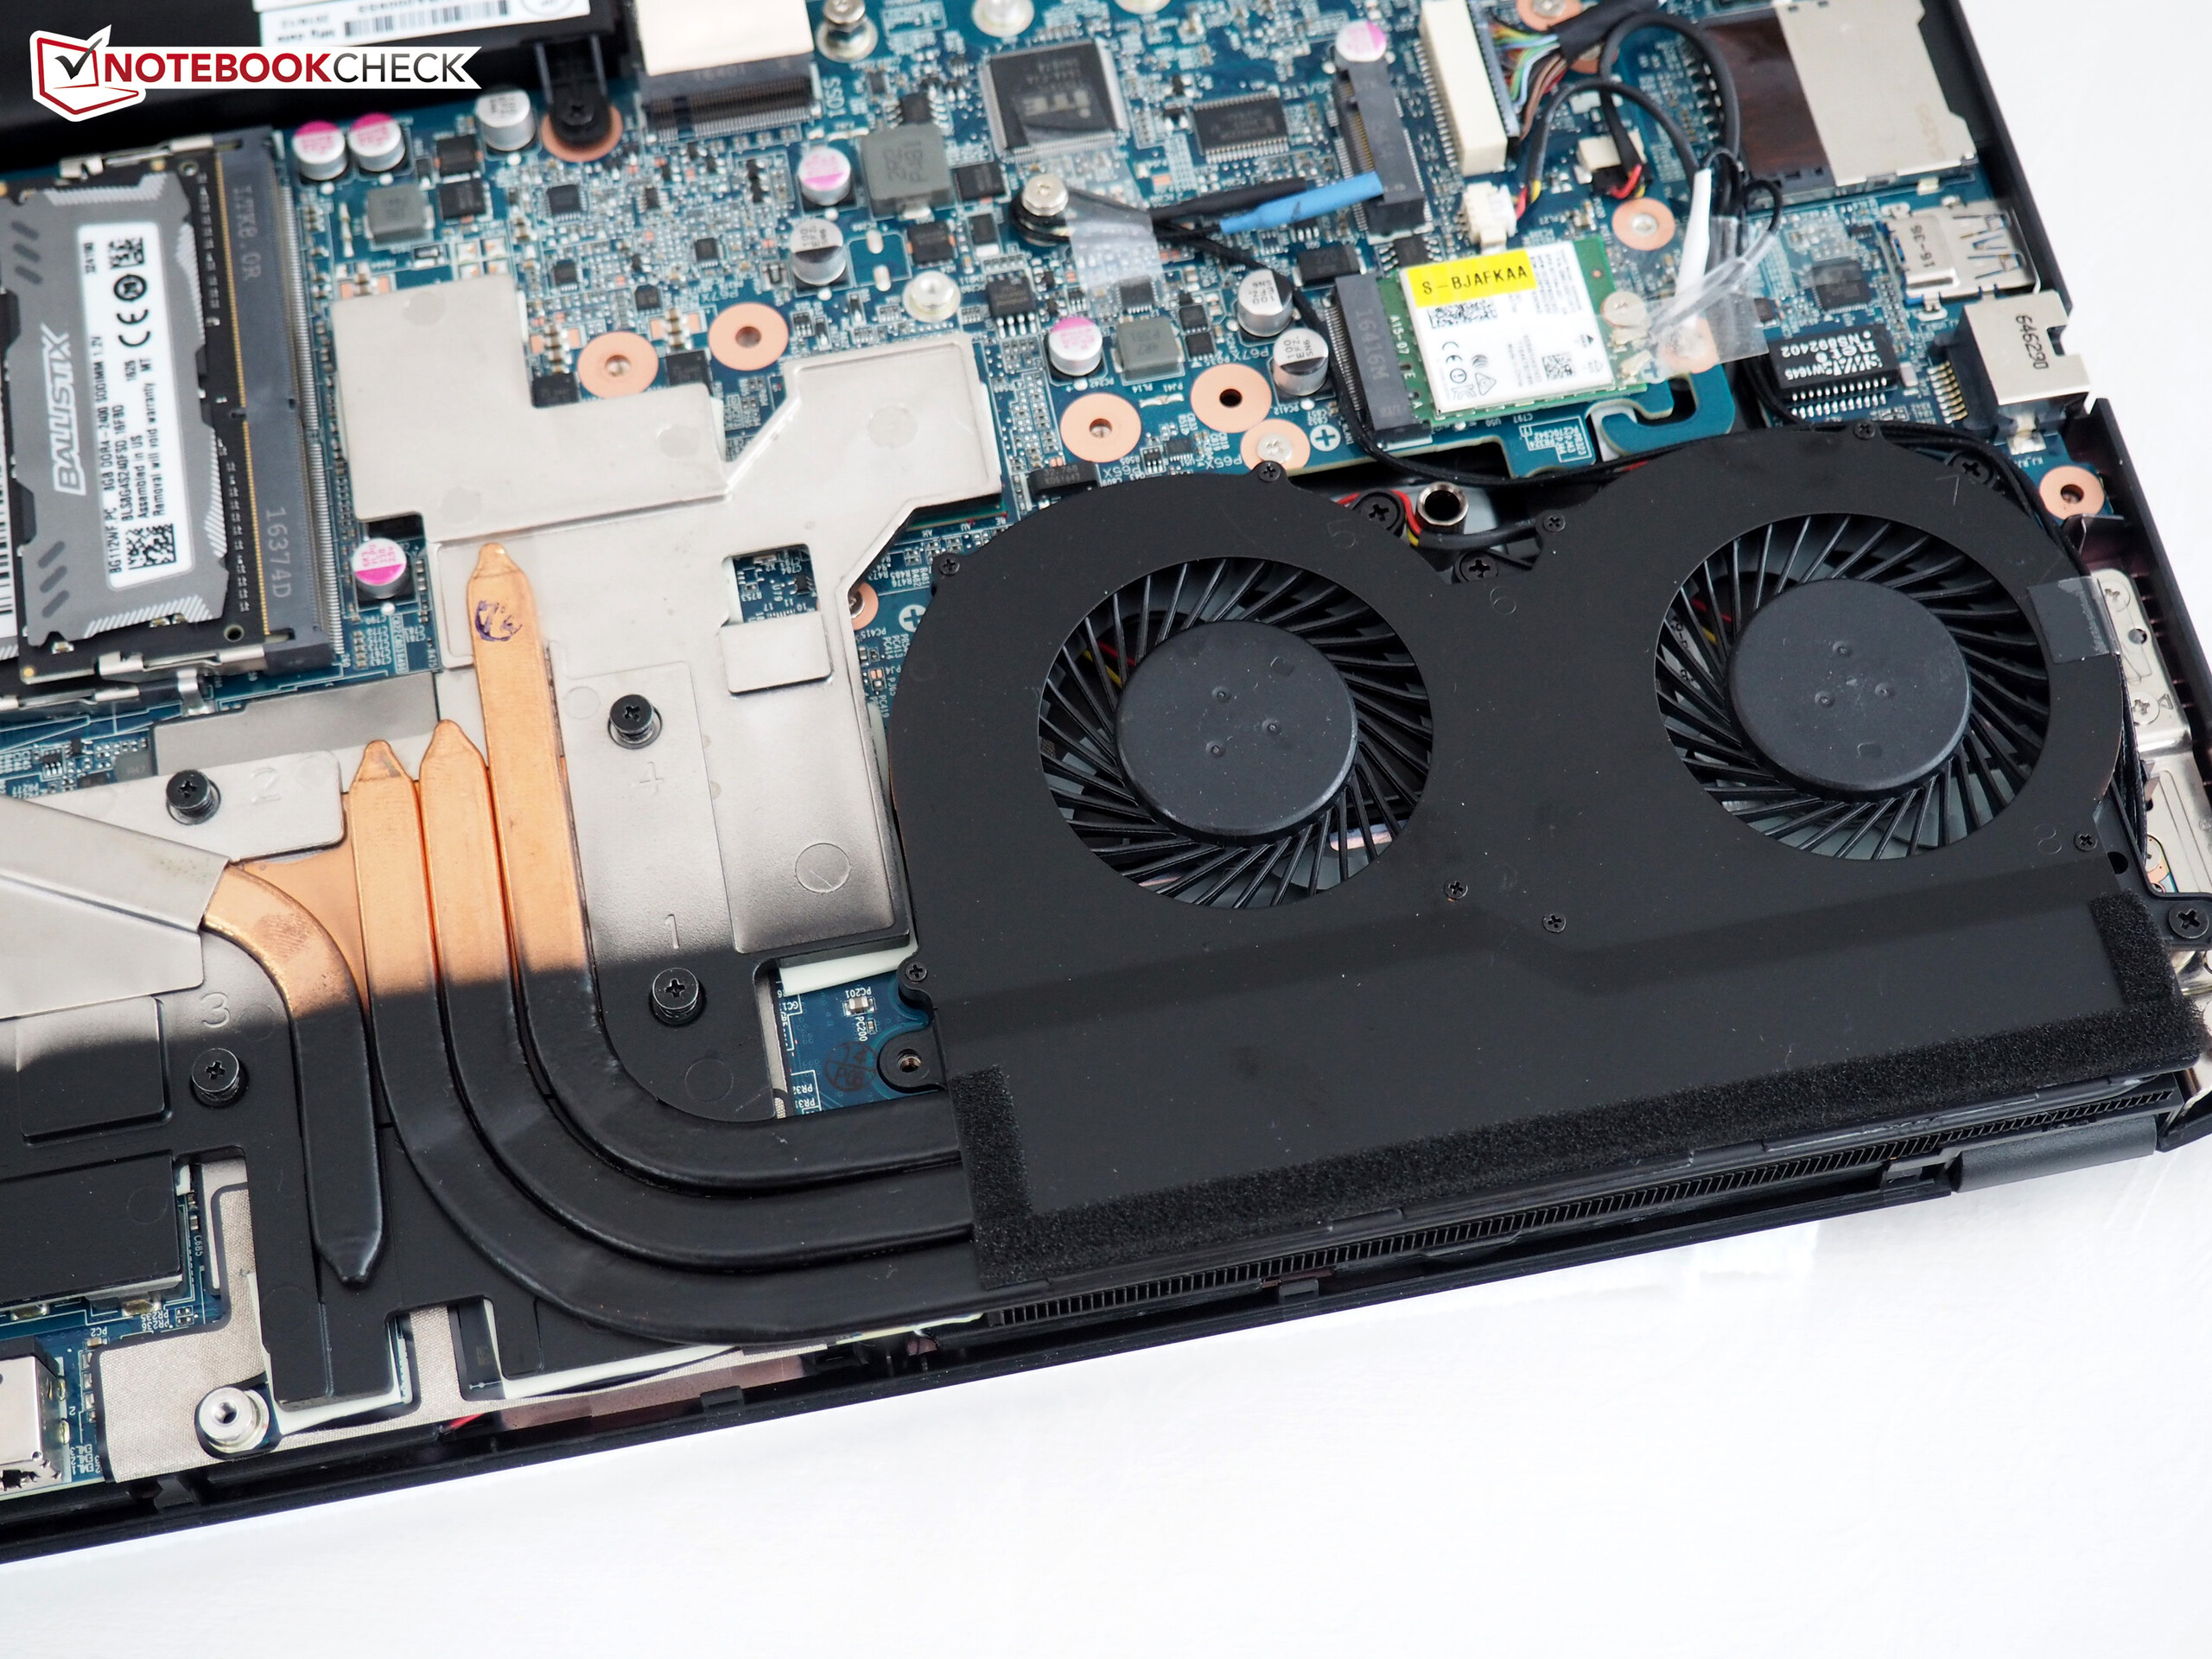
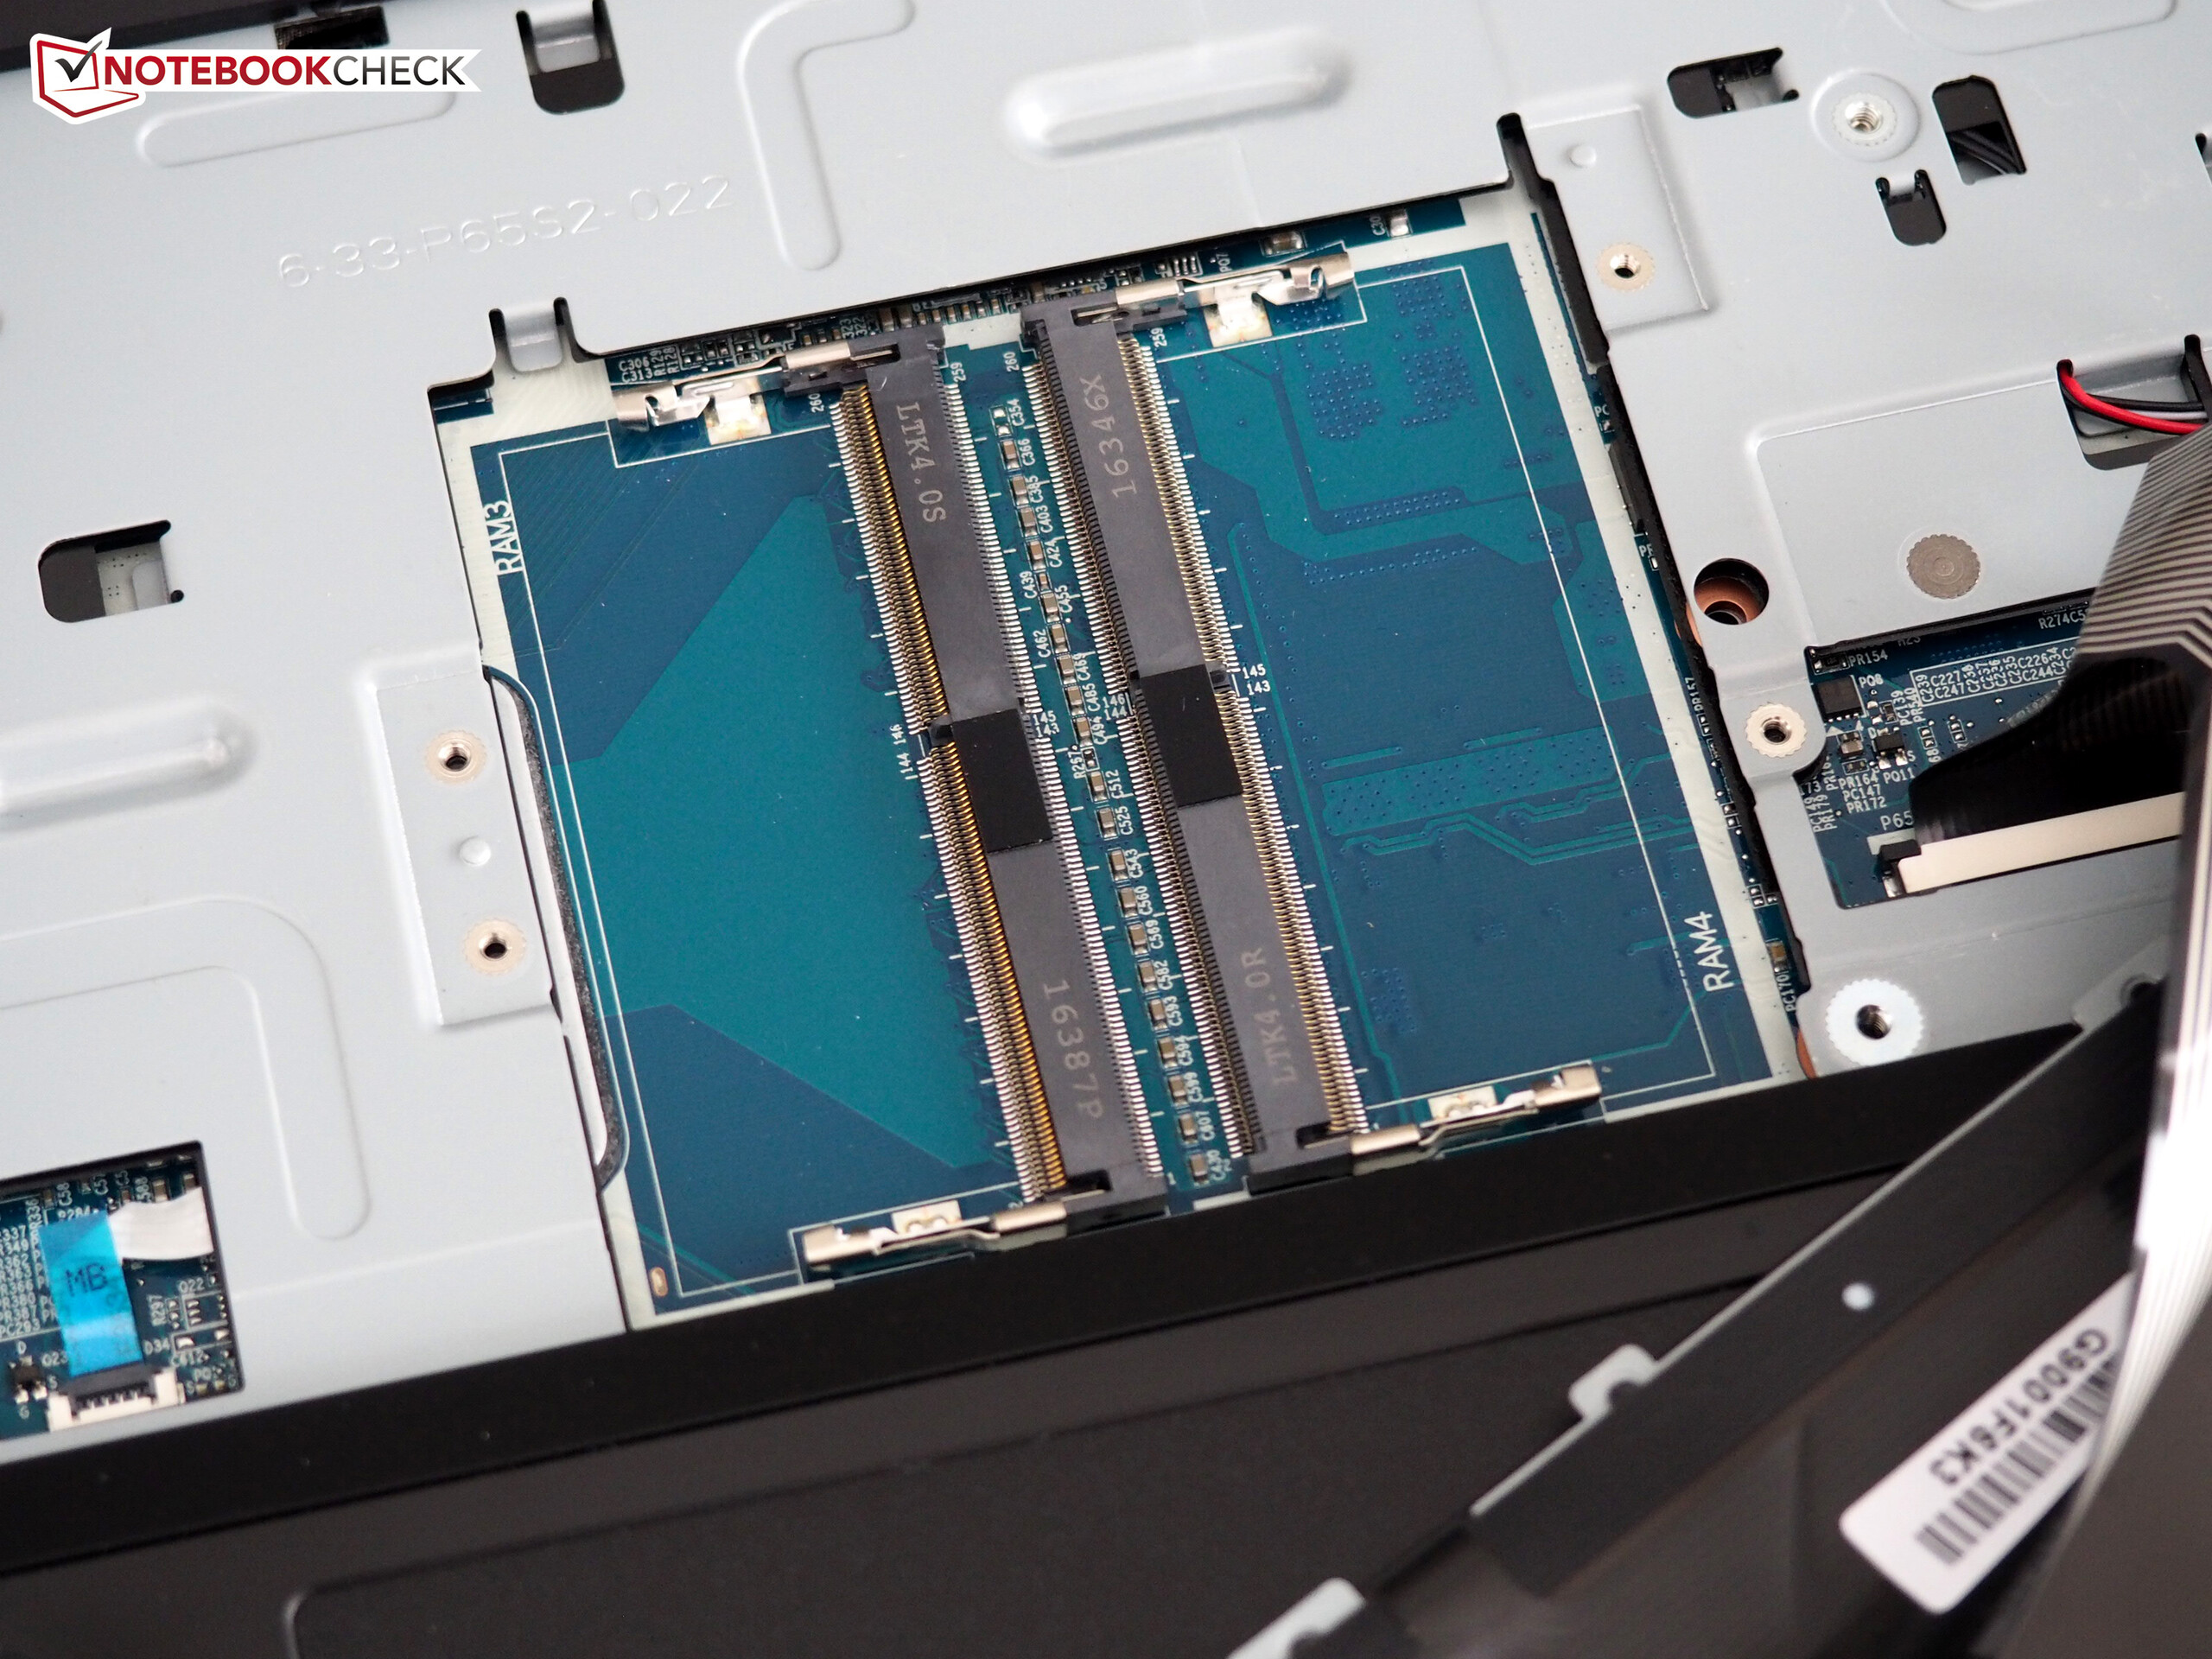
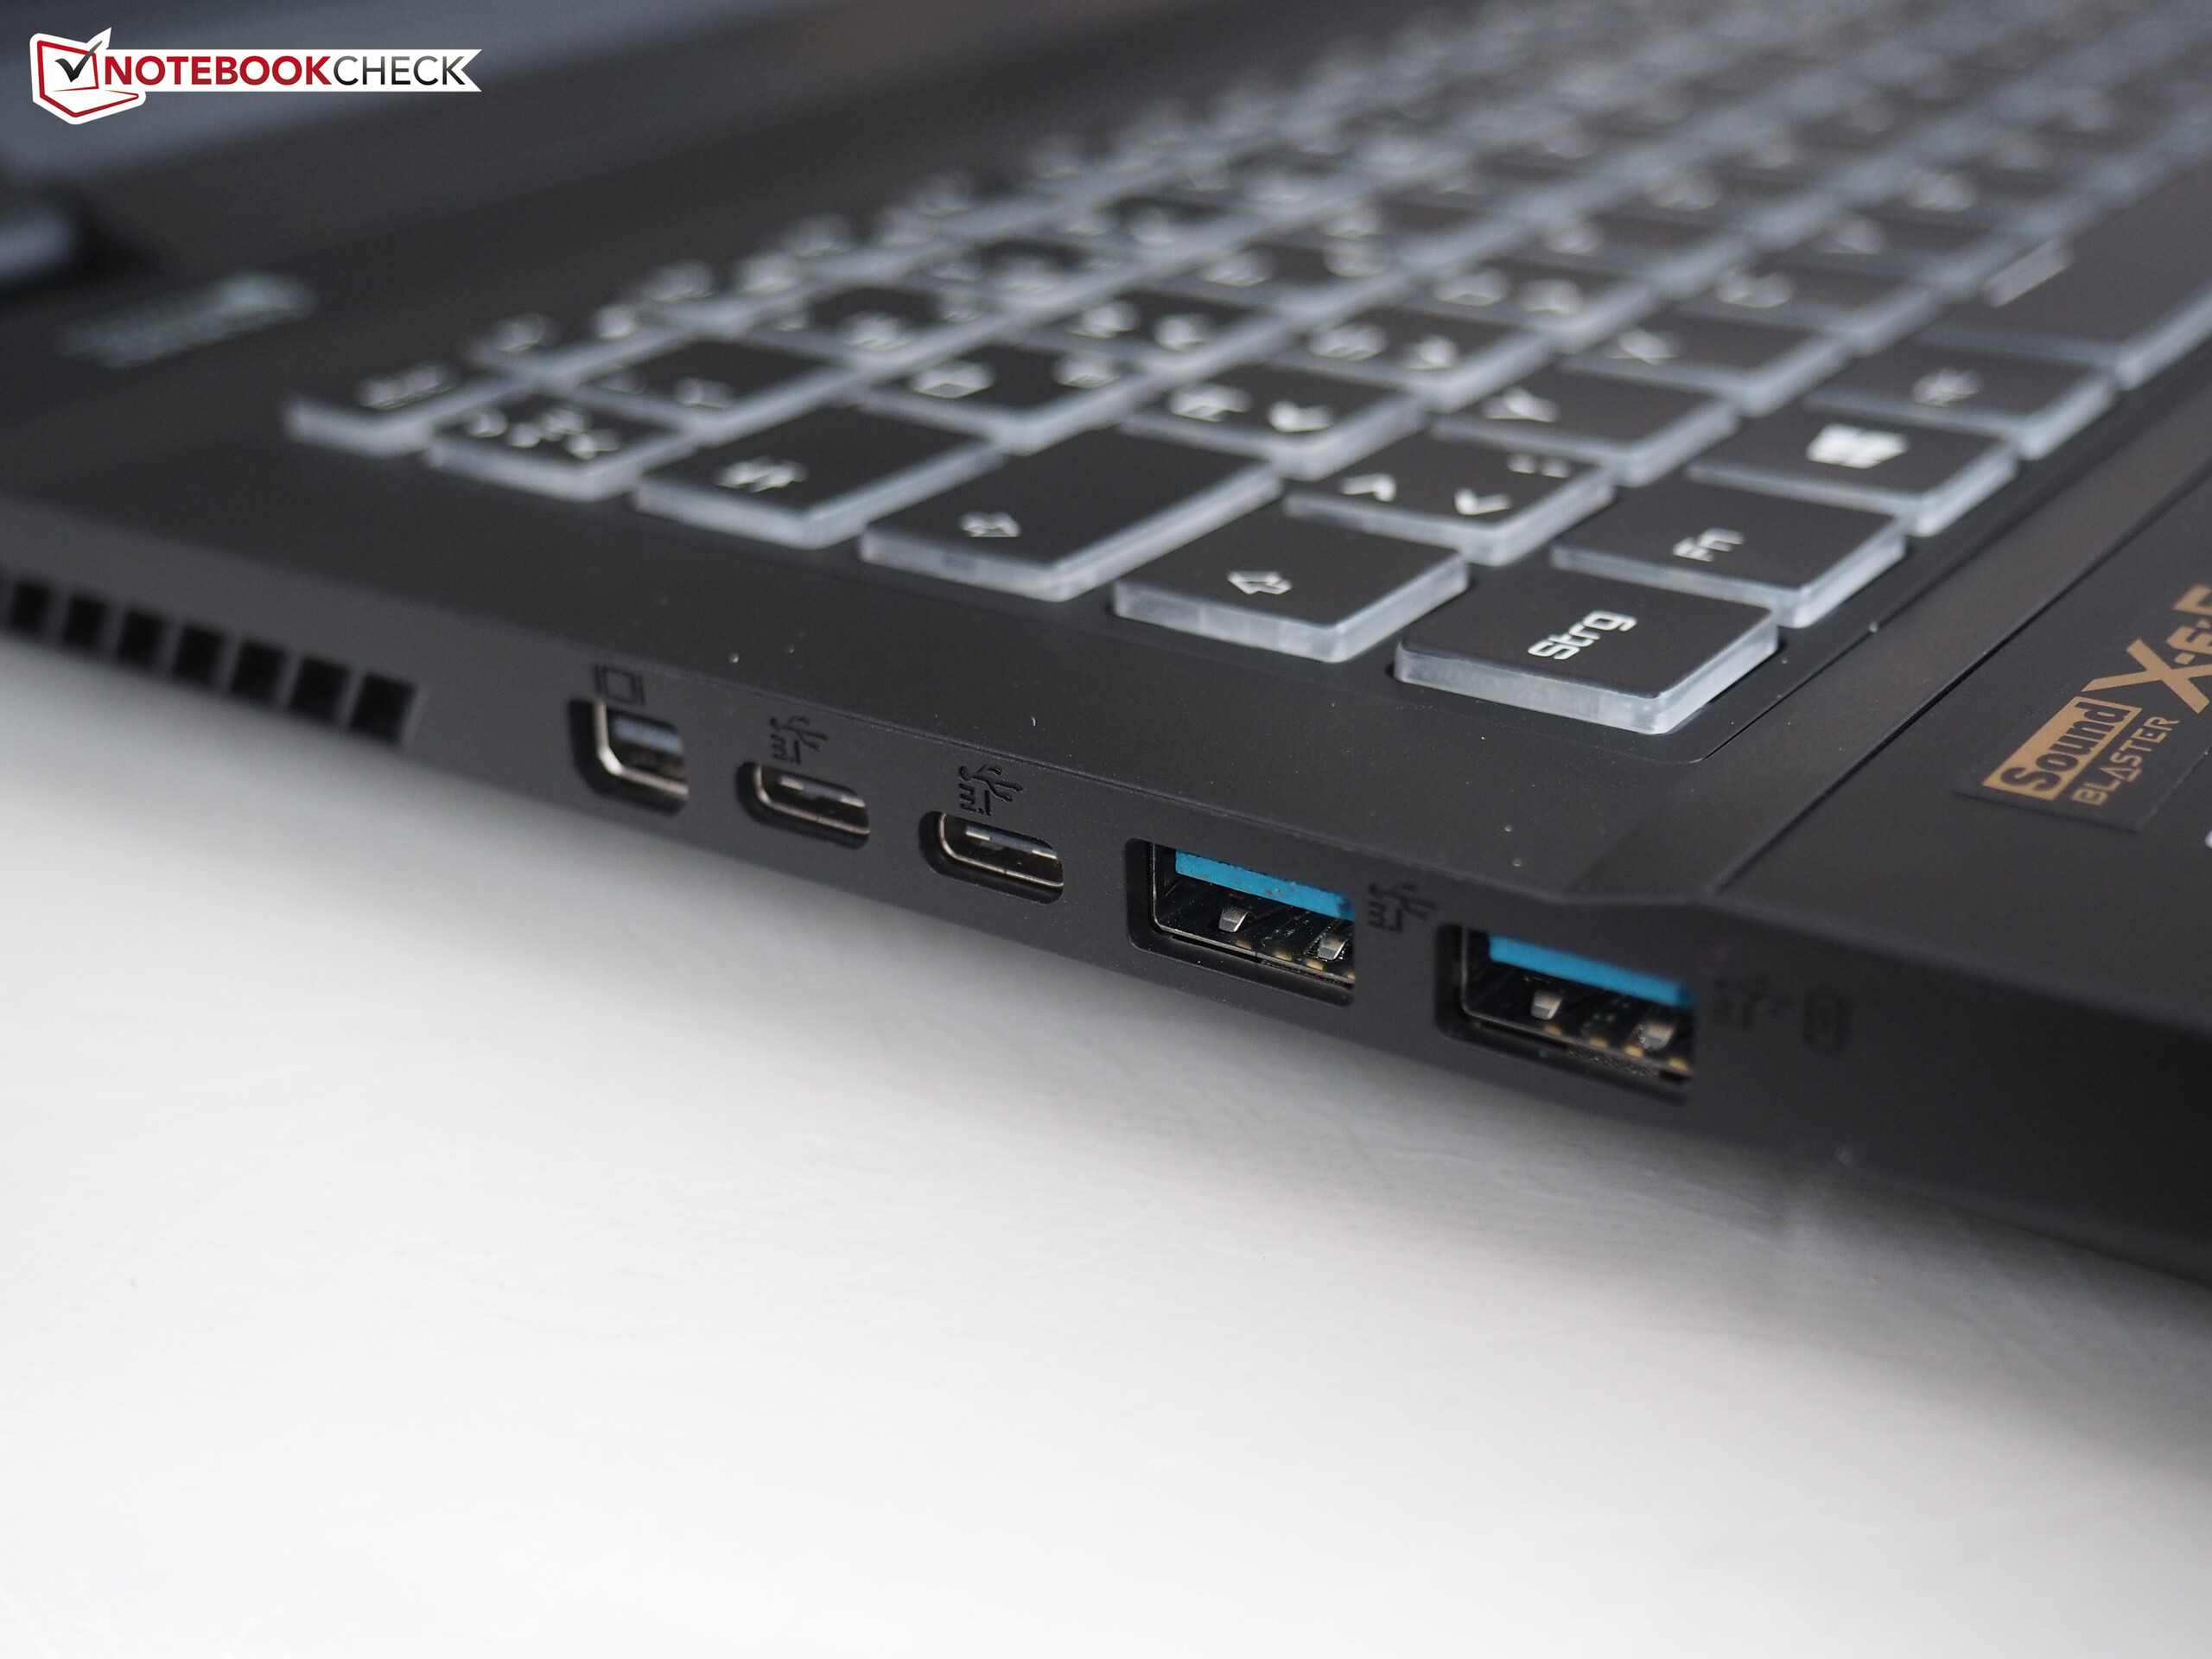
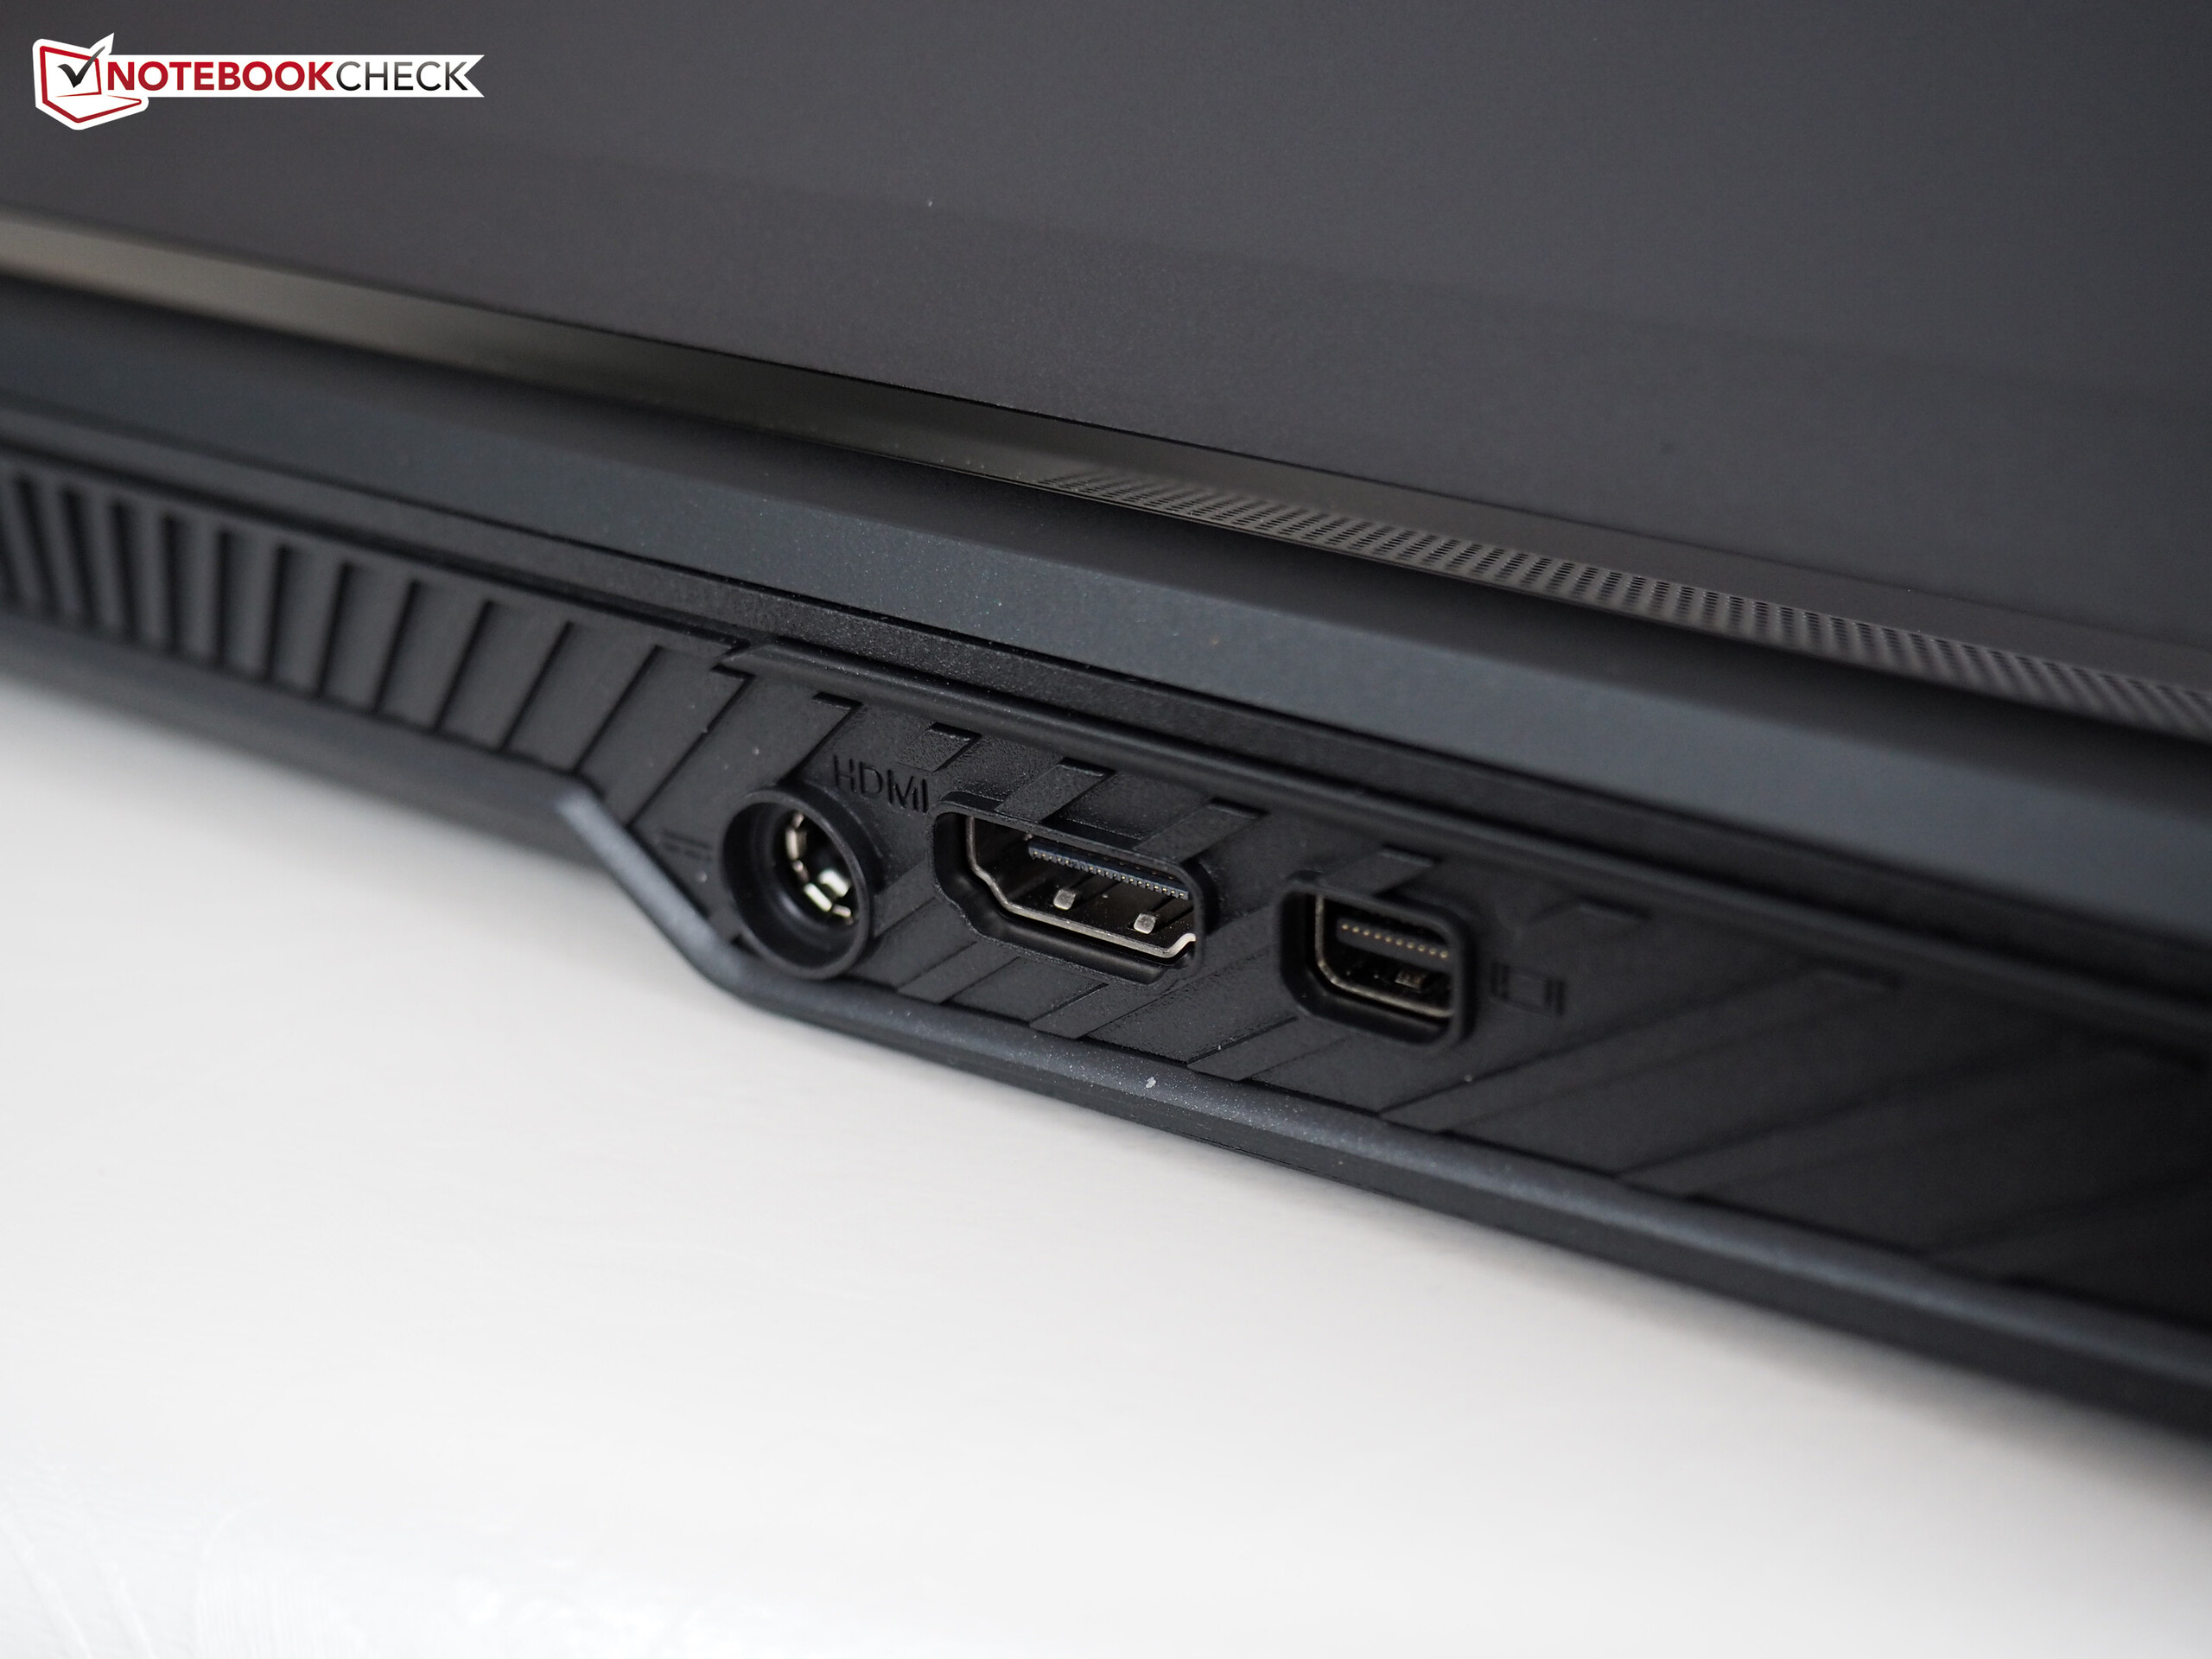
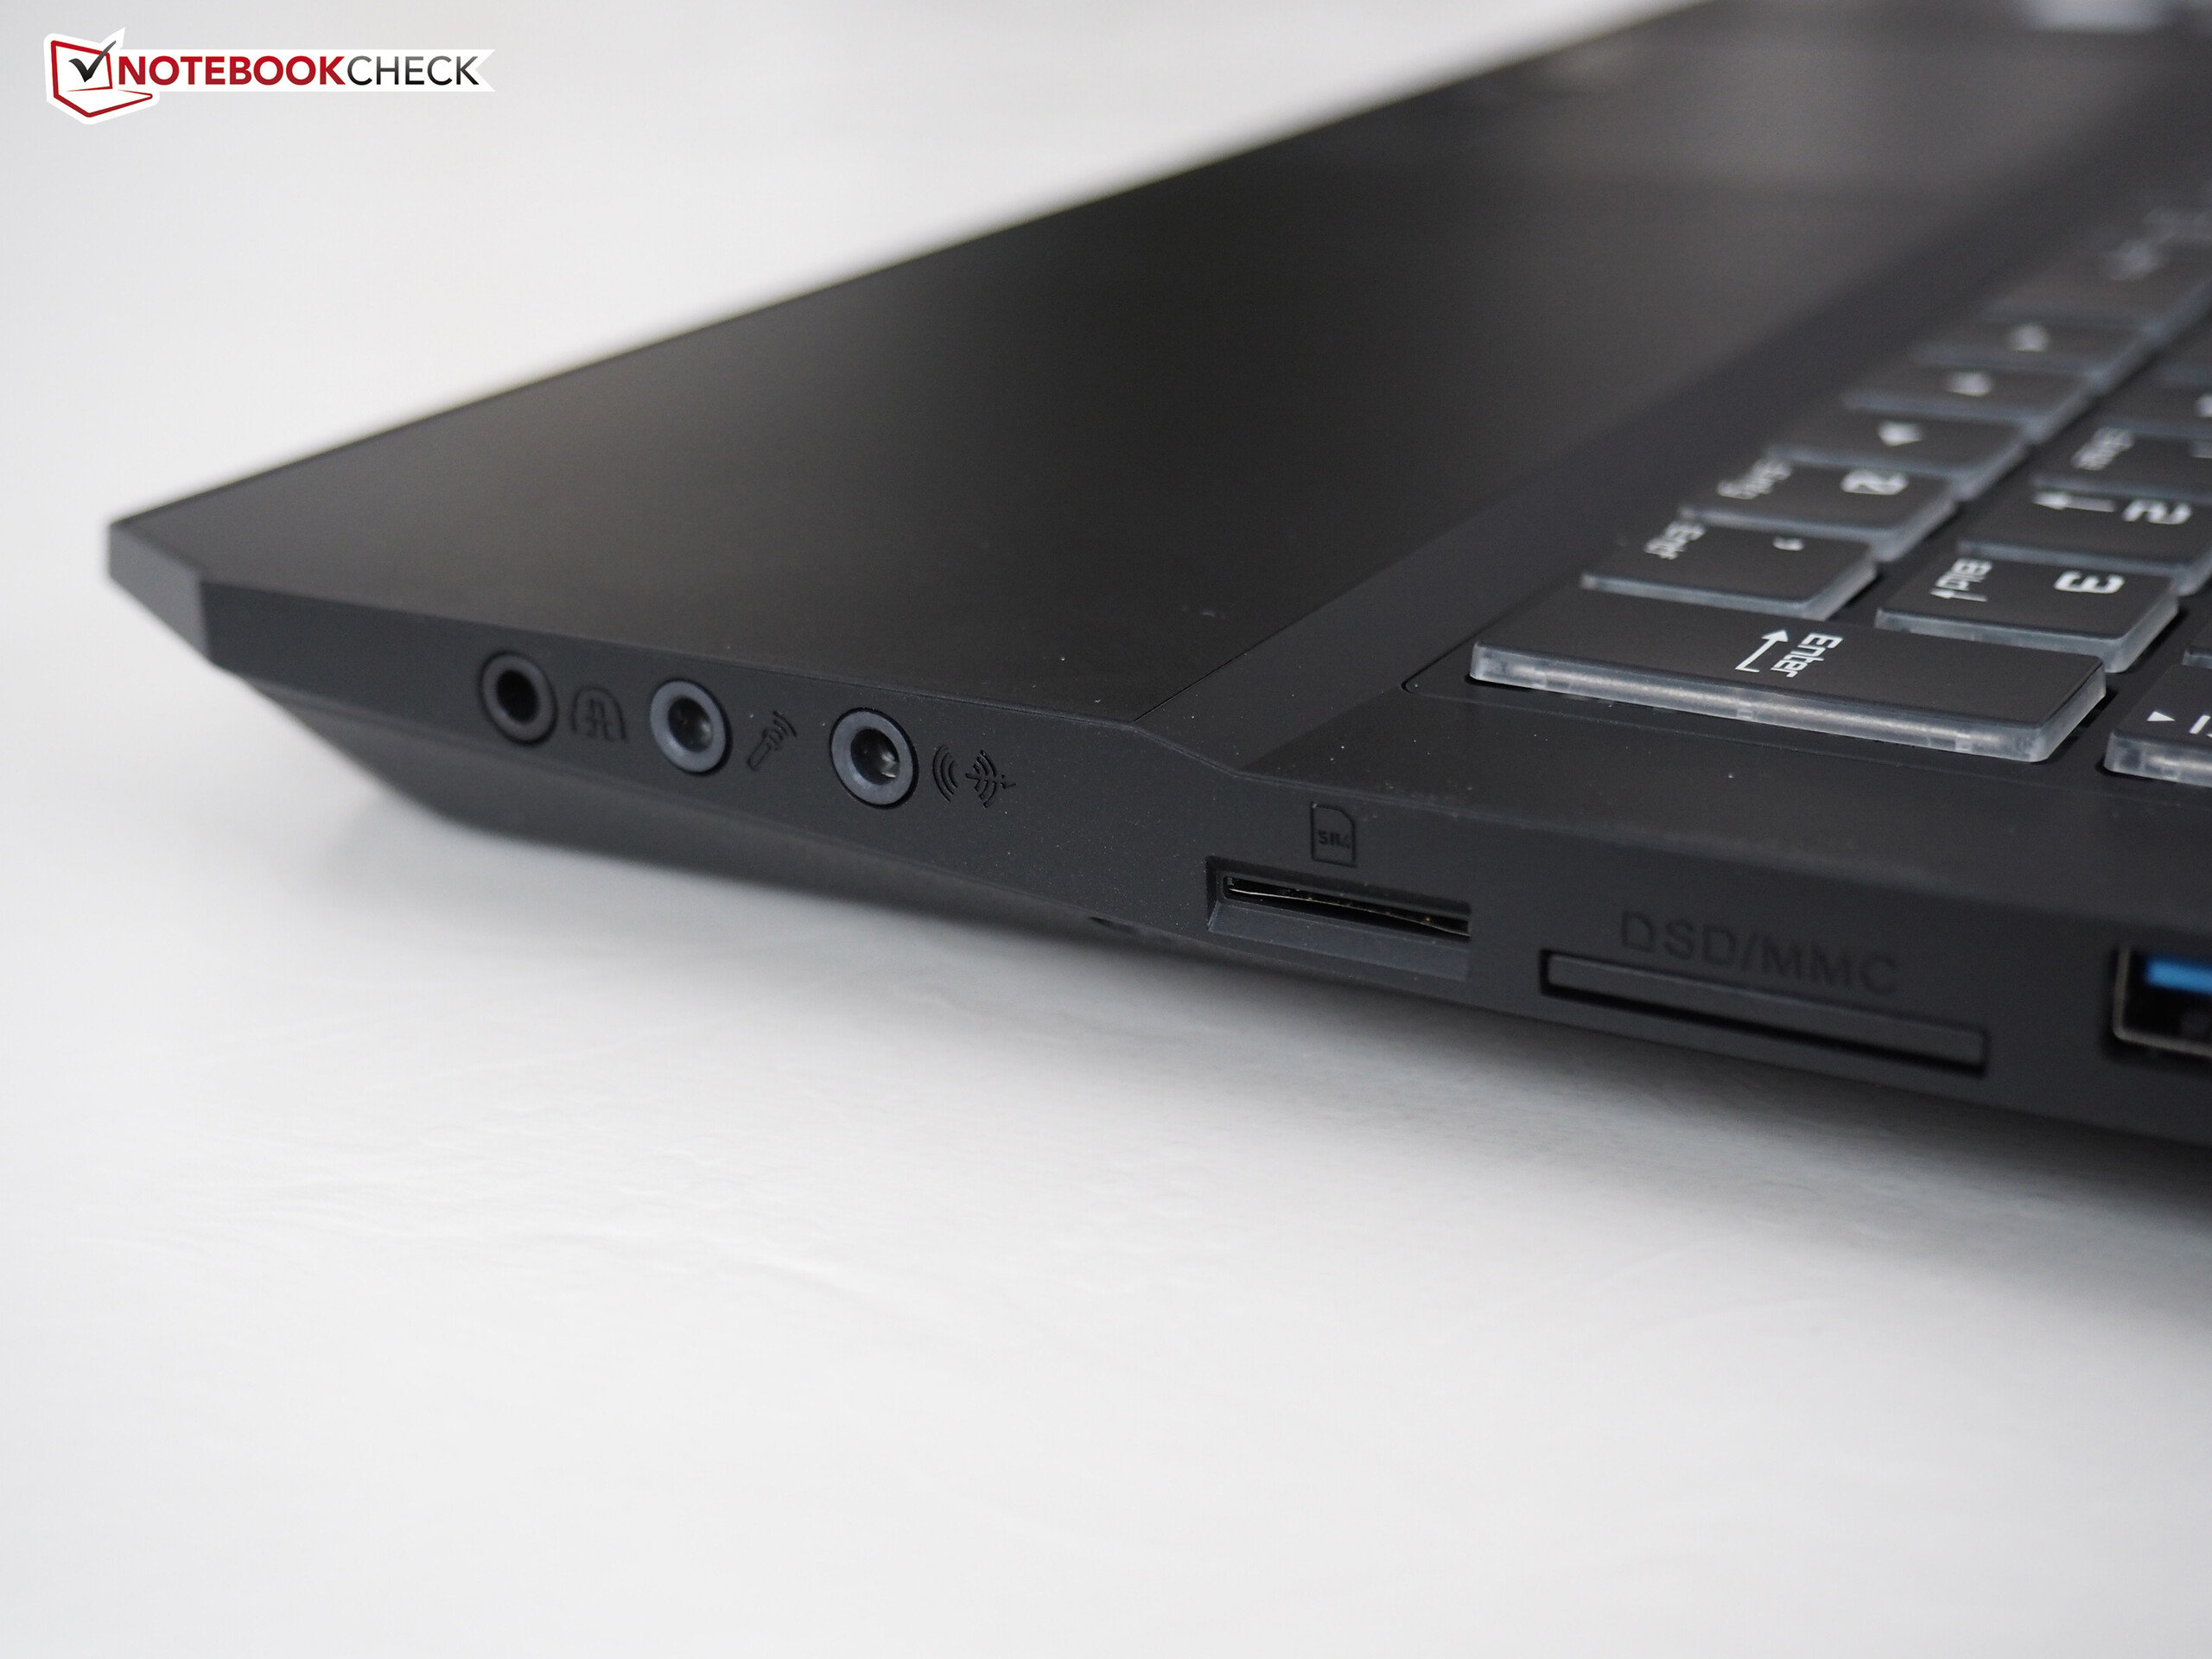
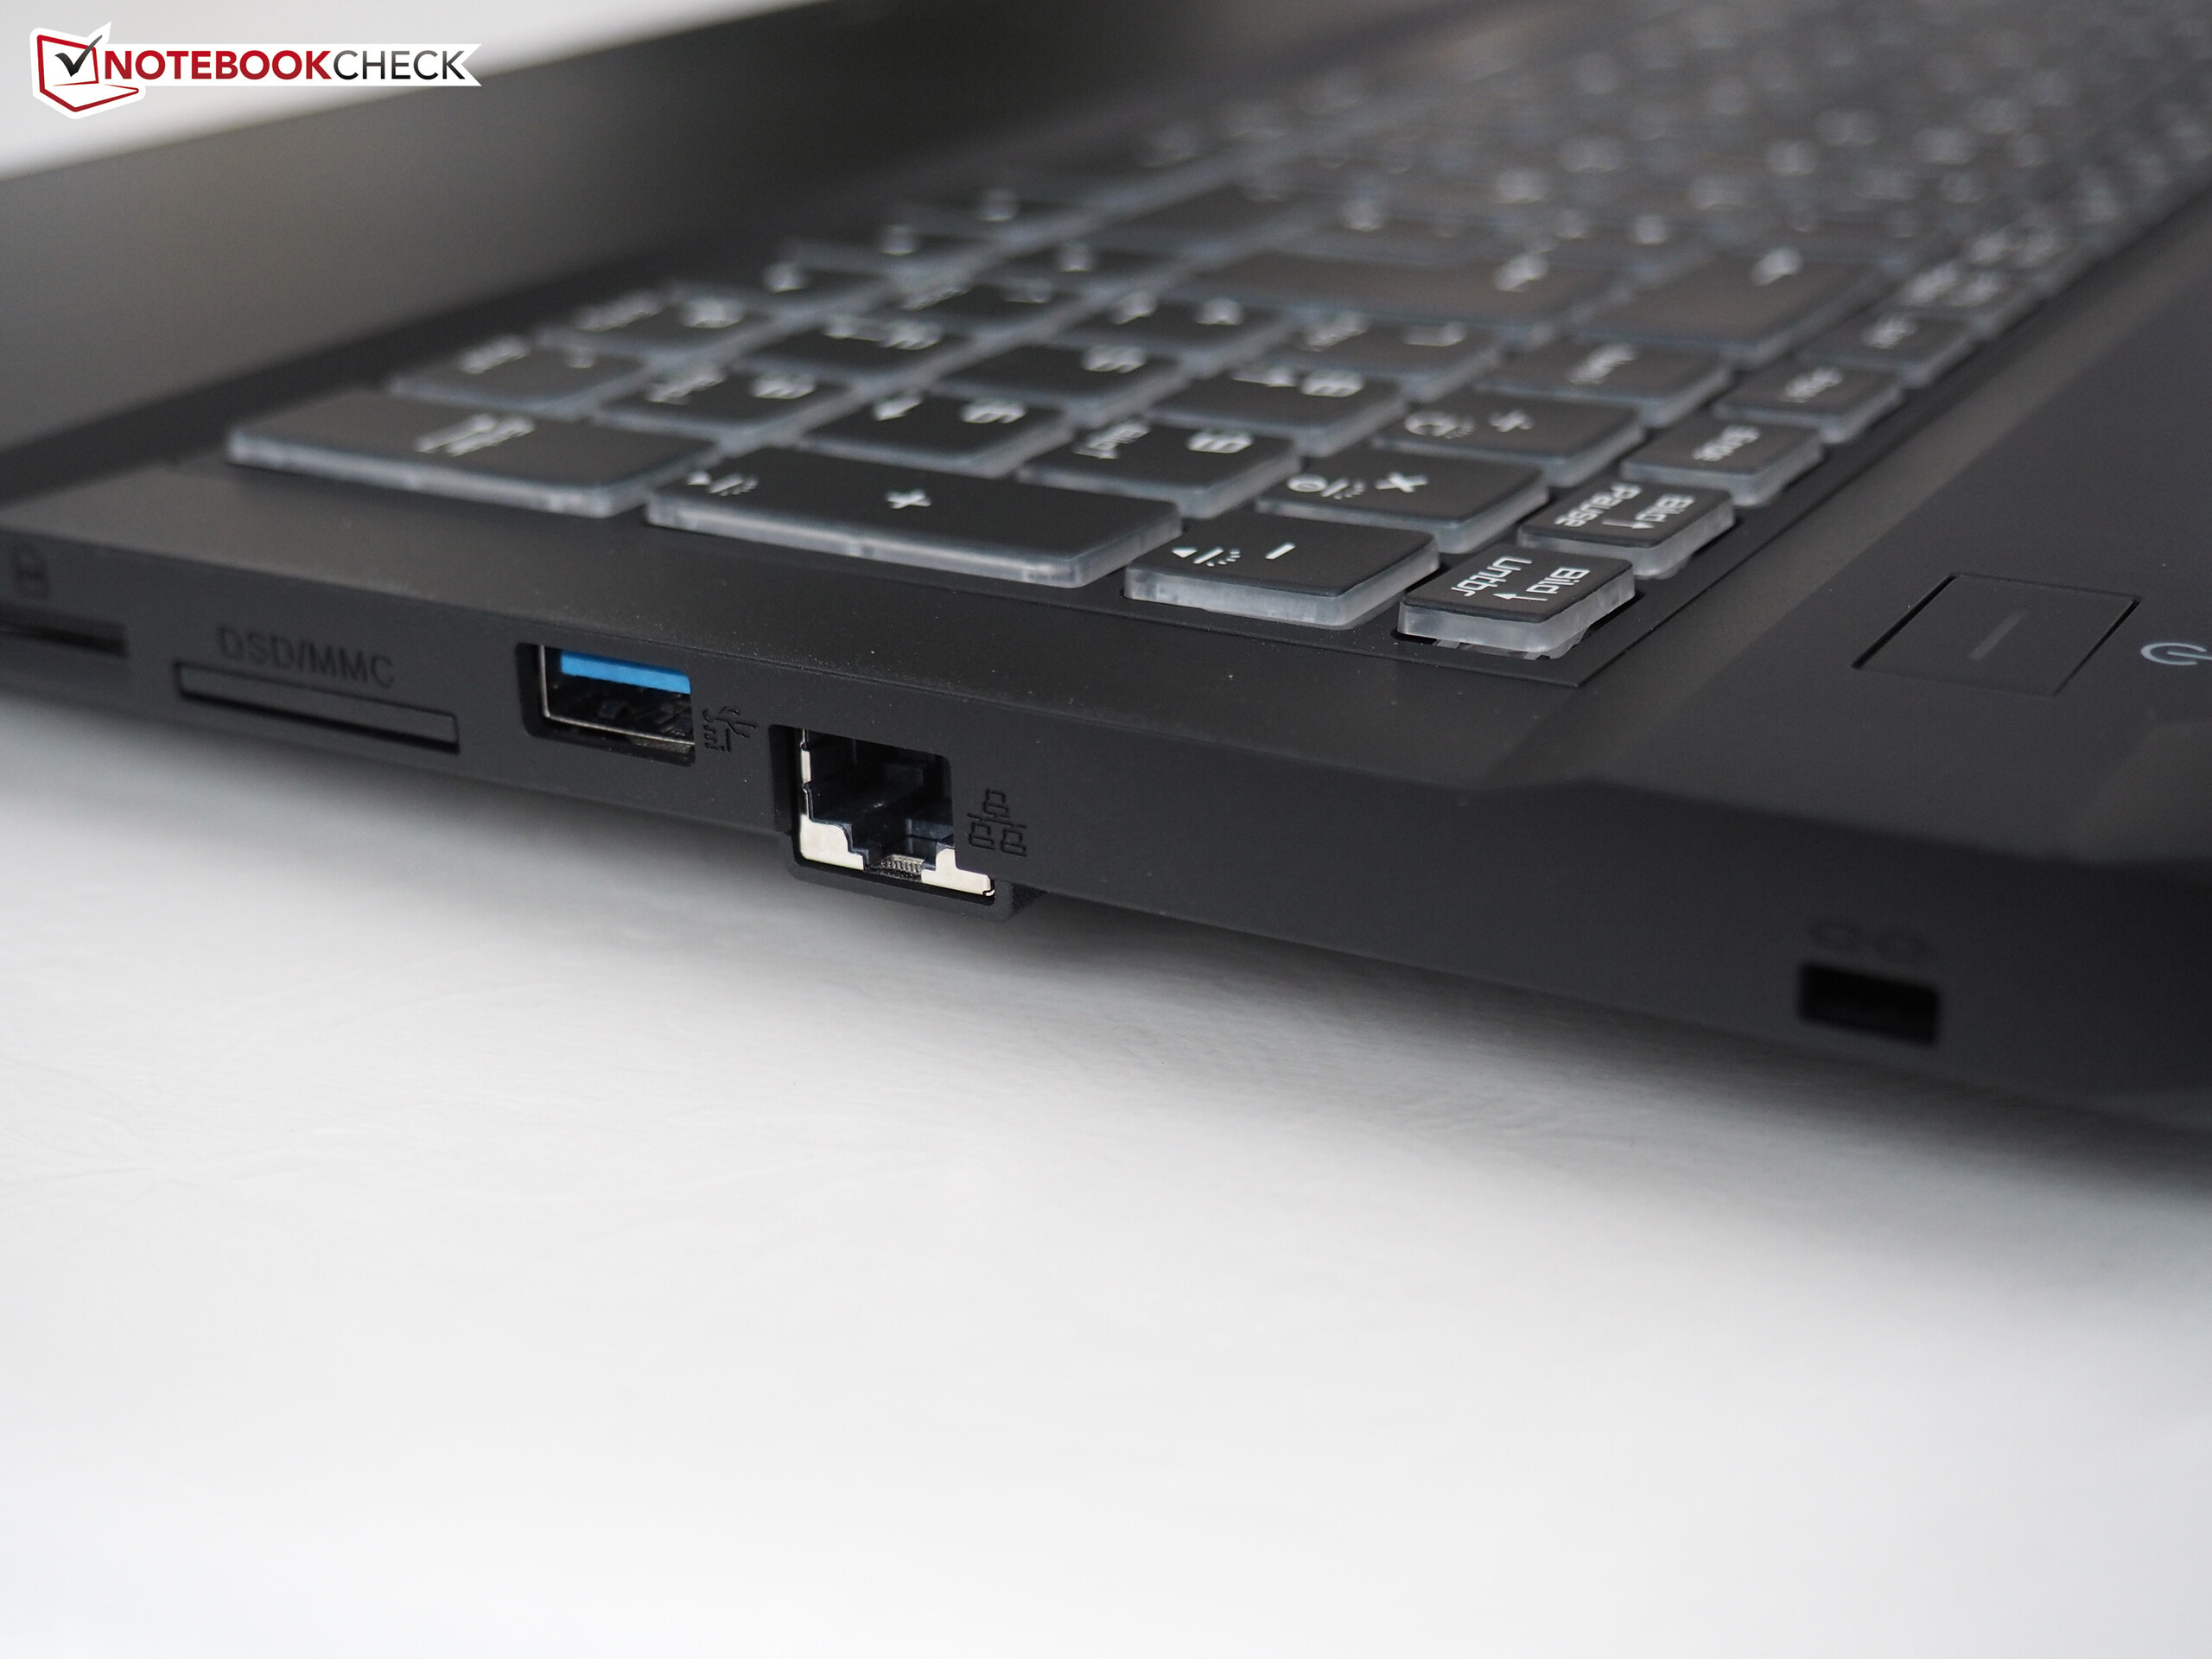
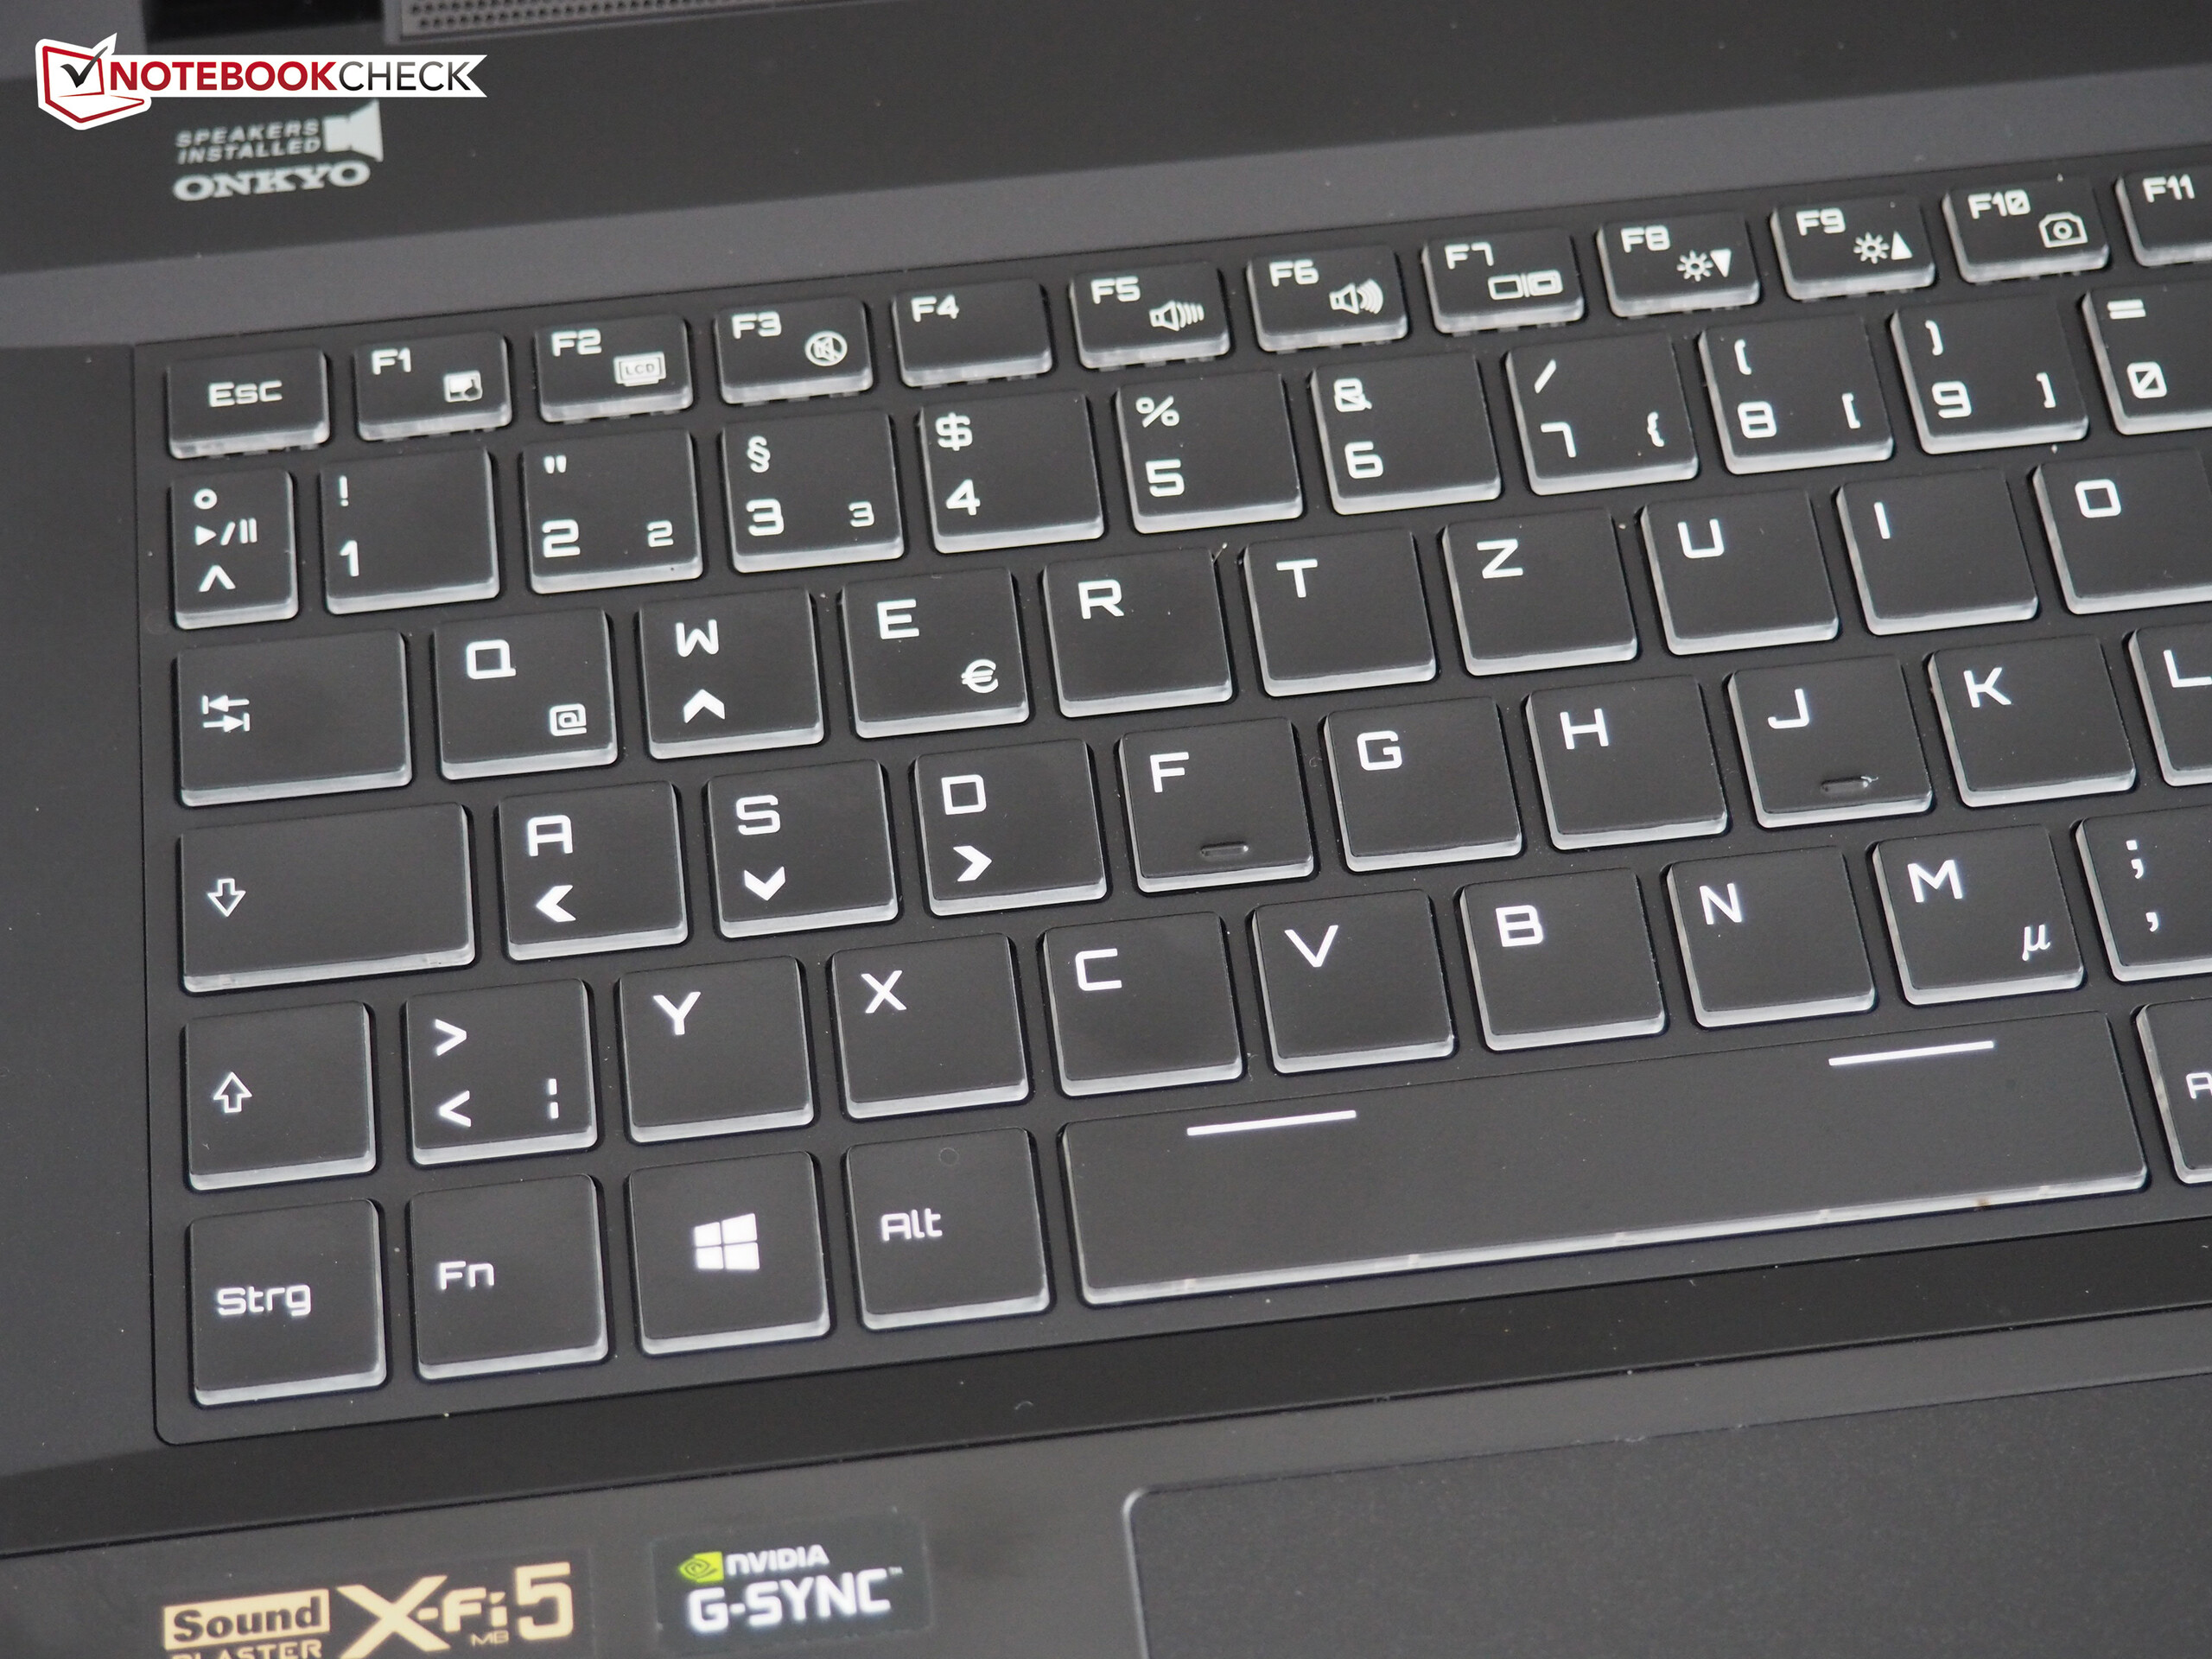
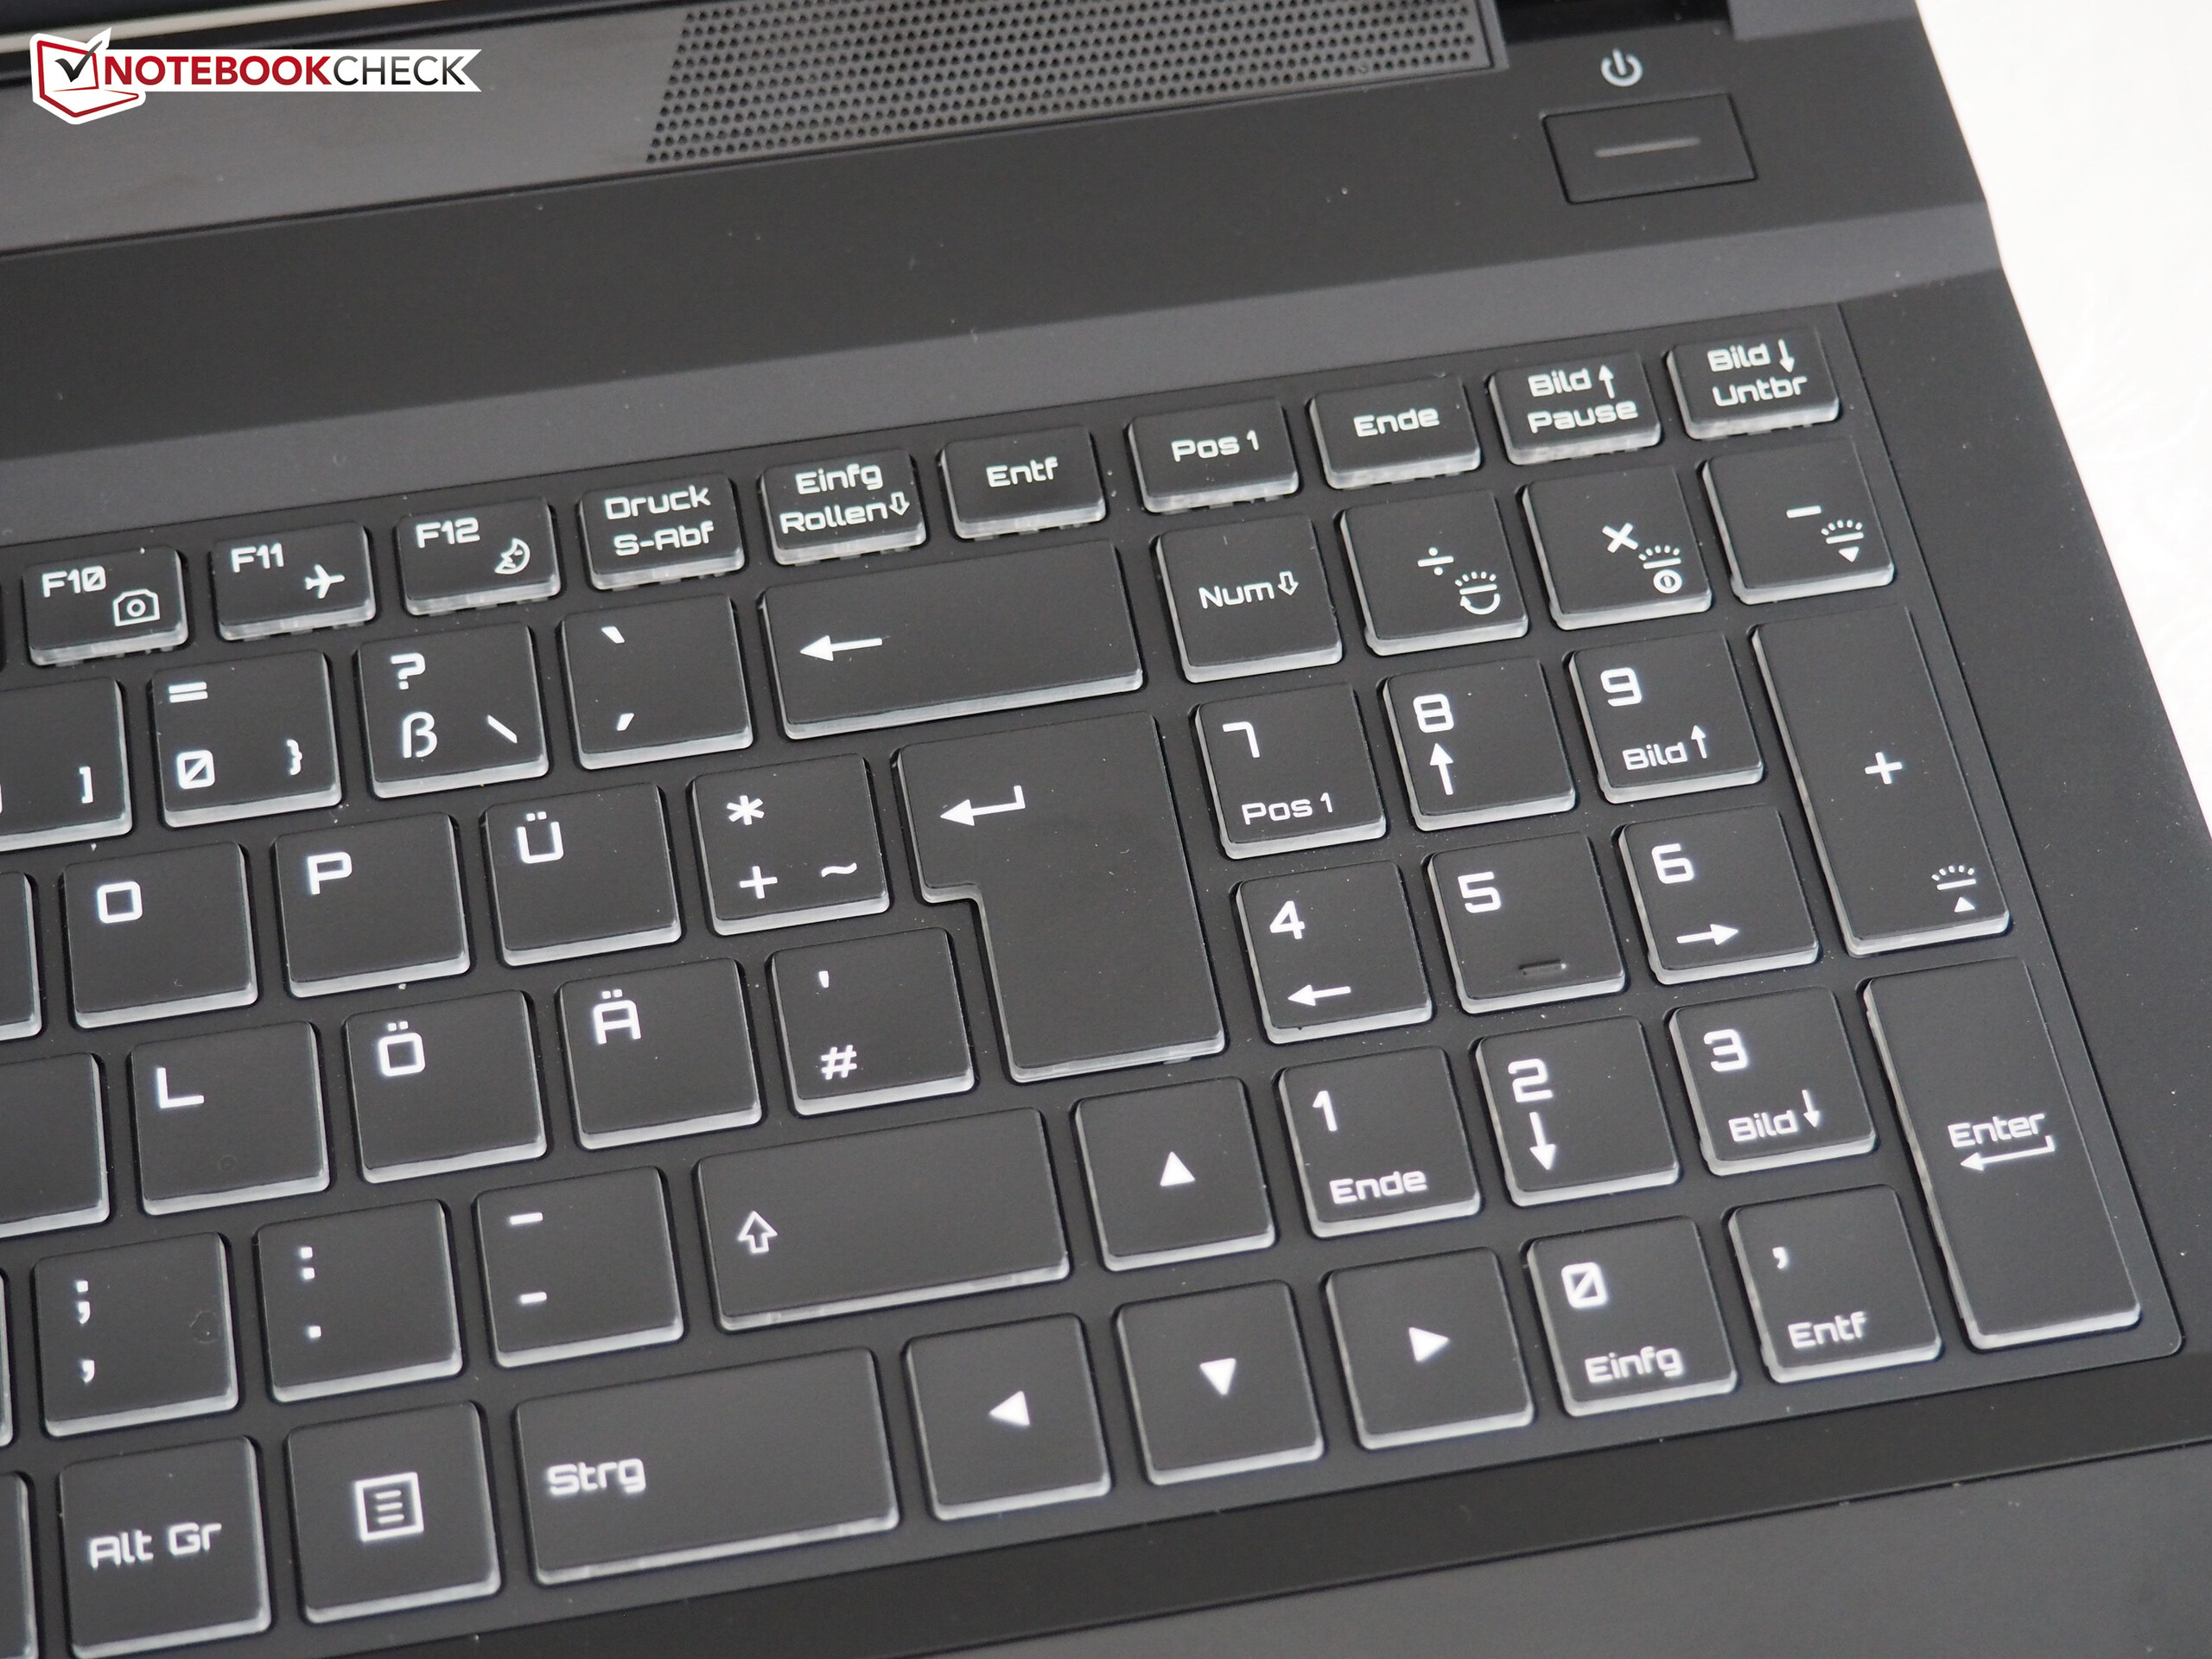
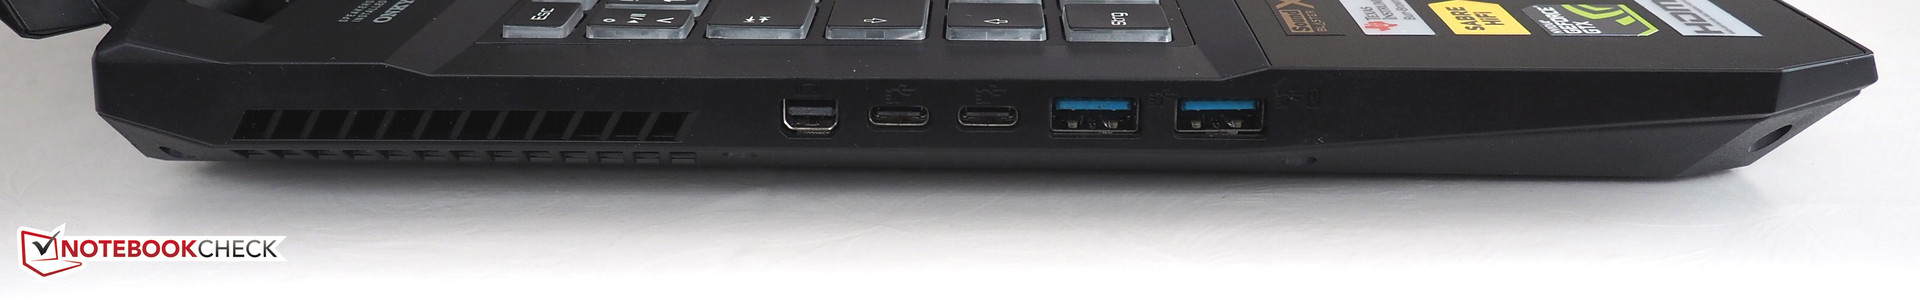
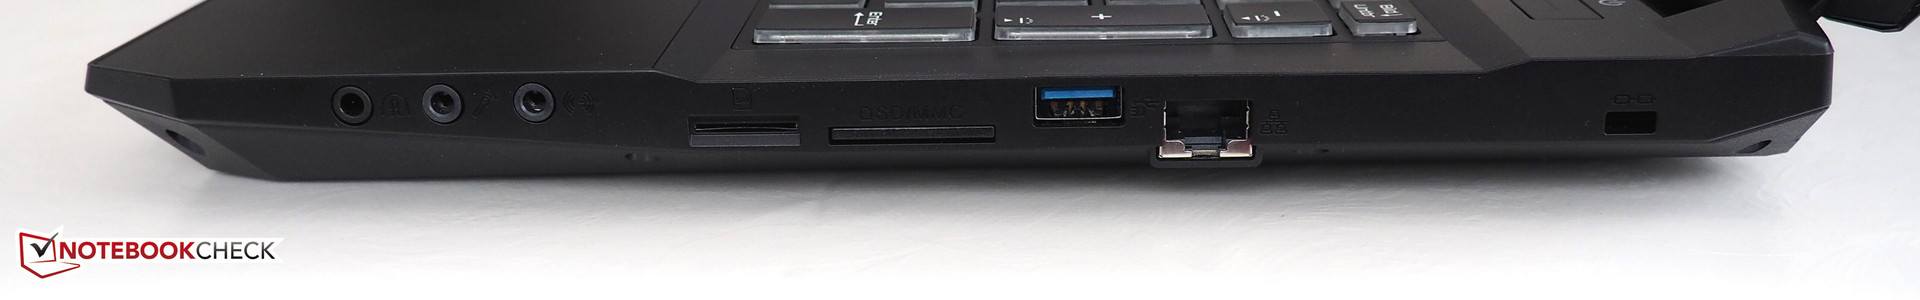
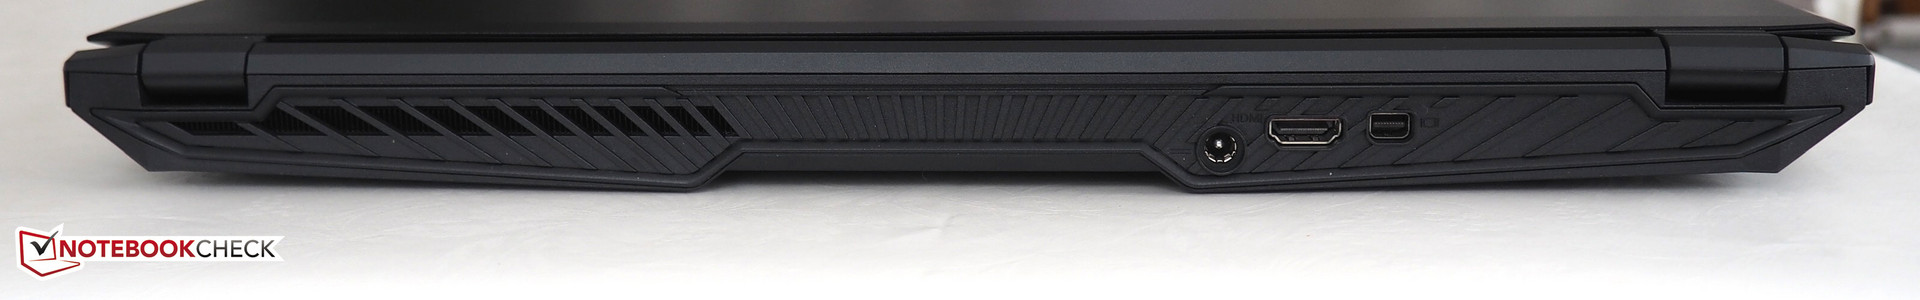
外壳设计非常简洁,构造精良,拥有相对纤薄的轮廓。您可以扩展/升级组件。良好的输入设备和众多端口是其他的亮点。然而,不幸的是,USB 3.1 Gen.2插口仍然不支持Thunderbolt 3。
注:本文是基于完整评测的缩减版本,阅读完整的英文评测,请点击这里。
Schenker XMG P507 PRO
- 01/19/2017 v6 (old)
Florian Glaser
Price comparison