我们的顶级英特尔NUC 11替代品。蓓玲珑GTI 11迷你电脑评测
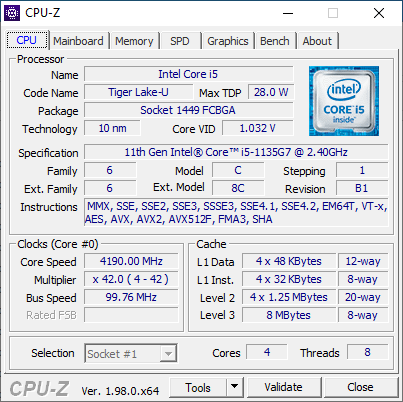
Beelink有整个系列的迷你电脑,目标是对英特尔NUC体验感兴趣的买家,而不必支付英特尔NUC的高价。最新的型号是GTI 11,它使用最新的第11代Tiger Lake-U Core i5-1135G7处理器,集成Iris Xe 80 EUs图形。这一细节值得注意,因为大多数其他Beelink迷你电脑通常依赖较旧或较慢的CPU,以便将成本保持在更实惠的水平。因此,GTI 11是Beelink当前产品系列中最快和最贵的迷你电脑之一。
GTI 11的替代品包括其他采用第11代英特尔酷睿U系列CPU的迷你电脑,如 英特尔NUC11幻影峡谷, Beelink GMK NucBoc 2或Zotac ZBox CI665 Nano。
更多Beelink的评论。
Potential Competitors in Comparison
Rating | Date | Model | Weight | Height | Size | Resolution | Price |
|---|---|---|---|---|---|---|---|
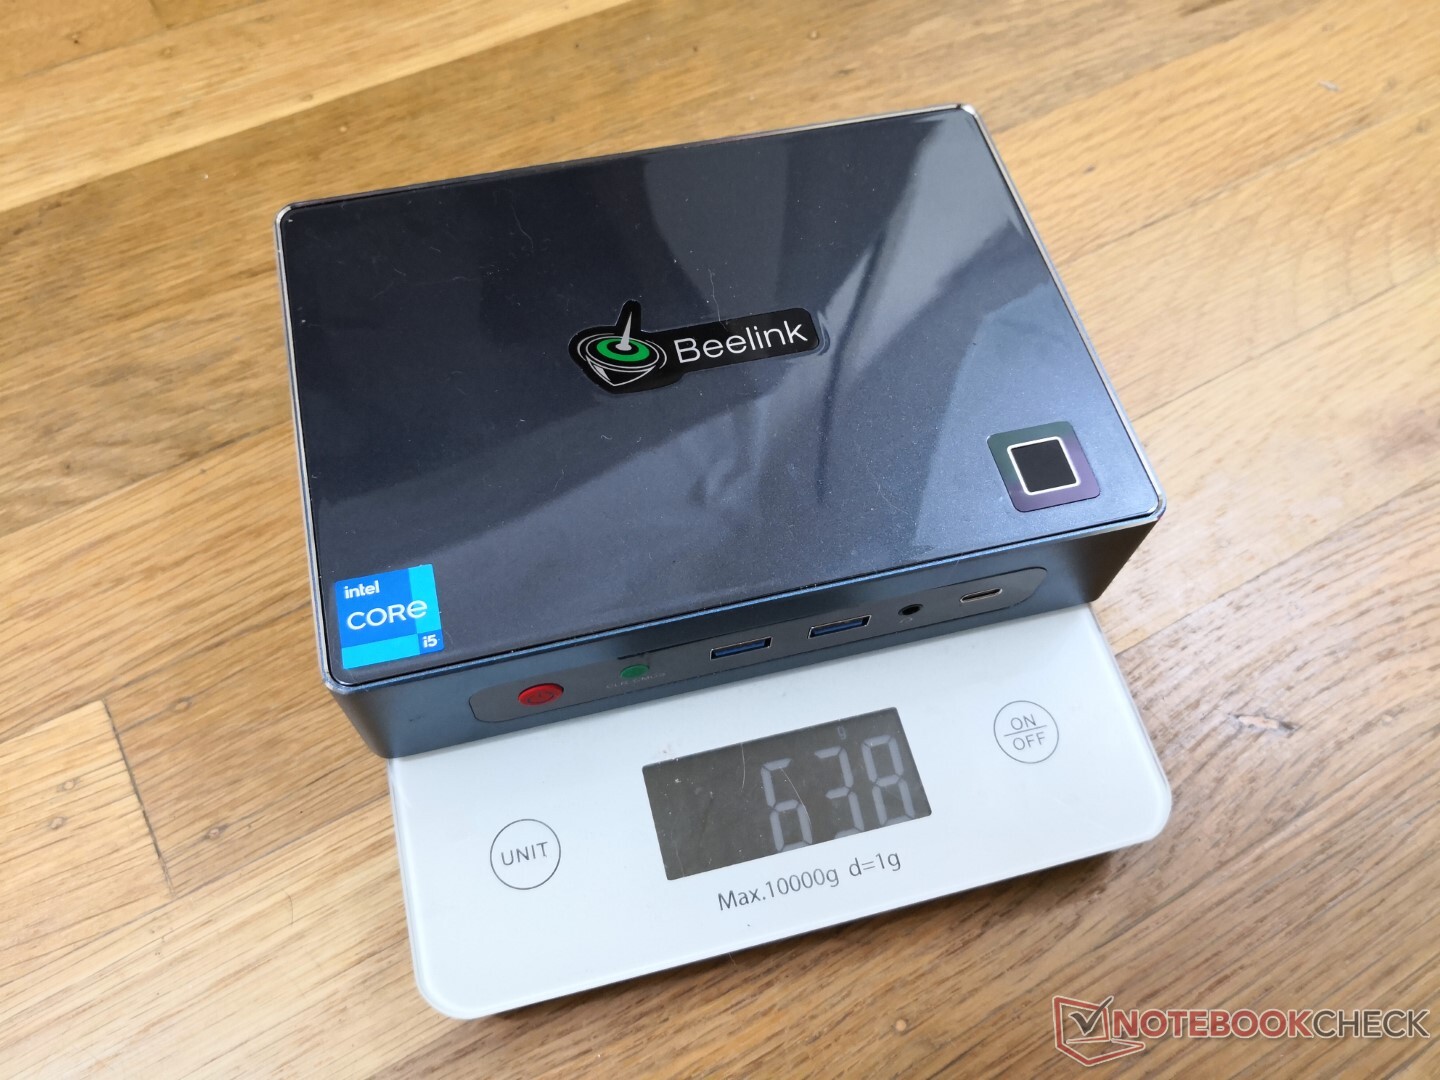
v (old) | 12 / 2021 | Beelink GTI 11 i5-1135G7, Iris Xe G7 80EUs | 638 g | 39 mm | x | ||
v (old) | 11 / 2021 | Beelink SER3 R7 3750H, Vega 10 | 492 g | 40 mm | x | ||
v (old) | Intel NUC11TNKi5 i5-1135G7, Iris Xe G7 80EUs | 504 g | 37 mm | x | |||
v (old) | Intel NUC10i7FNH i7-10710U, UHD Graphics 620 | 697 g | 51 mm | 0.00" | 0x0 | ||
v (old) | GMK NucBox 2 i5-8259U, Iris Plus Graphics 655 | 430 g | 50 mm | x | |||
v (old) | Intel Hades Canyon NUC8i7HVK i7-8809G, Vega M GH | 1.3 kg | 39 mm | x |
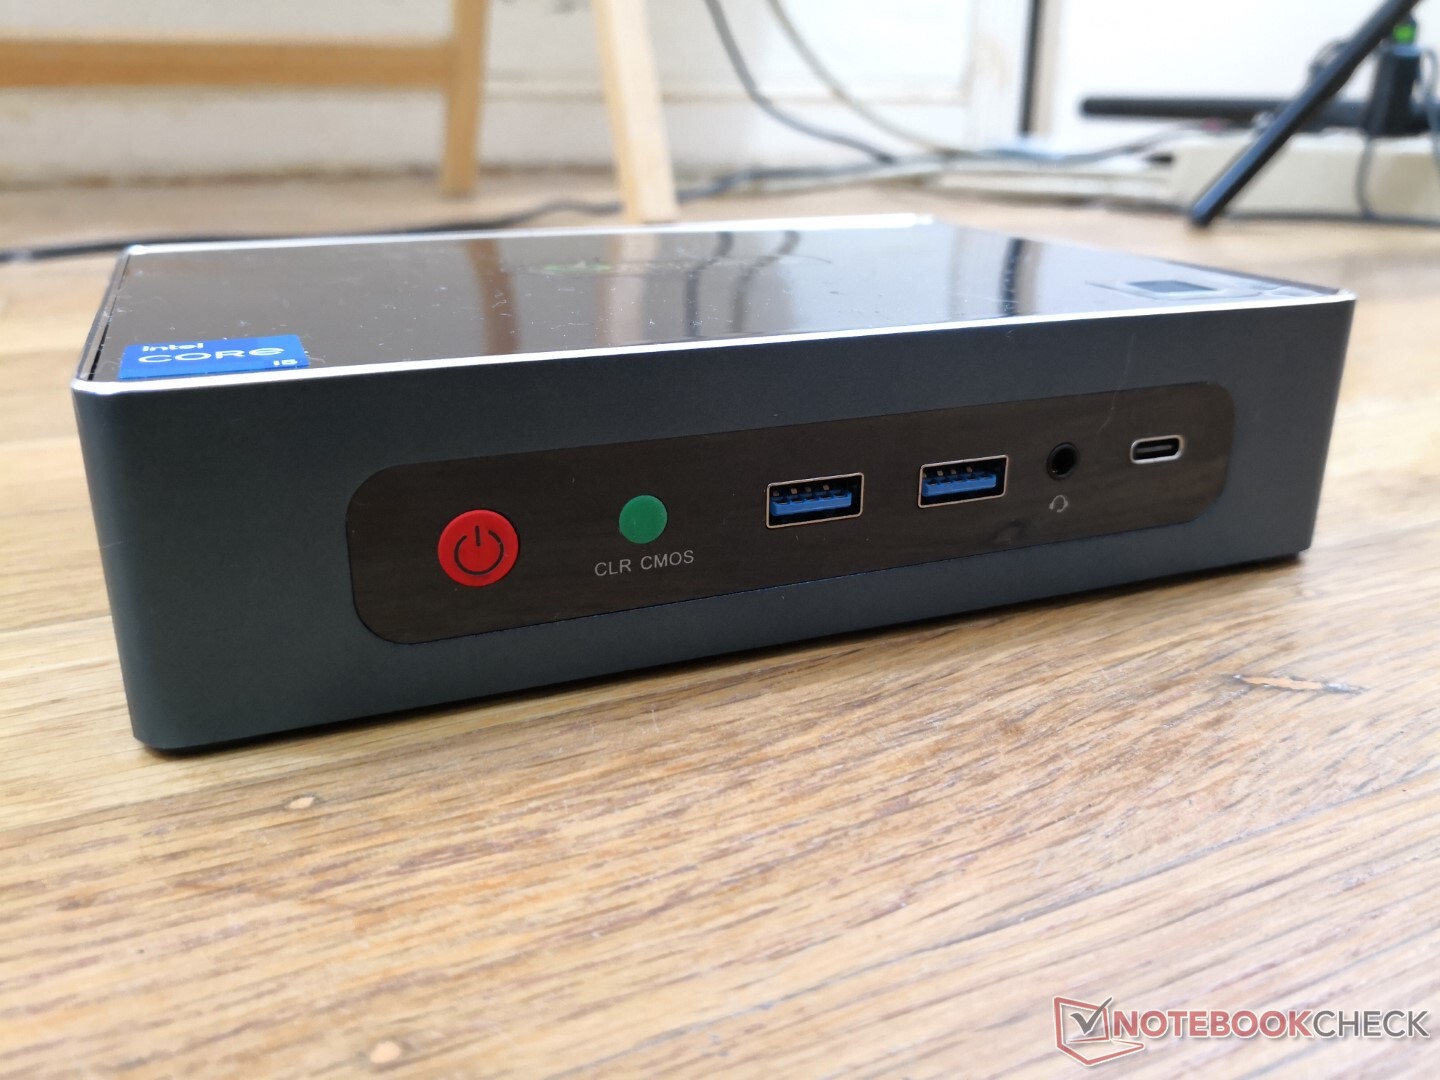
案例
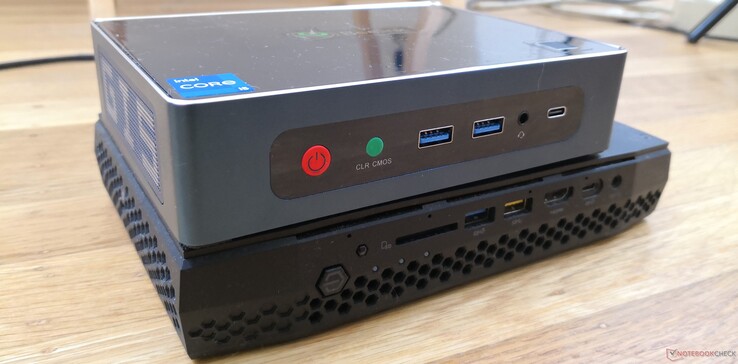
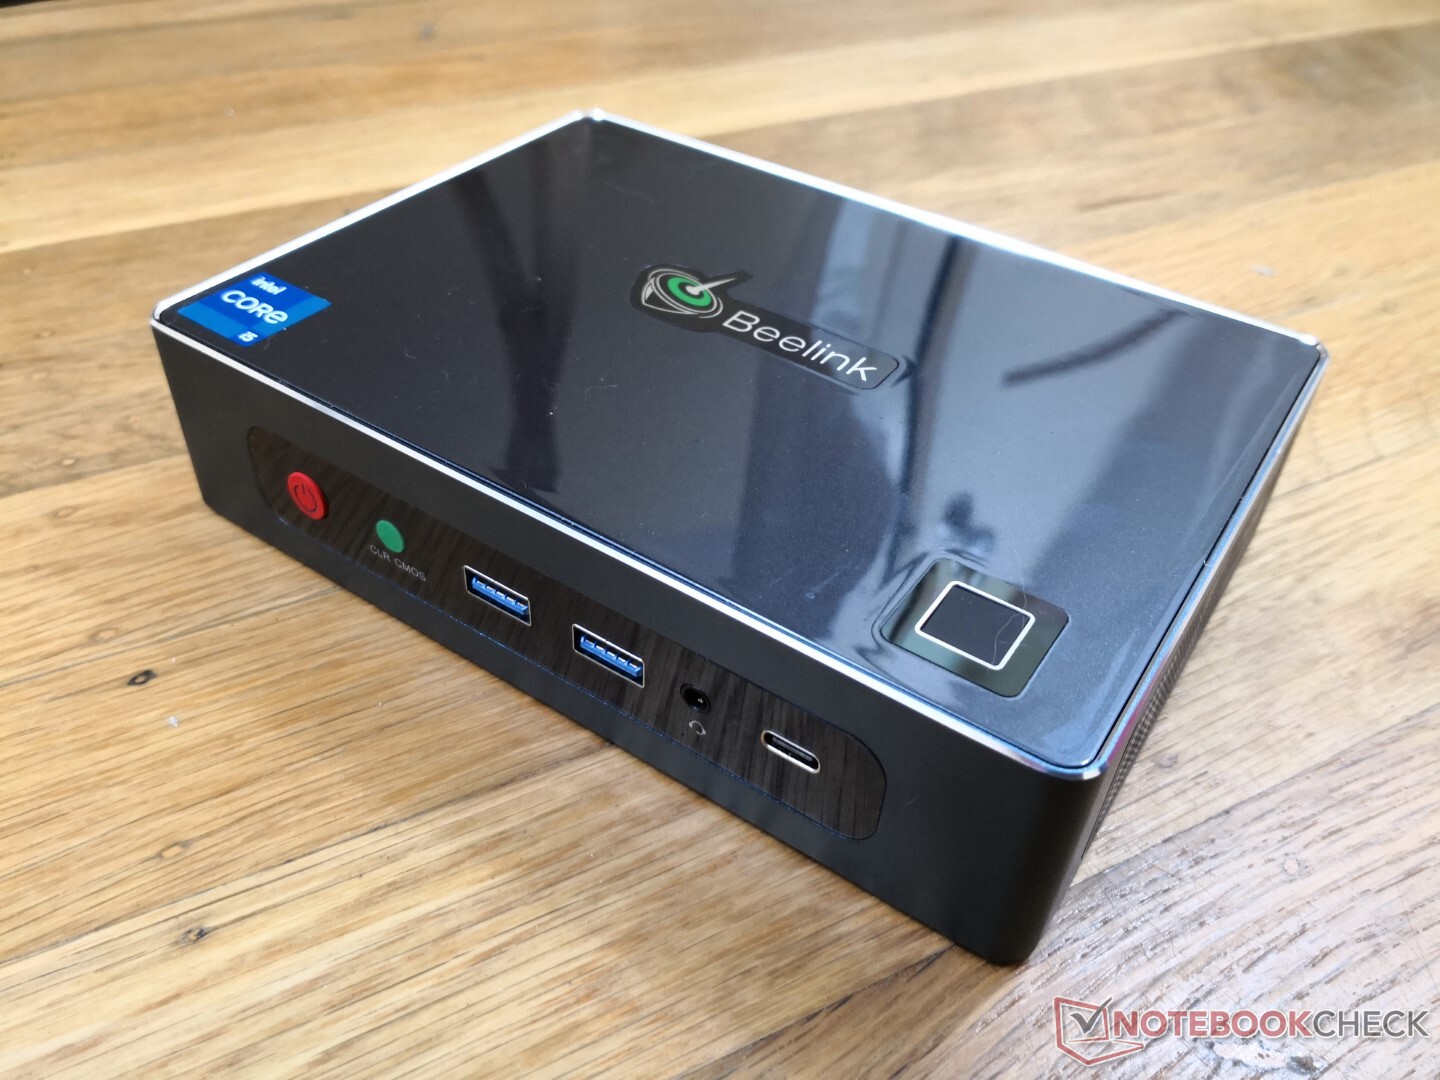
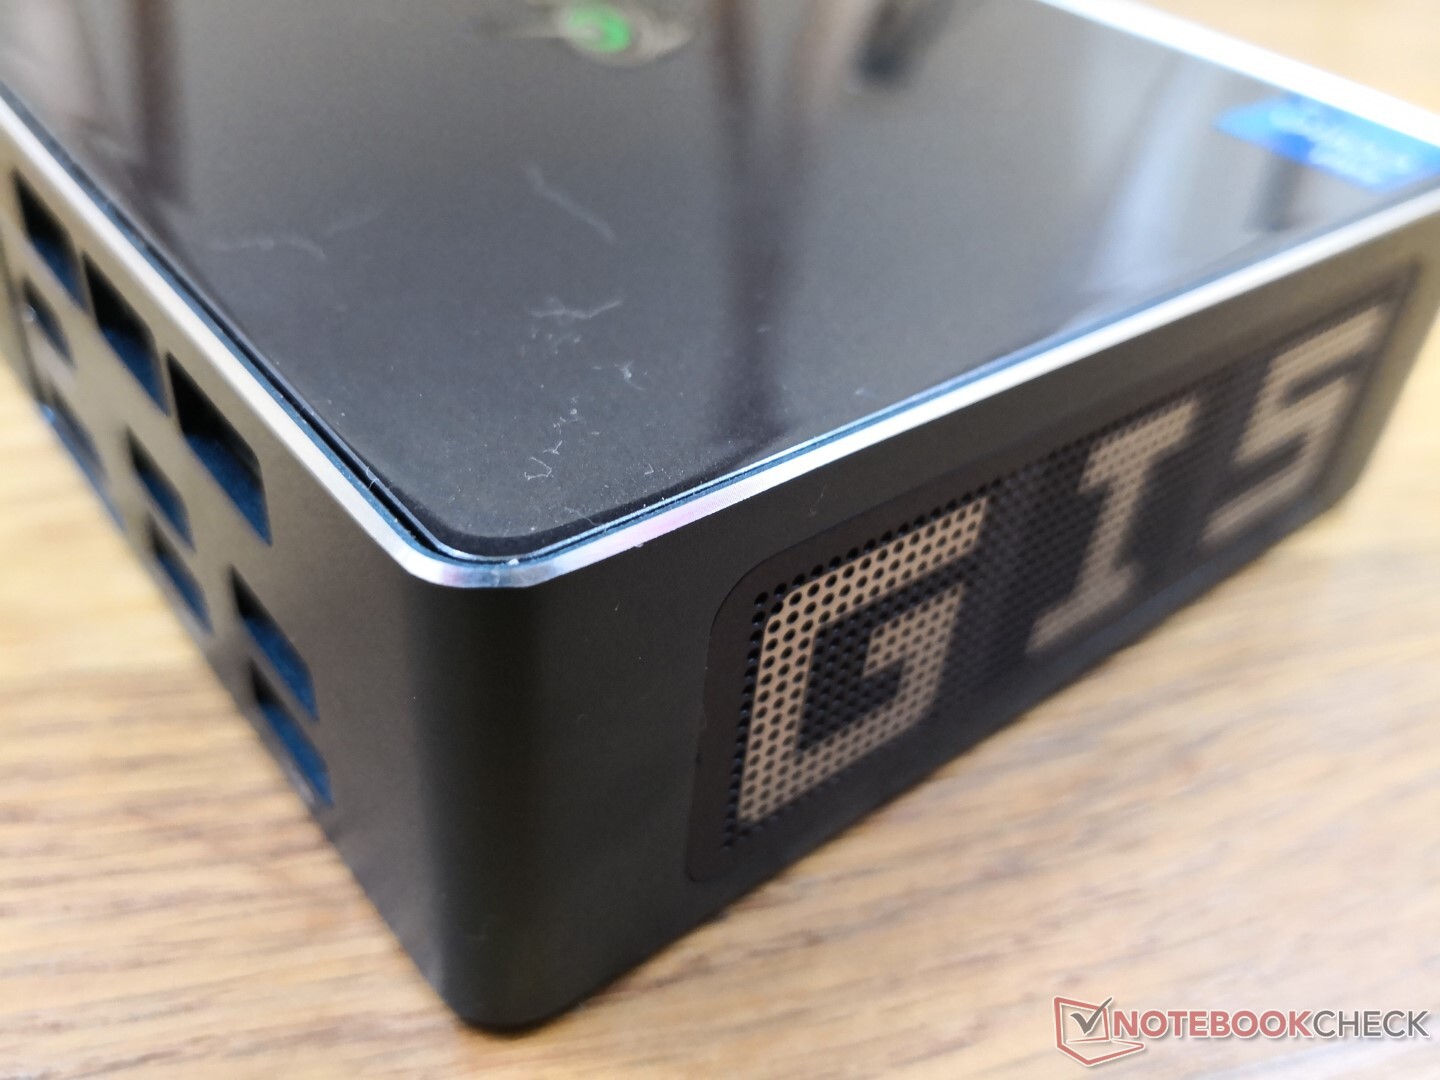
骨架由更薄的材料和更少的金属制成,比英特尔NUC可能是为了降低成本和减轻重量。建造质量仍然很好,没有弯曲或明显的弱点。然而,我们并不特别喜欢光亮的塑料顶部,因为它很快就会吸引指纹和划痕。
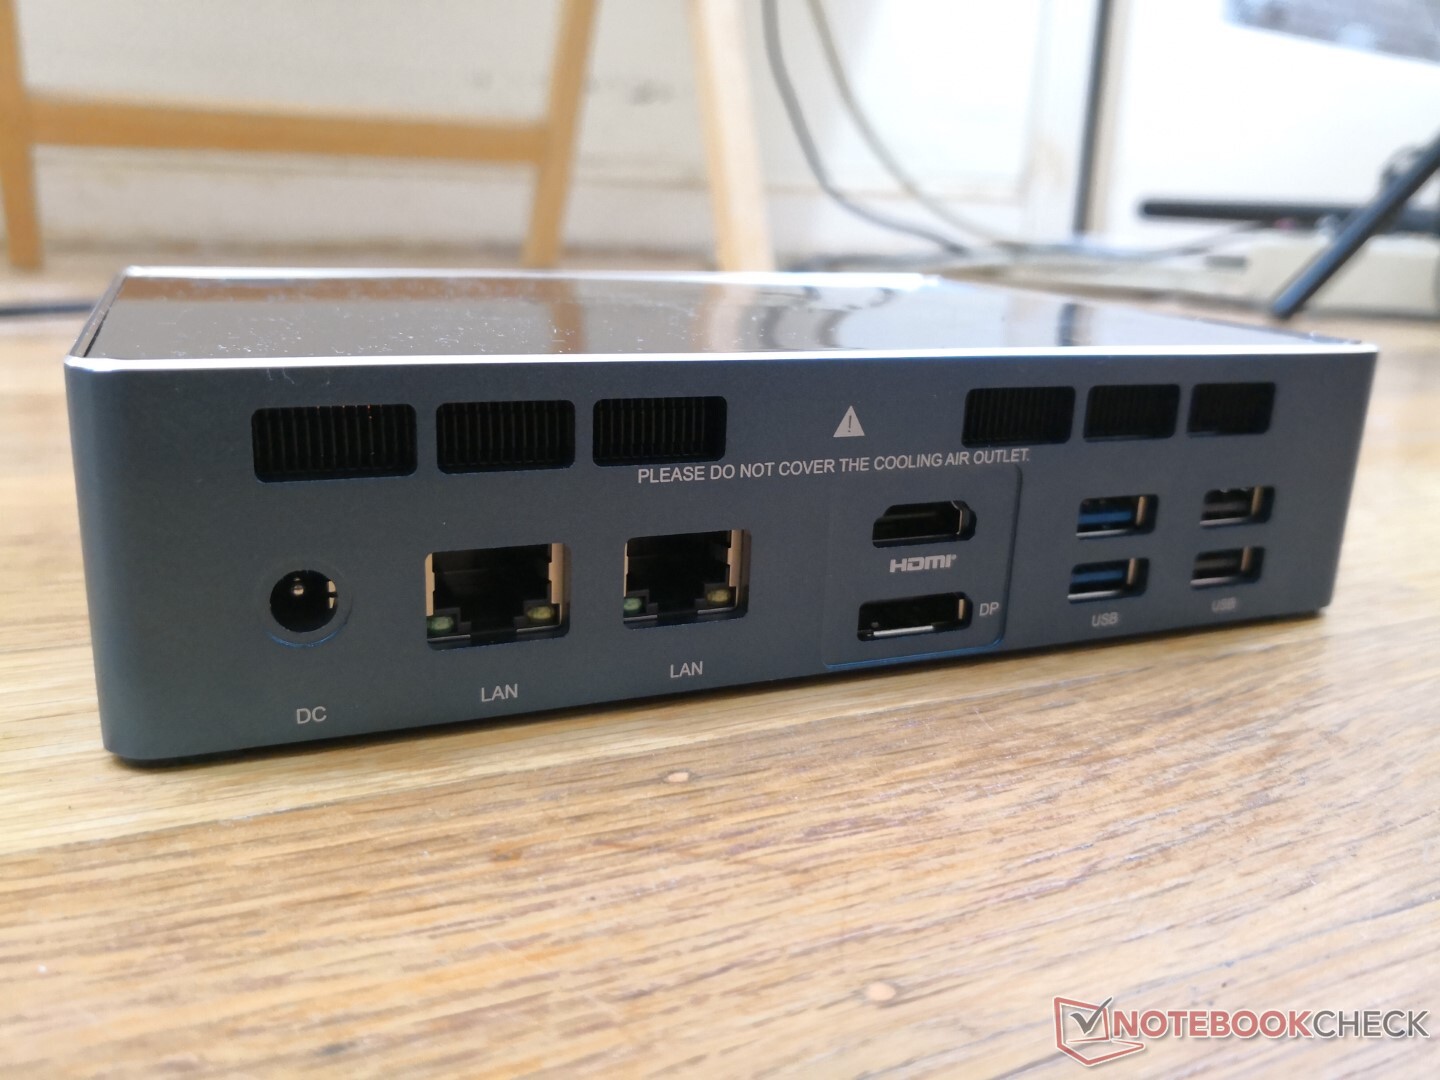
连接性
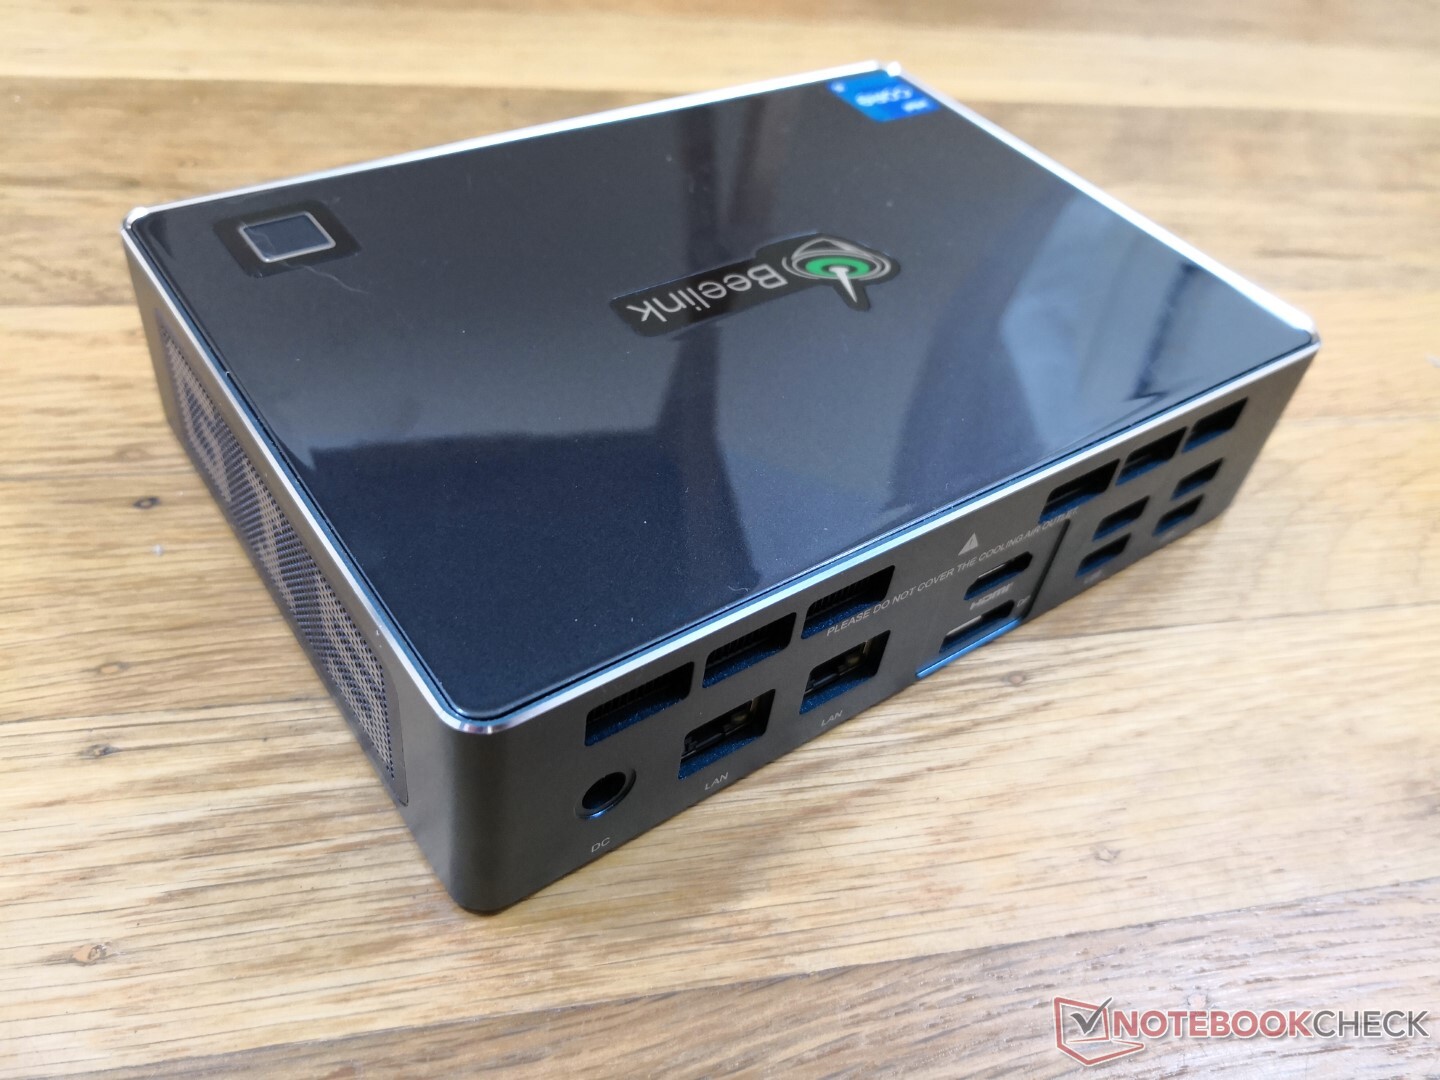
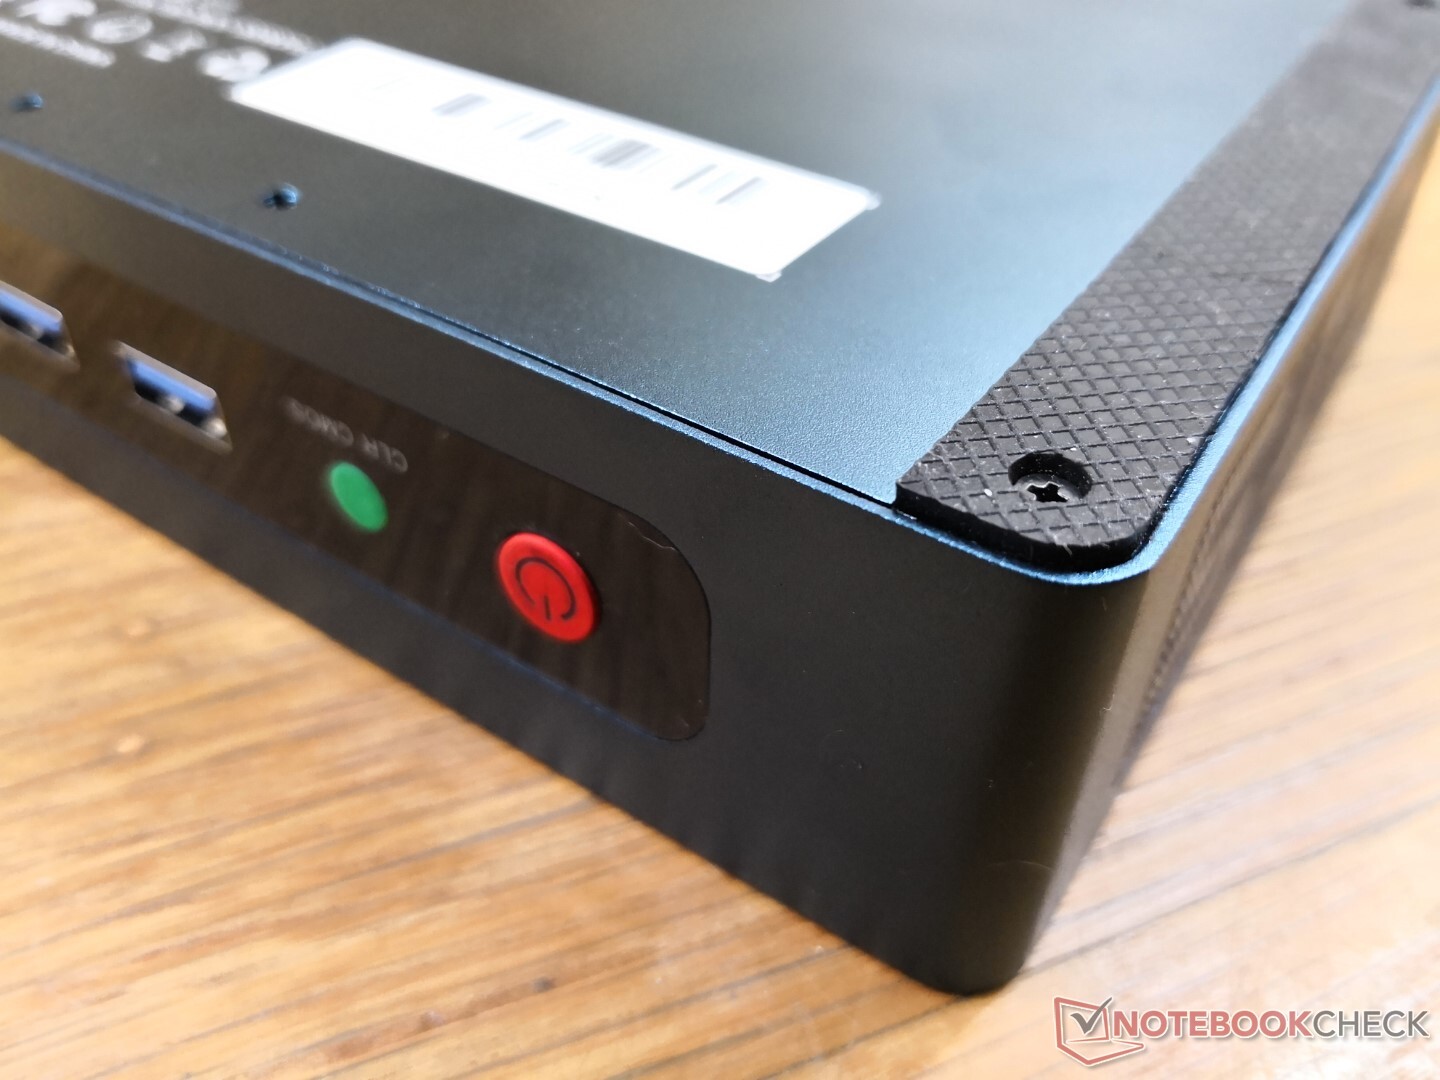
有很多端口可供选择,包括多个RJ-45端口,多个HDMI端口和六个USB-A端口。USB-C端口也支持Thunderbolt 4设备,尽管制造商并没有宣传它。Thunderbolt控制中心已预装,其DxDiag文件也确认支持Thunderbolt。
与英特尔NUC11TNKi5 Pro相比,单一的USB-C端口会让人感觉到局限性,也没有迷你显示端口或Kensington锁。
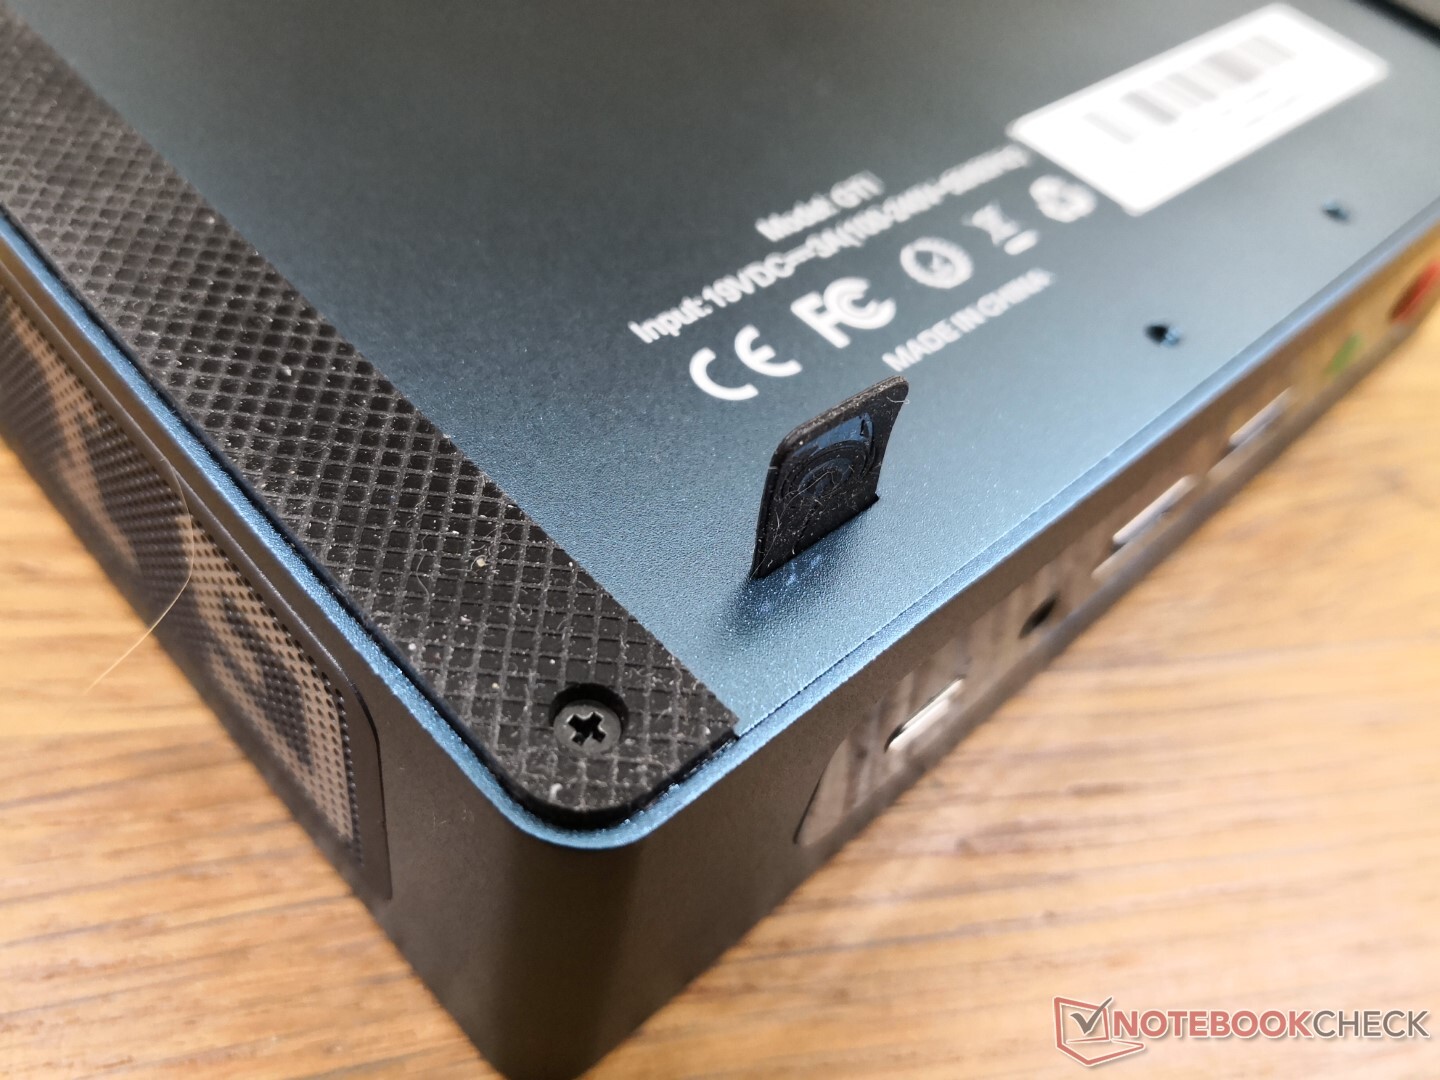
特别值得注意的是,Beelink可以用USB-C供电,而不是用专有的AC适配器。我们用戴尔XPS 15 9500的130W USB-C适配器进行了测试,它在我们的Beelink设备上没有问题。
沟通
内置有线和无线通信模块,将网络测试数据与竞争对手进行比较,可用的替代解决方案(5G/LTE)?,不规则(无线电接收)?
| Networking | |
| iperf3 transmit AX12 | |
| Intel NUC11TNKi5 | |
| Beelink GTI 11 | |
| GMK NucBox 2 | |
| Intel Hades Canyon NUC8i7HVK | |
| Beelink SER3 | |
| iperf3 receive AX12 | |
| Intel NUC11TNKi5 | |
| Beelink GTI 11 | |
| Beelink SER3 | |
| GMK NucBox 2 | |
| Intel Hades Canyon NUC8i7HVK | |
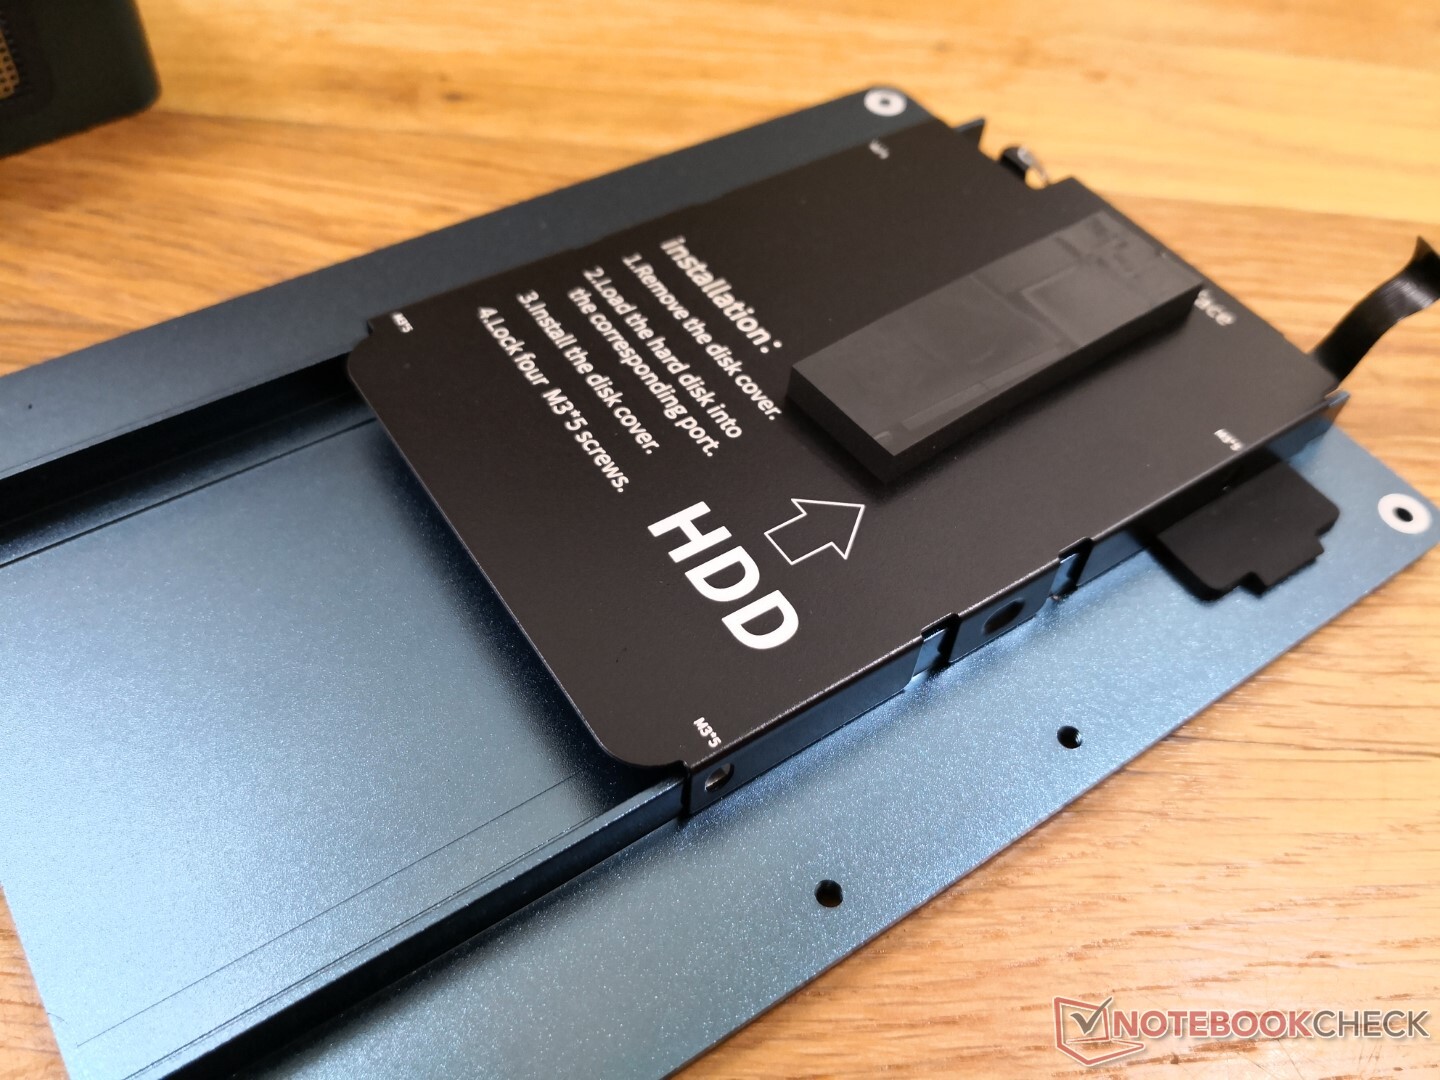
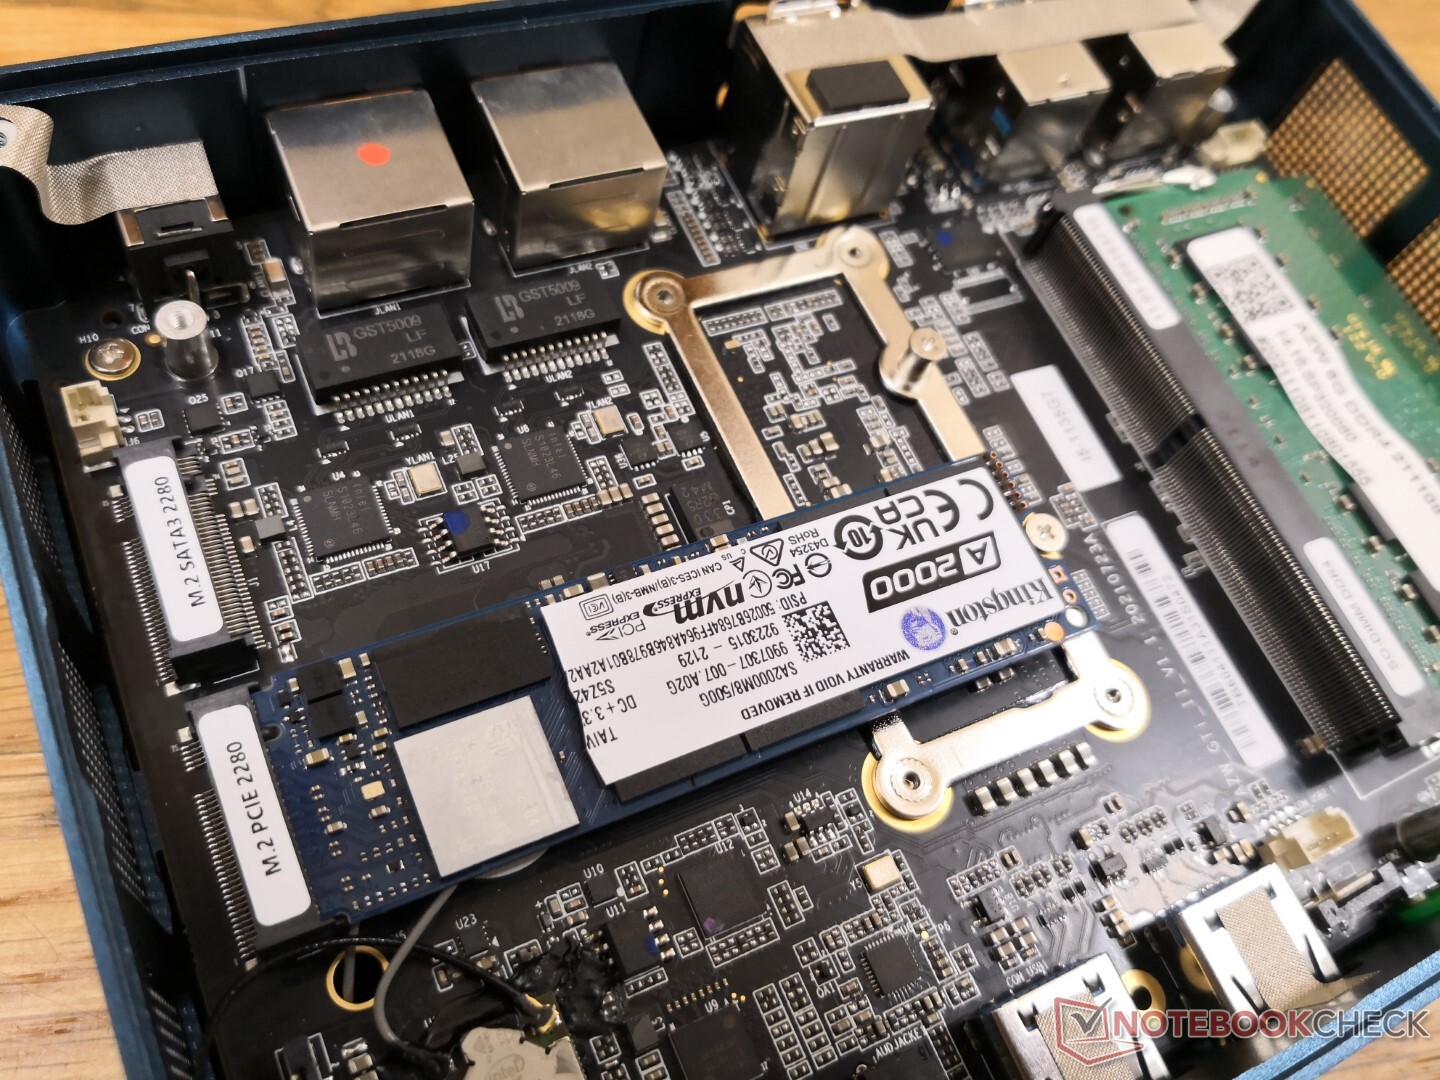
维护
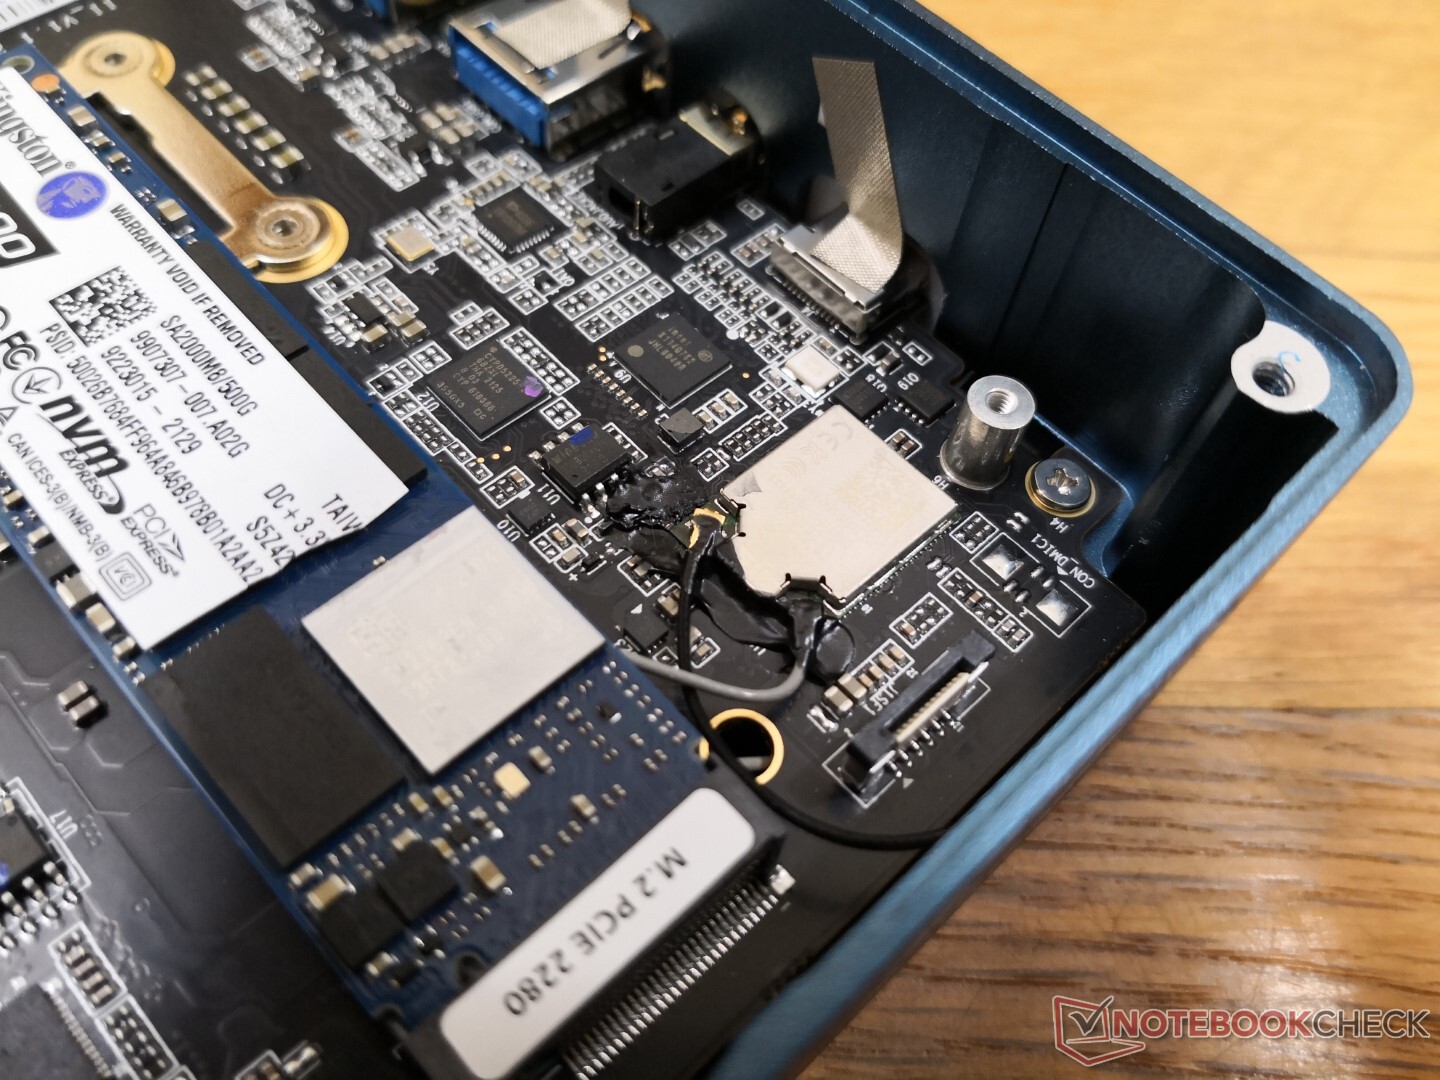
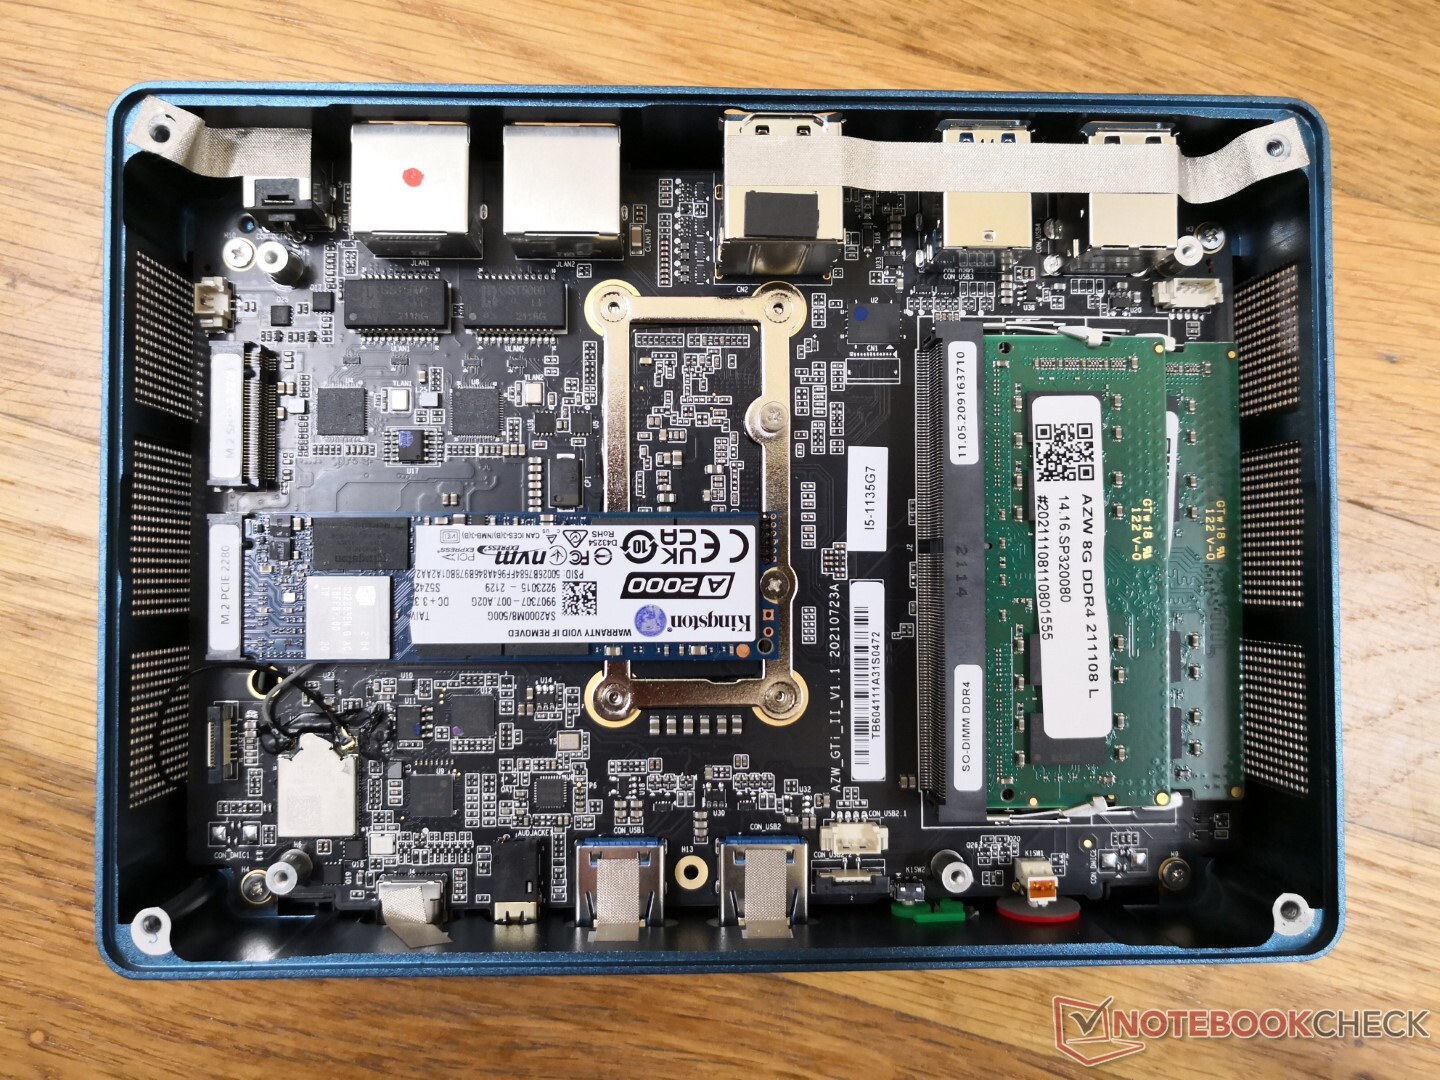
底部面板只需用一把飞利浦螺丝刀就可以拆下来。用户必须小心地拆下连接底板和主板的丝带。一旦卸下底板,就可以直接进入两个SODIMM插槽,两个M.2 2280插槽,以及2.5英寸SATA III插槽。
配件和保修
额外的东西包括两条HDMI线,额外的螺丝,以及一个VESA 50/100毫米的计数支架。
标准的一年有限保修适用。对一些用户来说,要求保修可能很困难,因为运输是在海外。
业绩
处理器
原始多线程CPU性能比具有相同功能的普通PC或笔记本电脑快15%至20%。 酷睿i5-1135G7CPU。即使是较早的100瓦Kaby Lake-G酷睿i7-8809GHades Canyon 迷你电脑也落后于我们的第11代酷睿i7 CPU。高端的酷睿i7-1165G7这在GTI 11上是不存在的,它可以使用户的多线程性能比我们的Core i5-1135G7高出25%。
当循环运行CineBench R15 xT时,最初的915分会迅速下降到约840分,代表性能下降了8%,这是因为涡轮增压的可持续性有限,详见下面的压力测试部分。
Cinebench R15 Multi Loop
Cinebench R23: Multi Core | Single Core
Cinebench R20: CPU (Multi Core) | CPU (Single Core)
Cinebench R15: CPU Multi 64Bit | CPU Single 64Bit
Blender: v2.79 BMW27 CPU
7-Zip 18.03: 7z b 4 | 7z b 4 -mmt1
Geekbench 5.5: Multi-Core | Single-Core
HWBOT x265 Benchmark v2.2: 4k Preset
LibreOffice : 20 Documents To PDF
R Benchmark 2.5: Overall mean
| CPU Performance rating | |
| Intel NUC11PAQi7 -1! | |
| Lenovo Yoga 6 13ALC6 -2! | |
| Intel NUC10i7FNH -3! | |
| Asus Vivobook 15 K513EQ -2! | |
| Beelink GTI 11 | |
| Lenovo Yoga 6 13 82ND0009US -2! | |
| Intel NUC11TNKi5 | |
| Intel Hades Canyon NUC8i7HVK -6! | |
| Average Intel Core i5-1135G7 | |
| Infinix INBook X1 Pro -2! | |
| Asus VivoBook S13 S333JA-DS51 | |
| GMK NucBox 2 | |
| Beelink SER3 -2! | |
| Beelink GTR35 II-G-16512D00W64PRO-1T -2! | |
| Cinebench R23 / Multi Core | |
| Lenovo Yoga 6 13ALC6 | |
| Intel NUC11PAQi7 | |
| Lenovo Yoga 6 13 82ND0009US | |
| Asus Vivobook 15 K513EQ | |
| Beelink GTI 11 | |
| Intel NUC11TNKi5 | |
| Average Intel Core i5-1135G7 (2786 - 6136, n=55) | |
| Infinix INBook X1 Pro | |
| Asus VivoBook S13 S333JA-DS51 | |
| Beelink SER3 | |
| GMK NucBox 2 | |
| Cinebench R23 / Single Core | |
| Asus Vivobook 15 K513EQ | |
| Intel NUC11TNKi5 | |
| Beelink GTI 11 | |
| Average Intel Core i5-1135G7 (1062 - 1373, n=53) | |
| Lenovo Yoga 6 13ALC6 | |
| Infinix INBook X1 Pro | |
| Lenovo Yoga 6 13 82ND0009US | |
| Asus VivoBook S13 S333JA-DS51 | |
| GMK NucBox 2 | |
| Beelink SER3 | |
| Cinebench R20 / CPU (Multi Core) | |
| Lenovo Yoga 6 13ALC6 | |
| Intel NUC11PAQi7 | |
| Lenovo Yoga 6 13 82ND0009US | |
| Intel NUC10i7FNH | |
| Asus Vivobook 15 K513EQ | |
| Beelink GTI 11 | |
| Intel Hades Canyon NUC8i7HVK | |
| Intel NUC11TNKi5 | |
| Average Intel Core i5-1135G7 (979 - 2382, n=62) | |
| Infinix INBook X1 Pro | |
| Beelink GTR35 II-G-16512D00W64PRO-1T | |
| Asus VivoBook S13 S333JA-DS51 | |
| Beelink SER3 | |
| GMK NucBox 2 | |
| Cinebench R20 / CPU (Single Core) | |
| Intel NUC11PAQi7 | |
| Asus Vivobook 15 K513EQ | |
| Beelink GTI 11 | |
| Average Intel Core i5-1135G7 (375 - 527, n=62) | |
| Intel NUC11TNKi5 | |
| Lenovo Yoga 6 13ALC6 | |
| Intel NUC10i7FNH | |
| Infinix INBook X1 Pro | |
| Lenovo Yoga 6 13 82ND0009US | |
| Intel Hades Canyon NUC8i7HVK | |
| GMK NucBox 2 | |
| Asus VivoBook S13 S333JA-DS51 | |
| Beelink SER3 | |
| Beelink GTR35 II-G-16512D00W64PRO-1T | |
| Cinebench R15 / CPU Multi 64Bit | |
| Lenovo Yoga 6 13ALC6 | |
| Intel NUC10i7FNH | |
| Lenovo Yoga 6 13 82ND0009US | |
| Intel NUC11PAQi7 | |
| Beelink GTI 11 | |
| Asus Vivobook 15 K513EQ | |
| Intel Hades Canyon NUC8i7HVK | |
| Intel NUC11TNKi5 | |
| Average Intel Core i5-1135G7 (431 - 941, n=65) | |
| Beelink SER3 | |
| Beelink GTR35 II-G-16512D00W64PRO-1T | |
| Infinix INBook X1 Pro | |
| Asus VivoBook S13 S333JA-DS51 | |
| GMK NucBox 2 | |
| Cinebench R15 / CPU Single 64Bit | |
| Intel NUC11PAQi7 | |
| Asus Vivobook 15 K513EQ | |
| Intel NUC11TNKi5 | |
| Beelink GTI 11 | |
| Average Intel Core i5-1135G7 (141.4 - 205, n=61) | |
| Intel NUC10i7FNH | |
| Lenovo Yoga 6 13ALC6 | |
| Infinix INBook X1 Pro | |
| Intel Hades Canyon NUC8i7HVK | |
| Lenovo Yoga 6 13 82ND0009US | |
| GMK NucBox 2 | |
| Beelink GTR35 II-G-16512D00W64PRO-1T | |
| Beelink SER3 | |
| Asus VivoBook S13 S333JA-DS51 | |
| Blender / v2.79 BMW27 CPU | |
| GMK NucBox 2 | |
| Asus VivoBook S13 S333JA-DS51 | |
| Infinix INBook X1 Pro | |
| Beelink SER3 | |
| Beelink GTR35 II-G-16512D00W64PRO-1T | |
| Average Intel Core i5-1135G7 (499 - 1044, n=60) | |
| Intel NUC11TNKi5 | |
| Beelink GTI 11 | |
| Asus Vivobook 15 K513EQ | |
| Intel Hades Canyon NUC8i7HVK | |
| Lenovo Yoga 6 13 82ND0009US | |
| Intel NUC10i7FNH | |
| Intel NUC11PAQi7 | |
| Lenovo Yoga 6 13ALC6 | |
| 7-Zip 18.03 / 7z b 4 | |
| Lenovo Yoga 6 13ALC6 | |
| Lenovo Yoga 6 13 82ND0009US | |
| Intel NUC10i7FNH | |
| Intel NUC11PAQi7 | |
| Asus Vivobook 15 K513EQ | |
| Beelink GTI 11 | |
| Intel NUC11TNKi5 | |
| Average Intel Core i5-1135G7 (14745 - 24873, n=62) | |
| Infinix INBook X1 Pro | |
| Intel Hades Canyon NUC8i7HVK | |
| GMK NucBox 2 | |
| Asus VivoBook S13 S333JA-DS51 | |
| Beelink SER3 | |
| Beelink GTR35 II-G-16512D00W64PRO-1T | |
| 7-Zip 18.03 / 7z b 4 -mmt1 | |
| Intel NUC11PAQi7 | |
| Asus Vivobook 15 K513EQ | |
| Beelink GTI 11 | |
| Intel NUC11TNKi5 | |
| Intel NUC10i7FNH | |
| Average Intel Core i5-1135G7 (3924 - 4921, n=62) | |
| Lenovo Yoga 6 13ALC6 | |
| Infinix INBook X1 Pro | |
| Lenovo Yoga 6 13 82ND0009US | |
| Intel Hades Canyon NUC8i7HVK | |
| GMK NucBox 2 | |
| Beelink SER3 | |
| Asus VivoBook S13 S333JA-DS51 | |
| Beelink GTR35 II-G-16512D00W64PRO-1T | |
| Geekbench 5.5 / Multi-Core | |
| Intel NUC10i7FNH | |
| Beelink GTI 11 | |
| Intel NUC11PAQi7 | |
| Average Intel Core i5-1135G7 (3475 - 5472, n=58) | |
| Intel NUC11TNKi5 | |
| Asus VivoBook S13 S333JA-DS51 | |
| GMK NucBox 2 | |
| Beelink GTR35 II-G-16512D00W64PRO-1T | |
| Geekbench 5.5 / Single-Core | |
| Intel NUC11PAQi7 | |
| Beelink GTI 11 | |
| Intel NUC11TNKi5 | |
| Average Intel Core i5-1135G7 (1147 - 1428, n=58) | |
| Intel NUC10i7FNH | |
| Asus VivoBook S13 S333JA-DS51 | |
| GMK NucBox 2 | |
| Beelink GTR35 II-G-16512D00W64PRO-1T | |
| HWBOT x265 Benchmark v2.2 / 4k Preset | |
| Lenovo Yoga 6 13ALC6 | |
| Intel NUC11PAQi7 | |
| Intel NUC10i7FNH | |
| Lenovo Yoga 6 13 82ND0009US | |
| Asus Vivobook 15 K513EQ | |
| Intel Hades Canyon NUC8i7HVK | |
| Beelink GTI 11 | |
| Intel NUC11TNKi5 | |
| Average Intel Core i5-1135G7 (3.57 - 7.6, n=57) | |
| Infinix INBook X1 Pro | |
| Asus VivoBook S13 S333JA-DS51 | |
| GMK NucBox 2 | |
| Beelink SER3 | |
| Beelink GTR35 II-G-16512D00W64PRO-1T | |
| LibreOffice / 20 Documents To PDF | |
| Beelink SER3 | |
| Beelink GTR35 II-G-16512D00W64PRO-1T | |
| Lenovo Yoga 6 13 82ND0009US | |
| GMK NucBox 2 | |
| Lenovo Yoga 6 13ALC6 | |
| Asus VivoBook S13 S333JA-DS51 | |
| Infinix INBook X1 Pro | |
| Beelink GTI 11 | |
| Average Intel Core i5-1135G7 (44.2 - 62.9, n=60) | |
| Intel NUC11TNKi5 | |
| Asus Vivobook 15 K513EQ | |
| Intel NUC11PAQi7 | |
| R Benchmark 2.5 / Overall mean | |
| GMK NucBox 2 | |
| Asus VivoBook S13 S333JA-DS51 | |
| Beelink GTR35 II-G-16512D00W64PRO-1T | |
| Beelink SER3 | |
| Infinix INBook X1 Pro | |
| Intel NUC10i7FNH | |
| Average Intel Core i5-1135G7 (0.619 - 0.727, n=59) | |
| Lenovo Yoga 6 13 82ND0009US | |
| Beelink GTI 11 | |
| Intel NUC11TNKi5 | |
| Lenovo Yoga 6 13ALC6 | |
| Asus Vivobook 15 K513EQ | |
| Intel NUC11PAQi7 | |
Cinebench R23: Multi Core | Single Core
Cinebench R20: CPU (Multi Core) | CPU (Single Core)
Cinebench R15: CPU Multi 64Bit | CPU Single 64Bit
Blender: v2.79 BMW27 CPU
7-Zip 18.03: 7z b 4 | 7z b 4 -mmt1
Geekbench 5.5: Multi-Core | Single-Core
HWBOT x265 Benchmark v2.2: 4k Preset
LibreOffice : 20 Documents To PDF
R Benchmark 2.5: Overall mean
* ... smaller is better
AIDA64: FP32 Ray-Trace | FPU Julia | CPU SHA3 | CPU Queen | FPU SinJulia | FPU Mandel | CPU AES | CPU ZLib | FP64 Ray-Trace | CPU PhotoWorxx
| Performance rating | |
| Beelink GTI 11 | |
| Intel NUC11TNKi5 | |
| Average Intel Core i5-1135G7 | |
| GMK NucBox 2 | |
| Beelink SER3 | |
| AIDA64 / FP32 Ray-Trace | |
| Beelink GTI 11 | |
| Intel NUC11TNKi5 | |
| Average Intel Core i5-1135G7 (4313 - 7952, n=45) | |
| GMK NucBox 2 | |
| Beelink SER3 | |
| AIDA64 / FPU Julia | |
| Beelink GTI 11 | |
| Intel NUC11TNKi5 | |
| Average Intel Core i5-1135G7 (19402 - 32283, n=45) | |
| GMK NucBox 2 | |
| Beelink SER3 | |
| AIDA64 / CPU SHA3 | |
| Beelink GTI 11 | |
| Intel NUC11TNKi5 | |
| Average Intel Core i5-1135G7 (1316 - 2172, n=45) | |
| GMK NucBox 2 | |
| Beelink SER3 | |
| AIDA64 / CPU Queen | |
| Beelink GTI 11 | |
| Intel NUC11TNKi5 | |
| Average Intel Core i5-1135G7 (39000 - 46951, n=45) | |
| Beelink SER3 | |
| GMK NucBox 2 | |
| AIDA64 / FPU SinJulia | |
| Beelink SER3 | |
| Intel NUC11TNKi5 | |
| Beelink GTI 11 | |
| GMK NucBox 2 | |
| Average Intel Core i5-1135G7 (3497 - 4445, n=45) | |
| AIDA64 / FPU Mandel | |
| Beelink GTI 11 | |
| Intel NUC11TNKi5 | |
| Average Intel Core i5-1135G7 (12569 - 19635, n=45) | |
| GMK NucBox 2 | |
| Beelink SER3 | |
| AIDA64 / CPU AES | |
| Beelink GTI 11 | |
| Intel NUC11TNKi5 | |
| Average Intel Core i5-1135G7 (28988 - 67977, n=45) | |
| Beelink SER3 | |
| GMK NucBox 2 | |
| AIDA64 / CPU ZLib | |
| Intel NUC11TNKi5 | |
| Beelink GTI 11 | |
| Beelink SER3 | |
| Average Intel Core i5-1135G7 (265 - 373, n=51) | |
| GMK NucBox 2 | |
| AIDA64 / FP64 Ray-Trace | |
| Beelink GTI 11 | |
| Intel NUC11TNKi5 | |
| Average Intel Core i5-1135G7 (2226 - 4291, n=45) | |
| GMK NucBox 2 | |
| Beelink SER3 | |
| AIDA64 / CPU PhotoWorxx | |
| Beelink GTI 11 | |
| Average Intel Core i5-1135G7 (9004 - 45366, n=45) | |
| Intel NUC11TNKi5 | |
| Beelink SER3 | |
| GMK NucBox 2 | |
系统性能
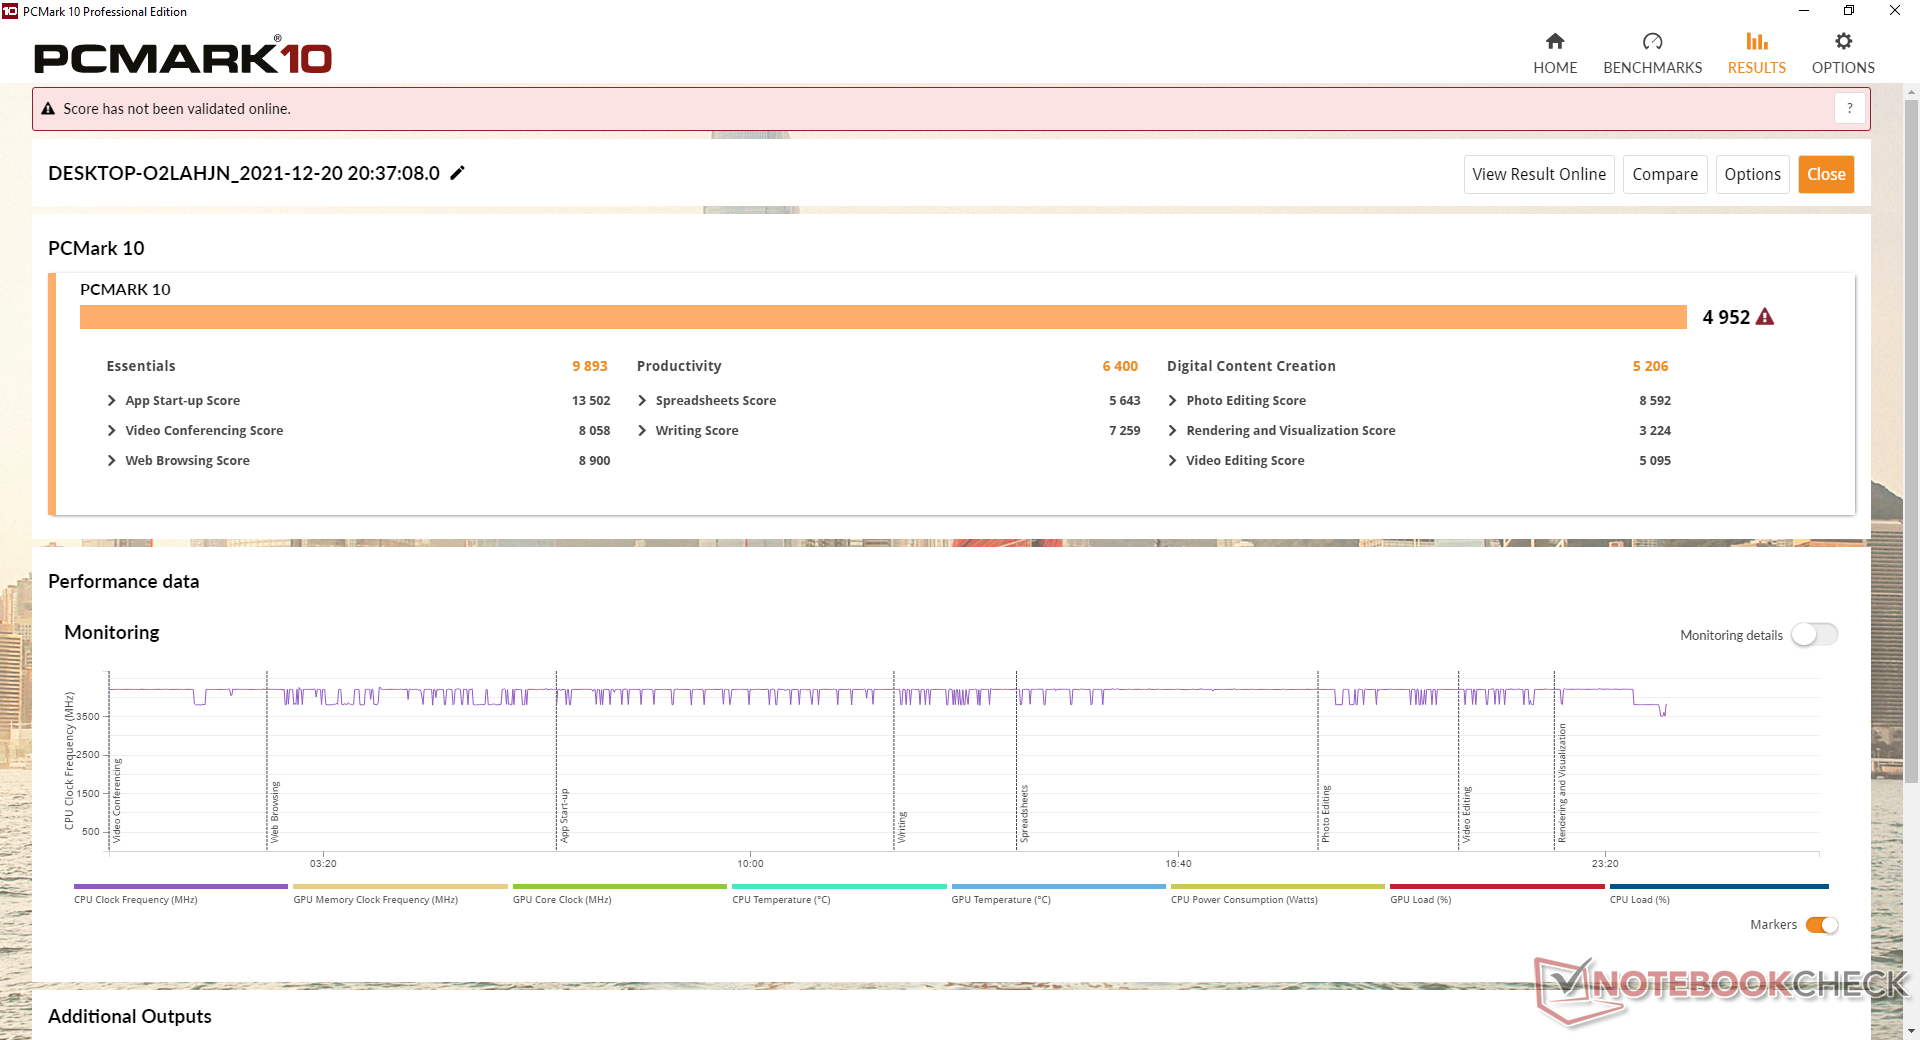
PCMark 10的成绩非常好,一直高于我们GTI 11之前的任何Beelink系统。使用更精简、更省电的第11代英特尔CPU的好处是使用户体验更顺畅。
| PCMark 10 / Score | |
| Intel Hades Canyon NUC8i7HVK | |
| Beelink GTI 11 | |
| Average Intel Core i5-1135G7, Intel Iris Xe Graphics G7 80EUs (4026 - 4952, n=53) | |
| Intel NUC11TNKi5 | |
| Intel NUC10i7FNH | |
| GMK NucBox 2 | |
| Beelink SER3 | |
| PCMark 10 / Essentials | |
| Beelink GTI 11 | |
| Average Intel Core i5-1135G7, Intel Iris Xe Graphics G7 80EUs (8149 - 9917, n=53) | |
| Intel Hades Canyon NUC8i7HVK | |
| Intel NUC10i7FNH | |
| Intel NUC11TNKi5 | |
| GMK NucBox 2 | |
| Beelink SER3 | |
| PCMark 10 / Productivity | |
| Intel Hades Canyon NUC8i7HVK | |
| Intel NUC10i7FNH | |
| Beelink GTI 11 | |
| GMK NucBox 2 | |
| Average Intel Core i5-1135G7, Intel Iris Xe Graphics G7 80EUs (5040 - 6619, n=53) | |
| Intel NUC11TNKi5 | |
| Beelink SER3 | |
| PCMark 10 / Digital Content Creation | |
| Intel Hades Canyon NUC8i7HVK | |
| Beelink GTI 11 | |
| Average Intel Core i5-1135G7, Intel Iris Xe Graphics G7 80EUs (3548 - 5255, n=53) | |
| Intel NUC11TNKi5 | |
| Intel NUC10i7FNH | |
| GMK NucBox 2 | |
| Beelink SER3 | |
| PCMark 10 Score | 4952 points | |
Help | ||
| AIDA64 / Memory Copy | |
| GMK NucBox 2 | |
| Beelink GTI 11 | |
| Average Intel Core i5-1135G7 (17443 - 63889, n=45) | |
| Intel NUC11TNKi5 | |
| Beelink SER3 | |
| AIDA64 / Memory Read | |
| Beelink GTI 11 | |
| Average Intel Core i5-1135G7 (19716 - 63705, n=45) | |
| GMK NucBox 2 | |
| Intel NUC11TNKi5 | |
| Beelink SER3 | |
| AIDA64 / Memory Write | |
| GMK NucBox 2 | |
| Beelink GTI 11 | |
| Average Intel Core i5-1135G7 (18722 - 66778, n=45) | |
| Intel NUC11TNKi5 | |
| Beelink SER3 | |
| AIDA64 / Memory Latency | |
| Beelink SER3 | |
| Intel NUC11TNKi5 | |
| Average Intel Core i5-1135G7 (68.3 - 107, n=51) | |
| Beelink GTI 11 | |
| GMK NucBox 2 | |
* ... smaller is better
DPC延时
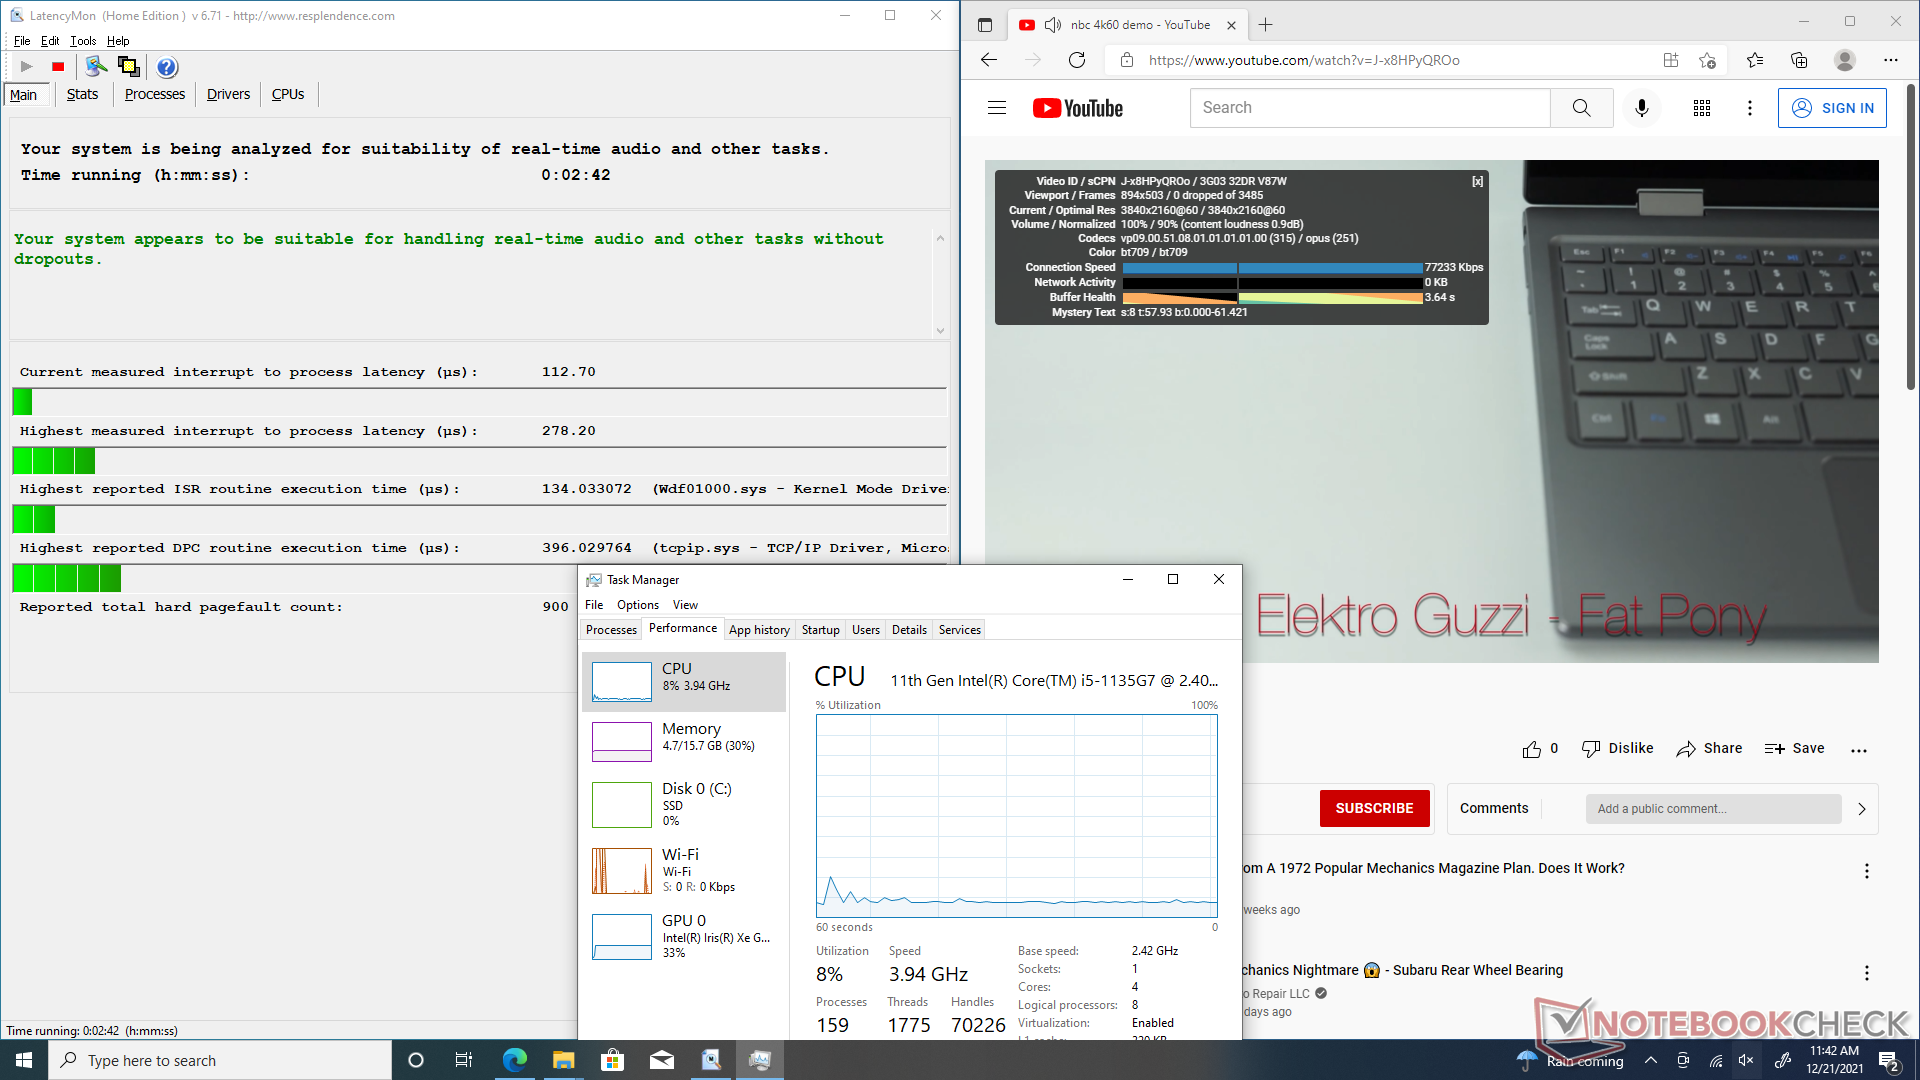
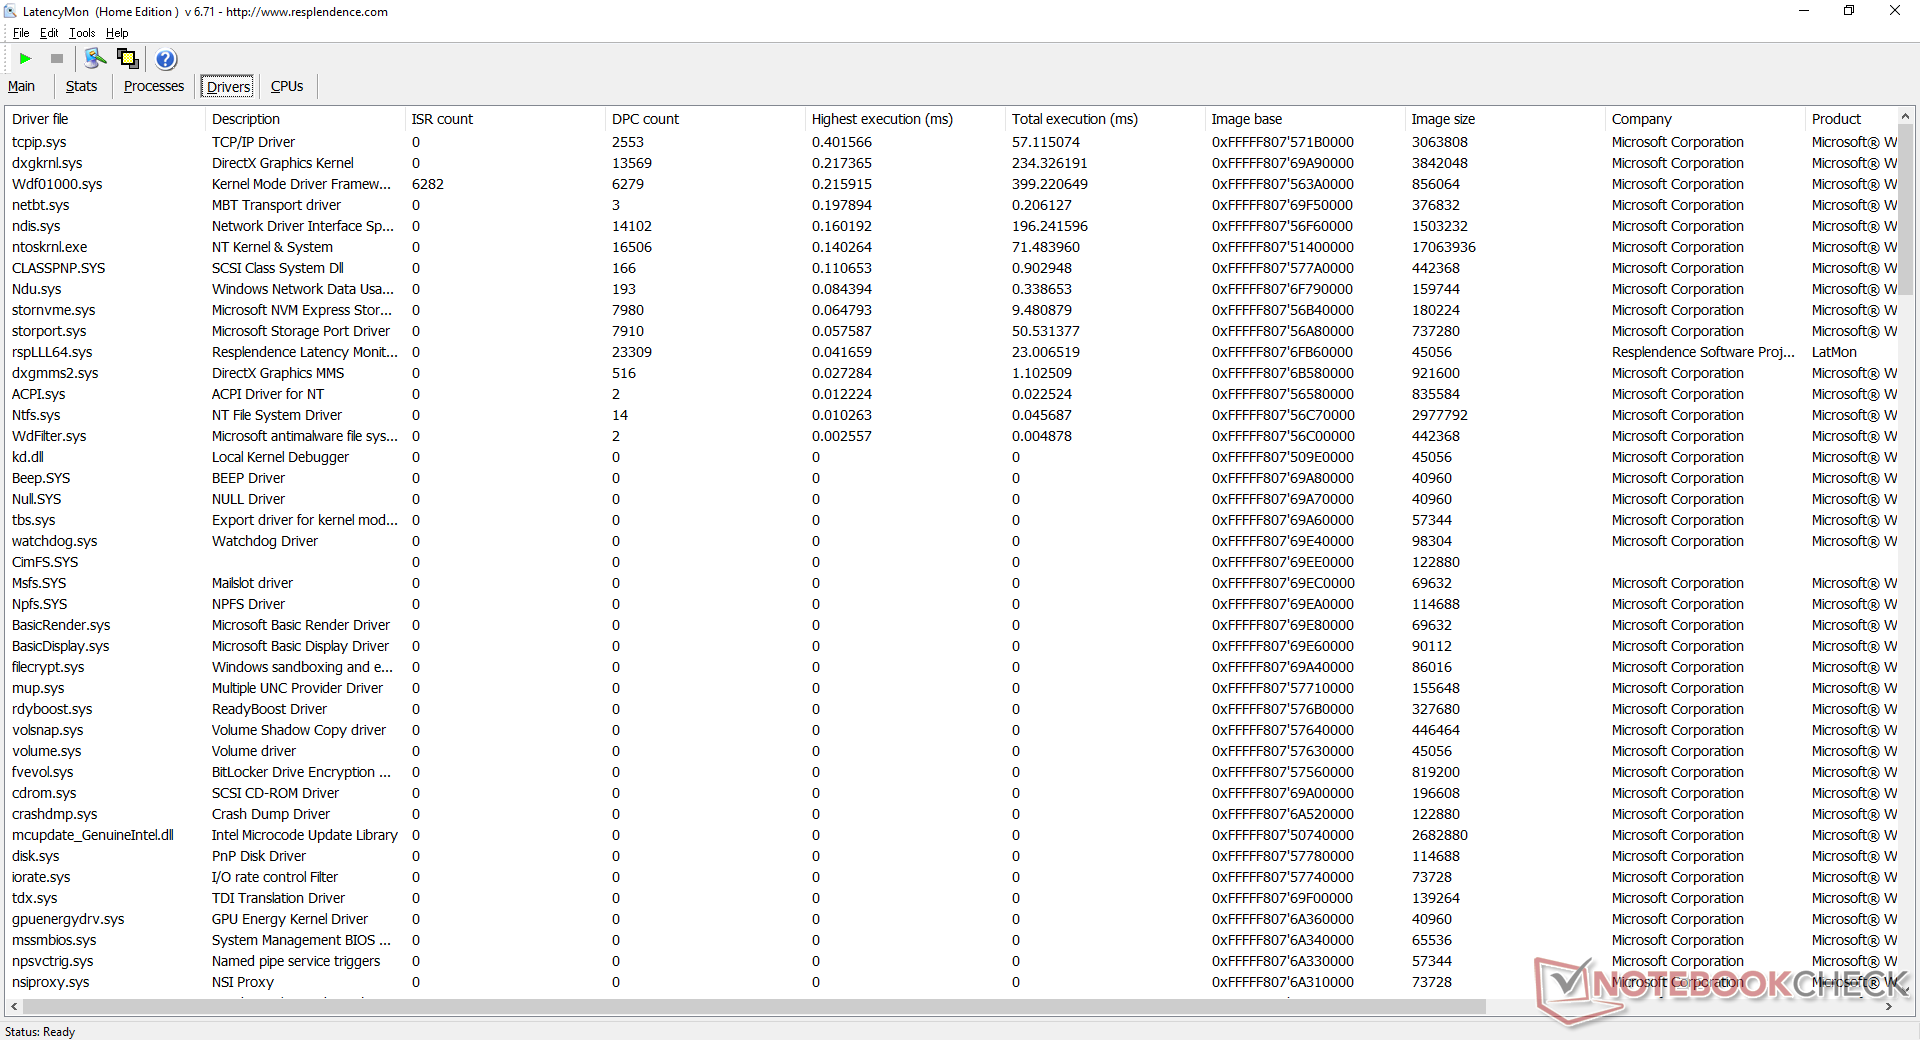
LatencyMon显示,在我们的主页上打开多个浏览器标签时没有DPC问题。在60FPS下的4K视频播放也很流畅,没有任何丢帧。
| DPC Latencies / LatencyMon - interrupt to process latency (max), Web, Youtube, Prime95 | |
| GMK NucBox 2 | |
| Beelink SER3 | |
| Intel NUC11TNKi5 | |
| Beelink GTI 11 | |
* ... smaller is better
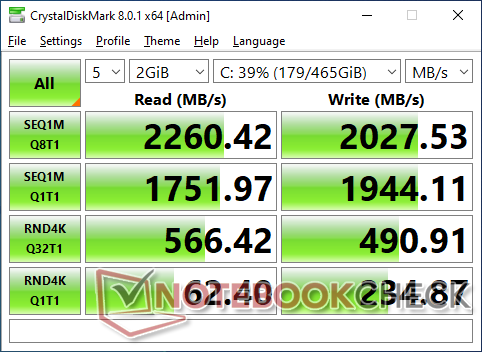
存储设备
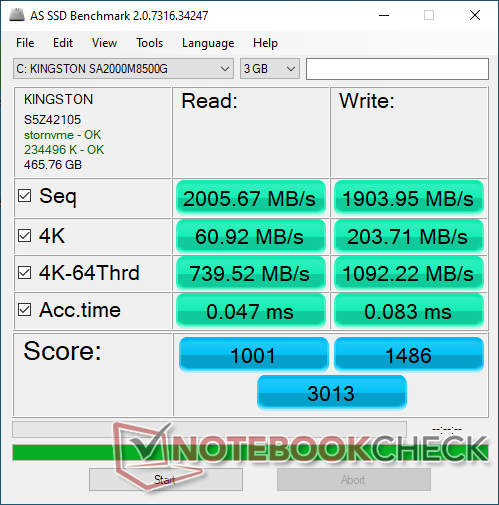
该系统最多可以支持三个内部驱动器(2x M.2 2280 + 1x 2.5英寸SATA III)。请记住,第二个M.2驱动器必须是一个SATA III驱动器,而不是一个NVMe驱动器。该 500GB金士顿A2000驱动器是一个中档的PCIe3 M.2驱动器,其连续读写速率约为2000至2200 MB/s。性能的可持续性也很好,在循环运行DiskSpd时没有热问题。
该设备配备了一个PCIe3驱动器,而不是PCIe4可能是为了节省成本。如果需要,用户可以安装自己的PCIe4驱动器。

| Drive Performance rating - Percent | |
| Beelink GTI 11 | |
| Intel Hades Canyon NUC8i7HVK -8! | |
| Beelink SER3 | |
| GMK NucBox 2 | |
| Intel NUC10i7FNH | |
| Intel NUC11TNKi5 | |
| DiskSpd | |
| seq read | |
| GMK NucBox 2 | |
| Beelink GTI 11 | |
| Beelink SER3 | |
| Intel NUC10i7FNH | |
| Intel NUC11TNKi5 | |
| seq write | |
| Beelink GTI 11 | |
| Beelink SER3 | |
| GMK NucBox 2 | |
| Intel NUC10i7FNH | |
| Intel NUC11TNKi5 | |
| seq q8 t1 read | |
| GMK NucBox 2 | |
| Beelink SER3 | |
| Beelink GTI 11 | |
| Intel NUC10i7FNH | |
| Intel NUC11TNKi5 | |
| seq q8 t1 write | |
| Beelink GTI 11 | |
| Beelink SER3 | |
| GMK NucBox 2 | |
| Intel NUC10i7FNH | |
| Intel NUC11TNKi5 | |
| 4k q1 t1 read | |
| Beelink GTI 11 | |
| Beelink SER3 | |
| GMK NucBox 2 | |
| Intel NUC10i7FNH | |
| Intel NUC11TNKi5 | |
| 4k q1 t1 write | |
| Beelink GTI 11 | |
| GMK NucBox 2 | |
| Beelink SER3 | |
| Intel NUC10i7FNH | |
| Intel NUC11TNKi5 | |
| 4k q32 t16 read | |
| Beelink SER3 | |
| Beelink GTI 11 | |
| GMK NucBox 2 | |
| Intel NUC11TNKi5 | |
| Intel NUC10i7FNH | |
| 4k q32 t16 write | |
| Beelink GTI 11 | |
| GMK NucBox 2 | |
| Beelink SER3 | |
| Intel NUC11TNKi5 | |
| Intel NUC10i7FNH | |
| AS SSD | |
| Score Total | |
| Intel Hades Canyon NUC8i7HVK | |
| Beelink GTI 11 | |
| Beelink SER3 | |
| Intel NUC10i7FNH | |
| GMK NucBox 2 | |
| Intel NUC11TNKi5 | |
| Score Read | |
| Intel Hades Canyon NUC8i7HVK | |
| Beelink GTI 11 | |
| Beelink SER3 | |
| Intel NUC10i7FNH | |
| GMK NucBox 2 | |
| Intel NUC11TNKi5 | |
| Score Write | |
| Beelink GTI 11 | |
| Beelink SER3 | |
| Intel NUC10i7FNH | |
| Intel Hades Canyon NUC8i7HVK | |
| GMK NucBox 2 | |
| Intel NUC11TNKi5 | |
| Seq Read | |
| GMK NucBox 2 | |
| Beelink GTI 11 | |
| Beelink SER3 | |
| Intel Hades Canyon NUC8i7HVK | |
| Intel NUC10i7FNH | |
| Intel NUC11TNKi5 | |
| Seq Write | |
| Beelink GTI 11 | |
| Beelink SER3 | |
| GMK NucBox 2 | |
| Intel NUC10i7FNH | |
| Intel Hades Canyon NUC8i7HVK | |
| Intel NUC11TNKi5 | |
| 4K Read | |
| Intel Hades Canyon NUC8i7HVK | |
| Beelink GTI 11 | |
| GMK NucBox 2 | |
| Beelink SER3 | |
| Intel NUC10i7FNH | |
| Intel NUC11TNKi5 | |
| 4K Write | |
| Beelink GTI 11 | |
| GMK NucBox 2 | |
| Beelink SER3 | |
| Intel Hades Canyon NUC8i7HVK | |
| Intel NUC10i7FNH | |
| Intel NUC11TNKi5 | |
| 4K-64 Read | |
| Intel Hades Canyon NUC8i7HVK | |
| Beelink SER3 | |
| Beelink GTI 11 | |
| Intel NUC10i7FNH | |
| GMK NucBox 2 | |
| Intel NUC11TNKi5 | |
| 4K-64 Write | |
| Beelink GTI 11 | |
| Intel NUC10i7FNH | |
| Beelink SER3 | |
| Intel Hades Canyon NUC8i7HVK | |
| GMK NucBox 2 | |
| Intel NUC11TNKi5 | |
| Access Time Read | |
| Intel NUC11TNKi5 | |
| Intel NUC10i7FNH | |
| Beelink SER3 | |
| GMK NucBox 2 | |
| Beelink GTI 11 | |
| Intel Hades Canyon NUC8i7HVK | |
| Access Time Write | |
| Beelink SER3 | |
| GMK NucBox 2 | |
| Intel NUC11TNKi5 | |
| Beelink GTI 11 | |
| Intel NUC10i7FNH | |
| Intel Hades Canyon NUC8i7HVK | |
* ... smaller is better
Disk Throttling: DiskSpd Read Loop, Queue Depth 8
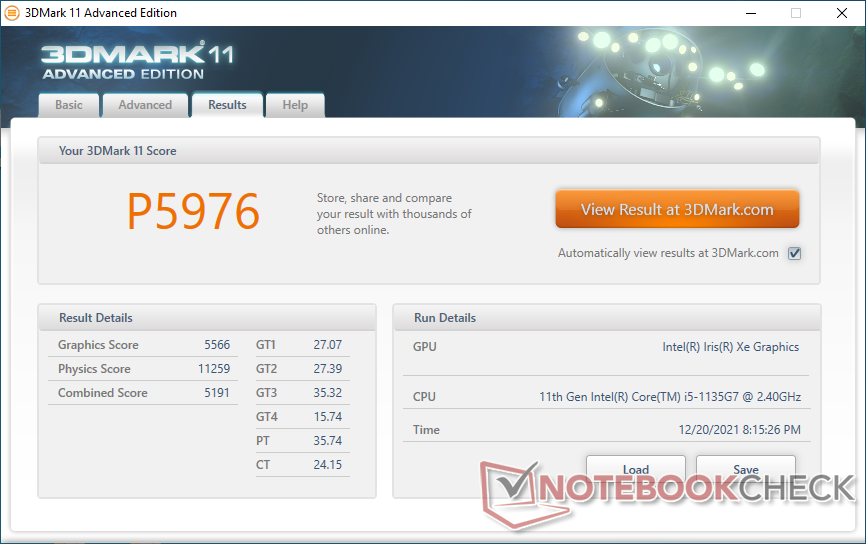
GPU性能
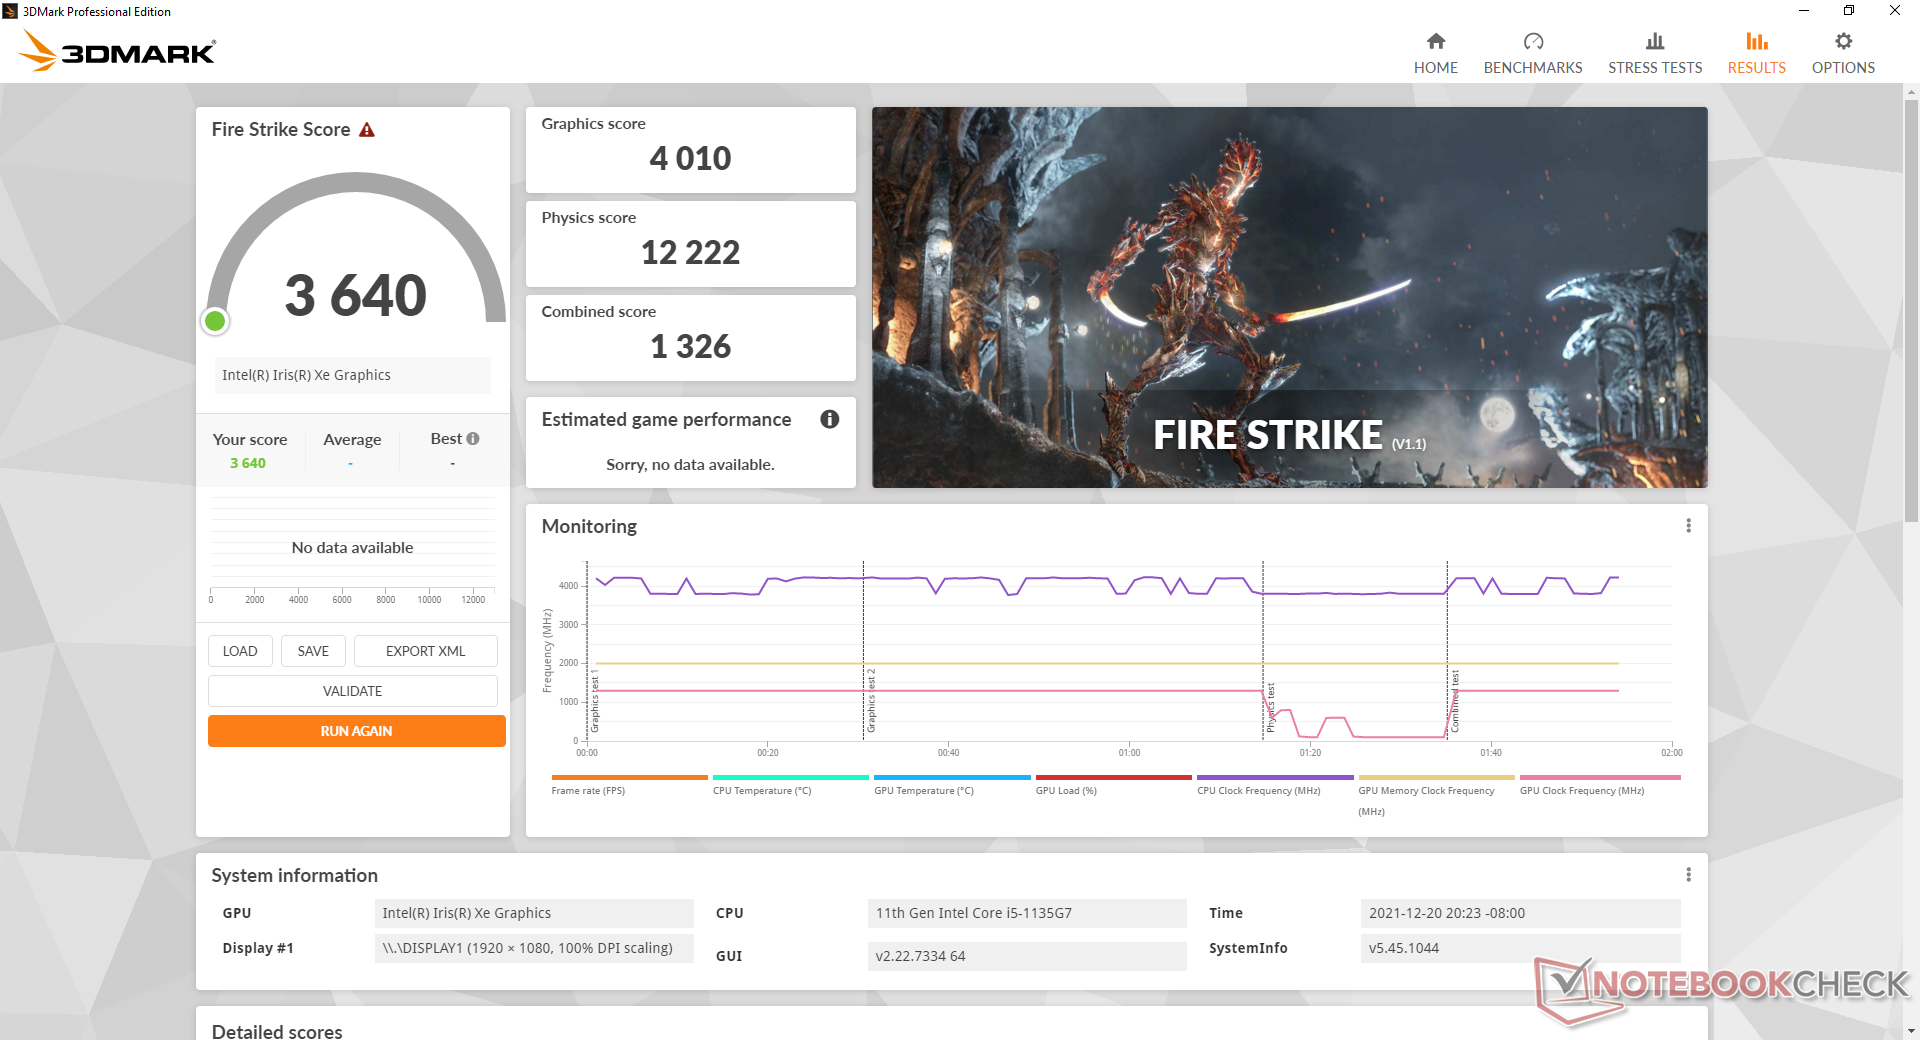
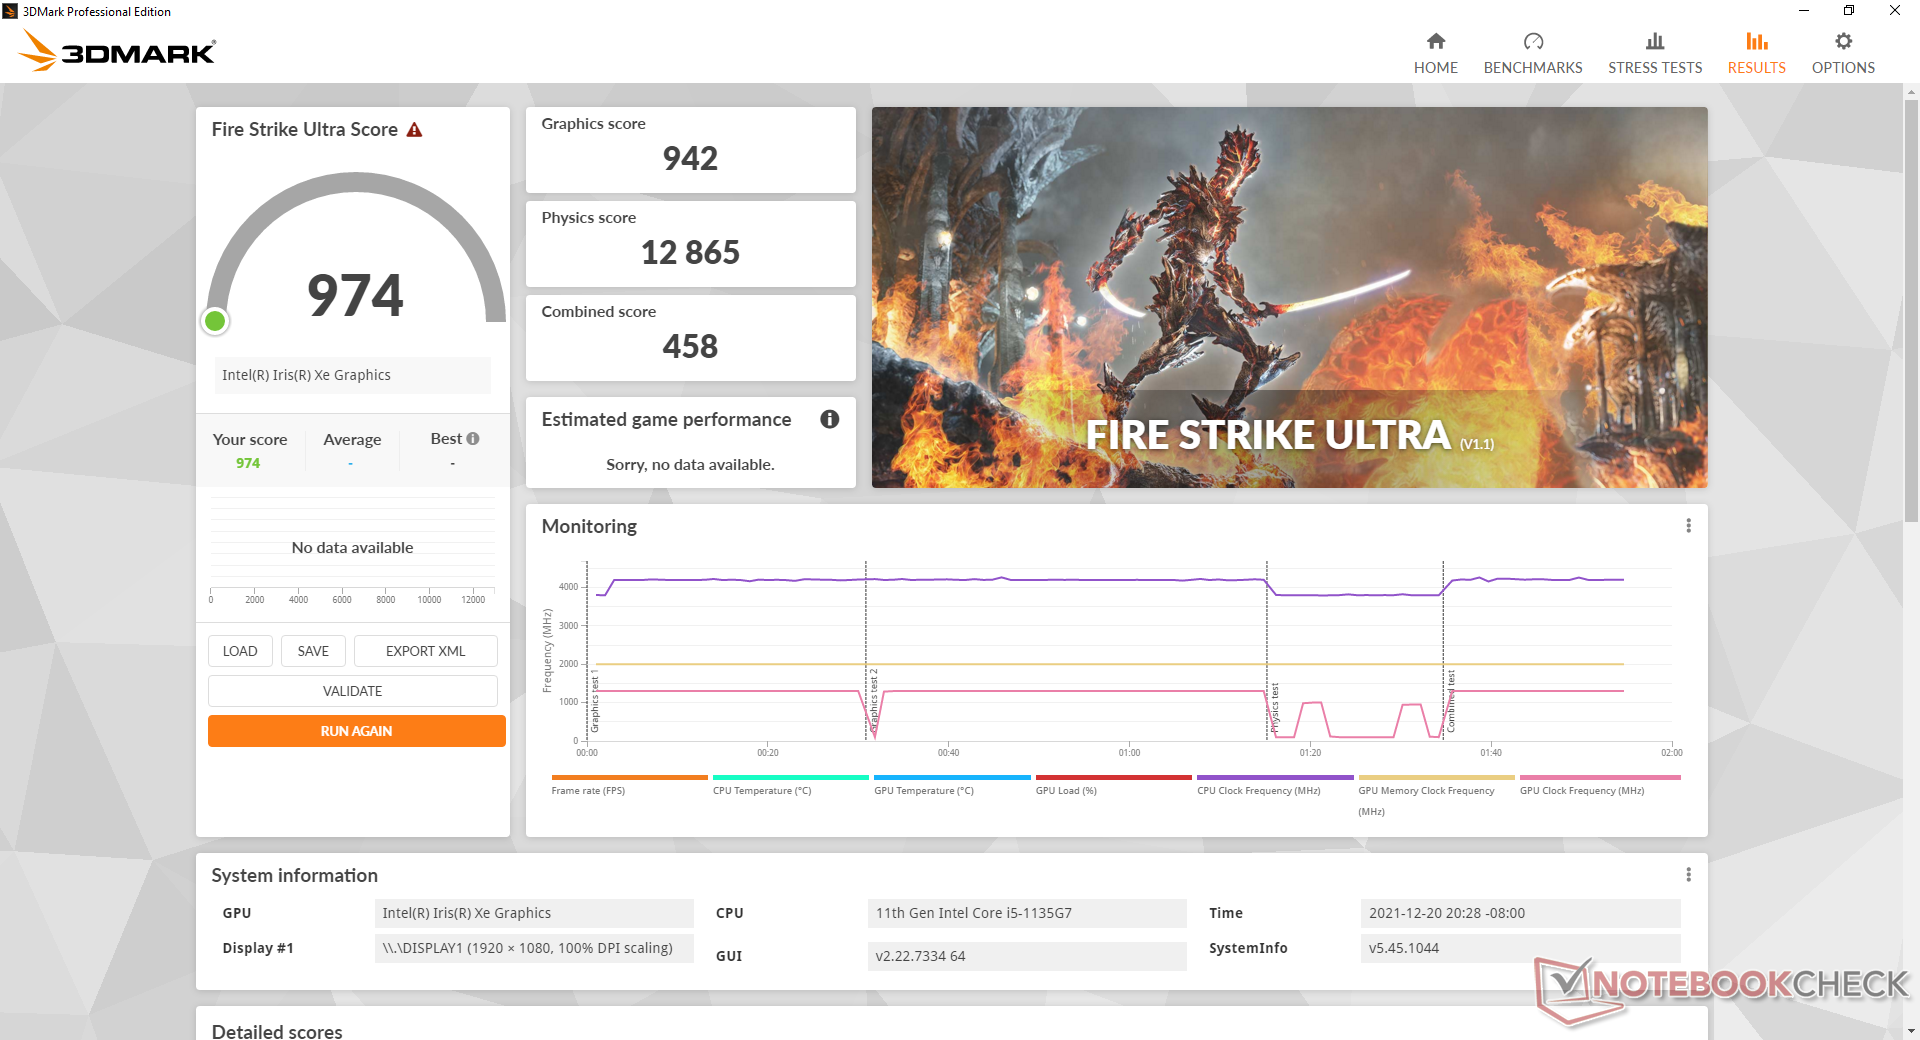
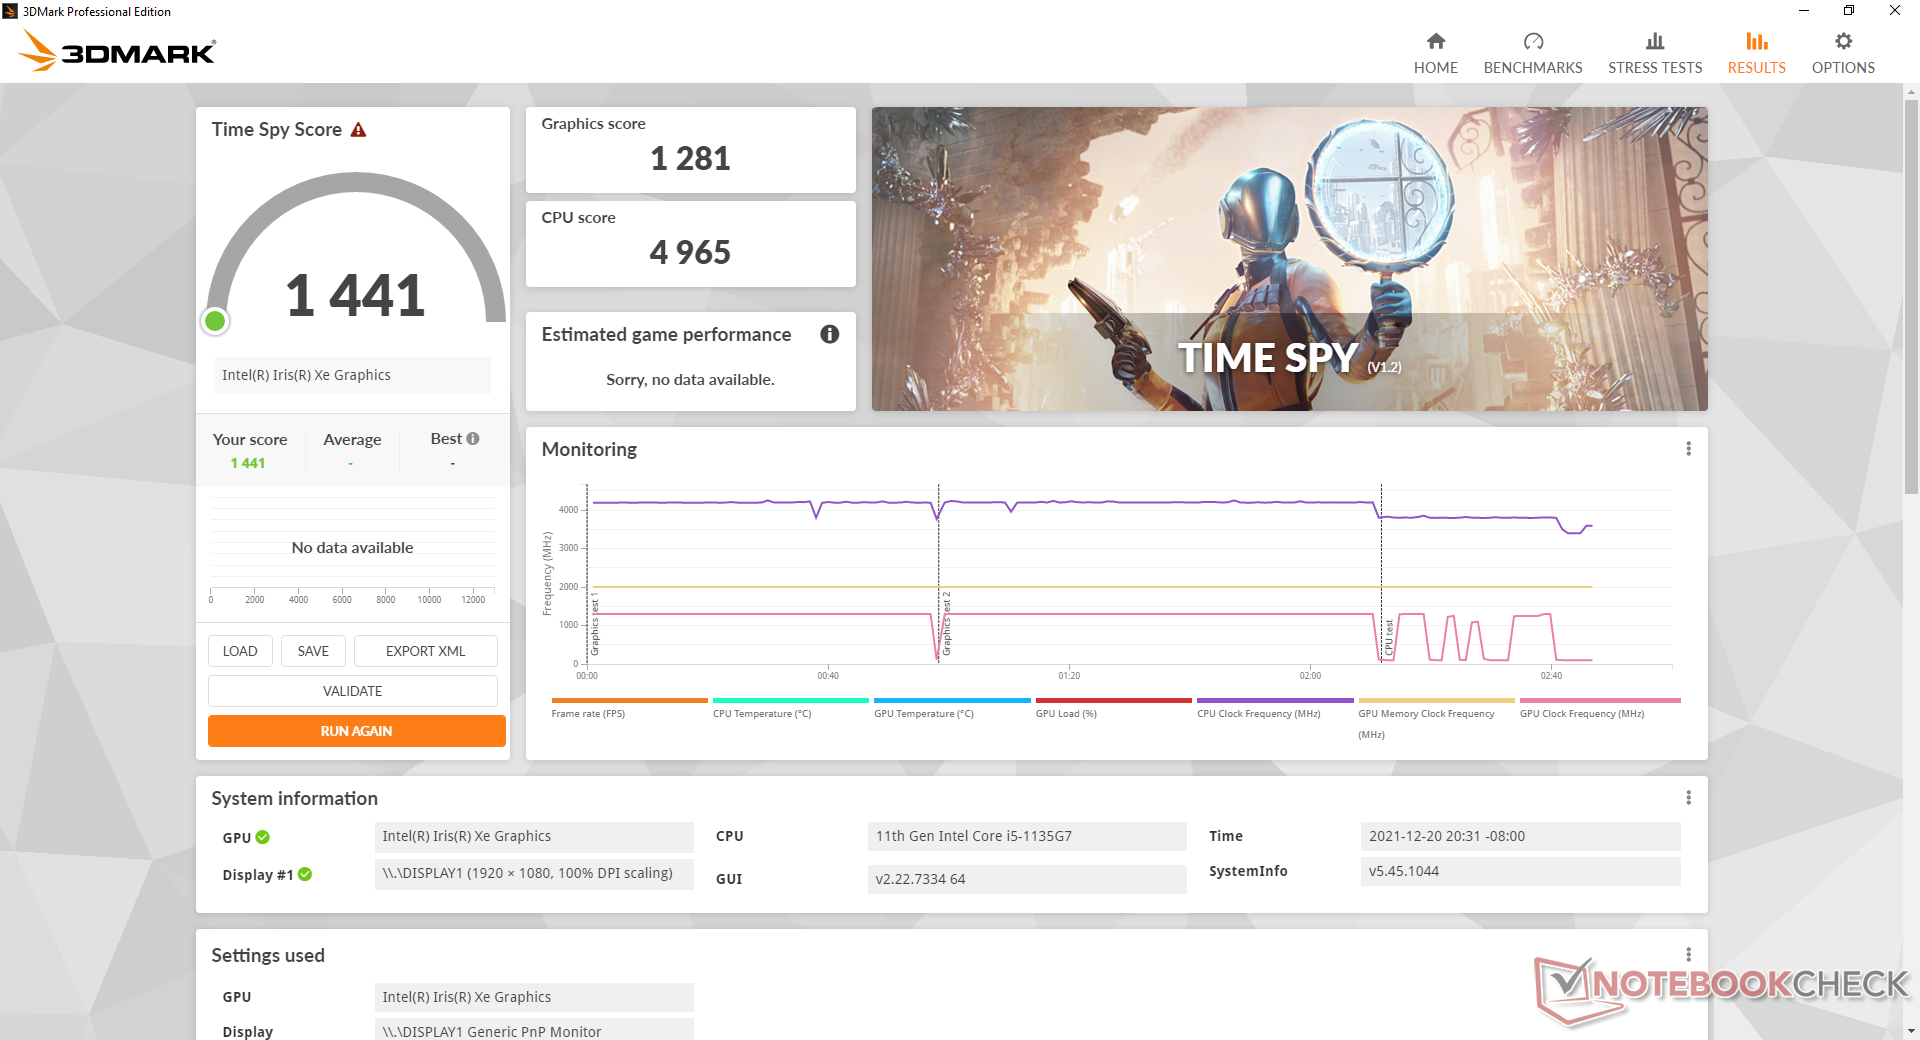
图形性能非常好,比配备同样集成的笔记本电脑或个人电脑大约快13%。 Iris Xe 80 EUs.GTI 11配备了双通道内存,与我们的 英特尔NUC11TNKi5测试装置,它配备了相同的Core i5-1135G7 CPU,但只有单通道内存。图形性能在我们的Beelink上快了大约25%,这主要是由于它们不同的内存配置。
升级到配备更高端的酷睿i7-1165G7和其集成的 Iris Xe 96 EUs将导致性能提升达25%至35%,具体取决于型号。

| 3DMark 11 - 1280x720 Performance GPU | |
| Intel Hades Canyon NUC8i7HVK | |
| Samsung Galaxy Book Pro 15 NP950XDB-KC5US | |
| Asus Vivobook 15 K513EQ | |
| Intel NUC11PAQi7 | |
| Lenovo Yoga 6 13ALC6 | |
| Beelink GTI 11 | |
| Intel NUC11TNKi5 | |
| Lenovo Yoga 6 13 82ND0009US | |
| Average Intel Iris Xe Graphics G7 80EUs (2246 - 6579, n=112) | |
| Infinix INBook X1 Pro | |
| Beelink GTR35 II-G-16512D00W64PRO-1T | |
| Beelink SER3 | |
| GMK NucBox 2 | |
| Asus VivoBook S13 S333JA-DS51 | |
| Intel NUC10i7FNH | |
| 3DMark 11 Performance | 5976 points | |
| 3DMark Cloud Gate Standard Score | 18036 points | |
| 3DMark Fire Strike Score | 3640 points | |
| 3DMark Time Spy Score | 1441 points | |
Help | ||
| Far Cry 5 | |
| 1280x720 Low Preset AA:T | |
| Asus Vivobook 15 K513EQ | |
| Beelink GTI 11 | |
| Lenovo Yoga 6 13ALC6 | |
| Average Intel Iris Xe Graphics G7 80EUs (14 - 63, n=50) | |
| Beelink SER3 | |
| 1920x1080 Low Preset AA:T | |
| Asus Vivobook 15 K513EQ | |
| Average Intel Iris Xe Graphics G7 80EUs (15 - 35, n=13) | |
| Beelink GTI 11 | |
| Lenovo Yoga 6 13ALC6 | |
| Beelink SER3 | |
| 1920x1080 Medium Preset AA:T | |
| Asus Vivobook 15 K513EQ | |
| Beelink GTI 11 | |
| Average Intel Iris Xe Graphics G7 80EUs (9 - 31, n=47) | |
| Lenovo Yoga 6 13ALC6 | |
| Beelink SER3 | |
| 1920x1080 High Preset AA:T | |
| Intel Hades Canyon NUC8i7HVK | |
| Asus Vivobook 15 K513EQ | |
| Beelink GTI 11 | |
| Average Intel Iris Xe Graphics G7 80EUs (8 - 29, n=39) | |
| Lenovo Yoga 6 13ALC6 | |
| Beelink SER3 | |
| 1920x1080 Ultra Preset AA:T | |
| Intel Hades Canyon NUC8i7HVK | |
| Asus Vivobook 15 K513EQ | |
| Beelink GTI 11 | |
| Average Intel Iris Xe Graphics G7 80EUs (8 - 27, n=29) | |
| Lenovo Yoga 6 13ALC6 | |
| Beelink SER3 | |
| X-Plane 11.11 | |
| 1280x720 low (fps_test=1) | |
| Asus Vivobook 15 K513EQ | |
| Intel Hades Canyon NUC8i7HVK | |
| Intel NUC11PAQi7 | |
| Lenovo Yoga 6 13ALC6 | |
| Intel NUC11TNKi5 | |
| Lenovo Yoga 6 13 82ND0009US | |
| Average Intel Iris Xe Graphics G7 80EUs (9.12 - 74.4, n=111) | |
| Asus VivoBook S13 S333JA-DS51 | |
| Beelink GTR35 II-G-16512D00W64PRO-1T | |
| GMK NucBox 2 | |
| Beelink GTI 11 | |
| Beelink SER3 | |
| Infinix INBook X1 Pro | |
| Intel NUC10i7FNH | |
| 1920x1080 med (fps_test=2) | |
| Asus Vivobook 15 K513EQ | |
| Intel Hades Canyon NUC8i7HVK | |
| Intel NUC11PAQi7 | |
| Lenovo Yoga 6 13ALC6 | |
| Lenovo Yoga 6 13 82ND0009US | |
| Average Intel Iris Xe Graphics G7 80EUs (6.45 - 40.5, n=112) | |
| Intel NUC11TNKi5 | |
| Beelink GTR35 II-G-16512D00W64PRO-1T | |
| Beelink GTI 11 | |
| Beelink SER3 | |
| GMK NucBox 2 | |
| Infinix INBook X1 Pro | |
| Asus VivoBook S13 S333JA-DS51 | |
| Intel NUC10i7FNH | |
| 1920x1080 high (fps_test=3) | |
| Asus Vivobook 15 K513EQ | |
| Intel Hades Canyon NUC8i7HVK | |
| Intel NUC11TNKi5 | |
| Intel NUC11PAQi7 | |
| Lenovo Yoga 6 13ALC6 | |
| Average Intel Iris Xe Graphics G7 80EUs (5.55 - 36.3, n=110) | |
| Lenovo Yoga 6 13 82ND0009US | |
| Beelink GTR35 II-G-16512D00W64PRO-1T | |
| Beelink GTI 11 | |
| Beelink SER3 | |
| GMK NucBox 2 | |
| Infinix INBook X1 Pro | |
| Asus VivoBook S13 S333JA-DS51 | |
| Intel NUC10i7FNH | |
| Strange Brigade | |
| 1280x720 lowest AF:1 | |
| Intel Hades Canyon NUC8i7HVK | |
| Asus Vivobook 15 K513EQ | |
| Beelink GTI 11 | |
| Lenovo Yoga 6 13ALC6 | |
| Lenovo Yoga 6 13 82ND0009US | |
| Average Intel Iris Xe Graphics G7 80EUs (22.7 - 98.7, n=84) | |
| Intel NUC11PAQi7 | |
| Beelink SER3 | |
| 1920x1080 medium AA:medium AF:4 | |
| Intel Hades Canyon NUC8i7HVK | |
| Asus Vivobook 15 K513EQ | |
| Beelink GTI 11 | |
| Lenovo Yoga 6 13ALC6 | |
| Average Intel Iris Xe Graphics G7 80EUs (6 - 48.8, n=86) | |
| Lenovo Yoga 6 13 82ND0009US | |
| Intel NUC11PAQi7 | |
| Beelink SER3 | |
| 1920x1080 high AA:high AF:8 | |
| Intel Hades Canyon NUC8i7HVK | |
| Beelink GTI 11 | |
| Asus Vivobook 15 K513EQ | |
| Lenovo Yoga 6 13ALC6 | |
| Average Intel Iris Xe Graphics G7 80EUs (11.4 - 34, n=83) | |
| Lenovo Yoga 6 13 82ND0009US | |
| Intel NUC11PAQi7 | |
| Beelink SER3 | |
| 1920x1080 ultra AA:ultra AF:16 | |
| Intel Hades Canyon NUC8i7HVK | |
| Lenovo Yoga 6 13 82ND0009US | |
| Lenovo Yoga 6 13ALC6 | |
| Beelink GTI 11 | |
| Average Intel Iris Xe Graphics G7 80EUs (13.6 - 27, n=60) | |
| Asus Vivobook 15 K513EQ | |
| Intel NUC11PAQi7 | |
| Beelink SER3 | |
| Dota 2 Reborn | |
| 1280x720 min (0/3) fastest | |
| Intel Hades Canyon NUC8i7HVK | |
| Asus Vivobook 15 K513EQ | |
| Beelink GTI 11 | |
| GMK NucBox 2 | |
| Lenovo Yoga 6 13 82ND0009US | |
| Infinix INBook X1 Pro | |
| Lenovo Yoga 6 13ALC6 | |
| Average Intel Iris Xe Graphics G7 80EUs (14.8 - 140.3, n=113) | |
| Beelink GTR35 II-G-16512D00W64PRO-1T | |
| Asus VivoBook S13 S333JA-DS51 | |
| Intel NUC10i7FNH | |
| Intel NUC11PAQi7 | |
| Intel NUC11TNKi5 | |
| Beelink SER3 | |
| 1366x768 med (1/3) | |
| Intel Hades Canyon NUC8i7HVK | |
| Asus Vivobook 15 K513EQ | |
| Beelink GTI 11 | |
| Lenovo Yoga 6 13 82ND0009US | |
| Lenovo Yoga 6 13ALC6 | |
| Average Intel Iris Xe Graphics G7 80EUs (10.9 - 119.5, n=113) | |
| Beelink GTR35 II-G-16512D00W64PRO-1T | |
| GMK NucBox 2 | |
| Intel NUC11PAQi7 | |
| Intel NUC11TNKi5 | |
| Infinix INBook X1 Pro | |
| Intel NUC10i7FNH | |
| Beelink SER3 | |
| Asus VivoBook S13 S333JA-DS51 | |
| 1920x1080 high (2/3) | |
| Intel Hades Canyon NUC8i7HVK | |
| Asus Vivobook 15 K513EQ | |
| Beelink GTI 11 | |
| Lenovo Yoga 6 13ALC6 | |
| Lenovo Yoga 6 13 82ND0009US | |
| Average Intel Iris Xe Graphics G7 80EUs (10.4 - 70.9, n=113) | |
| Beelink GTR35 II-G-16512D00W64PRO-1T | |
| Intel NUC11PAQi7 | |
| Intel NUC11TNKi5 | |
| Infinix INBook X1 Pro | |
| GMK NucBox 2 | |
| Beelink SER3 | |
| Asus VivoBook S13 S333JA-DS51 | |
| Intel NUC10i7FNH | |
| 1920x1080 ultra (3/3) best looking | |
| Intel Hades Canyon NUC8i7HVK | |
| Asus Vivobook 15 K513EQ | |
| Beelink GTI 11 | |
| Lenovo Yoga 6 13ALC6 | |
| Lenovo Yoga 6 13 82ND0009US | |
| Average Intel Iris Xe Graphics G7 80EUs (7.8 - 66.1, n=114) | |
| Beelink GTR35 II-G-16512D00W64PRO-1T | |
| Intel NUC11PAQi7 | |
| Intel NUC11TNKi5 | |
| Beelink SER3 | |
| Infinix INBook X1 Pro | |
| GMK NucBox 2 | |
| Asus VivoBook S13 S333JA-DS51 | |
| Intel NUC10i7FNH | |
Witcher 3 FPS Chart
| low | med. | high | ultra | |
|---|---|---|---|---|
| GTA V (2015) | 95.1 | 79.5 | 21.1 | 8.17 |
| The Witcher 3 (2015) | 77.1 | 46.6 | 23.1 | 11.5 |
| Dota 2 Reborn (2015) | 123 | 81 | 49.7 | 47.2 |
| Final Fantasy XV Benchmark (2018) | 36.7 | 18.7 | 13.5 | |
| X-Plane 11.11 (2018) | 24 | 21.4 | 21.9 | |
| Far Cry 5 (2018) | 47 | 23 | 22 | 21 |
| Strange Brigade (2018) | 76.5 | 30.8 | 25.2 | 20.2 |
排放
系统噪音
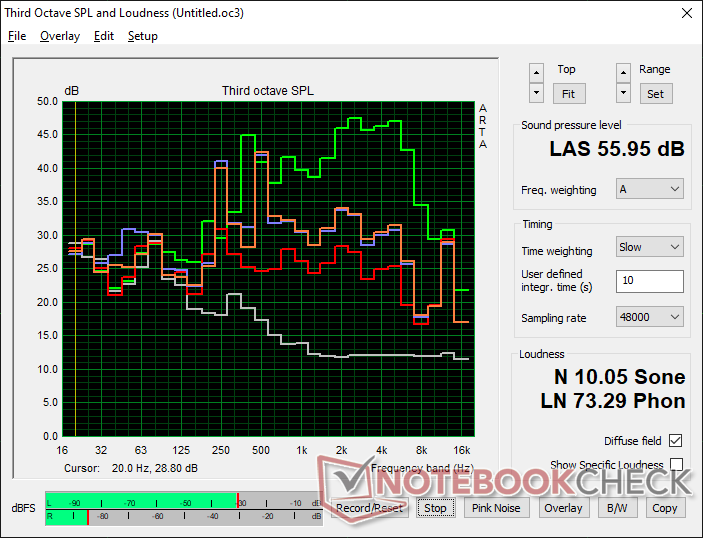
风扇的噪音可能是GTI 11最糟糕的方面。两个内部风扇频繁地跳动,而且明显地在28.4dB(A)和37.7dB(A)之间,即使是在桌面上闲置或浏览网页时也是如此。当把系统设置为省电模式时,风扇的行为也不会改变。
运行更高的负载,如游戏,会引起风扇噪音,范围从44 dB(A)到56 dB(A),这比我们在大多数其他迷你PC(包括英特尔NUC系列)上记录的要大得多。我们的设备也会受到轻微的电子噪音或线圈啸叫的影响,所以它从来没有真正的安静。
Noise level
| Idle |
| 28.4 / 32 / 37.7 dB(A) |
| Load |
| 44.2 / 56 dB(A) |
 | ||
30 dB silent 40 dB(A) audible 50 dB(A) loud |
||
min: | ||
| Beelink GTI 11 Iris Xe G7 80EUs, i5-1135G7, Kingston SA2000M8500G | Beelink SER3 Vega 10, R7 3750H, GSemi AZW GSDFN512TS3F1OGCX | Intel NUC11TNKi5 Iris Xe G7 80EUs, i5-1135G7, Transcend M.2 SSD 430S TS512GMTS430S | GMK NucBox 2 Iris Plus Graphics 655, i5-8259U, Netac S930E8/256GPN | Intel Hades Canyon NUC8i7HVK Vega M GH, i7-8809G, Intel Optane 120 GB SSDPEK1W120GA | |
|---|---|---|---|---|---|
| Noise | 19% | 3% | 20% | 8% | |
| off / environment * (dB) | 25.7 | 23.4 9% | 24.8 4% | 25.6 -0% | 28.7 -12% |
| Idle Minimum * (dB) | 28.4 | 23.4 18% | 35.6 -25% | 25.7 10% | 29 -2% |
| Idle Average * (dB) | 32 | 23.4 27% | 35.6 -11% | 25.7 20% | 29 9% |
| Idle Maximum * (dB) | 37.7 | 29.4 22% | 35.6 6% | 25.7 32% | 29 23% |
| Load Average * (dB) | 44.2 | 35.2 20% | 36.2 18% | 35.3 20% | 36 19% |
| Witcher 3 ultra * (dB) | 44.5 | 37.2 16% | 38 15% | 42 6% | |
| Load Maximum * (dB) | 56 | 43.3 23% | 47.6 15% | 35.1 37% | 49.4 12% |
* ... smaller is better
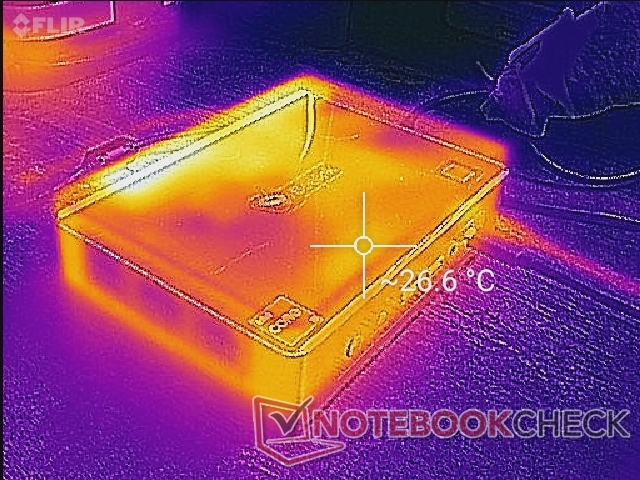
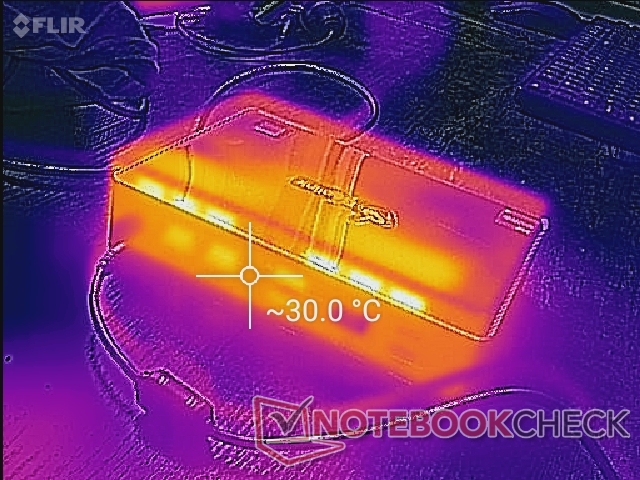
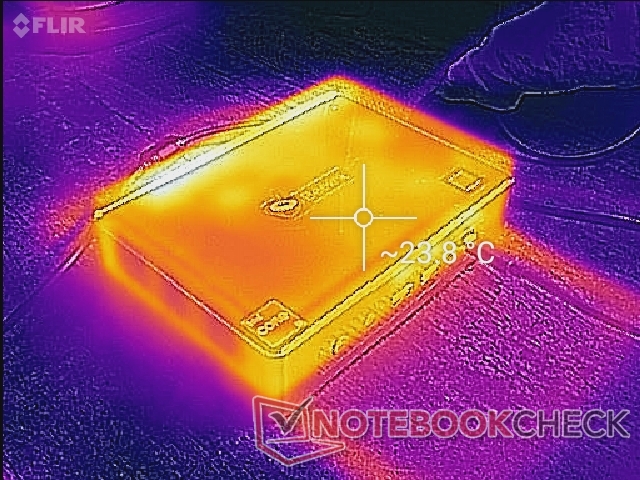
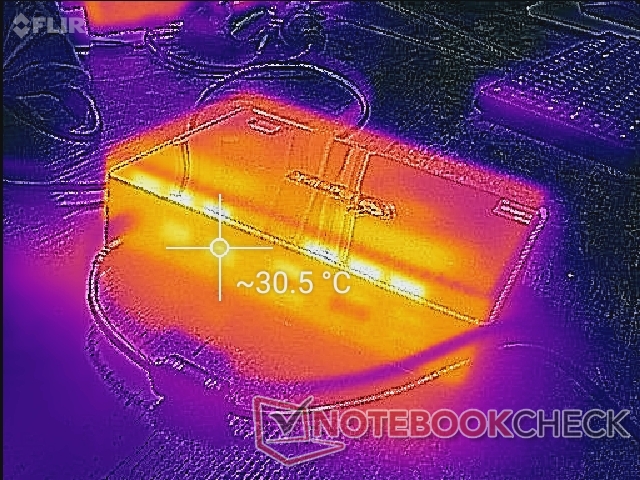
温度
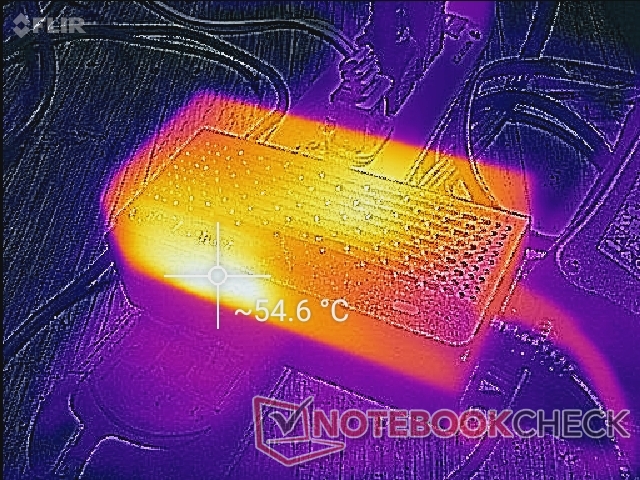
表面温度在GTI 11上不是一个问题。事实上,正如我们下面的温度图所示,空转和游戏负载之间的任何差异都相当小。冷空气从机箱两边最远的地方进入,热空气从后面存在。物品可以放在设备的顶部而不妨碍气流,但垂直方向可能会影响风扇噪音或温度。
压力测试
当运行Prime95对CPU施加压力时,在最初的20秒左右,时钟频率将提升到3.8GHz,直到达到89C的核心温度。然后时钟频率将下降到2.8GHz,以保持70C的较低核心温度。
核心温度和GPU时钟速率将分别稳定在64 C和1300 MHz,当运行 Witcher 3以代表高负载。结果与我们在竞争的NUC11TNKi5上记录的结果非常相似,当两个系统受到类似条件的影响时。
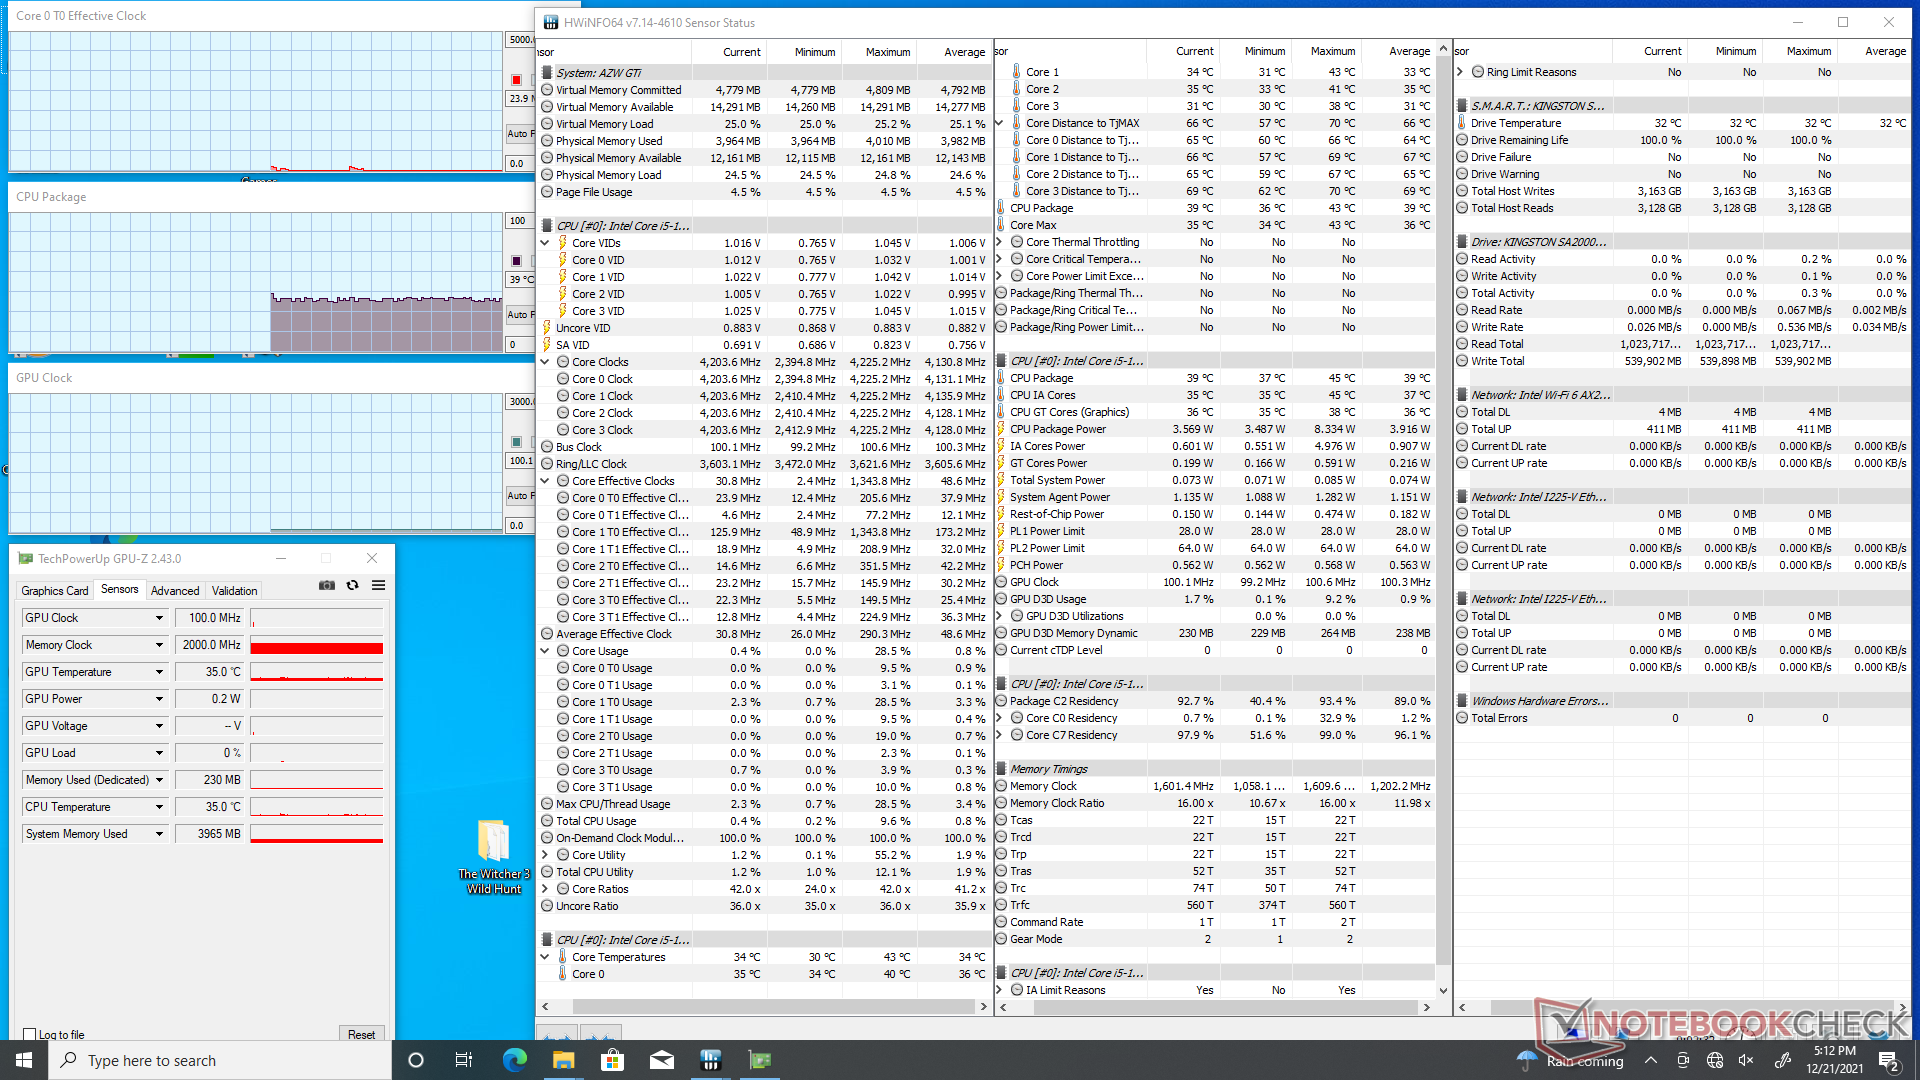
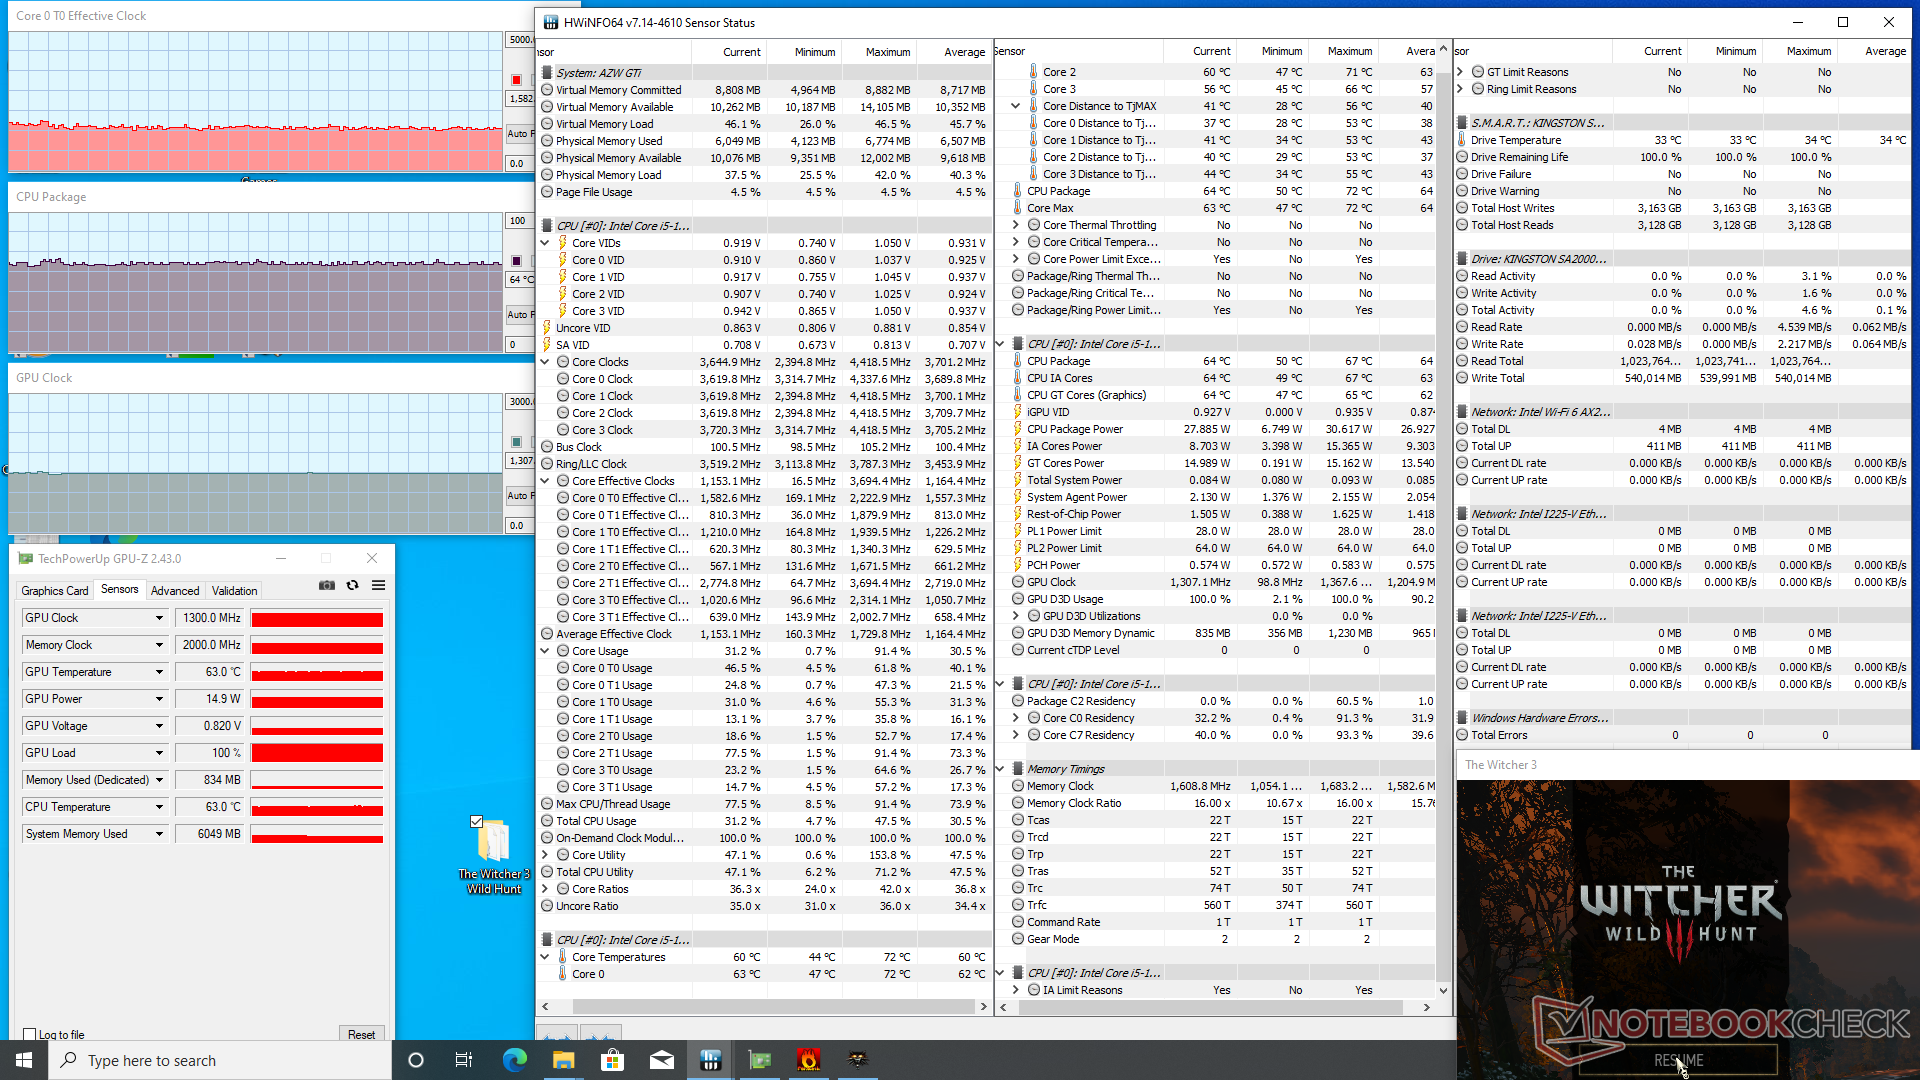
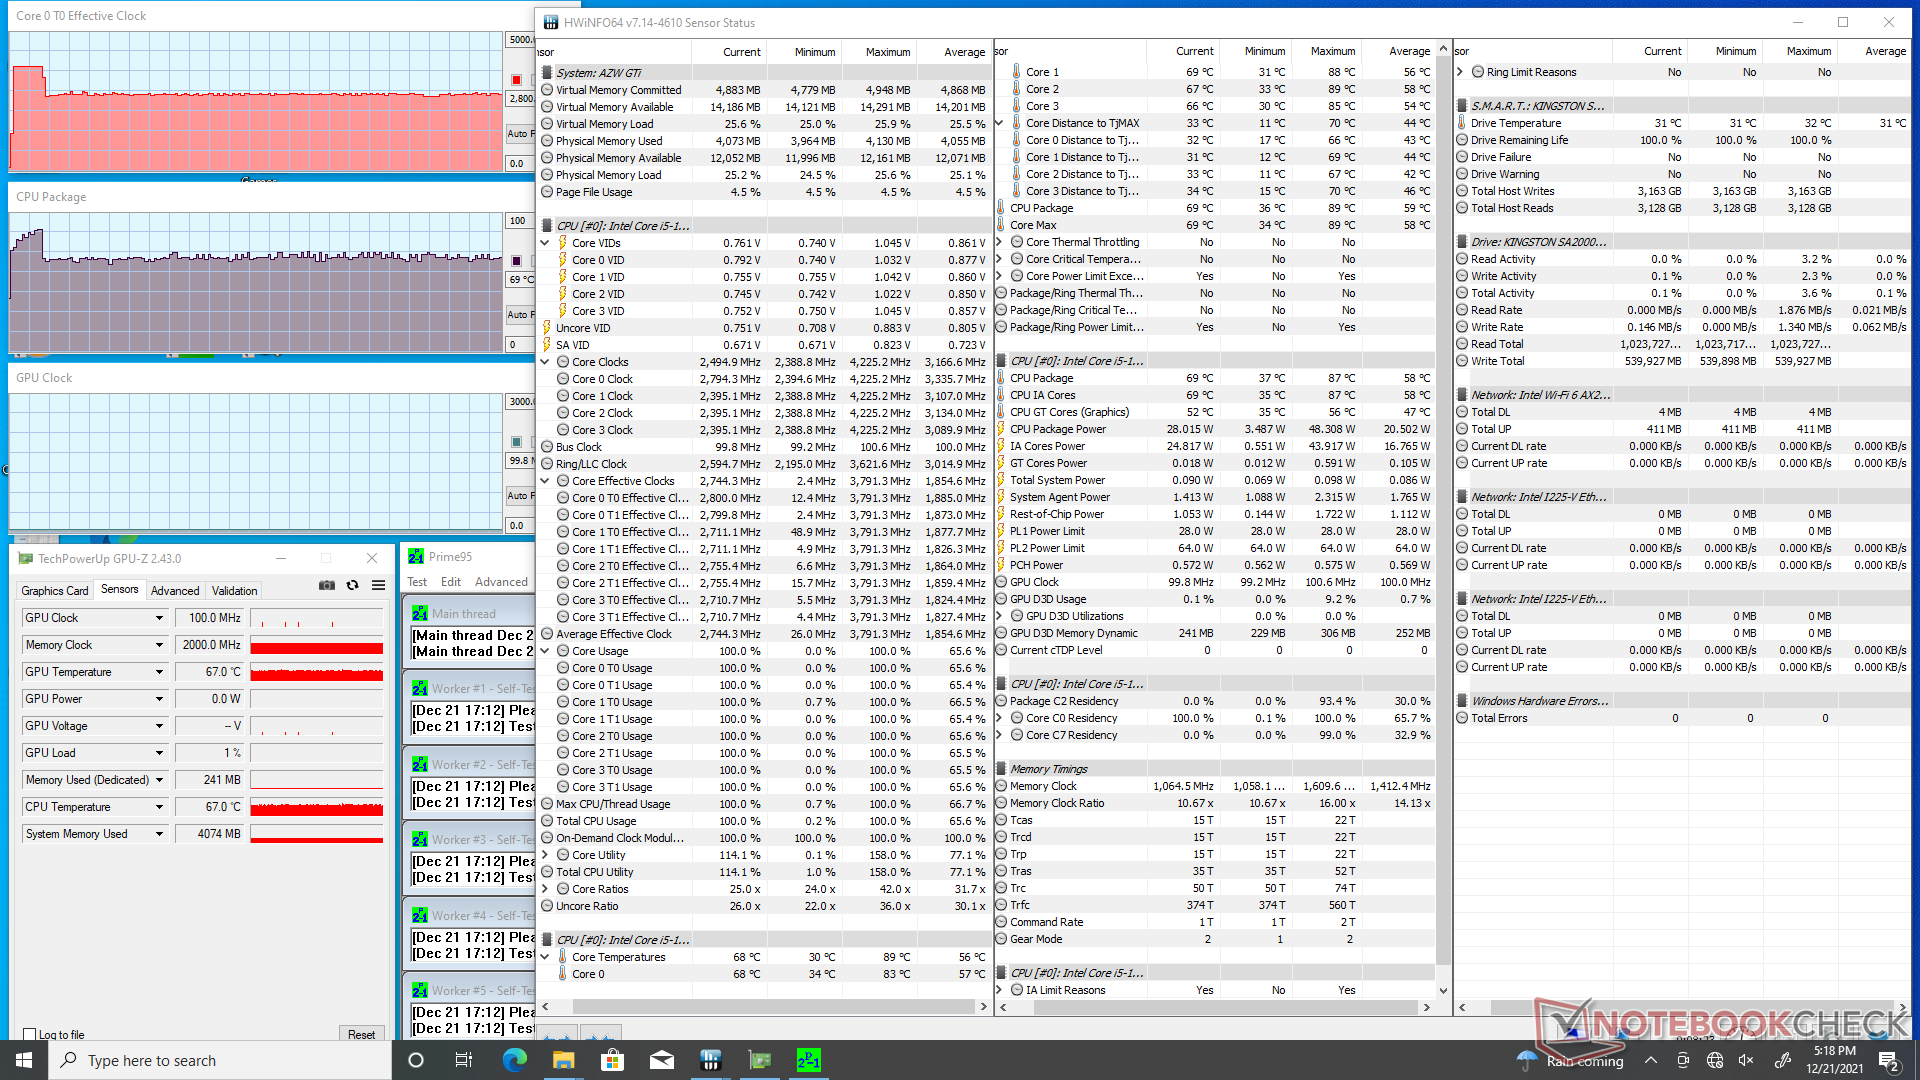
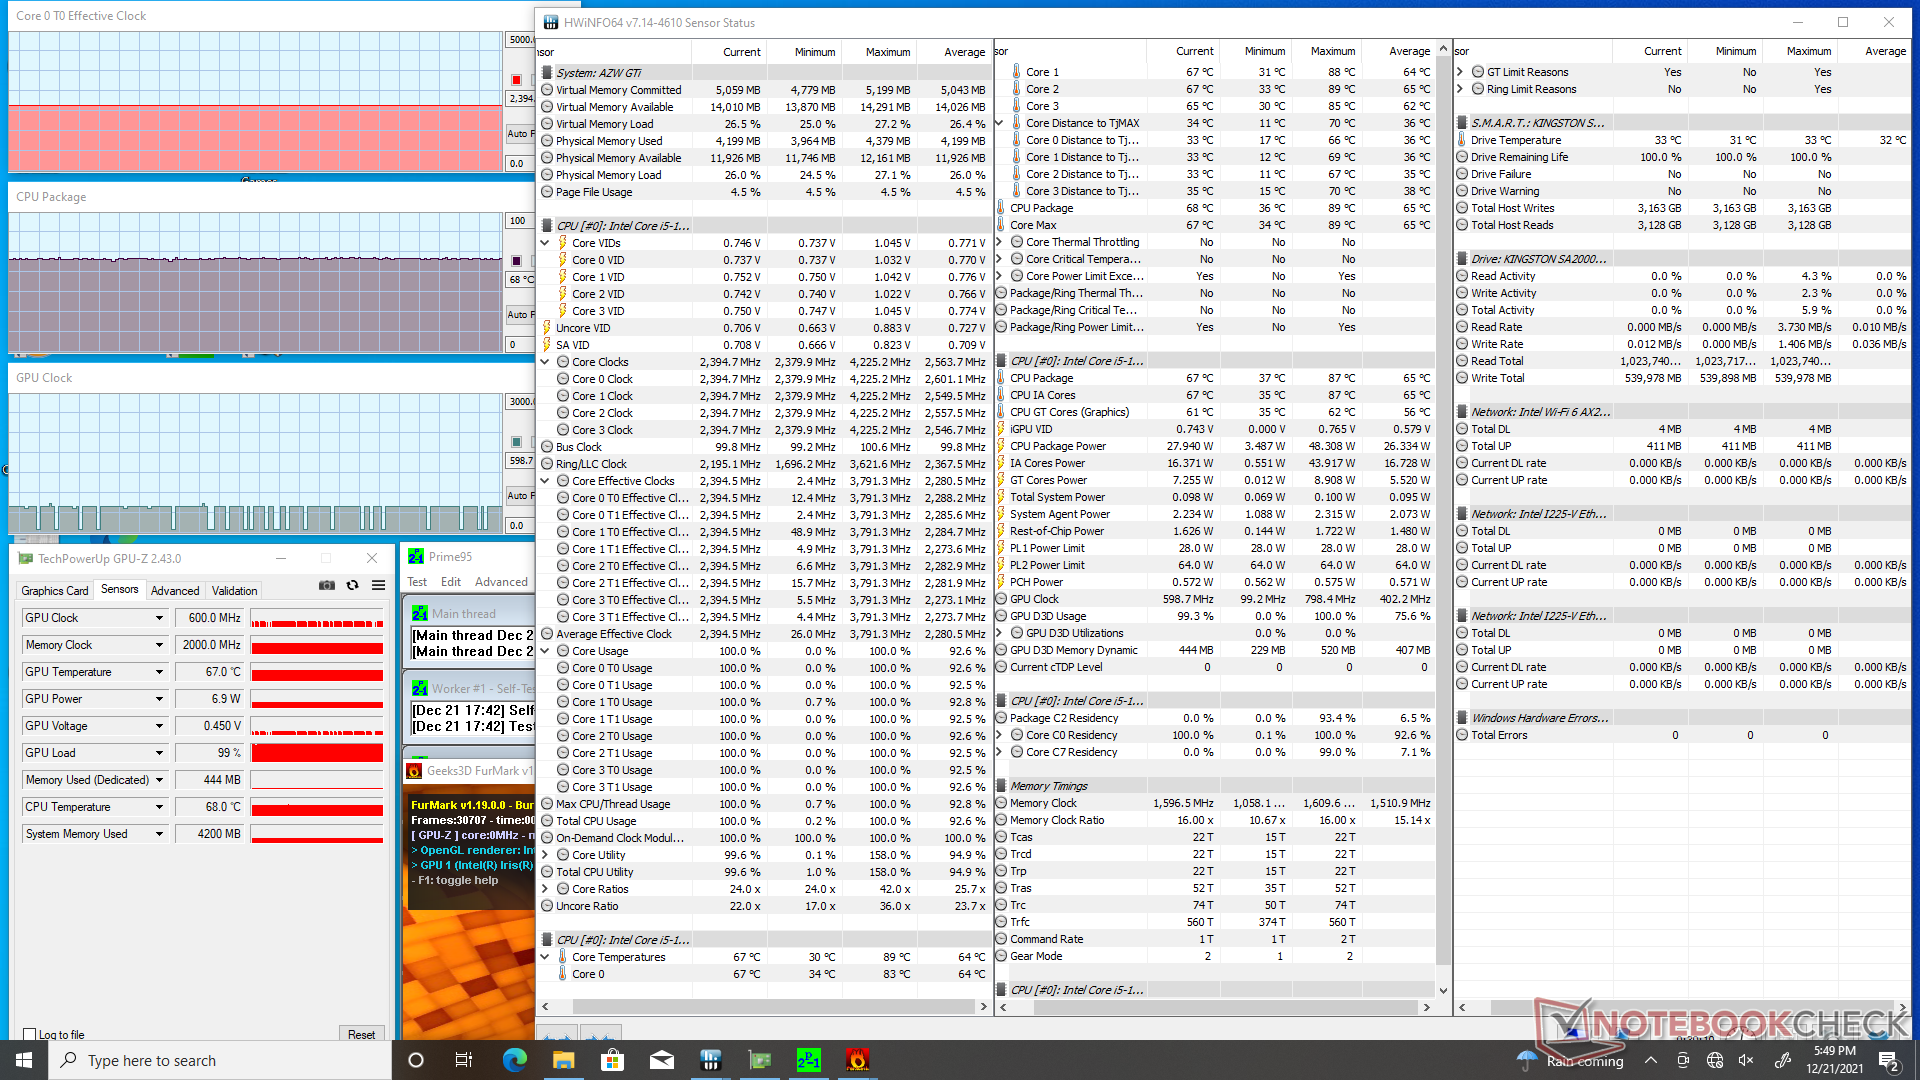
| CPU时钟(GHz) | GPU时钟(MHz) | CPU平均温度(℃) | |
| 系统空闲 | -- | -- | 39 |
| Prime95压力 | 2.8 | -- | 70 |
| Prime95 + FurMark压力 | 2.4 | 100 - 600 | 68 |
| Witcher 3 Stress | 1.6 | 1300 | 64 |
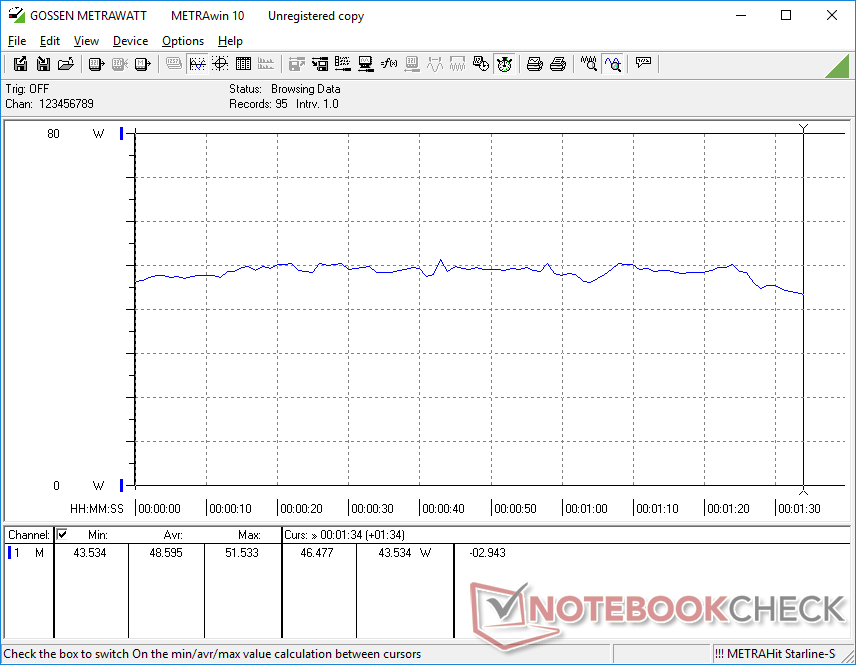
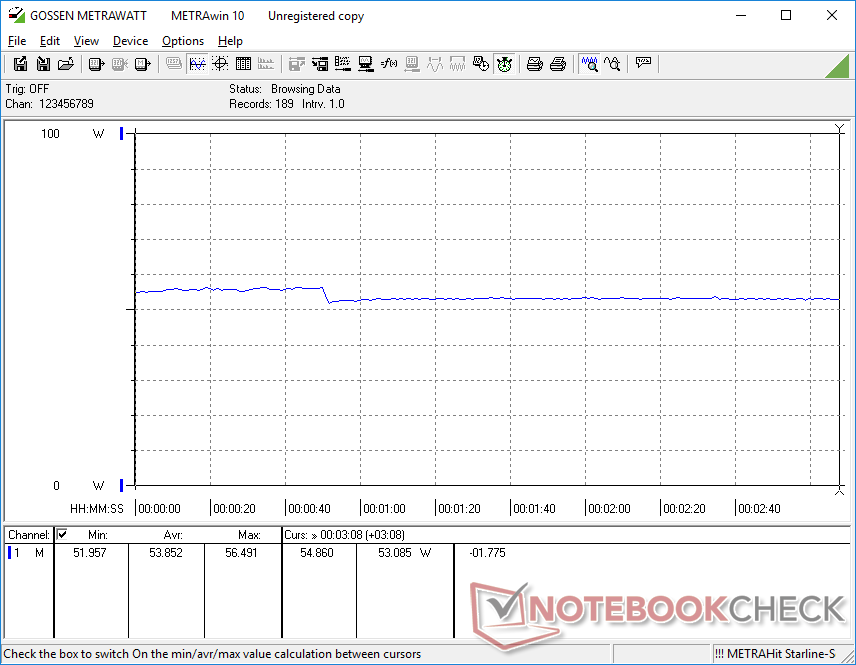
能源管理
消耗功率
总体功耗比预期的要高。例如,英特尔NUC11TNKi5采用完全相同的CPU,在所有测试条件下,与我们的Beelink设备相比,需要的功率要低几瓦。与使用相同Core i5-1135G7 CPU的普通PC相比,Beelink的CPU和GPU性能更快,这可能是其更高的功耗的原因。
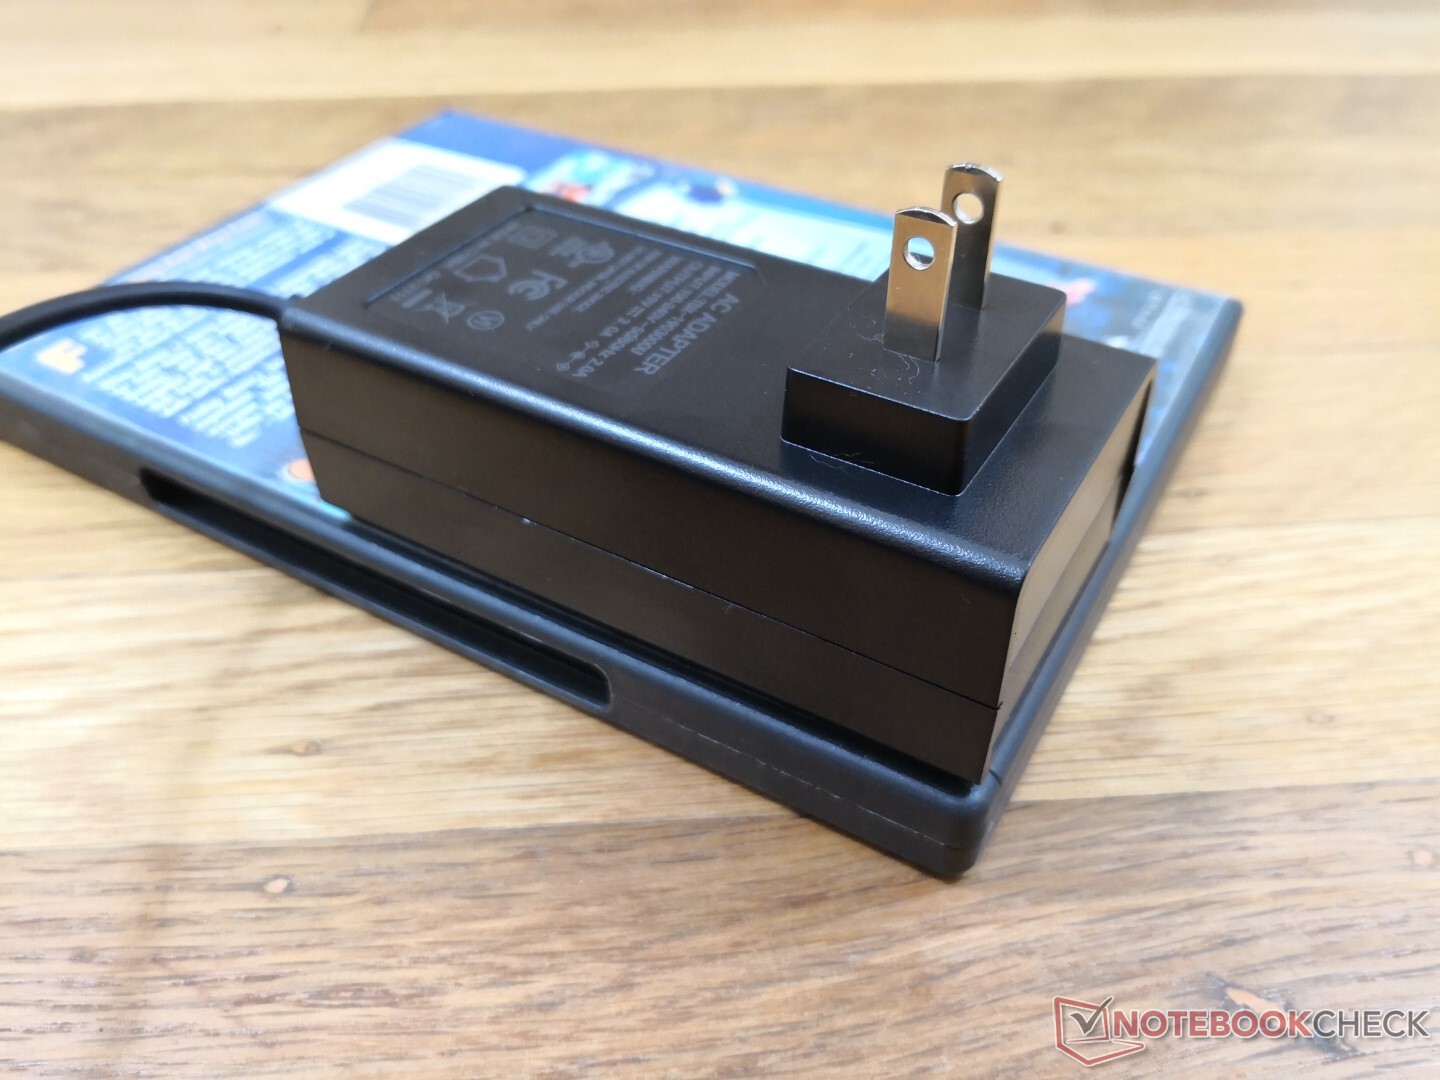
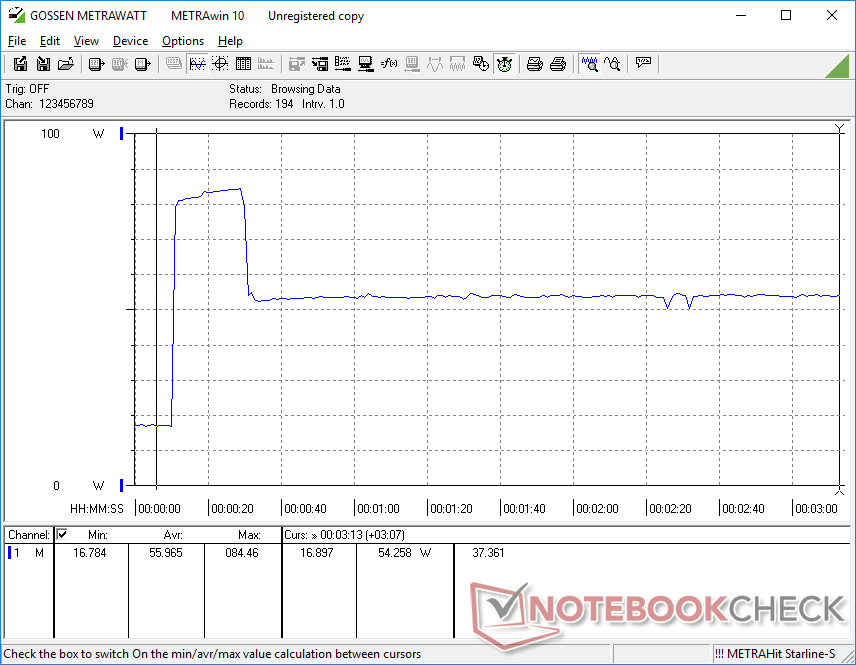
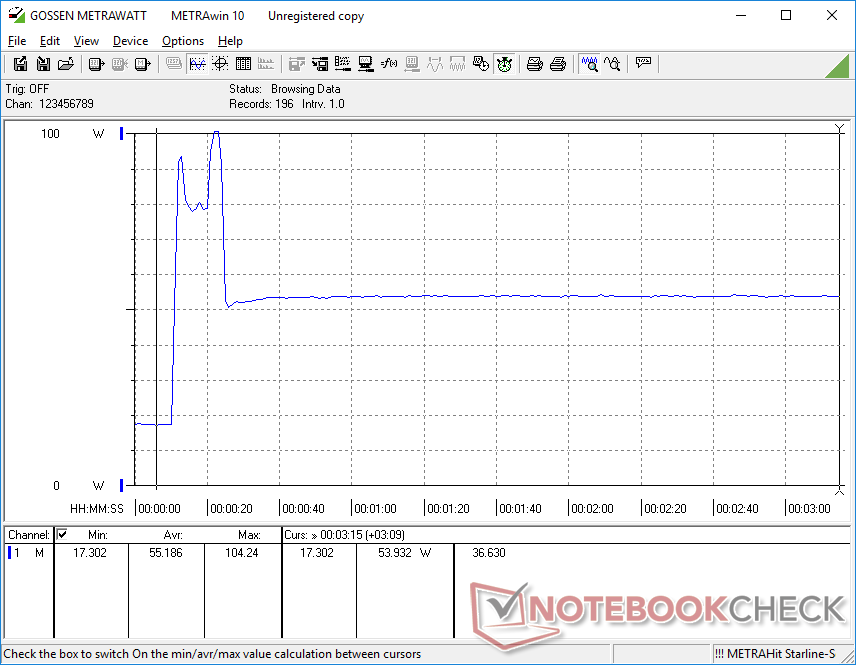
在运行Prime95时,我们能够从中小型(约9.8 x 5 x 3.4厘米)的57 W(19 V,3A)交流适配器测量到104 W的临时最大功耗。这个峰值持续了大约20秒,最终下降并稳定在56瓦,正如我们下面的图表所示。
| Off / Standby | |
| Idle | |
| Load |
|
Key:
min: | |
| Beelink GTI 11 i5-1135G7, Iris Xe G7 80EUs, Kingston SA2000M8500G, , x, | Beelink SER3 R7 3750H, Vega 10, GSemi AZW GSDFN512TS3F1OGCX, , x, | Intel NUC11TNKi5 i5-1135G7, Iris Xe G7 80EUs, Transcend M.2 SSD 430S TS512GMTS430S, , x, | Intel NUC10i7FNH i7-10710U, UHD Graphics 620, Kingston RBUSNS8154P3256GJ1, , 0x0, 0" | GMK NucBox 2 i5-8259U, Iris Plus Graphics 655, Netac S930E8/256GPN, , x, | Intel Hades Canyon NUC8i7HVK i7-8809G, Vega M GH, Intel Optane 120 GB SSDPEK1W120GA, , x, | |
|---|---|---|---|---|---|---|
| Power Consumption | 45% | 22% | 33% | 45% | -45% | |
| Idle Minimum * (Watt) | 15.2 | 7 54% | 11.5 24% | 6.1 60% | 15.5 -2% | |
| Idle Average * (Watt) | 16 | 9.1 43% | 12.4 22% | 8.4 47% | 6.8 57% | 16.2 -1% |
| Idle Maximum * (Watt) | 16 | 9.7 39% | 12.9 19% | 7.3 54% | 16.5 -3% | |
| Load Average * (Watt) | 48.6 | 29.5 39% | 40.7 16% | 46.3 5% | 83.4 -72% | |
| Witcher 3 ultra * (Watt) | 53.8 | 32.5 40% | 43.9 18% | 121.7 -126% | ||
| Load Maximum * (Watt) | 104.3 | 48.7 53% | 73.5 30% | 86 18% | 50.7 51% | 173.5 -66% |
* ... smaller is better
Power Consumption Witcher 3 / Stresstest
Power Consumption external Monitor
Pros
Cons
结论 - 像英特尔NUC,但价格更合理
Beelink GTI 11是非常引人注目的。以600至700美元的价格,用户可以得到完整的软件包,包括内存、存储和Windows 10 Pro,而英特尔NUC 11则是一个完整的软件包。 英特尔NUC 11而英特尔NUC 11采用相同的CPU,作为一个裸机套件,价格几乎为600美元。因此,你将在英特尔NUC上花费近800美元,只是为了匹配Beelink的规格。它可以支持Thunderbolt 4配件、Wi-Fi 6和最多三个内部固态硬盘的事实意味着用户在转向Beelink时不必放弃许多重要功能。
需要记住的主要缺点是GTI 11的风扇噪音行为不佳。风扇转速经常变化,而且似乎没有任何理由,很明显。与大多数英特尔NUC型号相比,预计该系统总体上会更响亮。
价格和可用性
亚马逊 目前正在以699美元的价格出售我们的GTI 11的确切配置。销售可能会使价格下降40美元或更多。用户还可以从Banggood购买 购买,价格为609美元。
Price comparison

