英特尔酷睿i5-1155G7首次亮相。VAIO SX12笔记本电脑评测
在13至15英寸范围内有很多超极本可供选择。然而,一旦你下移到12英寸或更小,选择就会变得更加狭窄,特别是如果你想要一台标准的蛤壳式笔记本电脑,并采用与大机型相同的酷睿U系列处理器。Vaio SX12是少数配备第11代英特尔Tiger Lake-U系列CPU的12.5英寸笔记本电脑之一,其性能水平更类似于成熟的超极本,而不是典型的次笔记本。
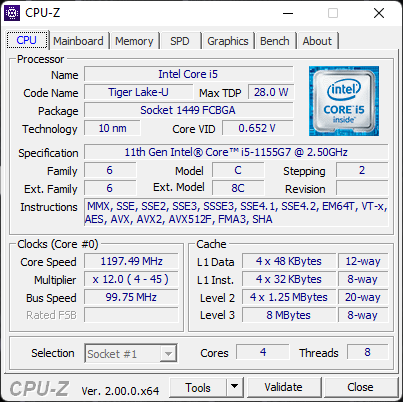
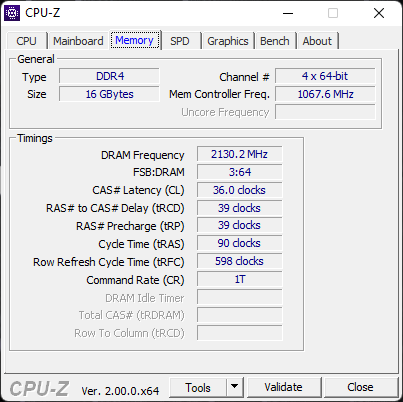
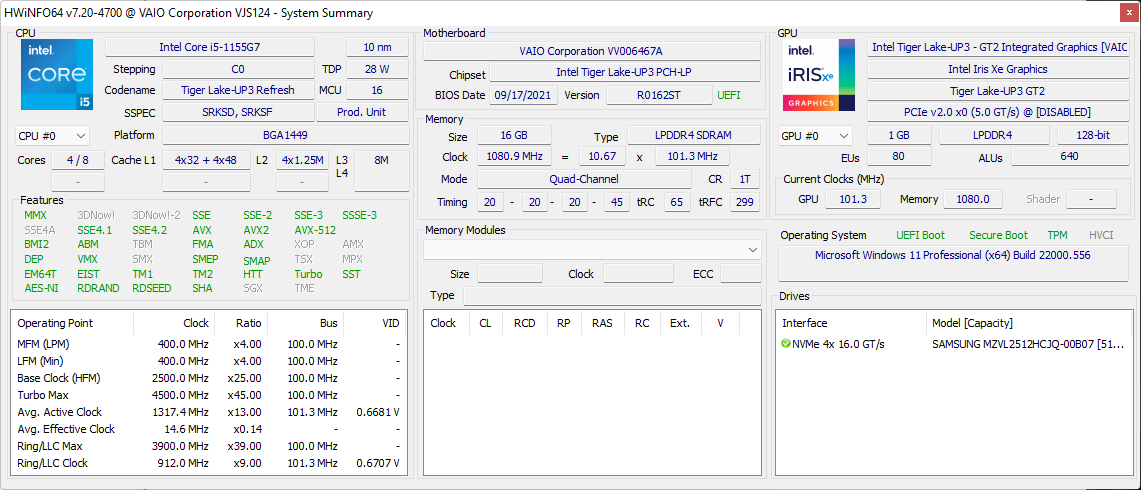
我们审查的配置包括Core i5-1155G7 CPU和512GB NVMe SSE,零售价约为1300美元。用户可以配置更高端的酷睿i7-1195G7和1TB存储,但所有配置都没有独立显卡和相同的16GB LPDDR4x-4266内存和1080p非触摸IPS显示屏。SX12的替代品不多,因为12英寸的副笔记本并不常见,但Surface Laptop Go,Lenovo ThinkPad A285, 或Dell latitude 5200系列 ,可以看作是竞争对手。
更多Vaio评论。
潜在的竞争对手比较
Rating | Date | Model | Weight | Height | Size | Resolution | Price |
|---|---|---|---|---|---|---|---|
| 86.3 % v7 (old) | 04 / 2022 | VAIO SX12 VJS124X1011P i5-1155G7, Iris Xe G7 80EUs | 892 g | 17.8 mm | 12.50" | 1920x1080 | |
| 84 % v6 (old) | 05 / 2019 | VAIO A12-92993 i7-8500Y, UHD Graphics 615 | 1.1 kg | 24 mm | 12.50" | 1920x1080 | |
| 87.2 % v7 (old) | 11 / 2021 | VAIO SX14 VJS144X0111K i7-1195G7, Iris Xe G7 96EUs | 1.1 kg | 17.9 mm | 14.00" | 1920x1080 | |
| 85.3 % v7 (old) | 03 / 2022 | Huawei MateBook E Core i5 i5-1130G7, Iris Xe G7 80EUs | 719 g | 7.99 mm | 12.60" | 2560x1600 | |
| 89.1 % v7 (old) | Dell Latitude 7200 i5-8365U, UHD Graphics 620 | 1.2 kg | 9.35 mm | 12.30" | 1920x1280 | ||
| 88.1 % v7 (old) | 12 / 2020 | Dell XPS 13 9310 Core i7 FHD i7-1165G7, Iris Xe G7 96EUs | 1.3 kg | 14.8 mm | 13.40" | 1920x1200 |
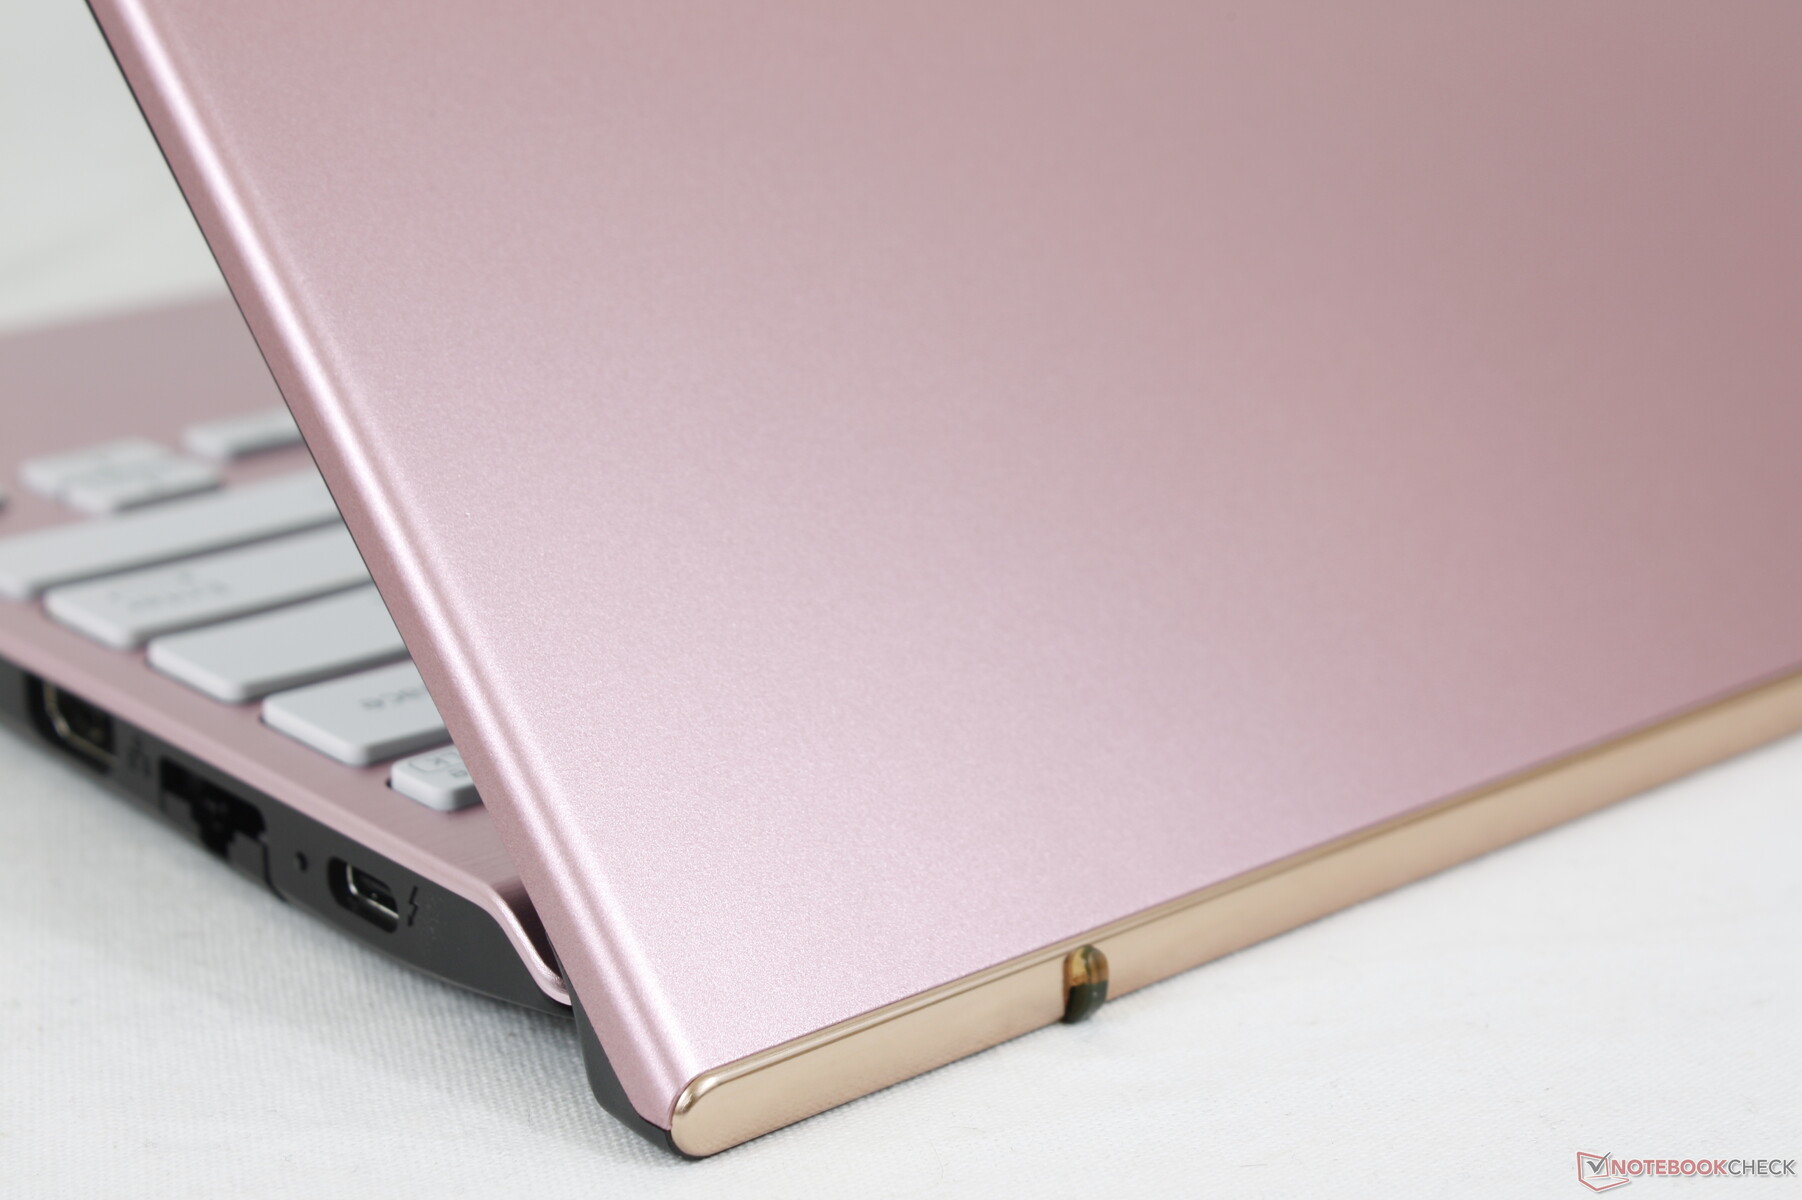
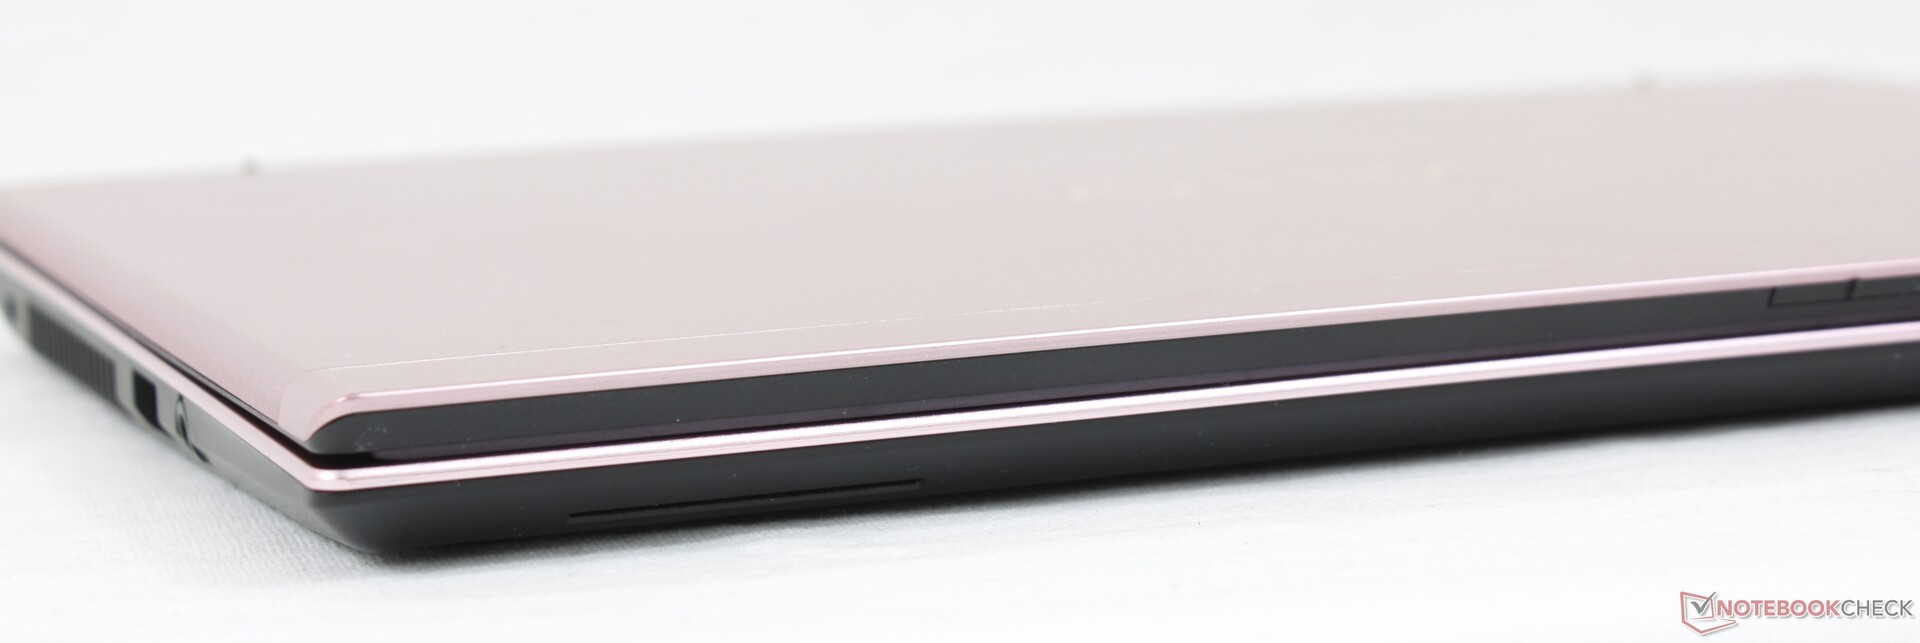
箱子 - 2磅以下
SX12采用了与SX14类似的薄金属材料,具有类似的外观和感觉。因此,该模型优先考虑低重量而不是底盘刚性,与Dynabook Portege X30L类似。 Dynabook Portege X30L,三星Galaxy Book Pro,或 LG Gram系列。例如,按压键盘中心或外盖,会导致它们的表面明显弯曲,比更重的 XPS 13或 雷蛇Blade Stealth.尤其是缺乏大猩猩玻璃加固的盖子。尽管如此,该模型的设计考虑到了这种弯曲,因此任何轻微的翘曲或扭曲都不一定会造成任何损害。即使它不像大多数其他高端超极本那样健全或不屈不挠,但它仍然感觉和看起来像一个豪华单位。
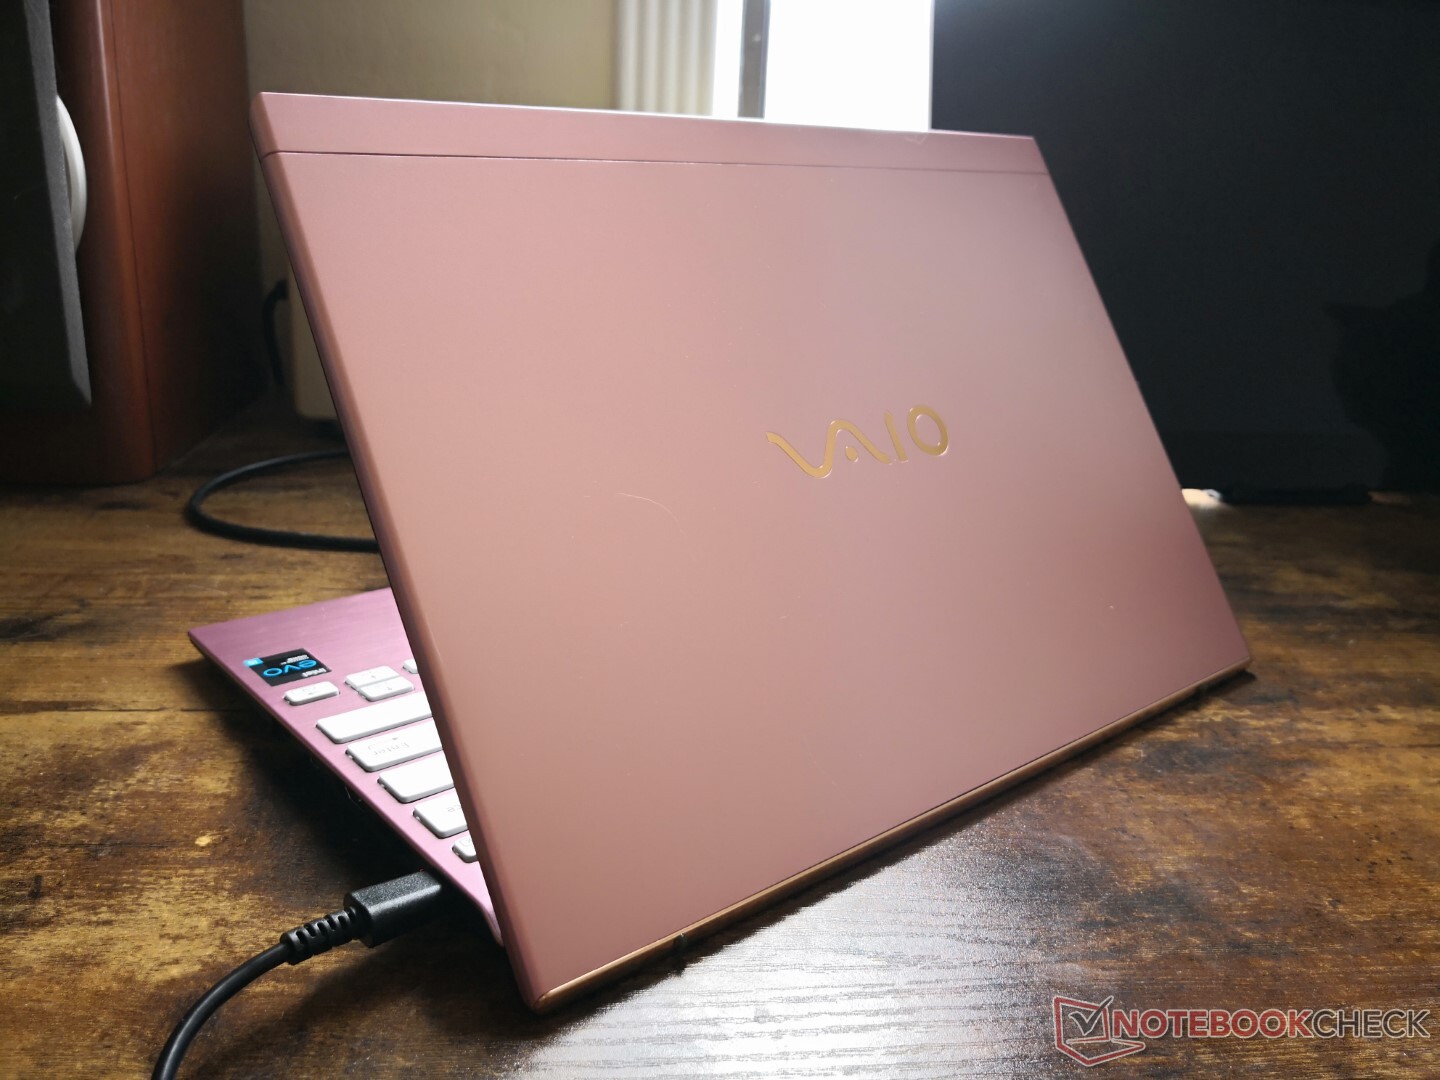
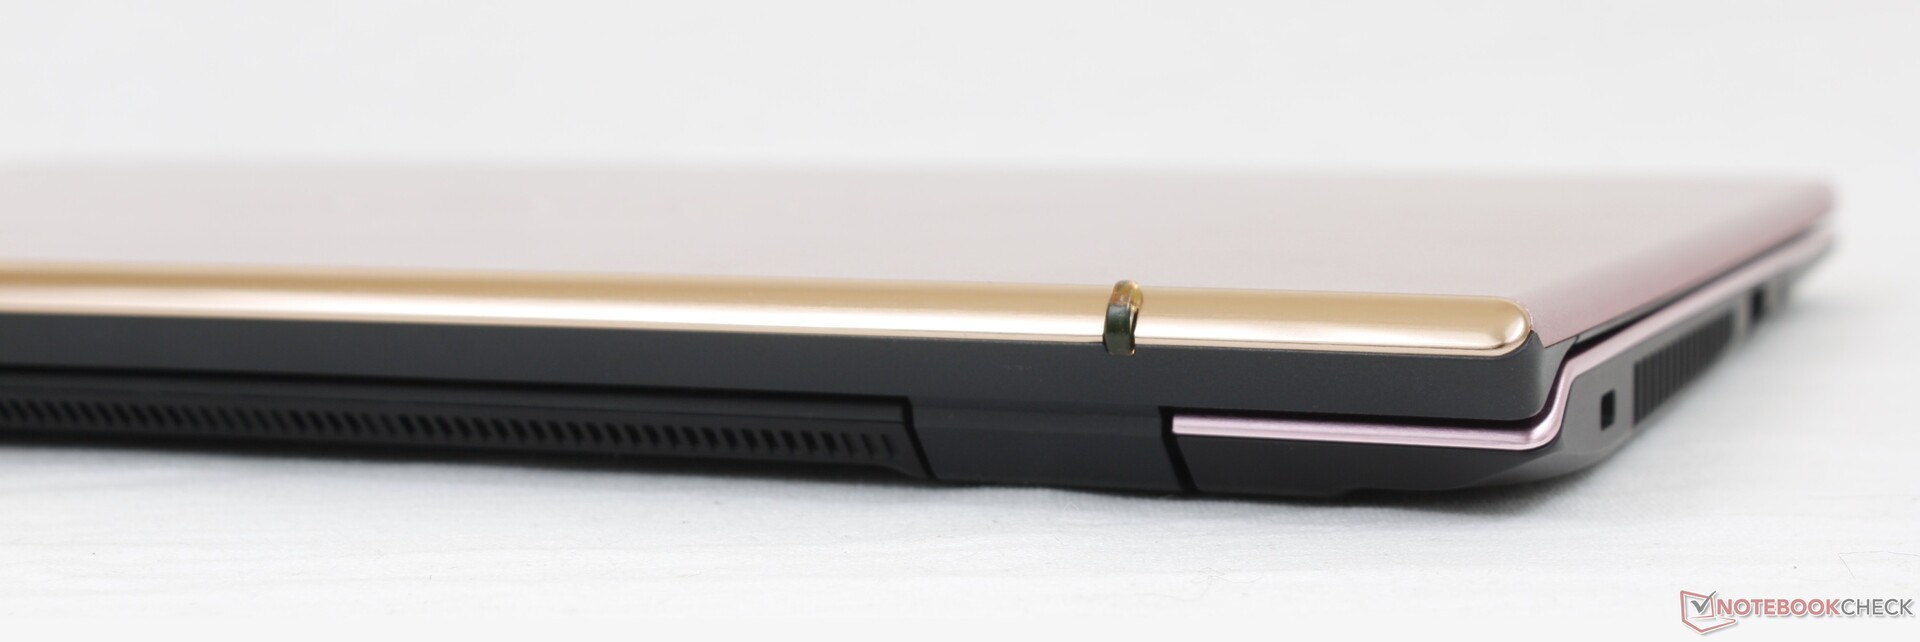
SX12的重量略低于900克,毫不奇怪,它比大多数其他笔记本电脑更便于携带。然而,它的整体尺寸比预期的要大,因为即使是XPS 13,尽管其13.3英寸的屏幕尺寸更大,但体积却更小。SX12的薄型底盘骨架可能是上述低重量和高易弯曲性的原因。
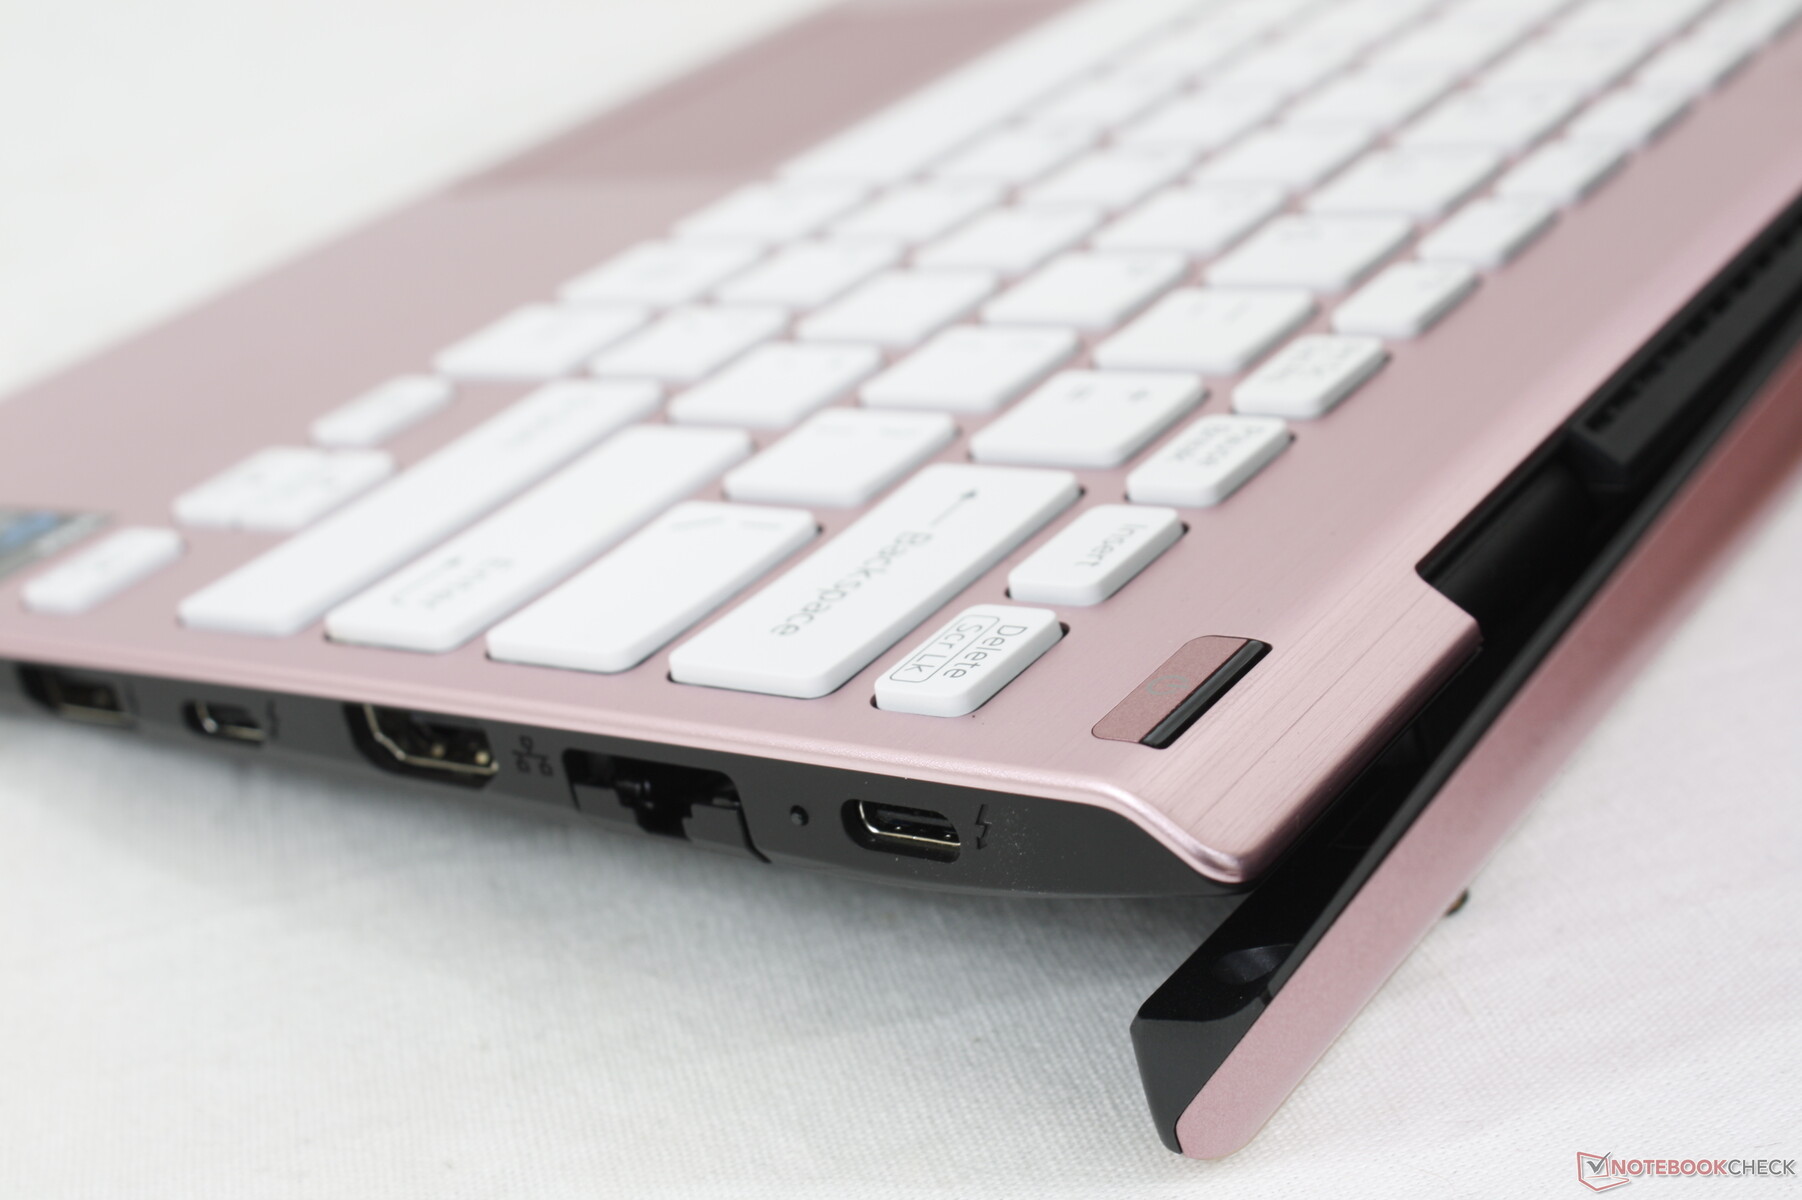
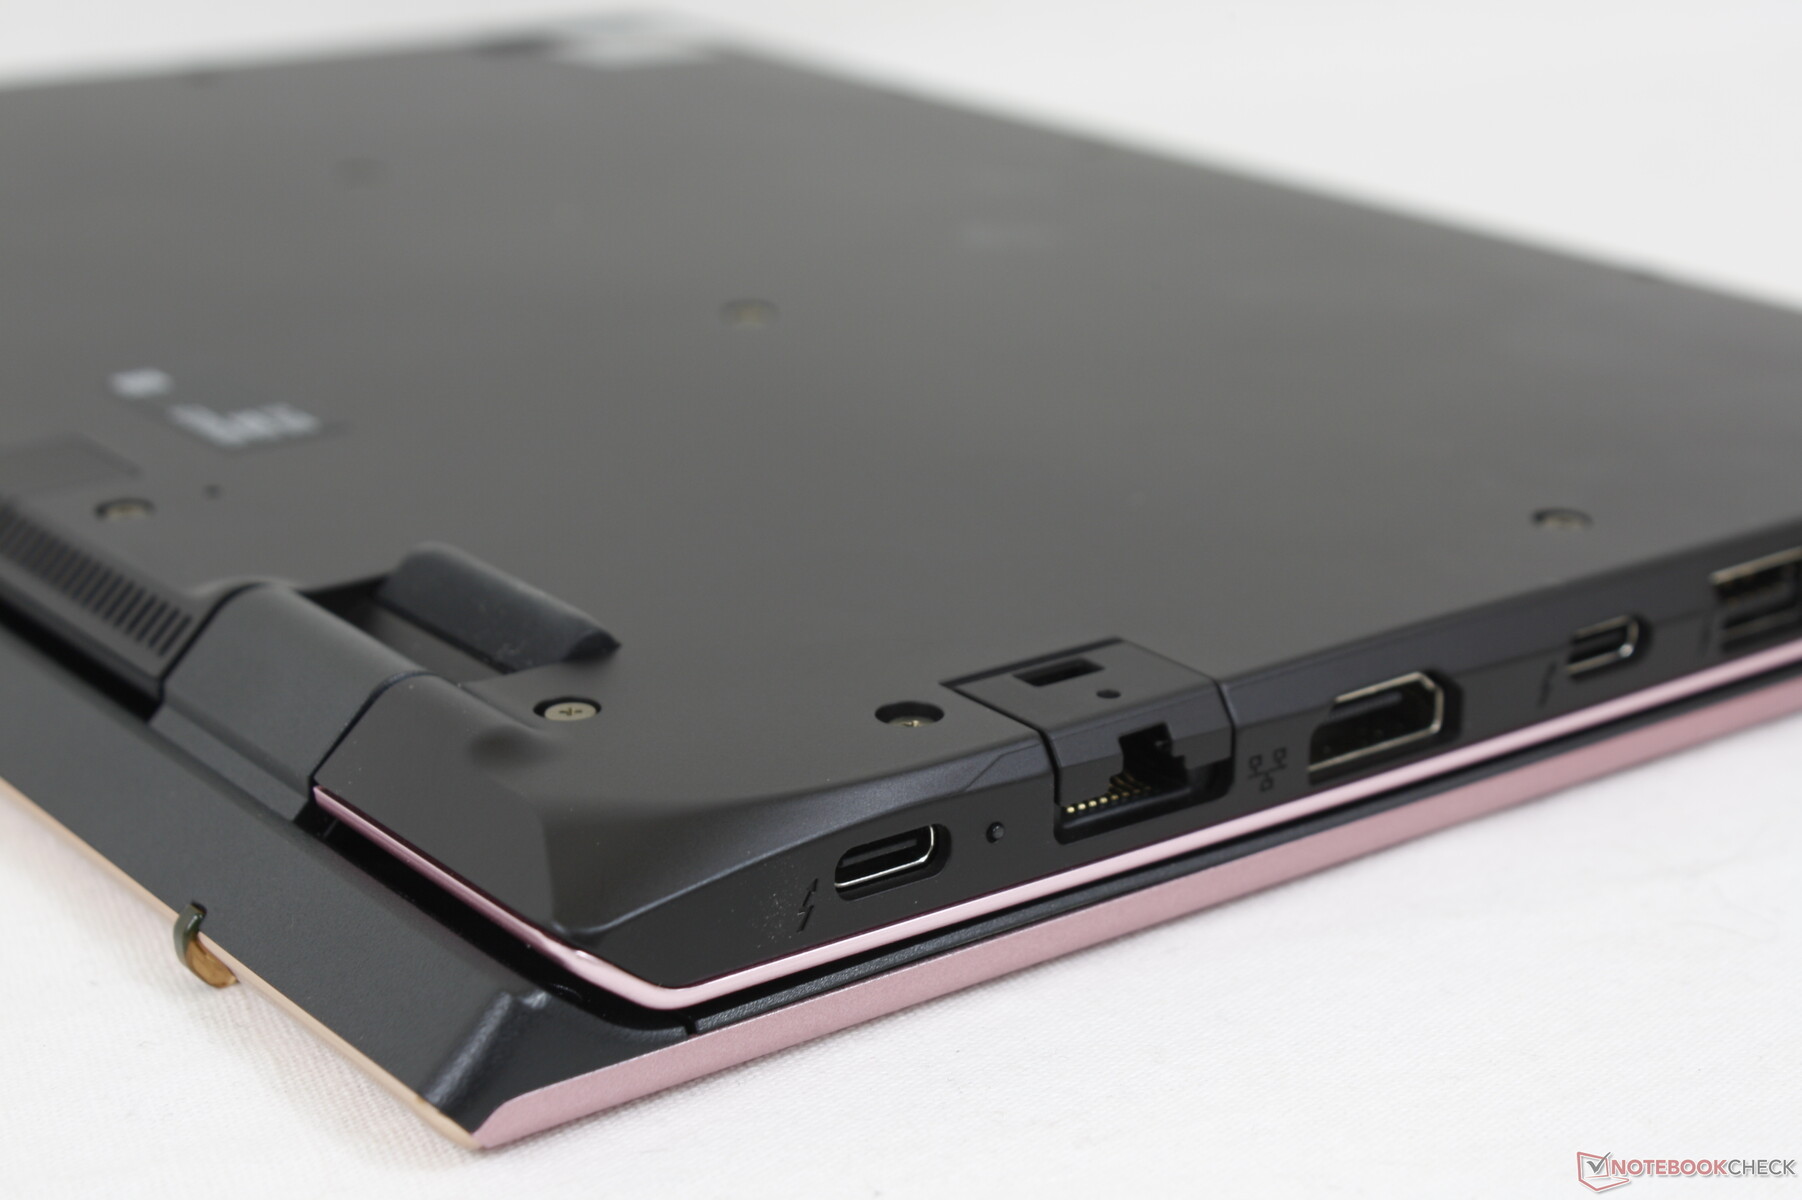
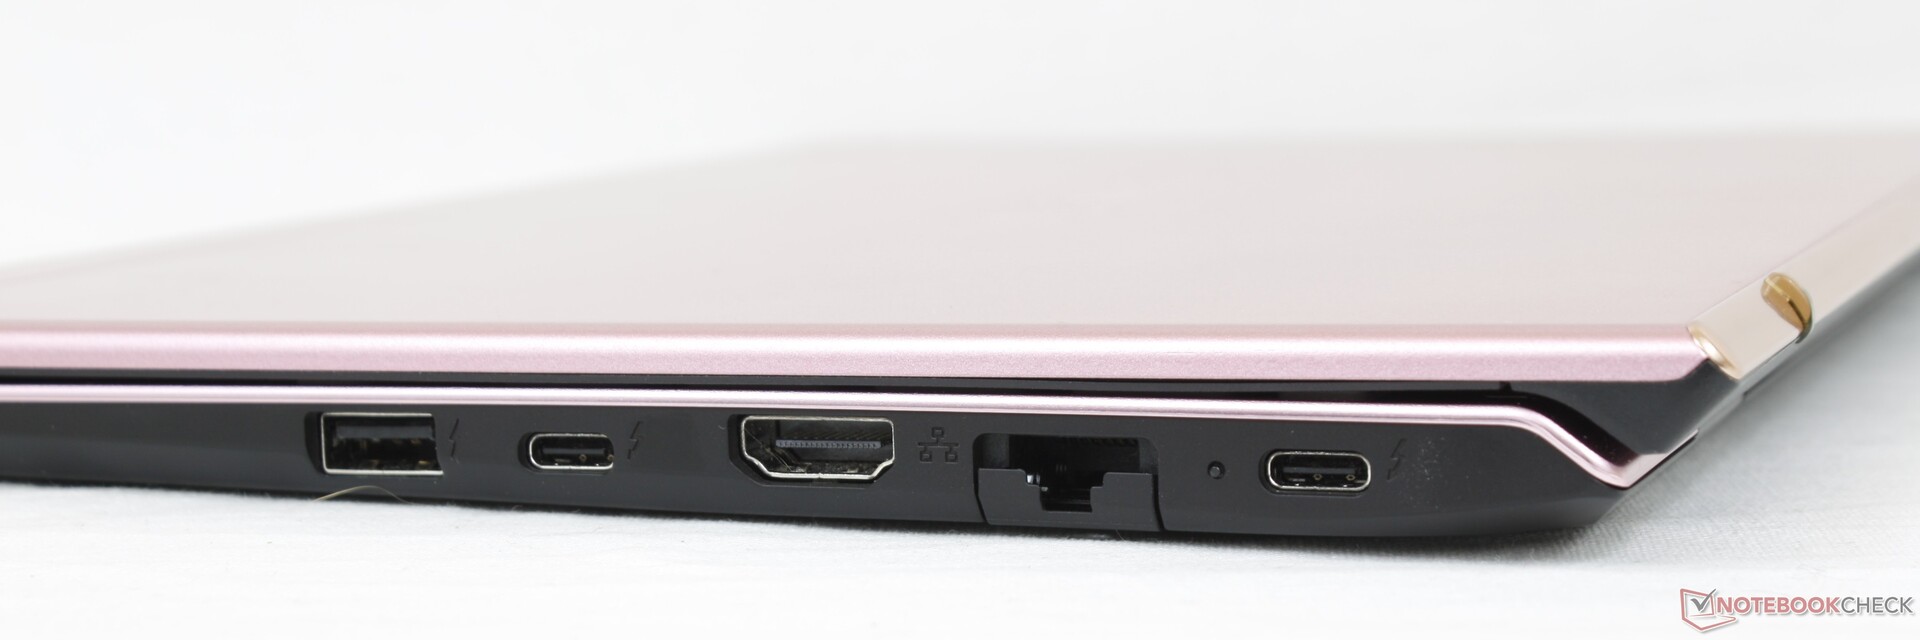
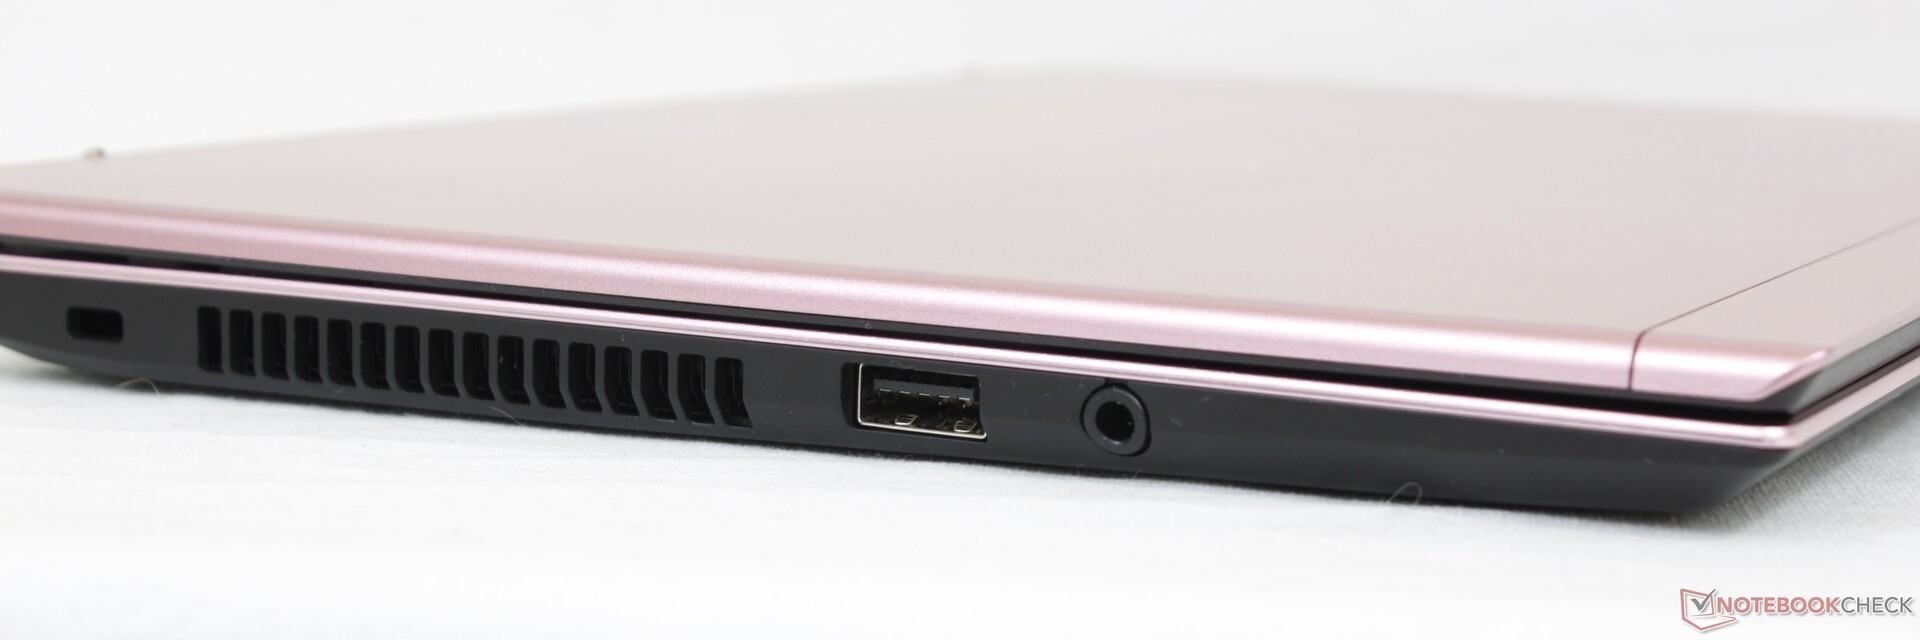
连接性 - 大量的选择
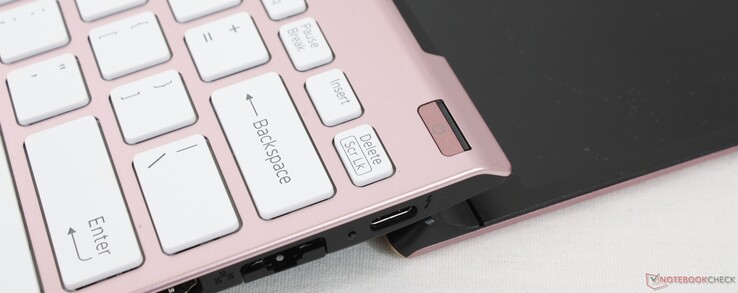
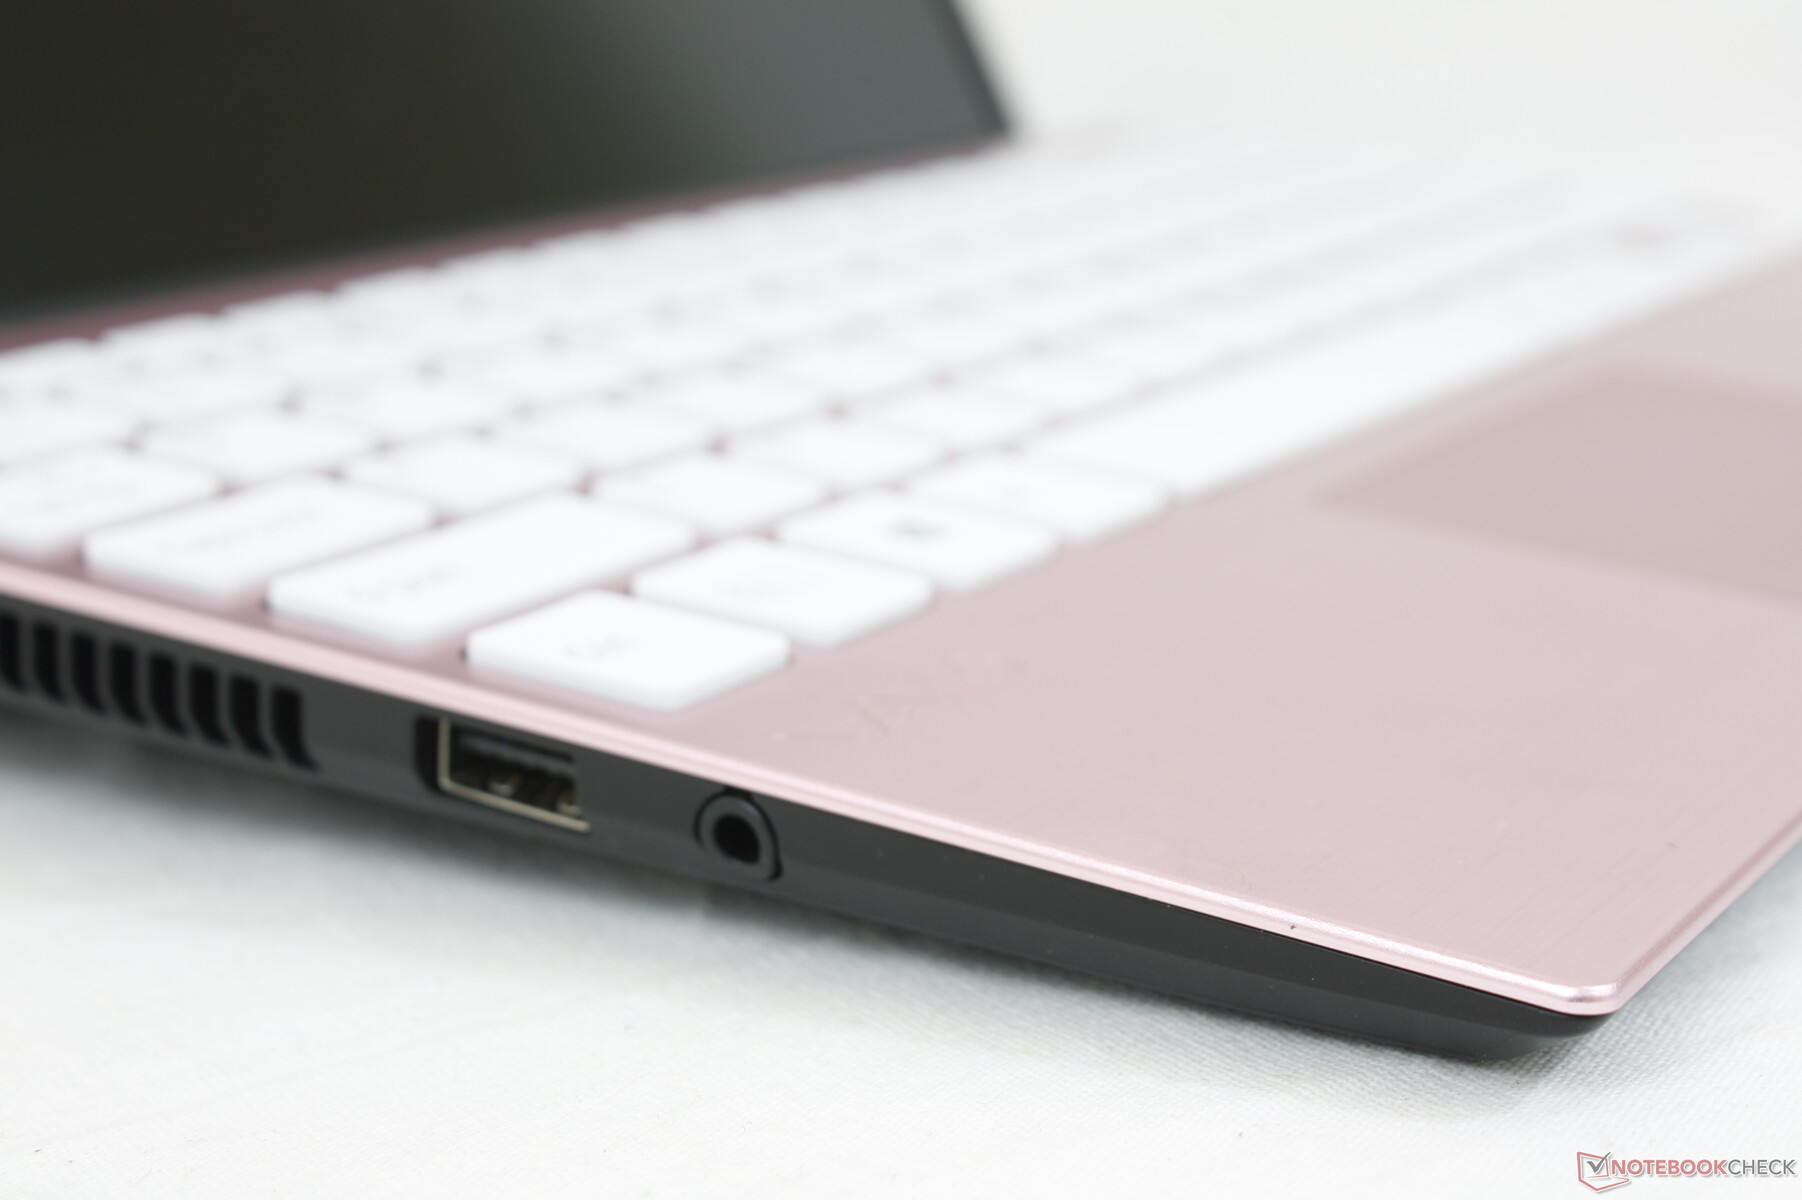
尽管它们的尺寸和重量不同,但端口选项与较大的SX14相同。该机型甚至还集成了一个RJ-45端口,这在如今的超极本上是非常罕见的。然而,大多数端口都位于右侧边缘,在使用外部鼠标时,由于所有突出的电缆,这可能是令人讨厌的。
沟通
| Networking | |
| iperf3 transmit AX12 | |
| Huawei MateBook E Core i5 | |
| VAIO SX12 VJS124X1011P | |
| VAIO SX14 VJS144X0111K | |
| Dell XPS 13 9310 Core i7 FHD | |
| VAIO A12-92993 | |
| Dell Latitude 7200 | |
| iperf3 receive AX12 | |
| VAIO SX12 VJS124X1011P | |
| Dell XPS 13 9310 Core i7 FHD | |
| Huawei MateBook E Core i5 | |
| VAIO SX14 VJS144X0111K | |
| Dell Latitude 7200 | |
| VAIO A12-92993 | |
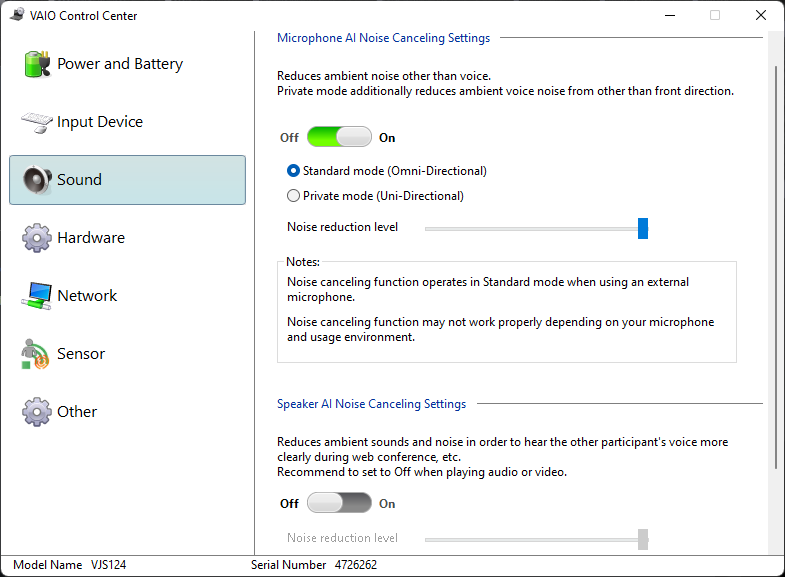
网络摄像头
集成的摄像头是1080p的,不像其他大多数笔记本电脑那样是720p的标准。红外线是支持Windows Hello的标准配置,而且还有一个物理隐私滑块快门。


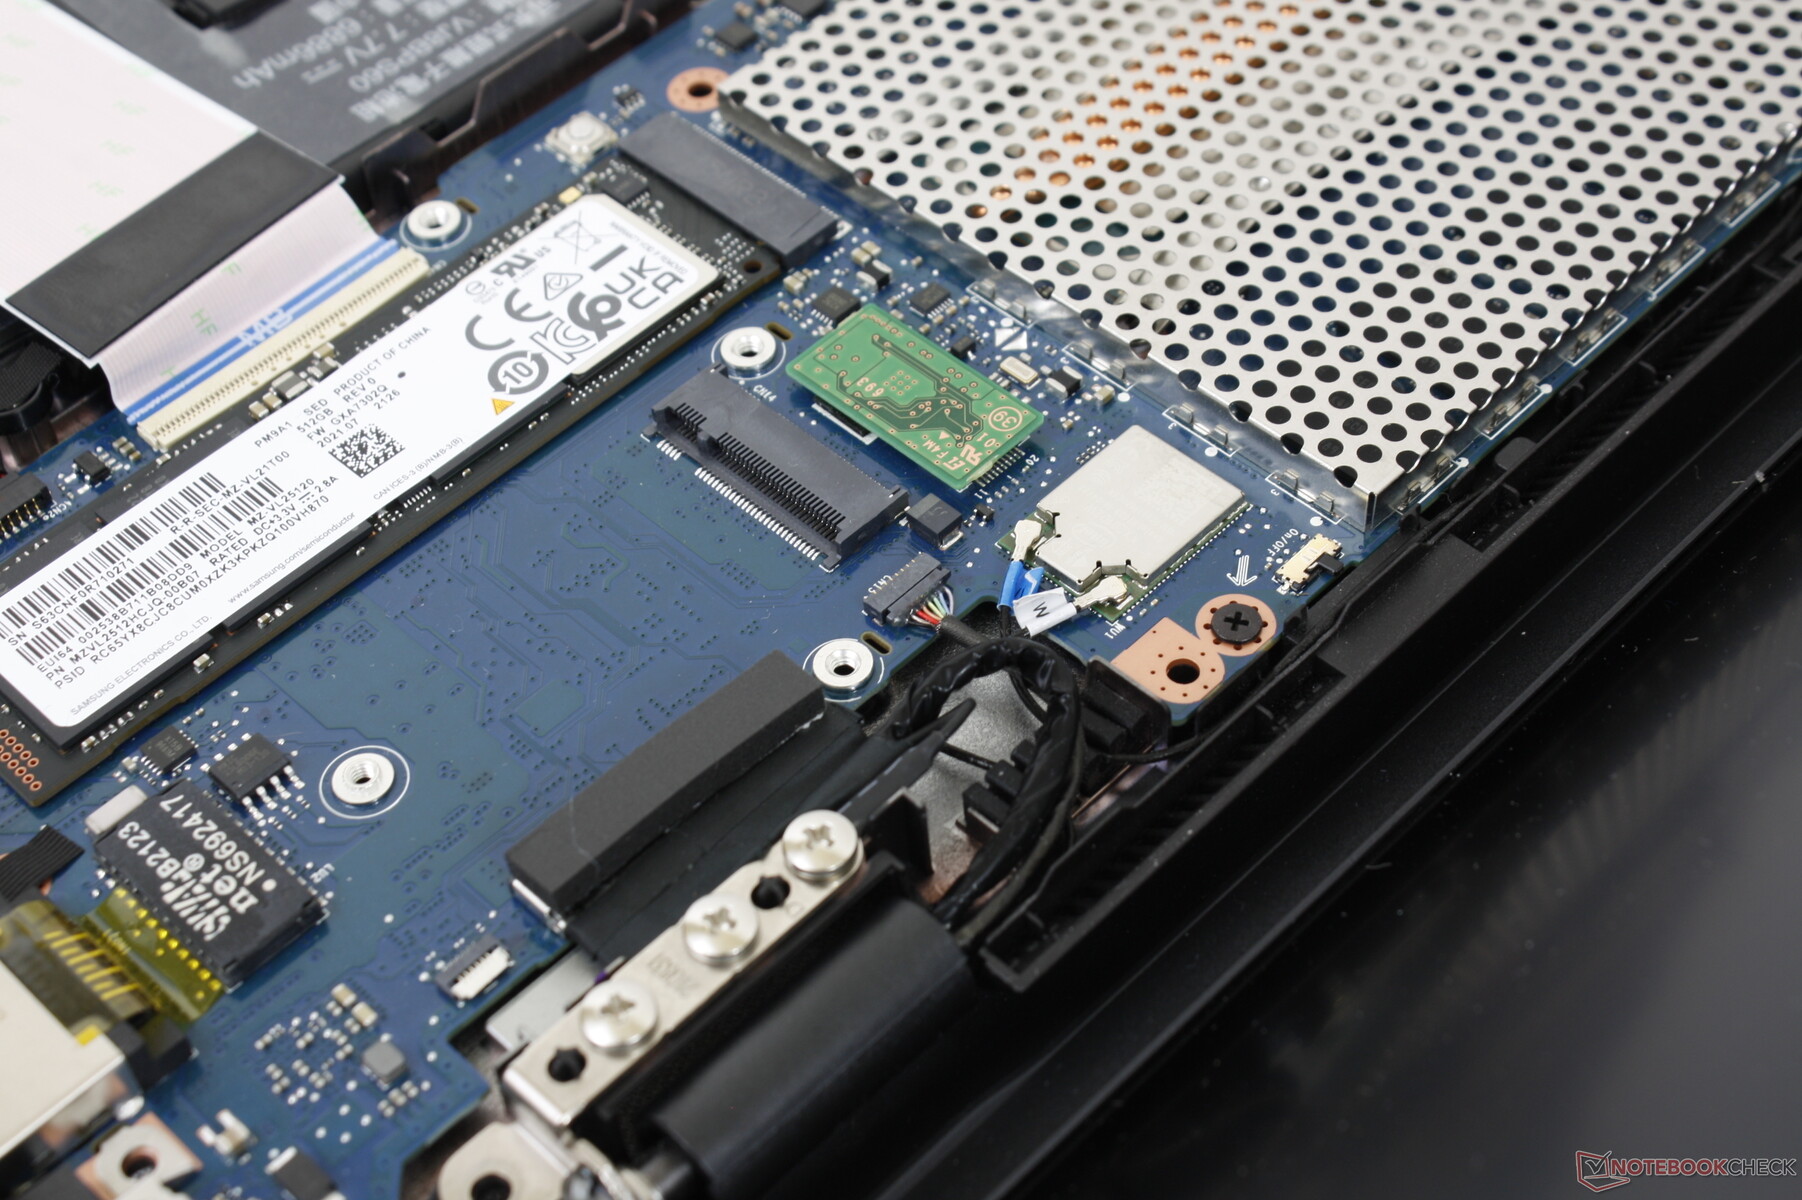
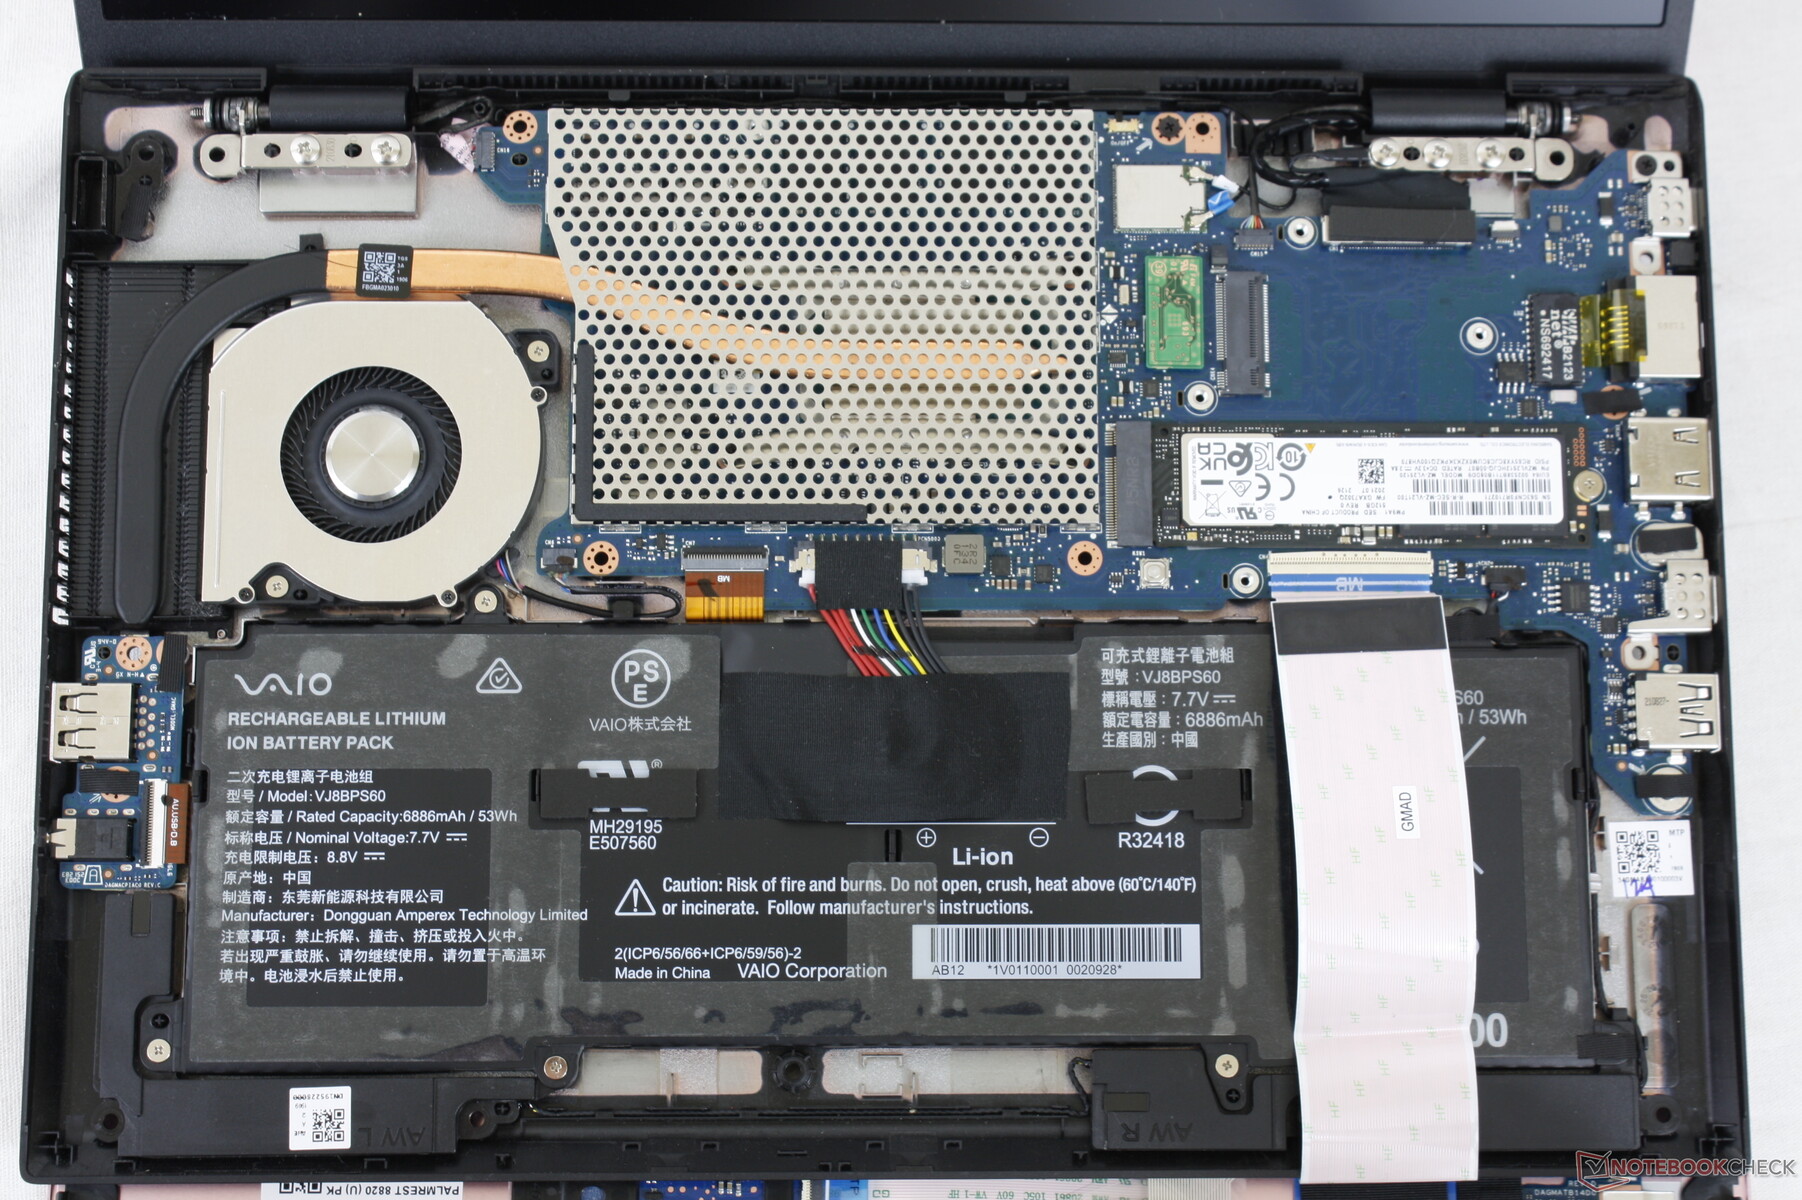
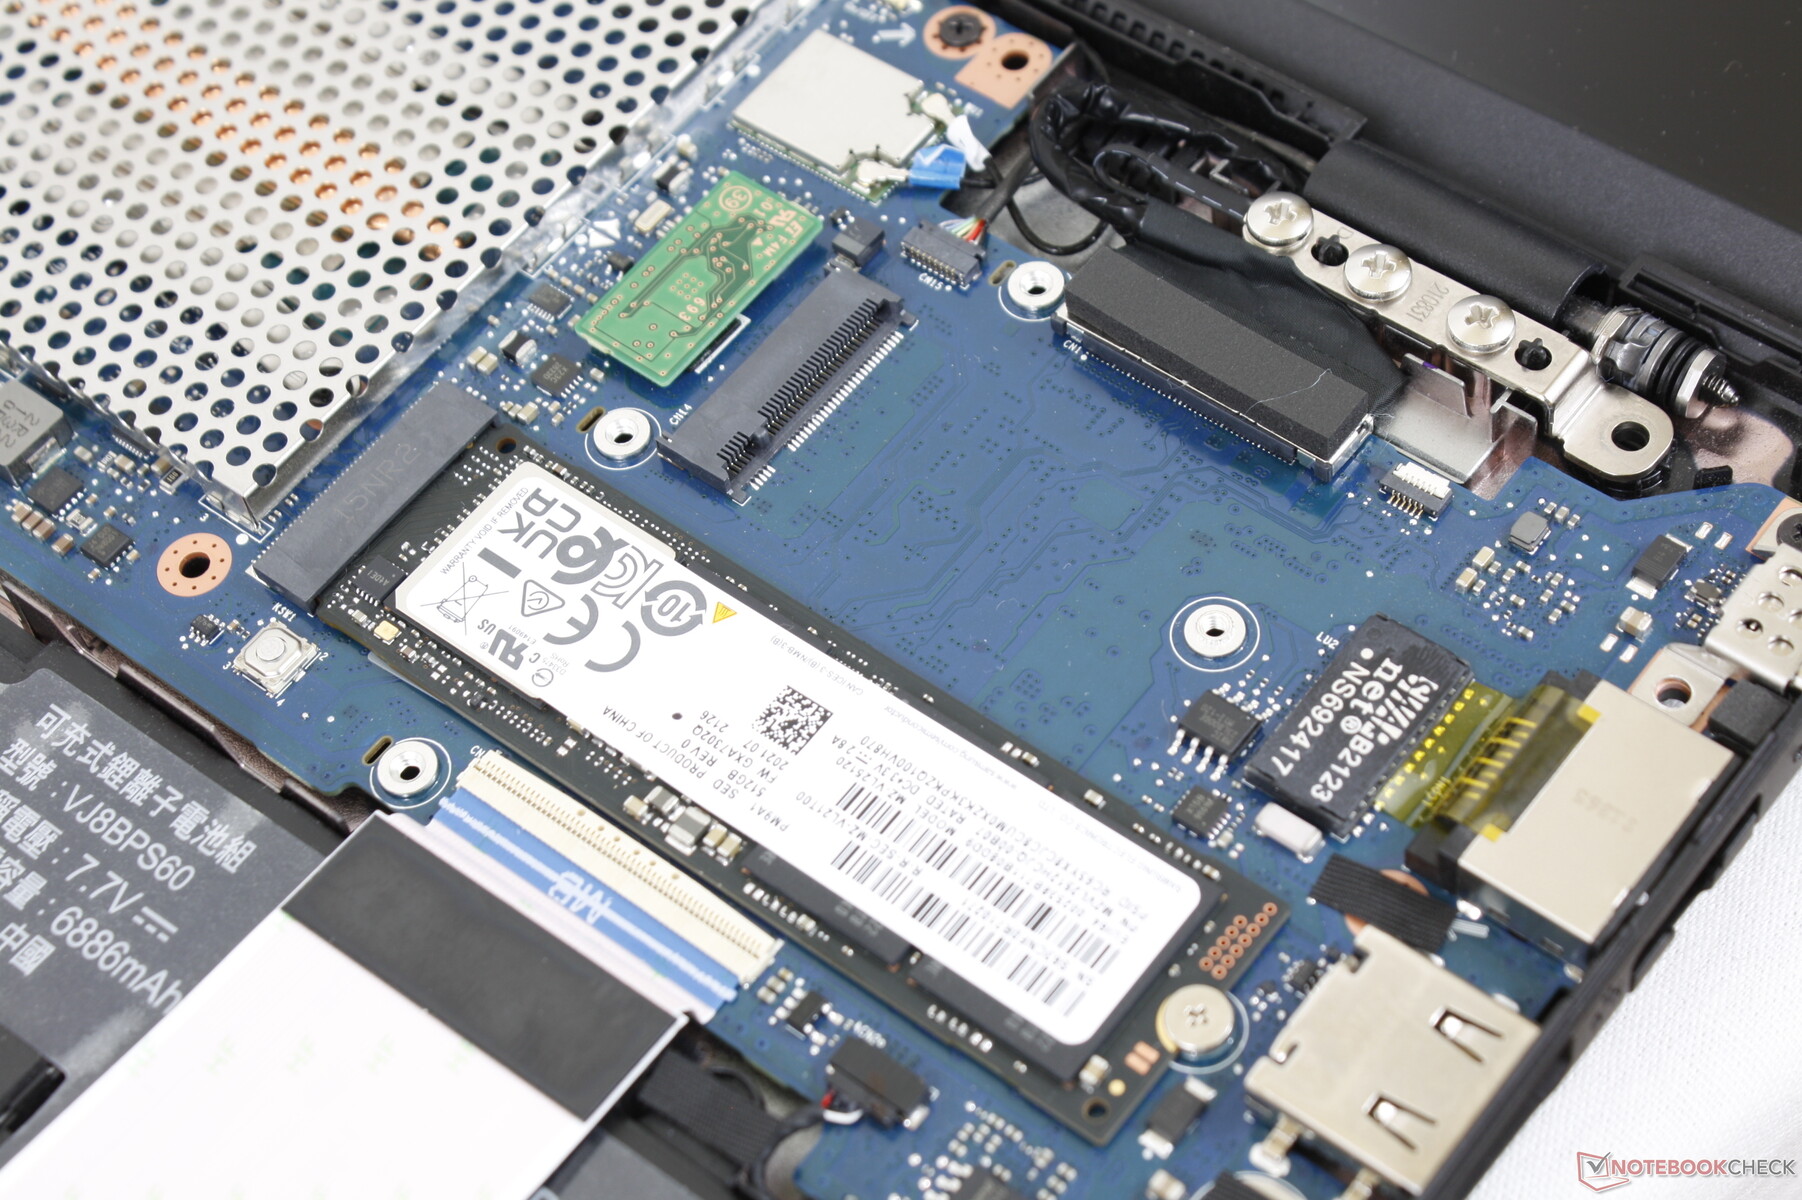
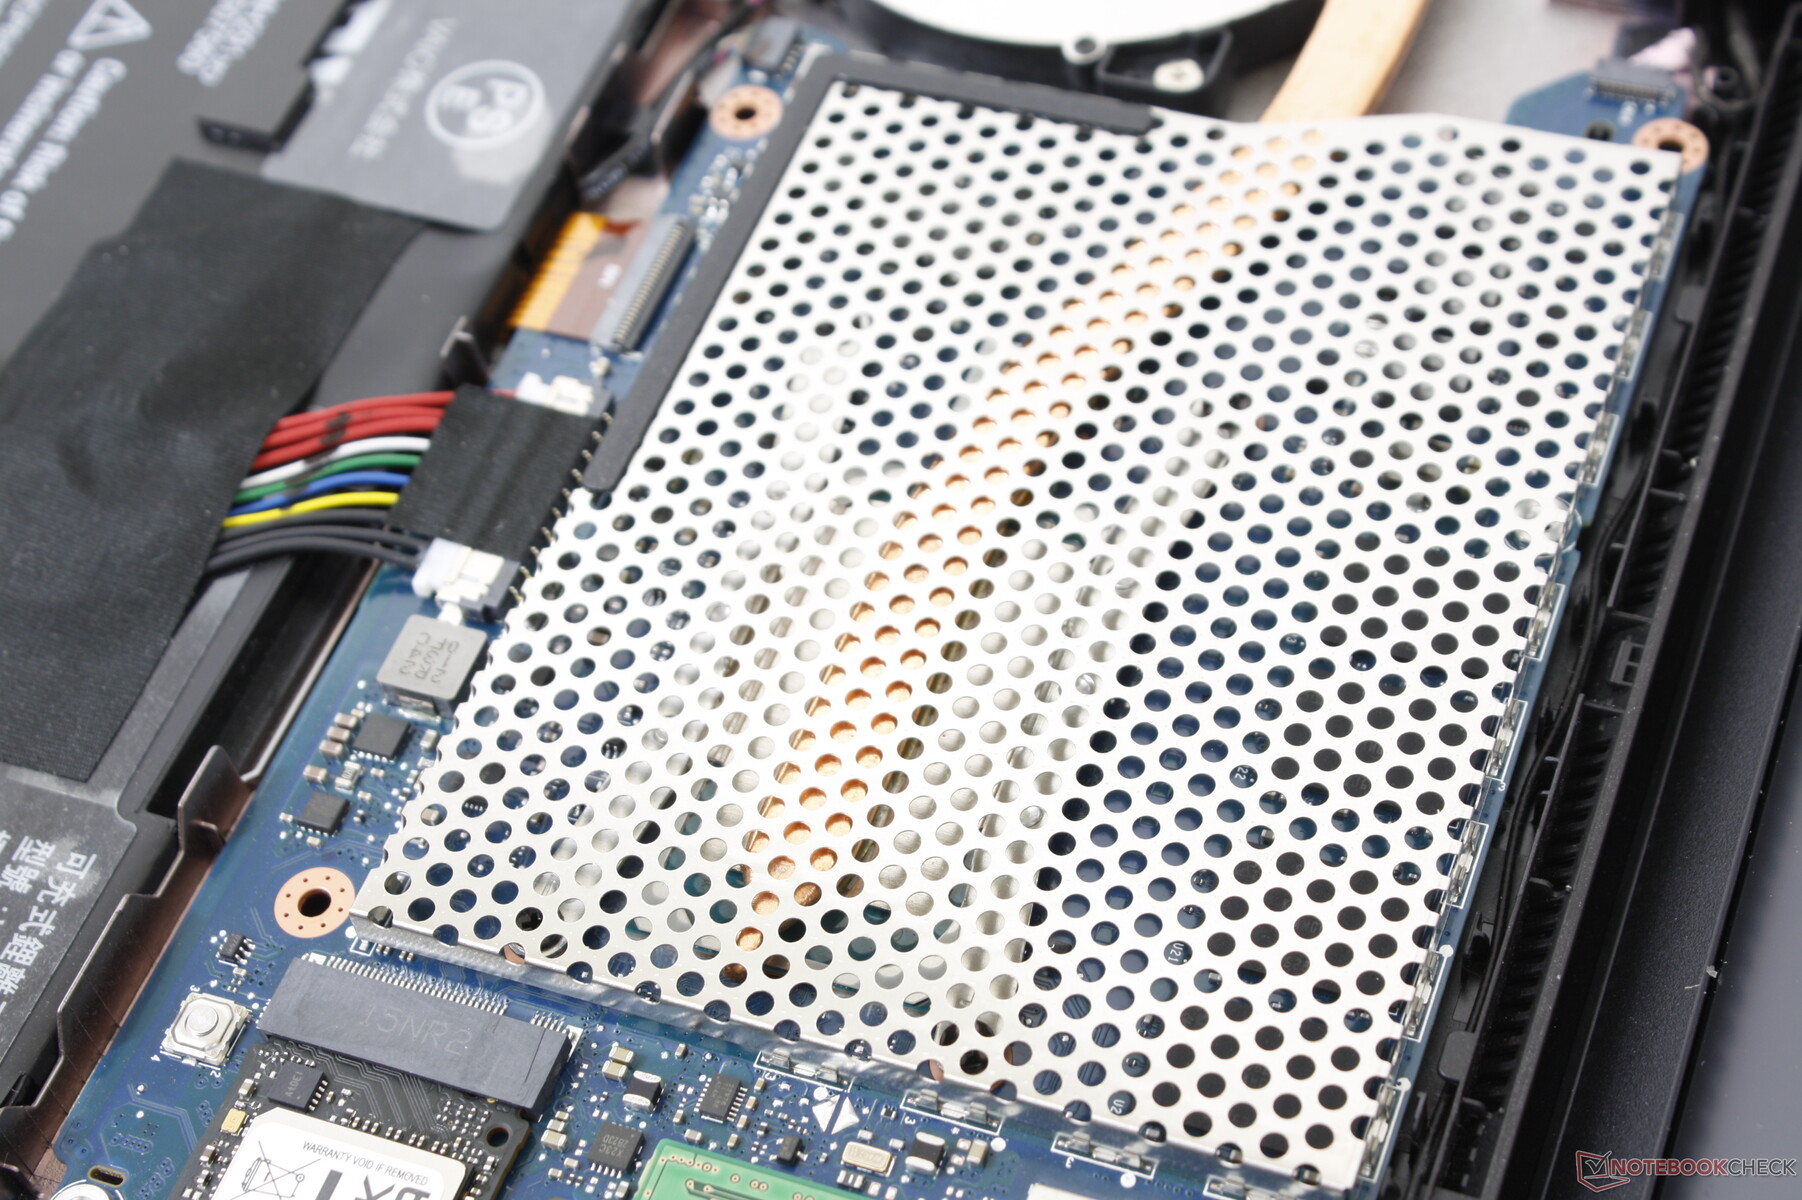
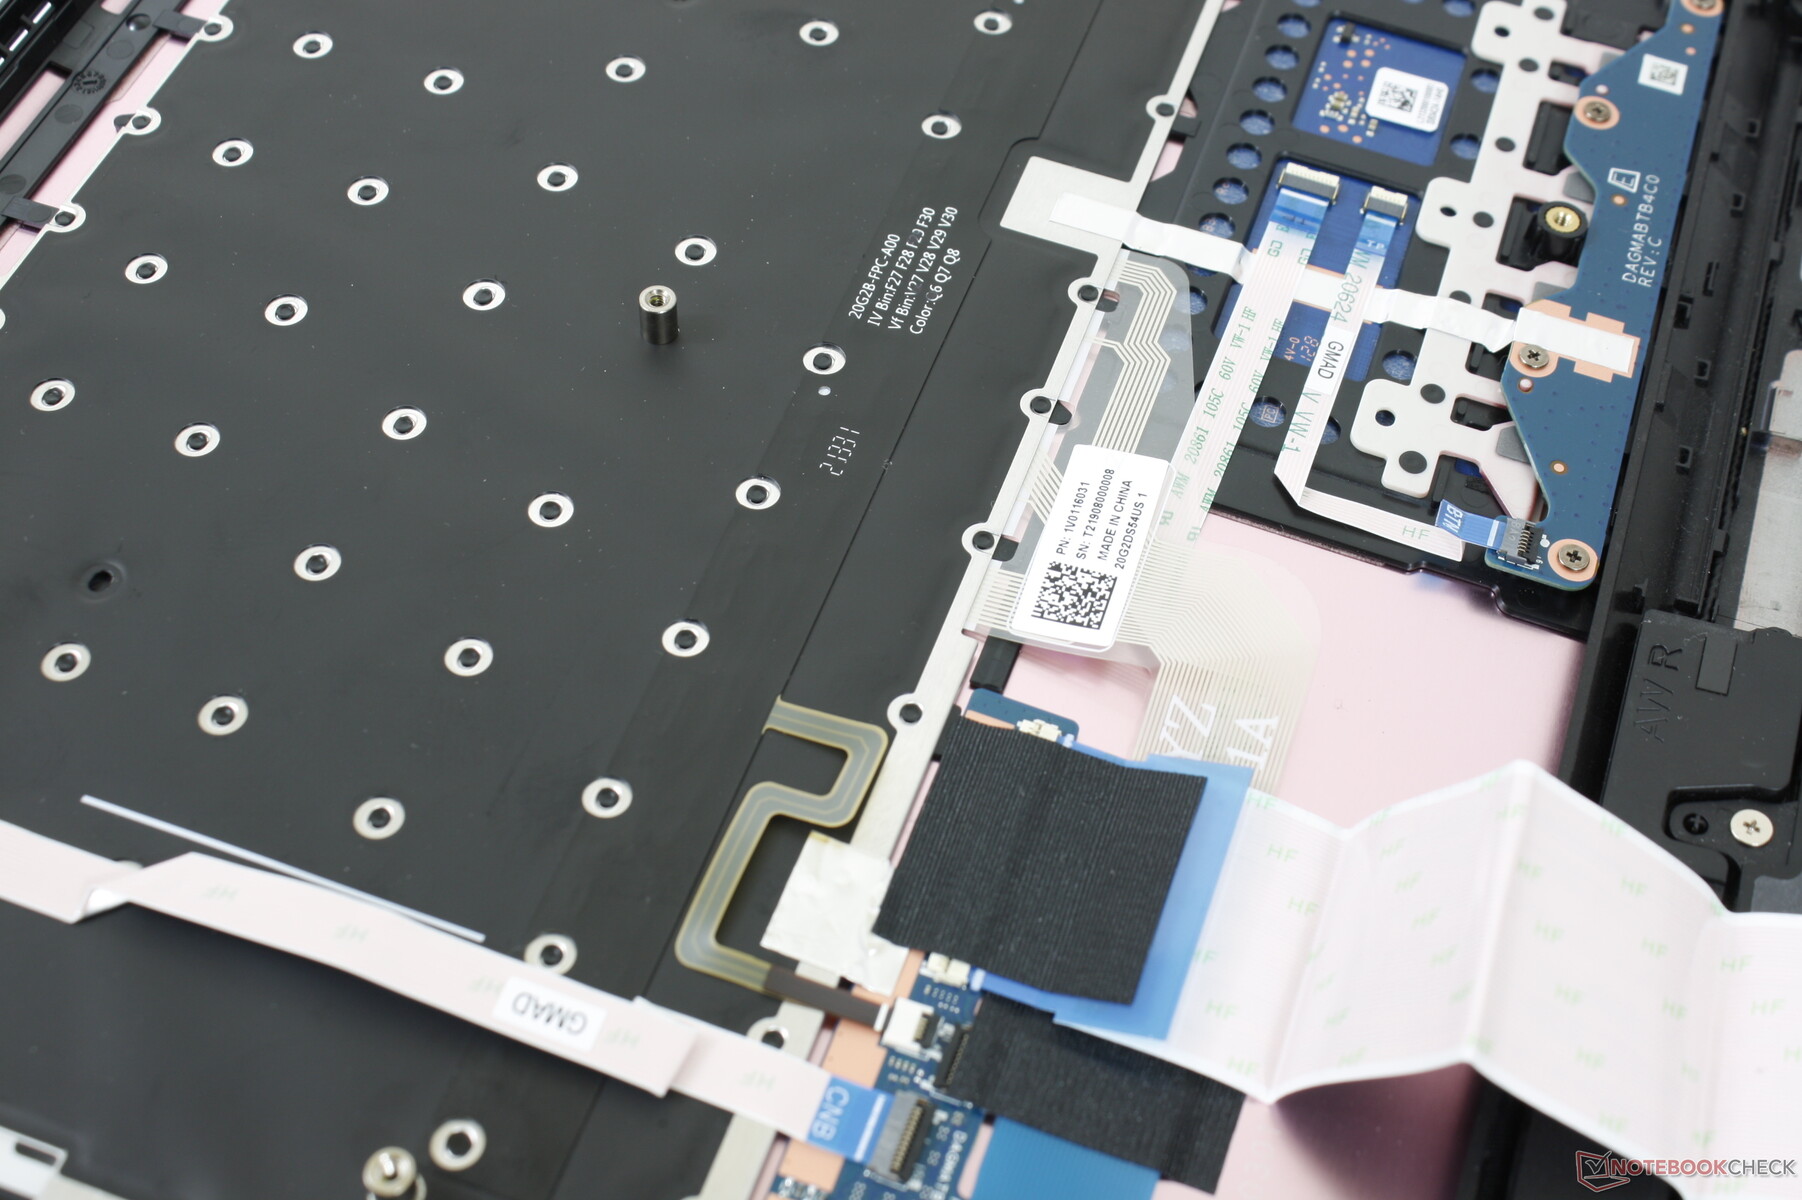
维护
接触内部结构相对容易,因为它只需要一把飞利浦螺丝刀和一个锋利的边缘。与大多数其他笔记本电脑不同的是,用户必须拆下键盘甲板而不是底盖进行任何维修。
配件和保修
除了交流电适配器和文件外,盒子里没有其他额外的东西。通常的一年有限保修期适用。
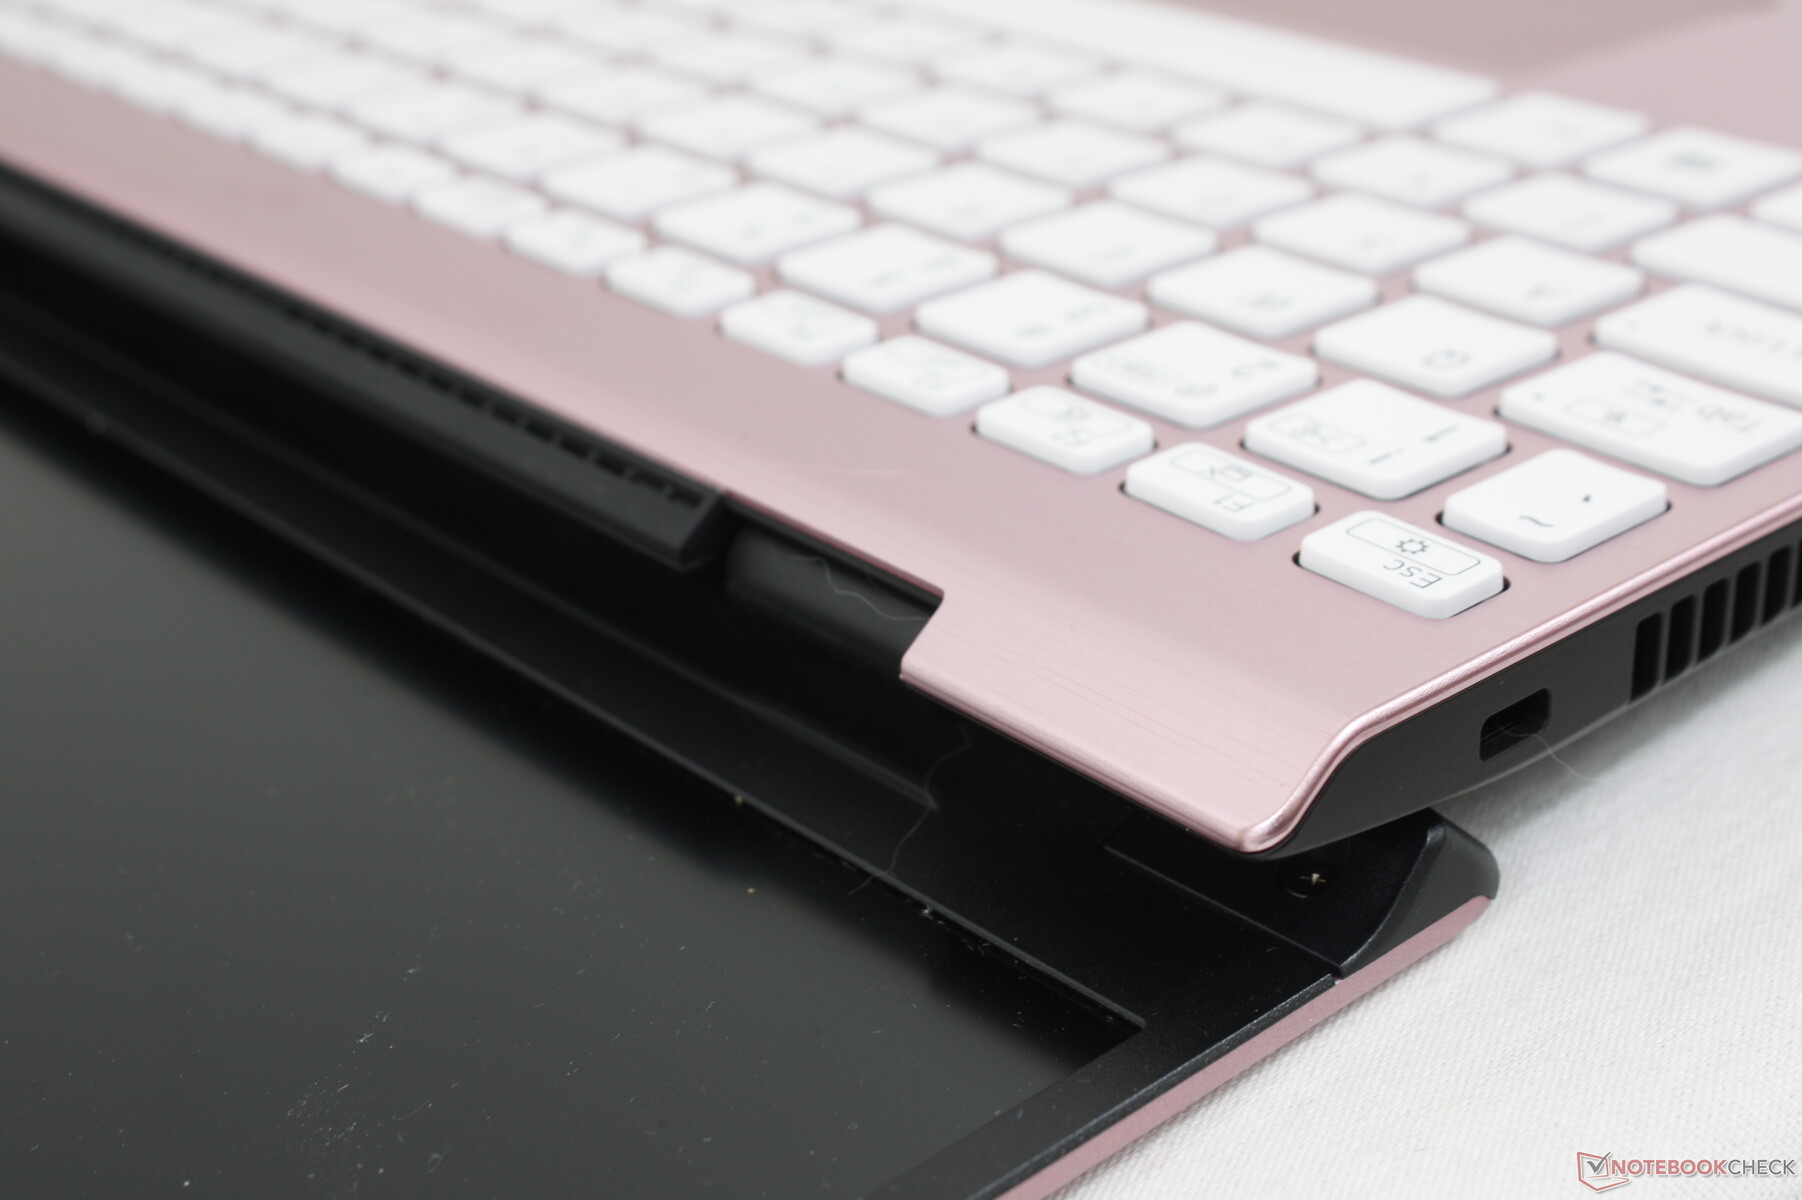
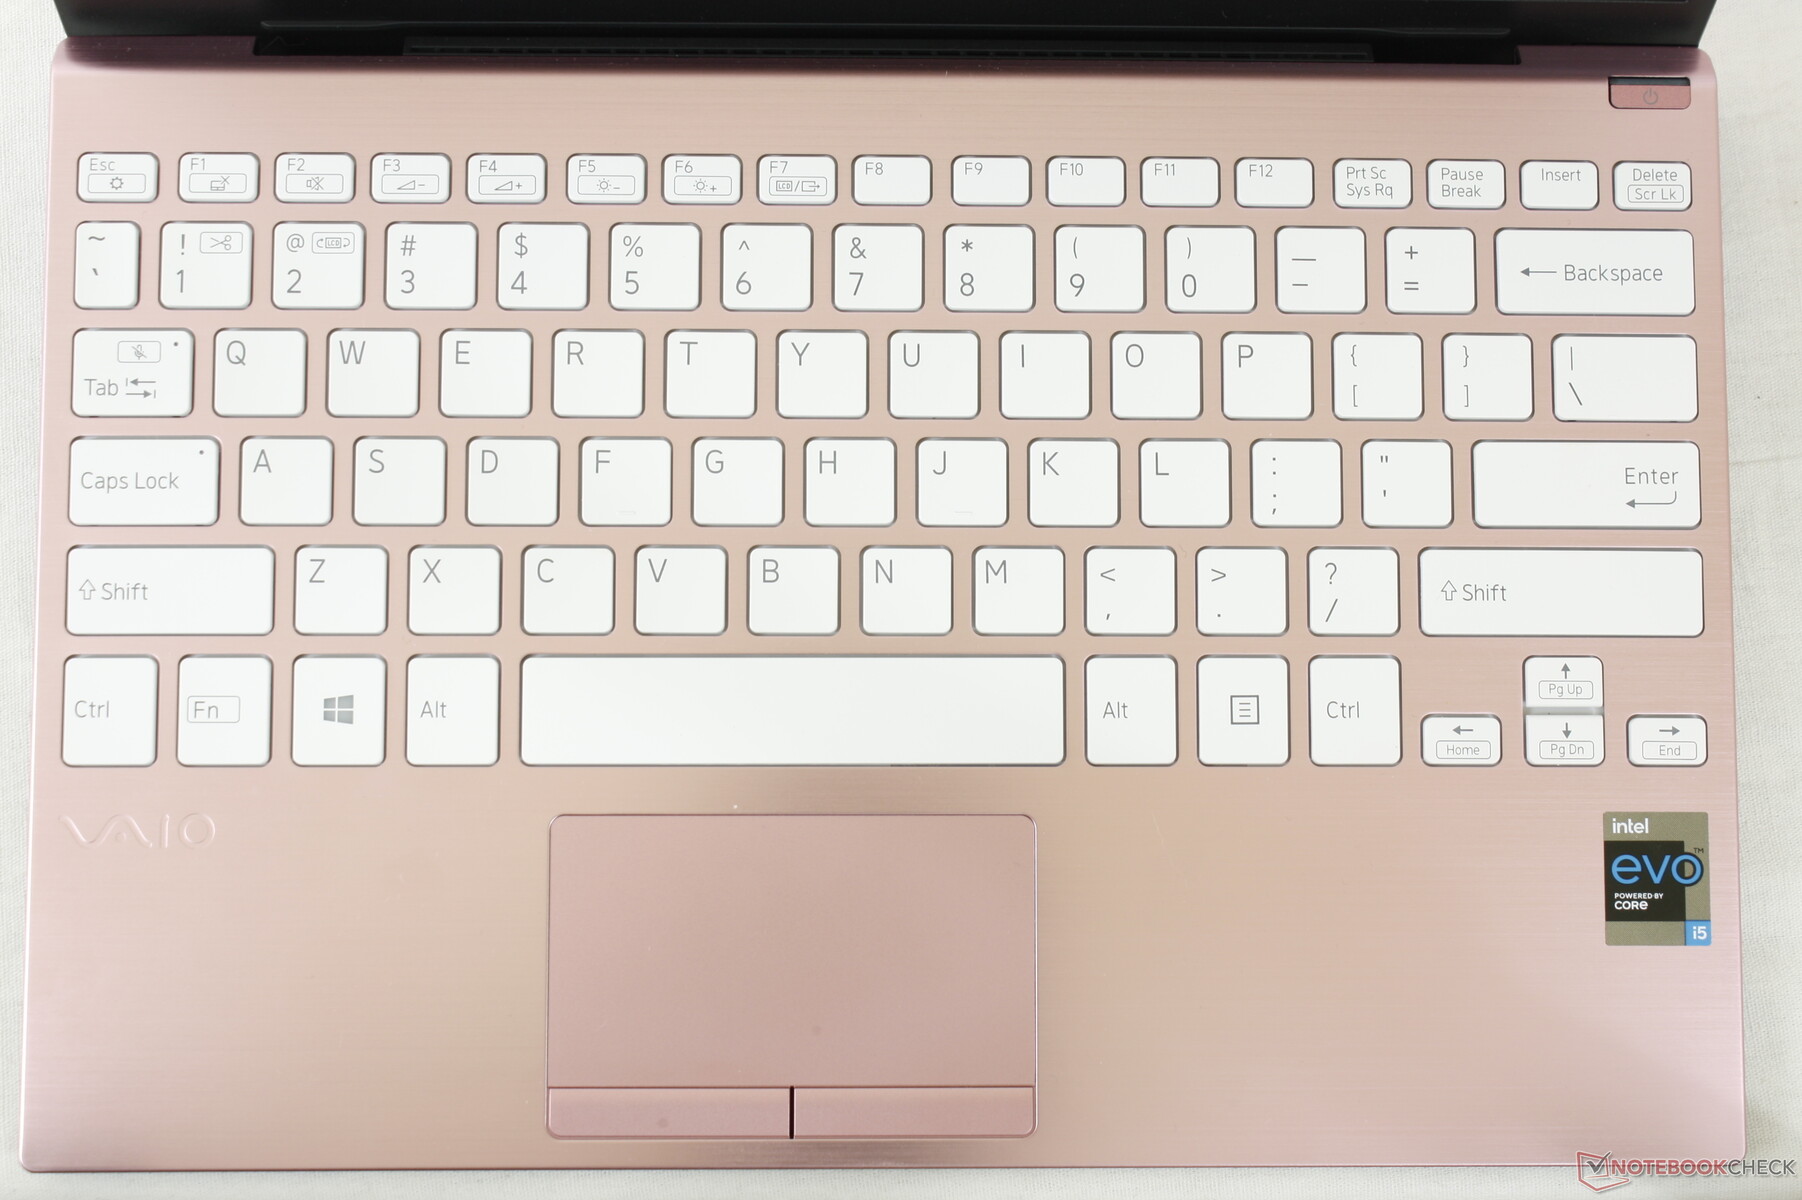
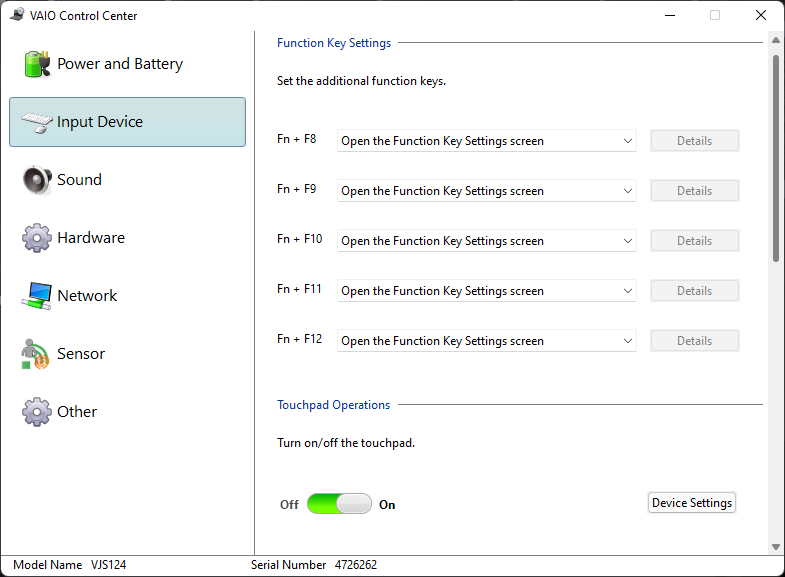
输入设备--宽敞,但还可以做得更好
键盘
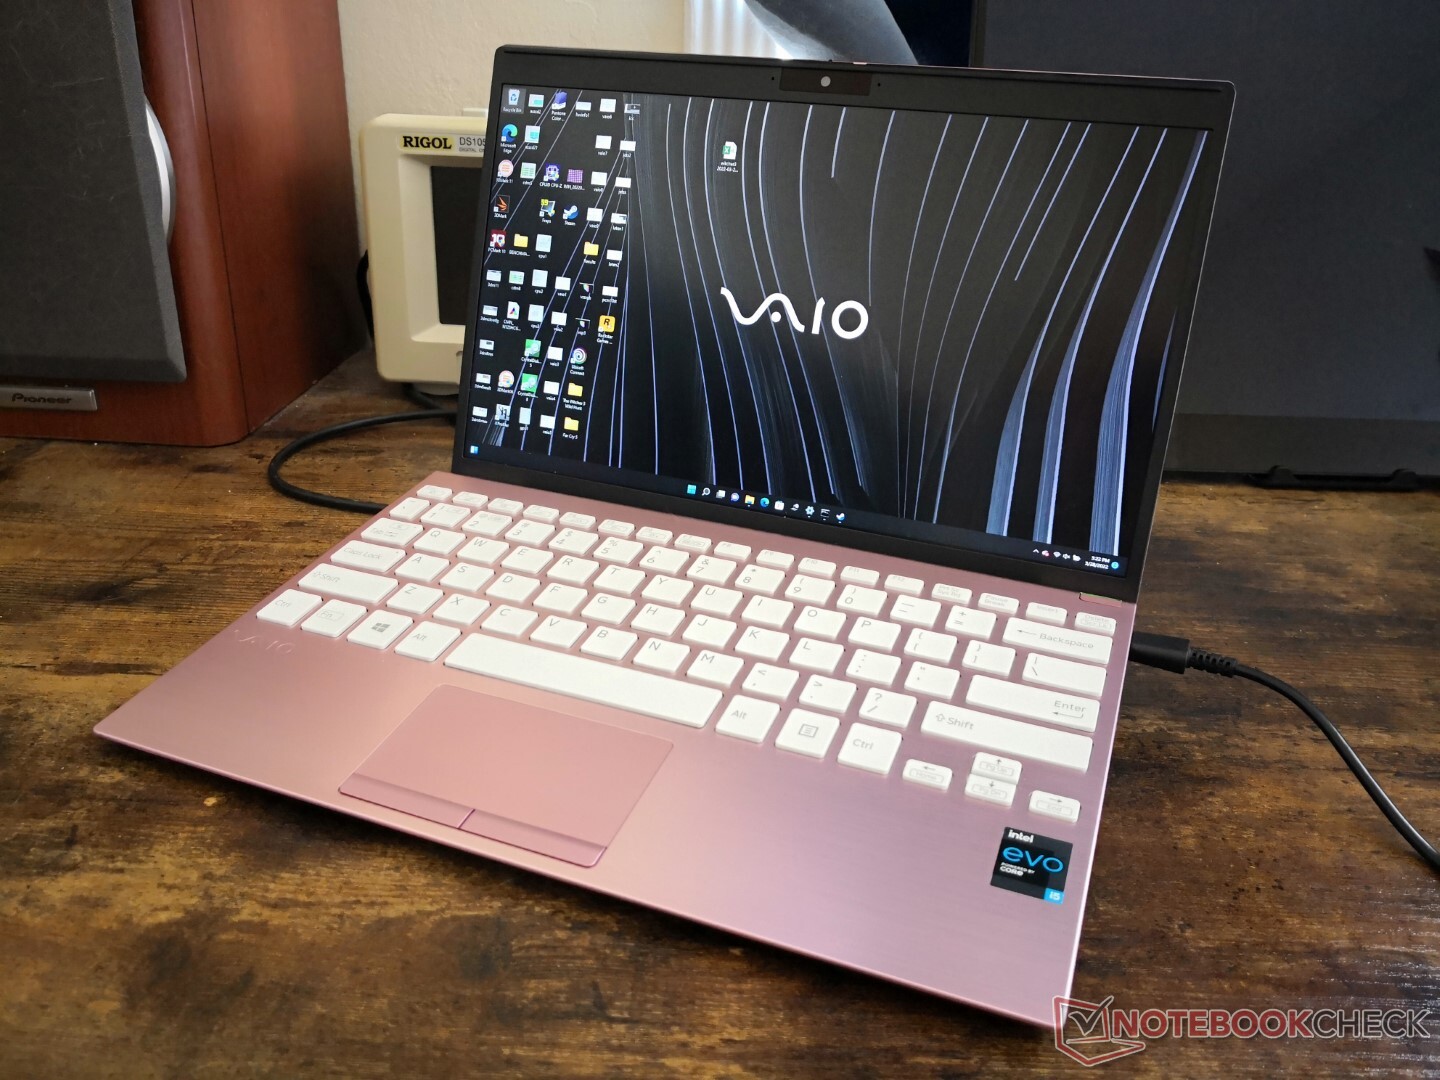
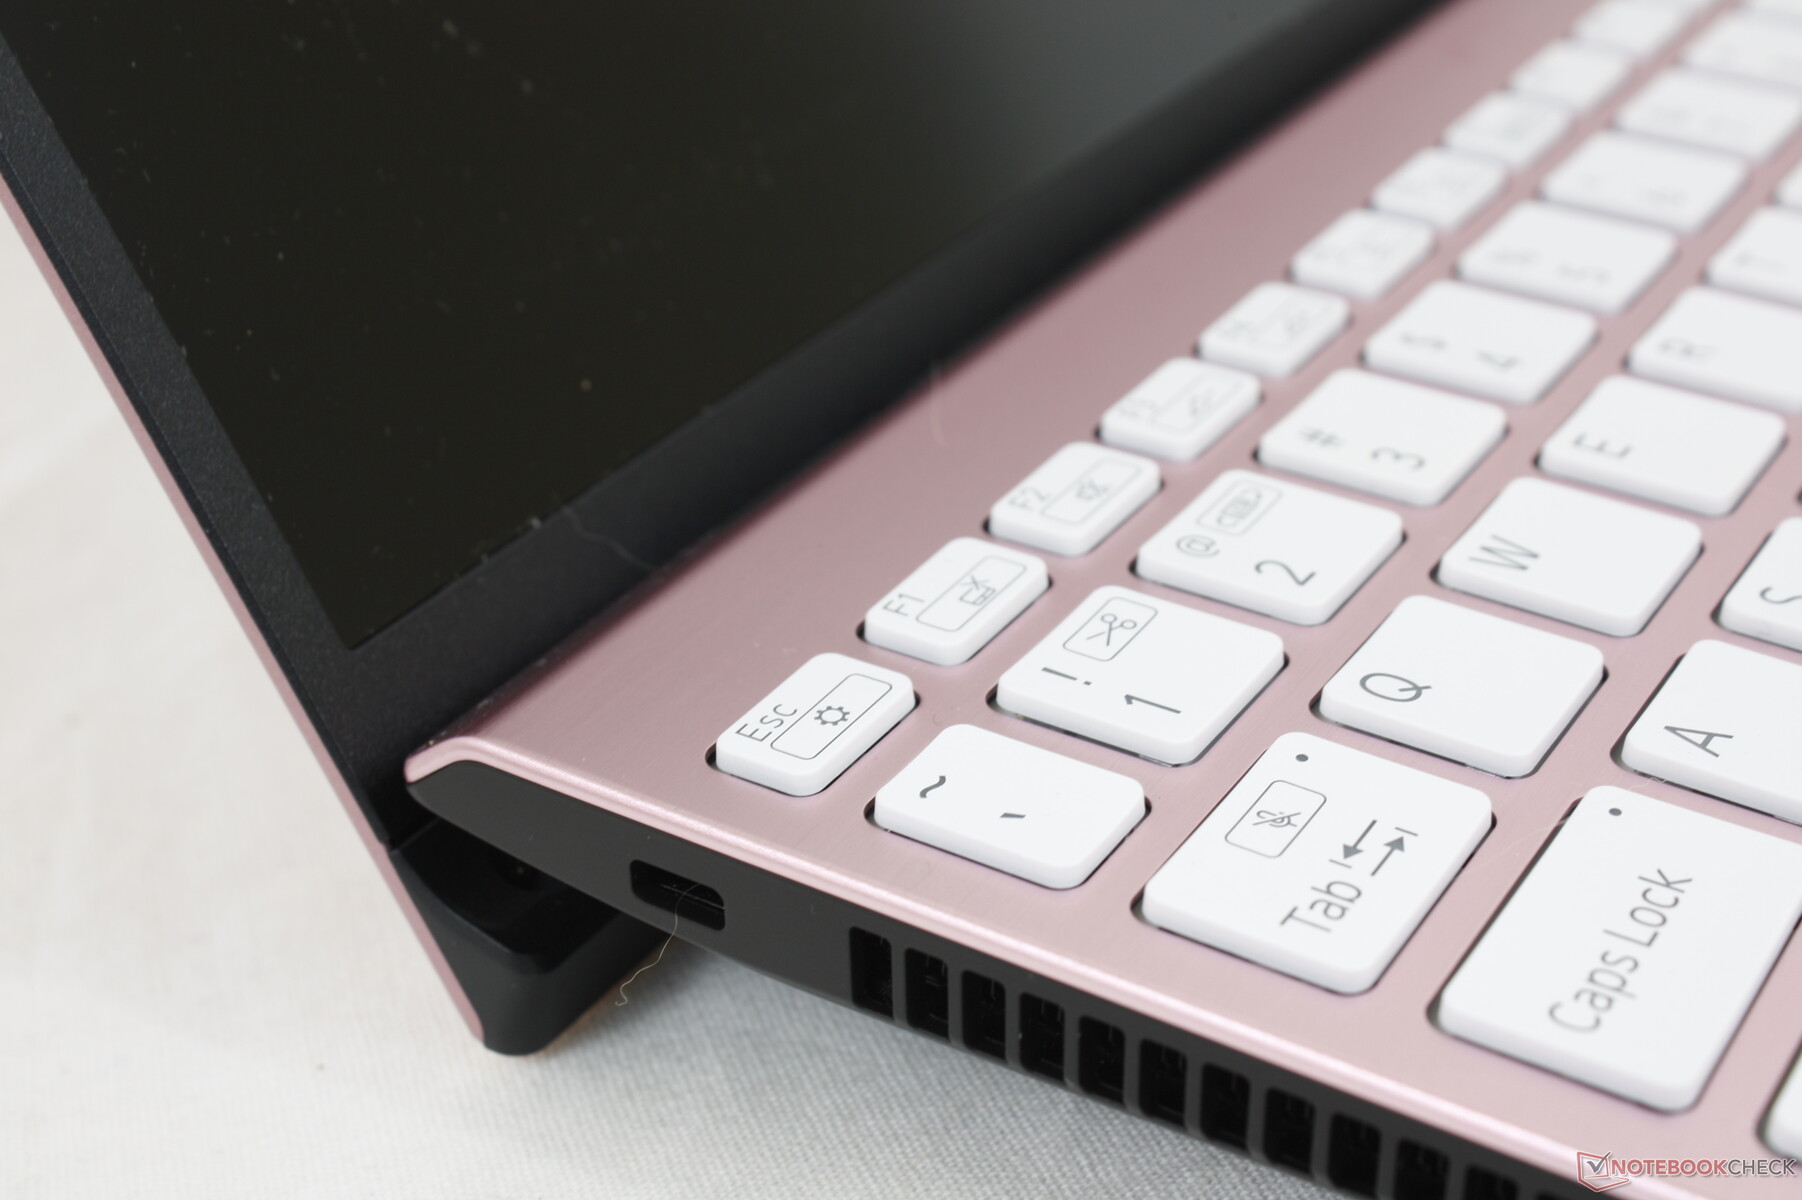
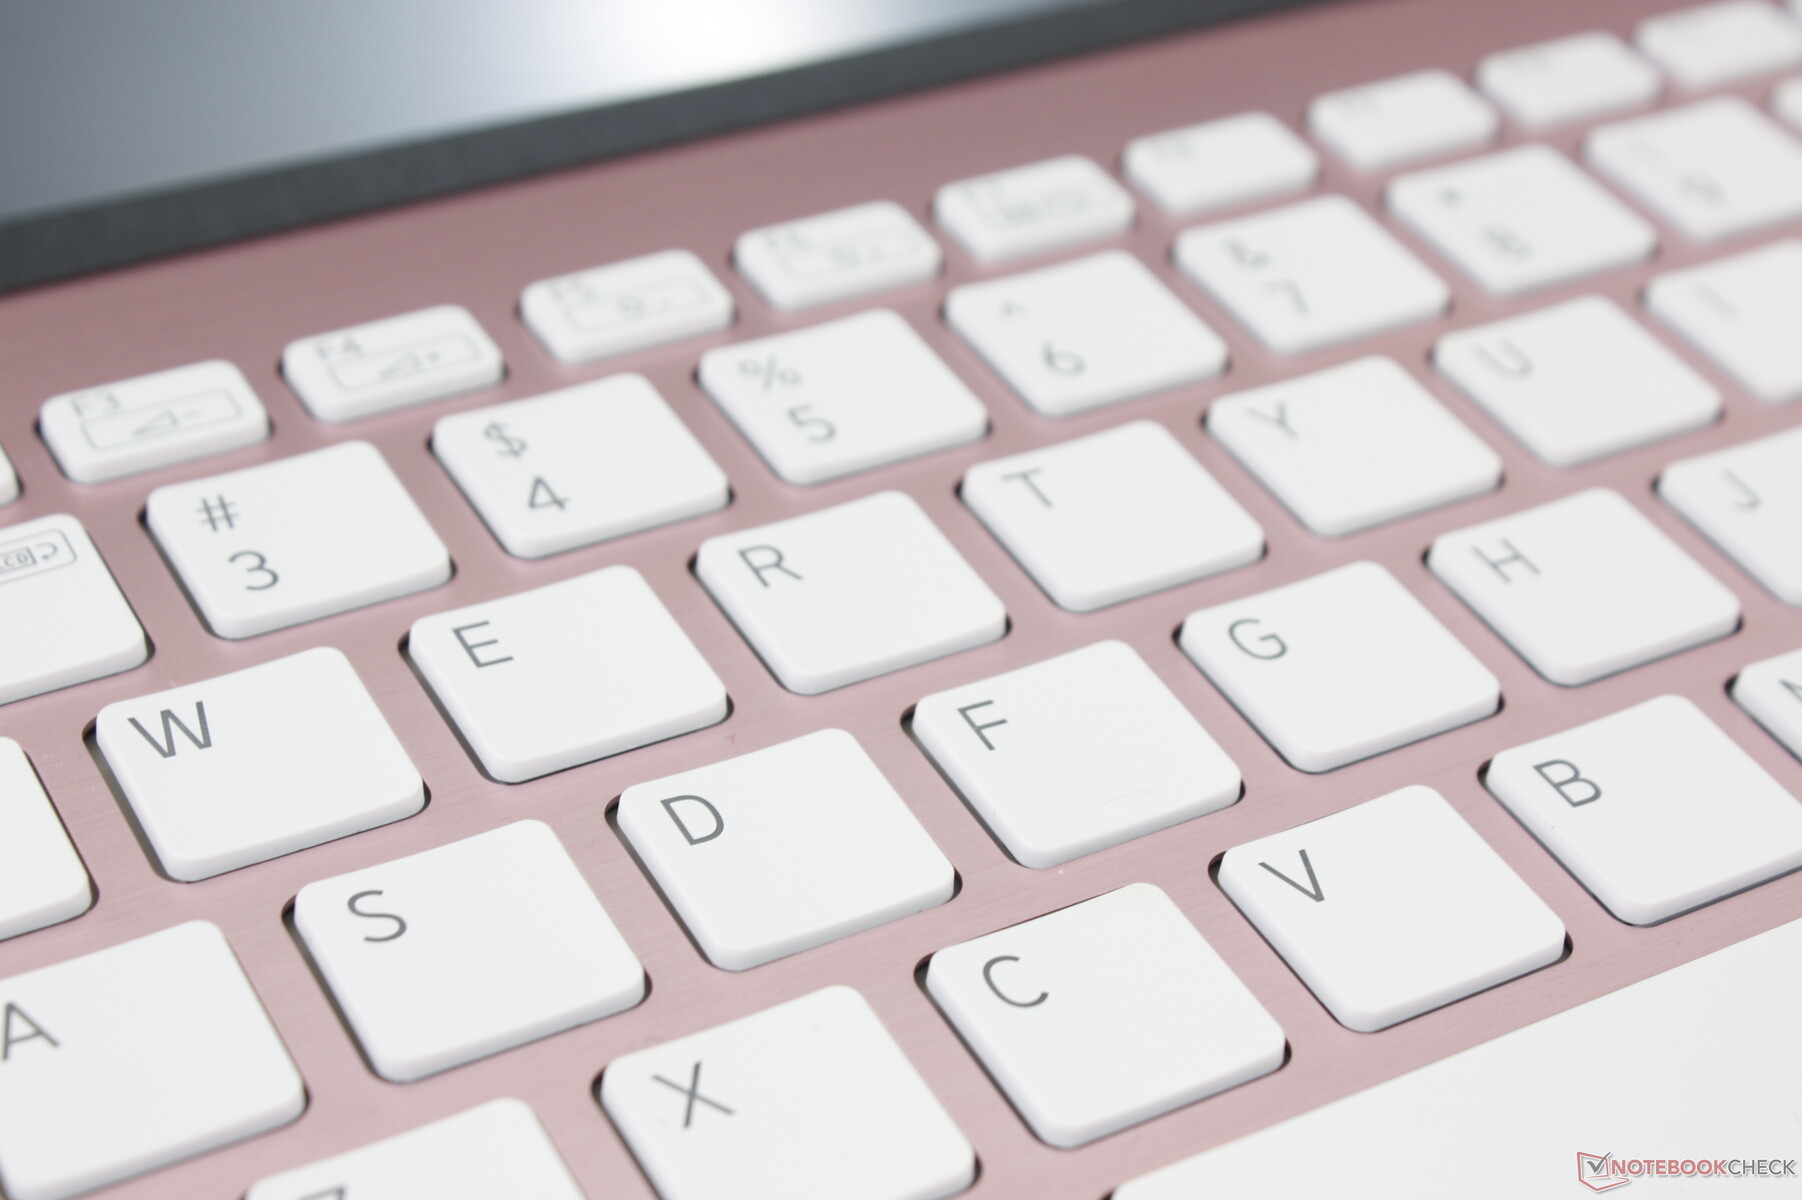
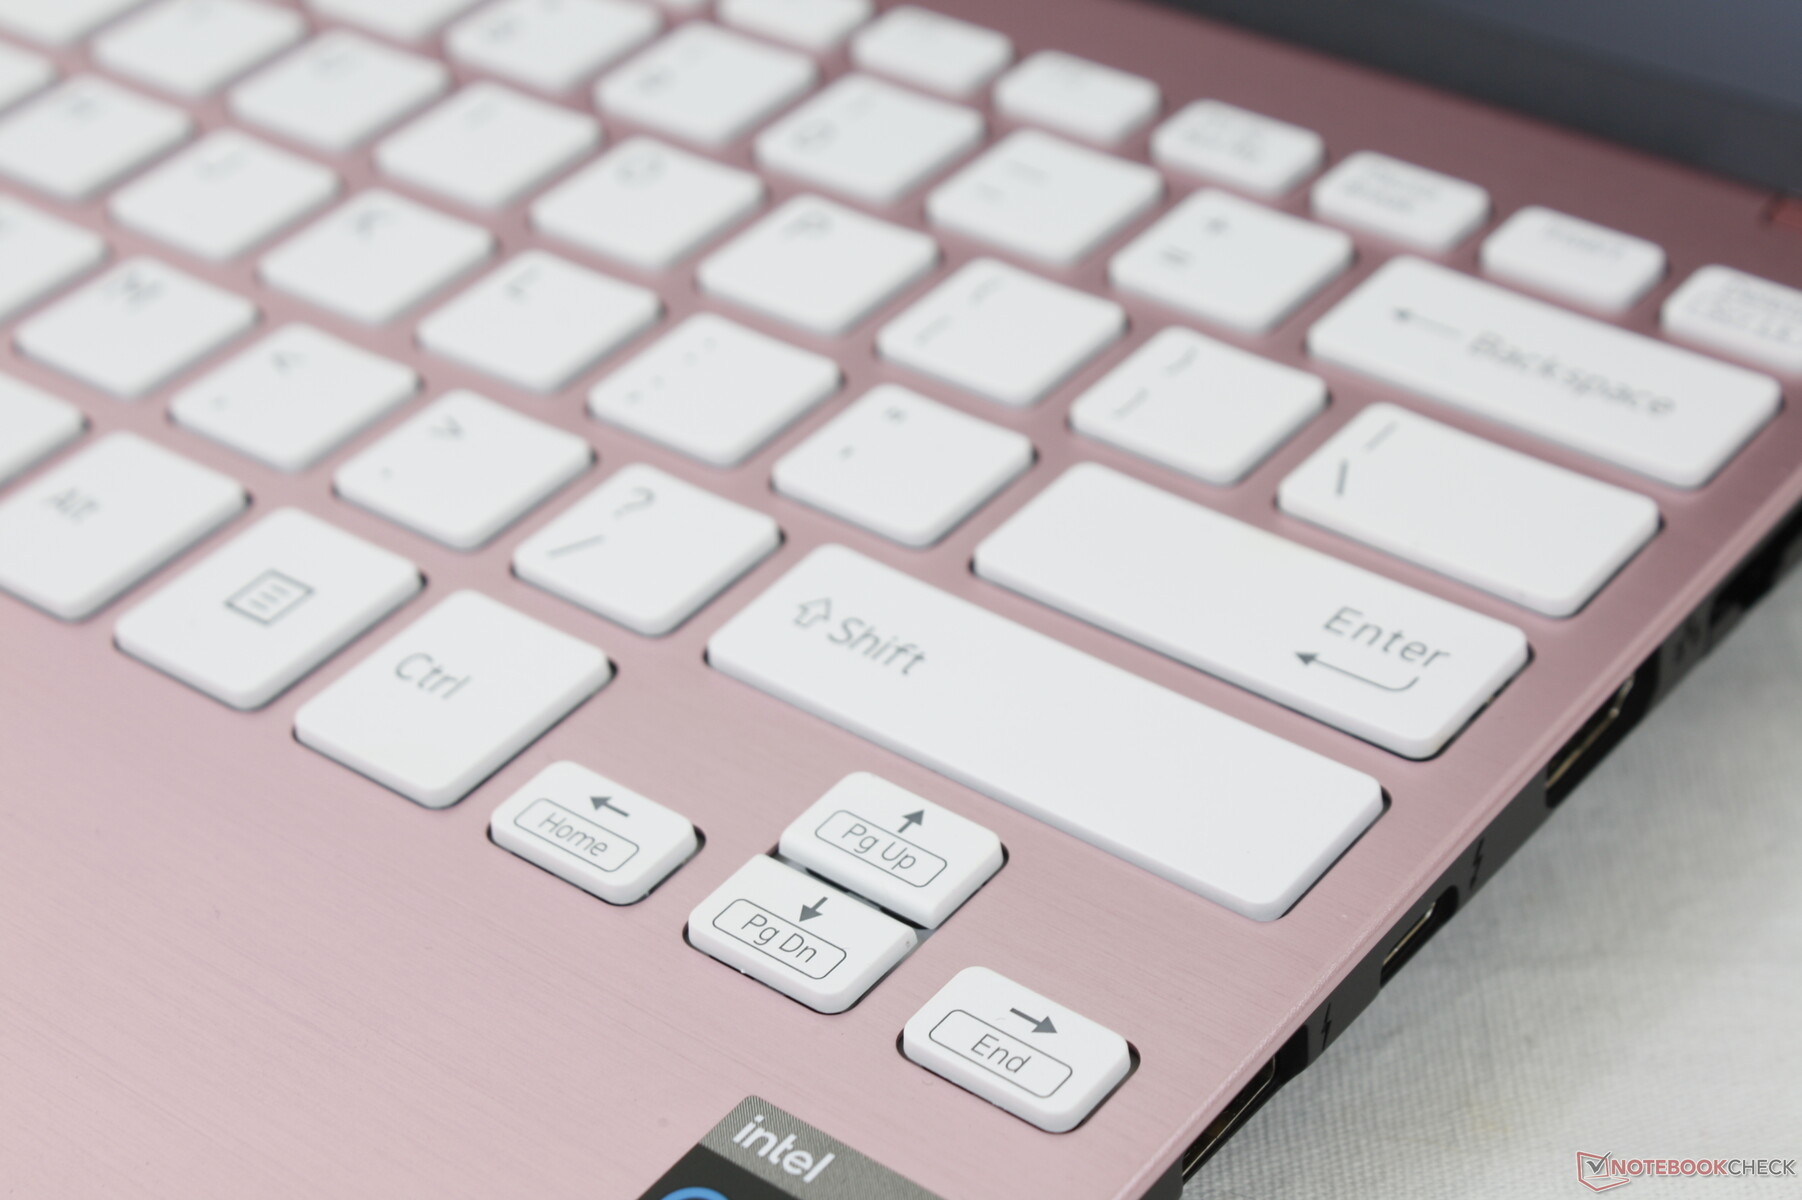
键盘的打字效果比我们最初预期的12英寸外形尺寸更舒适。键盘大小合理,反馈介于较软的XPS 13和较脆的Spectre 13 键之间。哗啦啦的声音因此略大,但我们并不在意。
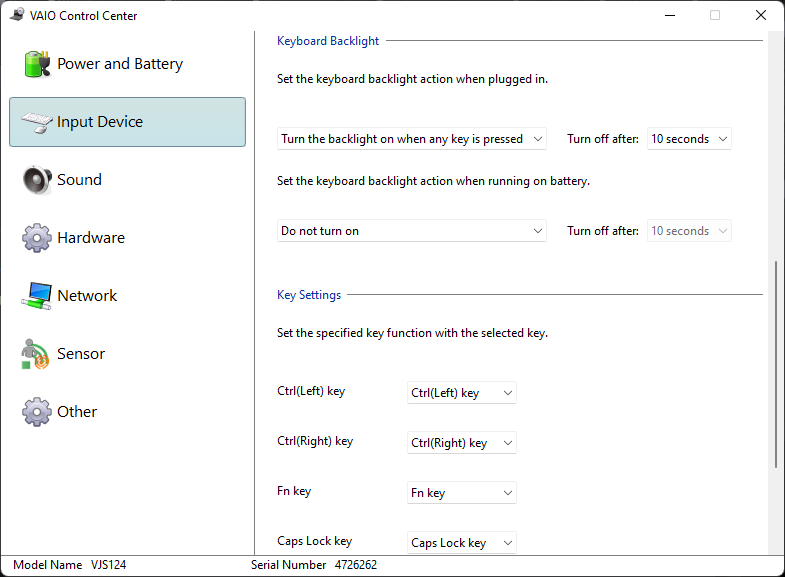
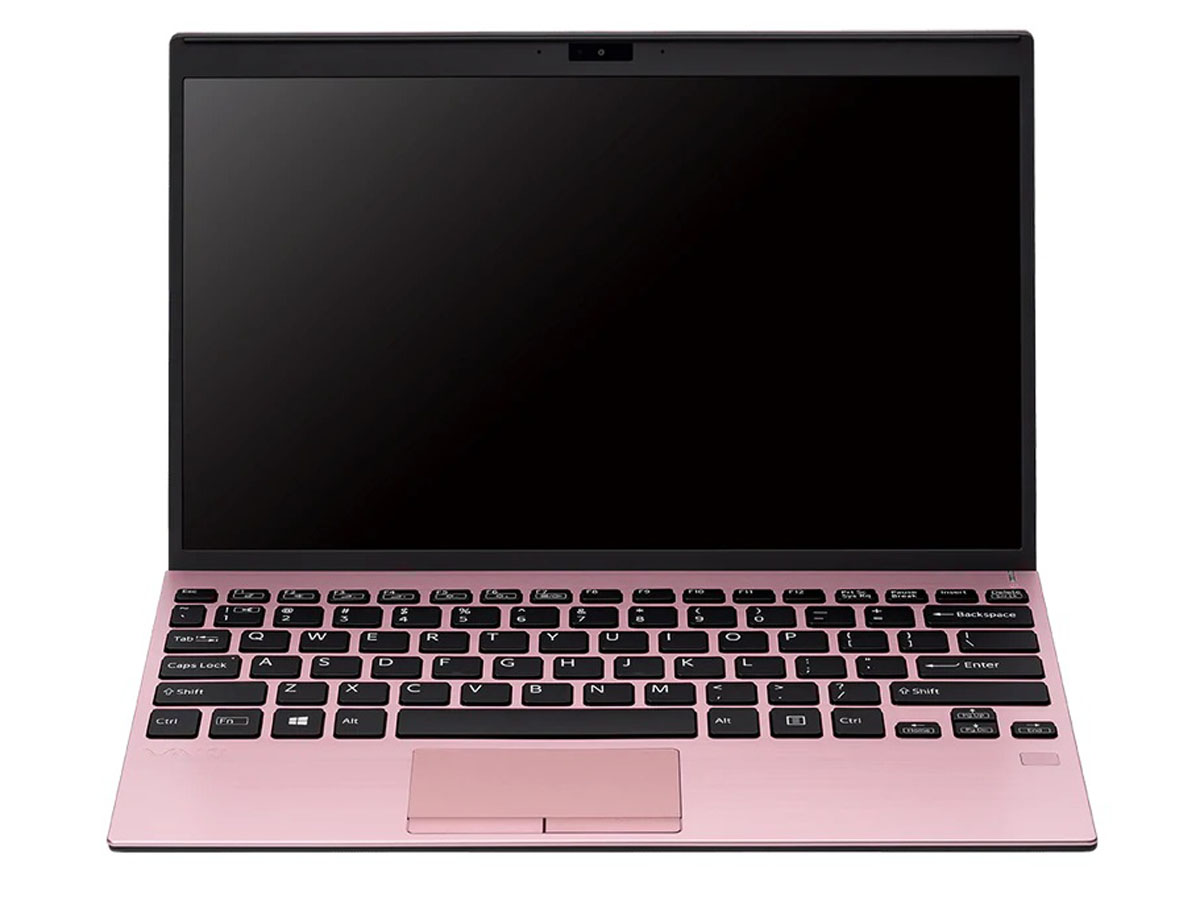
请记住,粉色和白色笔记本颜色选项上的键盘按键是白色的,而银色、黑色和深蓝色笔记本颜色选项上的按键是黑色。由于键盘背光也是白色的,白色按键可能很难识别,因为它们在一起的对比度很差。这也许是开发过程中的一个疏忽,因为不同的键盘背光颜色可以避免这个问题。
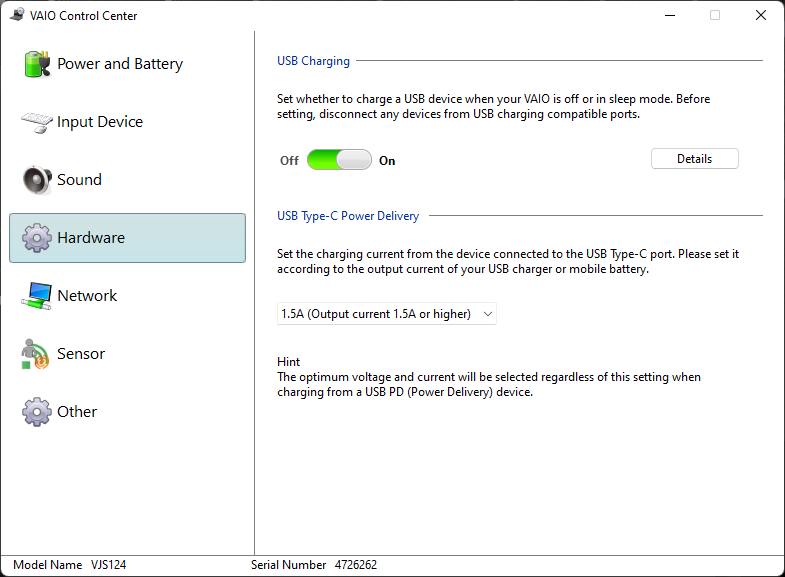
令人讨厌的是,键盘背光只能通过Vaio控制中心软件控制,而不是通过任何热键。
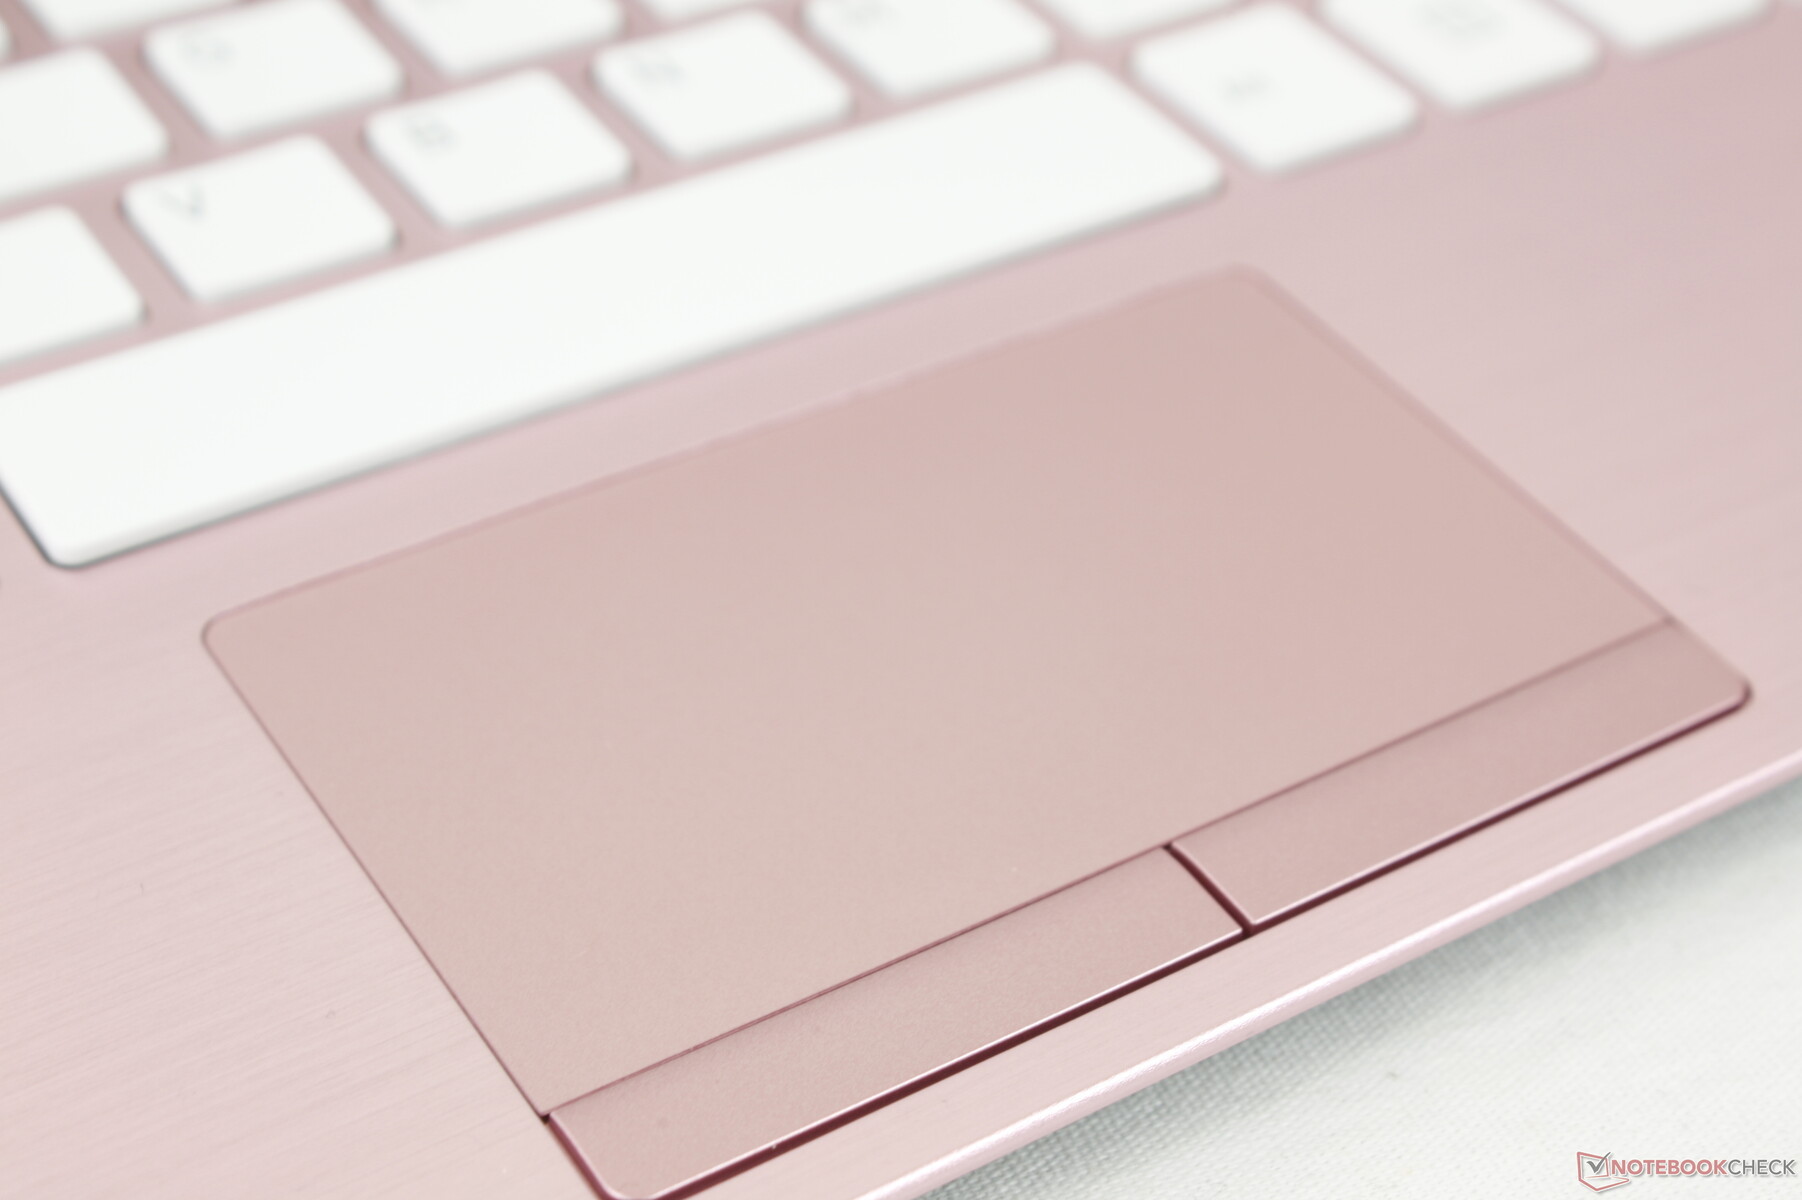
触摸板
Precision 触摸板是预期的小,只有8.2 x 4.5厘米。它的表面是光滑和可靠的,只有在以较慢的速度滑行时才有一点粘性,以帮助提高精确度。同时,与大多数根本没有专用按钮的点击板相比,专用的鼠标按钮使拖放动作更容易执行。不幸的是,这里的按钮很浅,反馈相对较弱且不均匀;沿着各自的边缘点击按钮的反馈比点击其中心附近的反馈更有弹性。
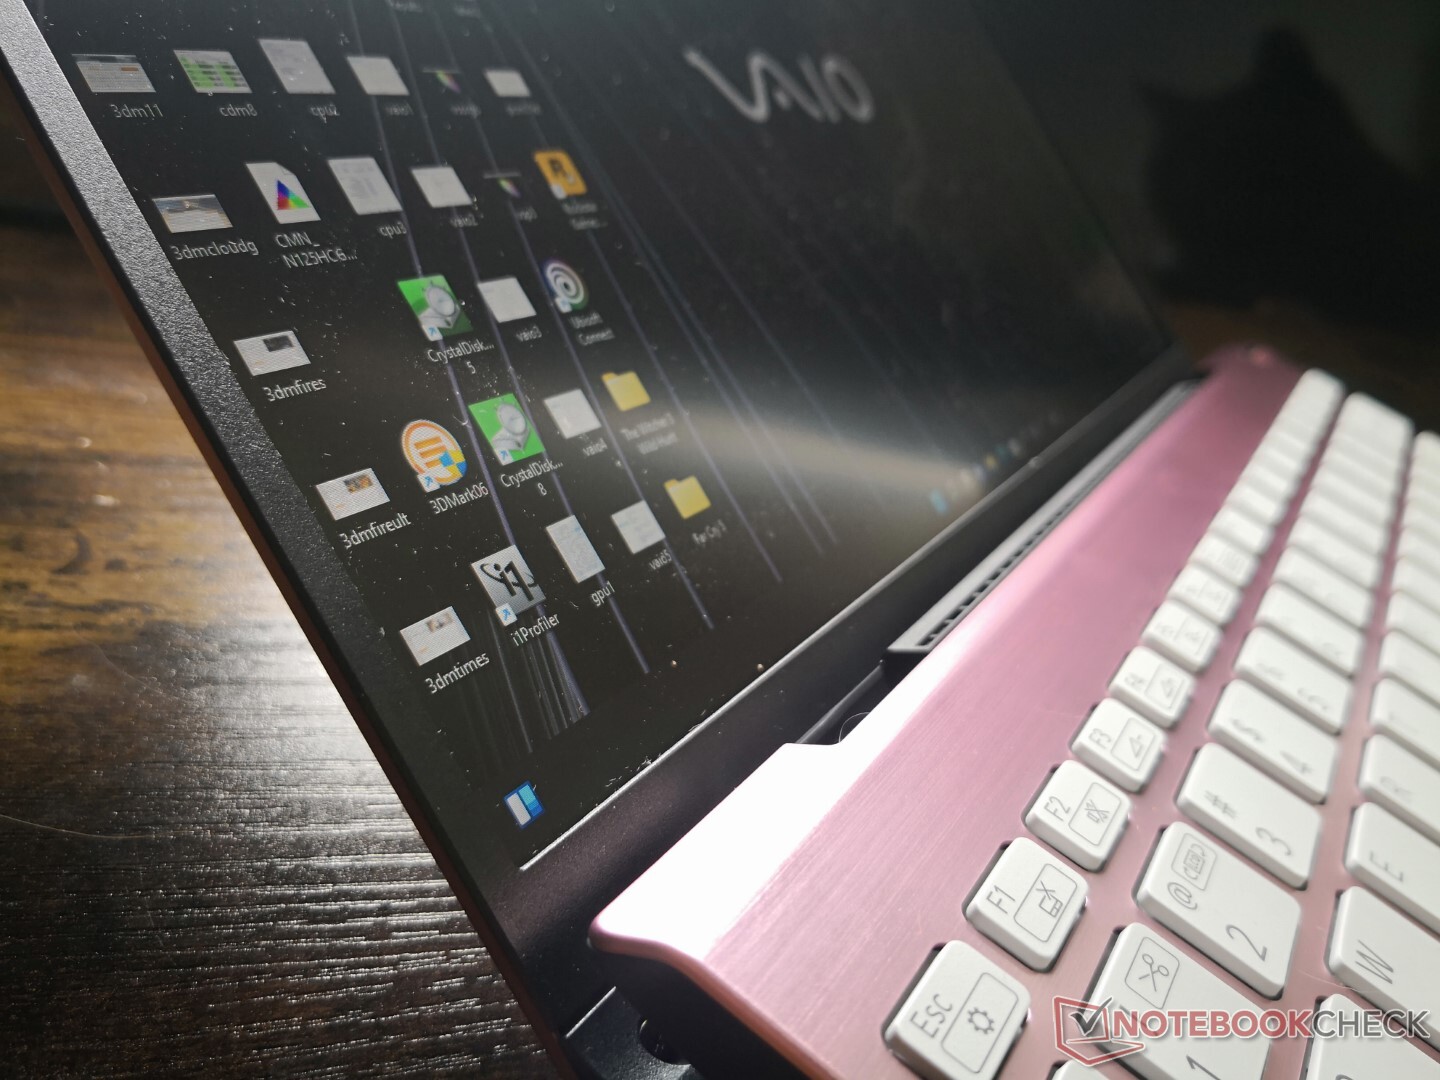
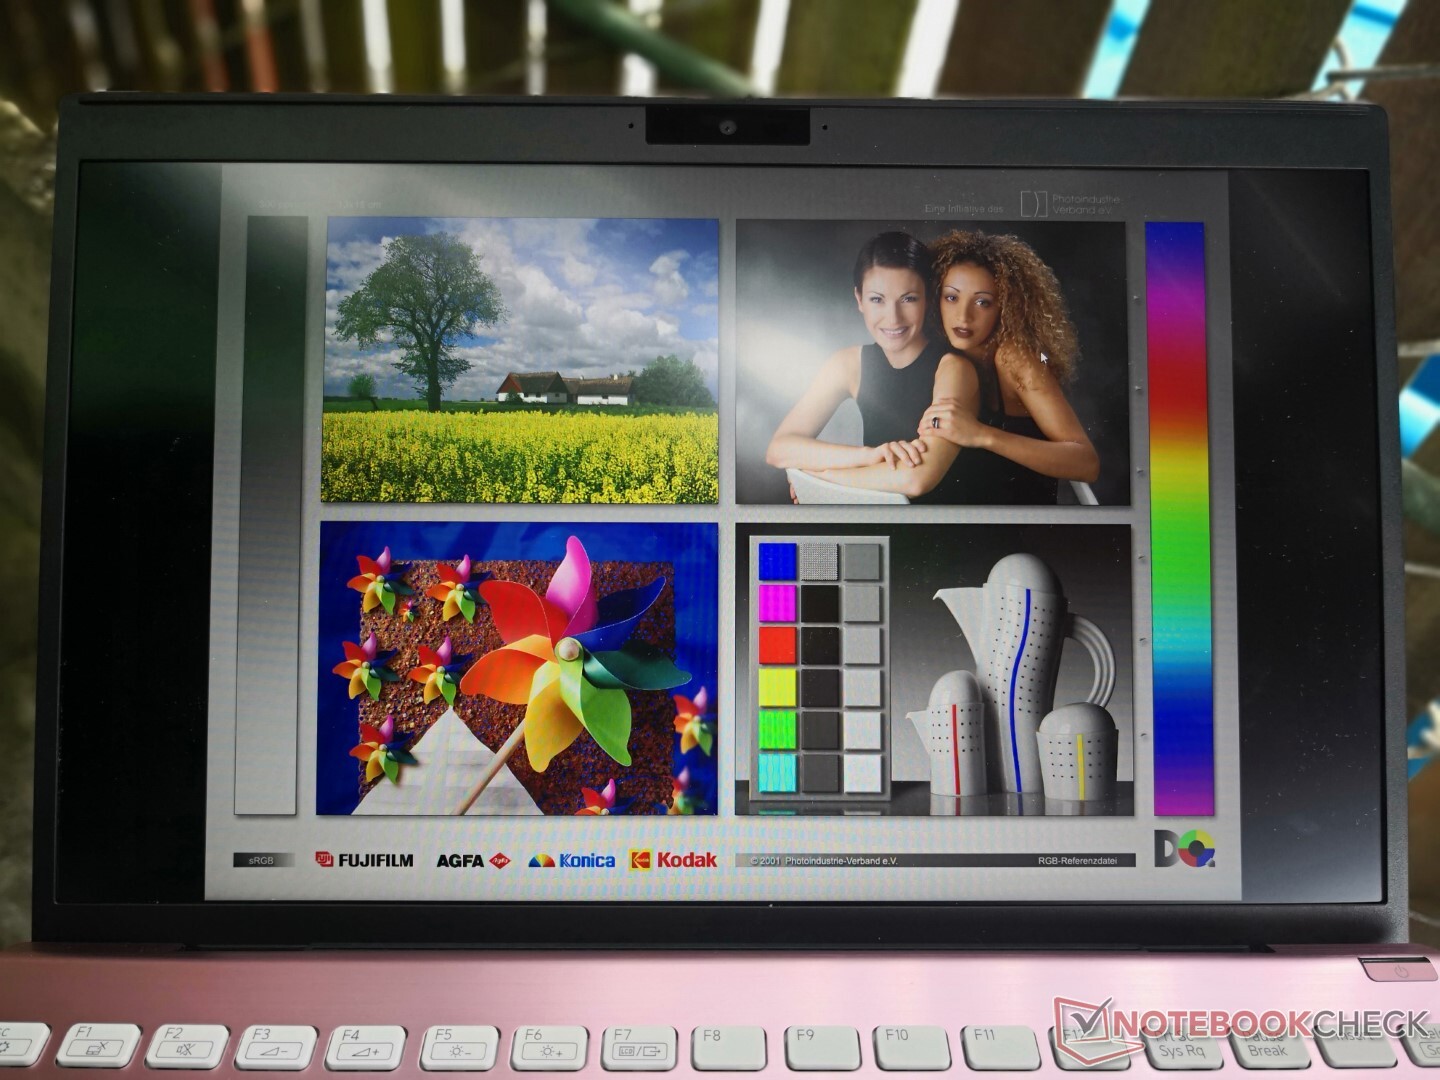
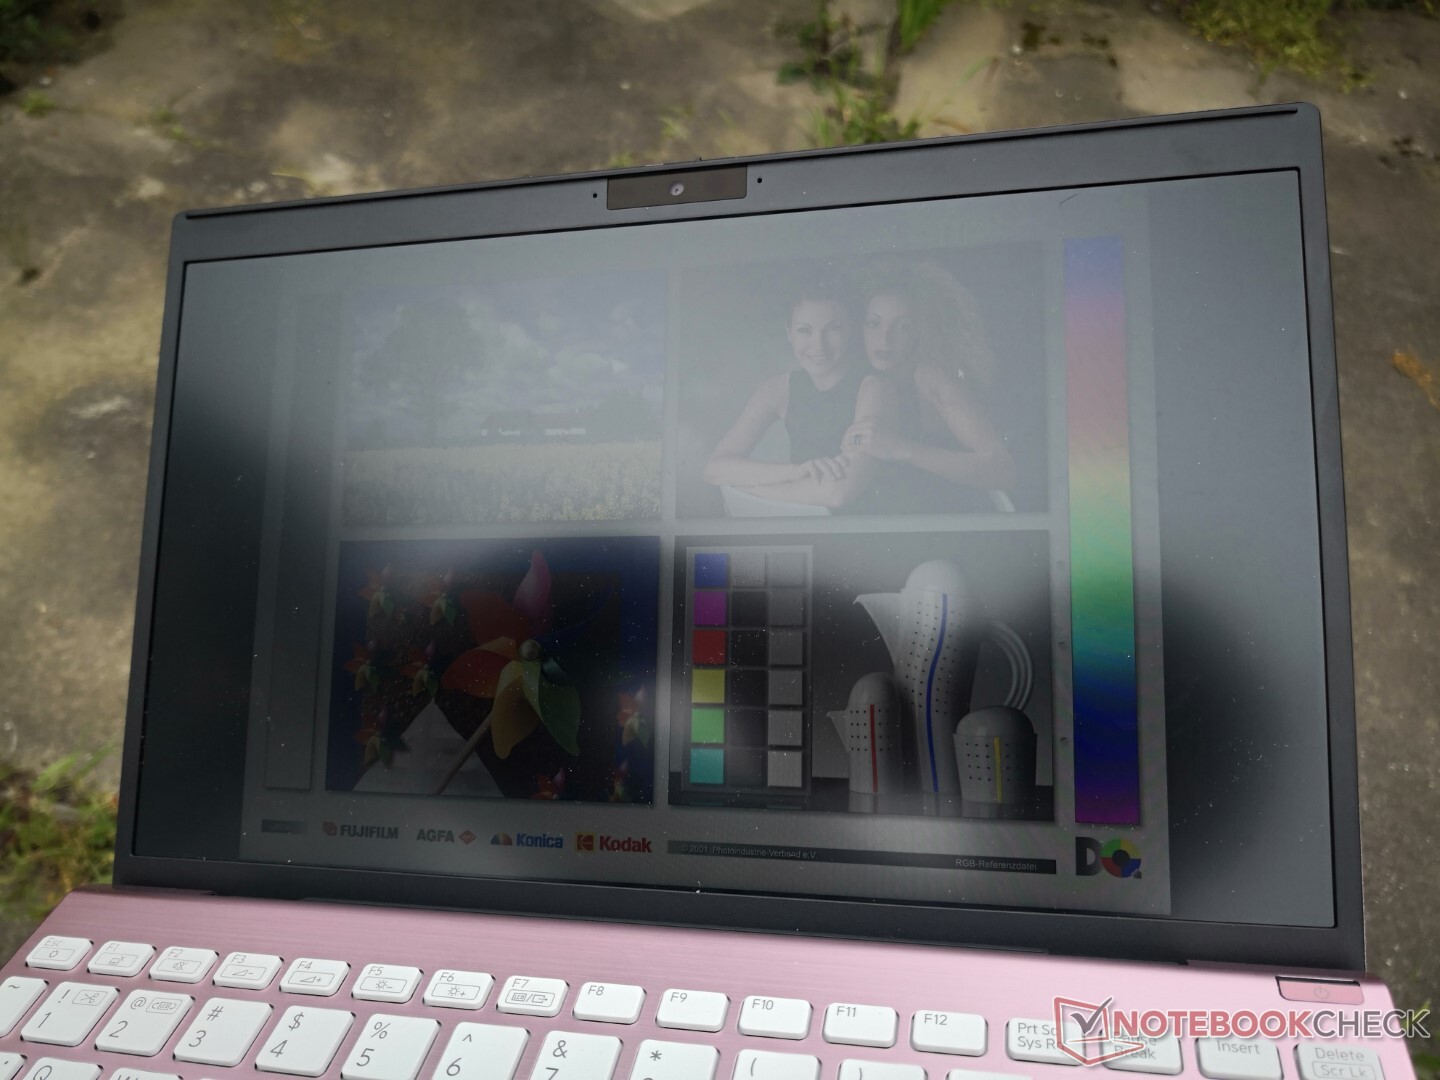
显示器 - 高质量12.5英寸面板
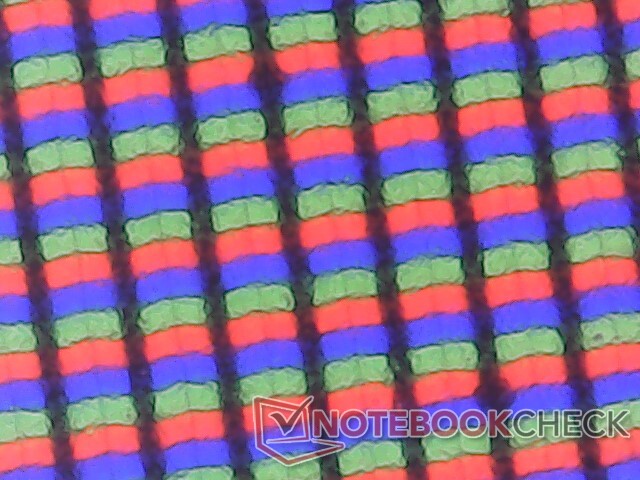
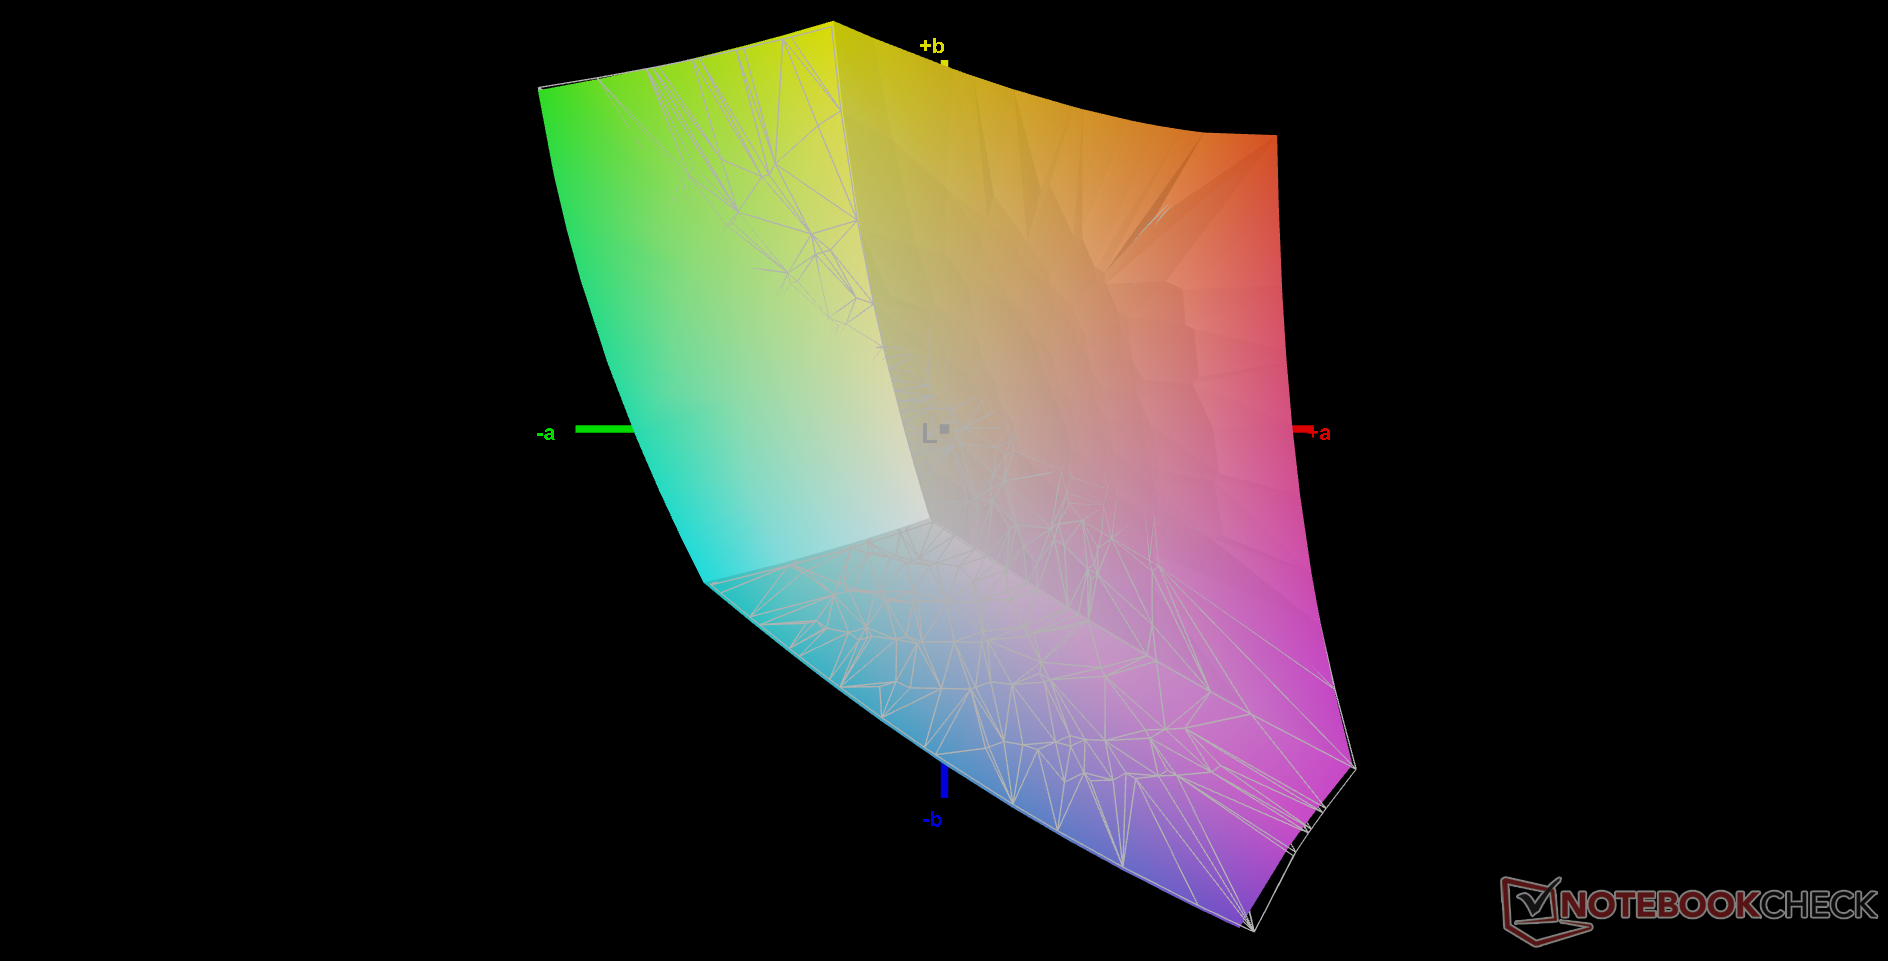
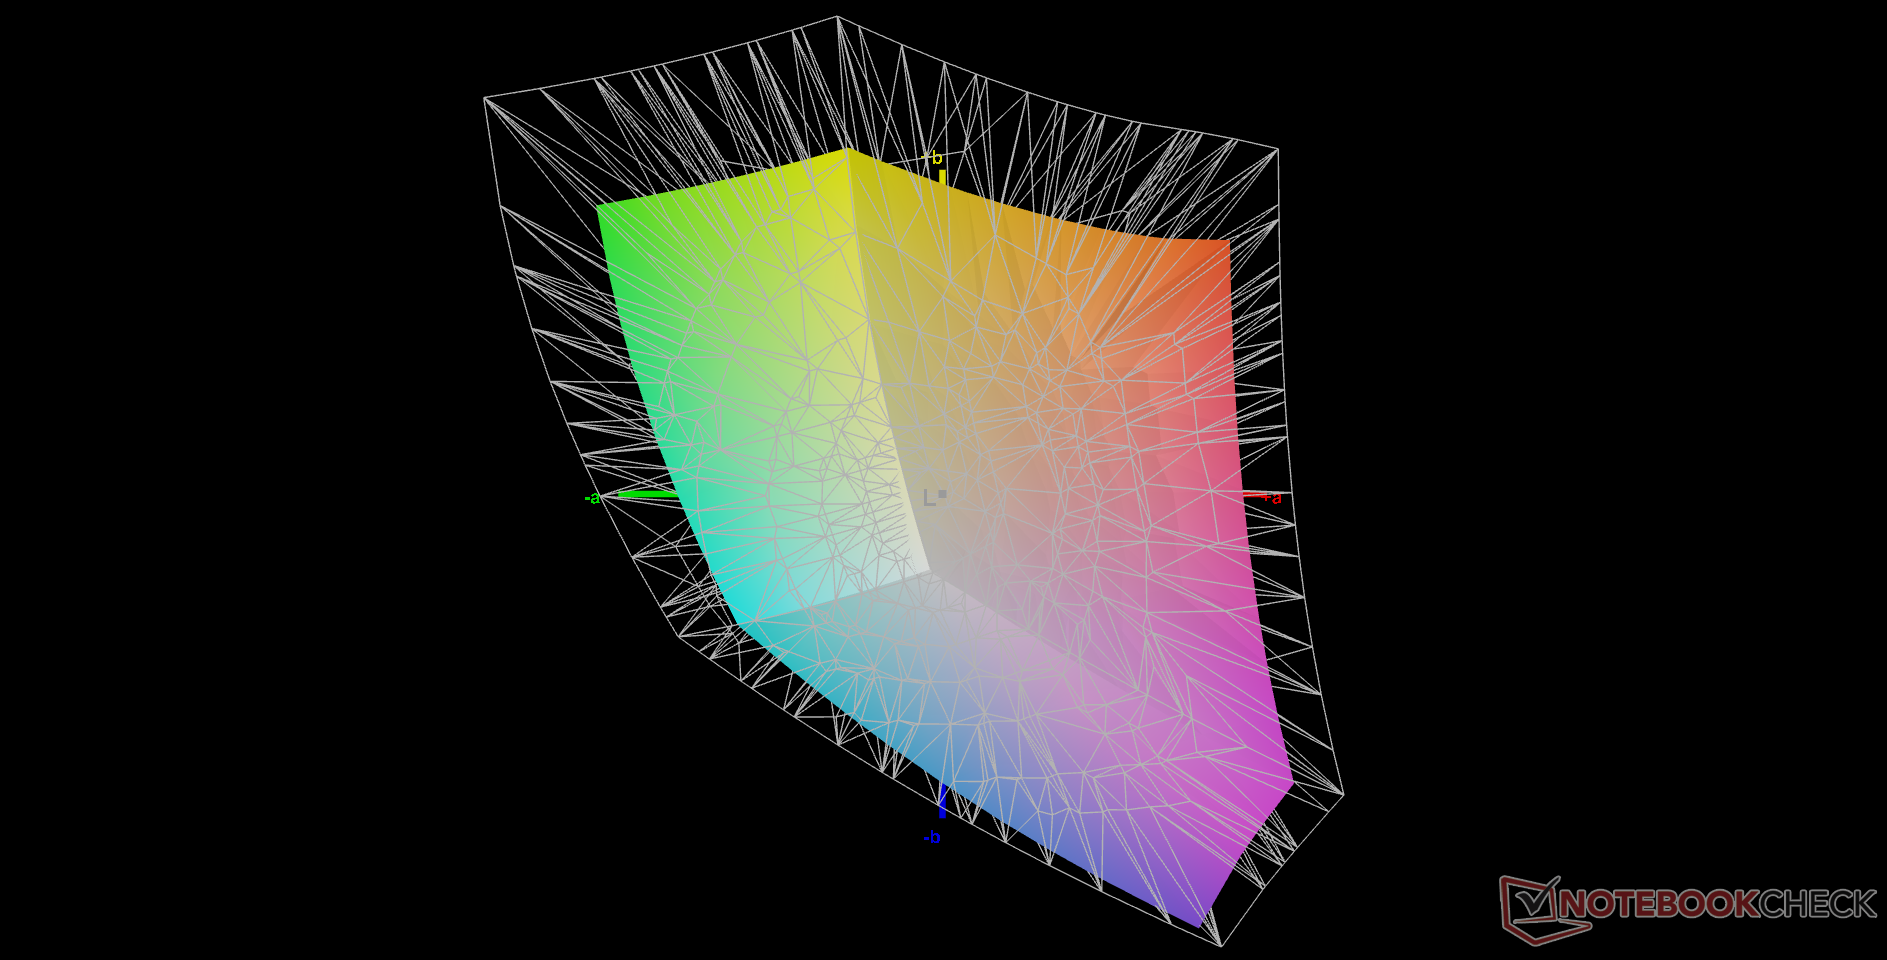
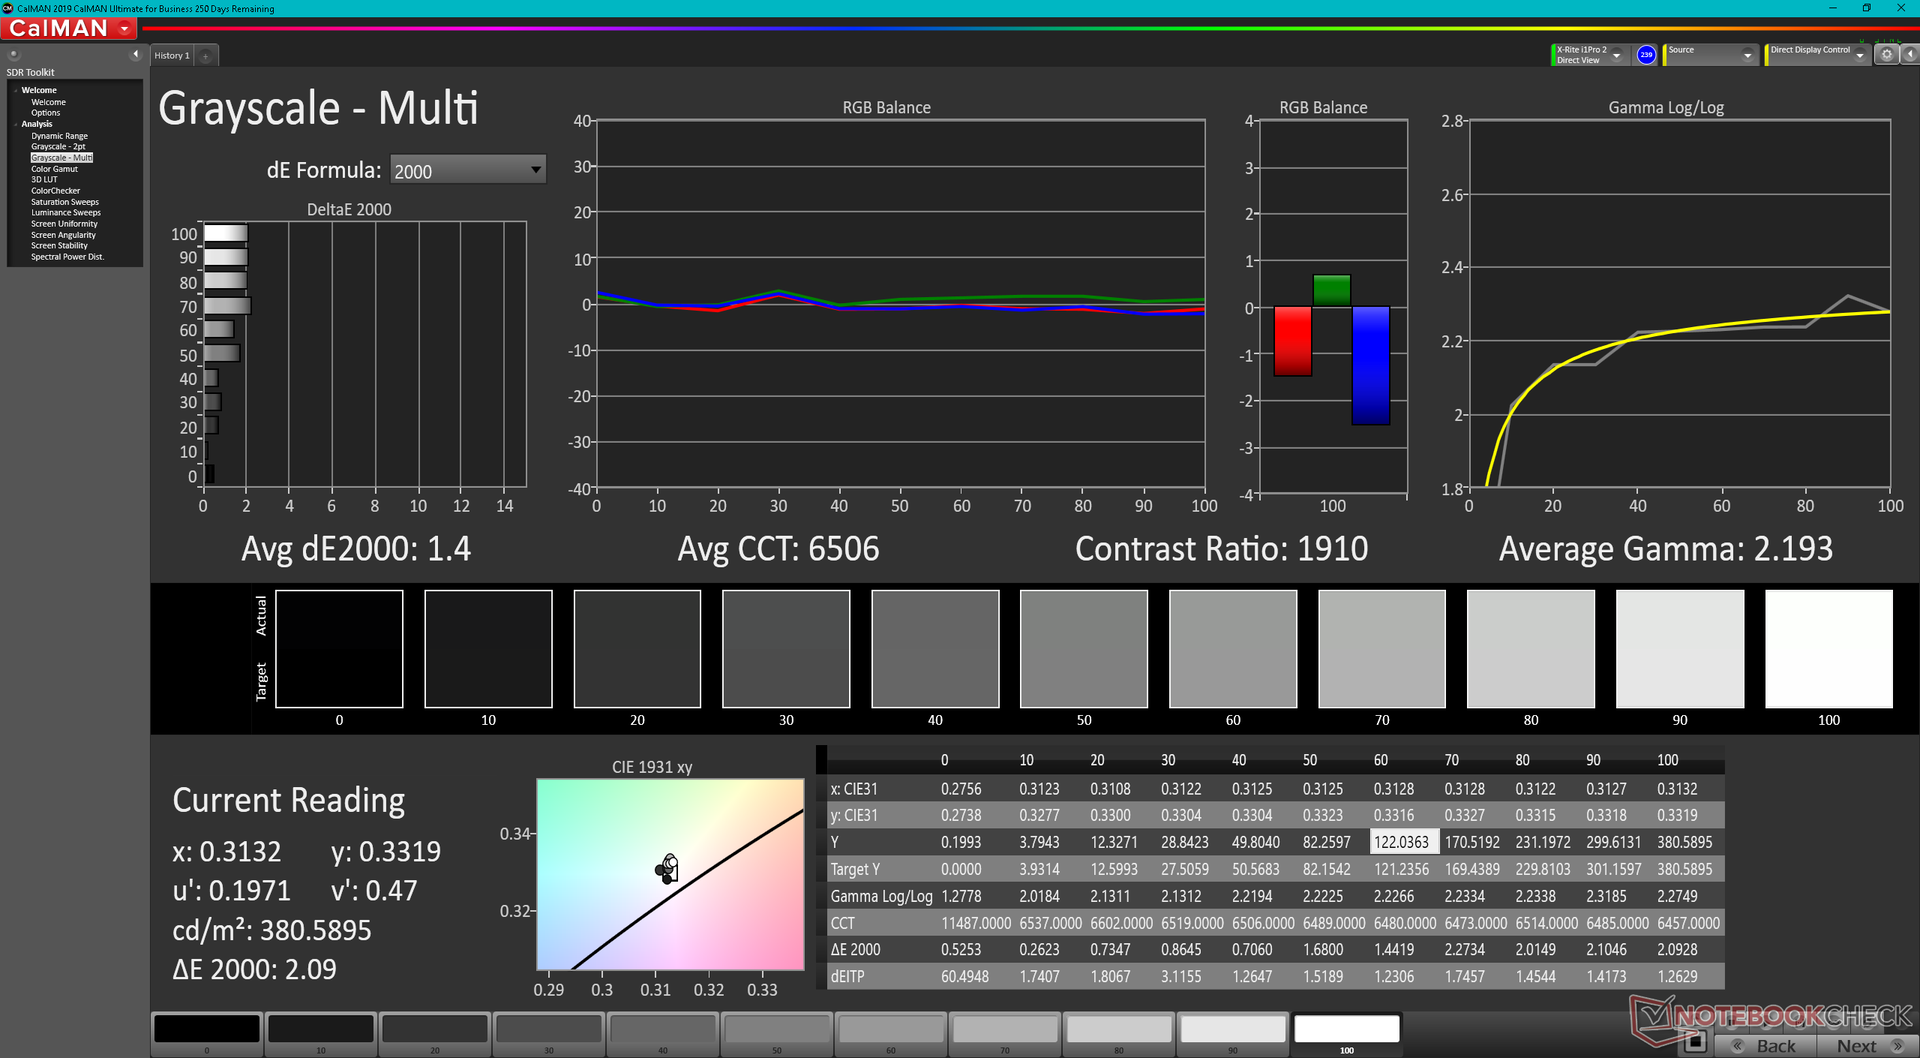
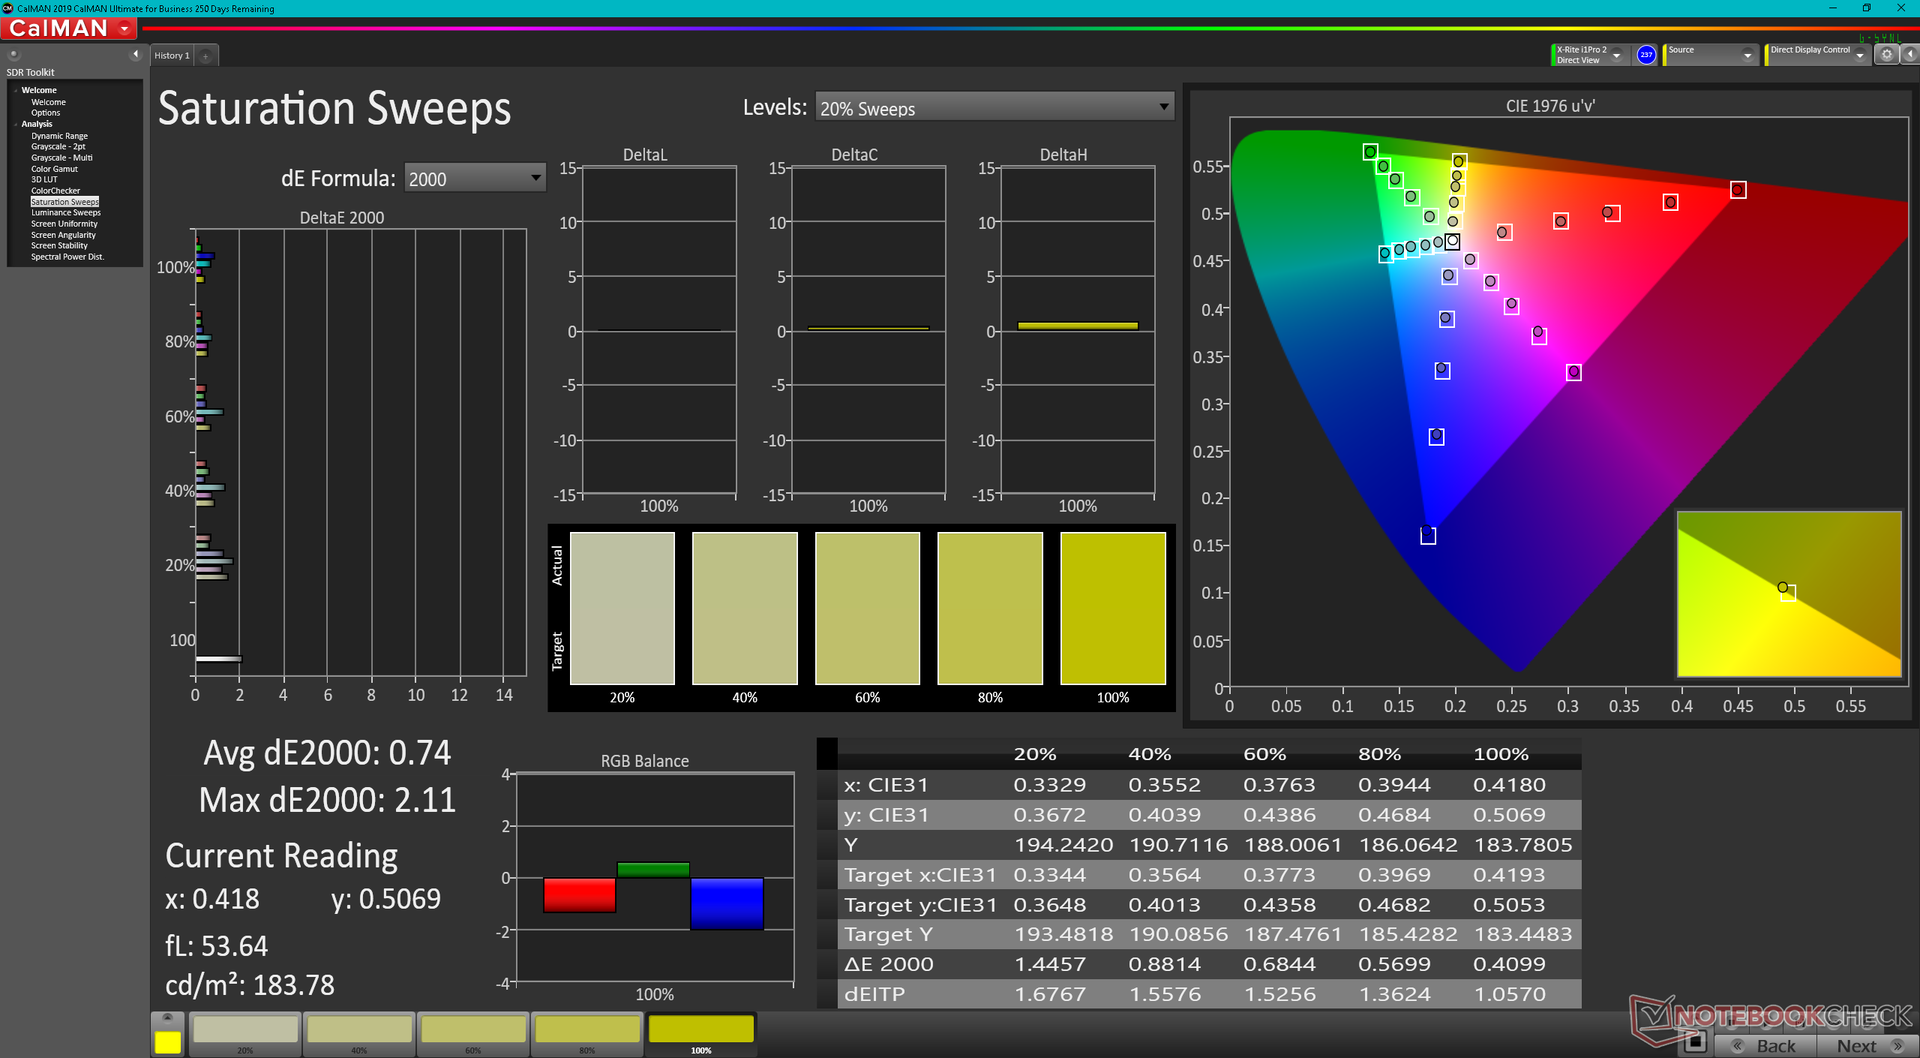
奇美N125HCG-GQ1 IPS面板是第一个出现在我们数据库中的。它是极少数具有全sRGB覆盖率的12.5英寸面板之一,相对于其他IPS显示器,它的对比度非常深。主要的缺点是黑白和灰白的响应时间较慢,鉴于SX12不是一台游戏机,这并不意外。尽管如此,在大多数情况下,预计会出现一些明显的重影。
| |||||||||||||||||||||||||
Brightness Distribution: 90 %
Center on Battery: 384.8 cd/m²
Contrast: 2138:1 (Black: 0.18 cd/m²)
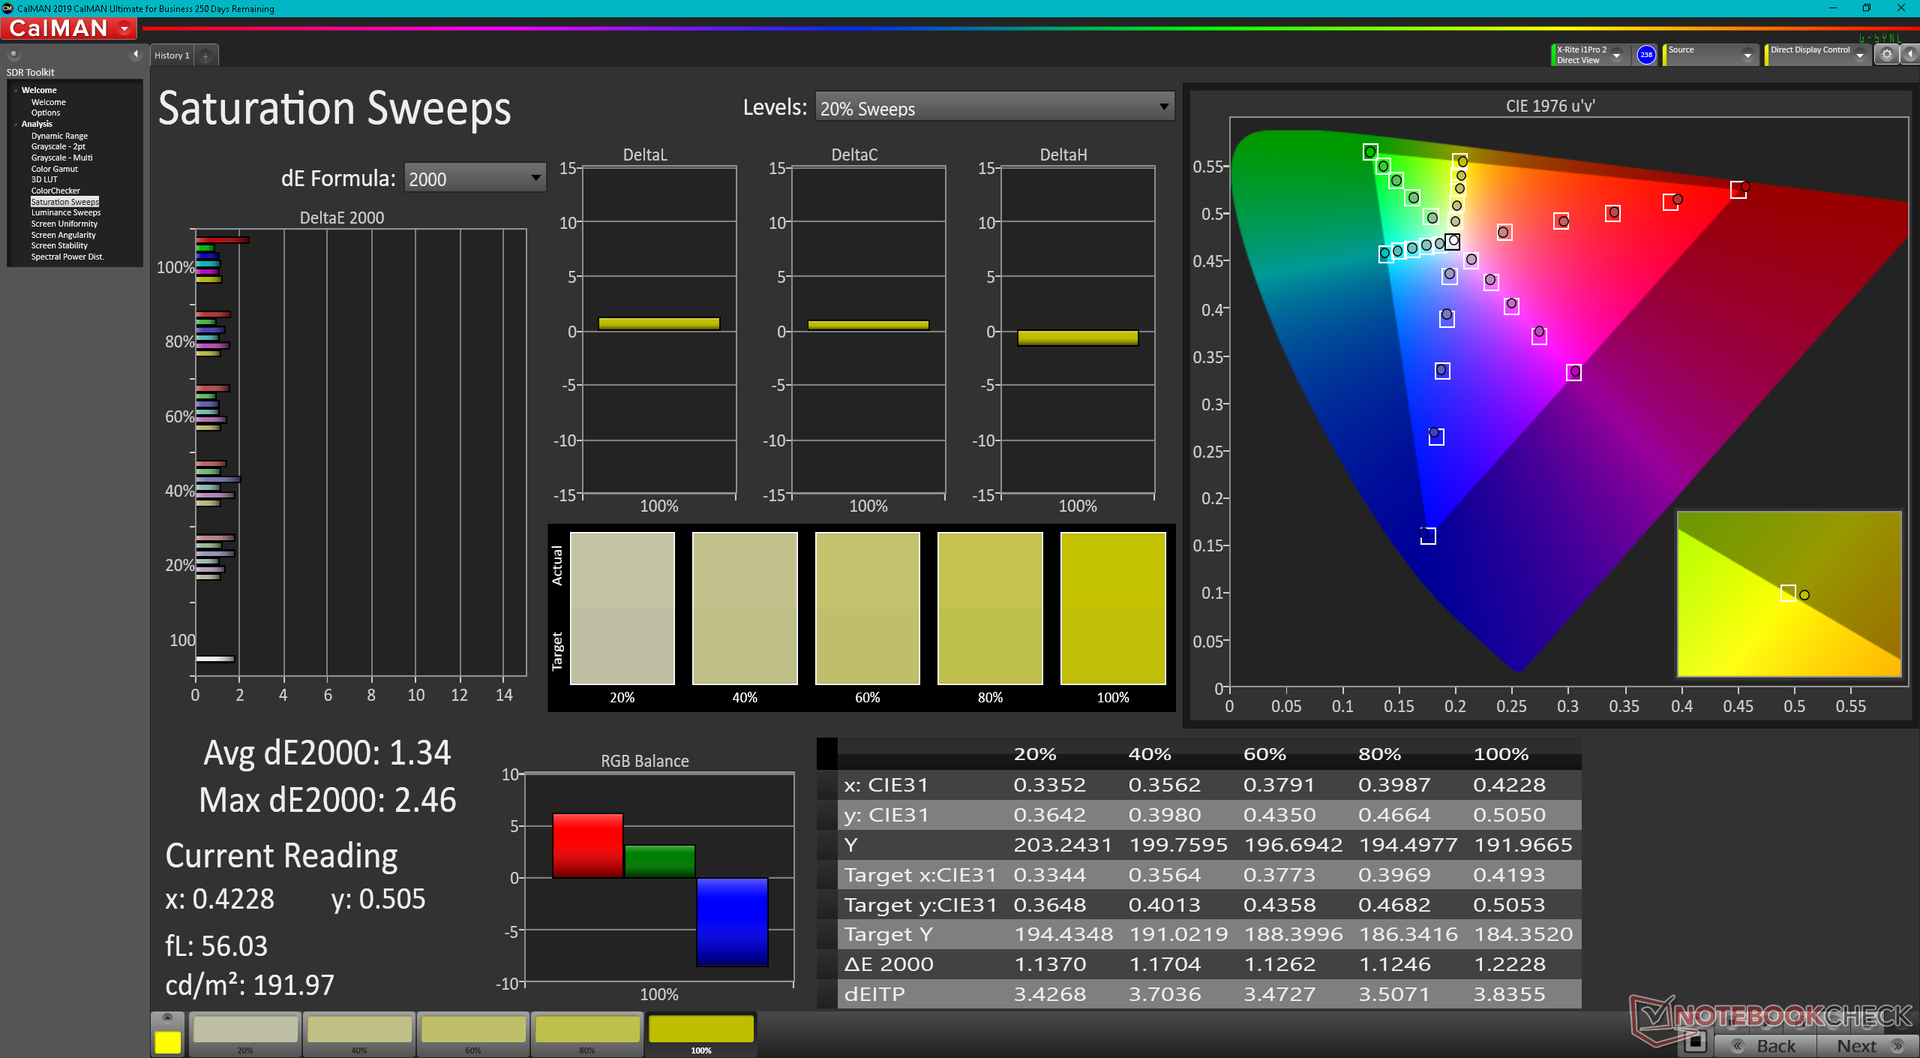
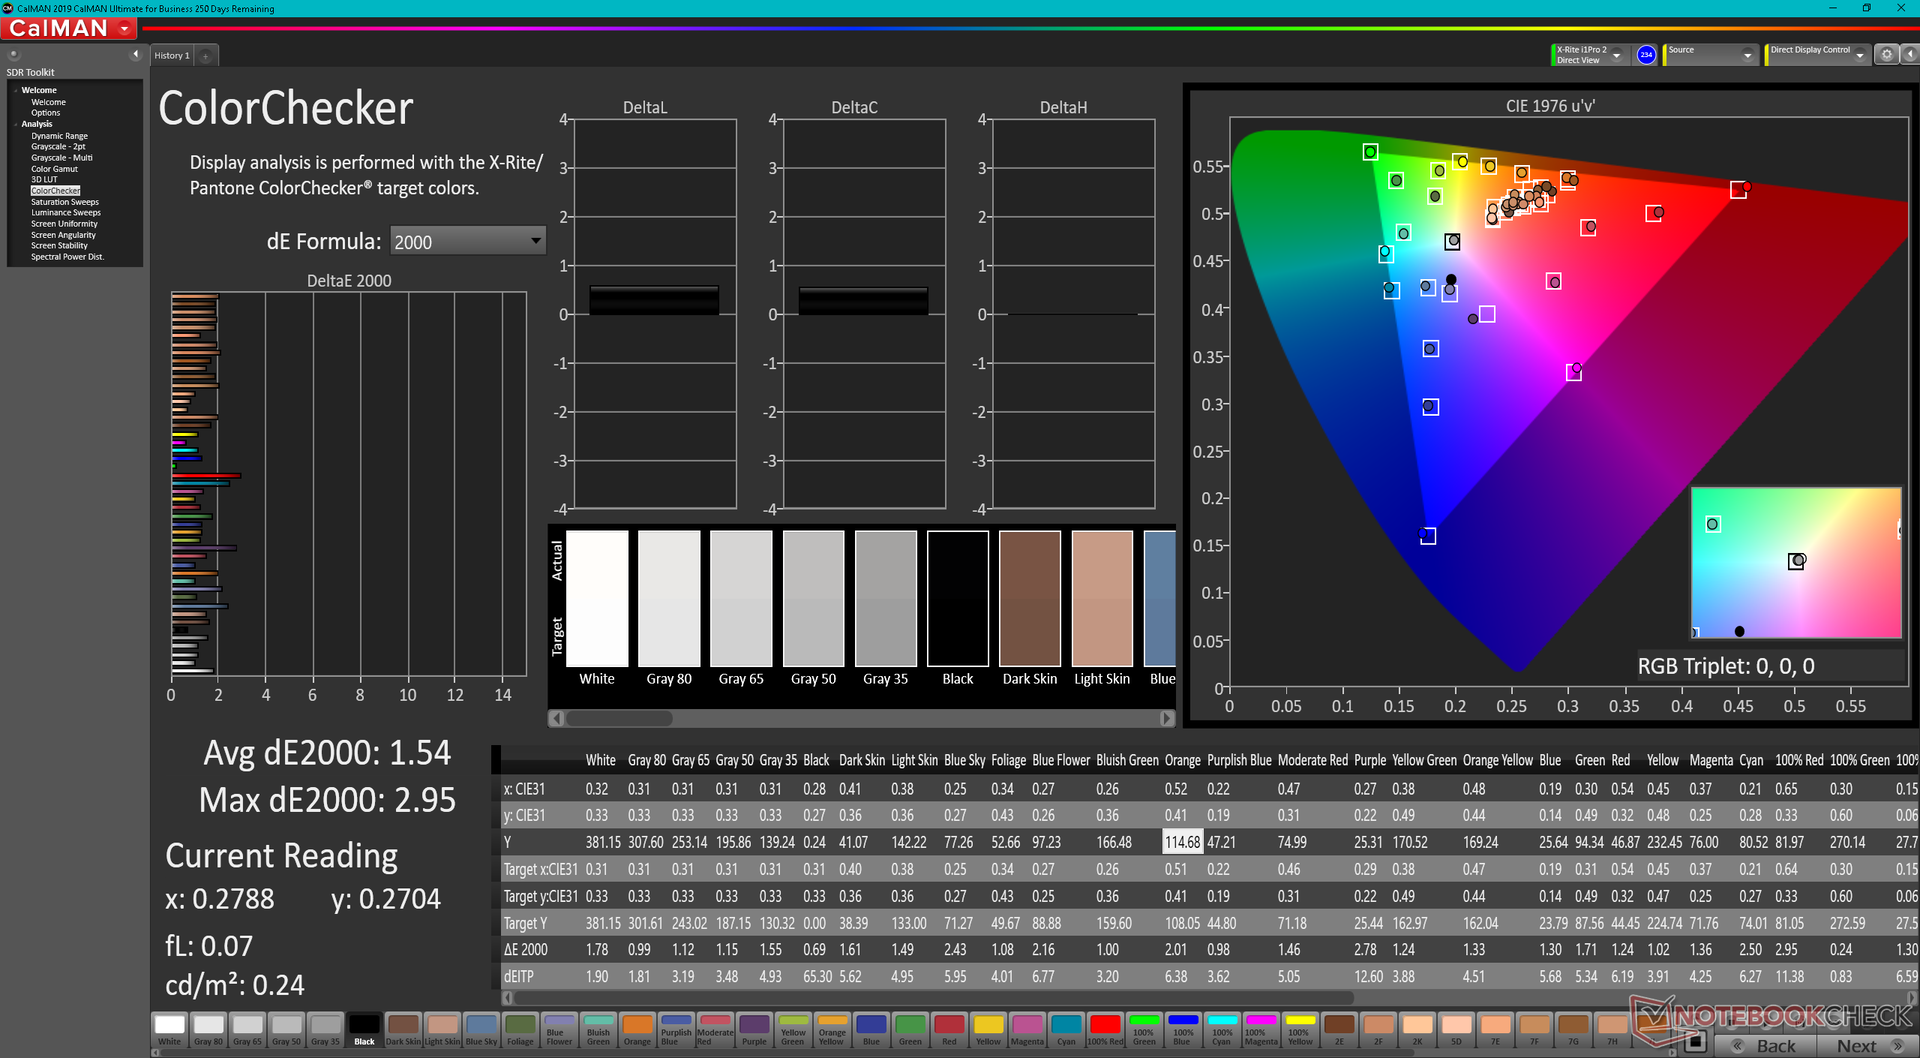
ΔE ColorChecker Calman: 1.54 | ∀{0.5-29.43 Ø4.71}
calibrated: 0.96
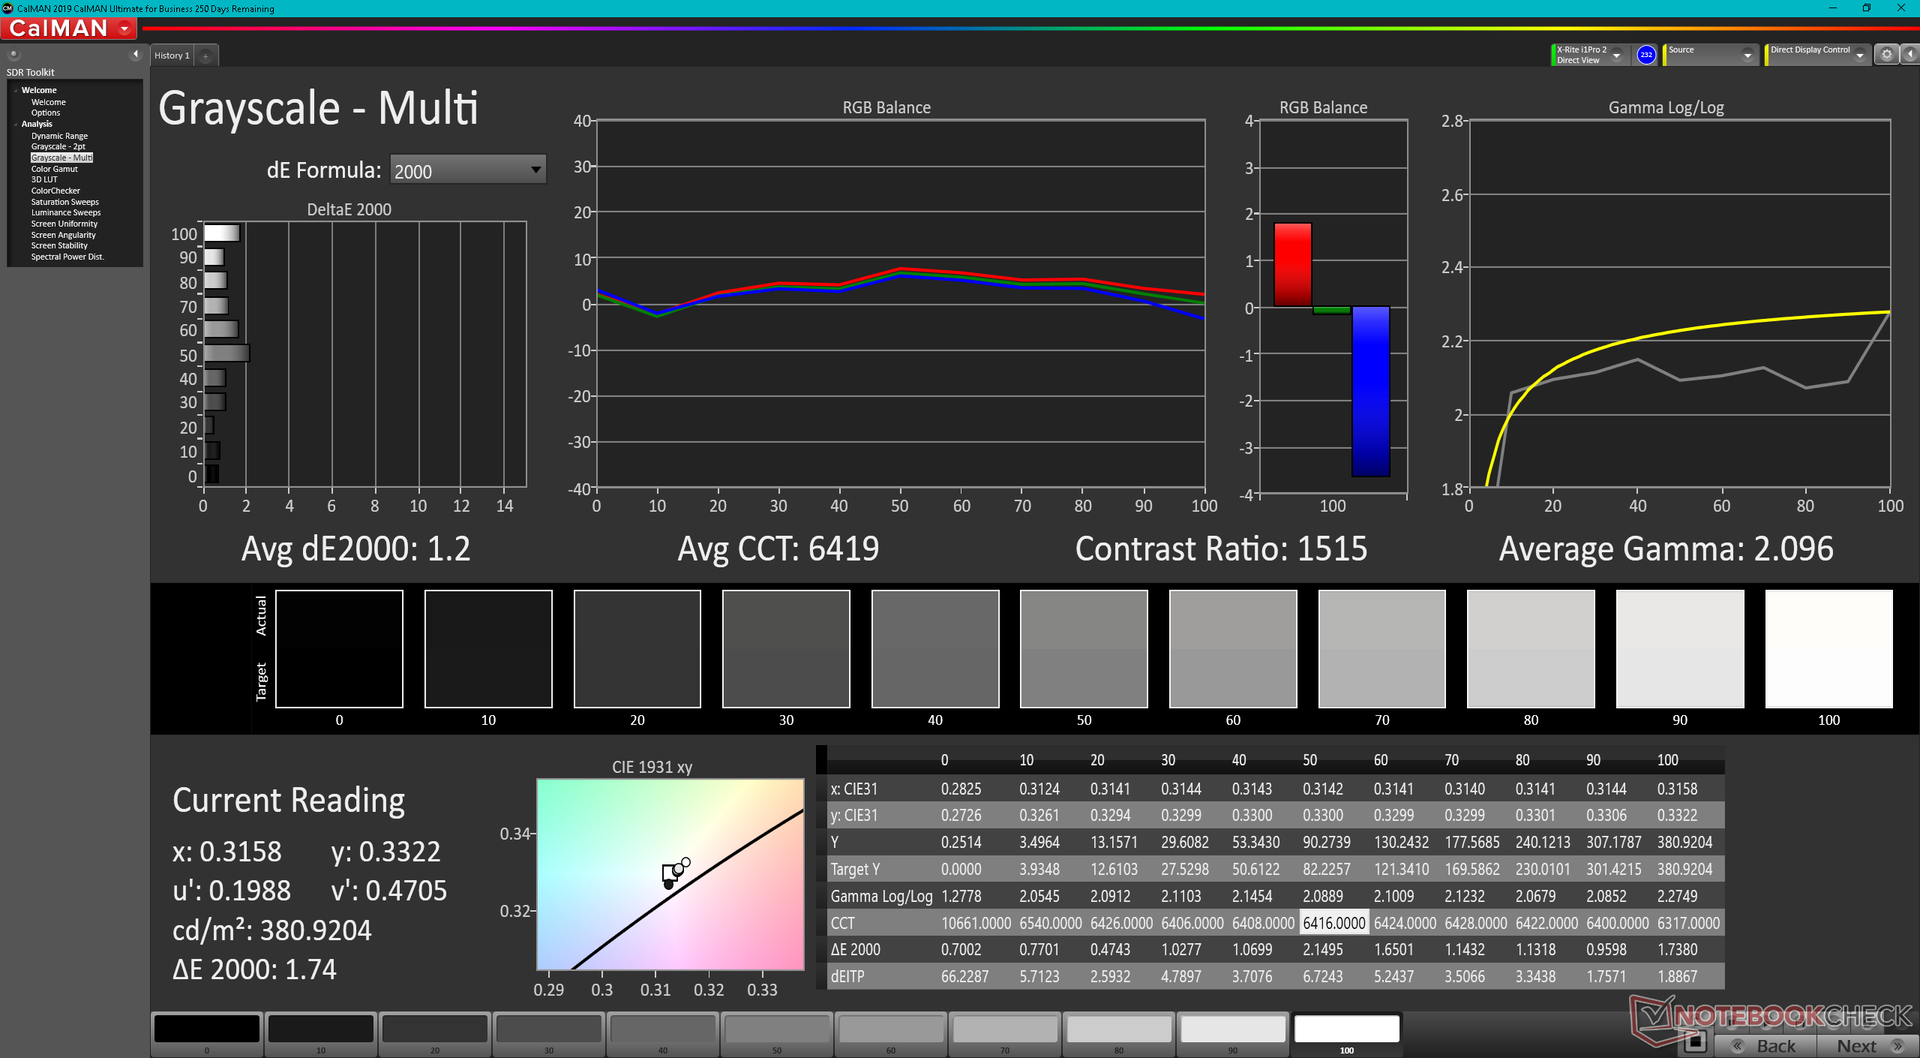
ΔE Greyscale Calman: 1.2 | ∀{0.09-98 Ø4.96}
69.4% AdobeRGB 1998 (Argyll 3D)
99.2% sRGB (Argyll 3D)
67.6% Display P3 (Argyll 3D)
Gamma: 2.1
CCT: 6419 K
| VAIO SX12 VJS124X1011P Chi Mei N125HCG-GQ1, IPS, 1920x1080, 12.5" | VAIO A12-92993 InfoVision IVO04E6, IPS, 1920x1080, 12.5" | VAIO SX14 VJS144X0111K Sharp LQ140M1JW55, IPS, 1920x1080, 14" | Huawei MateBook E Core i5 EDOC660, OLED, 2560x1600, 12.6" | Dell Latitude 7200 SHP14A3 LQ123N1, IPS LED, 1920x1280, 12.3" | Dell XPS 13 9310 Core i7 FHD Sharp LQ134N1, IPS, 1920x1200, 13.4" | |
|---|---|---|---|---|---|---|
| Display | -31% | -2% | 18% | 4% | 3% | |
| Display P3 Coverage (%) | 67.6 | 46 -32% | 66.8 -1% | 99.9 48% | 71.6 6% | 70.9 5% |
| sRGB Coverage (%) | 99.2 | 69.3 -30% | 97.7 -2% | 100 1% | 99.5 0% | 99.1 0% |
| AdobeRGB 1998 Coverage (%) | 69.4 | 47.52 -32% | 67.9 -2% | 72.9 5% | 72.6 5% | 72.9 5% |
| Response Times | 20% | -1% | 93% | 15% | 17% | |
| Response Time Grey 50% / Grey 80% * (ms) | 60 ? | 52.8 ? 12% | 54 ? 10% | 4 ? 93% | 52 ? 13% | 52 ? 13% |
| Response Time Black / White * (ms) | 41.6 ? | 30.4 ? 27% | 46.4 ? -12% | 3.2 ? 92% | 34.8 ? 16% | 33.2 ? 20% |
| PWM Frequency (Hz) | 990 ? | 60.2 ? | 1645 ? | 2475 ? | ||
| Screen | -102% | -48% | 18% | -18% | -73% | |
| Brightness middle (cd/m²) | 384.8 | 315 -18% | 373.4 -3% | 399 4% | 401 4% | 543.3 41% |
| Brightness (cd/m²) | 361 | 294 -19% | 376 4% | 407 13% | 385 7% | 524 45% |
| Brightness Distribution (%) | 90 | 89 -1% | 88 -2% | 94 4% | 88 -2% | 92 2% |
| Black Level * (cd/m²) | 0.18 | 0.21 -17% | 0.23 -28% | 0.28 -56% | 0.38 -111% | |
| Contrast (:1) | 2138 | 1500 -30% | 1623 -24% | 1432 -33% | 1430 -33% | |
| Colorchecker dE 2000 * | 1.54 | 4.4 -186% | 2.99 -94% | 1 35% | 1.8 -17% | 3.02 -96% |
| Colorchecker dE 2000 max. * | 2.95 | 7.1 -141% | 5.29 -79% | 1.6 46% | 3.4 -15% | 7.61 -158% |
| Colorchecker dE 2000 calibrated * | 0.96 | 2.9 -202% | 0.49 49% | 1.1 -15% | 1.23 -28% | |
| Greyscale dE 2000 * | 1.2 | 4.8 -300% | 4.3 -258% | 1.1 8% | 1.6 -33% | 5 -317% |
| Gamma | 2.1 105% | 2.02 109% | 2.02 109% | 2.14 103% | 2.14 103% | 2.02 109% |
| CCT | 6419 101% | 7307 89% | 6537 99% | 6434 101% | 6702 97% | 6550 99% |
| Color Space (Percent of AdobeRGB 1998) (%) | 44 | 66.6 | 66.8 | |||
| Color Space (Percent of sRGB) (%) | 69.5 | 99.4 | 99.6 | |||
| Total Average (Program / Settings) | -38% /
-69% | -17% /
-32% | 43% /
32% | 0% /
-9% | -18% /
-44% |
* ... smaller is better
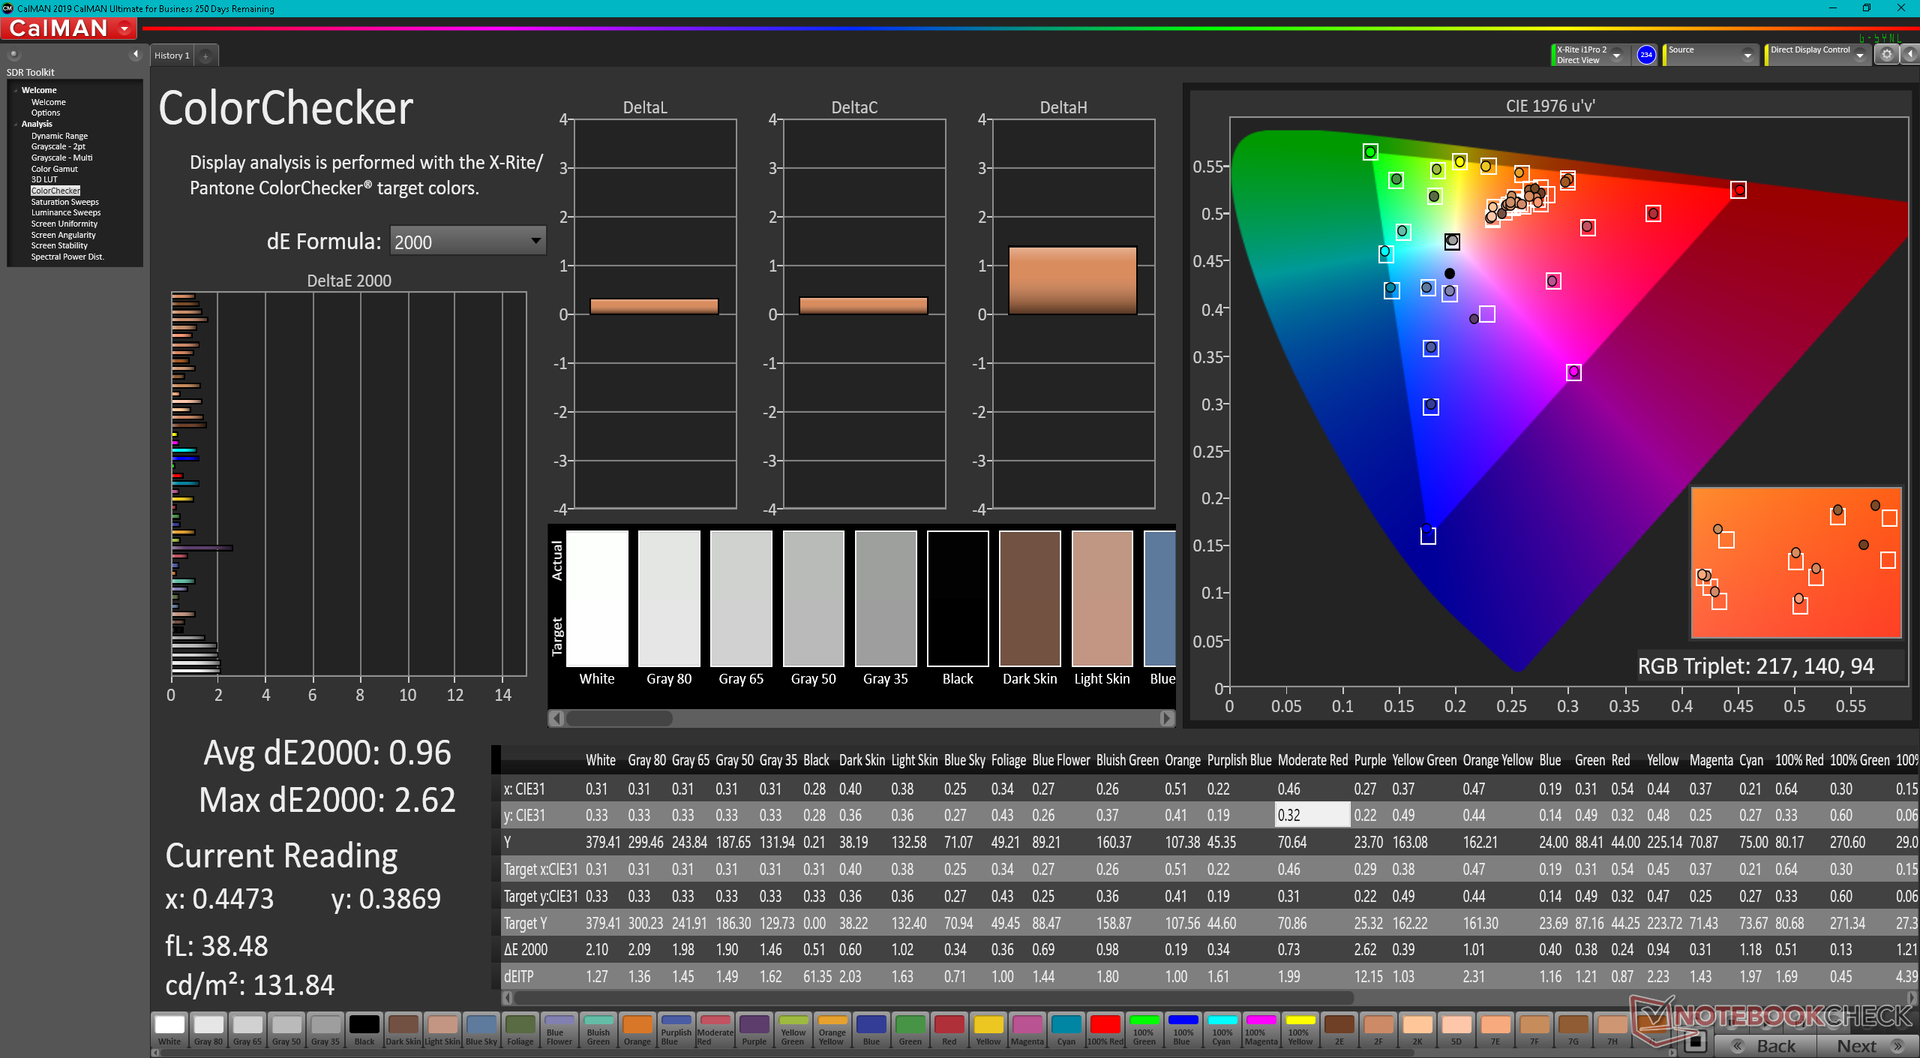
正如我们下面的CalMAN结果所显示的那样,该显示器在开箱时就已经被很好地校准了。平均灰度和彩色DeltaE值分别为1.2和1.54,如果优先考虑sRGB覆盖率,则适合大多数图形编辑。我们自己用X-Rite色度计进行的校准,只能略微提高色彩精度。
Display Response Times
| ↔ Response Time Black to White | ||
|---|---|---|
| 41.6 ms ... rise ↗ and fall ↘ combined | ↗ 19.6 ms rise | 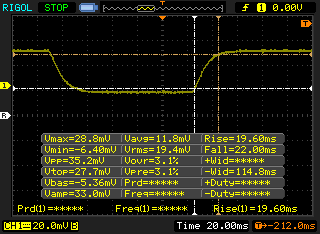 |
| ↘ 22 ms fall | ||
| The screen shows slow response rates in our tests and will be unsatisfactory for gamers. In comparison, all tested devices range from 0.1 (minimum) to 240 (maximum) ms. » 98 % of all devices are better. This means that the measured response time is worse than the average of all tested devices (19.8 ms). | ||
| ↔ Response Time 50% Grey to 80% Grey | ||
| 60 ms ... rise ↗ and fall ↘ combined | ↗ 28.8 ms rise | 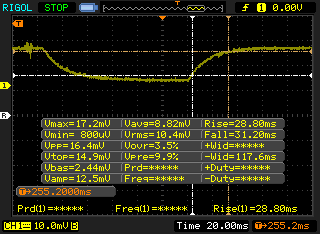 |
| ↘ 31.2 ms fall | ||
| The screen shows slow response rates in our tests and will be unsatisfactory for gamers. In comparison, all tested devices range from 0.165 (minimum) to 636 (maximum) ms. » 96 % of all devices are better. This means that the measured response time is worse than the average of all tested devices (30.9 ms). | ||
Screen Flickering / PWM (Pulse-Width Modulation)
| Screen flickering / PWM not detected | 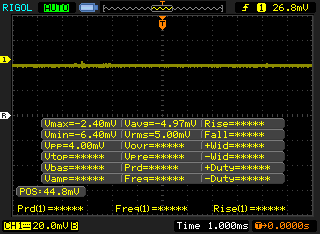 | ||
In comparison: 52 % of all tested devices do not use PWM to dim the display. If PWM was detected, an average of 7748 (minimum: 5 - maximum: 343500) Hz was measured. | |||
性能 - 小尺寸,大性能
测试条件
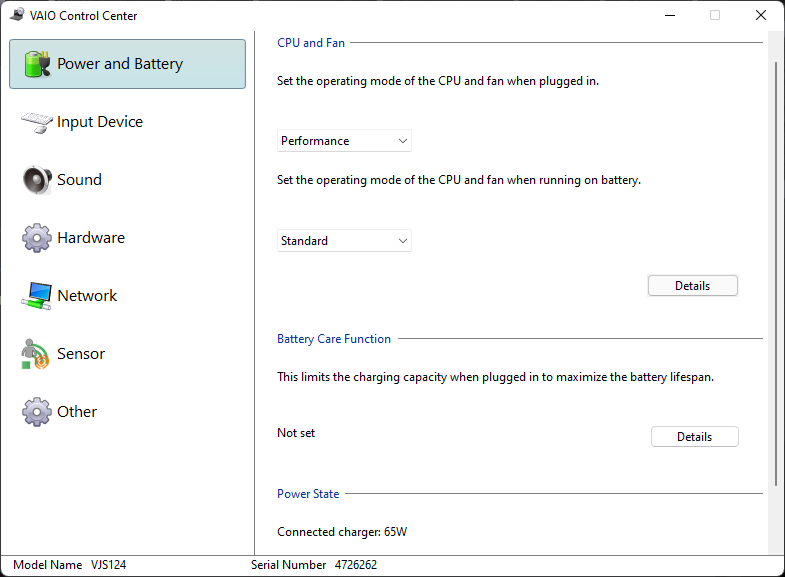
我们的设备通过预装的Vaio控制中心软件被设置为性能模式,以获得尽可能高的基准分数。用户应该熟悉这个软件,因为关键功能在这里被切换,包括键盘背光行为、功能键快捷方式、红外摄像头传感器等等。
处理器
从不常见的CPU性能 酷睿i5-1155G7 是令人印象深刻的结果,比我们数据库中的平均笔记本电脑快20%,与 酷睿i5-1135G7.事实上,这里的CPU能够胜过许多其他配备所谓更快的笔记本电脑 酷睿i7-1165G7包括 三星Galaxy Book Pro 15.
有趣的是,在我们的CineBench R15 xT循环测试开始时,性能会出现下滑,然后再恢复,如下图所示。
Cinebench R15 Multi Loop
Cinebench R23: Multi Core | Single Core
Cinebench R15: CPU Multi 64Bit | CPU Single 64Bit
Blender: v2.79 BMW27 CPU
7-Zip 18.03: 7z b 4 | 7z b 4 -mmt1
Geekbench 5.5: Multi-Core | Single-Core
HWBOT x265 Benchmark v2.2: 4k Preset
LibreOffice : 20 Documents To PDF
R Benchmark 2.5: Overall mean
| Cinebench R20 / CPU (Multi Core) | |
| Lenovo ThinkPad L15 G2 AMD | |
| Dell XPS 13 7390 Core i7-10710U | |
| Average Intel Core i5-1155G7 (2123 - 2273, n=3) | |
| VAIO SX12 VJS124X1011P | |
| Microsoft Surface Pro 8, i7-1185G7 | |
| Asus ExpertBook B5 Flip B5302FEA | |
| Dynabook Portégé X30W-J-10K | |
| Average Intel Core i5-1135G7 (979 - 2382, n=62) | |
| Dell XPS 13 9300 i5 FHD | |
| HP Elite Dragonfly Max | |
| Asus ZenBook 13 UX325JA | |
| Lenovo ThinkPad X13 Yoga 20SX0004GE | |
| Cinebench R20 / CPU (Single Core) | |
| Microsoft Surface Pro 8, i7-1185G7 | |
| Dynabook Portégé X30W-J-10K | |
| VAIO SX12 VJS124X1011P | |
| HP Elite Dragonfly Max | |
| Average Intel Core i5-1155G7 (521 - 551, n=3) | |
| Lenovo ThinkPad L15 G2 AMD | |
| Asus ExpertBook B5 Flip B5302FEA | |
| Average Intel Core i5-1135G7 (375 - 527, n=62) | |
| Dell XPS 13 7390 Core i7-10710U | |
| Asus ZenBook 13 UX325JA | |
| Dell XPS 13 9300 i5 FHD | |
| Lenovo ThinkPad X13 Yoga 20SX0004GE | |
| Cinebench R23 / Multi Core | |
| Lenovo ThinkPad L15 G2 AMD | |
| Microsoft Surface Pro 8, i7-1185G7 | |
| Average Intel Core i5-1155G7 (5471 - 5791, n=3) | |
| VAIO SX12 VJS124X1011P | |
| Asus ExpertBook B5 Flip B5302FEA | |
| Dynabook Portégé X30W-J-10K | |
| Average Intel Core i5-1135G7 (2786 - 6136, n=55) | |
| HP Elite Dragonfly Max | |
| Cinebench R23 / Single Core | |
| Microsoft Surface Pro 8, i7-1185G7 | |
| Dynabook Portégé X30W-J-10K | |
| VAIO SX12 VJS124X1011P | |
| Average Intel Core i5-1155G7 (1362 - 1446, n=3) | |
| HP Elite Dragonfly Max | |
| Lenovo ThinkPad L15 G2 AMD | |
| Asus ExpertBook B5 Flip B5302FEA | |
| Average Intel Core i5-1135G7 (1062 - 1373, n=53) | |
| Cinebench R15 / CPU Multi 64Bit | |
| Lenovo ThinkPad L15 G2 AMD | |
| Dell XPS 13 7390 Core i7-10710U | |
| Microsoft Surface Pro 8, i7-1185G7 | |
| Asus ExpertBook B5 Flip B5302FEA | |
| Average Intel Core i5-1155G7 (858 - 928, n=3) | |
| VAIO SX12 VJS124X1011P | |
| Average Intel Core i5-1135G7 (431 - 941, n=65) | |
| Dynabook Portégé X30W-J-10K | |
| Asus ZenBook 13 UX325JA | |
| Dell XPS 13 9300 i5 FHD | |
| Dell XPS 13 9300 i5 FHD | |
| HP Elite Dragonfly Max | |
| Lenovo ThinkPad X13 Yoga 20SX0004GE | |
| Cinebench R15 / CPU Single 64Bit | |
| Microsoft Surface Pro 8, i7-1185G7 | |
| Lenovo ThinkPad L15 G2 AMD | |
| Dynabook Portégé X30W-J-10K | |
| Average Intel Core i5-1155G7 (210 - 211, n=3) | |
| VAIO SX12 VJS124X1011P | |
| Asus ExpertBook B5 Flip B5302FEA | |
| Average Intel Core i5-1135G7 (141.4 - 205, n=61) | |
| Asus ZenBook 13 UX325JA | |
| Dell XPS 13 7390 Core i7-10710U | |
| Lenovo ThinkPad X13 Yoga 20SX0004GE | |
| HP Elite Dragonfly Max | |
| Dell XPS 13 9300 i5 FHD | |
| Blender / v2.79 BMW27 CPU | |
| Asus ZenBook 13 UX325JA | |
| Lenovo ThinkPad X13 Yoga 20SX0004GE | |
| Dell XPS 13 9300 i5 FHD | |
| HP Elite Dragonfly Max | |
| Average Intel Core i5-1135G7 (499 - 1044, n=60) | |
| Dynabook Portégé X30W-J-10K | |
| Asus ExpertBook B5 Flip B5302FEA | |
| Dell XPS 13 7390 Core i7-10710U | |
| Microsoft Surface Pro 8, i7-1185G7 | |
| Average Intel Core i5-1155G7 (536 - 566, n=3) | |
| VAIO SX12 VJS124X1011P | |
| Lenovo ThinkPad L15 G2 AMD | |
| 7-Zip 18.03 / 7z b 4 | |
| Lenovo ThinkPad L15 G2 AMD | |
| Dell XPS 13 7390 Core i7-10710U | |
| Average Intel Core i5-1155G7 (24862 - 25203, n=3) | |
| VAIO SX12 VJS124X1011P | |
| Microsoft Surface Pro 8, i7-1185G7 | |
| Asus ExpertBook B5 Flip B5302FEA | |
| Dynabook Portégé X30W-J-10K | |
| Average Intel Core i5-1135G7 (14745 - 24873, n=62) | |
| HP Elite Dragonfly Max | |
| Dell XPS 13 9300 i5 FHD | |
| Lenovo ThinkPad X13 Yoga 20SX0004GE | |
| Asus ZenBook 13 UX325JA | |
| 7-Zip 18.03 / 7z b 4 -mmt1 | |
| Lenovo ThinkPad L15 G2 AMD | |
| Microsoft Surface Pro 8, i7-1185G7 | |
| HP Elite Dragonfly Max | |
| Dynabook Portégé X30W-J-10K | |
| VAIO SX12 VJS124X1011P | |
| Average Intel Core i5-1155G7 (4603 - 4949, n=3) | |
| Asus ExpertBook B5 Flip B5302FEA | |
| Average Intel Core i5-1135G7 (3924 - 4921, n=62) | |
| Lenovo ThinkPad X13 Yoga 20SX0004GE | |
| Dell XPS 13 7390 Core i7-10710U | |
| Asus ZenBook 13 UX325JA | |
| Dell XPS 13 9300 i5 FHD | |
| Geekbench 5.5 / Multi-Core | |
| Microsoft Surface Pro 8, i7-1185G7 | |
| Average Intel Core i5-1155G7 (5654 - 5825, n=3) | |
| VAIO SX12 VJS124X1011P | |
| Dynabook Portégé X30W-J-10K | |
| HP Elite Dragonfly Max | |
| Lenovo ThinkPad L15 G2 AMD | |
| Average Intel Core i5-1135G7 (3475 - 5472, n=58) | |
| Asus ZenBook 13 UX325JA | |
| Asus ExpertBook B5 Flip B5302FEA | |
| Dell XPS 13 9300 i5 FHD | |
| Lenovo ThinkPad X13 Yoga 20SX0004GE | |
| Geekbench 5.5 / Single-Core | |
| Microsoft Surface Pro 8, i7-1185G7 | |
| HP Elite Dragonfly Max | |
| Dynabook Portégé X30W-J-10K | |
| VAIO SX12 VJS124X1011P | |
| Average Intel Core i5-1155G7 (1461 - 1480, n=3) | |
| Average Intel Core i5-1135G7 (1147 - 1428, n=58) | |
| Asus ExpertBook B5 Flip B5302FEA | |
| Lenovo ThinkPad L15 G2 AMD | |
| Asus ZenBook 13 UX325JA | |
| Dell XPS 13 9300 i5 FHD | |
| Lenovo ThinkPad X13 Yoga 20SX0004GE | |
| HWBOT x265 Benchmark v2.2 / 4k Preset | |
| Lenovo ThinkPad L15 G2 AMD | |
| VAIO SX12 VJS124X1011P | |
| Average Intel Core i5-1155G7 (7.13 - 7.55, n=3) | |
| Microsoft Surface Pro 8, i7-1185G7 | |
| Dynabook Portégé X30W-J-10K | |
| Dell XPS 13 7390 Core i7-10710U | |
| Average Intel Core i5-1135G7 (3.57 - 7.6, n=57) | |
| Asus ExpertBook B5 Flip B5302FEA | |
| HP Elite Dragonfly Max | |
| Lenovo ThinkPad X13 Yoga 20SX0004GE | |
| Dell XPS 13 9300 i5 FHD | |
| Asus ZenBook 13 UX325JA | |
| LibreOffice / 20 Documents To PDF | |
| Lenovo ThinkPad X13 Yoga 20SX0004GE | |
| Average Intel Core i5-1135G7 (44.2 - 62.9, n=60) | |
| Asus ExpertBook B5 Flip B5302FEA | |
| VAIO SX12 VJS124X1011P | |
| Average Intel Core i5-1155G7 (51.4 - 52.7, n=3) | |
| Asus ZenBook 13 UX325JA | |
| Microsoft Surface Pro 8, i7-1185G7 | |
| Dynabook Portégé X30W-J-10K | |
| Lenovo ThinkPad L15 G2 AMD | |
| HP Elite Dragonfly Max | |
| R Benchmark 2.5 / Overall mean | |
| Dell XPS 13 9300 i5 FHD | |
| Asus ZenBook 13 UX325JA | |
| Lenovo ThinkPad X13 Yoga 20SX0004GE | |
| Average Intel Core i5-1135G7 (0.619 - 0.727, n=59) | |
| Asus ExpertBook B5 Flip B5302FEA | |
| VAIO SX12 VJS124X1011P | |
| Average Intel Core i5-1155G7 (0.605 - 0.616, n=3) | |
| HP Elite Dragonfly Max | |
| Dynabook Portégé X30W-J-10K | |
| Microsoft Surface Pro 8, i7-1185G7 | |
| Lenovo ThinkPad L15 G2 AMD | |
* ... smaller is better
AIDA64: FP32 Ray-Trace | FPU Julia | CPU SHA3 | CPU Queen | FPU SinJulia | FPU Mandel | CPU AES | CPU ZLib | FP64 Ray-Trace | CPU PhotoWorxx
| Performance rating | |
| VAIO SX12 VJS124X1011P | |
| Average Intel Core i5-1155G7 | |
| VAIO SX14 VJS144X0111K | |
| Huawei MateBook E Core i5 | |
| Dynabook Portégé X40-G-10K | |
| AIDA64 / FP32 Ray-Trace | |
| VAIO SX12 VJS124X1011P | |
| Average Intel Core i5-1155G7 (7146 - 8007, n=3) | |
| VAIO SX14 VJS144X0111K | |
| Dynabook Portégé X40-G-10K | |
| Huawei MateBook E Core i5 | |
| AIDA64 / FPU Julia | |
| VAIO SX12 VJS124X1011P | |
| Average Intel Core i5-1155G7 (31134 - 33150, n=3) | |
| VAIO SX14 VJS144X0111K | |
| Dynabook Portégé X40-G-10K | |
| Huawei MateBook E Core i5 | |
| AIDA64 / CPU SHA3 | |
| VAIO SX12 VJS124X1011P | |
| Average Intel Core i5-1155G7 (2078 - 2201, n=3) | |
| VAIO SX14 VJS144X0111K | |
| Huawei MateBook E Core i5 | |
| Dynabook Portégé X40-G-10K | |
| AIDA64 / CPU Queen | |
| Average Intel Core i5-1155G7 (52180 - 52265, n=3) | |
| VAIO SX12 VJS124X1011P | |
| VAIO SX14 VJS144X0111K | |
| Dynabook Portégé X40-G-10K | |
| Huawei MateBook E Core i5 | |
| AIDA64 / FPU SinJulia | |
| VAIO SX12 VJS124X1011P | |
| Average Intel Core i5-1155G7 (4936 - 5001, n=3) | |
| VAIO SX14 VJS144X0111K | |
| Dynabook Portégé X40-G-10K | |
| Huawei MateBook E Core i5 | |
| AIDA64 / FPU Mandel | |
| VAIO SX12 VJS124X1011P | |
| Average Intel Core i5-1155G7 (18707 - 19716, n=3) | |
| VAIO SX14 VJS144X0111K | |
| Huawei MateBook E Core i5 | |
| Dynabook Portégé X40-G-10K | |
| AIDA64 / CPU AES | |
| VAIO SX12 VJS124X1011P | |
| Average Intel Core i5-1155G7 (73655 - 76866, n=3) | |
| Huawei MateBook E Core i5 | |
| VAIO SX14 VJS144X0111K | |
| Dynabook Portégé X40-G-10K | |
| AIDA64 / CPU ZLib | |
| VAIO SX12 VJS124X1011P | |
| Average Intel Core i5-1155G7 (407 - 425, n=3) | |
| VAIO SX14 VJS144X0111K | |
| Dynabook Portégé X40-G-10K | |
| Huawei MateBook E Core i5 | |
| AIDA64 / FP64 Ray-Trace | |
| VAIO SX12 VJS124X1011P | |
| Average Intel Core i5-1155G7 (3886 - 4211, n=3) | |
| VAIO SX14 VJS144X0111K | |
| Dynabook Portégé X40-G-10K | |
| Huawei MateBook E Core i5 | |
| AIDA64 / CPU PhotoWorxx | |
| VAIO SX12 VJS124X1011P | |
| Average Intel Core i5-1155G7 (33302 - 39951, n=3) | |
| VAIO SX14 VJS144X0111K | |
| Huawei MateBook E Core i5 | |
| Dynabook Portégé X40-G-10K | |
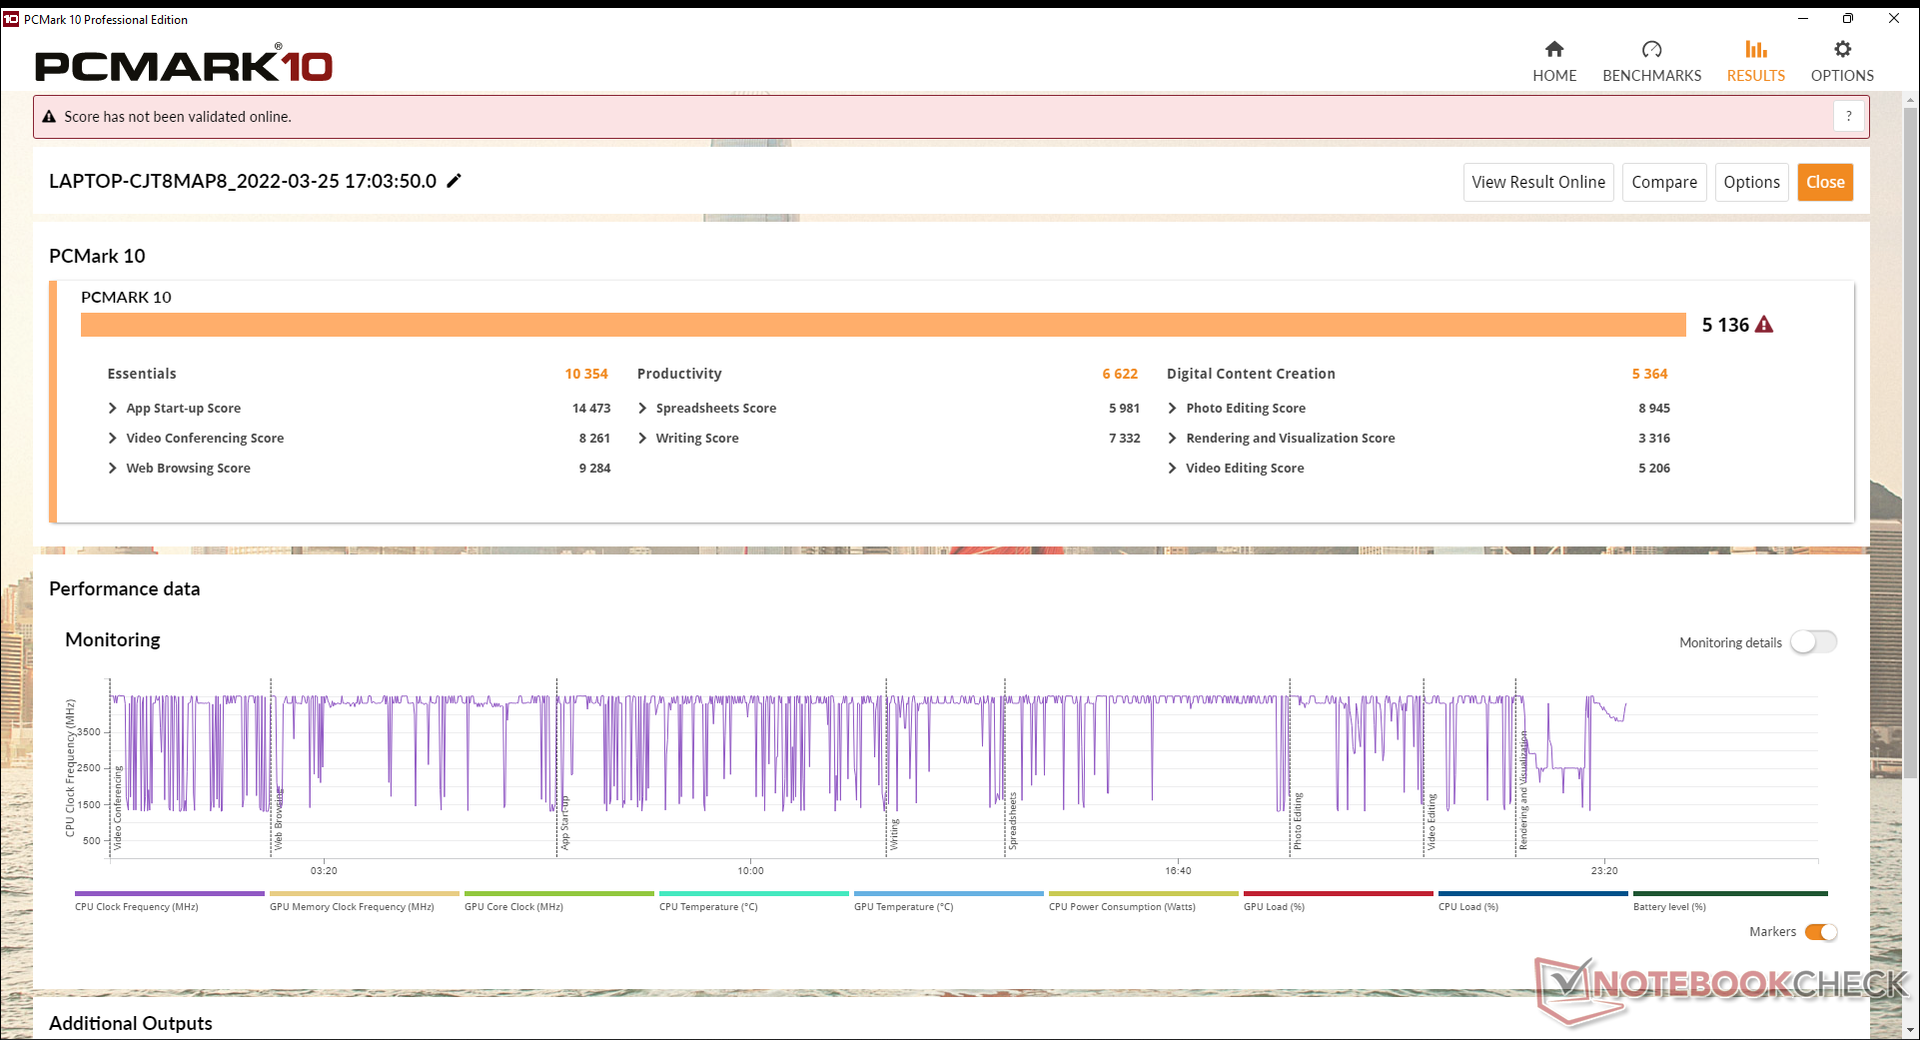
系统性能
PCMark 10的结果与较大的SX14和其他采用类似的12代系列英特尔CPU和PCIe4 x4 NVMe SSD的高端超极本相当。在我们使用测试设备期间,我们没有遇到任何奇特的软件或硬件问题。
CrossMark: Overall | Productivity | Creativity | Responsiveness
| PCMark 10 / Score | |
| VAIO SX12 VJS124X1011P | |
| VAIO SX14 VJS144X0111K | |
| Average Intel Core i5-1155G7, Intel Iris Xe Graphics G7 80EUs (5095 - 5136, n=3) | |
| Dell XPS 13 9310 Core i7 FHD | |
| Huawei MateBook E Core i5 | |
| Dynabook Portégé X40-G-10K | |
| VAIO A12-92993 | |
| PCMark 10 / Essentials | |
| VAIO SX14 VJS144X0111K | |
| VAIO SX12 VJS124X1011P | |
| Average Intel Core i5-1155G7, Intel Iris Xe Graphics G7 80EUs (9853 - 10354, n=3) | |
| Dell XPS 13 9310 Core i7 FHD | |
| Huawei MateBook E Core i5 | |
| Dynabook Portégé X40-G-10K | |
| VAIO A12-92993 | |
| PCMark 10 / Productivity | |
| Dell XPS 13 9310 Core i7 FHD | |
| VAIO SX14 VJS144X0111K | |
| VAIO SX12 VJS124X1011P | |
| Average Intel Core i5-1155G7, Intel Iris Xe Graphics G7 80EUs (6549 - 6622, n=3) | |
| VAIO A12-92993 | |
| Dynabook Portégé X40-G-10K | |
| Huawei MateBook E Core i5 | |
| PCMark 10 / Digital Content Creation | |
| Average Intel Core i5-1155G7, Intel Iris Xe Graphics G7 80EUs (5364 - 5583, n=3) | |
| VAIO SX12 VJS124X1011P | |
| VAIO SX14 VJS144X0111K | |
| Dell XPS 13 9310 Core i7 FHD | |
| Huawei MateBook E Core i5 | |
| Dynabook Portégé X40-G-10K | |
| VAIO A12-92993 | |
| CrossMark / Overall | |
| Average Intel Core i5-1155G7, Intel Iris Xe Graphics G7 80EUs (1381 - 1395, n=2) | |
| Huawei MateBook E Core i5 | |
| CrossMark / Productivity | |
| Average Intel Core i5-1155G7, Intel Iris Xe Graphics G7 80EUs (1442 - 1449, n=2) | |
| Huawei MateBook E Core i5 | |
| CrossMark / Creativity | |
| Average Intel Core i5-1155G7, Intel Iris Xe Graphics G7 80EUs (1309 - 1330, n=2) | |
| Huawei MateBook E Core i5 | |
| CrossMark / Responsiveness | |
| Average Intel Core i5-1155G7, Intel Iris Xe Graphics G7 80EUs (1426 - 1439, n=2) | |
| Huawei MateBook E Core i5 | |
| PCMark 10 Score | 5136 points | |
Help | ||
| AIDA64 / Memory Copy | |
| VAIO SX12 VJS124X1011P | |
| VAIO SX14 VJS144X0111K | |
| Huawei MateBook E Core i5 | |
| Dell Latitude 7200 | |
| AIDA64 / Memory Read | |
| VAIO SX12 VJS124X1011P | |
| Huawei MateBook E Core i5 | |
| VAIO SX14 VJS144X0111K | |
| Dell Latitude 7200 | |
| AIDA64 / Memory Write | |
| VAIO SX12 VJS124X1011P | |
| VAIO SX14 VJS144X0111K | |
| Huawei MateBook E Core i5 | |
| Dell Latitude 7200 | |
| AIDA64 / Memory Latency | |
| Dell Latitude 7200 | |
| VAIO SX14 VJS144X0111K | |
| VAIO SX12 VJS124X1011P | |
| Huawei MateBook E Core i5 | |
* ... smaller is better
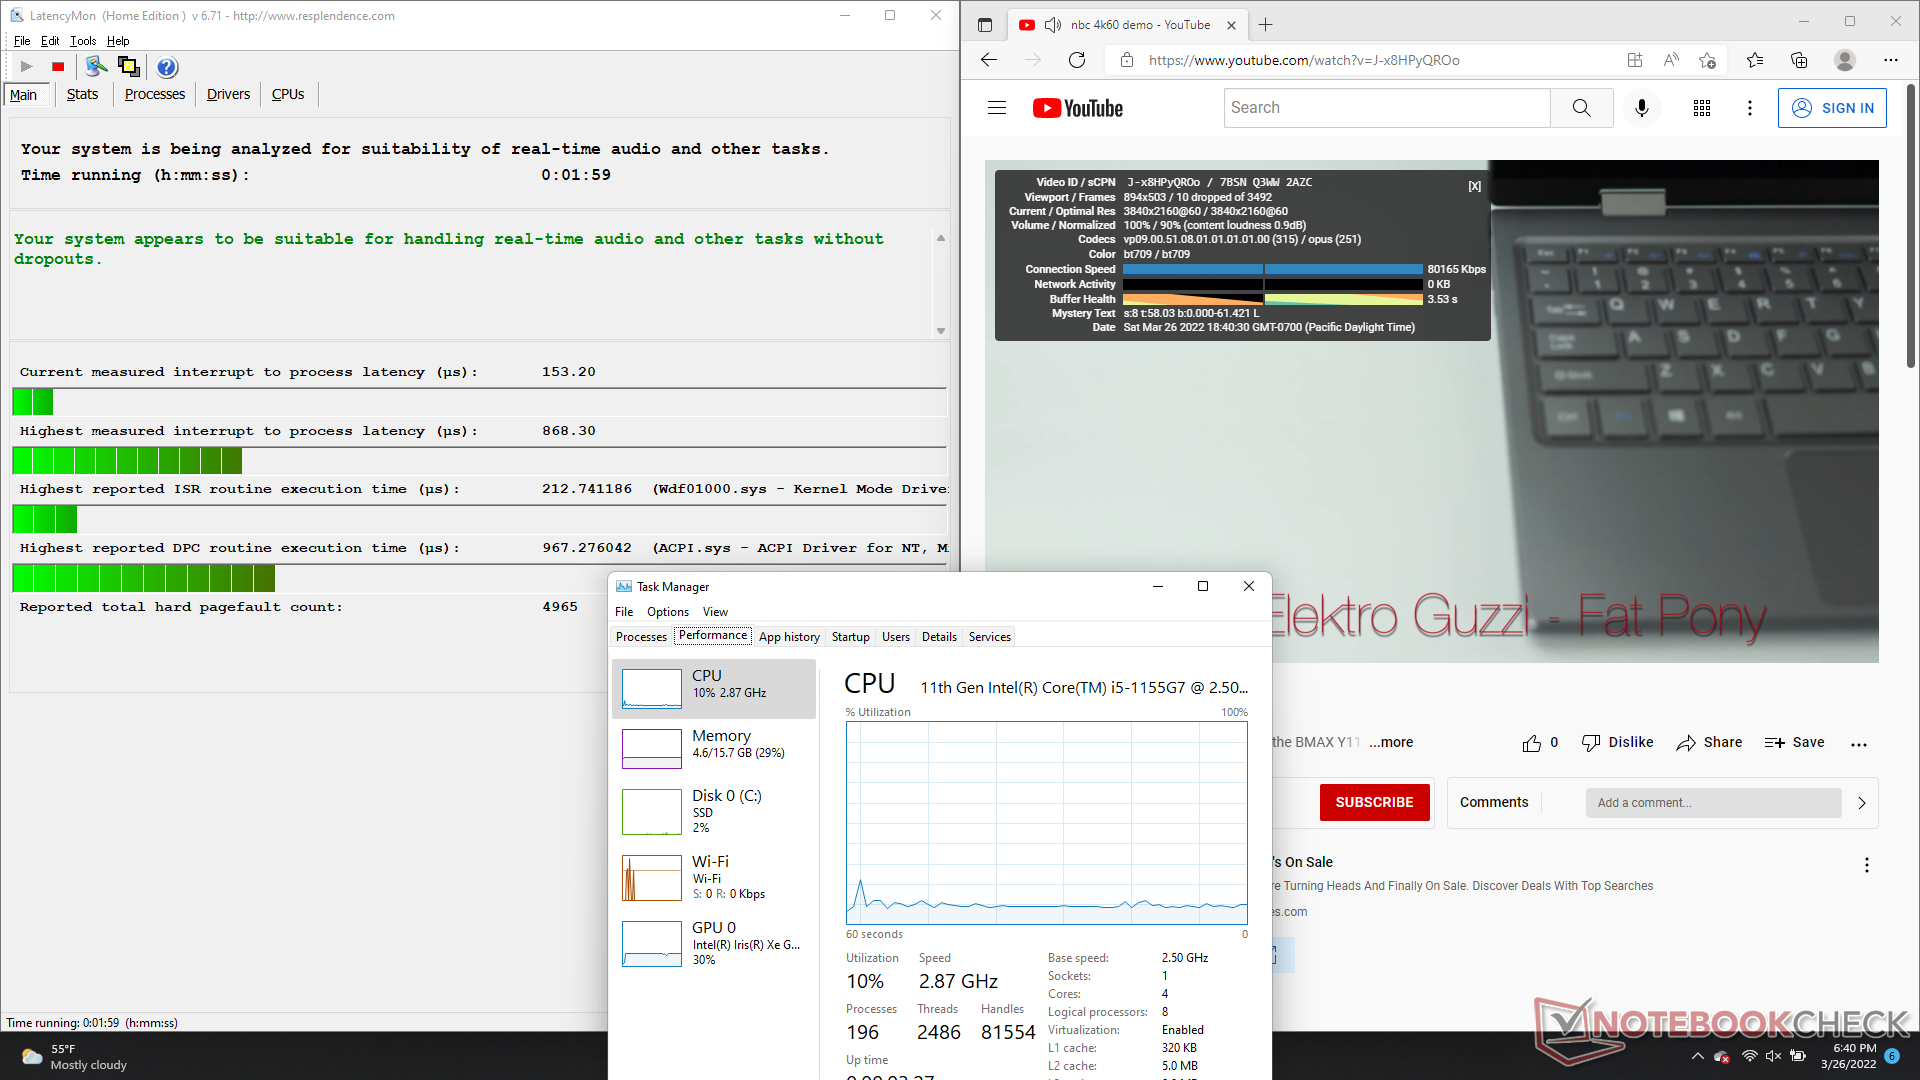
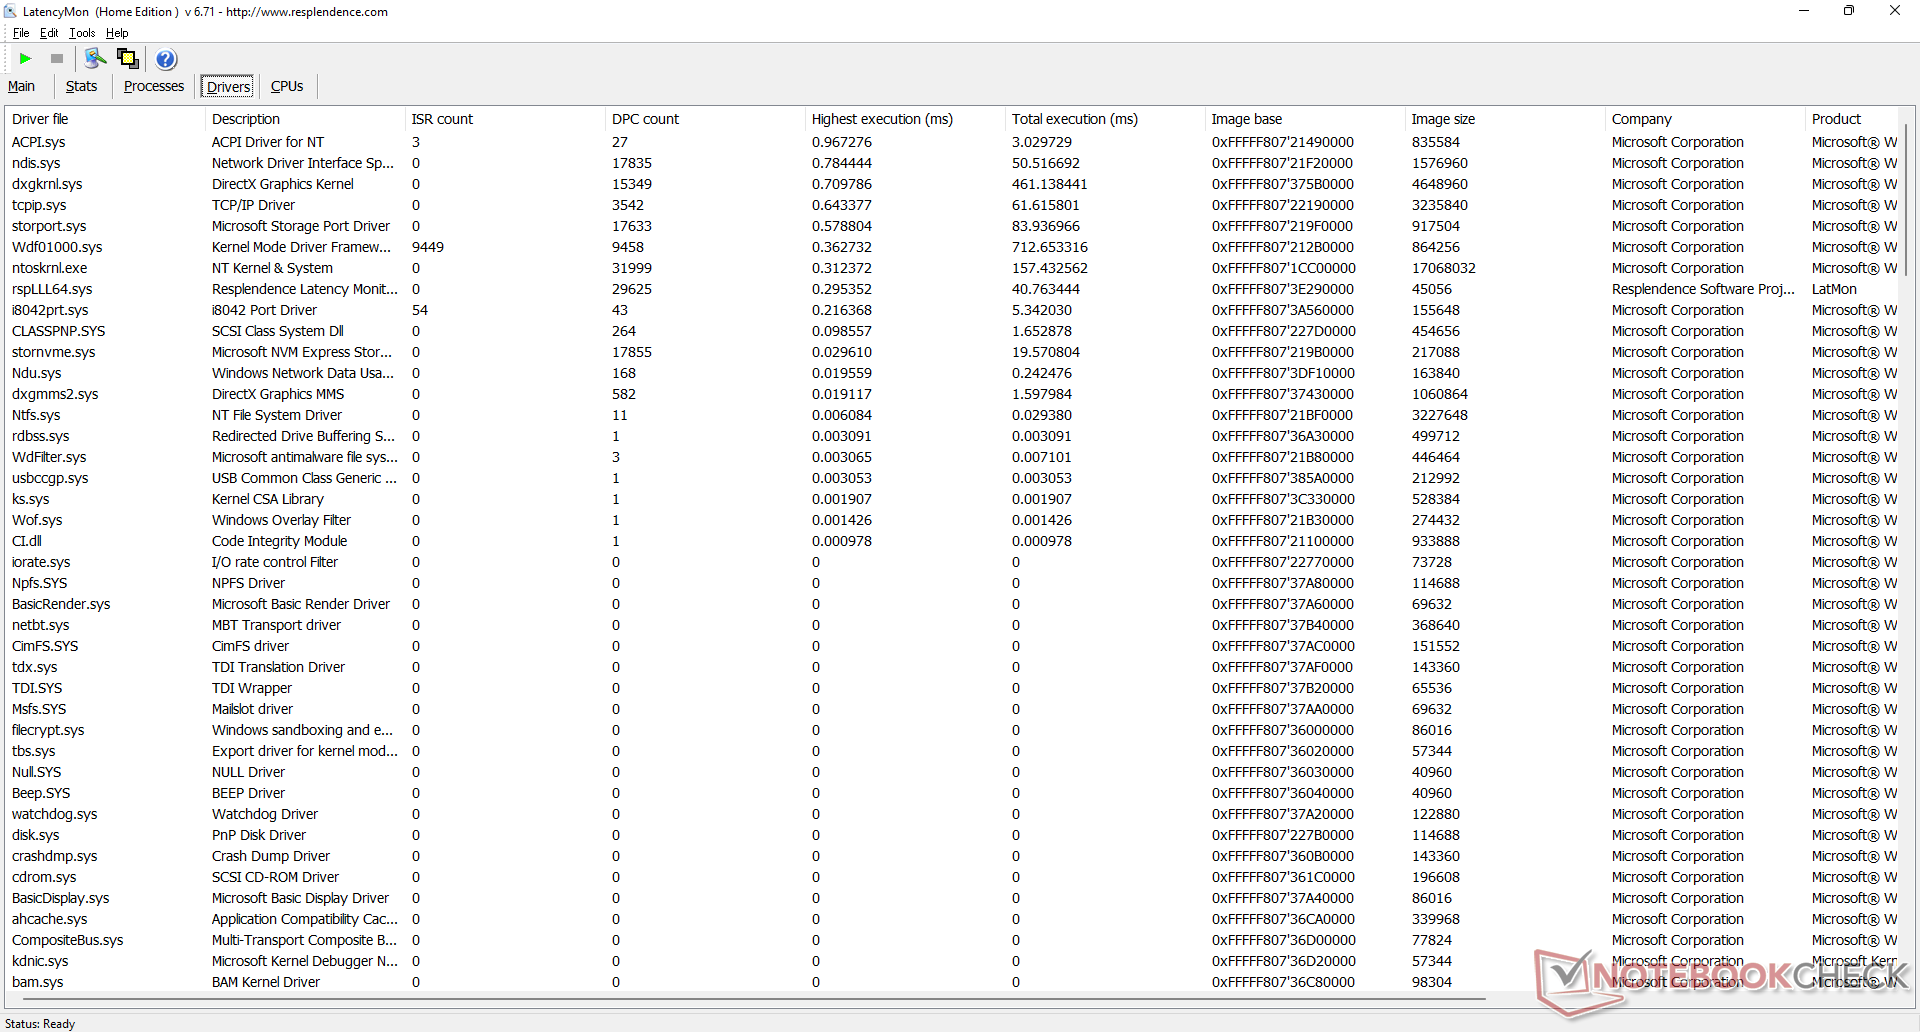
DPC延时
LatencyMon显示在我们的主页上打开多个标签时没有DPC问题。在我们长达1分钟的视频测试中,以60 FPS播放4K视频几乎完美,只有10个丢帧。
| DPC Latencies / LatencyMon - interrupt to process latency (max), Web, Youtube, Prime95 | |
| Dynabook Portégé X40-G-10K | |
| VAIO SX14 VJS144X0111K | |
| Dell XPS 13 9310 Core i7 FHD | |
| Huawei MateBook E Core i5 | |
| VAIO SX12 VJS124X1011P | |
* ... smaller is better
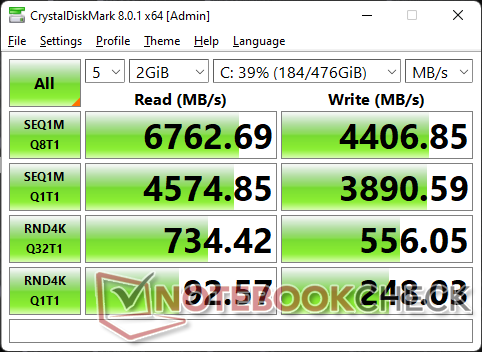
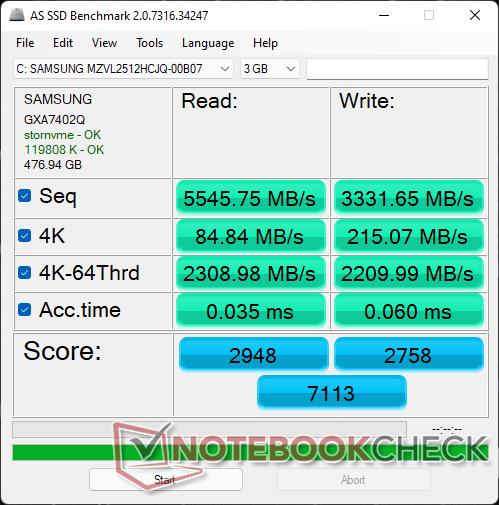
存储设备 - 支持PCIe4 x4
我们的设备配置了一个512GB的 三星PM9A1这是目前最快的基于消费者的PCIe4 x4 NVMe SSD之一。也许更令人印象深刻的是,在我们的DiskSpd循环测试中,尽管机箱尺寸很小,但该驱动器可以长时间保持其非常高的传输速率。

| Drive Performance rating - Percent | |
| VAIO SX12 VJS124X1011P | |
| VAIO SX14 VJS144X0111K | |
| Huawei MateBook E Core i5 | |
| VAIO A12-92993 -8! | |
| Dynabook Portégé X40-G-10K | |
| Dell XPS 13 9310 Core i7 FHD | |
* ... smaller is better
Disk Throttling: DiskSpd Read Loop, Queue Depth 8
GPU性能--配备双通道内存的Iris Xe
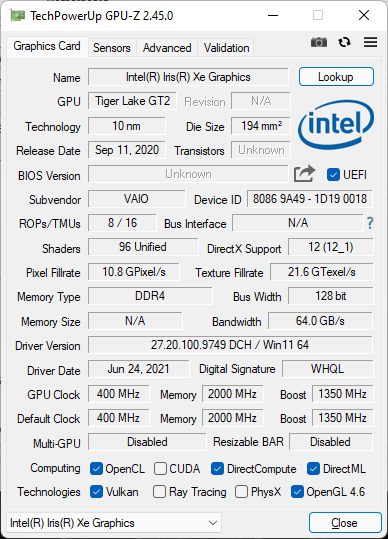
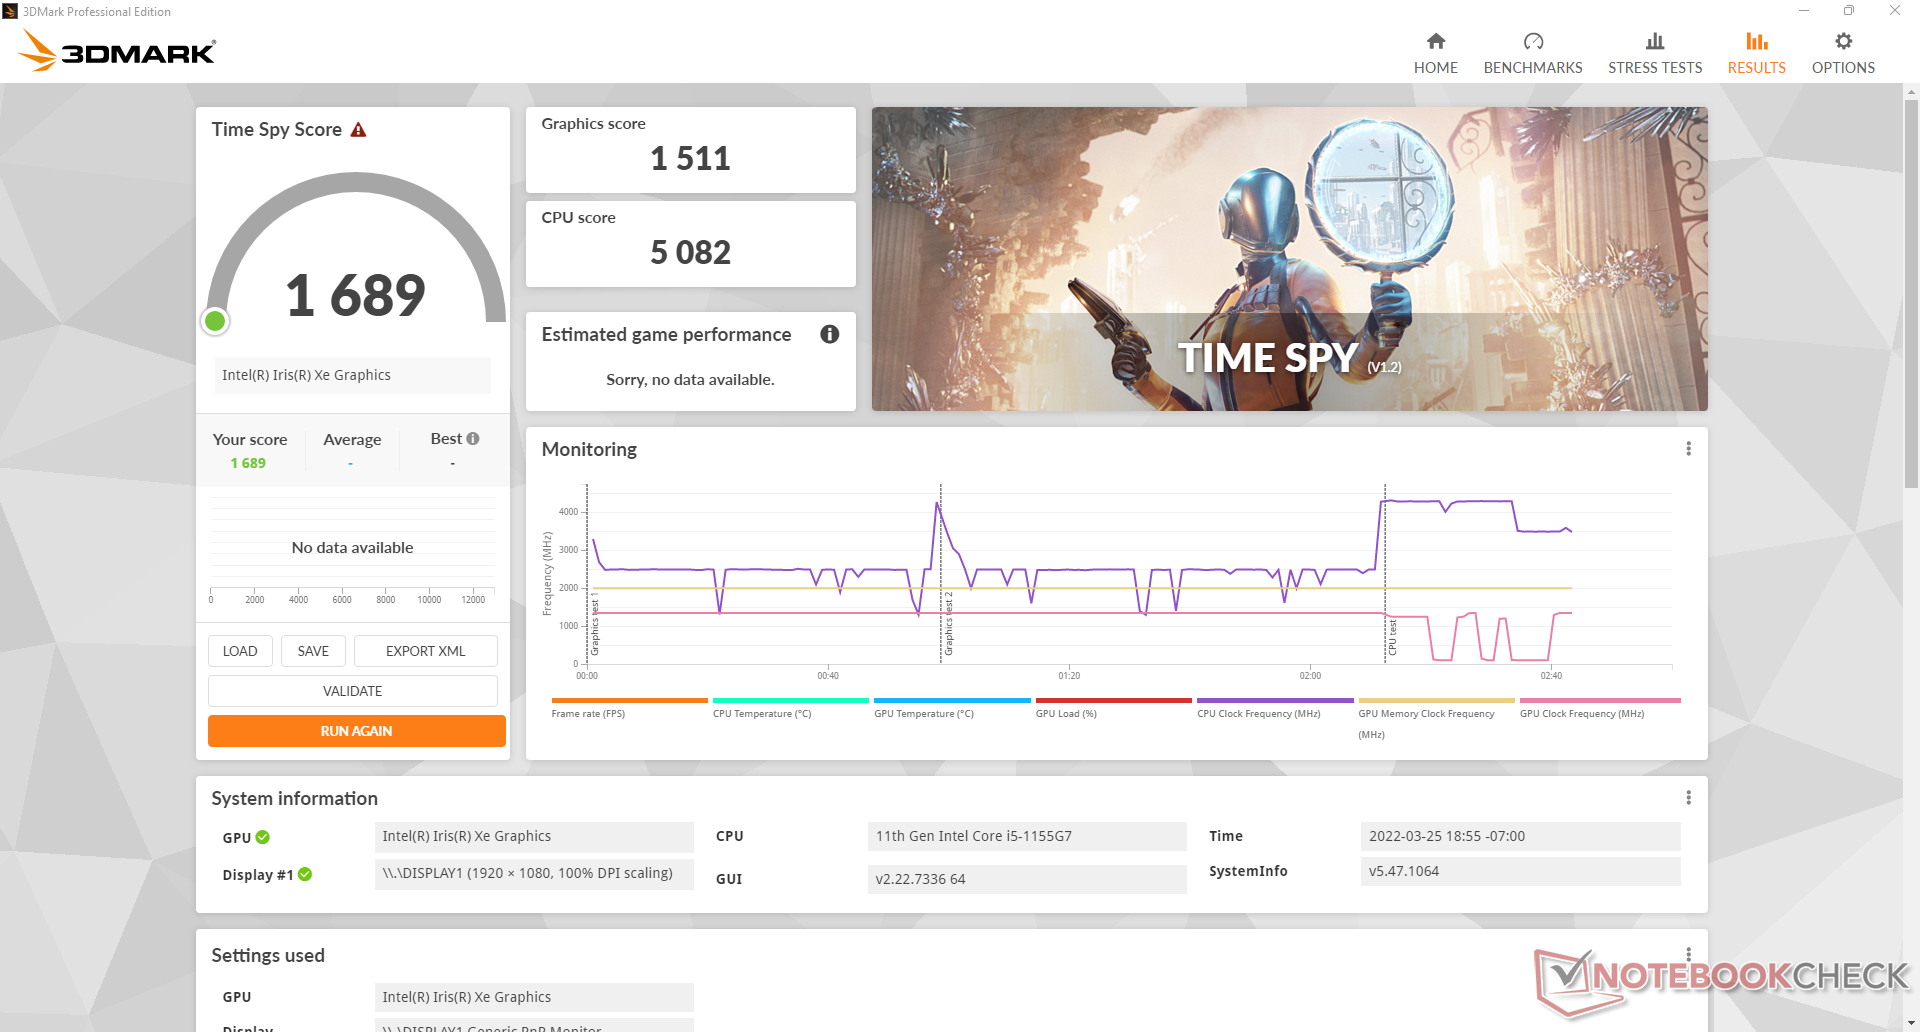
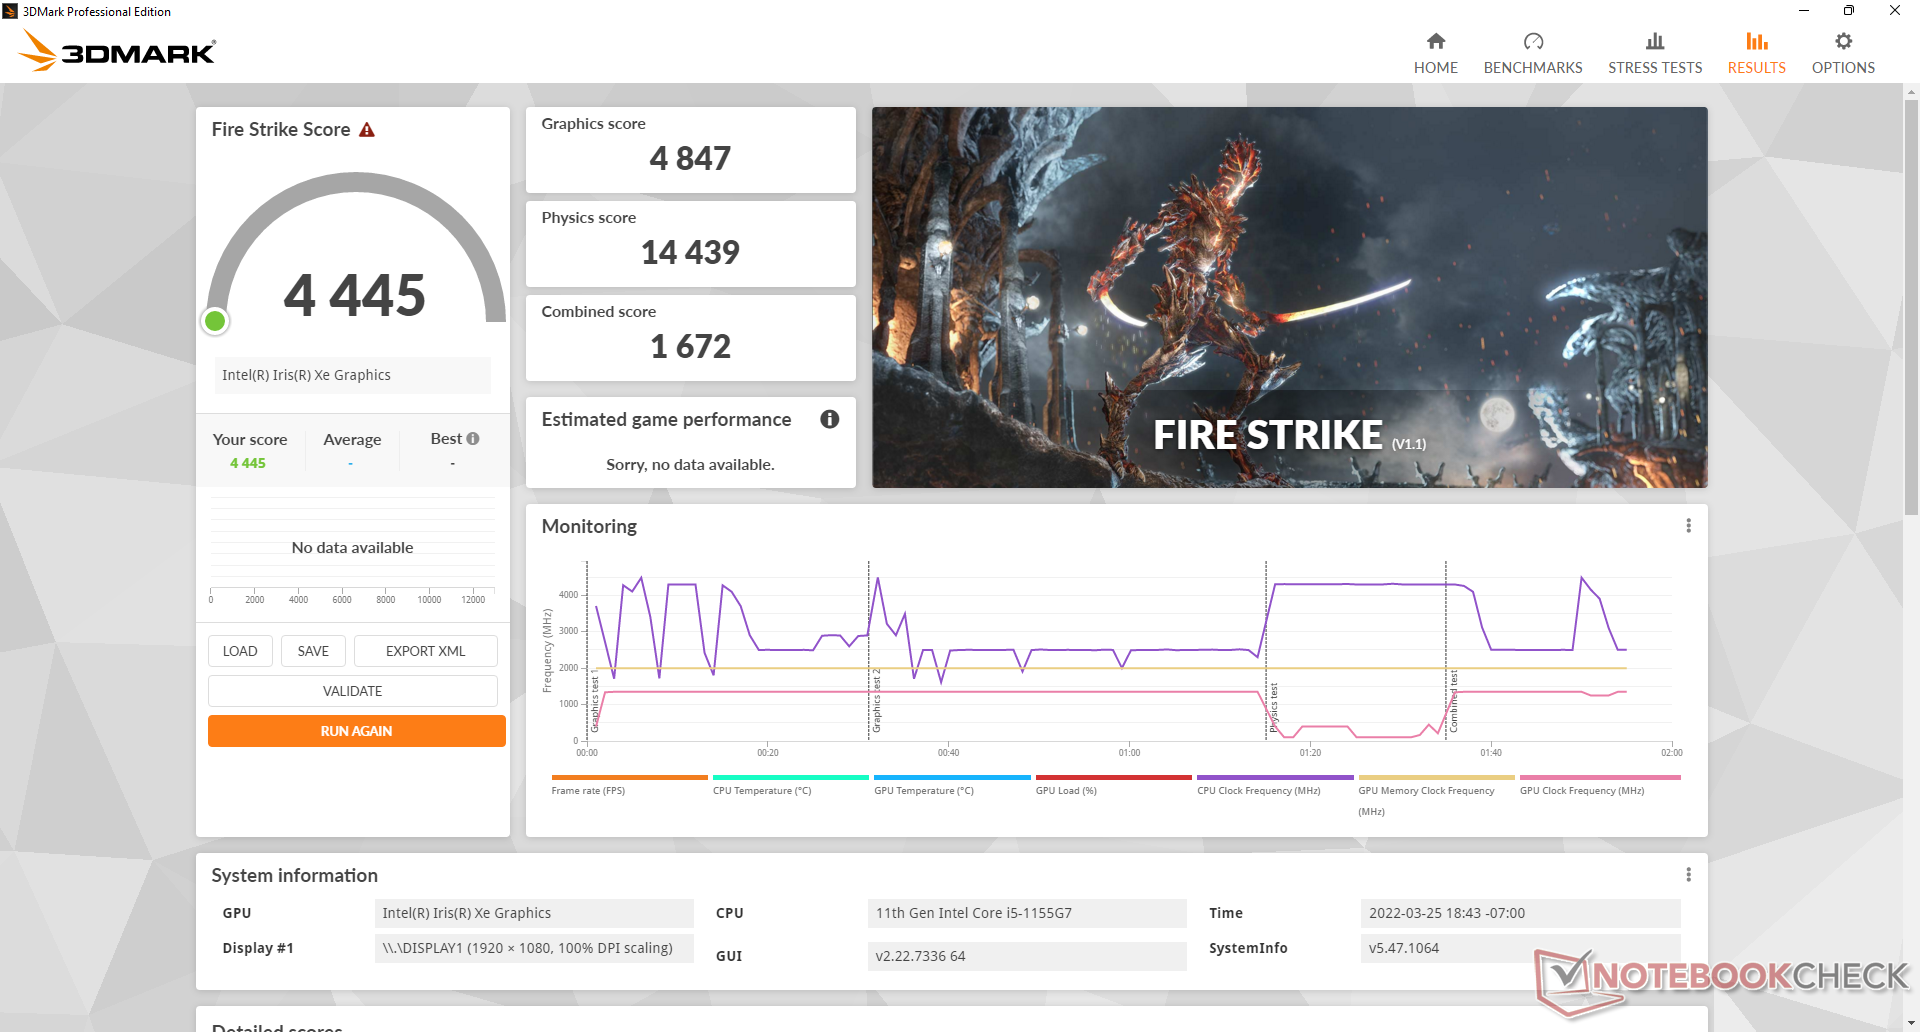
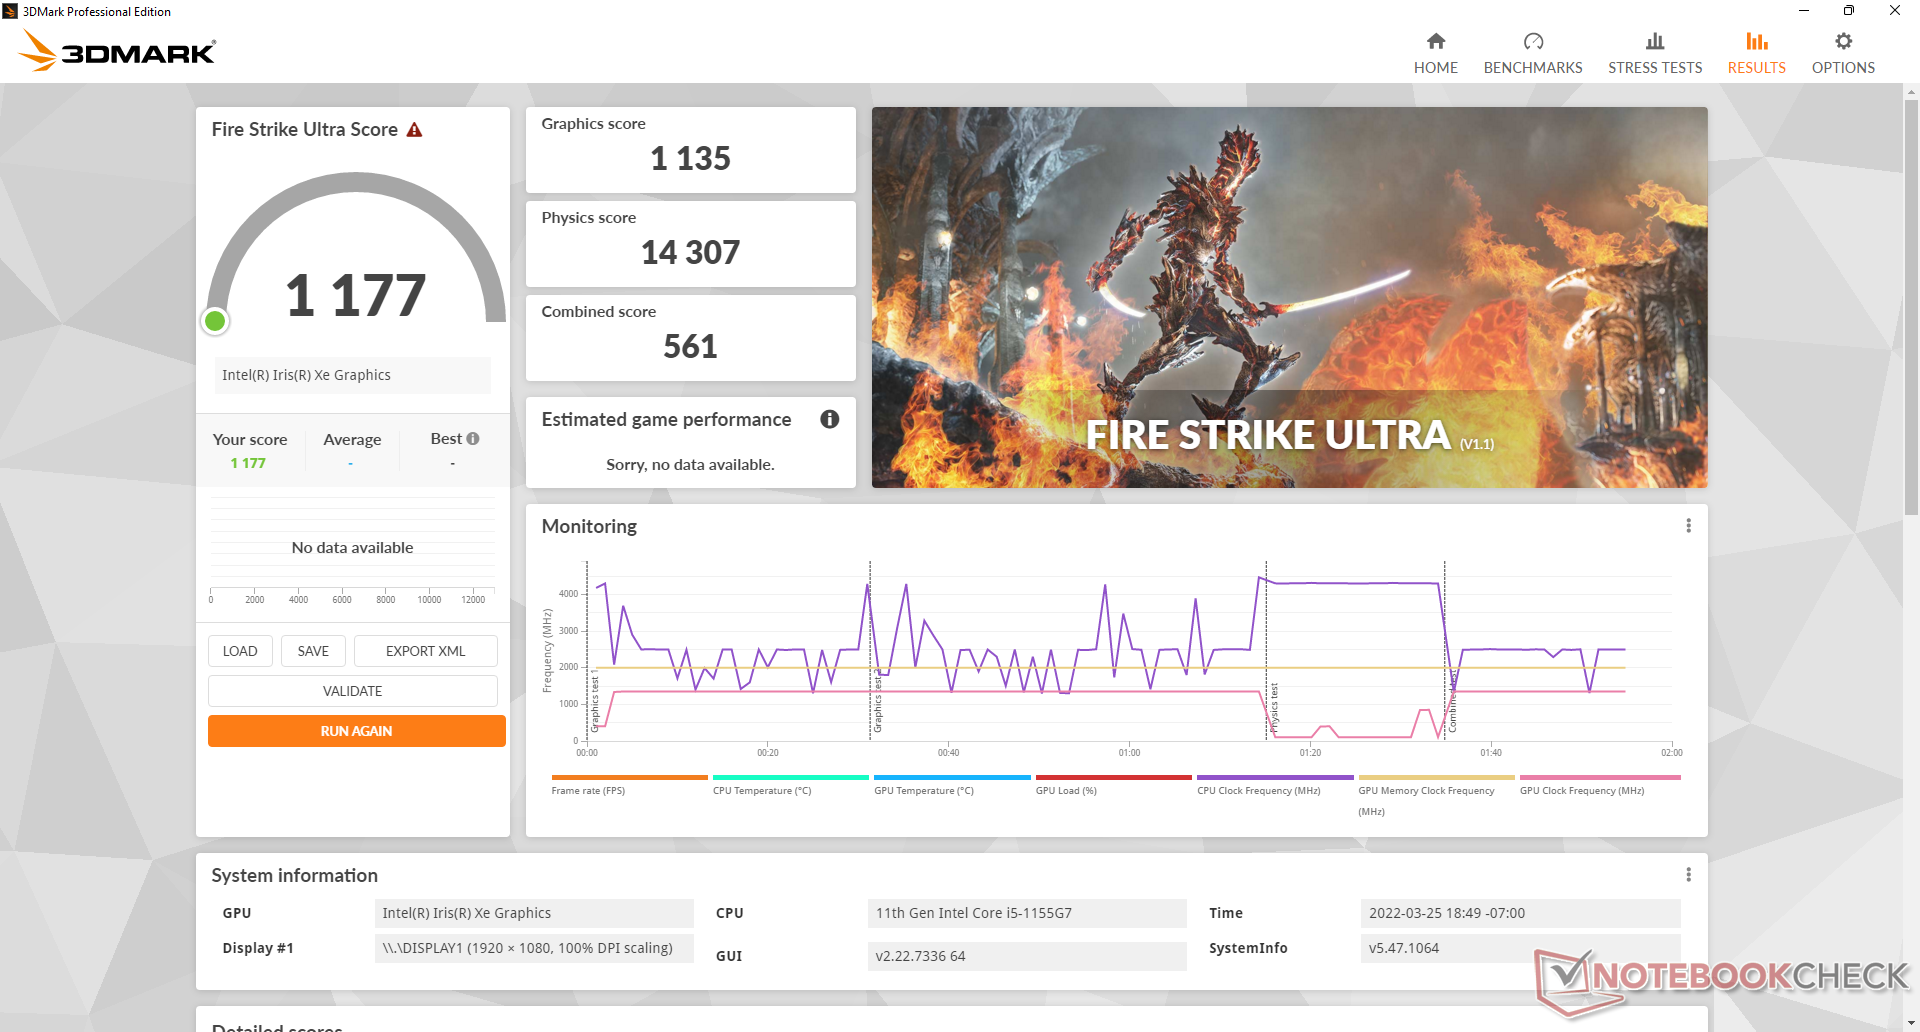
图形性能非常好,3DMark结果比具有相同集成度的普通笔记本电脑高出30%到35%。 Iris Xe 80 EUs GPU.更快的结果可以部分归功于16GB的双通道内存,因为许多第11代英特尔酷睿i5笔记本电脑通常会用单通道内存代替。升级到酷睿i7 SKU,配有 Iris Xe 96 EUs显卡,预计将比我们的酷睿i5配置提高约15%的GPU性能。
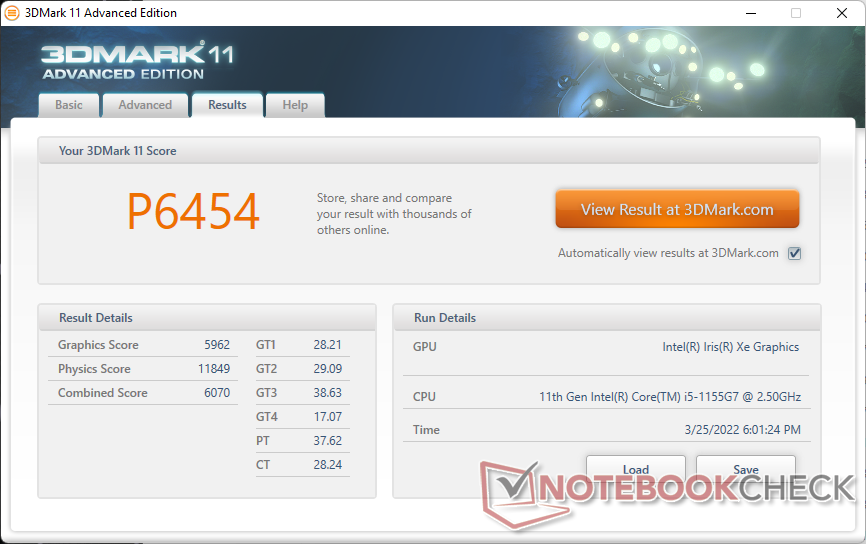
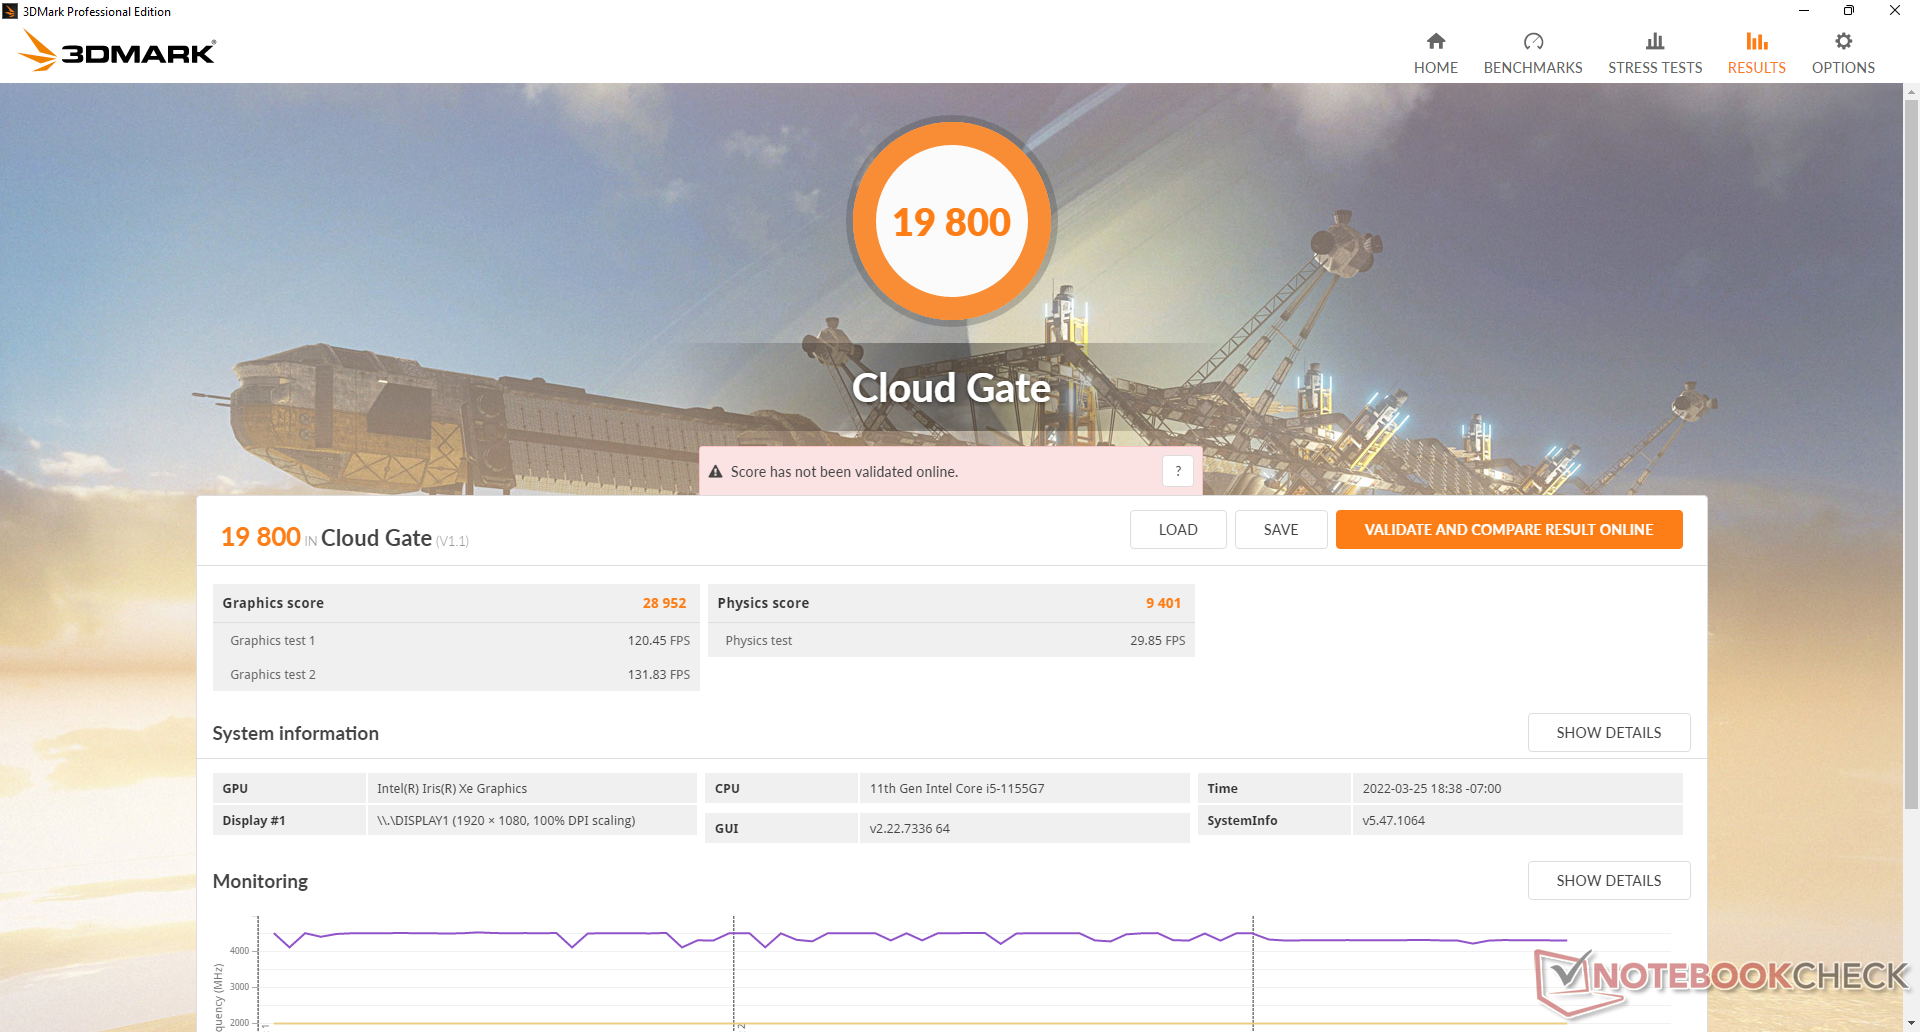
| 3DMark 11 Performance | 6454 points | |
| 3DMark Cloud Gate Standard Score | 19800 points | |
| 3DMark Fire Strike Score | 4445 points | |
| 3DMark Time Spy Score | 1689 points | |
Help | ||
Witcher 3 FPS Chart
| low | med. | high | ultra | |
|---|---|---|---|---|
| GTA V (2015) | 104 | 90.5 | 29.5 | 11.3 |
| The Witcher 3 (2015) | 87.3 | 55.1 | 31.6 | 14.9 |
| Dota 2 Reborn (2015) | 109 | 116 | 57 | 50.4 |
| Final Fantasy XV Benchmark (2018) | 41.8 | 23.2 | 16.5 | |
| X-Plane 11.11 (2018) | 44.8 | 40.4 | 36.3 | |
| Far Cry 5 (2018) | 55 | 27 | 25 | 24 |
| Strange Brigade (2018) | 77.2 | 35.5 | 28.8 | 23.6 |
排放
系统噪音--比你的典型副笔记本更响亮
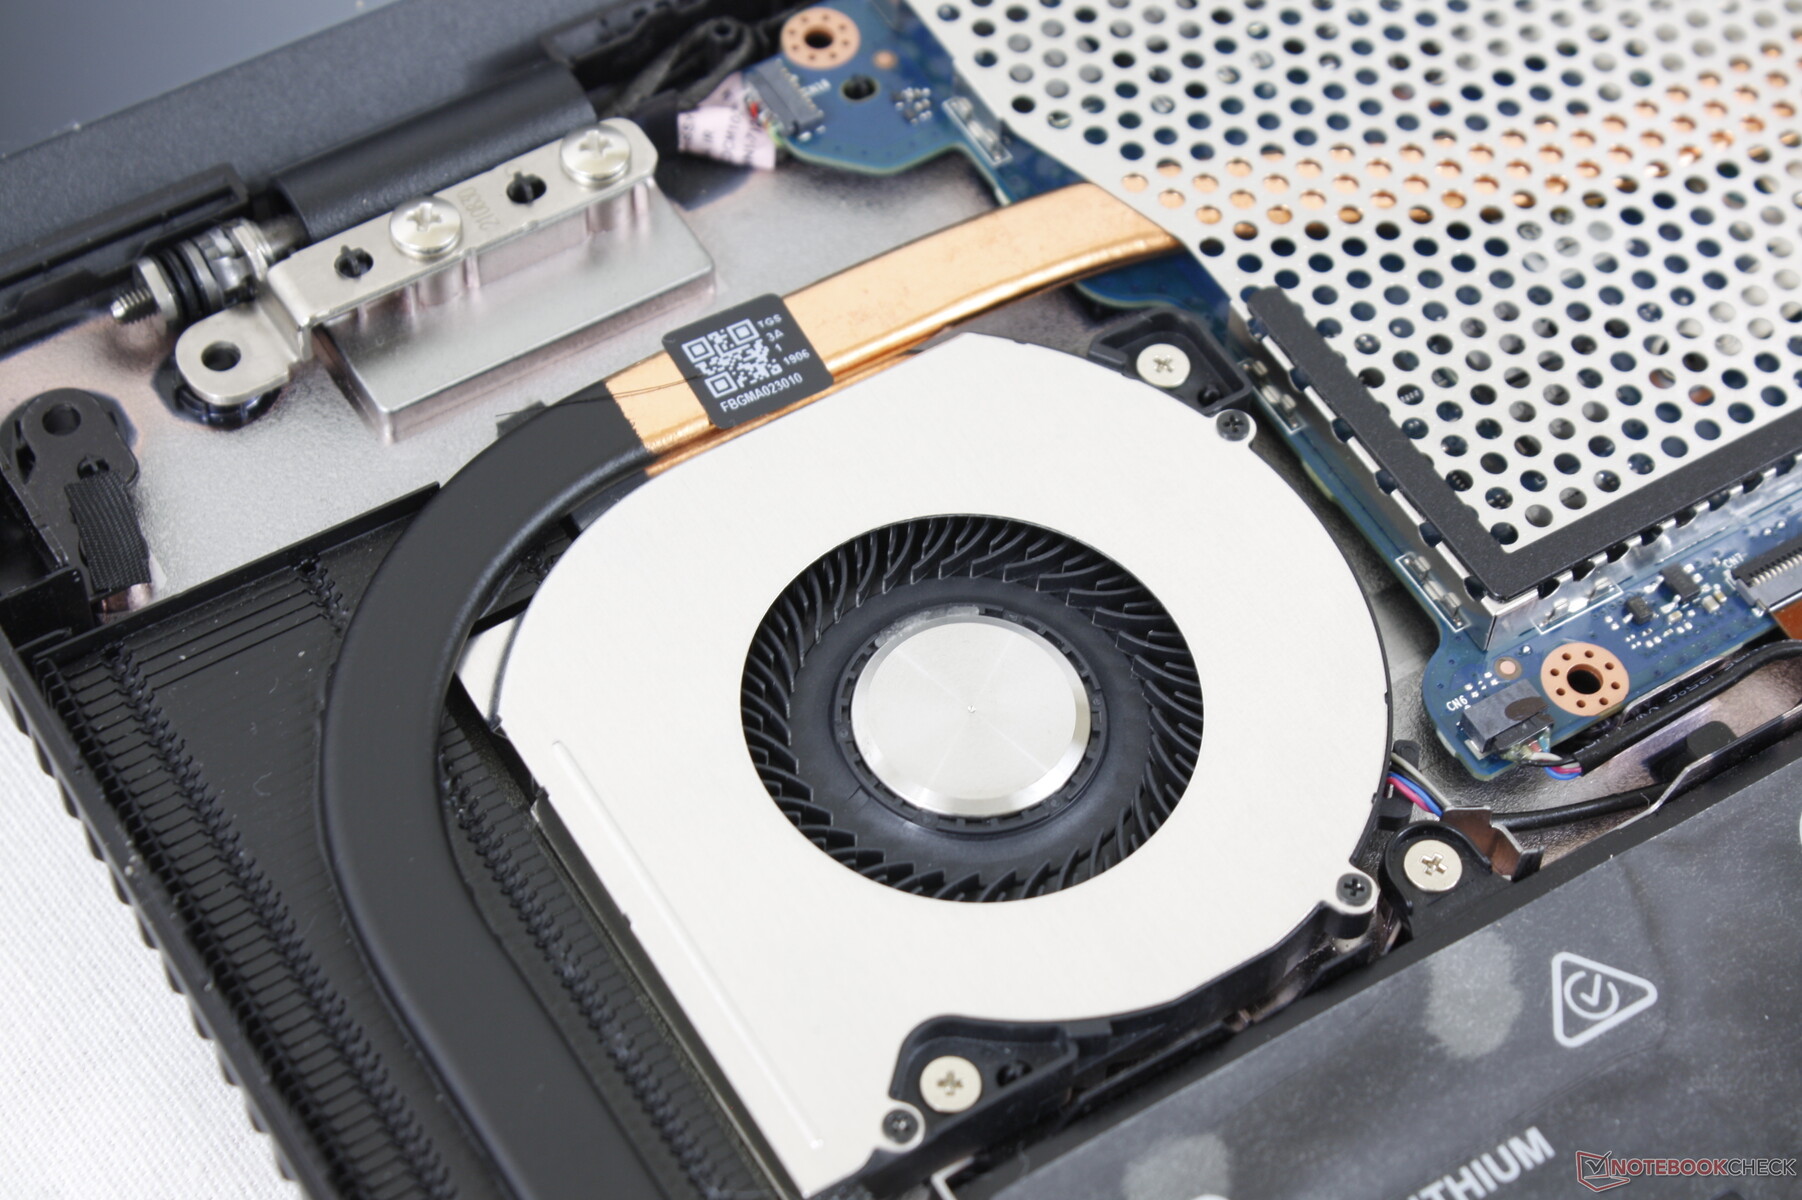
与其他采用类似酷睿U系列CPU的超极本相比,风扇的噪音更大,更明显。我们怀疑SX12较小的外形尺寸和较小的冷却解决方案需要一个更活跃的风扇,以保持温度的控制。尽管在浏览网页或播放视频时,风扇几乎一直处于活动状态,但不会太麻烦。
运行更高的负载,如游戏,会使风扇很快达到更高的转速。例如,当运行Witcher 3 ,该系统可以像一些游戏笔记本电脑一样响亮,大约为46 dB(A)。
Noise level
| Idle |
| 30.7 / 30.8 / 30.8 dB(A) |
| Load |
| 48.3 / 50.3 dB(A) |
 | ||
30 dB silent 40 dB(A) audible 50 dB(A) loud |
||
min: | ||
| VAIO SX12 VJS124X1011P Iris Xe G7 80EUs, i5-1155G7, Samsung PM9A1 MZVL2512HCJQ | VAIO SX14 VJS144X0111K Iris Xe G7 96EUs, i7-1195G7, Samsung PM9A1 MZVL22T0HBLB | Huawei MateBook E Core i5 Iris Xe G7 80EUs, i5-1130G7, Silicon Motion PCIe-8 SSD | Dell XPS 13 9310 Core i7 FHD Iris Xe G7 96EUs, i7-1165G7, Micron 2300 512GB MTFDHBA512TDV | Dynabook Portégé X40-G-10K UHD Graphics 620, i5-10210U, Samsung SSD PM981a MZVLB256HBHQ | |
|---|---|---|---|---|---|
| Noise | 7% | 24% | 19% | 20% | |
| off / environment * (dB) | 23.2 | 23.8 -3% | 24.3 -5% | 25.7 -11% | 25.2 -9% |
| Idle Minimum * (dB) | 30.7 | 24.3 21% | 24.3 21% | 25.7 16% | 25.2 18% |
| Idle Average * (dB) | 30.8 | 24.3 21% | 24.3 21% | 25.7 17% | 25.2 18% |
| Idle Maximum * (dB) | 30.8 | 31.3 -2% | 24.3 21% | 25.9 16% | 25.2 18% |
| Load Average * (dB) | 48.3 | 36.6 24% | 28.6 41% | 26.2 46% | 24.2 50% |
| Witcher 3 ultra * (dB) | 46.4 | 49.6 -7% | 30.7 34% | 36.5 21% | |
| Load Maximum * (dB) | 50.3 | 51.5 -2% | 32.4 36% | 36.6 27% | 37.6 25% |
* ... smaller is better
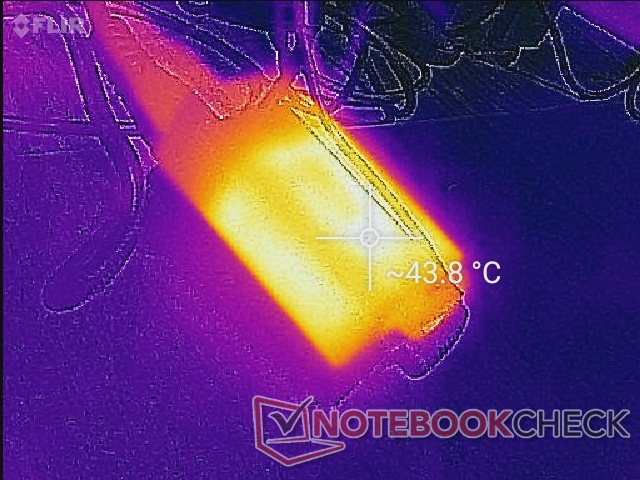
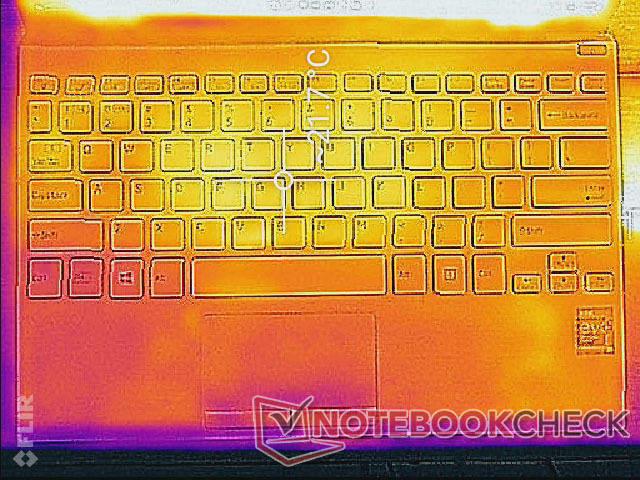
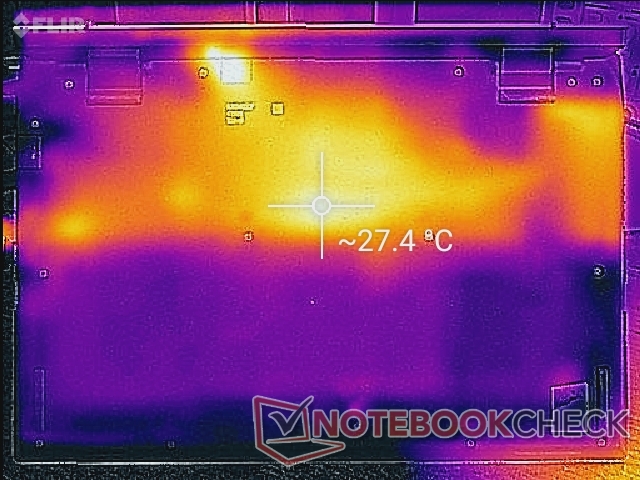
温度--永远不会太热
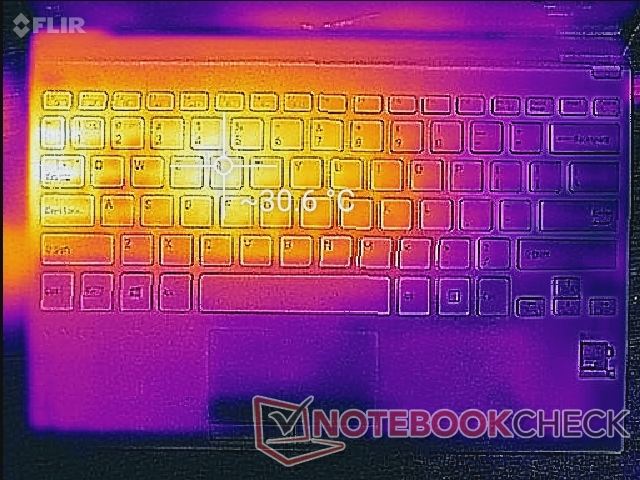
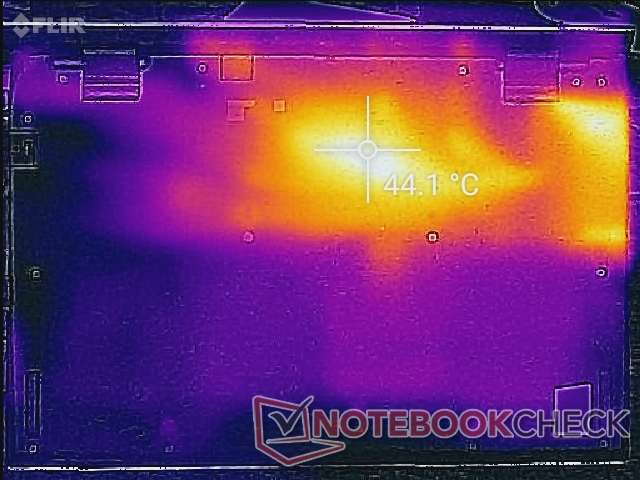
在低加工负荷时,表面温度全面冷却。当运行更高的负载时,顶部和底部的热点可以分别达到31 C和45 C,如下面的温度图所示。相比之下,XPS 13在遭受类似条件时,每侧的温度会高得多,超过45摄氏度。
请注意,由于冷却解决方案在内部的定位方式,笔记本电脑的左半部分将总是比右半部分更热。
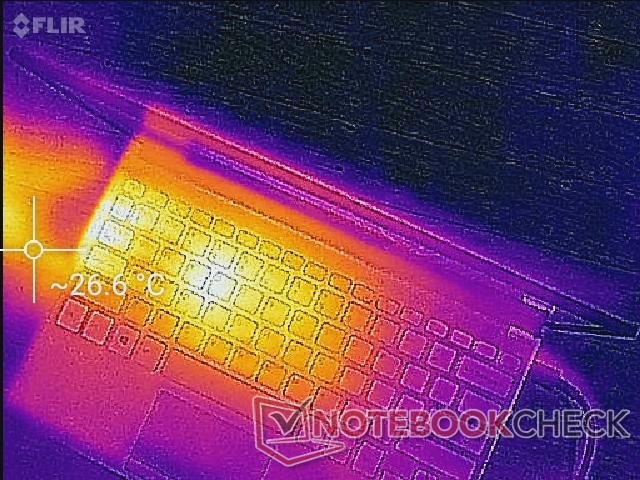
(+) The maximum temperature on the upper side is 30.4 °C / 87 F, compared to the average of 35.9 °C / 97 F, ranging from 21.4 to 59 °C for the class Subnotebook.
(±) The bottom heats up to a maximum of 44.4 °C / 112 F, compared to the average of 39.2 °C / 103 F
(+) In idle usage, the average temperature for the upper side is 21 °C / 70 F, compared to the device average of 30.8 °C / 87 F.
(+) The palmrests and touchpad are cooler than skin temperature with a maximum of 23.4 °C / 74.1 F and are therefore cool to the touch.
(+) The average temperature of the palmrest area of similar devices was 28.2 °C / 82.8 F (+4.8 °C / 8.7 F).
| VAIO SX12 VJS124X1011P Intel Core i5-1155G7, Intel Iris Xe Graphics G7 80EUs | VAIO A12-92993 Intel Core i7-8500Y, Intel UHD Graphics 615 | VAIO SX14 VJS144X0111K Intel Core i7-1195G7, Intel Iris Xe Graphics G7 96EUs | Huawei MateBook E Core i5 Intel Core i5-1130G7, Intel Iris Xe Graphics G7 80EUs | Dell XPS 13 9310 Core i7 FHD Intel Core i7-1165G7, Intel Iris Xe Graphics G7 96EUs | |
|---|---|---|---|---|---|
| Heat | -14% | -7% | -11% | -12% | |
| Maximum Upper Side * (°C) | 30.4 | 42.4 -39% | 36.2 -19% | 40.5 -33% | 46.2 -52% |
| Maximum Bottom * (°C) | 44.4 | 47.1 -6% | 50.2 -13% | 41.6 6% | 46 -4% |
| Idle Upper Side * (°C) | 21.8 | 26.6 -22% | 21.4 2% | 26.2 -20% | 22 -1% |
| Idle Bottom * (°C) | 28 | 24.9 11% | 27.8 1% | 27.4 2% | 25 11% |
* ... smaller is better
压力测试
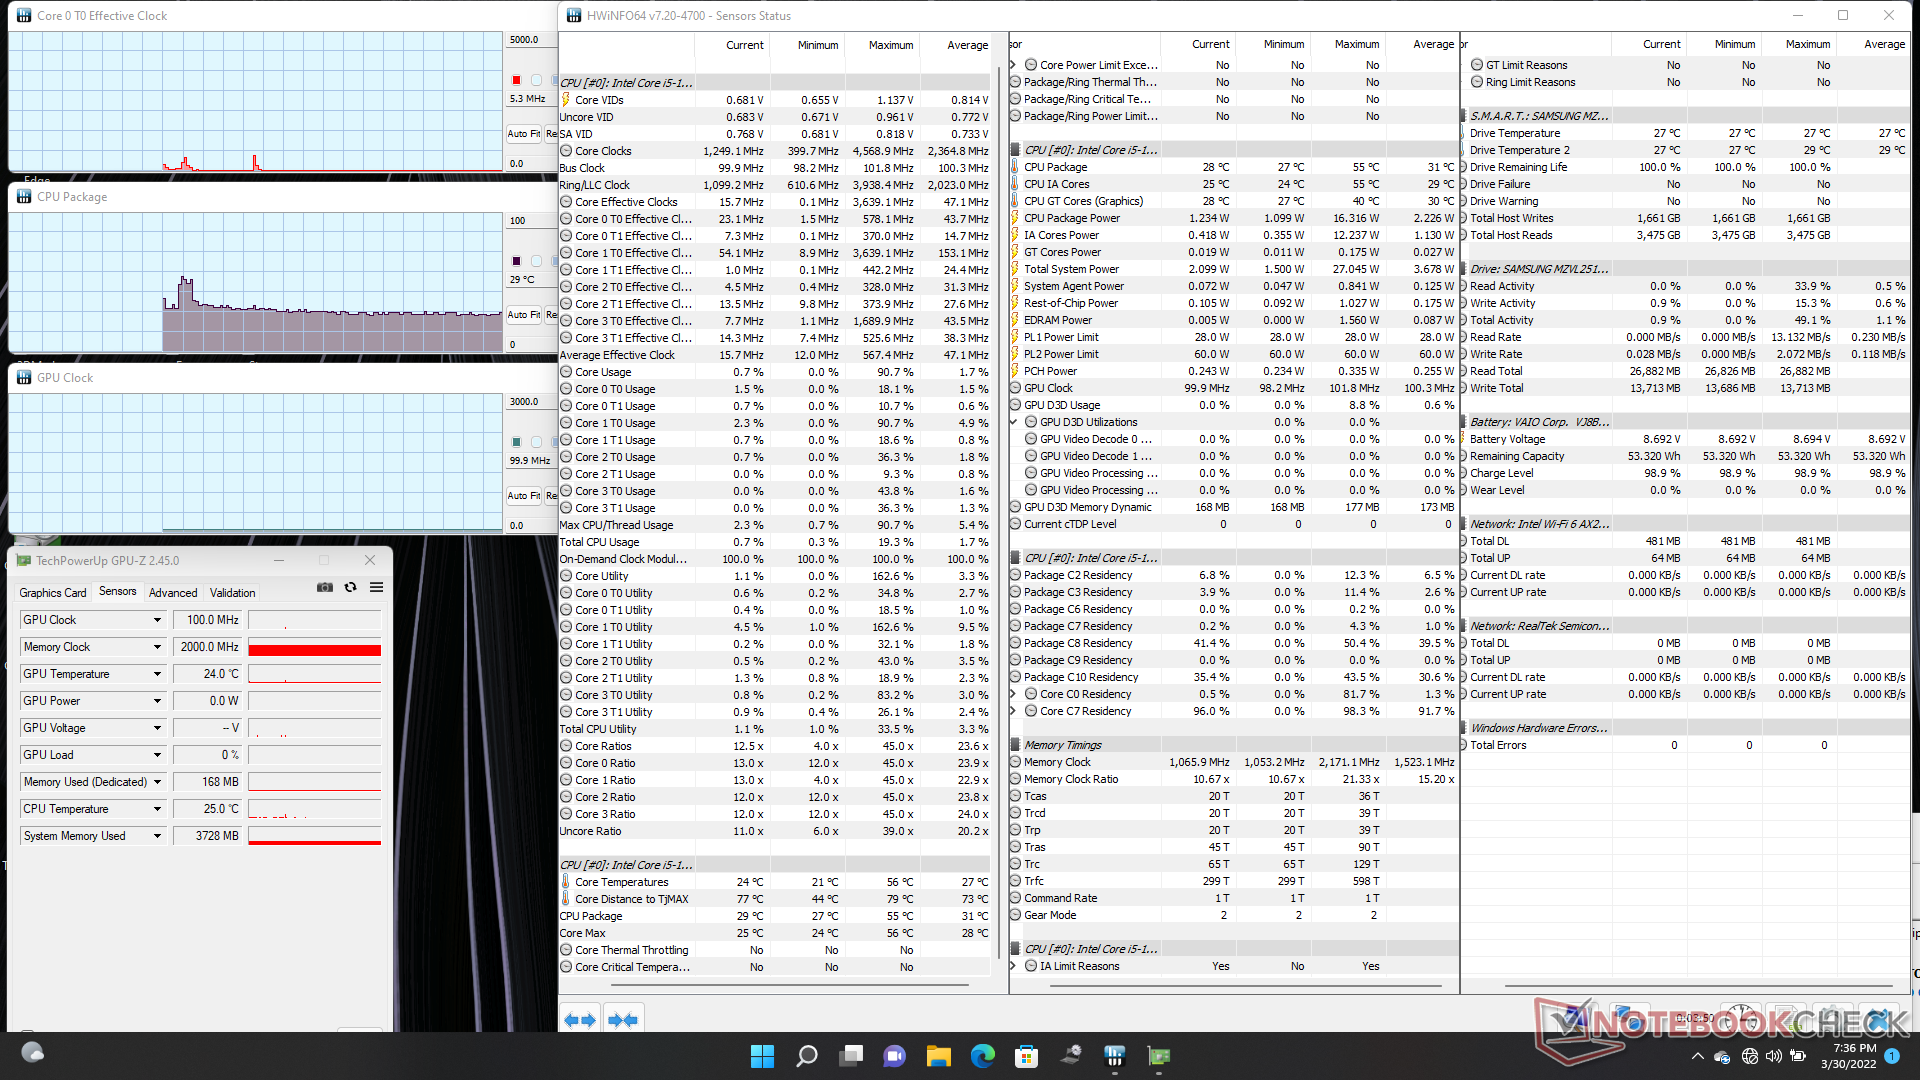
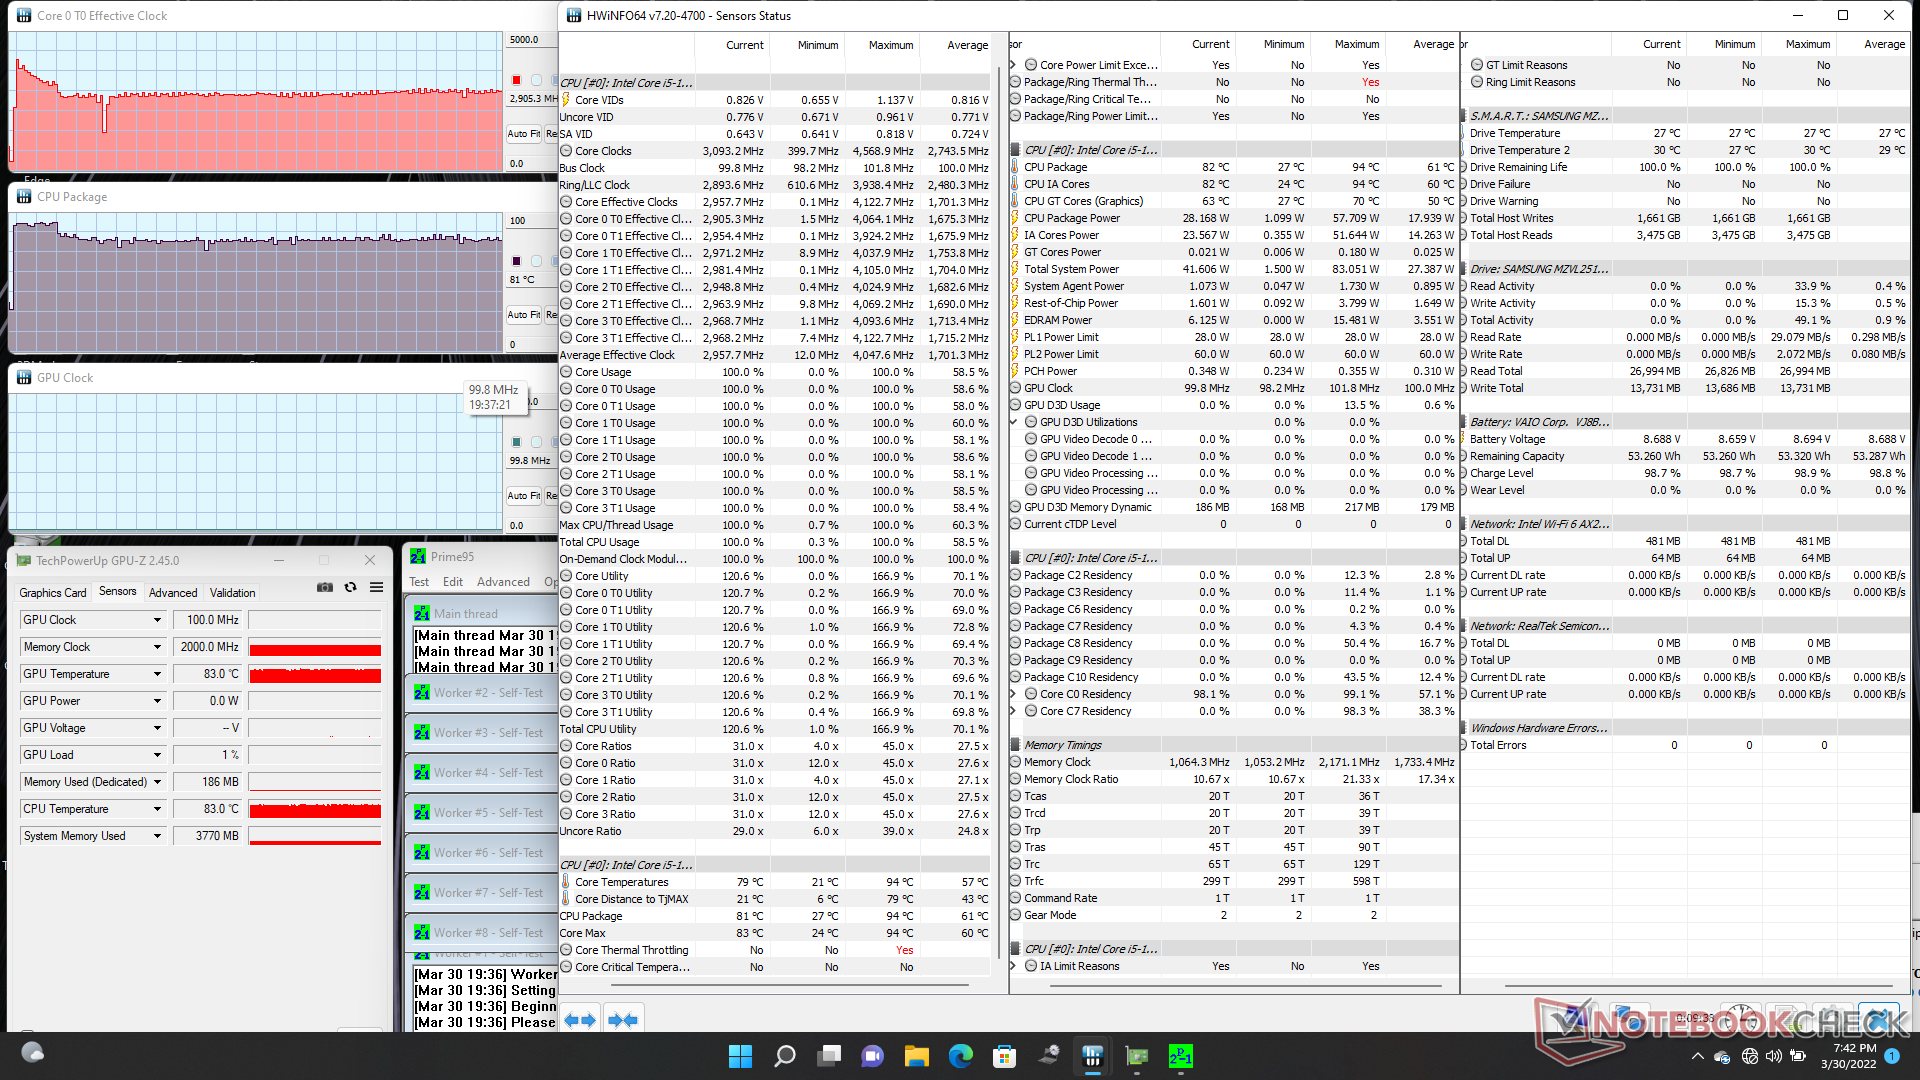
当运行Prime95对CPU施加压力时,时钟频率和温度几乎会立即提升到4.1 GHz和92 C,然后在接下来的30秒内下降到3.2至3.6 GHz的范围。如我们下面的截图所示,时钟频率和温度最终将分别稳定在2.9 GHz和81 C。在压力测试开始时,CPU封装功率可高达58W,然后稳定在28W。
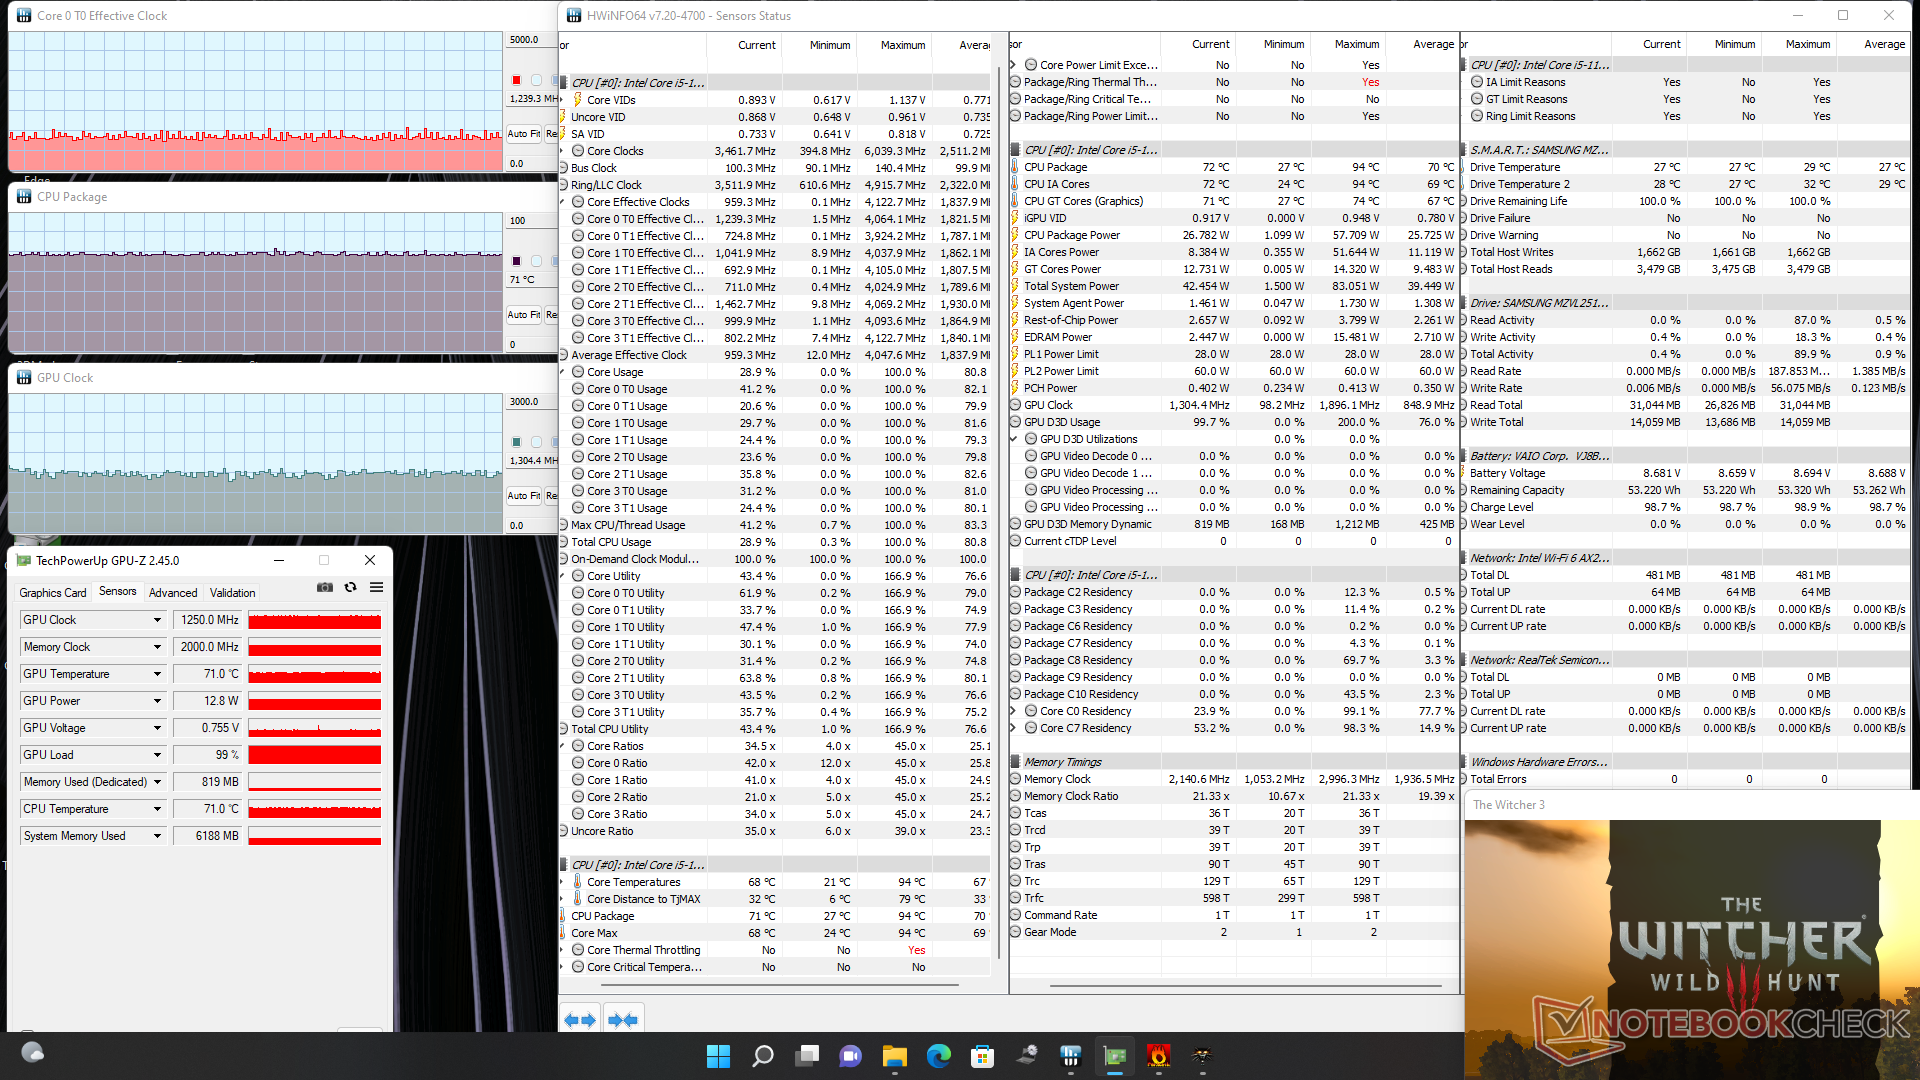
当运行像游戏这样的高负荷时,处理器将稳定在71摄氏度,而在XPS 13上的低60摄氏度范围内,或者在较大的 SX14.
用电池供电运行不会限制性能。在电池上进行的3DMark 11测试将返回物理和图形分数,分别为11800分和5896分,而在主电源上时为11849分和5962分。
| CPU时钟(GHz) | GPU时钟(MHz) | CPU平均温度(°C) | |
| 系统空闲 | -- | -- | 29 |
| Prime95压力 | 2.9 | -- | 81 |
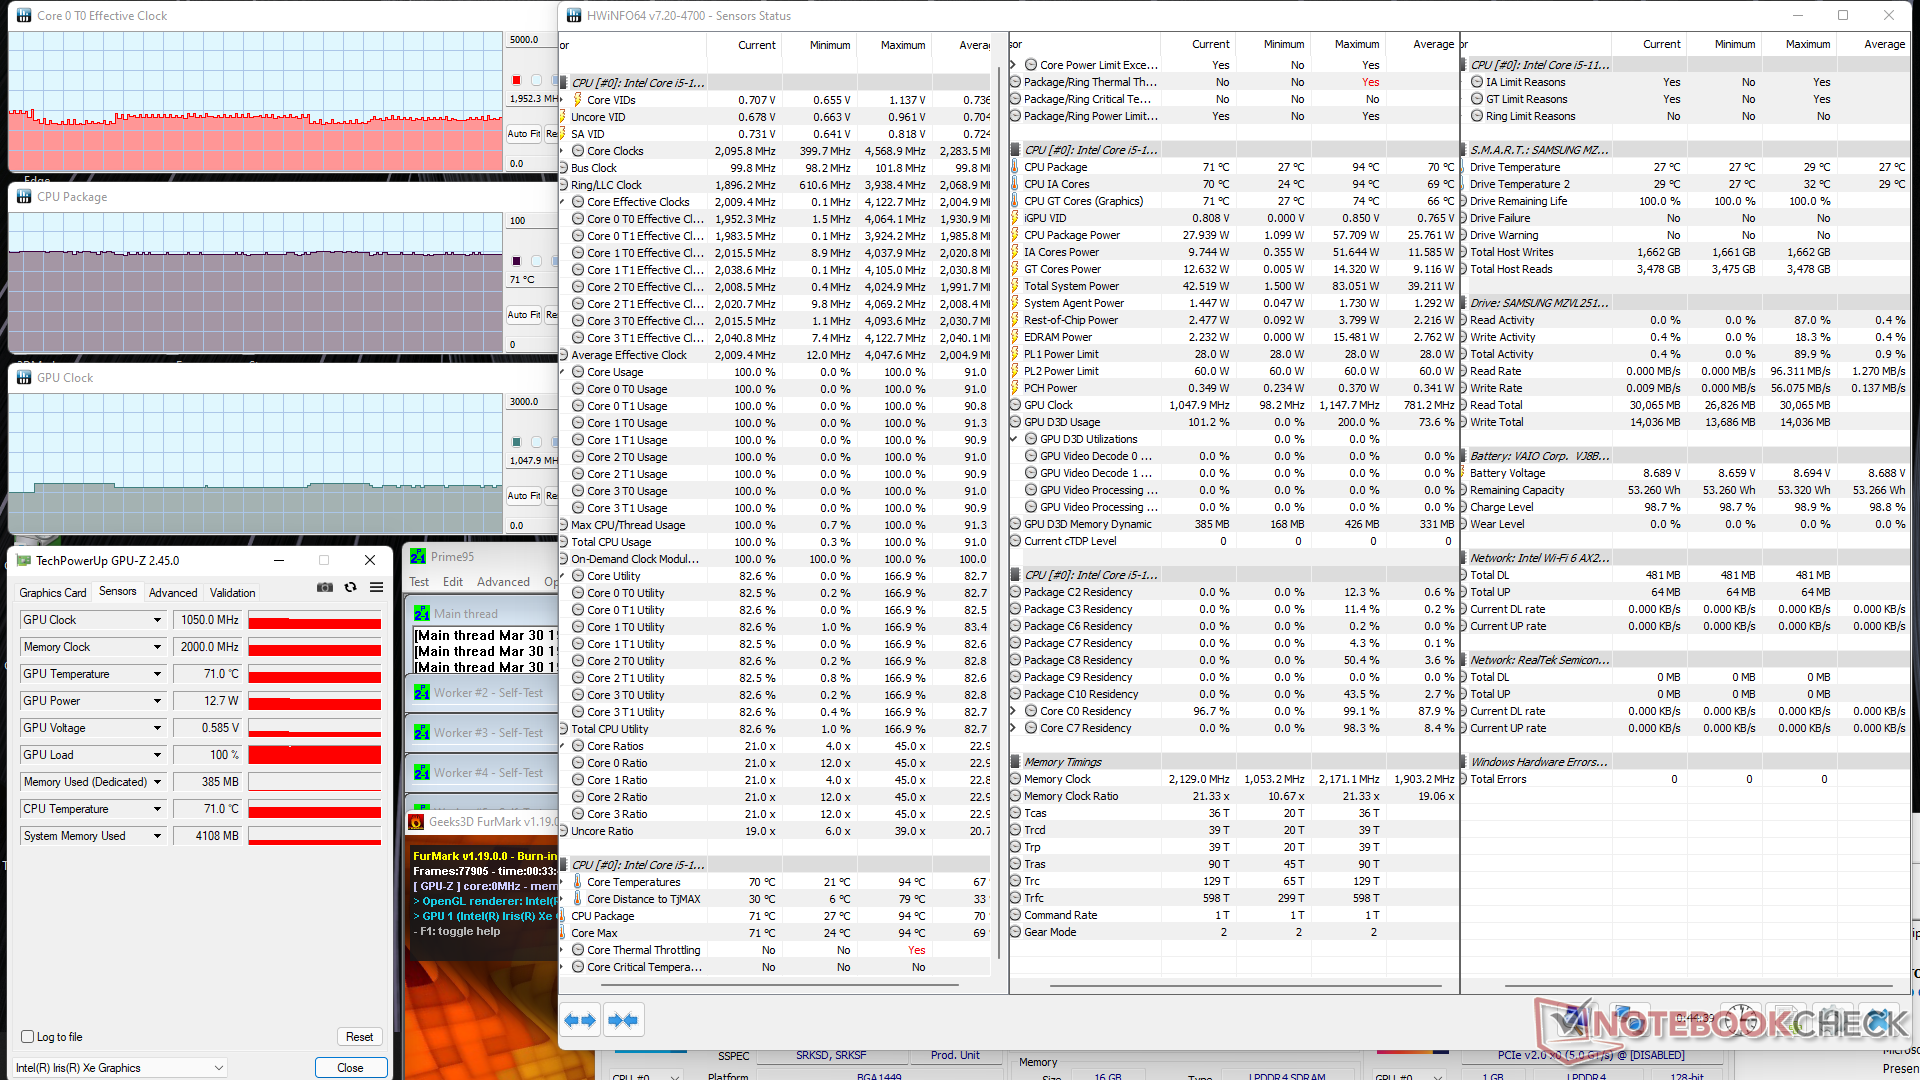
| Prime95 + FurMark 压力 | 1.9 | 1050 | 71 |
| Witcher 3 应力 | 1.2 | 1250 | 71 |
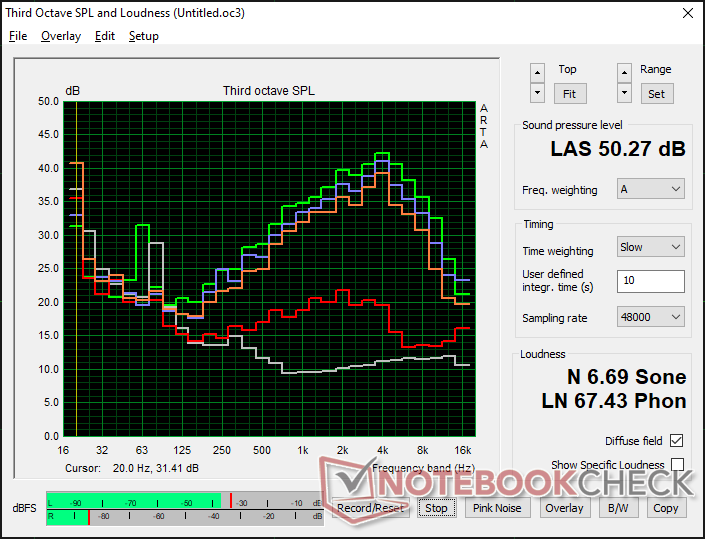
发言人
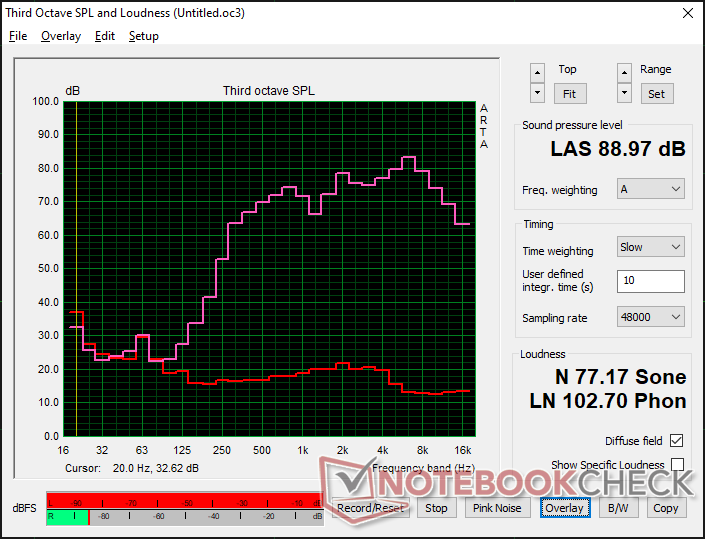
VAIO SX12 VJS124X1011P audio analysis
(+) | speakers can play relatively loud (89 dB)
Bass 100 - 315 Hz
(-) | nearly no bass - on average 31.5% lower than median
(±) | linearity of bass is average (12.5% delta to prev. frequency)
Mids 400 - 2000 Hz
(+) | balanced mids - only 2.8% away from median
(±) | linearity of mids is average (7.1% delta to prev. frequency)
Highs 2 - 16 kHz
(±) | higher highs - on average 5.9% higher than median
(+) | highs are linear (5.4% delta to prev. frequency)
Overall 100 - 16.000 Hz
(±) | linearity of overall sound is average (20.7% difference to median)
Compared to same class
» 68% of all tested devices in this class were better, 7% similar, 25% worse
» The best had a delta of 5%, average was 18%, worst was 53%
Compared to all devices tested
» 56% of all tested devices were better, 8% similar, 36% worse
» The best had a delta of 4%, average was 23%, worst was 134%
Apple MacBook Pro 16 2021 M1 Pro audio analysis
(+) | speakers can play relatively loud (84.7 dB)
Bass 100 - 315 Hz
(+) | good bass - only 3.8% away from median
(+) | bass is linear (5.2% delta to prev. frequency)
Mids 400 - 2000 Hz
(+) | balanced mids - only 1.3% away from median
(+) | mids are linear (2.1% delta to prev. frequency)
Highs 2 - 16 kHz
(+) | balanced highs - only 1.9% away from median
(+) | highs are linear (2.7% delta to prev. frequency)
Overall 100 - 16.000 Hz
(+) | overall sound is linear (4.6% difference to median)
Compared to same class
» 0% of all tested devices in this class were better, 0% similar, 100% worse
» The best had a delta of 5%, average was 17%, worst was 45%
Compared to all devices tested
» 0% of all tested devices were better, 0% similar, 100% worse
» The best had a delta of 4%, average was 23%, worst was 134%
能源管理
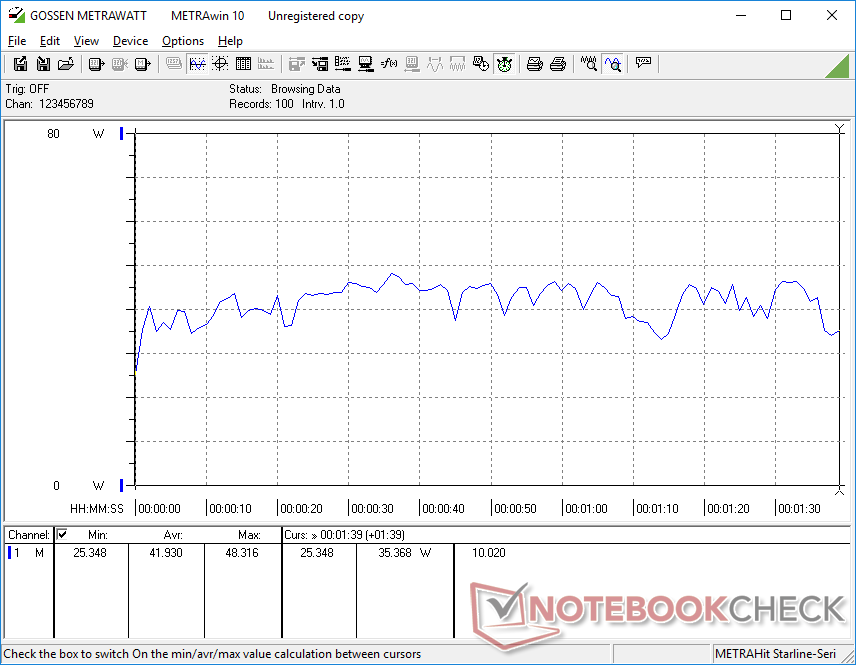
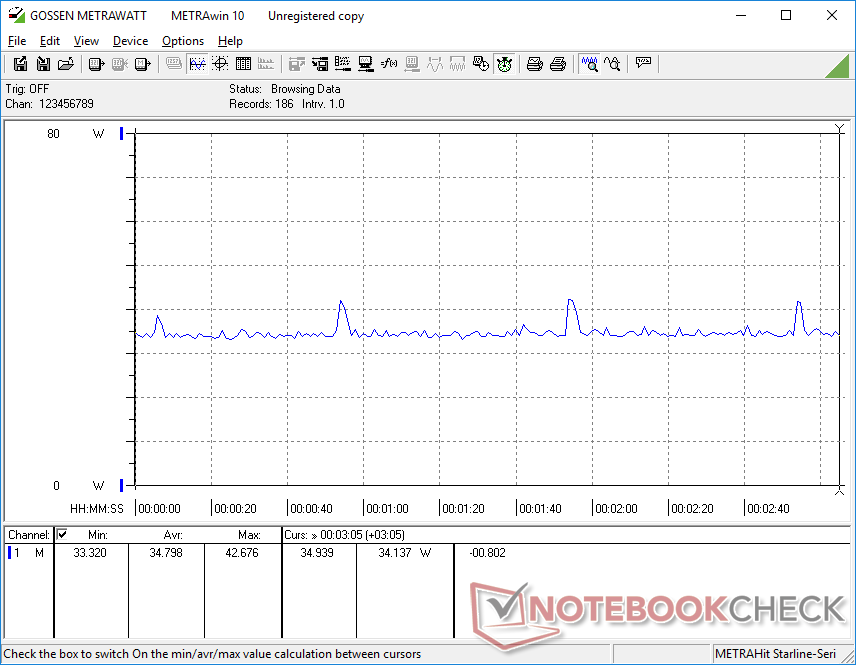
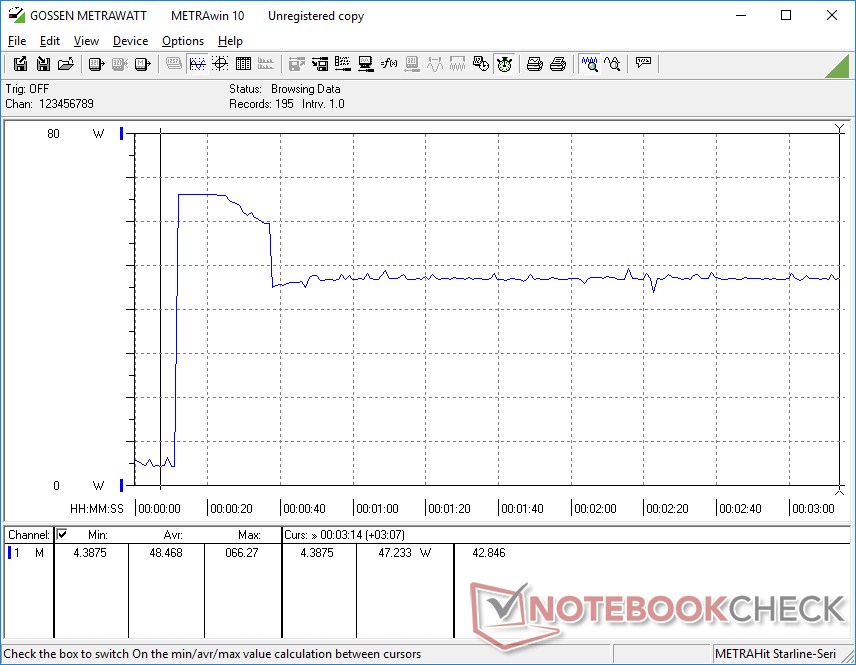
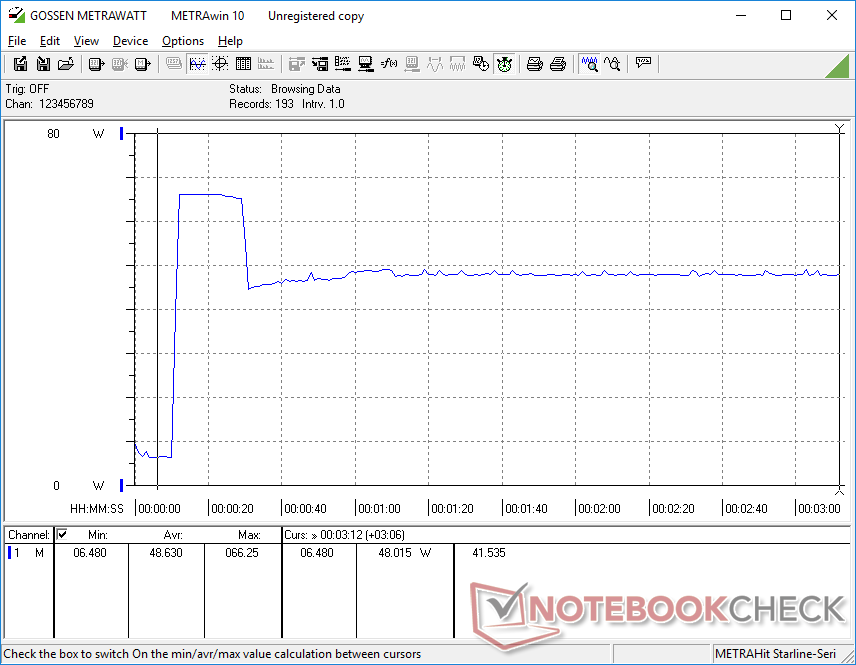
耗电量--一个苛刻的小家伙
由于SX12使用的是类似级别的CPU,因此总体消耗量与较大的XPS 13并无不同。当运行更高的负载(如游戏)时,SX12的要求会比Vaio A12高2倍。 Vaio A12尽管原始图形性能提升了8倍,但每瓦性能显著提高。类似的每瓦性能优势也可以引申到Dynabook Portégé X40采用了较早的Comet Lake-U处理器。
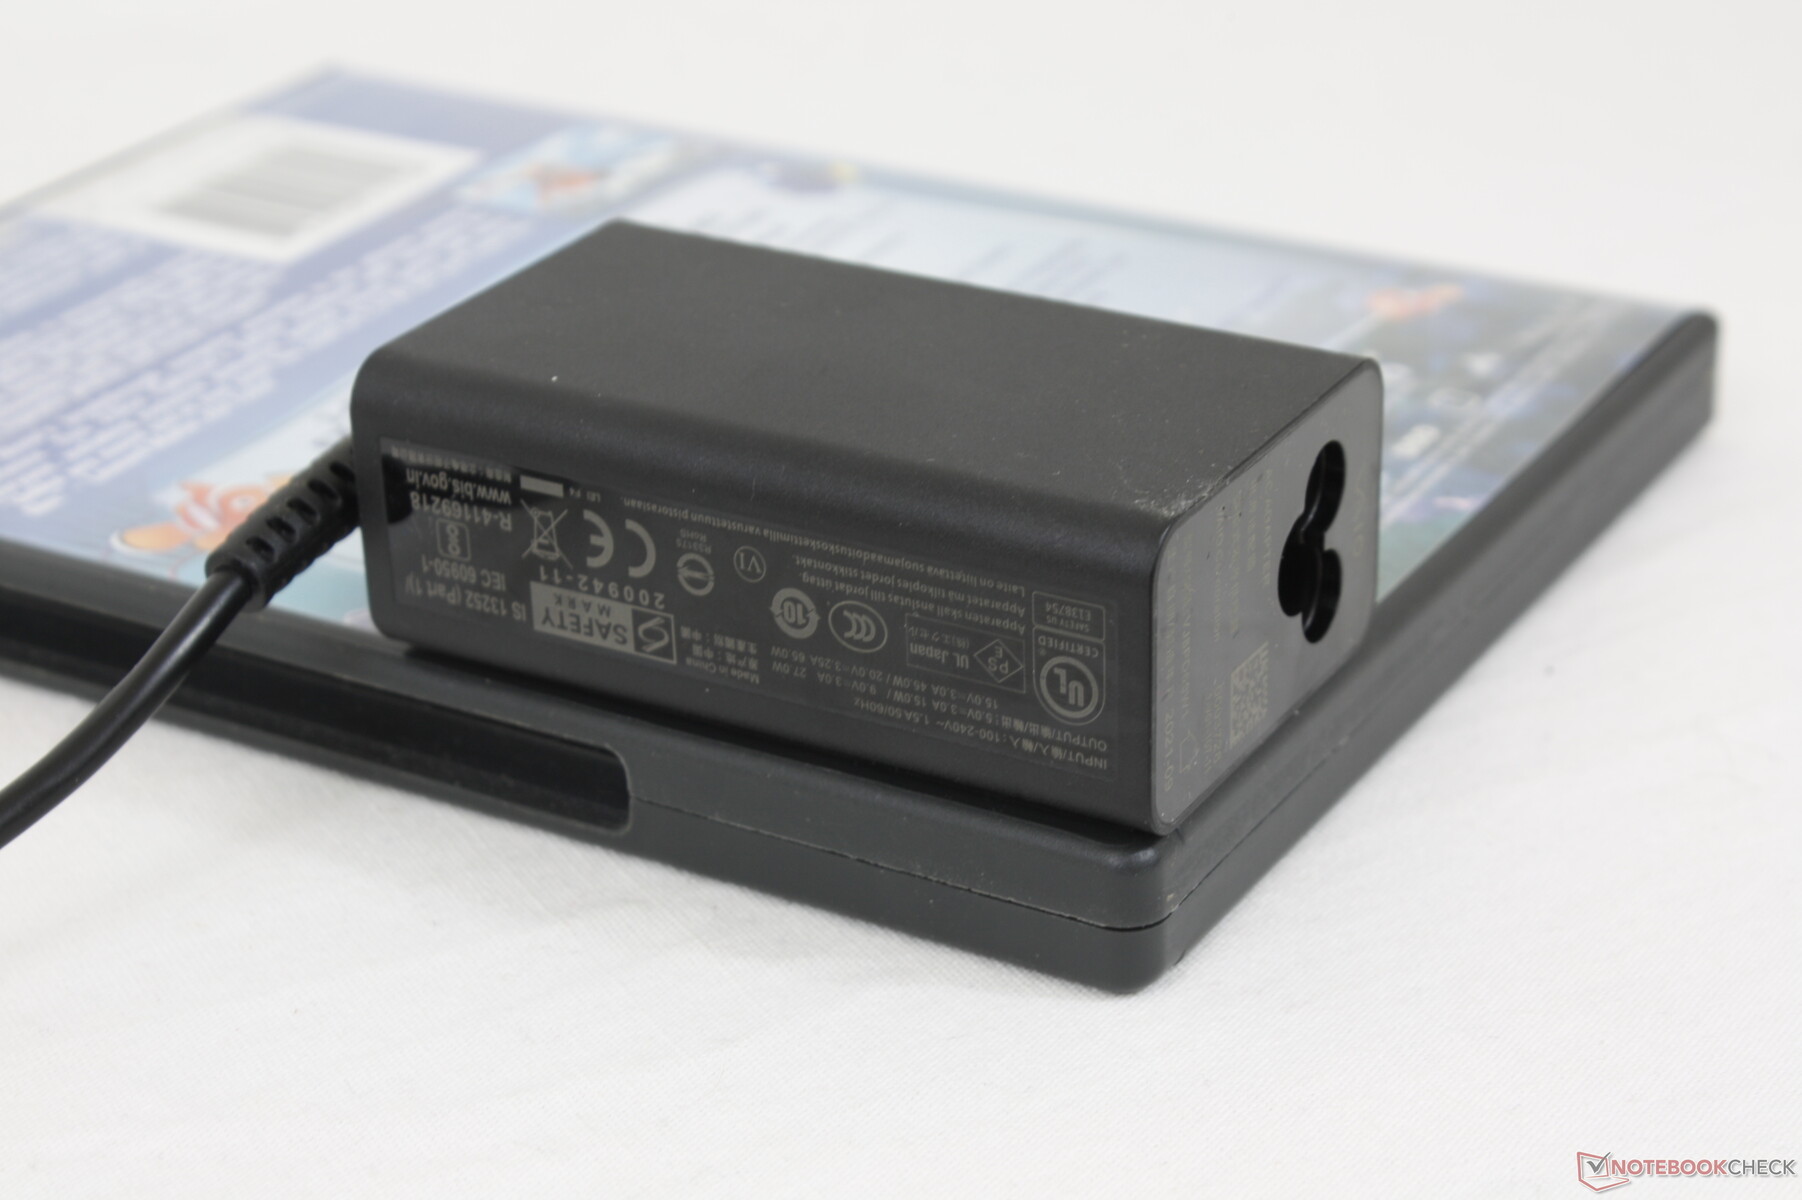
我们能够从小型(约7.8 x 4.4 x 2.8厘米)的65瓦交流适配器上测量到最大功耗为66.3瓦。我们很欣赏这种高容量的适配器,因为许多其他超极本,如XPS 13,通常会配备一个能力较差的45W适配器。涡轮增压的潜力随后在Vaio上更高,即使它只是暂时的。
| Off / Standby | |
| Idle | |
| Load |
|
Key:
min: | |
| VAIO SX12 VJS124X1011P i5-1155G7, Iris Xe G7 80EUs, Samsung PM9A1 MZVL2512HCJQ, IPS, 1920x1080, 12.5" | VAIO A12-92993 i7-8500Y, UHD Graphics 615, Samsung SSD PM981 MZVLB512HAJQ, IPS, 1920x1080, 12.5" | VAIO SX14 VJS144X0111K i7-1195G7, Iris Xe G7 96EUs, Samsung PM9A1 MZVL22T0HBLB, IPS, 1920x1080, 14" | Huawei MateBook E Core i5 i5-1130G7, Iris Xe G7 80EUs, Silicon Motion PCIe-8 SSD, OLED, 2560x1600, 12.6" | Dell XPS 13 9310 Core i7 FHD i7-1165G7, Iris Xe G7 96EUs, Micron 2300 512GB MTFDHBA512TDV, IPS, 1920x1200, 13.4" | Dynabook Portégé X40-G-10K i5-10210U, UHD Graphics 620, Samsung SSD PM981a MZVLB256HBHQ, IPS, 1920x1080, 14" | |
|---|---|---|---|---|---|---|
| Power Consumption | 8% | -60% | -13% | 1% | -25% | |
| Idle Minimum * (Watt) | 3 | 4.4 -47% | 3.3 -10% | 5.5 -83% | 3.9 -30% | 2.7 10% |
| Idle Average * (Watt) | 5.8 | 6.5 -12% | 13.9 -140% | 8.9 -53% | 5.9 -2% | 11.2 -93% |
| Idle Maximum * (Watt) | 6.4 | 7.1 -11% | 15.9 -148% | 9.5 -48% | 6.3 2% | 11.8 -84% |
| Load Average * (Watt) | 41.9 | 20.2 52% | 54 -29% | 26.6 37% | 39.7 5% | 38 9% |
| Witcher 3 ultra * (Watt) | 34.8 | 46.6 -34% | 20.6 41% | 34.8 -0% | ||
| Load Maximum * (Watt) | 66.3 | 28 58% | 66 -0% | 48.5 27% | 47.5 28% | 43.6 34% |
* ... smaller is better
Power Consumption Witcher 3 / Stresstest
Power Consumption external Monitor
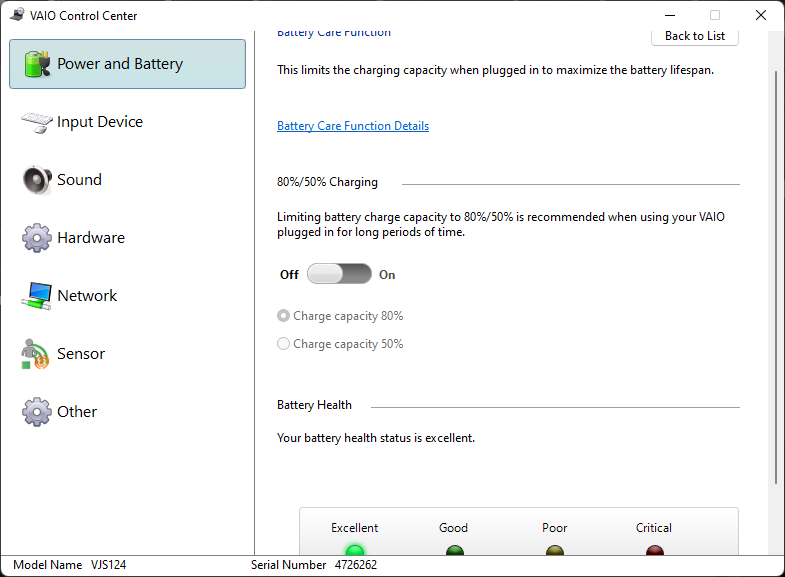
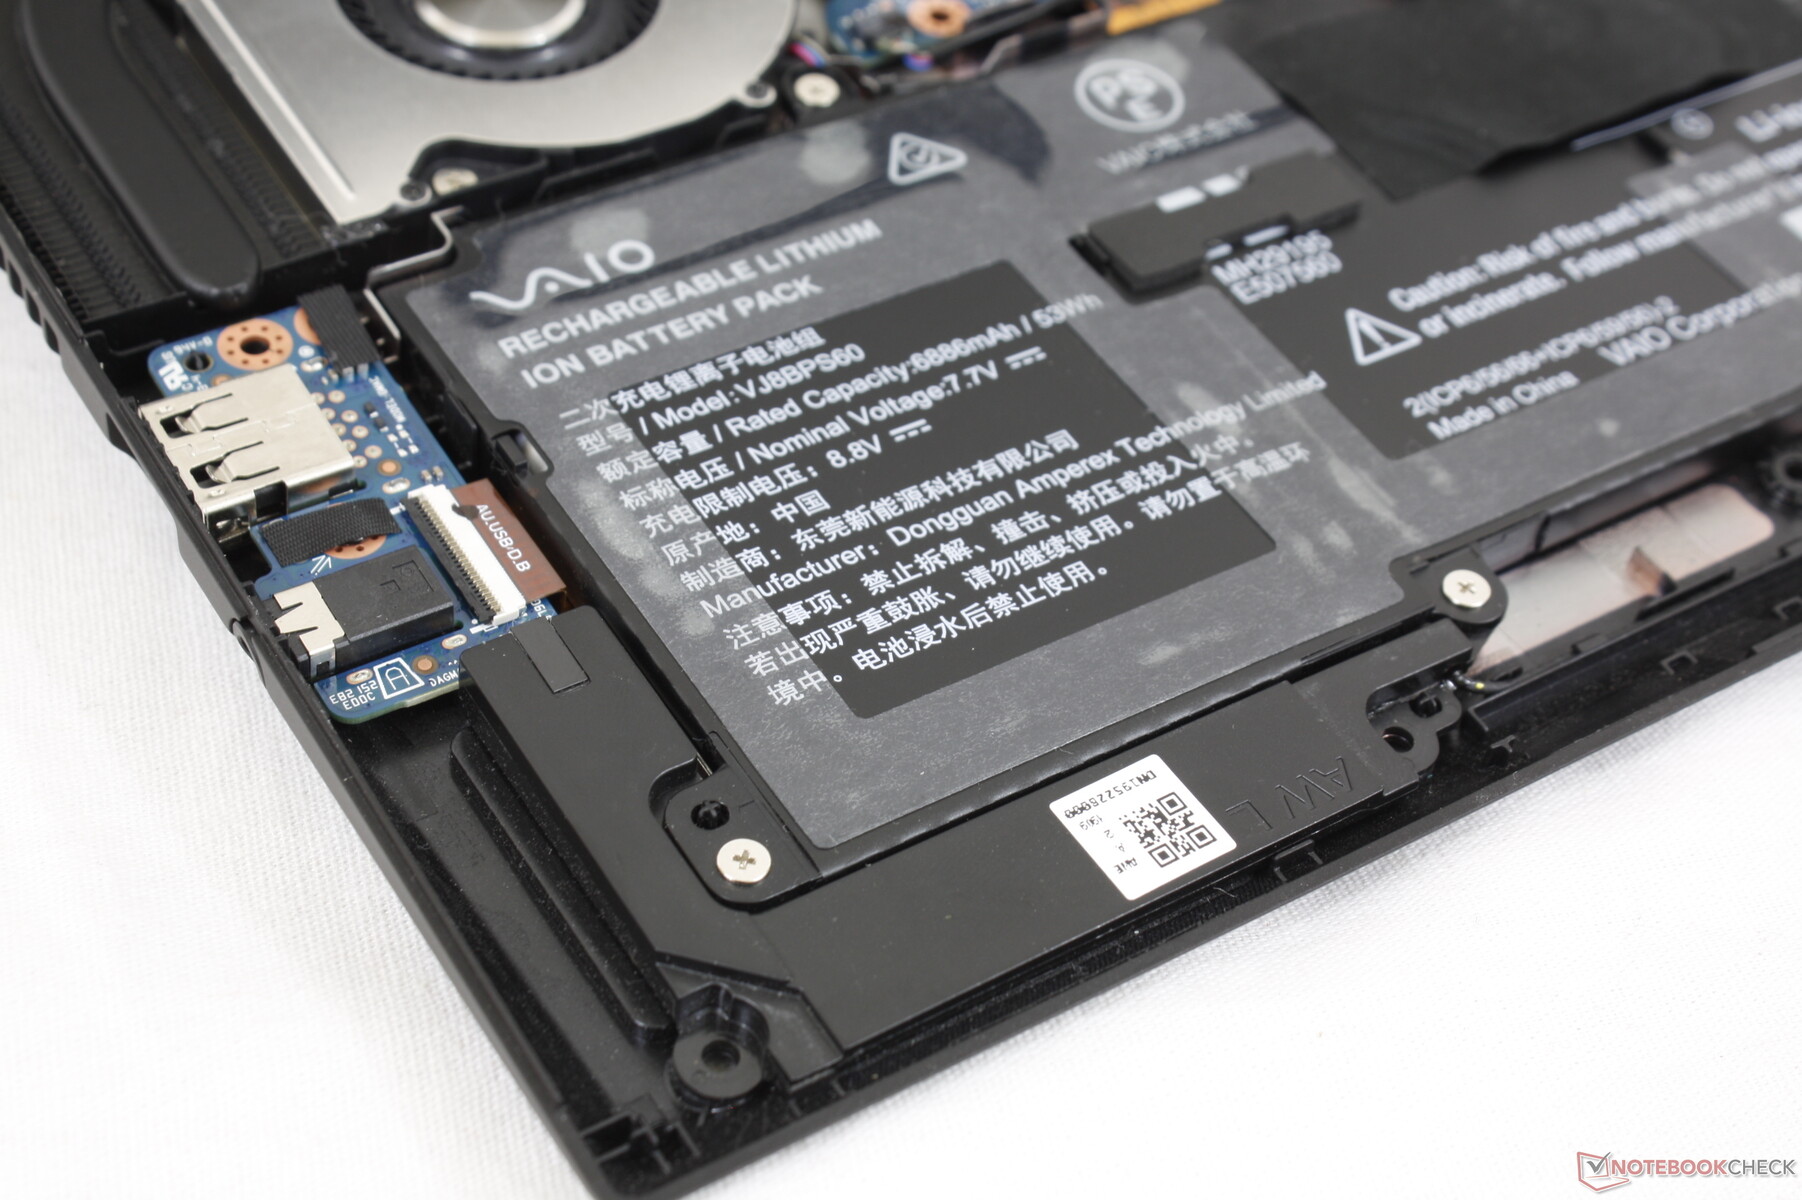
电池寿命
对于12.5英寸的外形尺寸来说,54Wh的内置电池是比较大的。因此,电池寿命非常长,实际使用WLAN的时间为13小时。然而,从空电到满电的充电速度比预期的要慢得多,为3个小时,而其他大多数超极本的充电时间仅为一半。
| VAIO SX12 VJS124X1011P i5-1155G7, Iris Xe G7 80EUs, 53 Wh | VAIO A12-92993 i7-8500Y, UHD Graphics 615, 23.4 Wh | VAIO SX14 VJS144X0111K i7-1195G7, Iris Xe G7 96EUs, 53 Wh | Huawei MateBook E Core i5 i5-1130G7, Iris Xe G7 80EUs, 42 Wh | Dell Latitude 7200 i5-8365U, UHD Graphics 620, 38 Wh | Dell XPS 13 9310 Core i7 FHD i7-1165G7, Iris Xe G7 96EUs, 52 Wh | |
|---|---|---|---|---|---|---|
| Battery runtime | -42% | -24% | 3% | -21% | 20% | |
| Reader / Idle (h) | 33.4 | 8.6 -74% | 34.1 2% | 30 -10% | ||
| WiFi v1.3 (h) | 13.4 | 7.2 -46% | 8.9 -34% | 6.1 -54% | 7 -48% | 11 -18% |
| Load (h) | 1.7 | 1.6 -6% | 1 -41% | 2.7 59% | 1.8 6% | 3.2 88% |
| H.264 (h) | 3.7 | 6.2 | 8.2 |
Pros
Cons
结论--小有大情怀
与其他同尺寸级别的次笔记本相比,SX12充满了惊喜。它有一个更明亮、更饱满的sRGB IPS显示屏,适当的酷睿U系列CPU,具有良好的Turbo Boost可持续性,响亮的内部扬声器,宽敞的键盘,更大的电池容量,以及比大多数人更多的端口选项。该机型成功地将我们从较大的13英寸或15英寸超极本中期待的几乎所有核心功能整合到一个超轻的12英寸外形尺寸上,而没有沿途削减任何主要角落。
不要让它的小尺寸欺骗你。SX12的性能与大男孩一样快,而且还有许多相同的功能。
该系统的主要缺点是相对于其他超极本,它的风扇噪音很大。由于机箱是如此的小和轻,内部风扇必须通过更大声和更频繁的运行来补偿。如果用户计划在相对强大的处理器上玩游戏或运行其他苛刻的负载,他们肯定会注意到。
其他缺点是白色背光与白色键帽相映成趣,而且盖子的刚性有点差。你不能指望机箱像戴尔XPS、惠普Spectre或RazerBlade Stealth 那样坚固,因为它明显更轻、更便携。考虑到这台笔记本电脑在几乎所有其他方面都有很大的优势,这可以说是一个小的缺点。
价格和可用性
Vaio SX12目前可以直接从制造商那里获得https://us.vaio.com/products/vaio-sx-2022?variant=39541688860747起价为1300美元,为我们的配置所回顾。
VAIO SX12 VJS124X1011P
- 04/02/2022 v7 (old)
Allen Ngo
Price comparison

