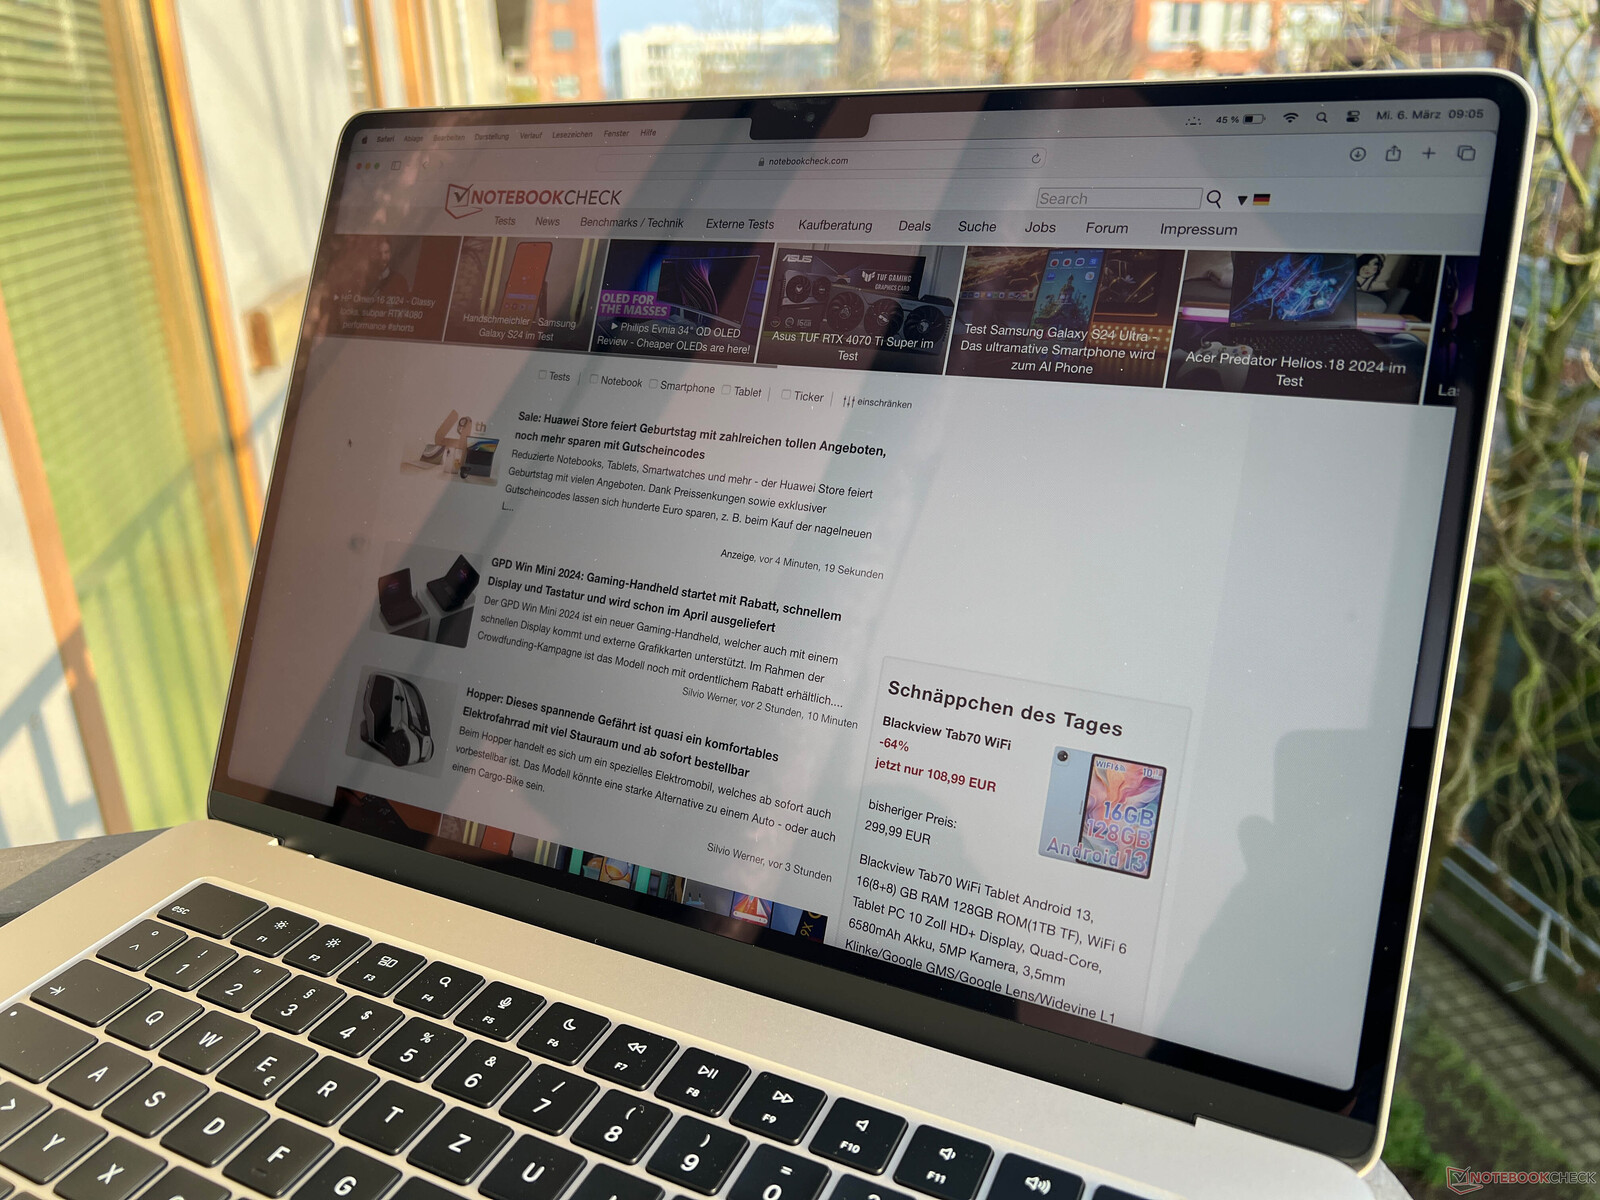
Apple MacBook Air 15 M3 评测 - 大型日常 MacBook 的升级版Apple
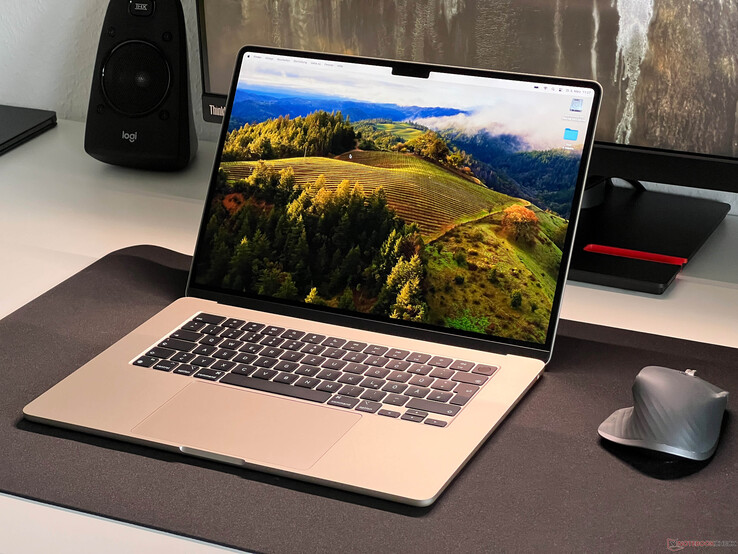
去年年中,Apple ,推出了更大尺寸的 MacBook Air 15,与我们的预期完全一致:更大的 MacBook Air 拥有更大的屏幕空间,由于采用了相同的被动散热技术,性能也不相上下。现在,这款大屏幕 Air 首次升级到新的 M3 处理器,并安装了新的 Wi-Fi 模块,但除此之外,它几乎和原来一样。
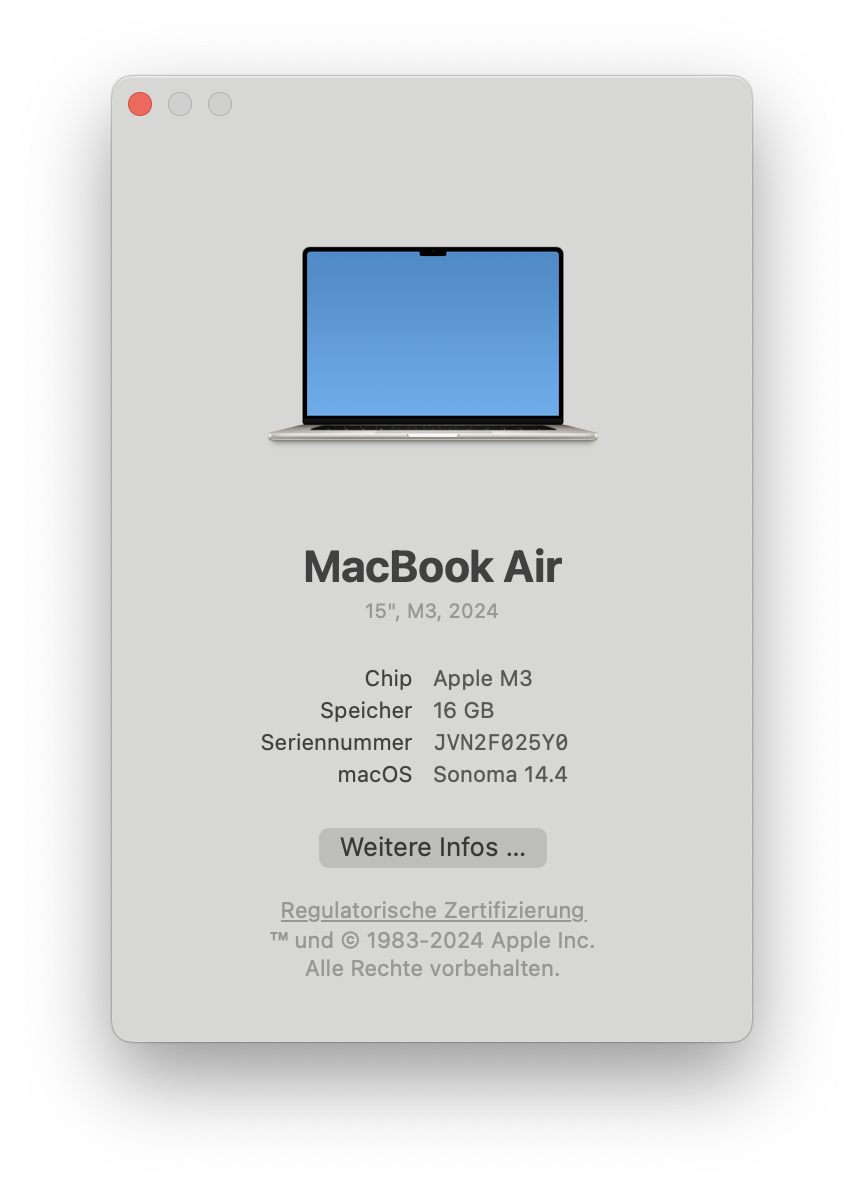
Apple 入门级机型配备 8 GB 内存和 256 GB 固态硬盘,售价高达 1299 美元。现在又多了一款预配置机型(我们的评测设备),配备 16GB 内存和 512GB SSD,售价 1699 美元。这样做的好处是,在许多商店里,预配置机型的价格往往会降低。
潜在的竞争对手比较
Rating | Date | Model | Weight | Height | Size | Resolution | Price |
|---|---|---|---|---|---|---|---|
| 91.6 % v7 (old) | 03 / 2024 | Apple MacBook Air 15 M3 M3, M3 10-Core GPU | 1.5 kg | 11.5 mm | 15.30" | 2880x1864 | |
| 84.9 % v7 (old) | 02 / 2024 | Asus VivoBook S15 K5504 i9-13900H, Iris Xe G7 96EUs | 1.6 kg | 19 mm | 15.60" | 2880x1620 | |
| 88.1 % v7 (old) | 12 / 2023 | MSI Prestige 16 B1MG-001US Ultra 7 155H, Arc 8-Core | 1.6 kg | 19.1 mm | 16.00" | 2560x1600 | |
| 86.6 % v7 (old) | 06 / 2023 | Acer Swift Go SFG16-71 i7-13700H, Iris Xe G7 96EUs | 1.6 kg | 19 mm | 16.00" | 3200x2000 | |
| 86 % v7 (old) | 06 / 2023 | Huawei MateBook 16s i9 i9-13900H, Iris Xe G7 96EUs | 2 kg | 17.8 mm | 16.00" | 2560x1680 | |
| 85 % v7 (old) | 08 / 2023 | LG Gram SuperSlim (2023) i7-1360P, Iris Xe G7 96EUs | 990 g | 10.9 mm | 15.60" | 1920x1080 | |
| 80.7 % v7 (old) | 06 / 2023 | Samsung Galaxy Book3 15, Core i5-1335U i5-1335U, Iris Xe G7 80EUs | 1.5 kg | 15.4 mm | 15.60" | 1920x1080 |
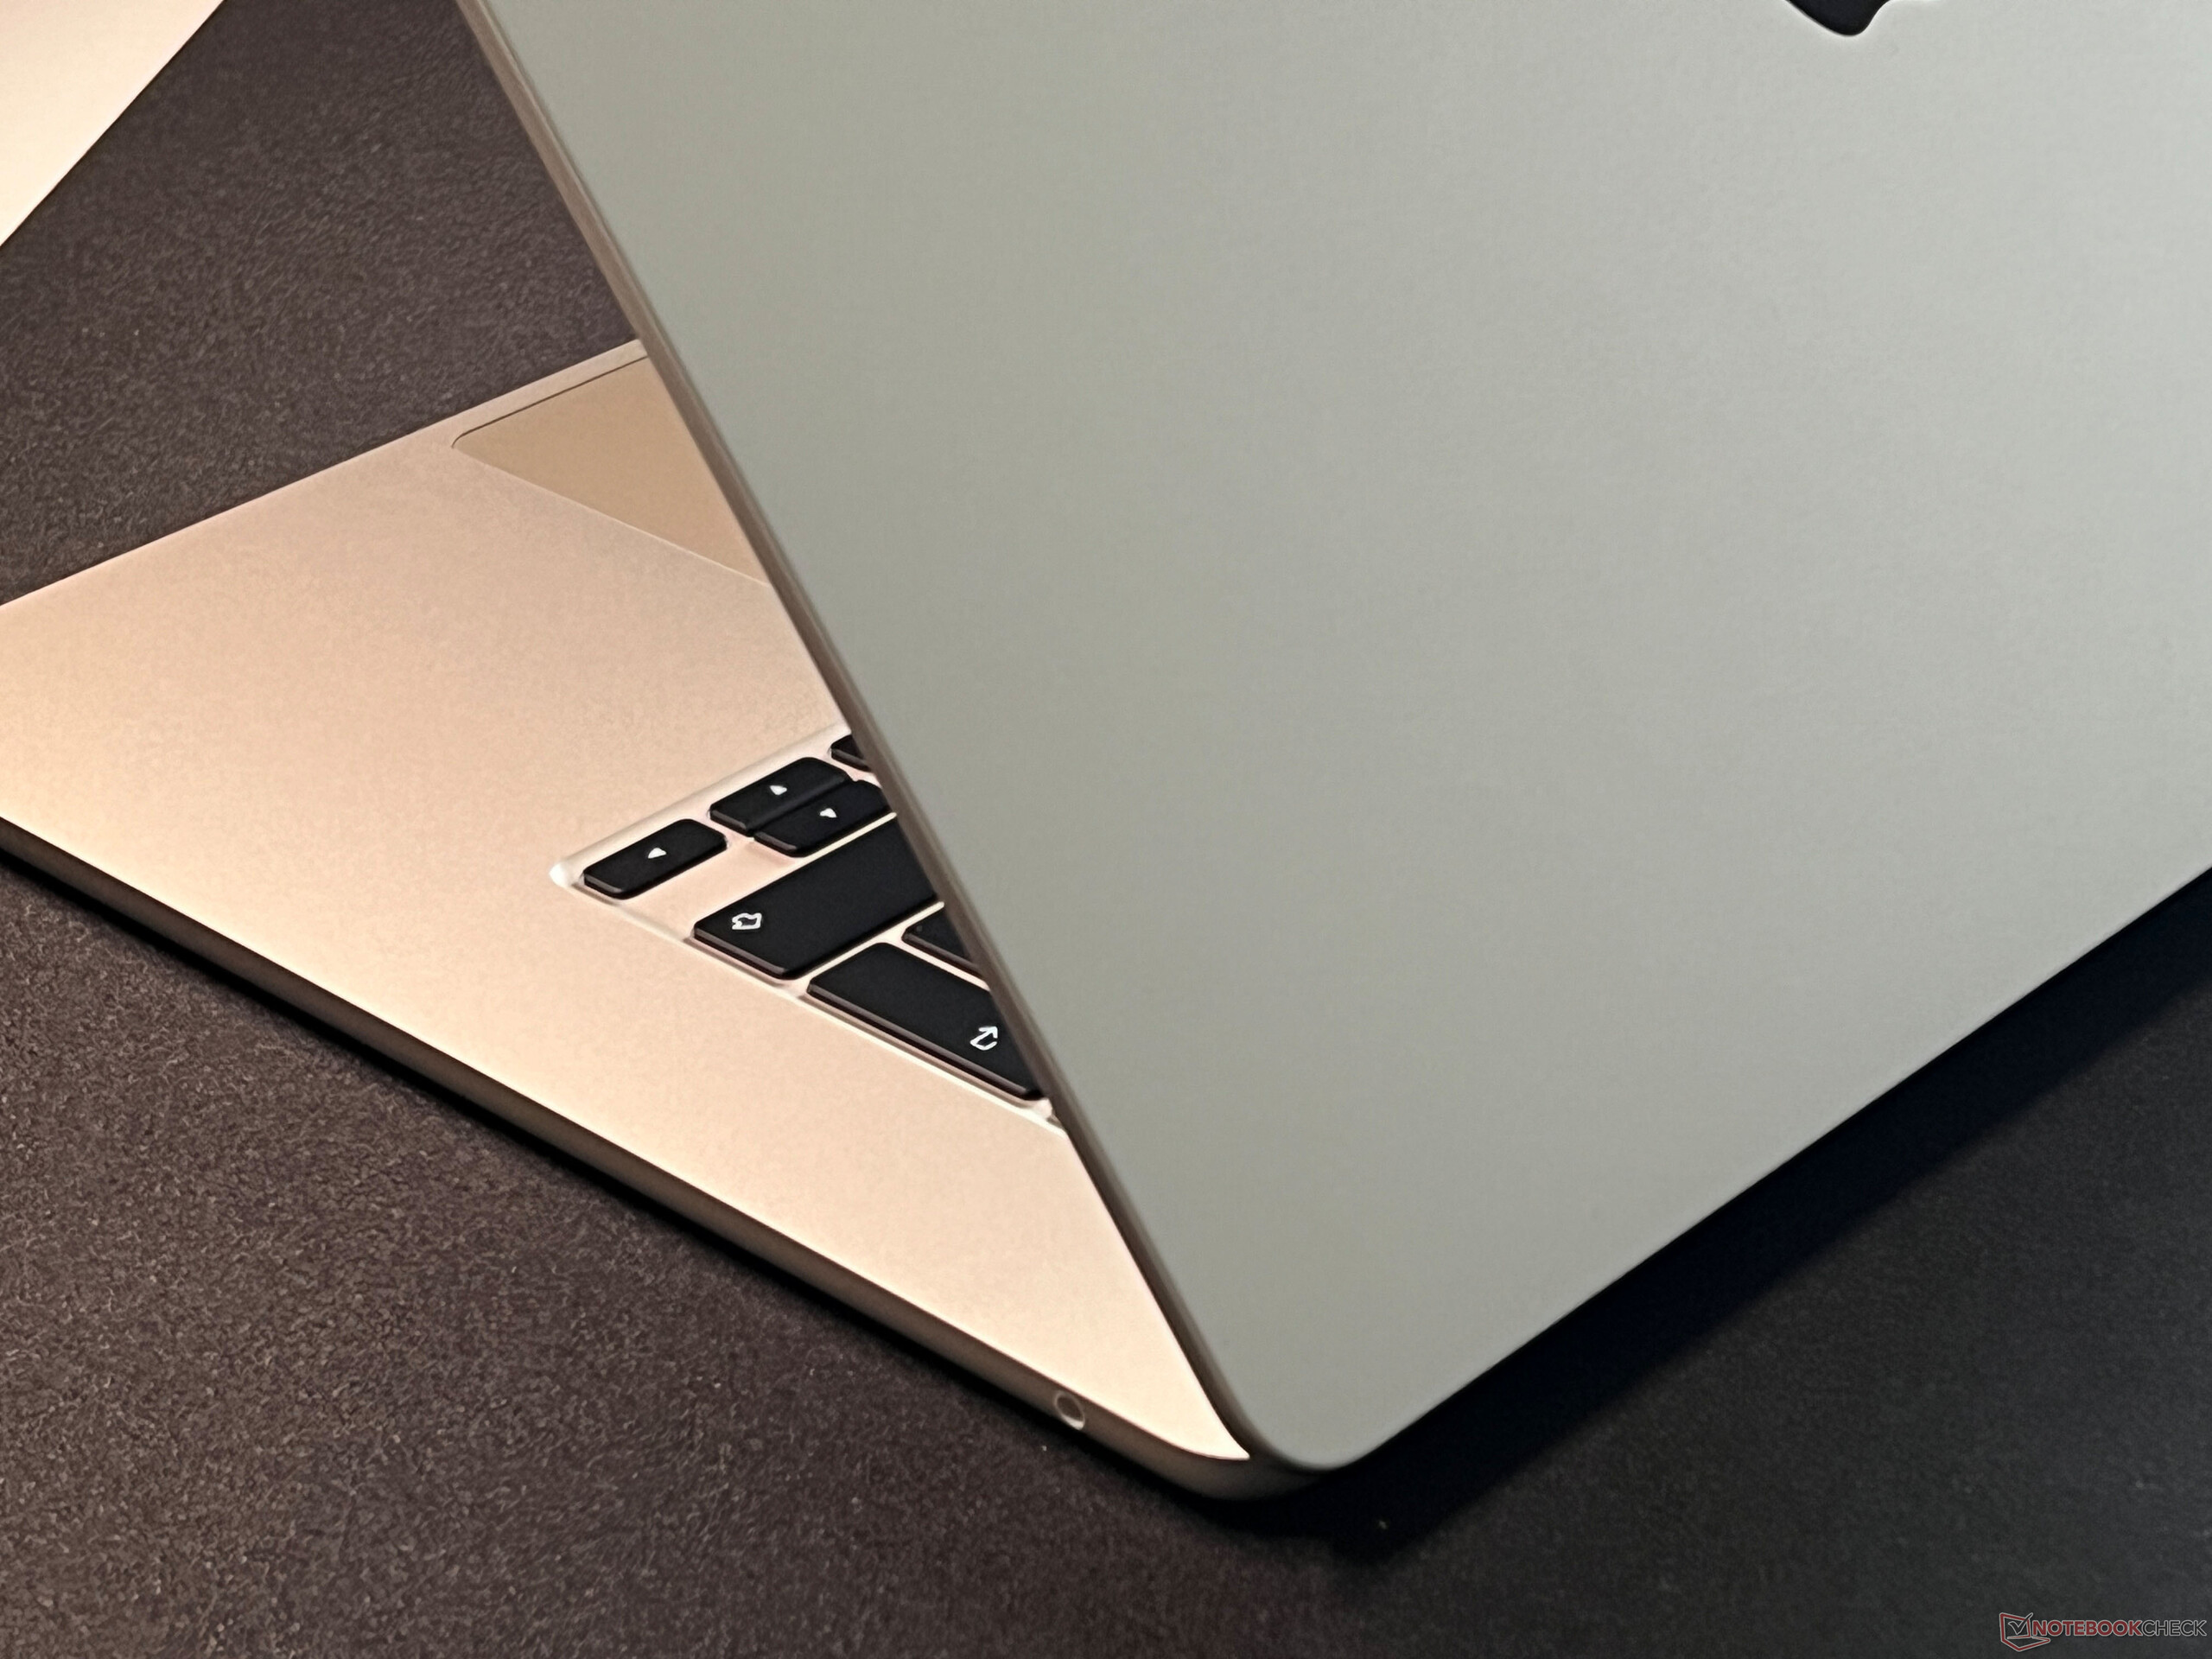
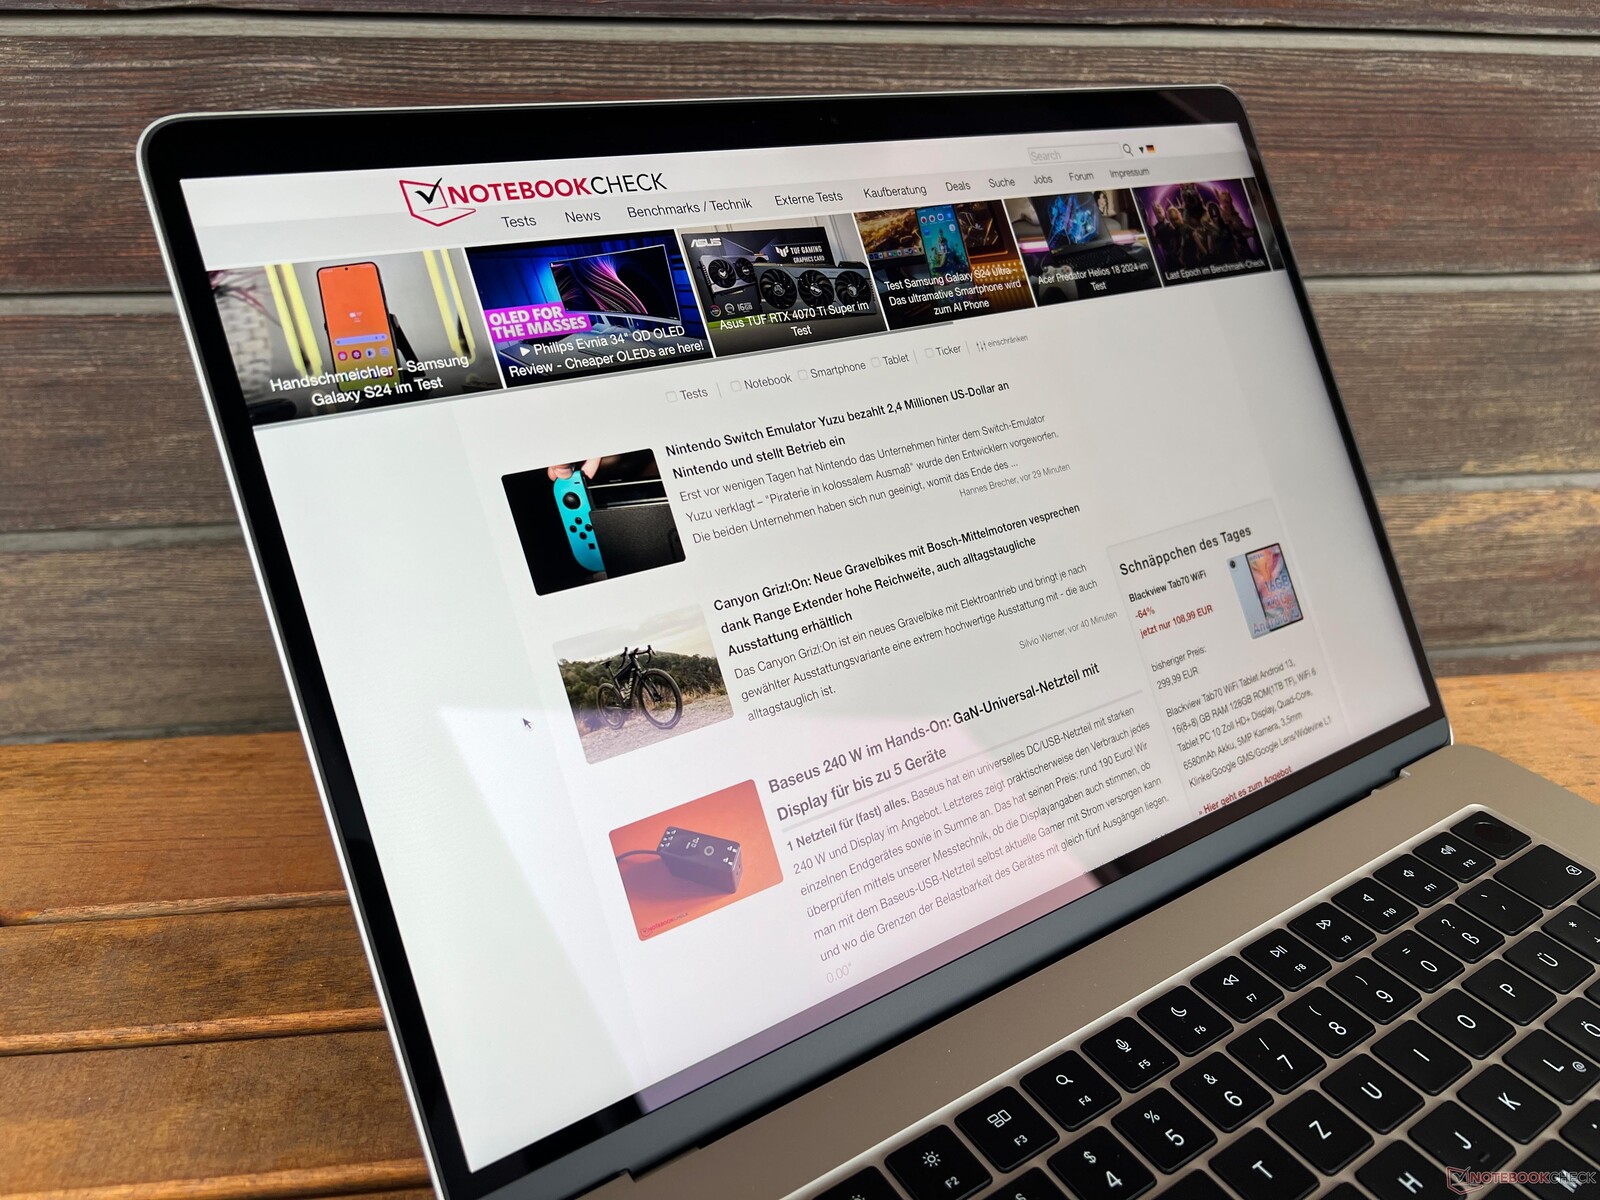
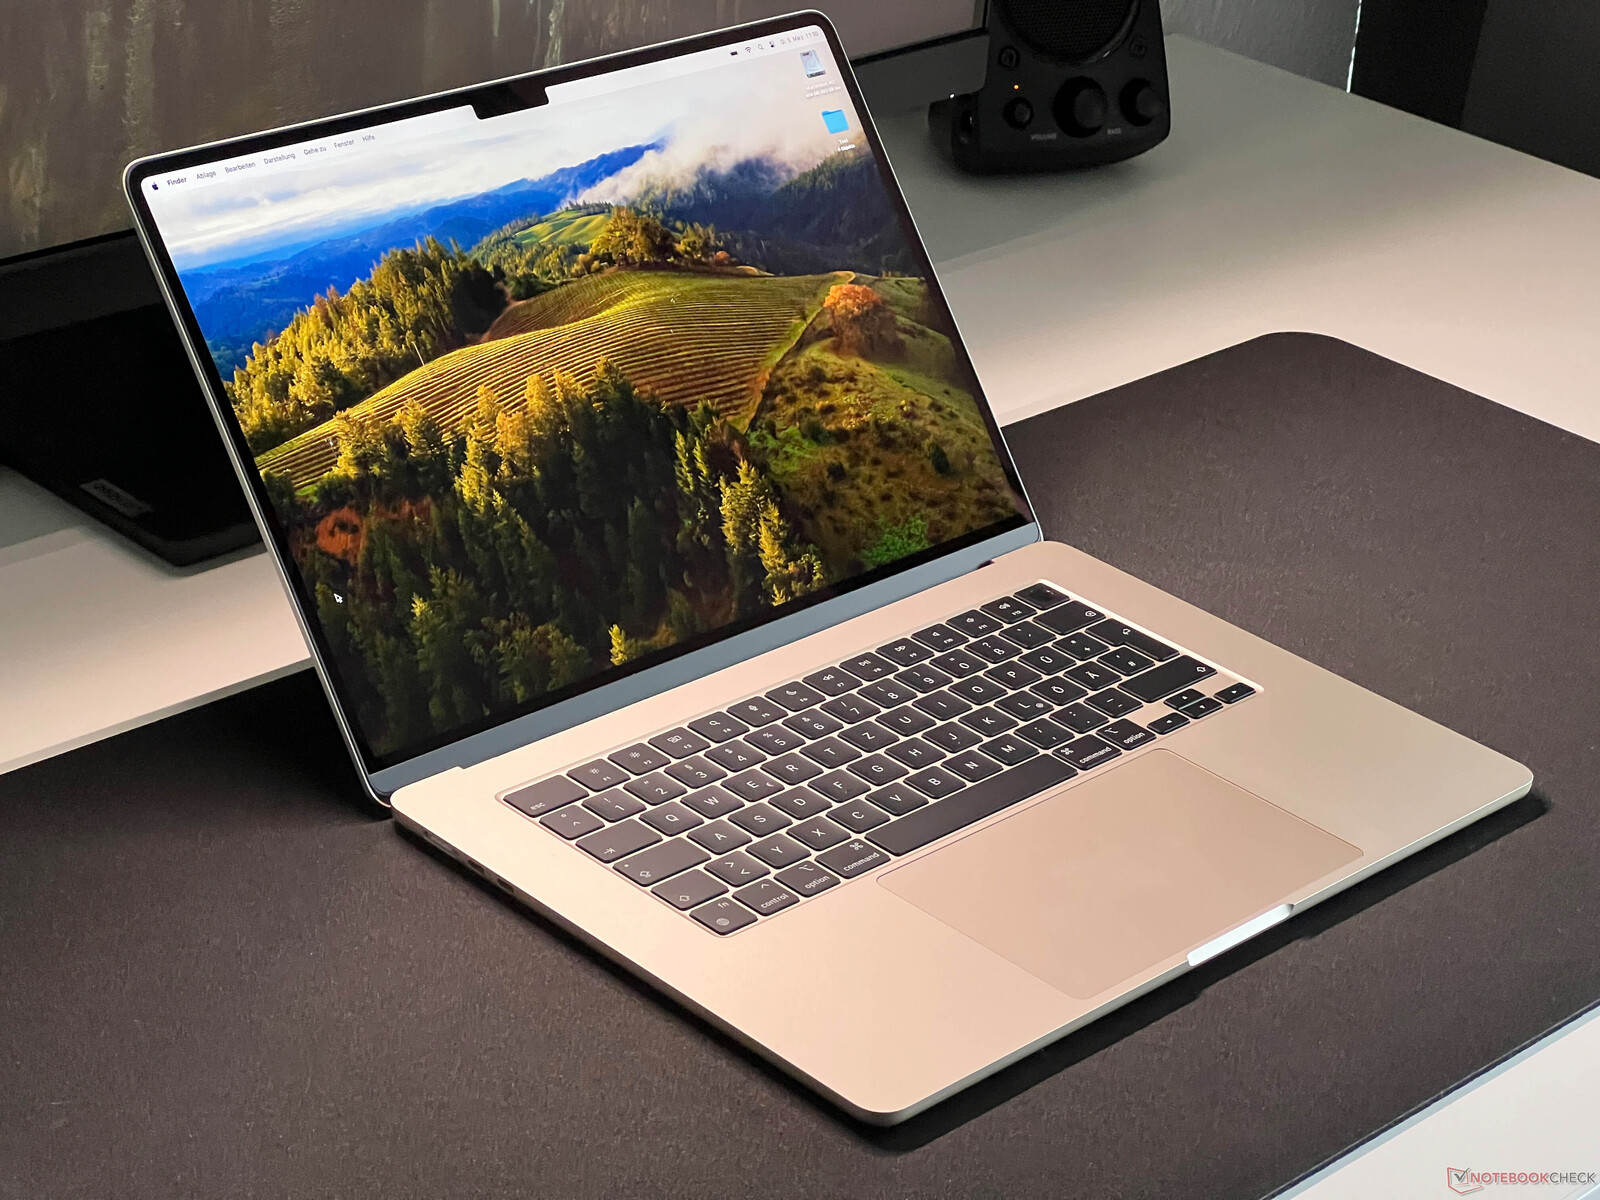
外壳 - Midnight MacBook 现在配备了全新涂层
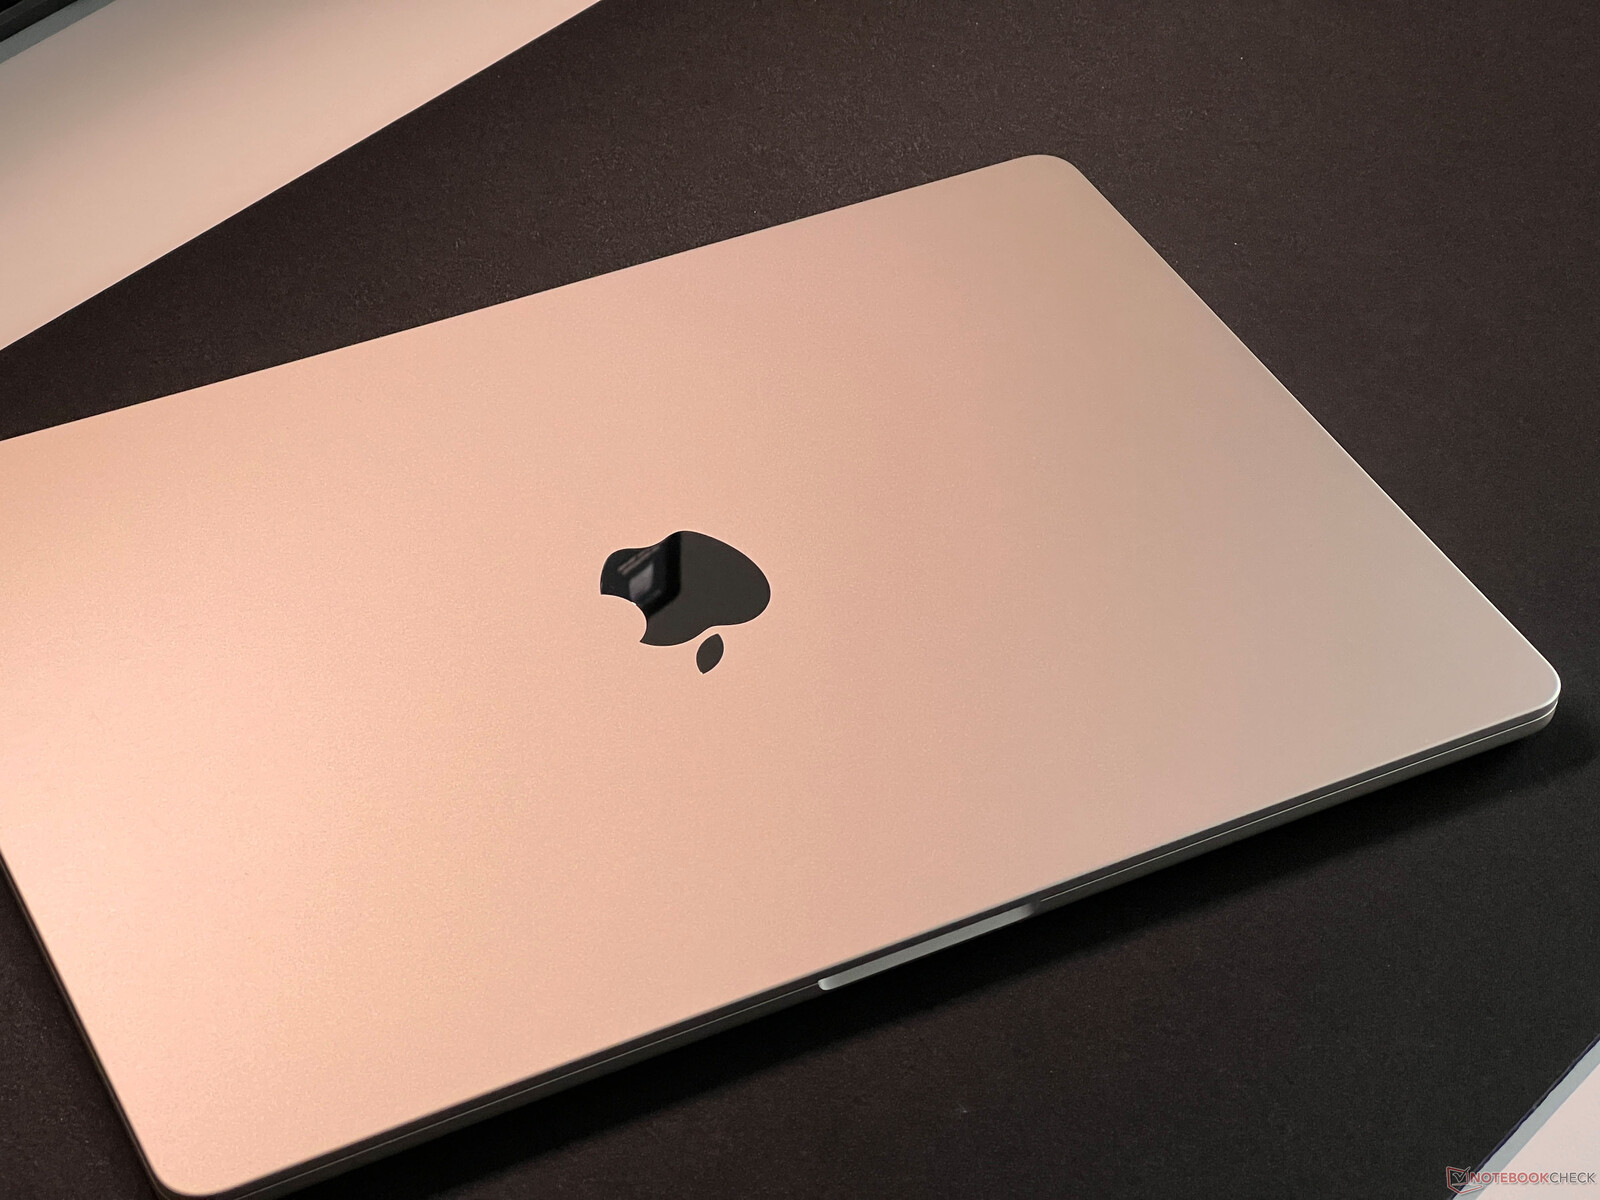
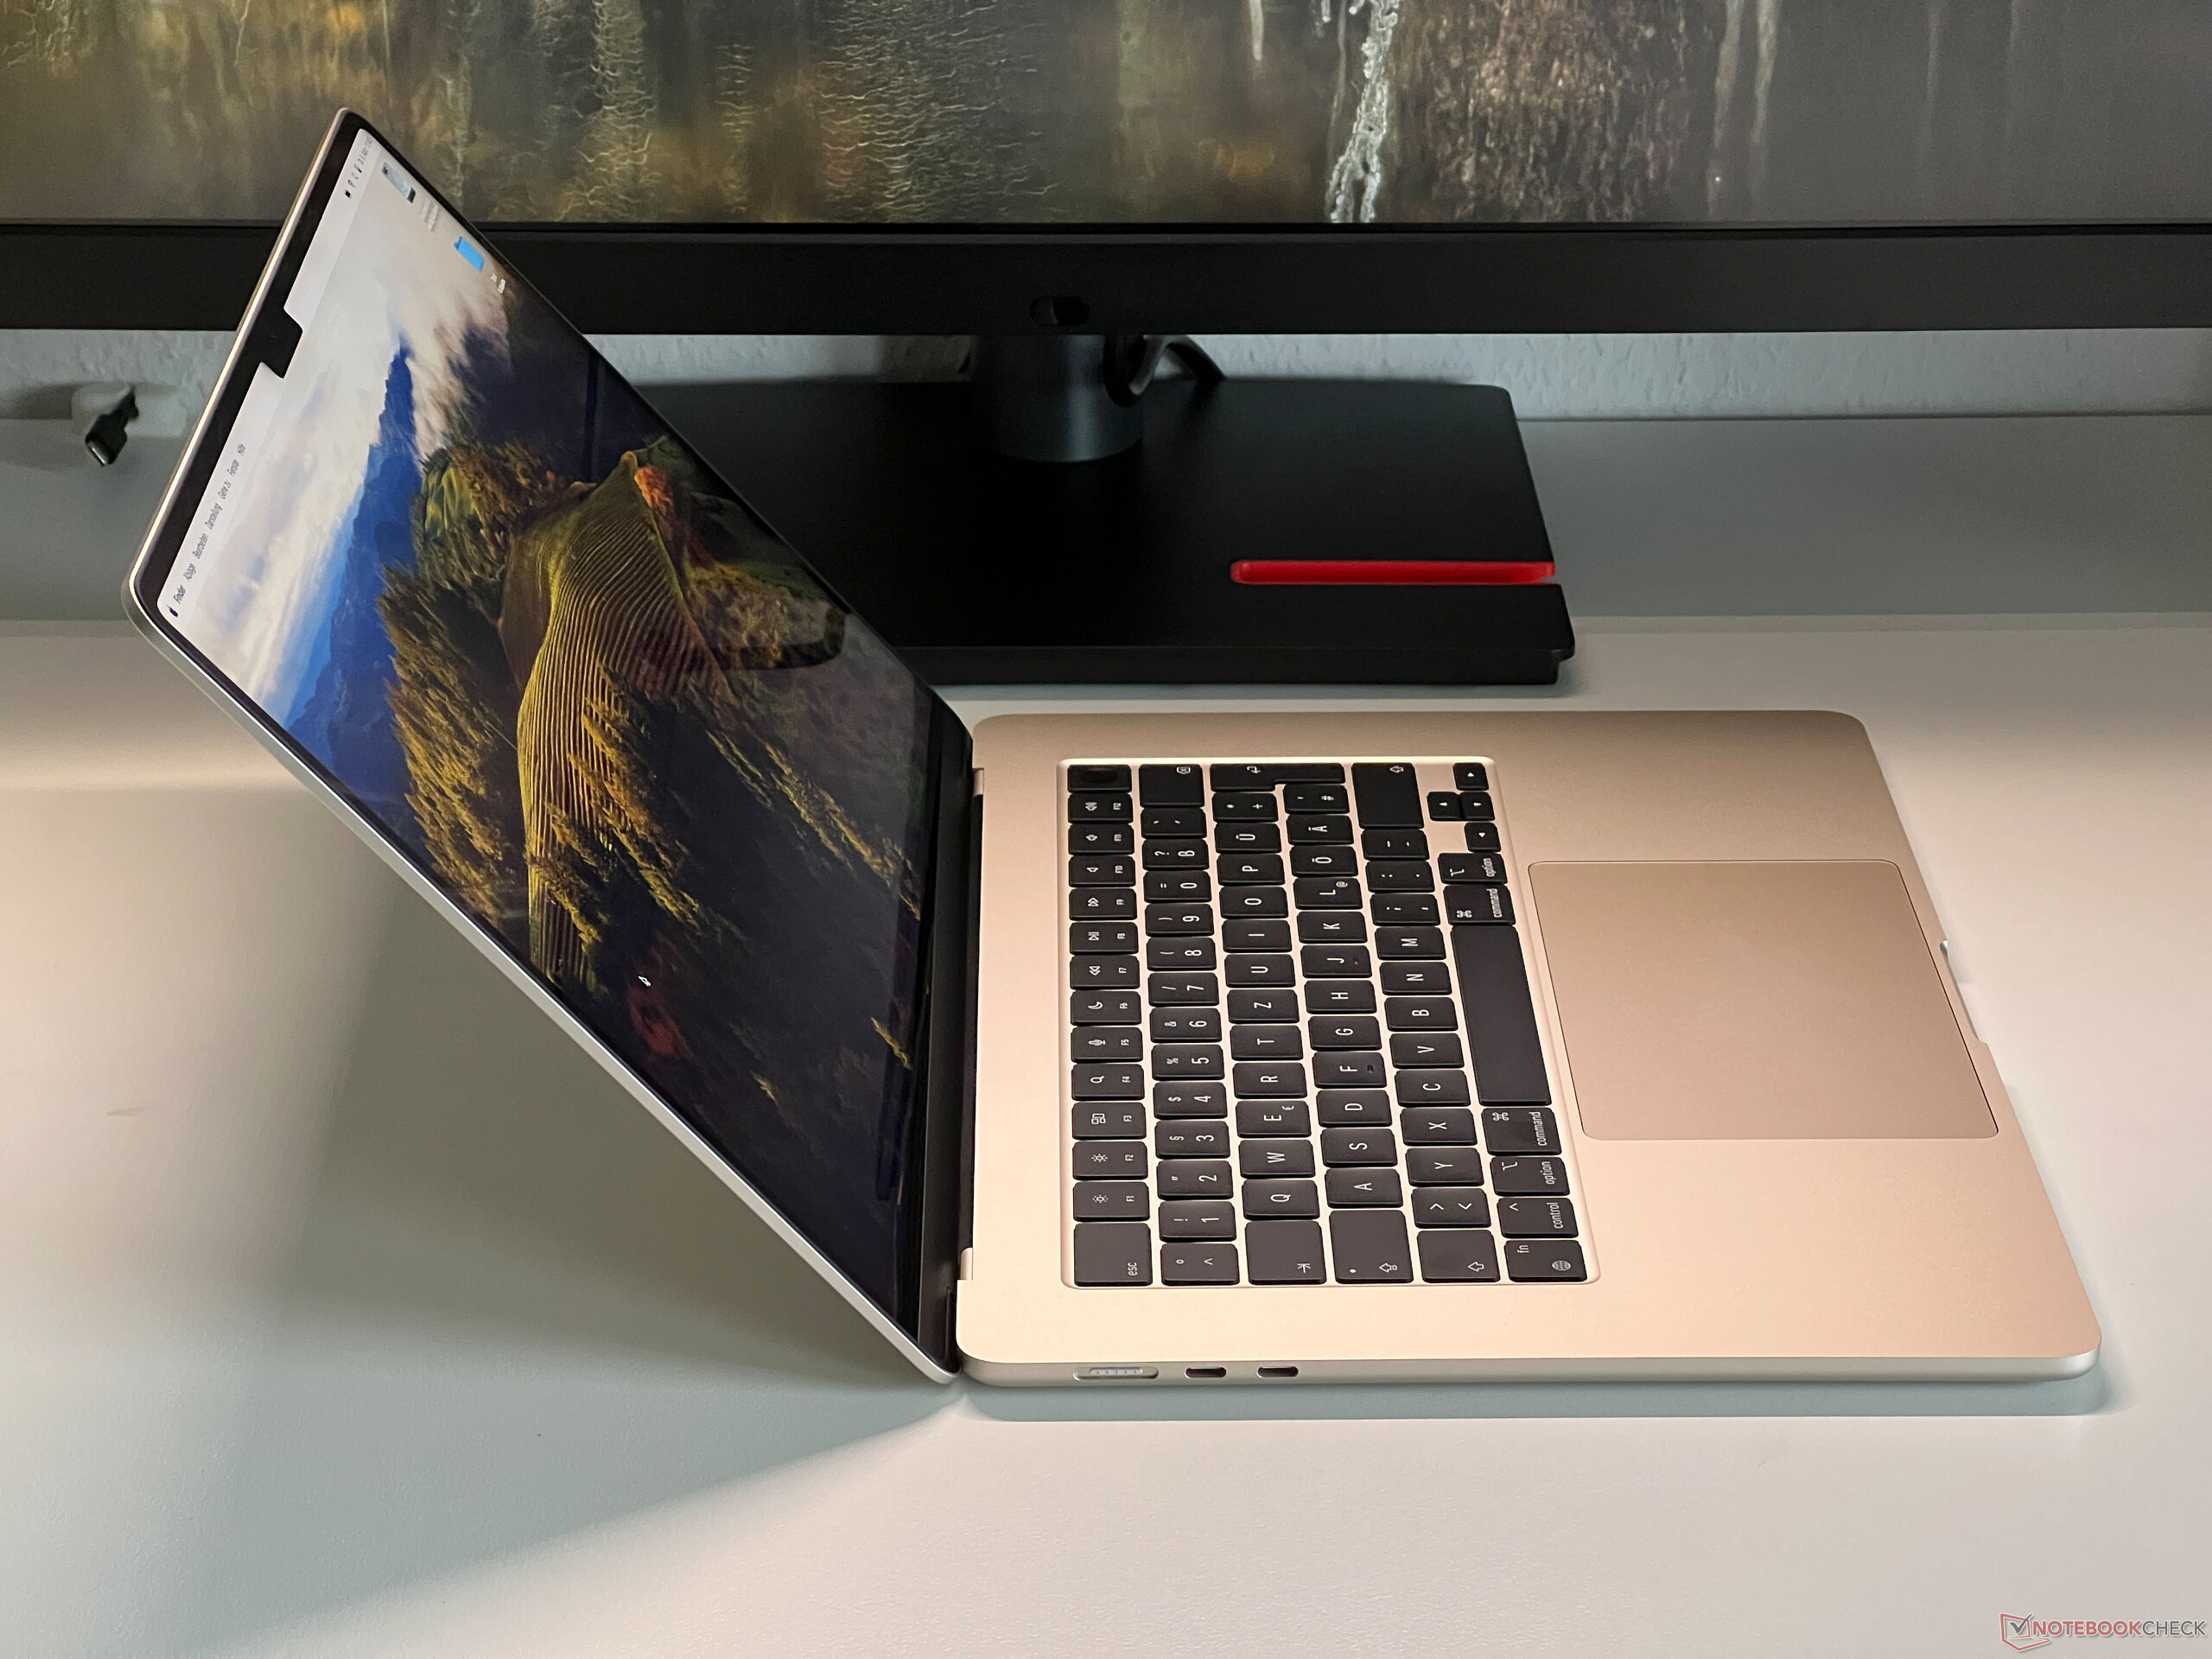
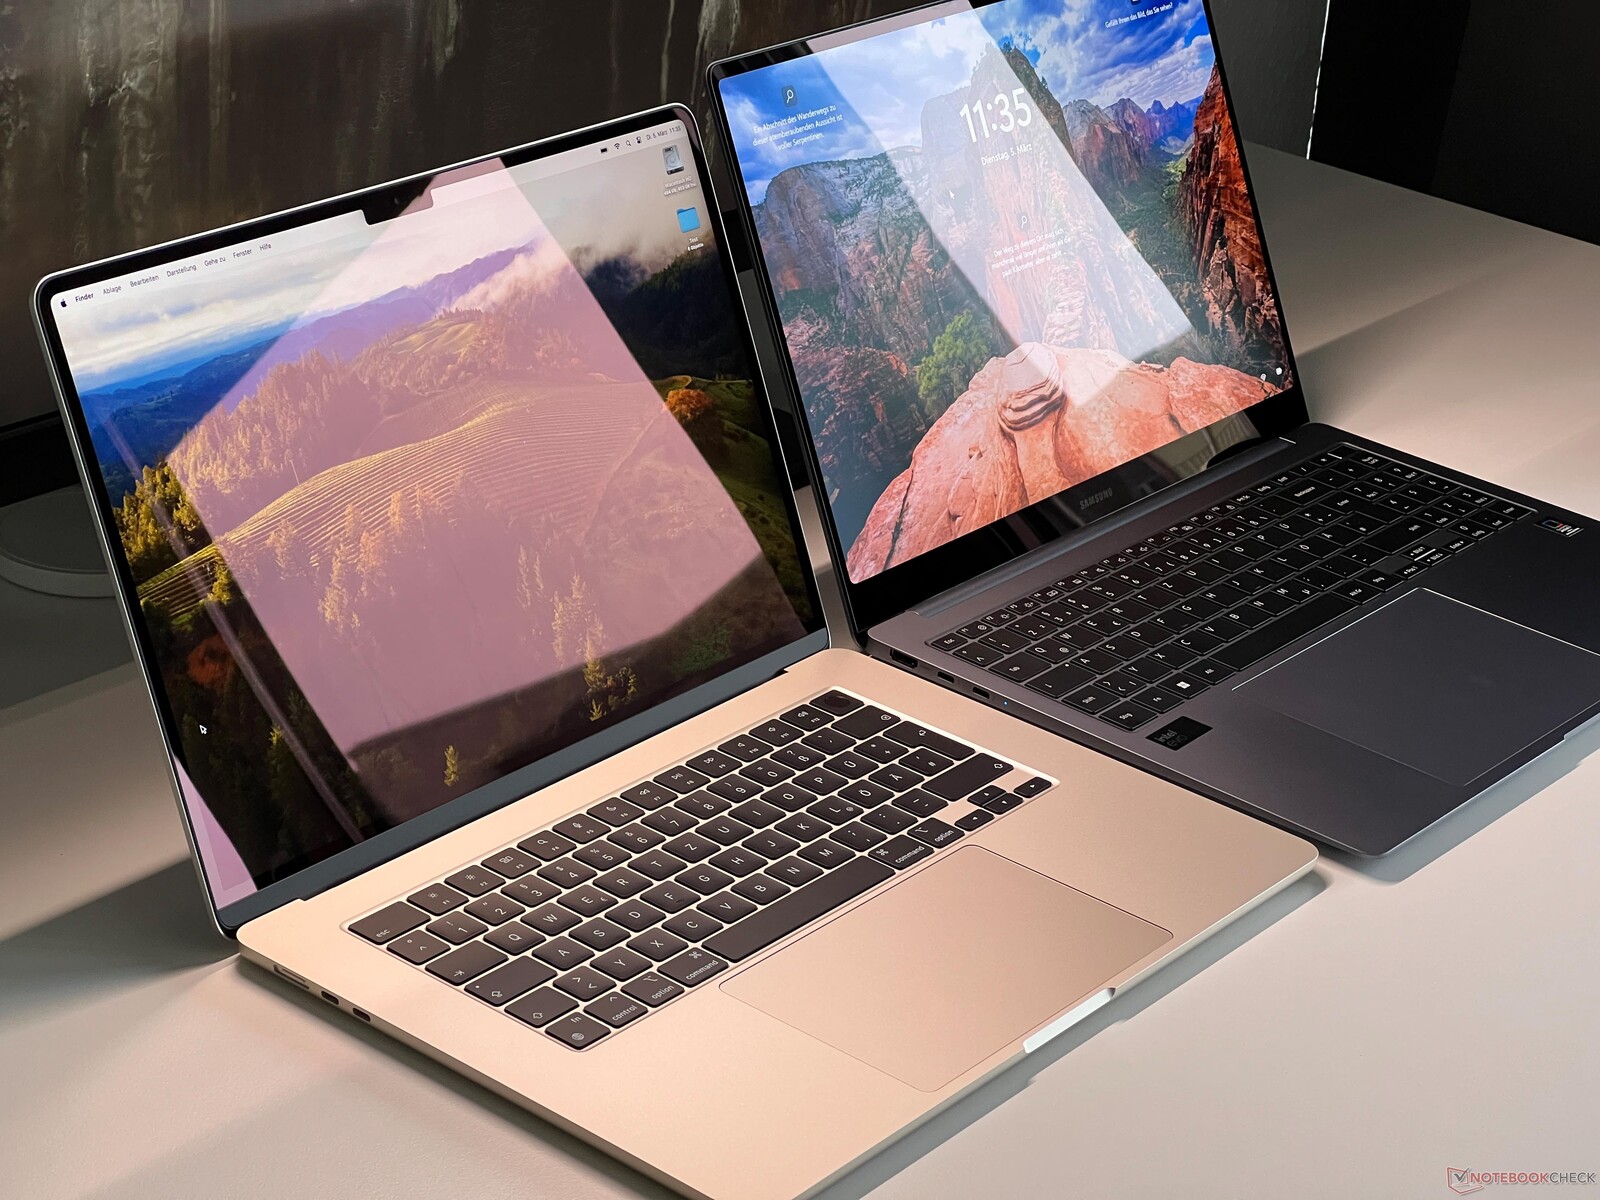
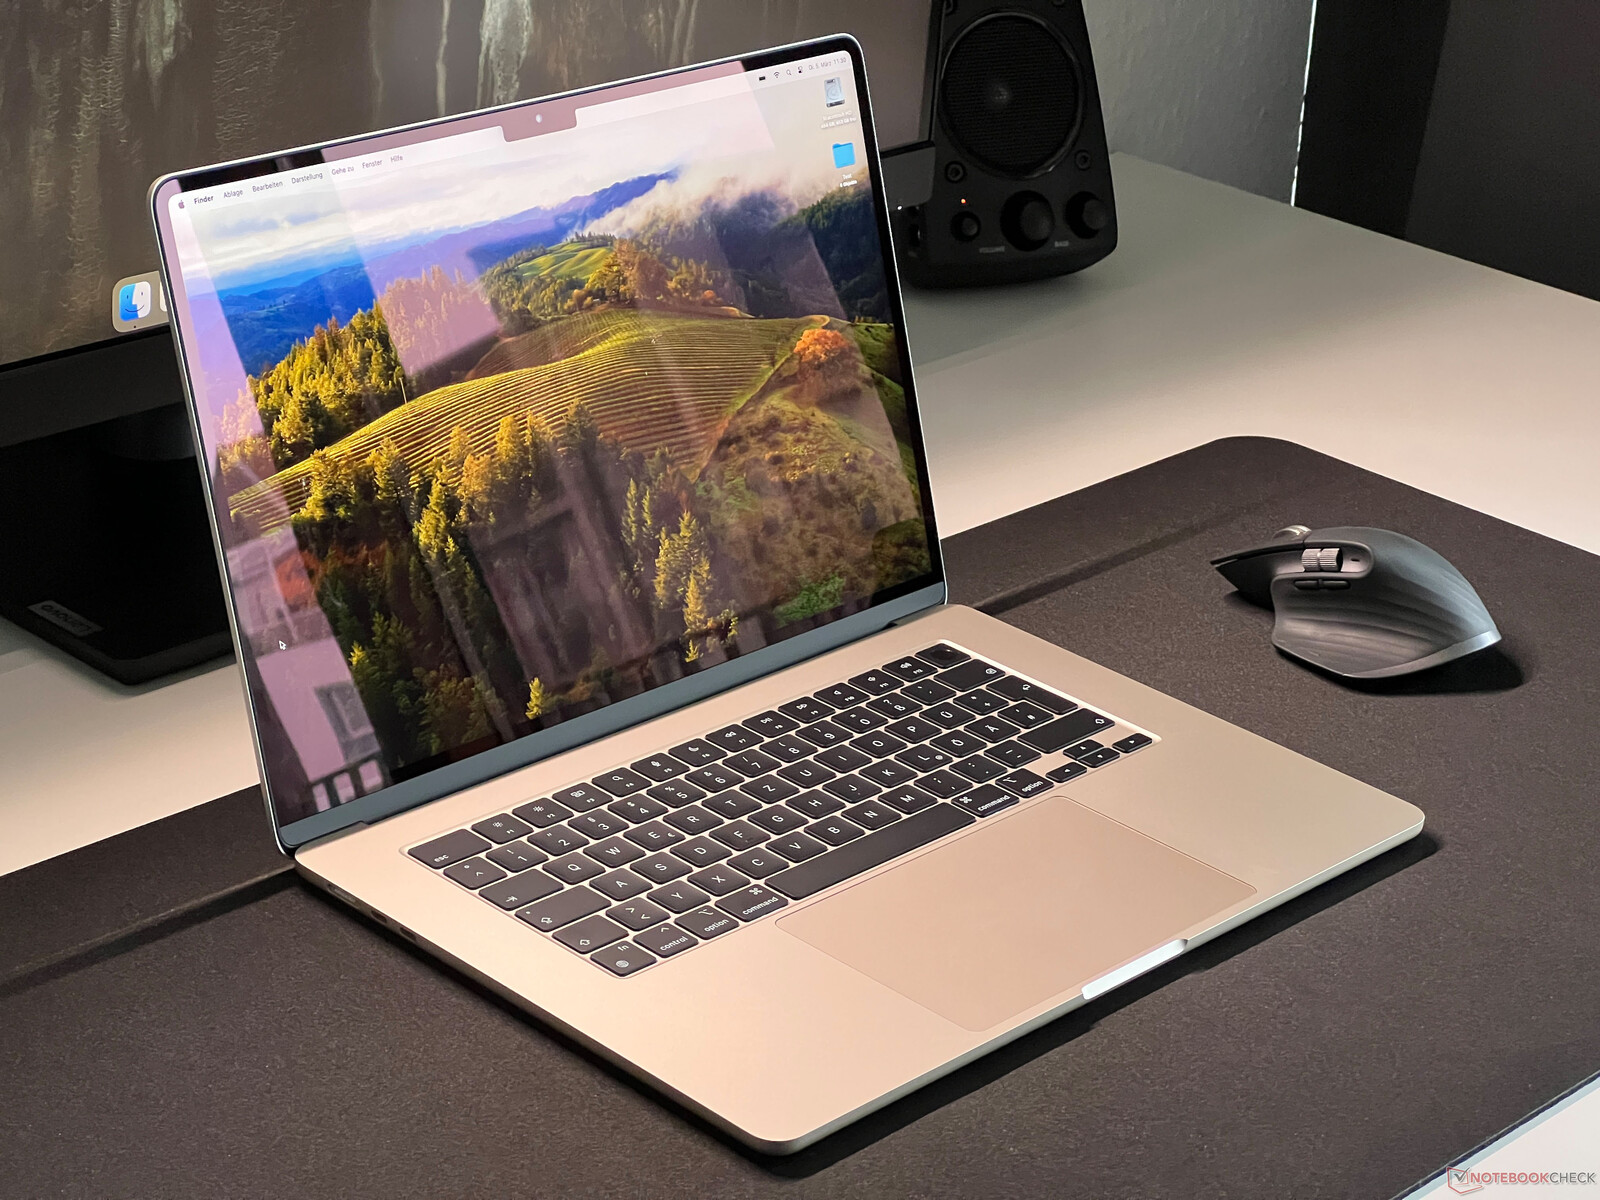
说到 MacBook Air 15 的设计和外壳质量,基本上没有什么变化。与前代产品一样,这款更大的 Air 比 MBA 13 更薄,这也是为什么该设备的重量(1.5 千克)在你第一次拿起它时会让你大吃一惊的原因。在实际使用中,由于底座太平,坚硬的前边缘不会给手腕带来不适。制造质量依然出色,稳定性也是如此。最大开启角度为 135 度。
Apple 在颜色方面,我们依然采用了我们熟悉的四种颜色(银色、太空灰、北极星和午夜)。深蓝色的 "午夜 "款在产品照片上看起来特别漂亮,但很快就暴露出它是一个指纹磁铁,很难保持表面清洁。新的 M3 机型(午夜版)采用了与黑色 MacBook Pro 14/16 相同的阳极氧化涂层。这有助于减少指纹问题,这也是我们在新款 MacBook Air 13.不过,我们的极地之星评测样机等轻薄版本在这方面更具优势。
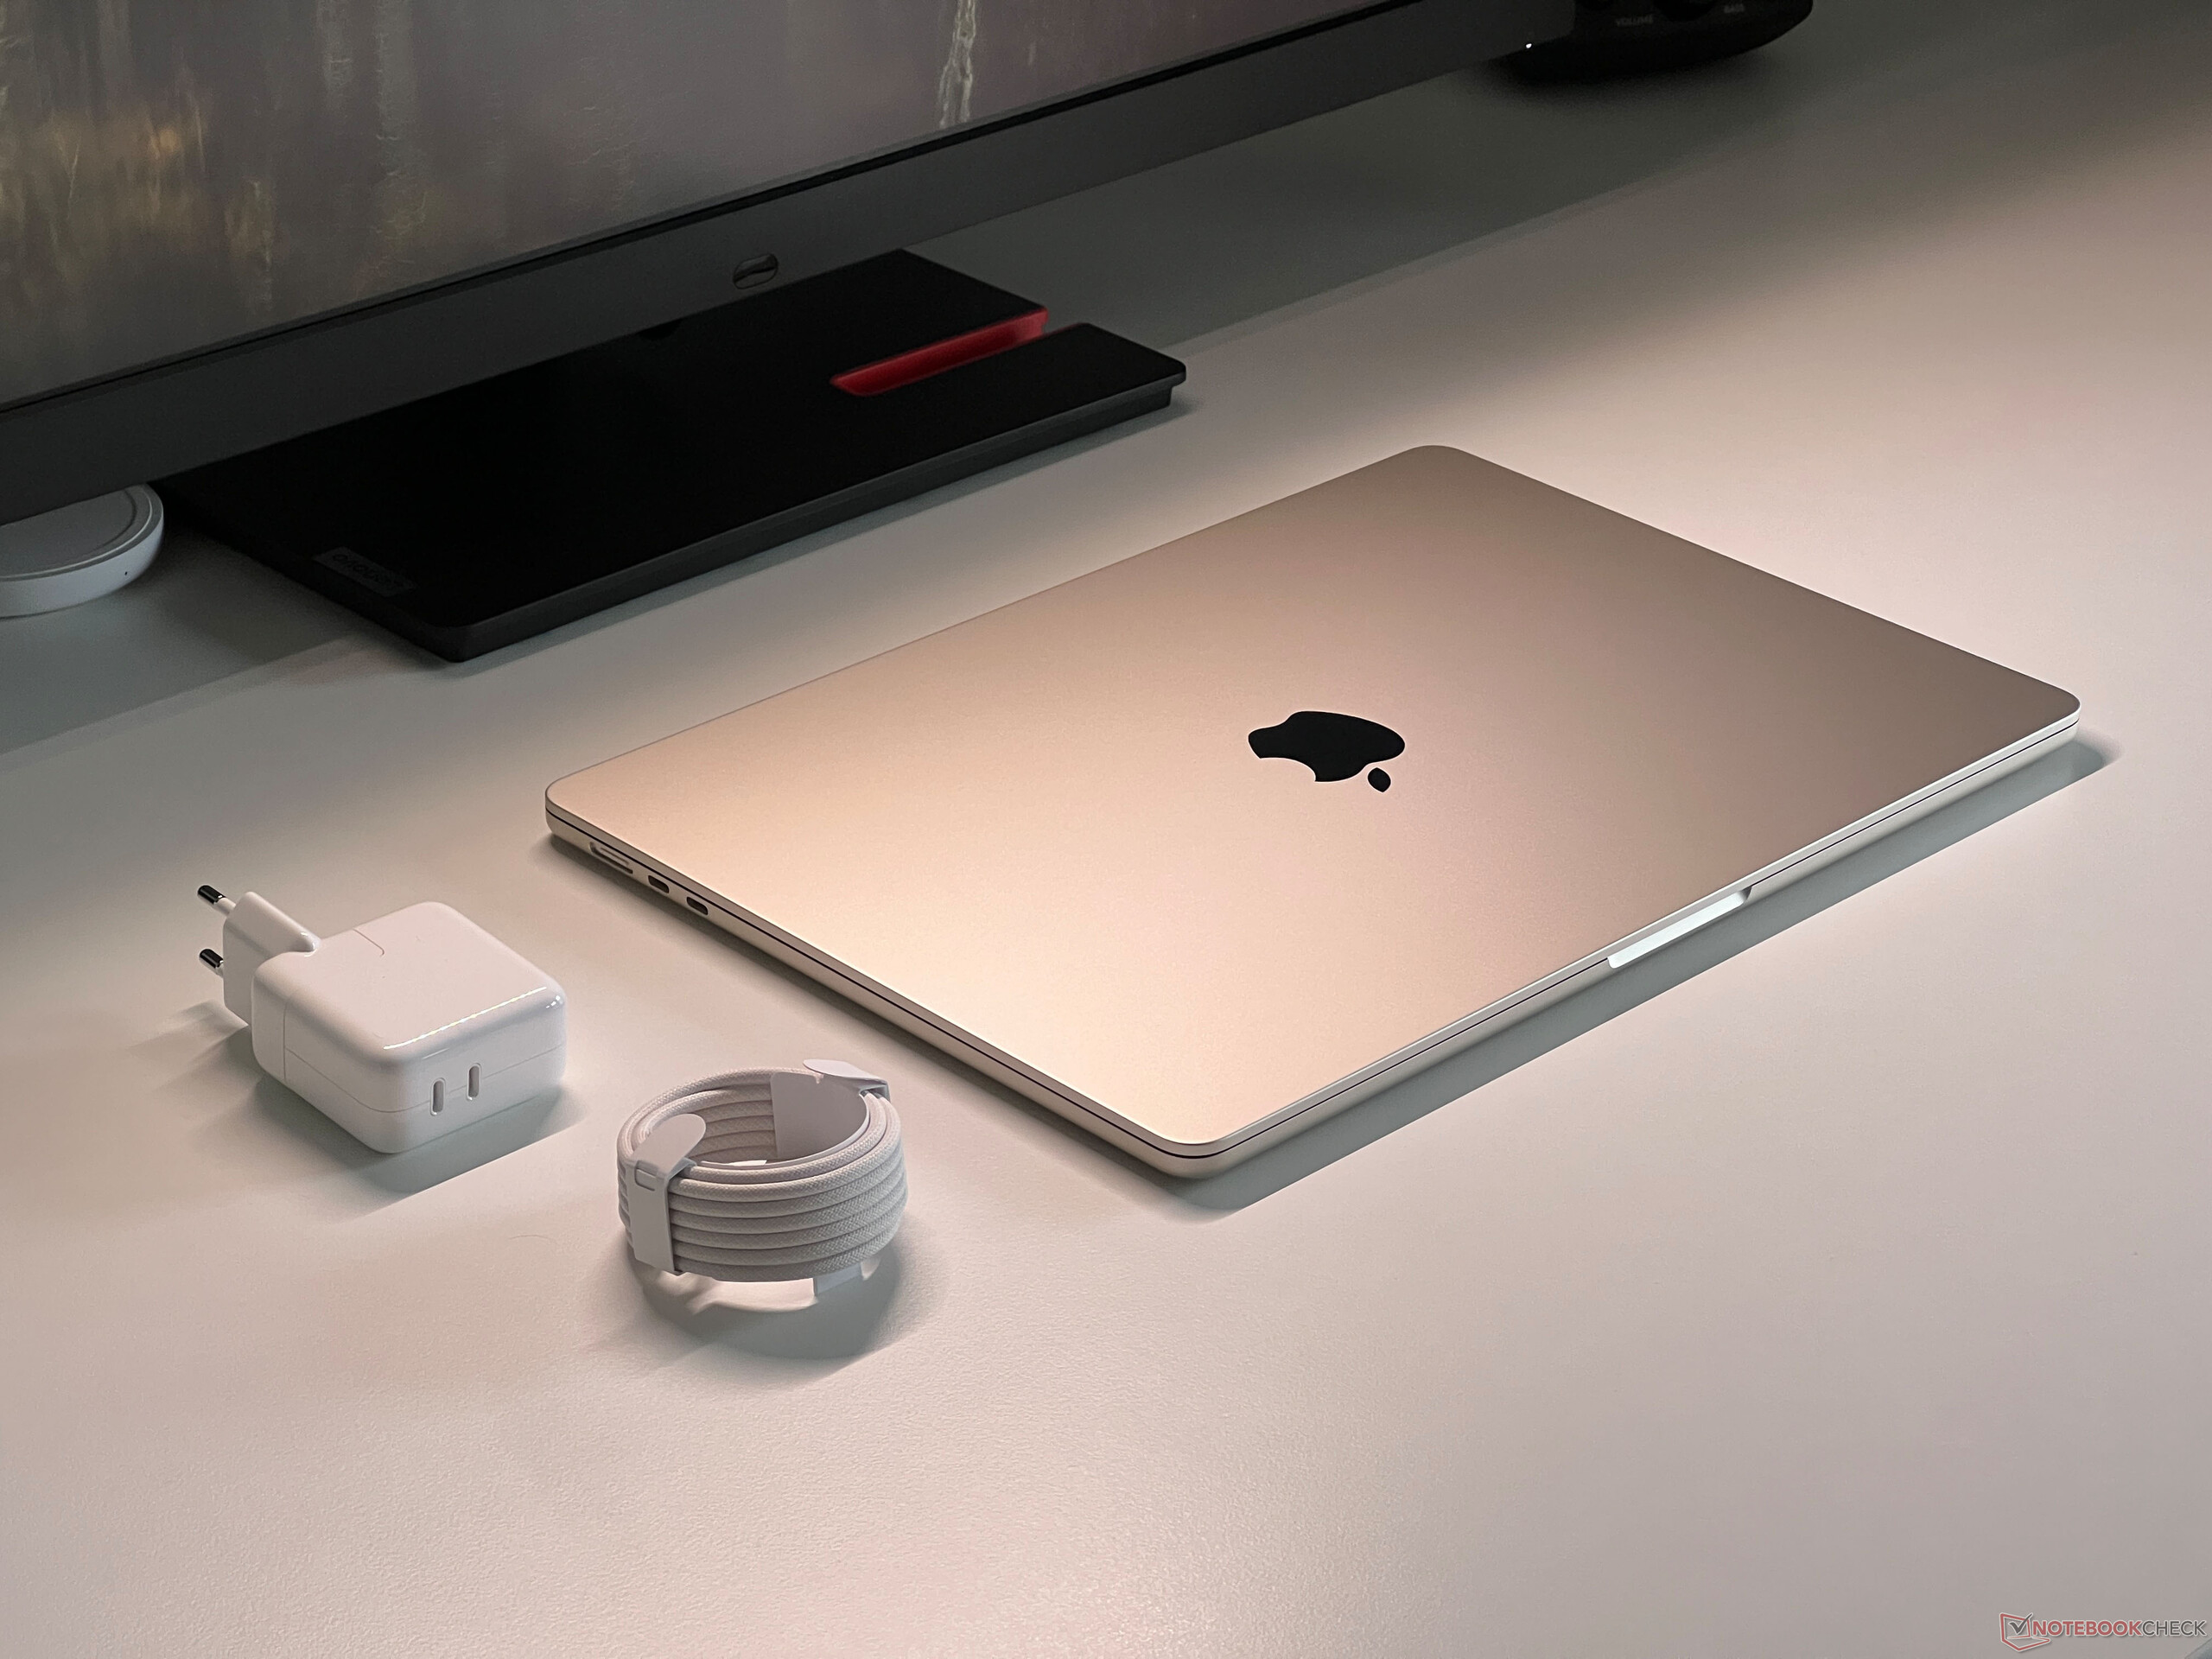
Air 15 的重量仅为 1.5 千克,仅次于 LG Gram(990克),但Apple 的笔记本电脑在一定程度上是最薄的设备。35 瓦的电源适配器又带来了 184 克的重量。
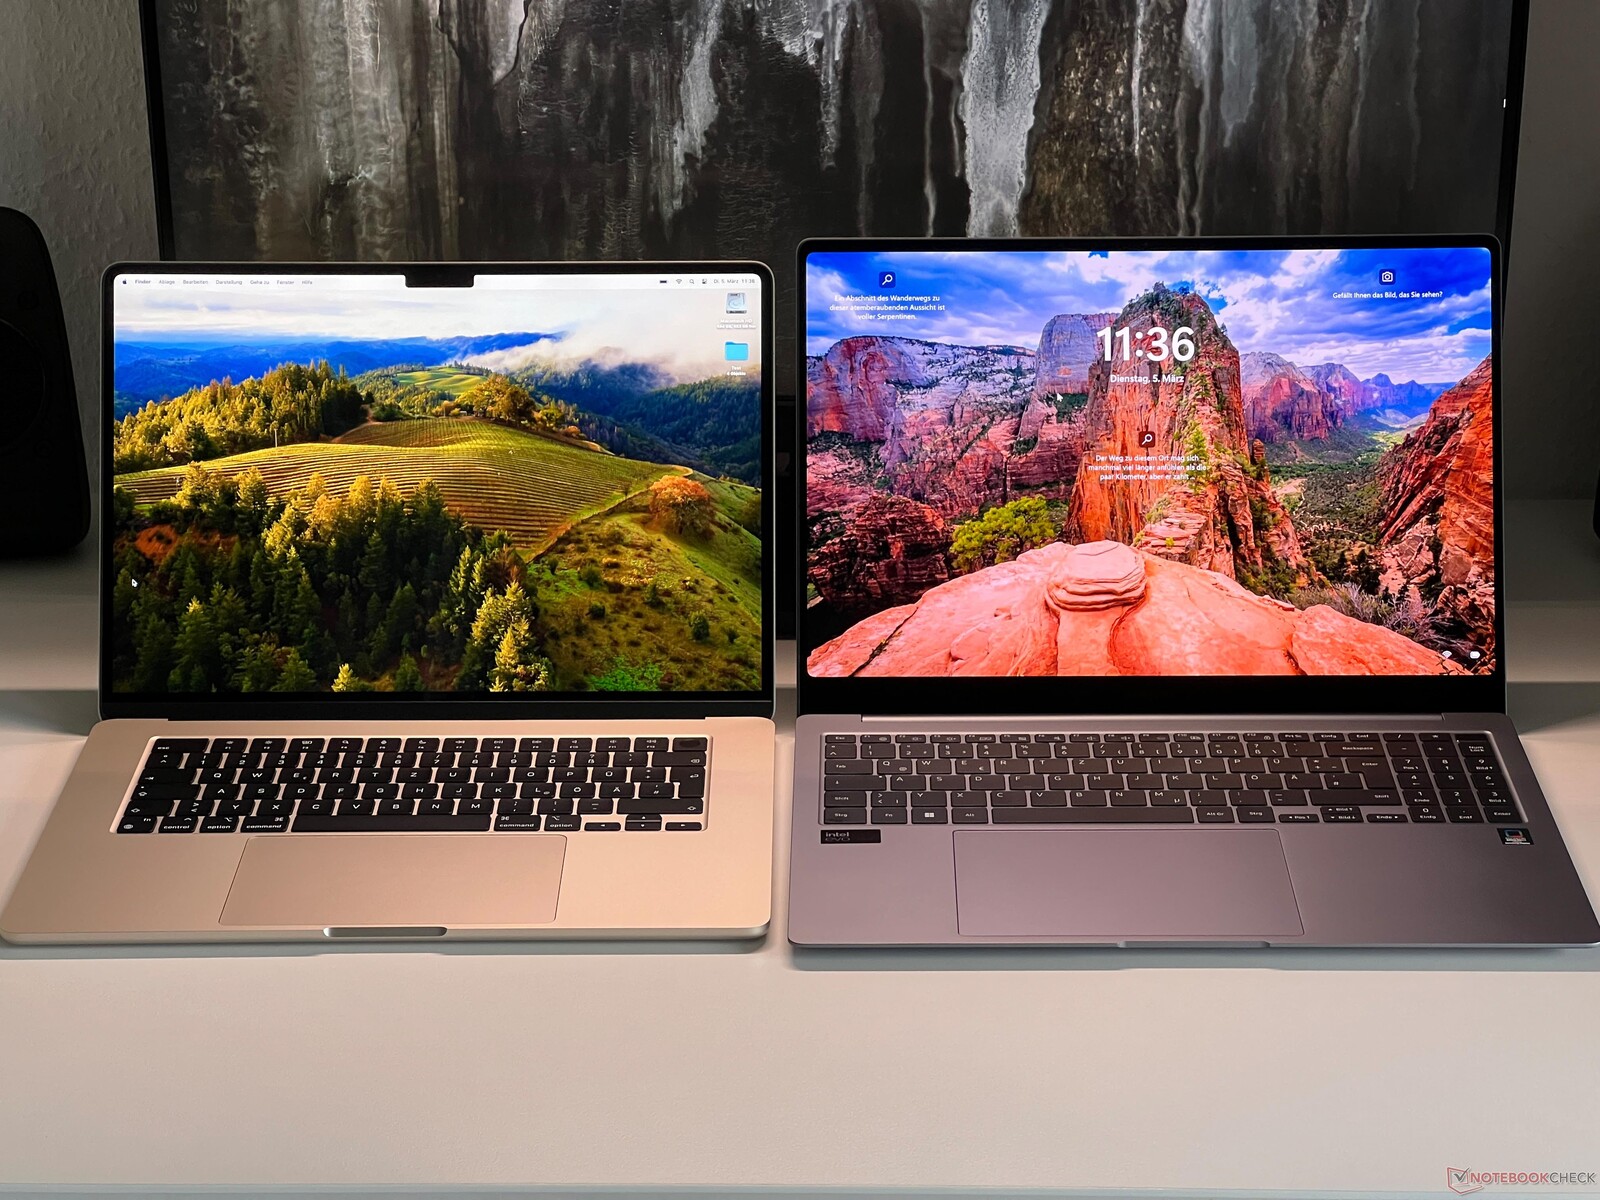
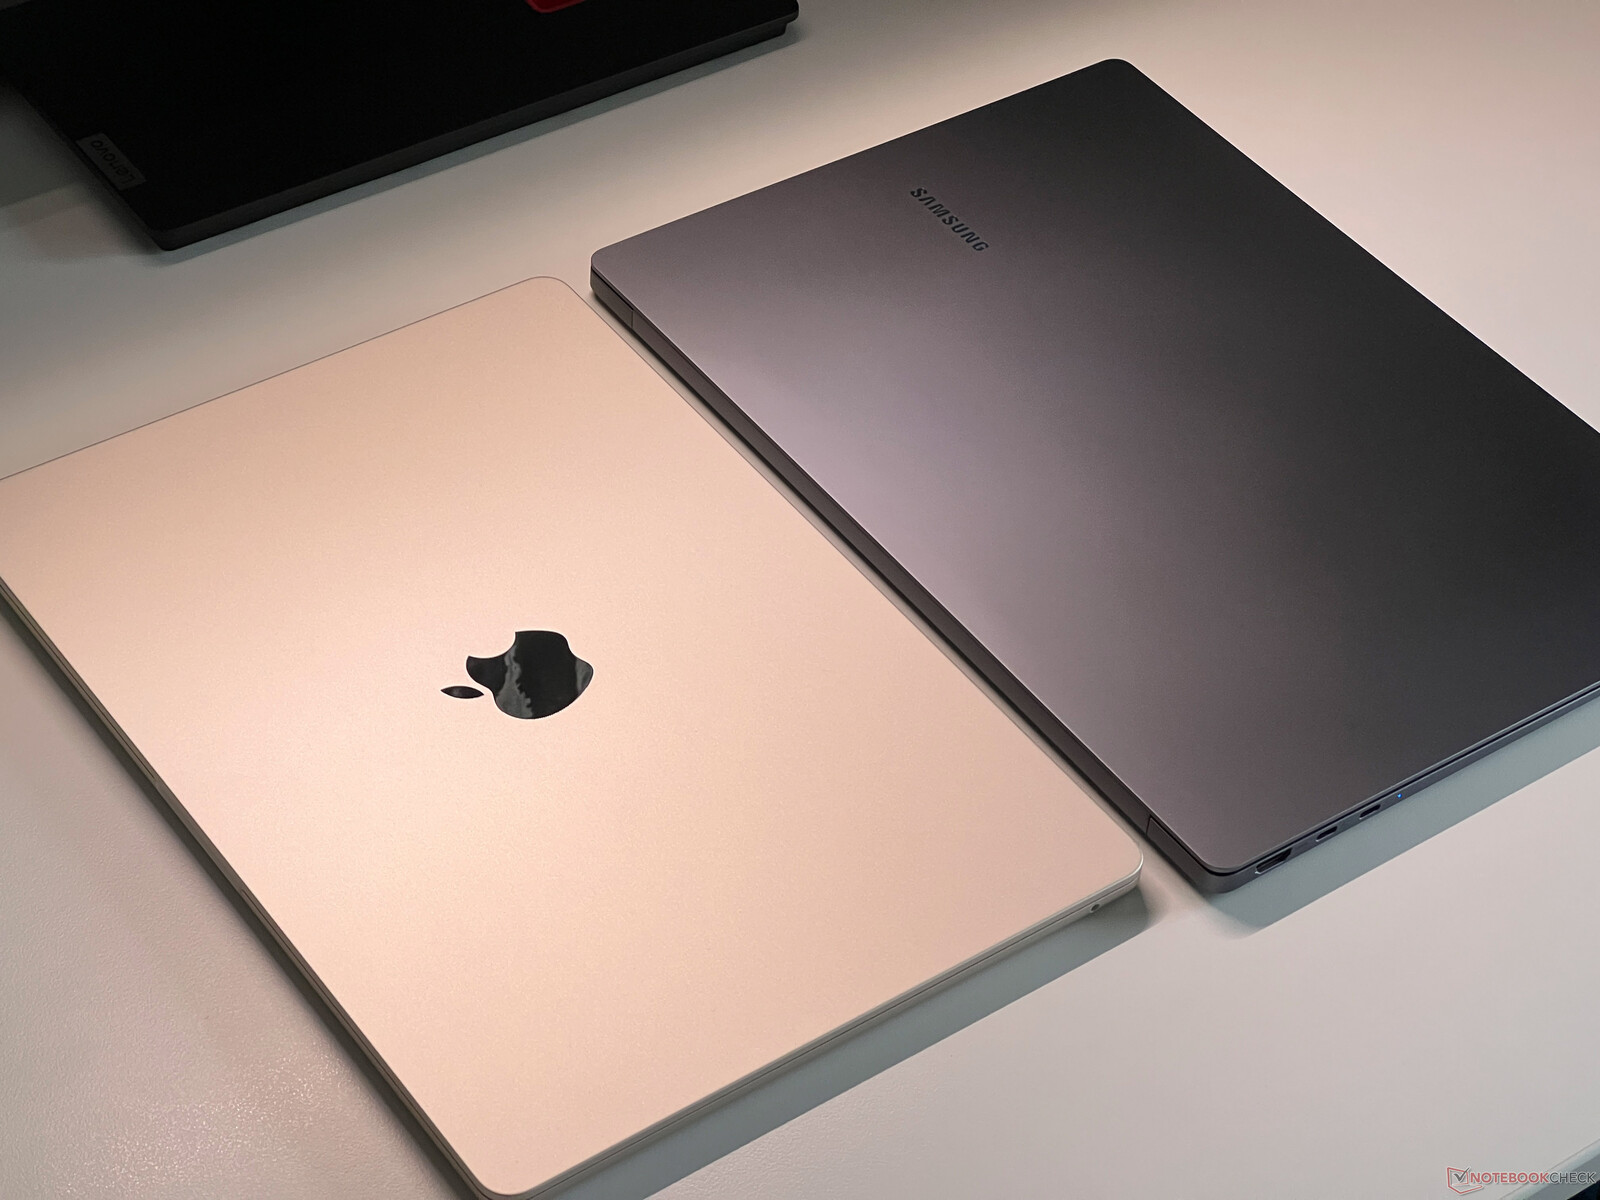
我们又拍摄了一些新款三星Galaxy Book4 Pro 16 的对比照片(我们的评测将很快发布),它是目前 M3 MacBook Air 15 的竞争对手之一。Galaxy Book4 的 16 英寸 OLED 屏幕稍大一些,但直接对比不难发现,由于屏幕底部边框较厚,浪费了大量空间。这也使三星笔记本电脑的机身明显更深;此外,它的底座也比Apple 的要厚得多。
功能 - 现在您可以控制两个显示屏
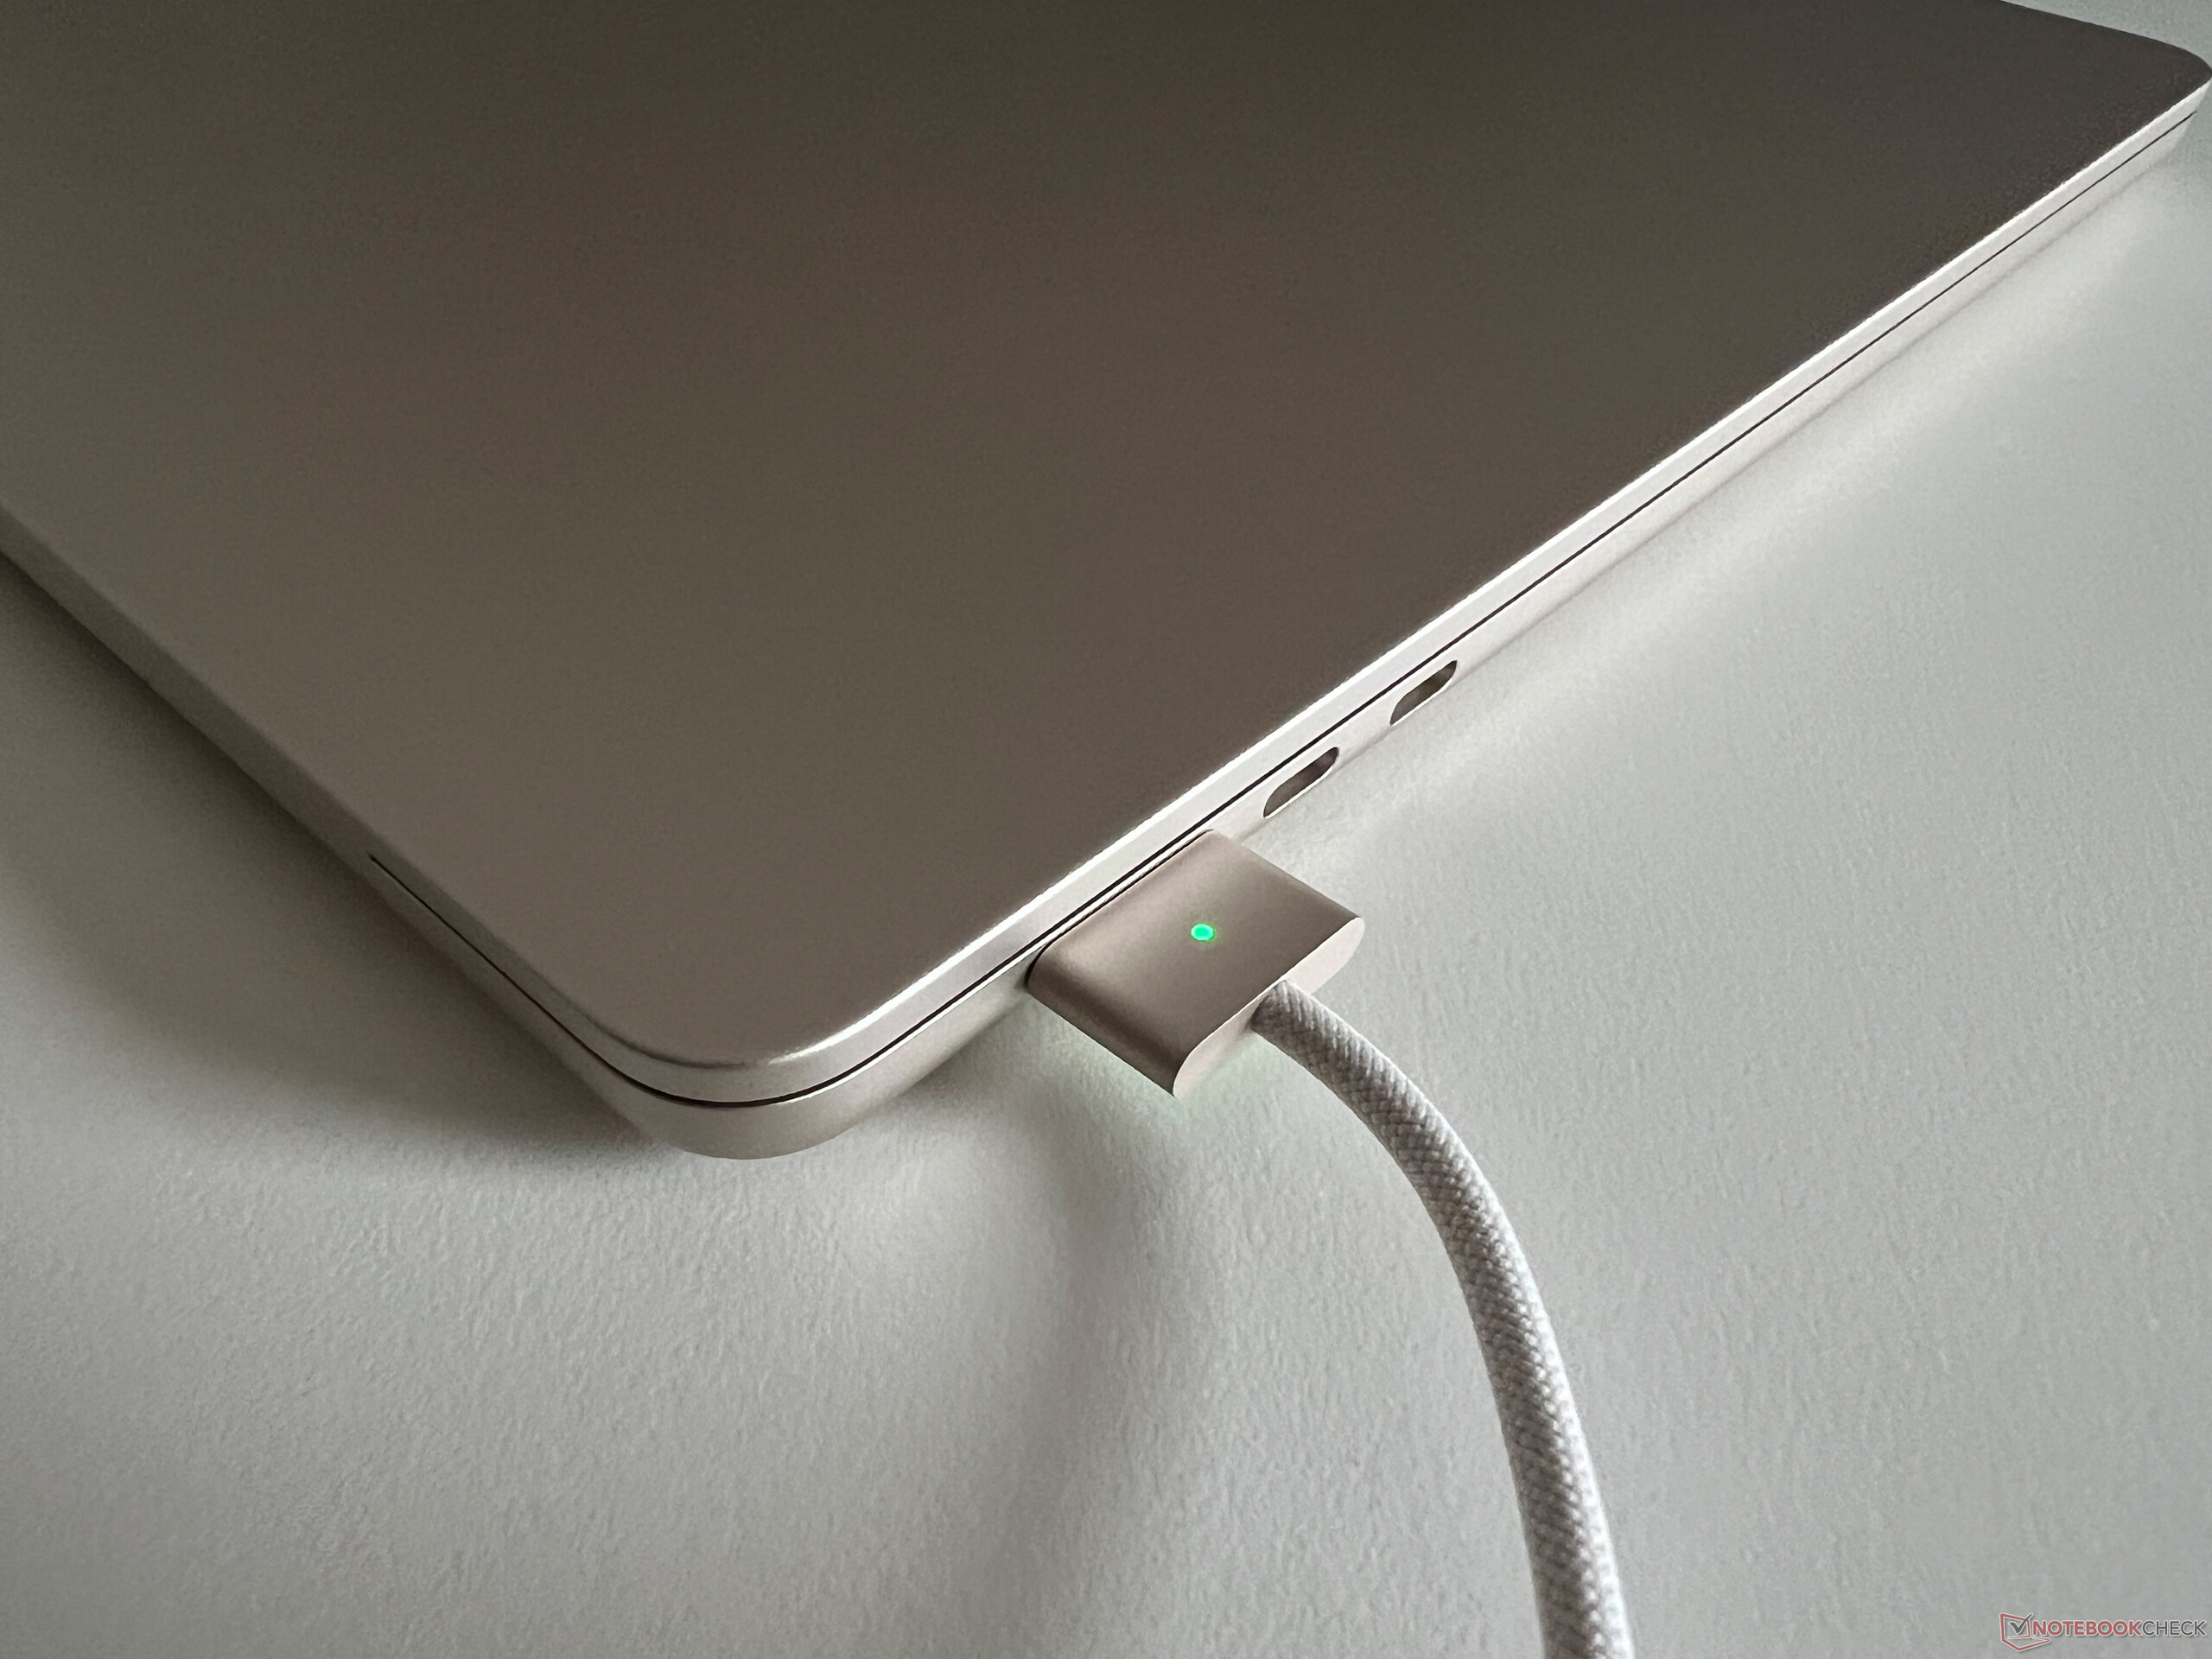
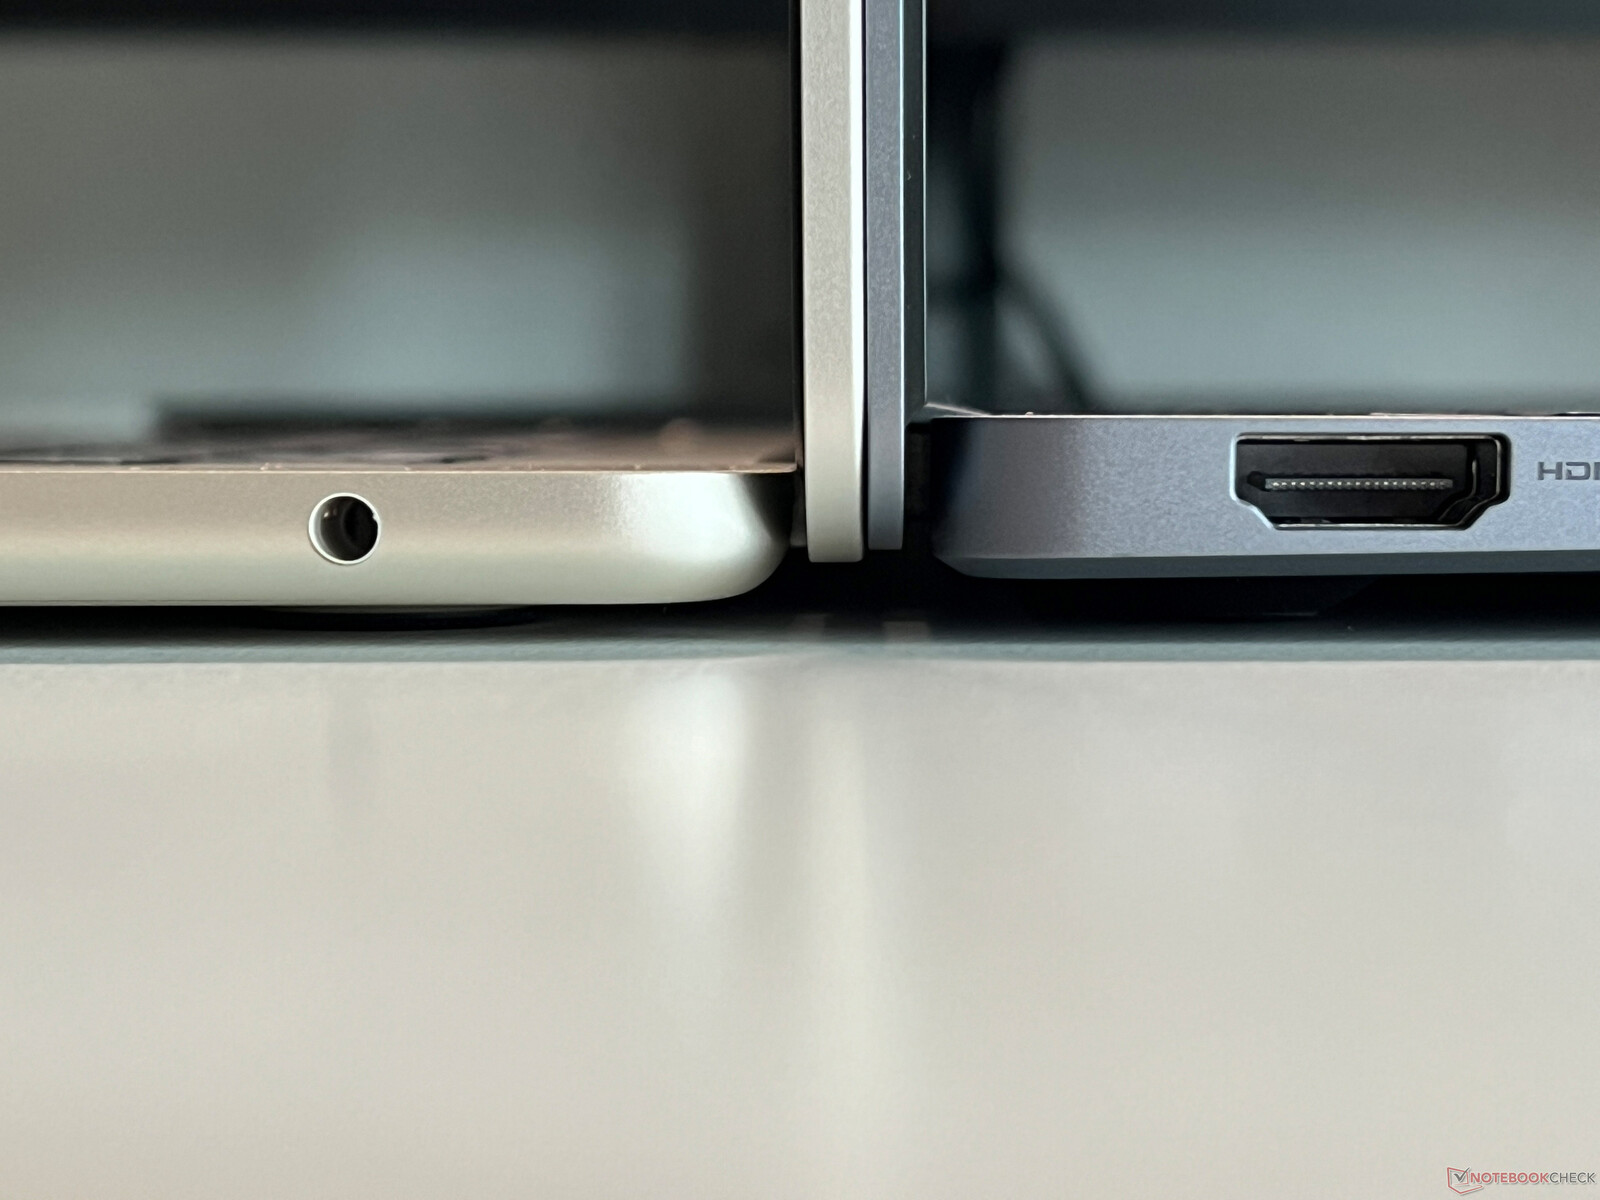
端口方面没有变化。除了电源适配器的 MagSafe 接口外,左侧仍有两个 USB-C 端口(4.0),仍然只支持 Thunderbolt 3。右侧只有 3.5 毫米音频接口,我们希望能看到另一个 USB 端口。15 英寸机型的闲置空间更为明显。
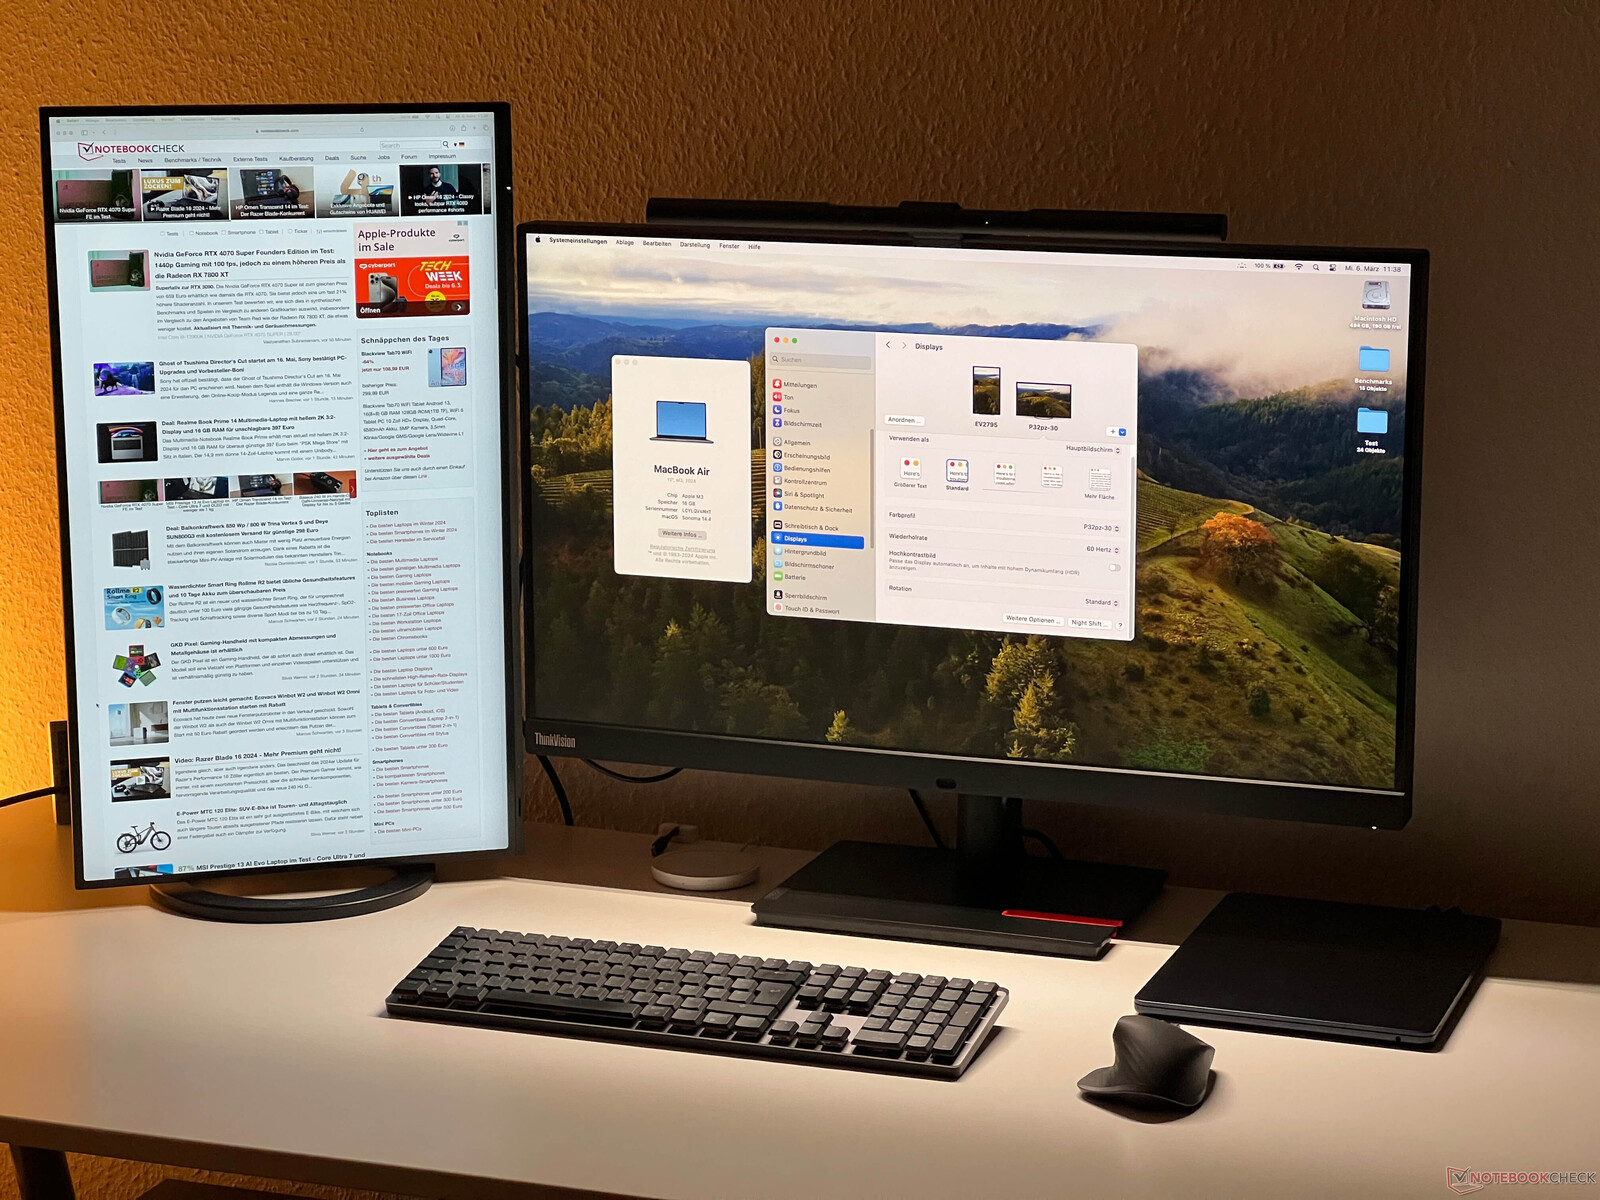
不过,有一项新功能。到目前为止 MacBook Air 15 M2除了内置面板外,只能控制一个外接显示器。M3 SoC 的硬件要求相同,这意味着它只能控制两台显示器,但当显示器盖子关闭时,现在可以使用两台外接显示器(1 台最高 6K/60 Hz,1 台最高 5K/60 Hz)。当然,这还不够完美,但绝对是一个进步,如果你想使用两台显示器,它可以让你的使用体验完全不同。
我们用 MBA 13 和两台外接显示器(一台通过 USB-C,一台通过 USB-C/HDMI 适配器)试用了这项新功能,效果非常好。我们使用 MacBook Pro 14 M3也将在未来某个时候通过软件更新获得这一功能。
交流
Apple 更新了 Wi-Fi 模块,现在它支持频率为 160 MHz 的 Wi-Fi 6E 和蓝牙 5.3。与我们的华硕参考路由器搭配使用,效果立竿见影,因为新款 MacBook Air M3 现在的速度是前代产品的两倍。 速度的两倍与更大的 MacBook Pro 机型不相上下。
| Networking | |
| Apple MacBook Air 15 M3 | |
| iperf3 transmit AXE11000 | |
| iperf3 receive AXE11000 | |
| Asus VivoBook S15 K5504 | |
| iperf3 transmit AXE11000 | |
| iperf3 receive AXE11000 | |
| iperf3 transmit AXE11000 6GHz | |
| iperf3 receive AXE11000 6GHz | |
| MSI Prestige 16 B1MG-001US | |
| iperf3 transmit AXE11000 | |
| iperf3 receive AXE11000 | |
| iperf3 transmit AXE11000 6GHz | |
| iperf3 receive AXE11000 6GHz | |
| Acer Swift Go SFG16-71 | |
| iperf3 transmit AXE11000 | |
| iperf3 receive AXE11000 | |
| iperf3 transmit AXE11000 6GHz | |
| iperf3 receive AXE11000 6GHz | |
| Huawei MateBook 16s i9 | |
| iperf3 transmit AXE11000 | |
| iperf3 receive AXE11000 | |
| iperf3 transmit AXE11000 6GHz | |
| iperf3 receive AXE11000 6GHz | |
| LG Gram SuperSlim (2023) | |
| iperf3 transmit AXE11000 | |
| iperf3 receive AXE11000 | |
| iperf3 transmit AXE11000 6GHz | |
| iperf3 receive AXE11000 6GHz | |
| Samsung Galaxy Book3 15, Core i5-1335U | |
| iperf3 transmit AXE11000 | |
| iperf3 receive AXE11000 | |
网络摄像头
在光线充足的情况下,1080p 网络摄像头仍能拍摄出不错的照片,麦克风也没有任何问题。您还可以选择将 iPhone 用作网络摄像头。


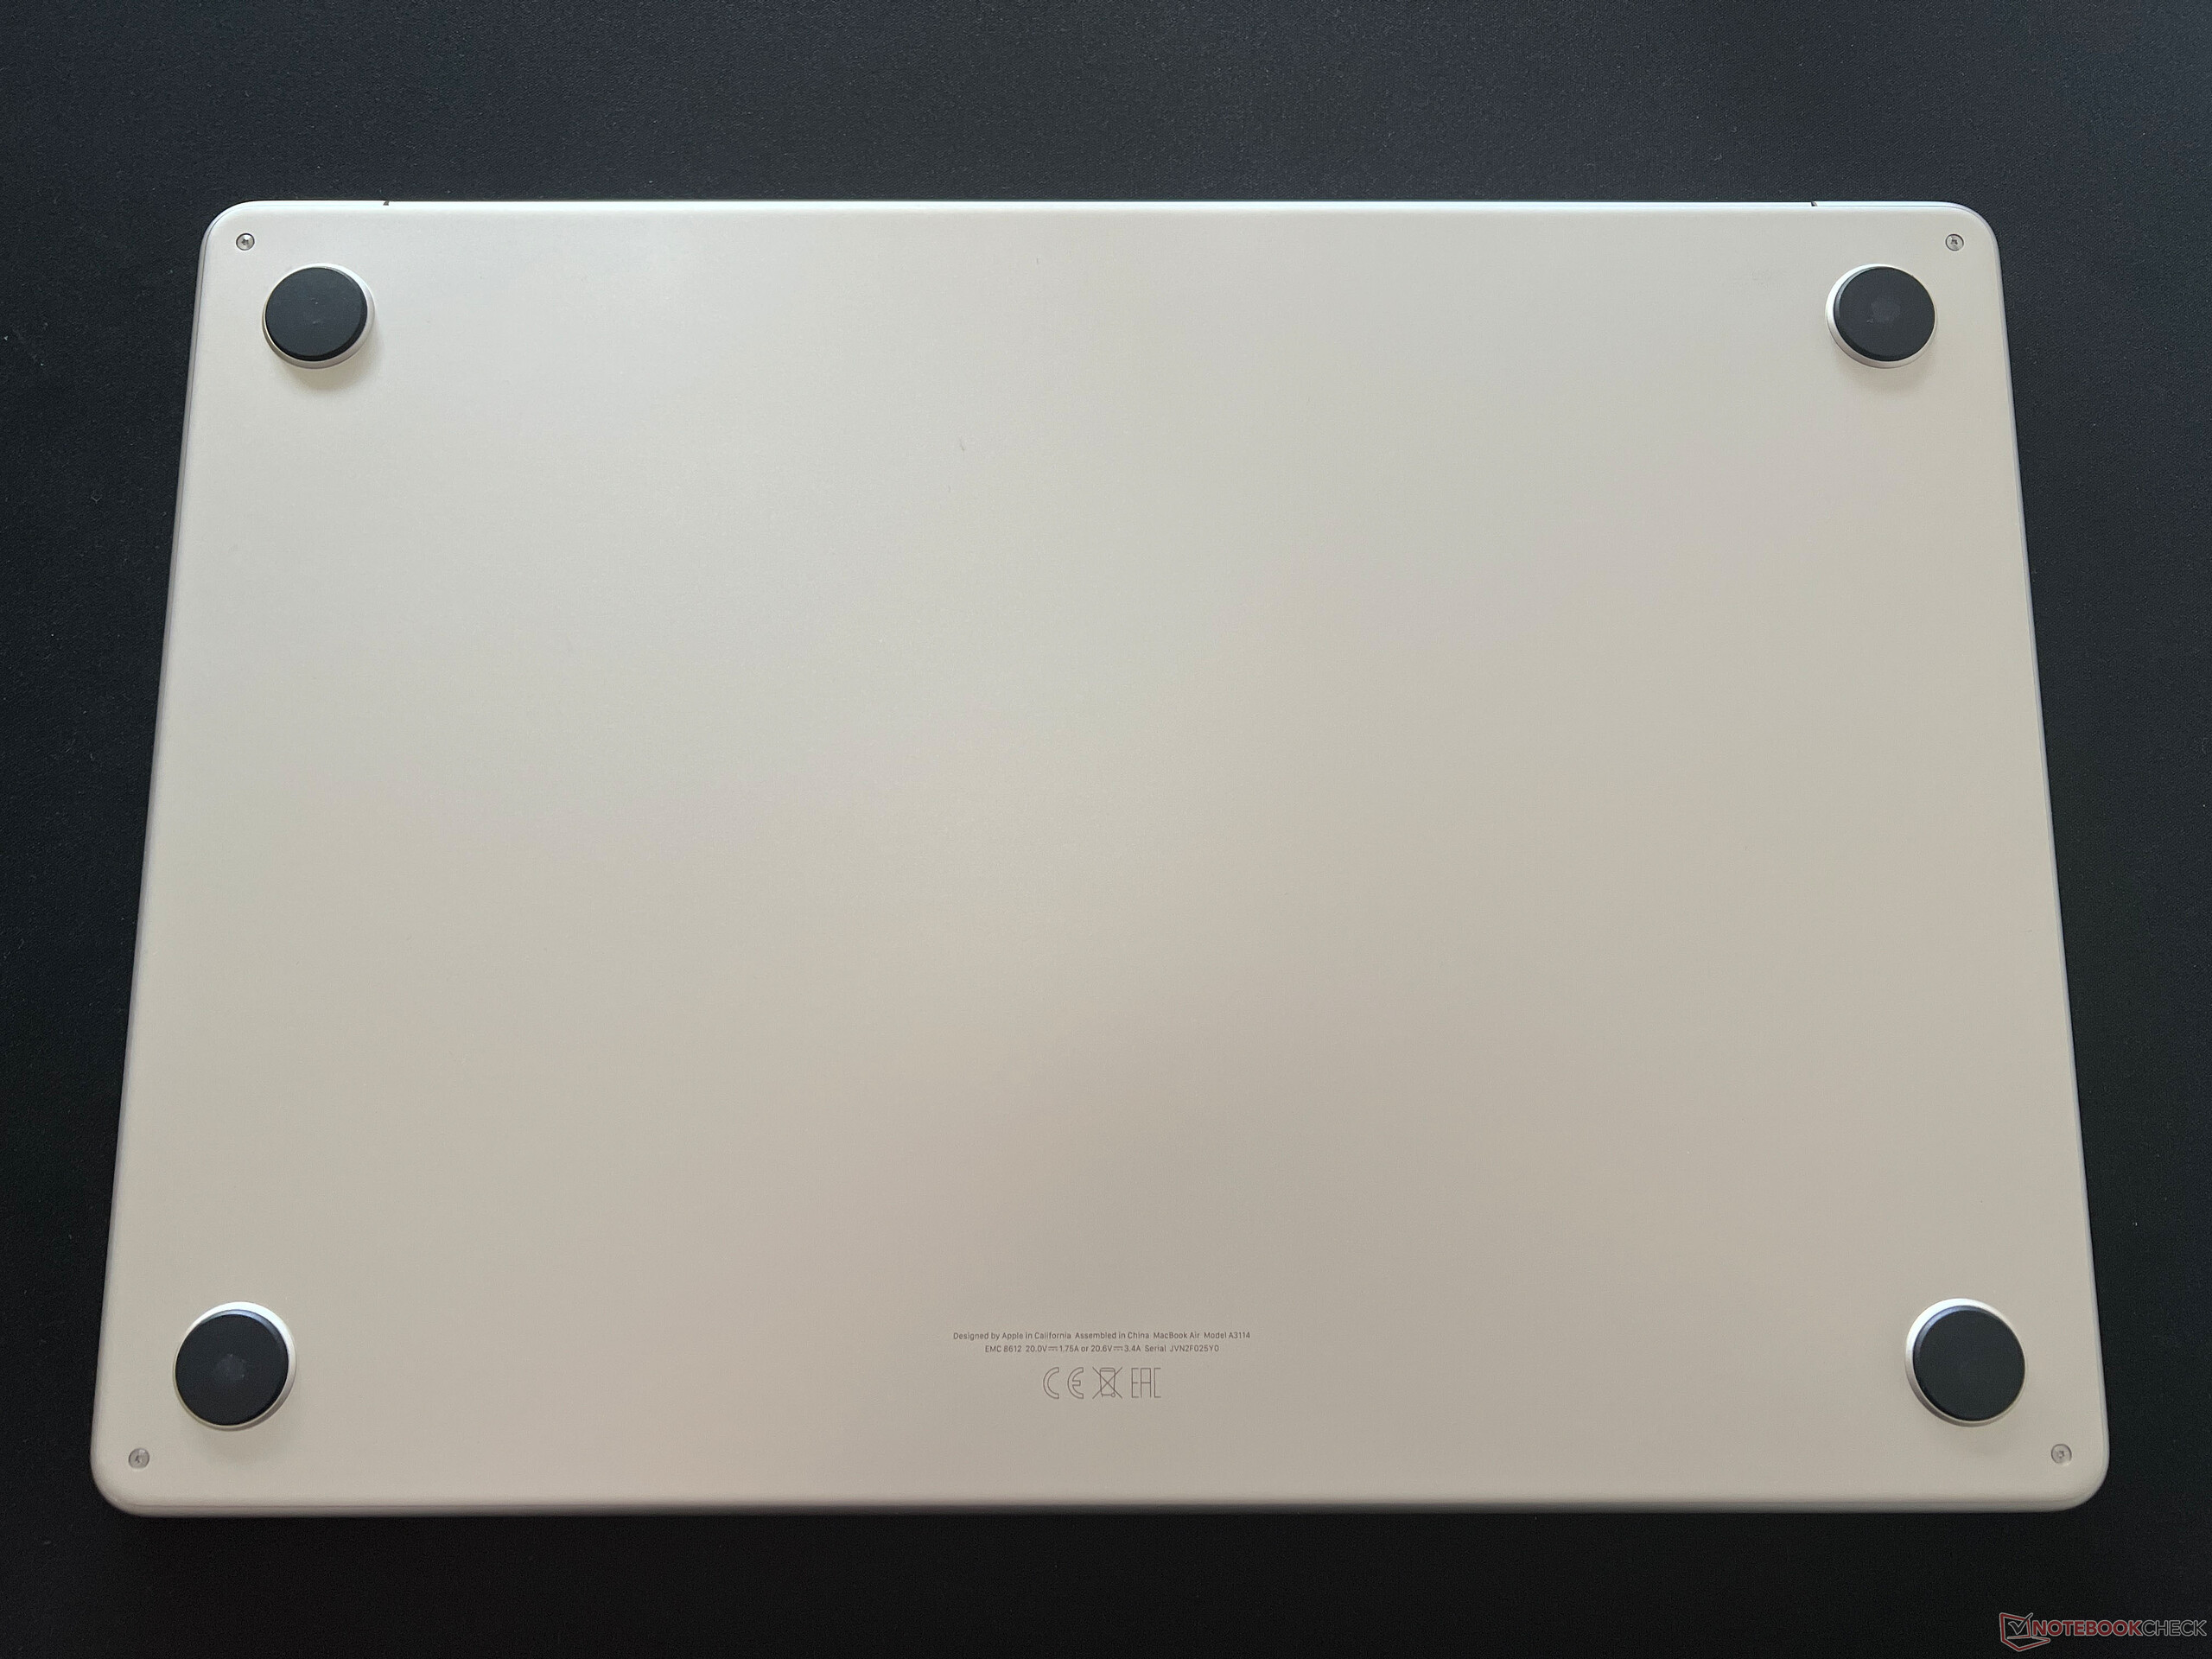
维护
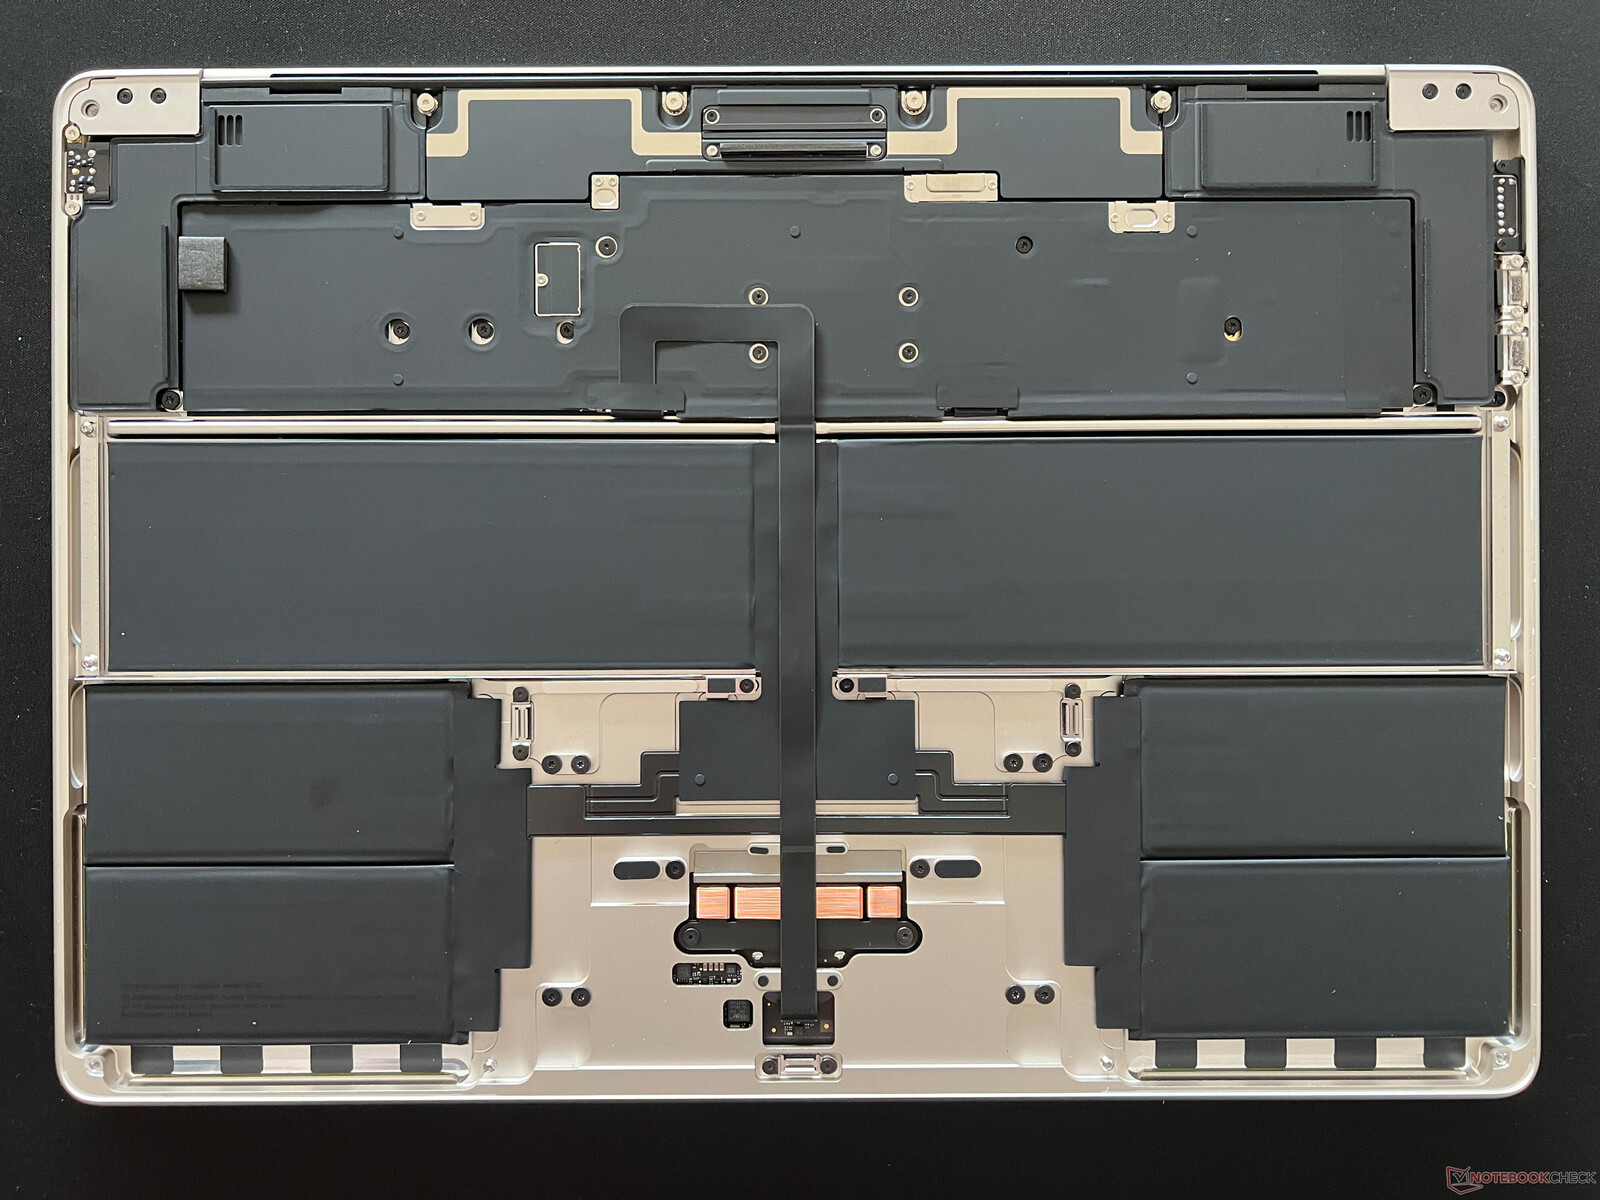
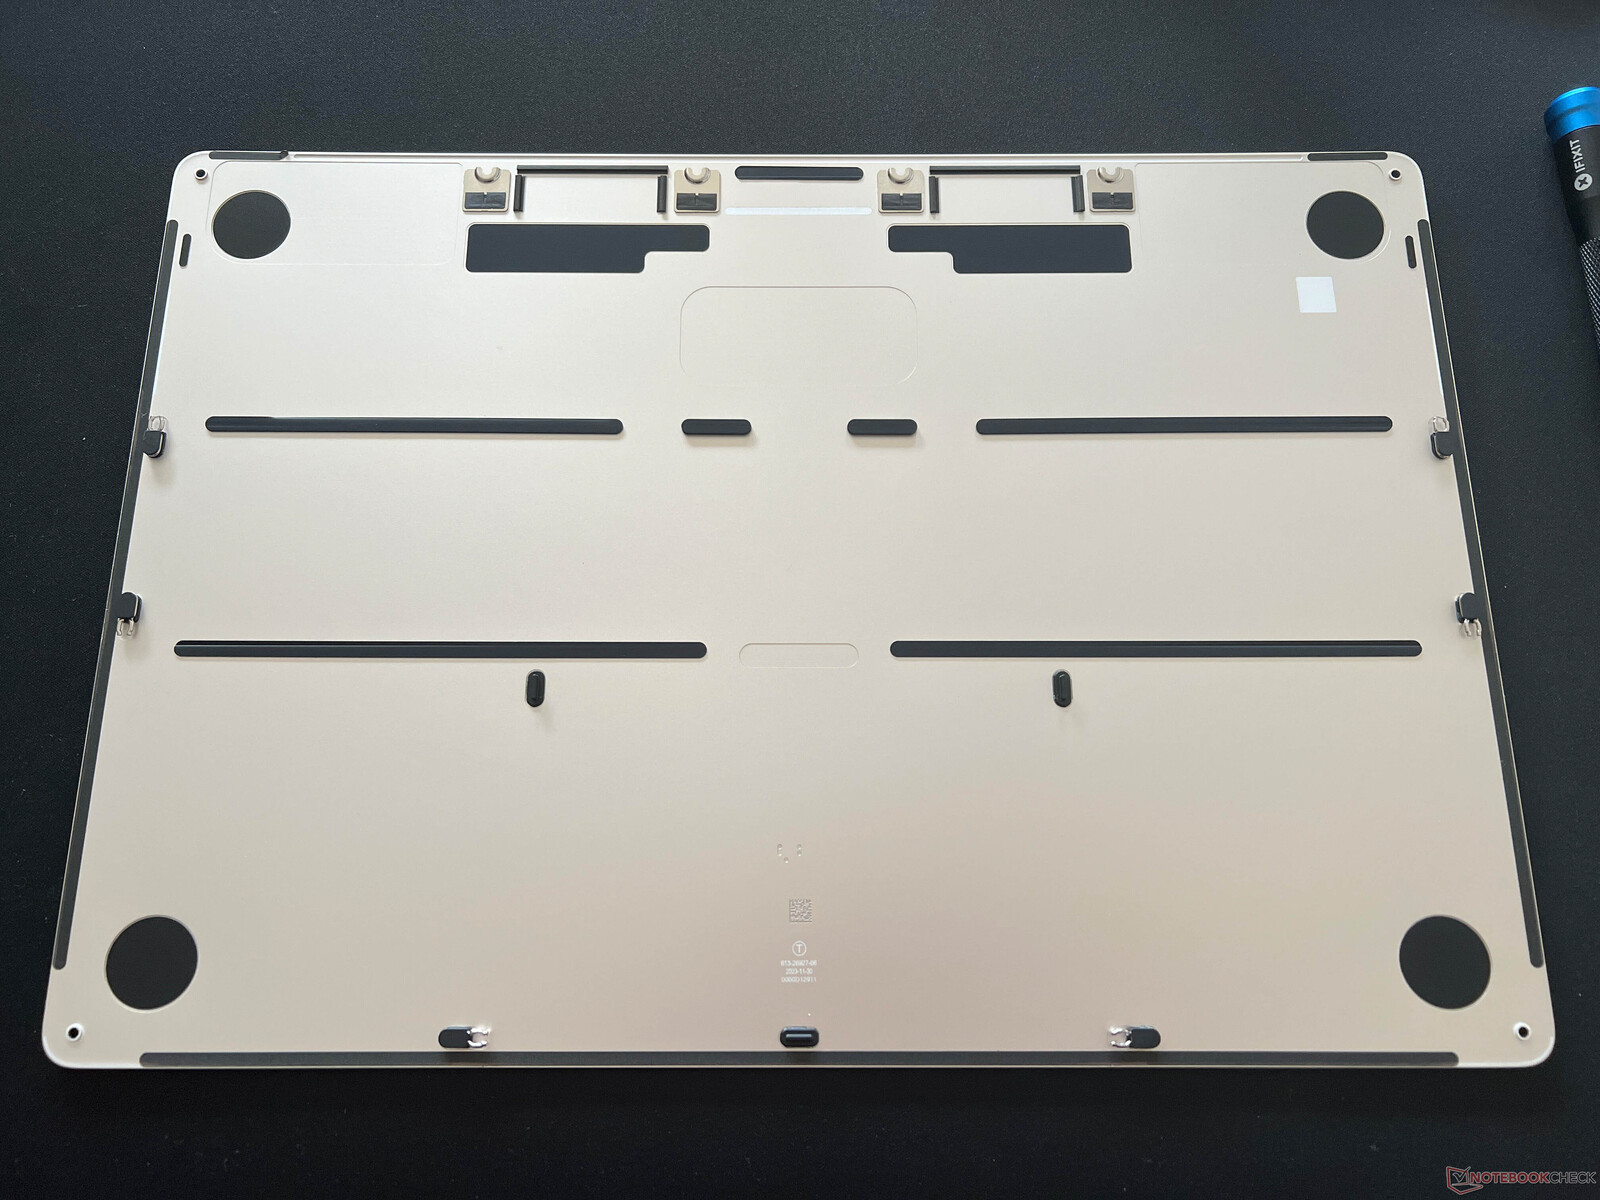
与之前的情况一样,只要使用合适的十字螺丝刀,就可以卸下机箱下盖。不过,由于没有风扇,而且所有元件都是焊接的,所以最终还是可以省去拆卸的麻烦。如果需要,可以更换粘合的电池,但这有点麻烦,只能由合格的维修人员来完成。
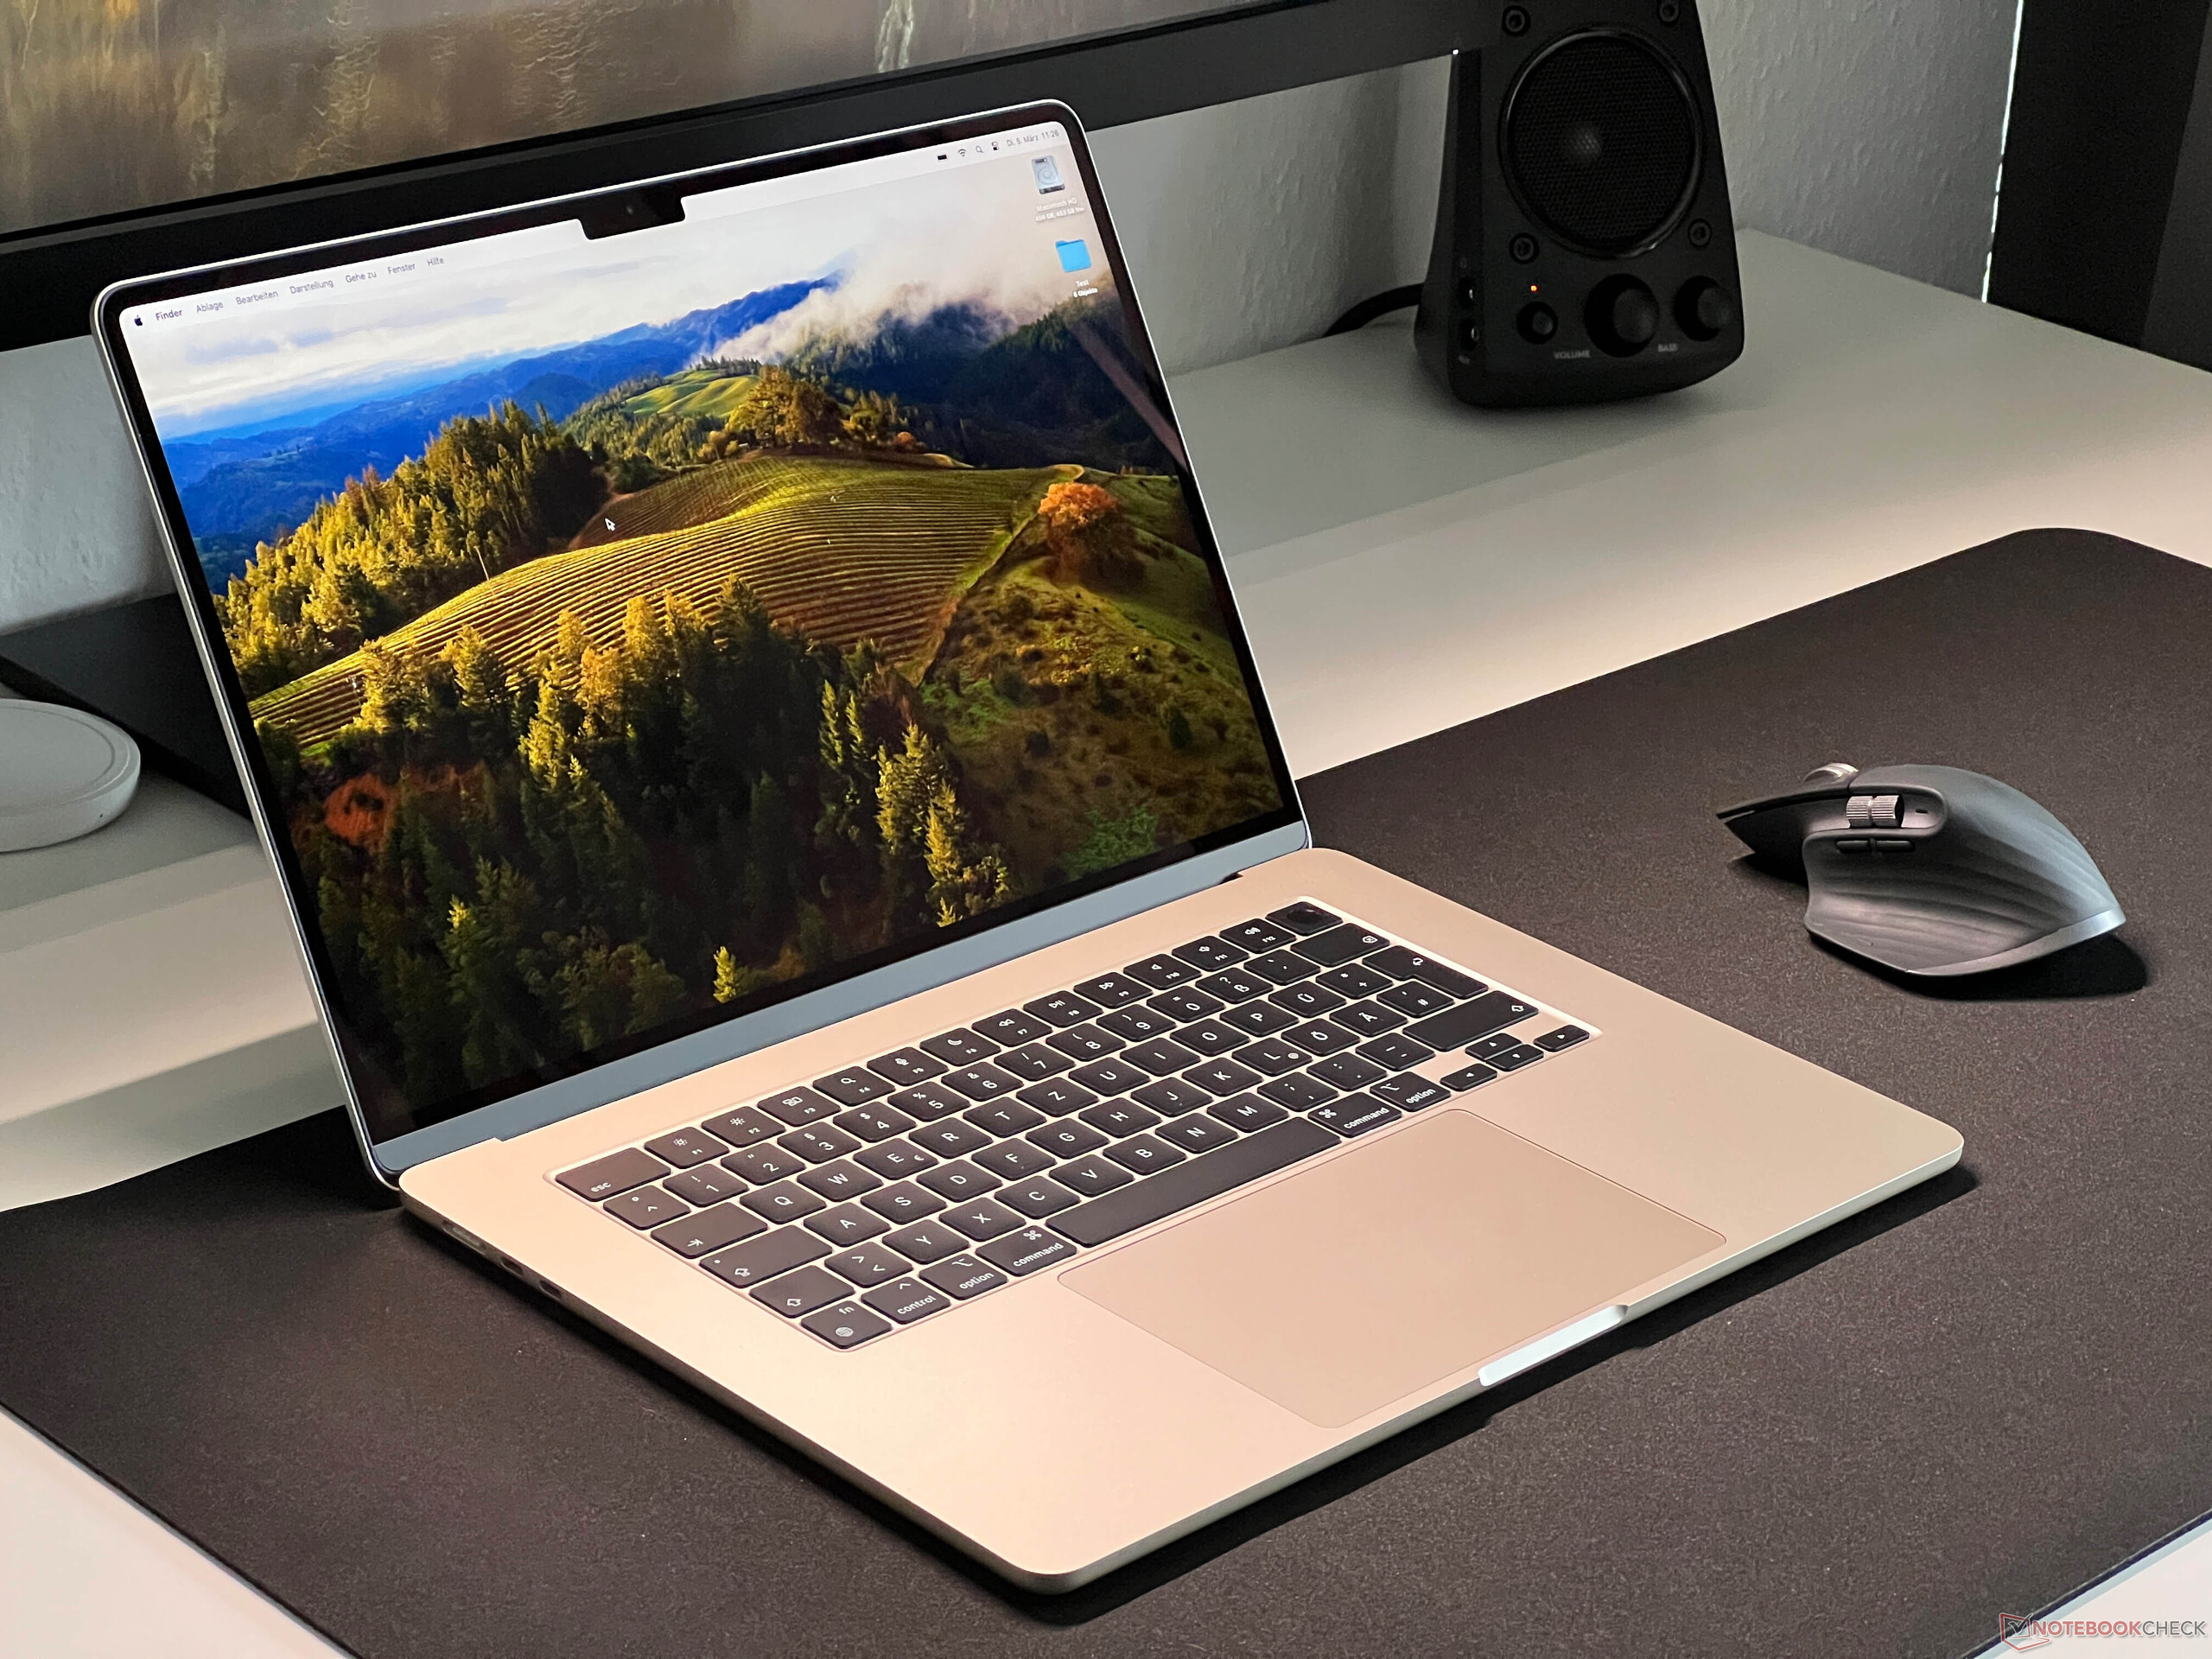
输入设备 - 出色的触控板
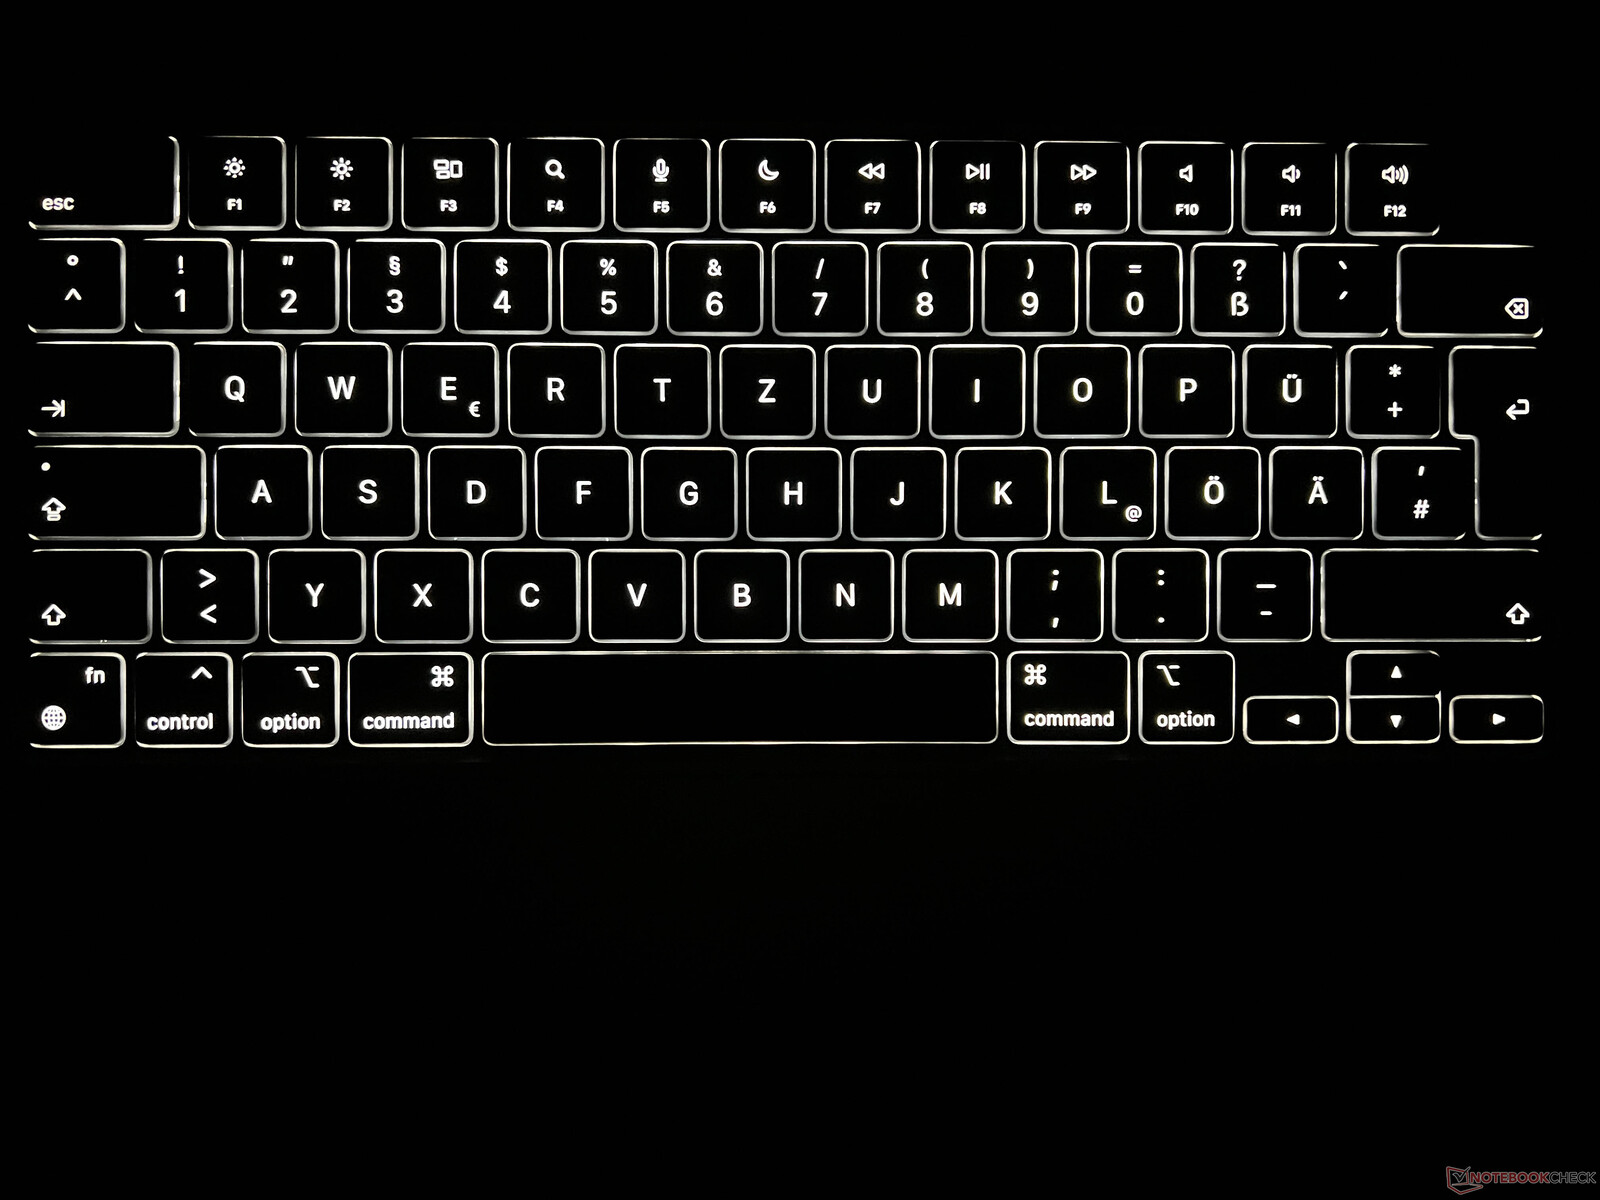
与 MacBook Air M2 相比,输入设备没有任何变化。键盘的质量虽然没有达到高级商务笔记本电脑的水平,但总的来说,键盘输入准确,输入舒适。Touch ID 指纹扫描仪的工作仍然无可挑剔,而且多年来,Apple ,由于其多级亮度设置和自动适应环境光线的能力,在白色键盘背光方面一直是值得追赶的公司。
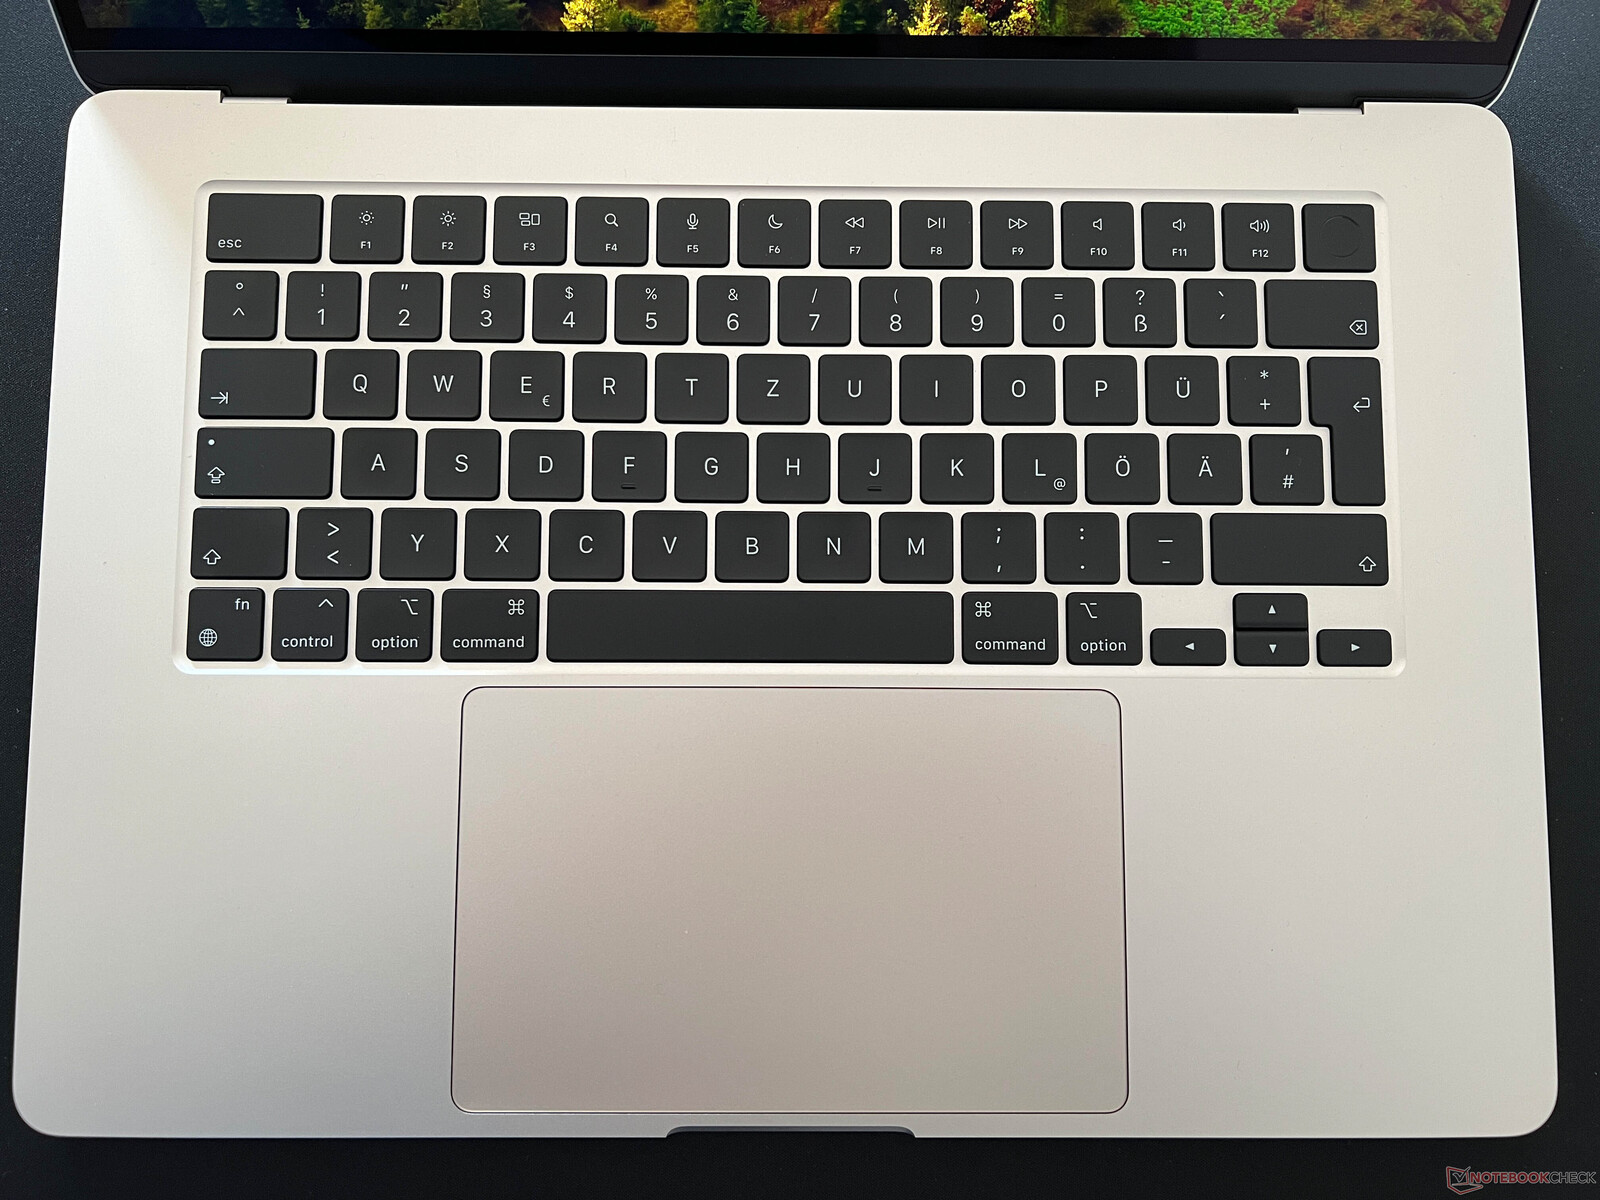
大尺寸触控板仍然是移动领域的典范,它与 macOS 的集成也非常出色。有了 Force Touch,点击在任何地方都是一样的,声音也不会太大,此外,手势操作也实现得非常完美。与往常一样,MacBook Air 没有配备触摸屏。
显示屏 - P3 覆盖的 IPS
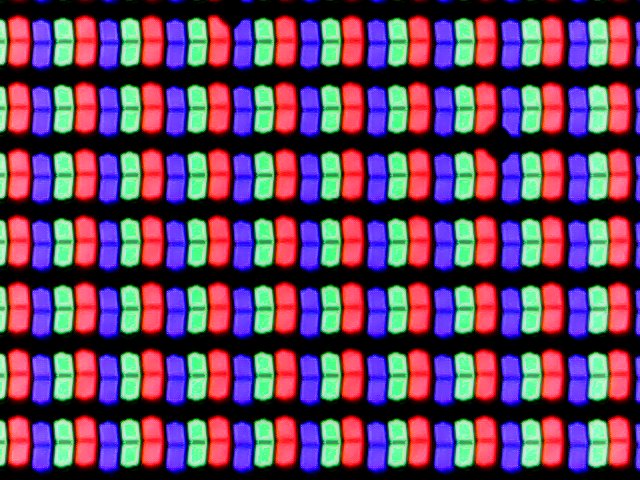
对于 Air,Apple 仍然选择使用 15.6 英寸 IPS 屏幕。分辨率为 2,880 x 1,864 像素,有点奇怪。额外的 64 个垂直像素用于凹槽旁边的区域。这看起来仍然不是特别好,但并没有侵蚀 16:10 面板的实际空间。
该面板的主观画质依然非常出色。色彩鲜艳,内容清晰,macOS 也依然没有出现缩放问题。不过,在刷新率方面,我们希望能升级到 120 Hz,因为我们使用的仍然是 60 Hz 的面板。响应时间并不突出,在日常使用中也不会出现重影现象。没有 PWM,屏幕亮度和色温都能自动适应环境光线。
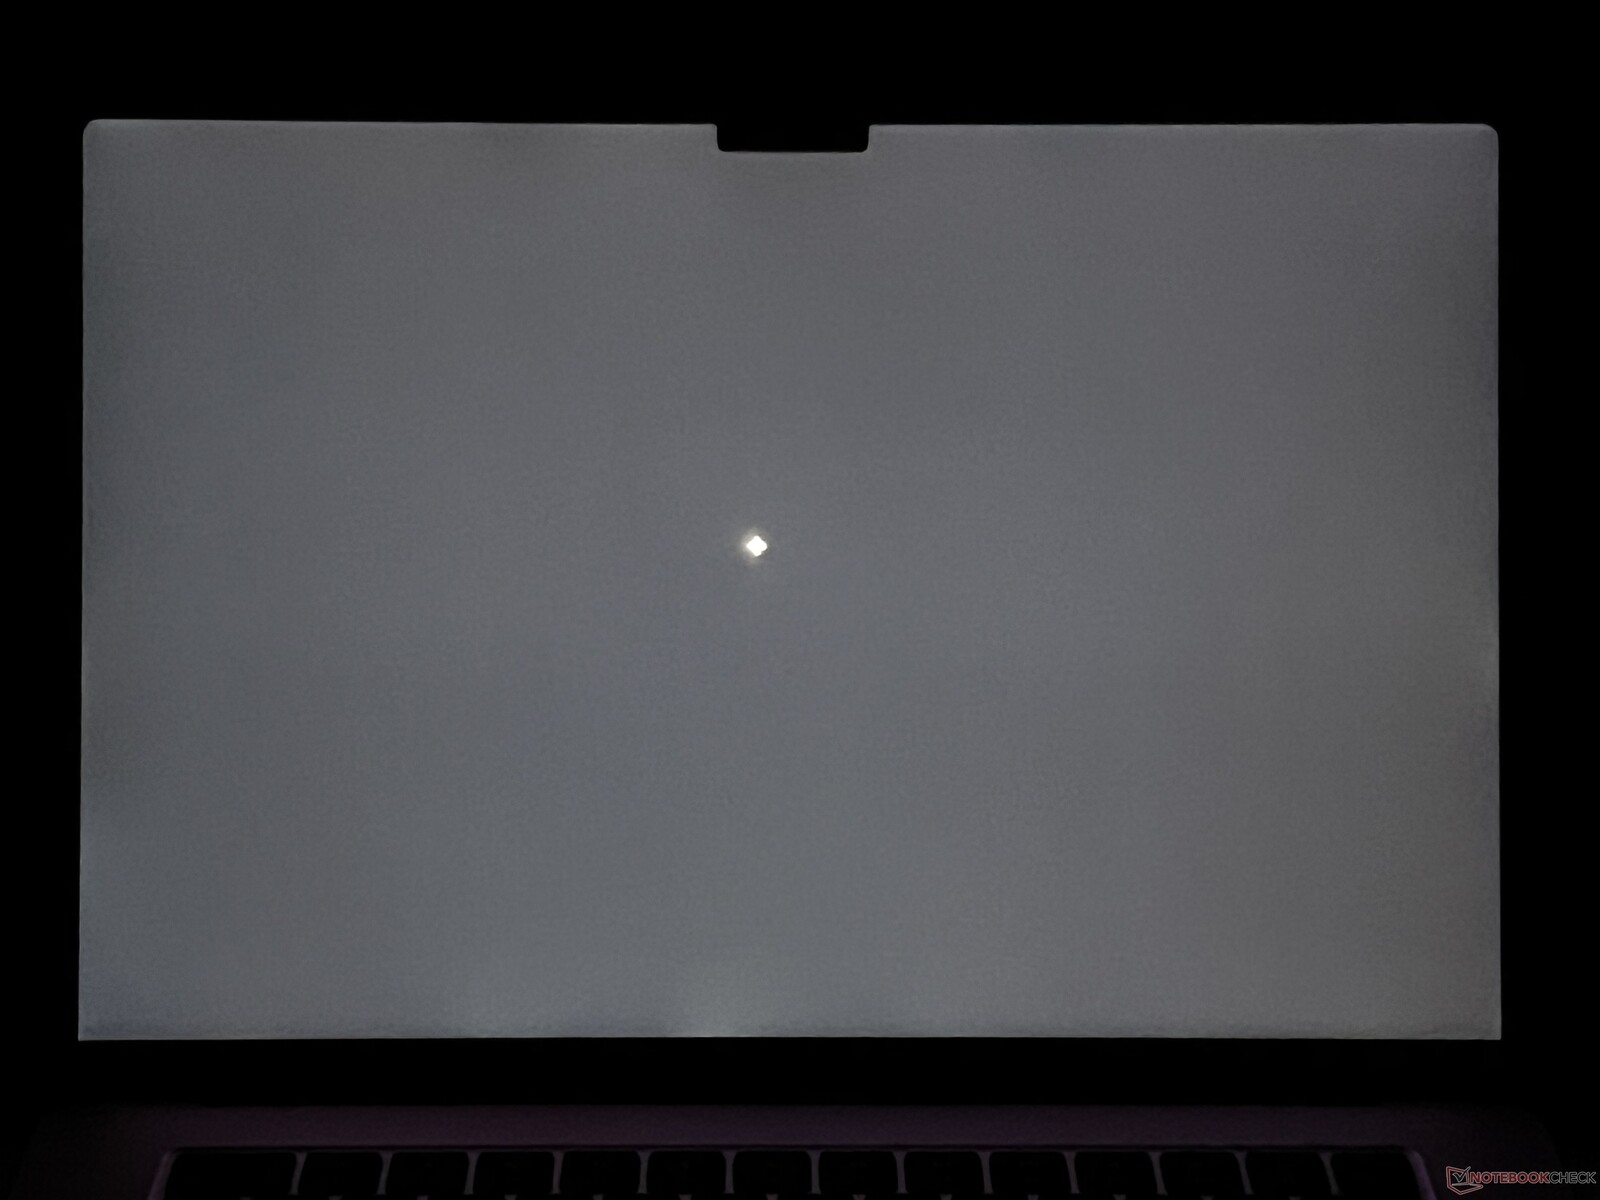
我们在显示屏中部测得的最大亮度为 525 cd/m²,平均亮度略高于 500 cd/m²。然而,0.37 cd/m² 的黑色值非常高,这就是为什么与 OLED 或微型 LED 面板相比,暗色内容永远不会呈现全黑的原因。对比度为 1.400:1。与 MacBook Air 13 不同的是,较大的 Air 15 并不存在漏光问题。
| |||||||||||||||||||||||||
Brightness Distribution: 92 %
Center on Battery: 525 cd/m²
Contrast: 1422:1 (Black: 0.37 cd/m²)
ΔE ColorChecker Calman: 1.4 | ∀{0.5-29.43 Ø4.72}
calibrated: 0.6
ΔE Greyscale Calman: 2.1 | ∀{0.09-98 Ø4.97}
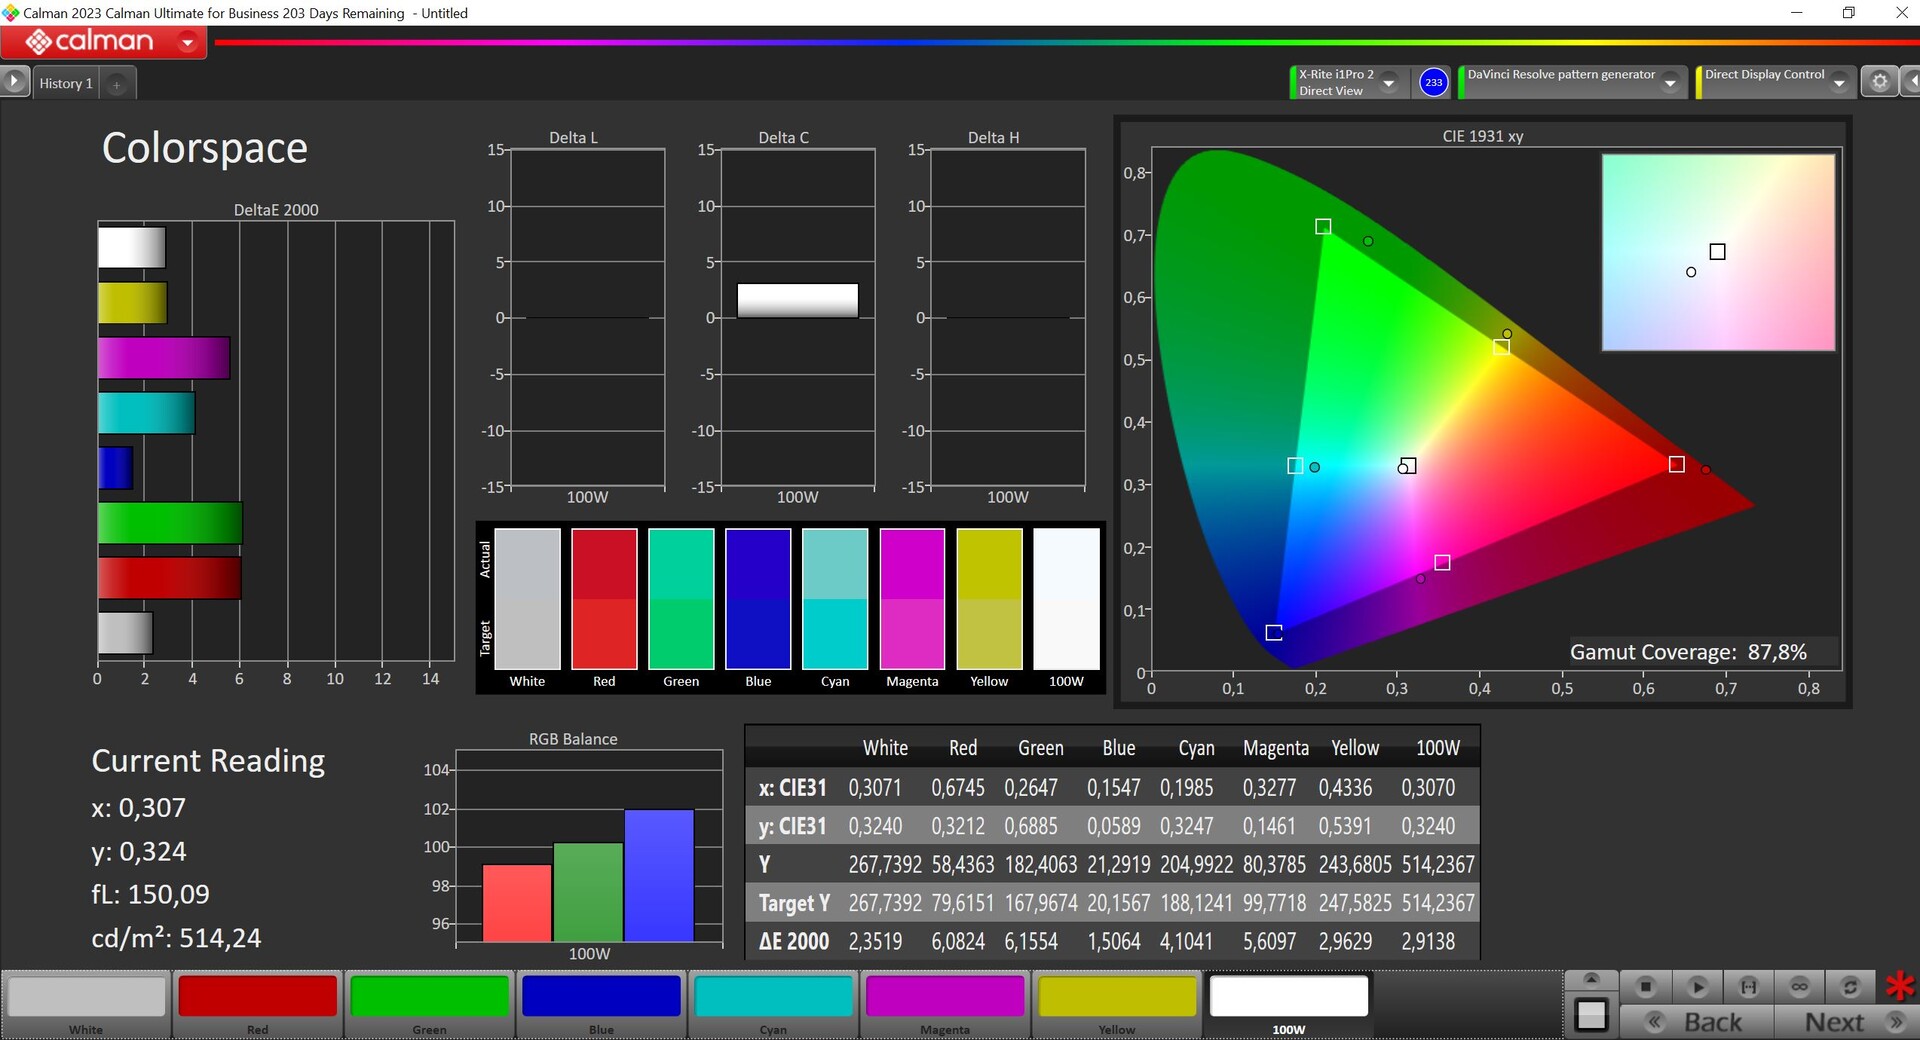
87.8% AdobeRGB 1998 (Argyll 3D)
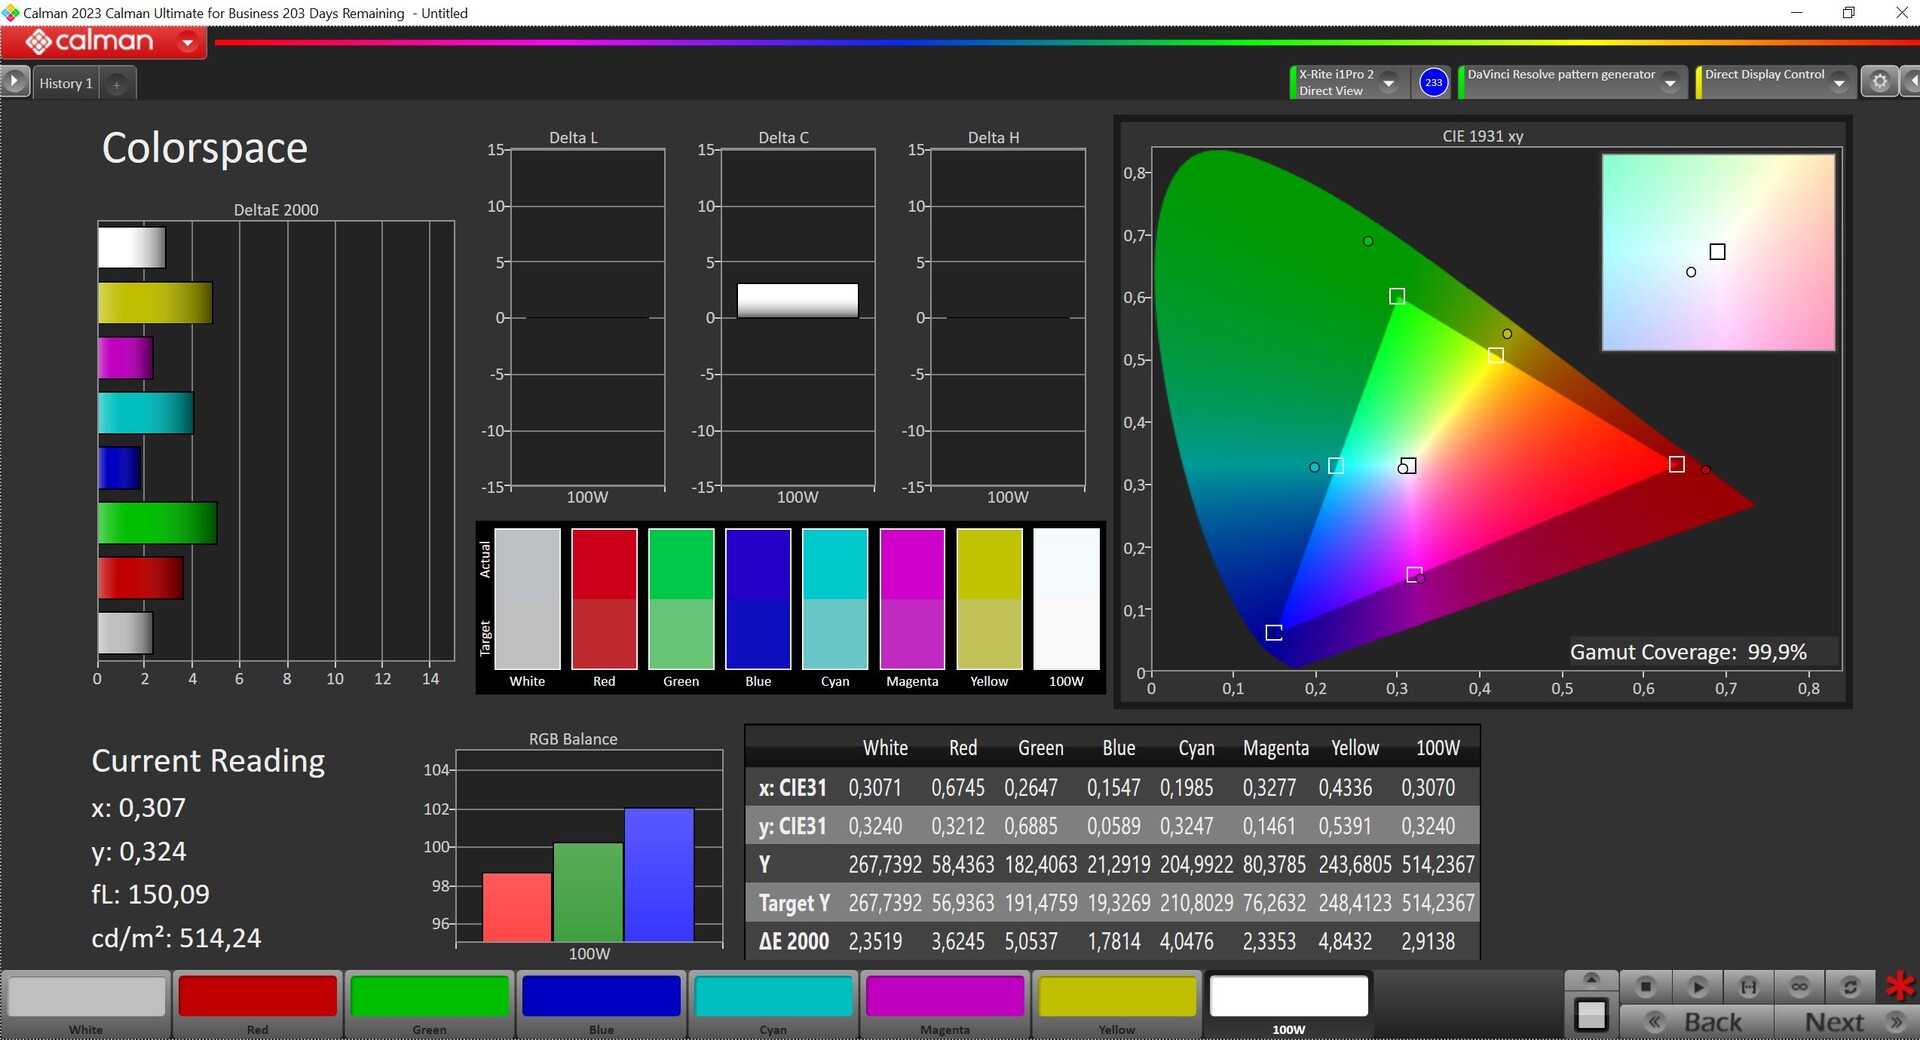
99.9% sRGB (Argyll 3D)
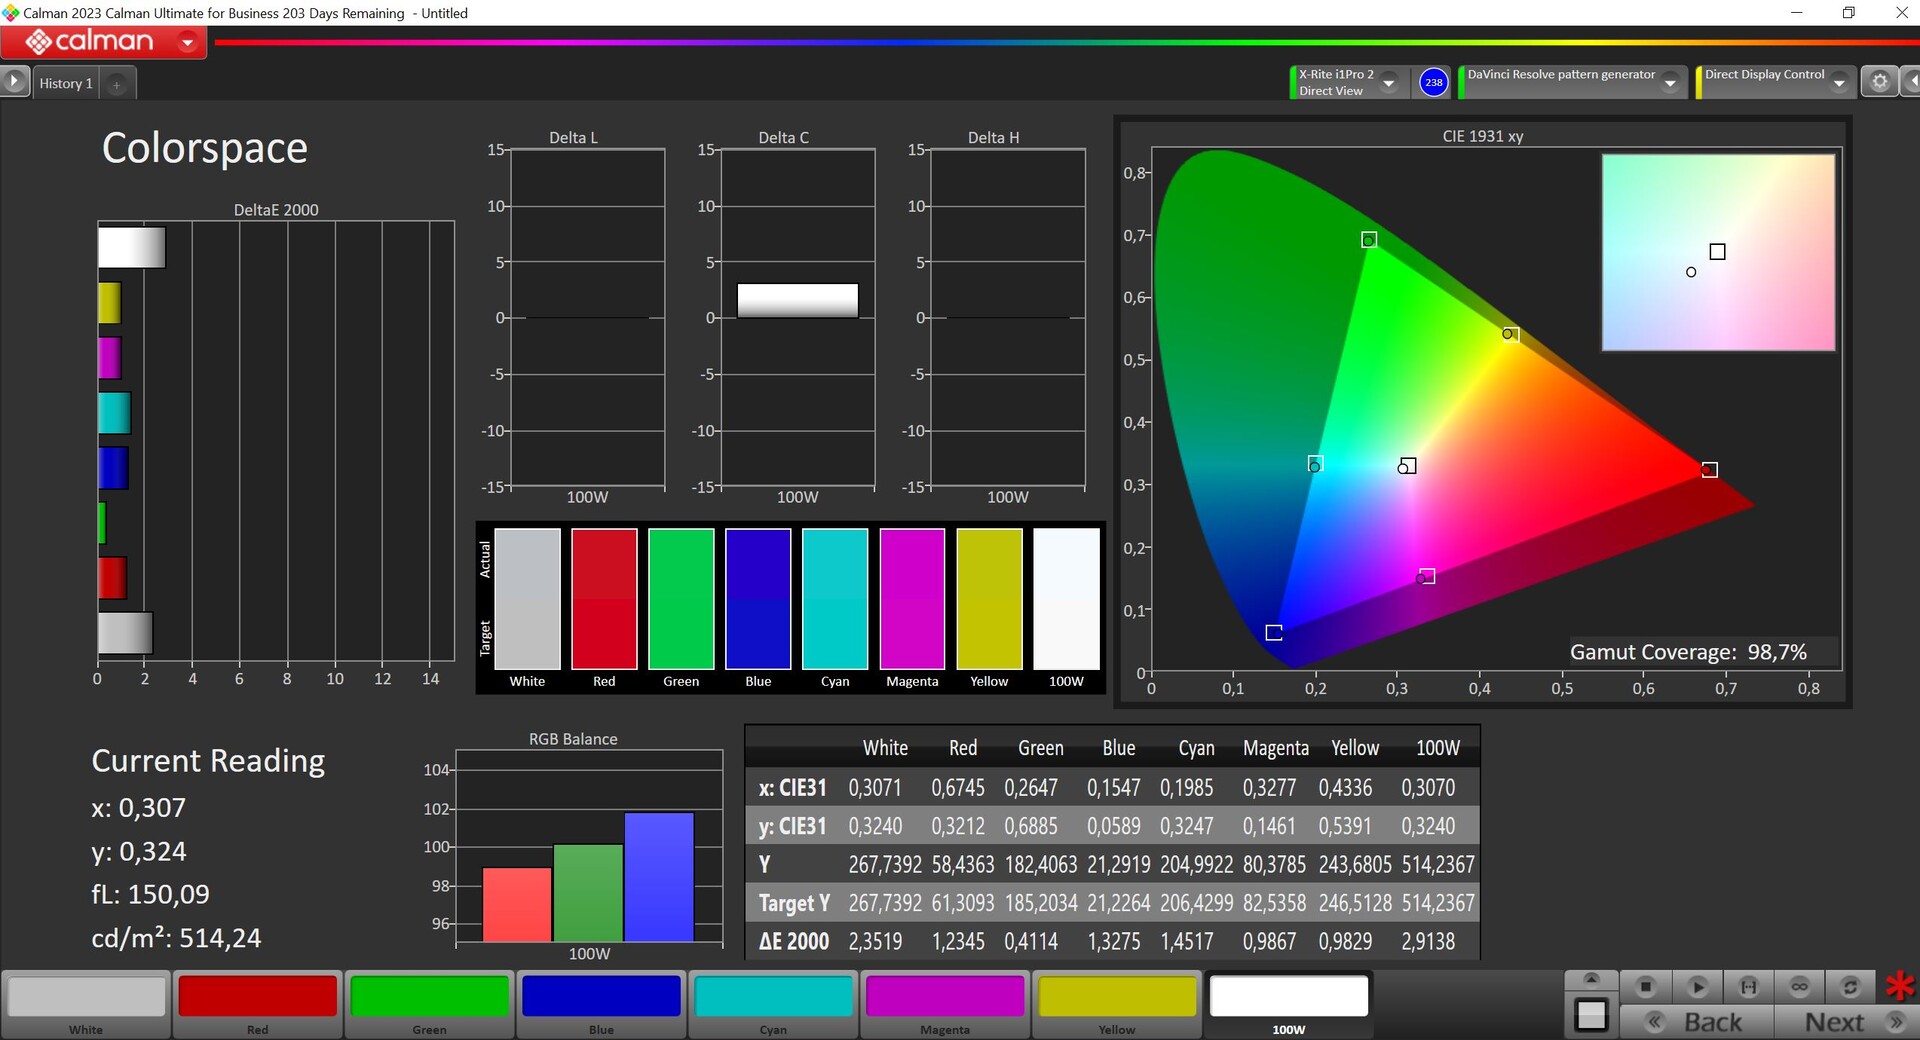
98.7% Display P3 (Argyll 3D)
Gamma: 2.23
CCT: 6865 K
| Apple MacBook Air 15 M3 IPS, 2880x1864, 15.3" | Asus VivoBook S15 K5504 Samsung SDC4180, OLED, 2880x1620, 15.6" | MSI Prestige 16 B1MG-001US AU Optronics B160QAN03.R, IPS, 2560x1600, 16" | Acer Swift Go SFG16-71 Samsung SDC418D ATNA60BC03-0, OLED, 3200x2000, 16" | Huawei MateBook 16s i9 BOE0BB0 TV160DKT-NH1, IPS, 2560x1680, 16" | LG Gram SuperSlim (2023) Samsung ATNA56YX08-0, OLED, 1920x1080, 15.6" | Samsung Galaxy Book3 15, Core i5-1335U BOE 18 NE156FHM-NS0, IPS, 1920x1080, 15.6" | |
|---|---|---|---|---|---|---|---|
| Display | 3% | -2% | 5% | -22% | 4% | -47% | |
| Display P3 Coverage (%) | 98.7 | 99.93 1% | 96.7 -2% | 99.91 1% | 63 -36% | 99.8 1% | 43.17 -56% |
| sRGB Coverage (%) | 99.9 | 100 0% | 99.8 0% | 100 0% | 94.9 -5% | 100 0% | 65.03 -35% |
| AdobeRGB 1998 Coverage (%) | 87.8 | 95.52 9% | 84.6 -4% | 98.87 13% | 65.1 -26% | 98.09 12% | 44.6 -49% |
| Response Times | 91% | -79% | 91% | -3% | 91% | 36% | |
| Response Time Grey 50% / Grey 80% * (ms) | 35.3 ? | 2 ? 94% | 49.4 ? -40% | 2 ? 94% | 34 ? 4% | 2 ? 94% | 20 ? 43% |
| Response Time Black / White * (ms) | 15.6 ? | 2 ? 87% | 33.9 ? -117% | 2 ? 87% | 17 ? -9% | 2 ? 87% | 11 ? 29% |
| PWM Frequency (Hz) | 240 | 227 ? | 26 ? | ||||
| Screen | 81% | -98% | -92% | -23% | -70% | -188% | |
| Brightness middle (cd/m²) | 526 | 370.4 -30% | 473.6 -10% | 370 -30% | 448 -15% | 395 -25% | 308 -41% |
| Brightness (cd/m²) | 506 | 376 -26% | 456 -10% | 371 -27% | 436 -14% | 392 -23% | 290 -43% |
| Brightness Distribution (%) | 92 | 96 4% | 87 -5% | 98 7% | 93 1% | 97 5% | 83 -10% |
| Black Level * (cd/m²) | 0.37 | 0.02 95% | 0.19 49% | 0.35 5% | 0.1 73% | 0.425 -15% | |
| Contrast (:1) | 1422 | 18520 1202% | 2493 75% | 1280 -10% | 3950 178% | 725 -49% | |
| Colorchecker dE 2000 * | 1.4 | 1.51 -8% | 5.9 -321% | 2.77 -98% | 1.6 -14% | 2.2 -57% | 5.27 -276% |
| Colorchecker dE 2000 max. * | 2 | 2.89 -45% | 9.37 -368% | 4.08 -104% | 4.44 -122% | 4.43 -122% | 16.43 -722% |
| Colorchecker dE 2000 calibrated * | 0.6 | 3.36 -460% | 0.89 -48% | 2.83 -372% | 0.64 -7% | 4.65 -675% | 2.58 -330% |
| Greyscale dE 2000 * | 2.1 | 2.1 -0% | 7.3 -248% | 2.58 -23% | 2.78 -32% | 1.78 15% | 6.38 -204% |
| Gamma | 2.23 99% | 2.2 100% | 1.9 116% | 2.46 89% | 2.39 92% | 2.4 92% | |
| CCT | 6865 95% | 6536 99% | 7260 90% | 6241 104% | 6582 99% | 6284 103% | 7784 84% |
| Color Space (Percent of AdobeRGB 1998) (%) | 2.43 | ||||||
| Total Average (Program / Settings) | 58% /
66% | -60% /
-75% | 1% /
-38% | -16% /
-20% | 8% /
-31% | -66% /
-126% |
* ... smaller is better
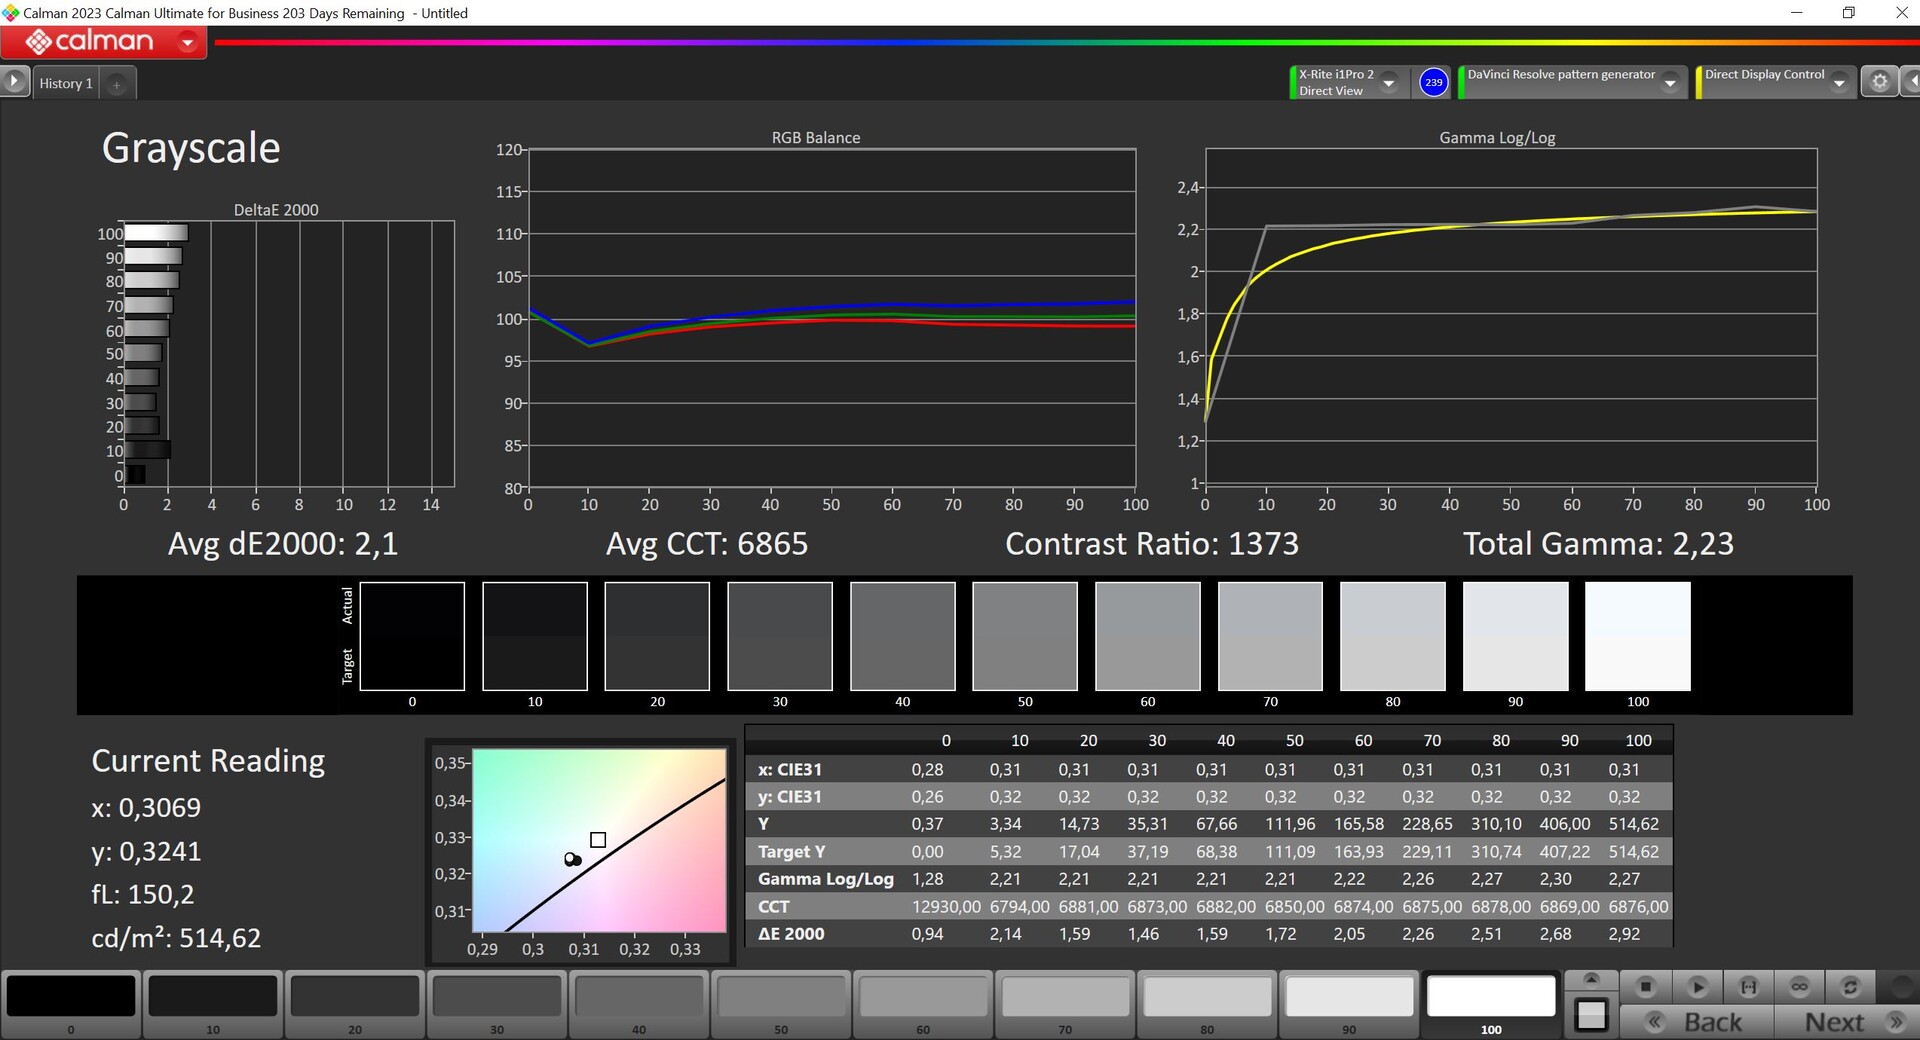

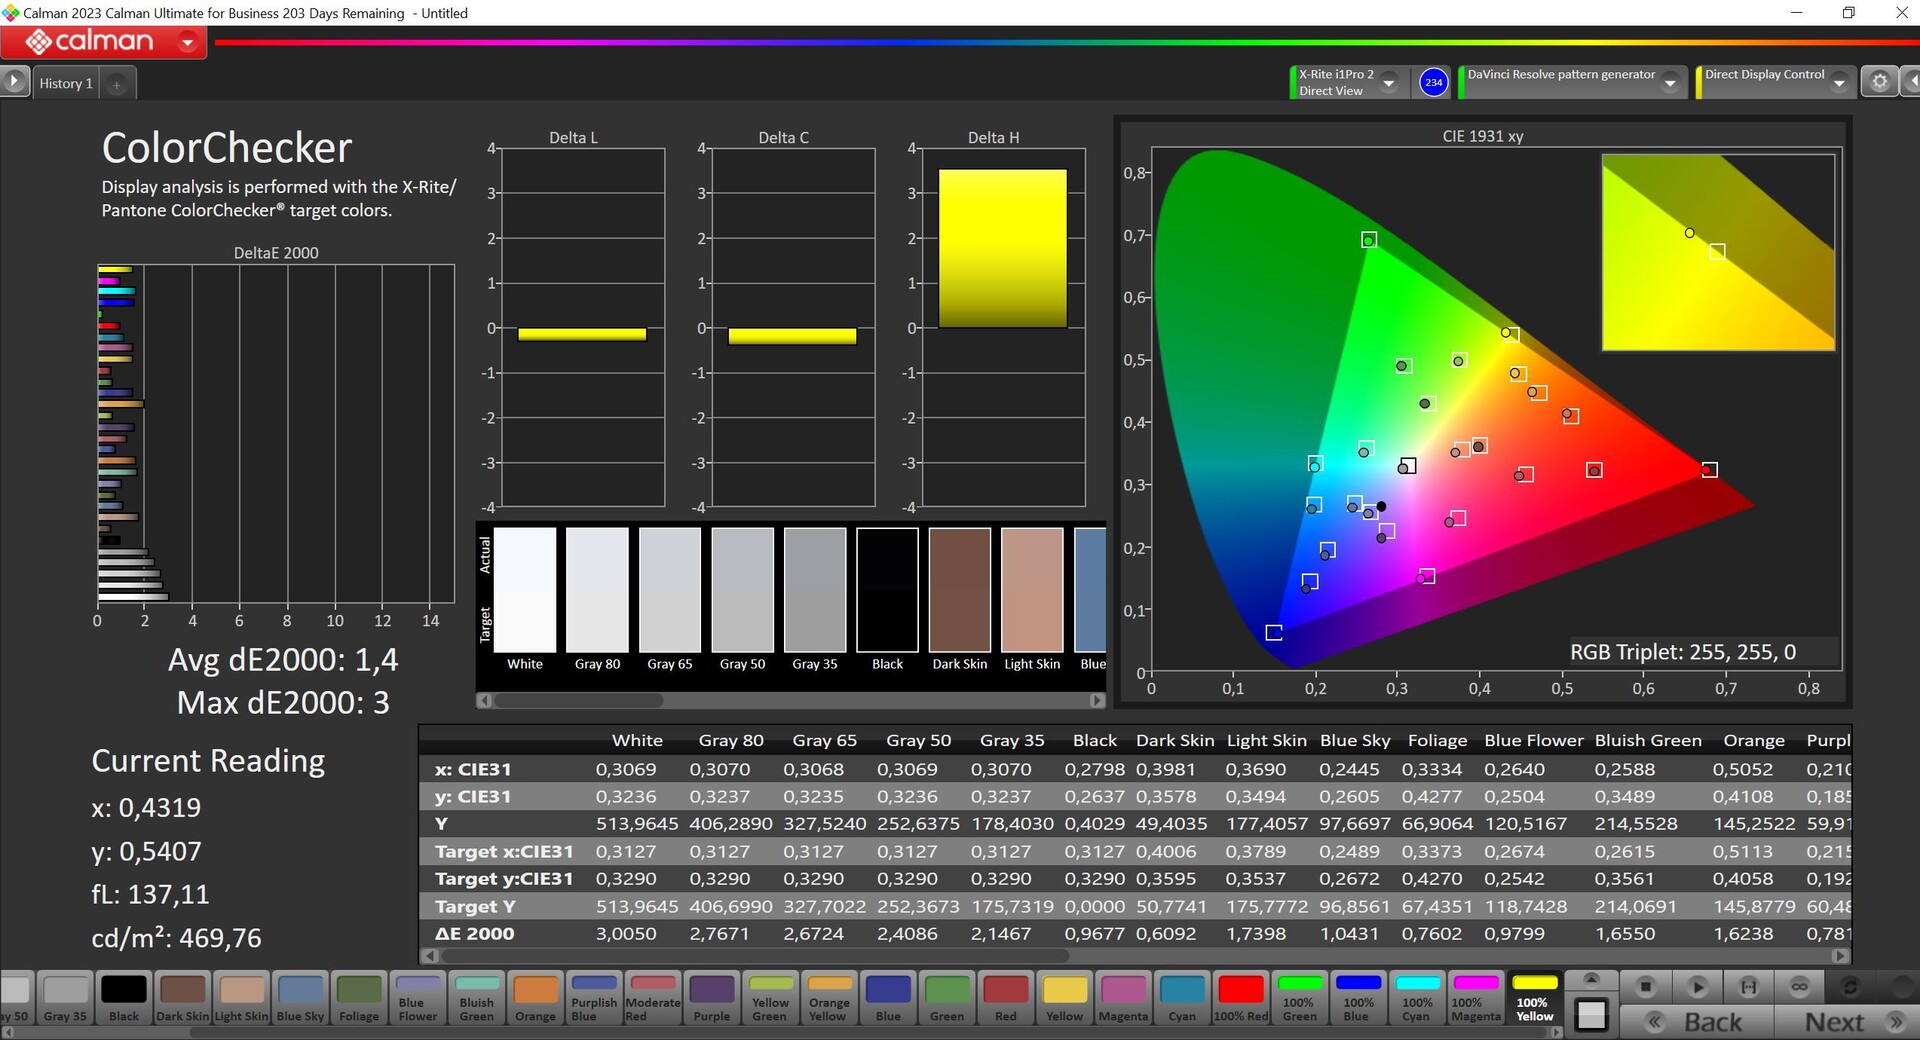
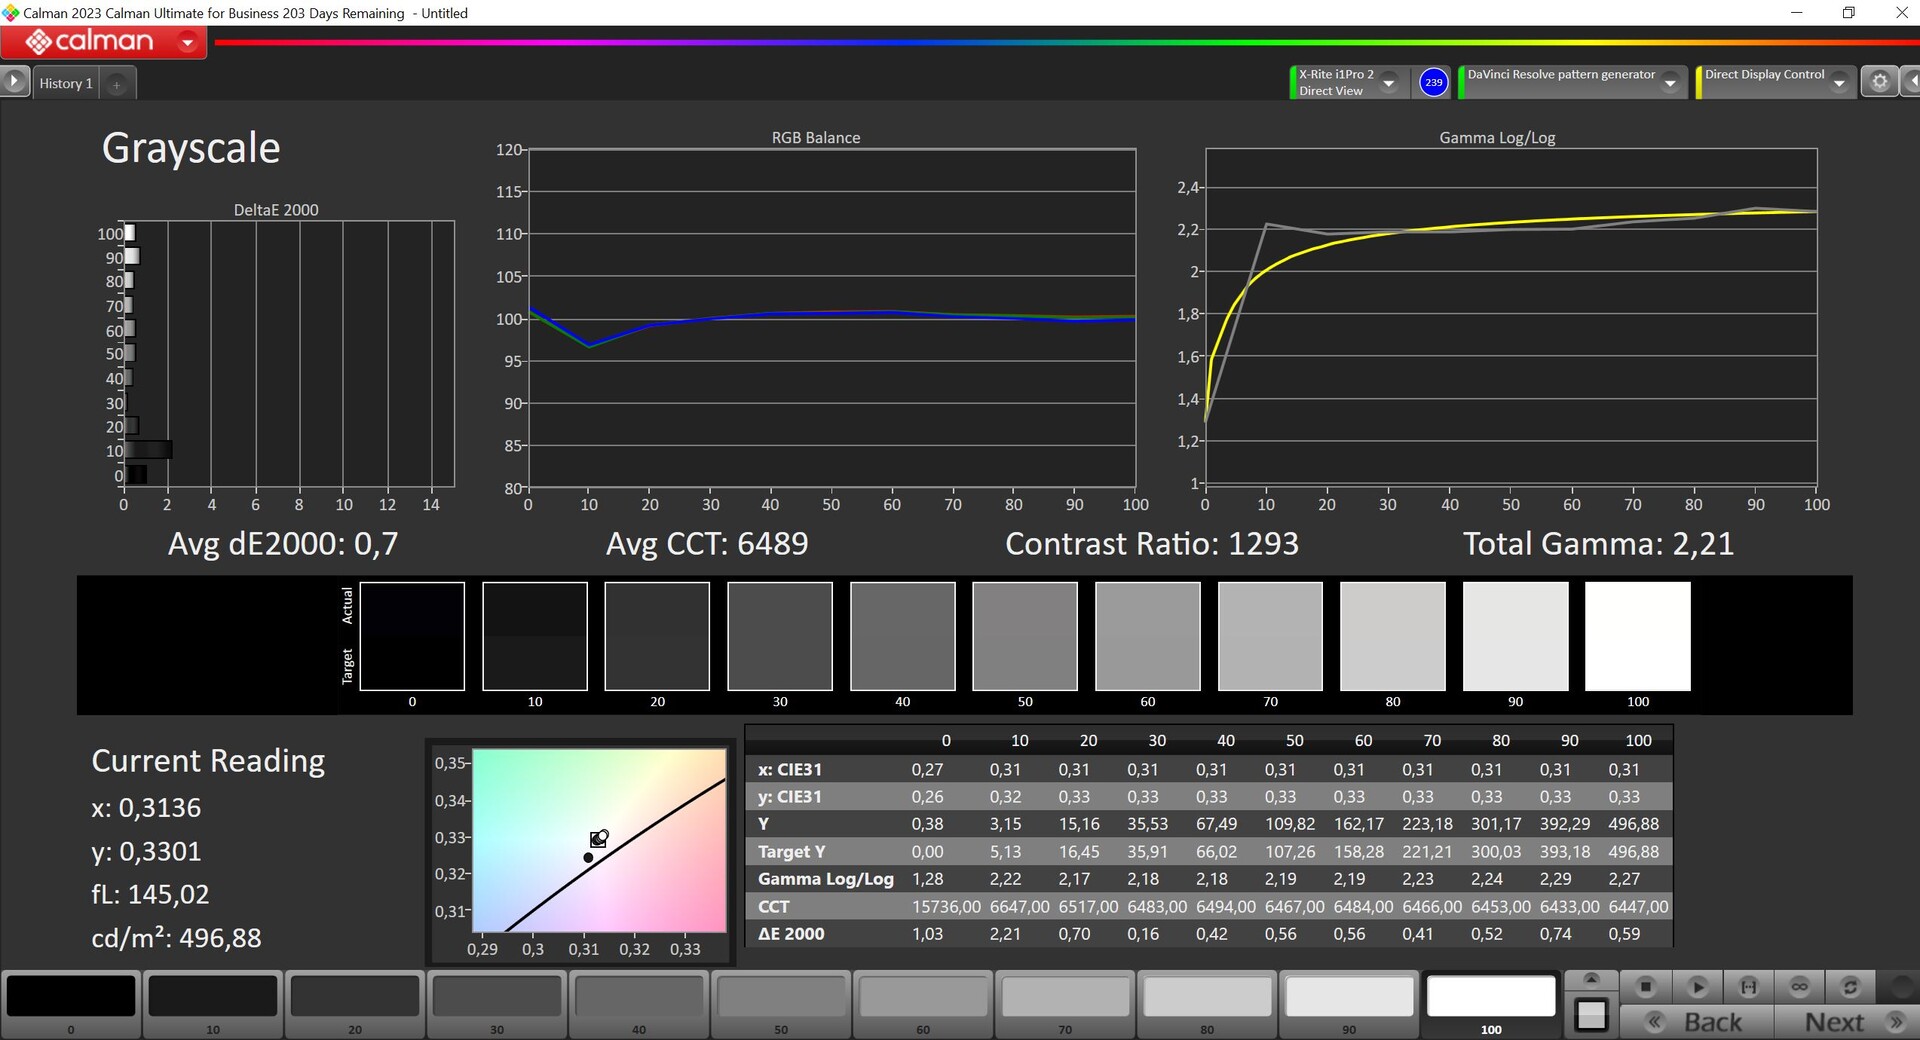
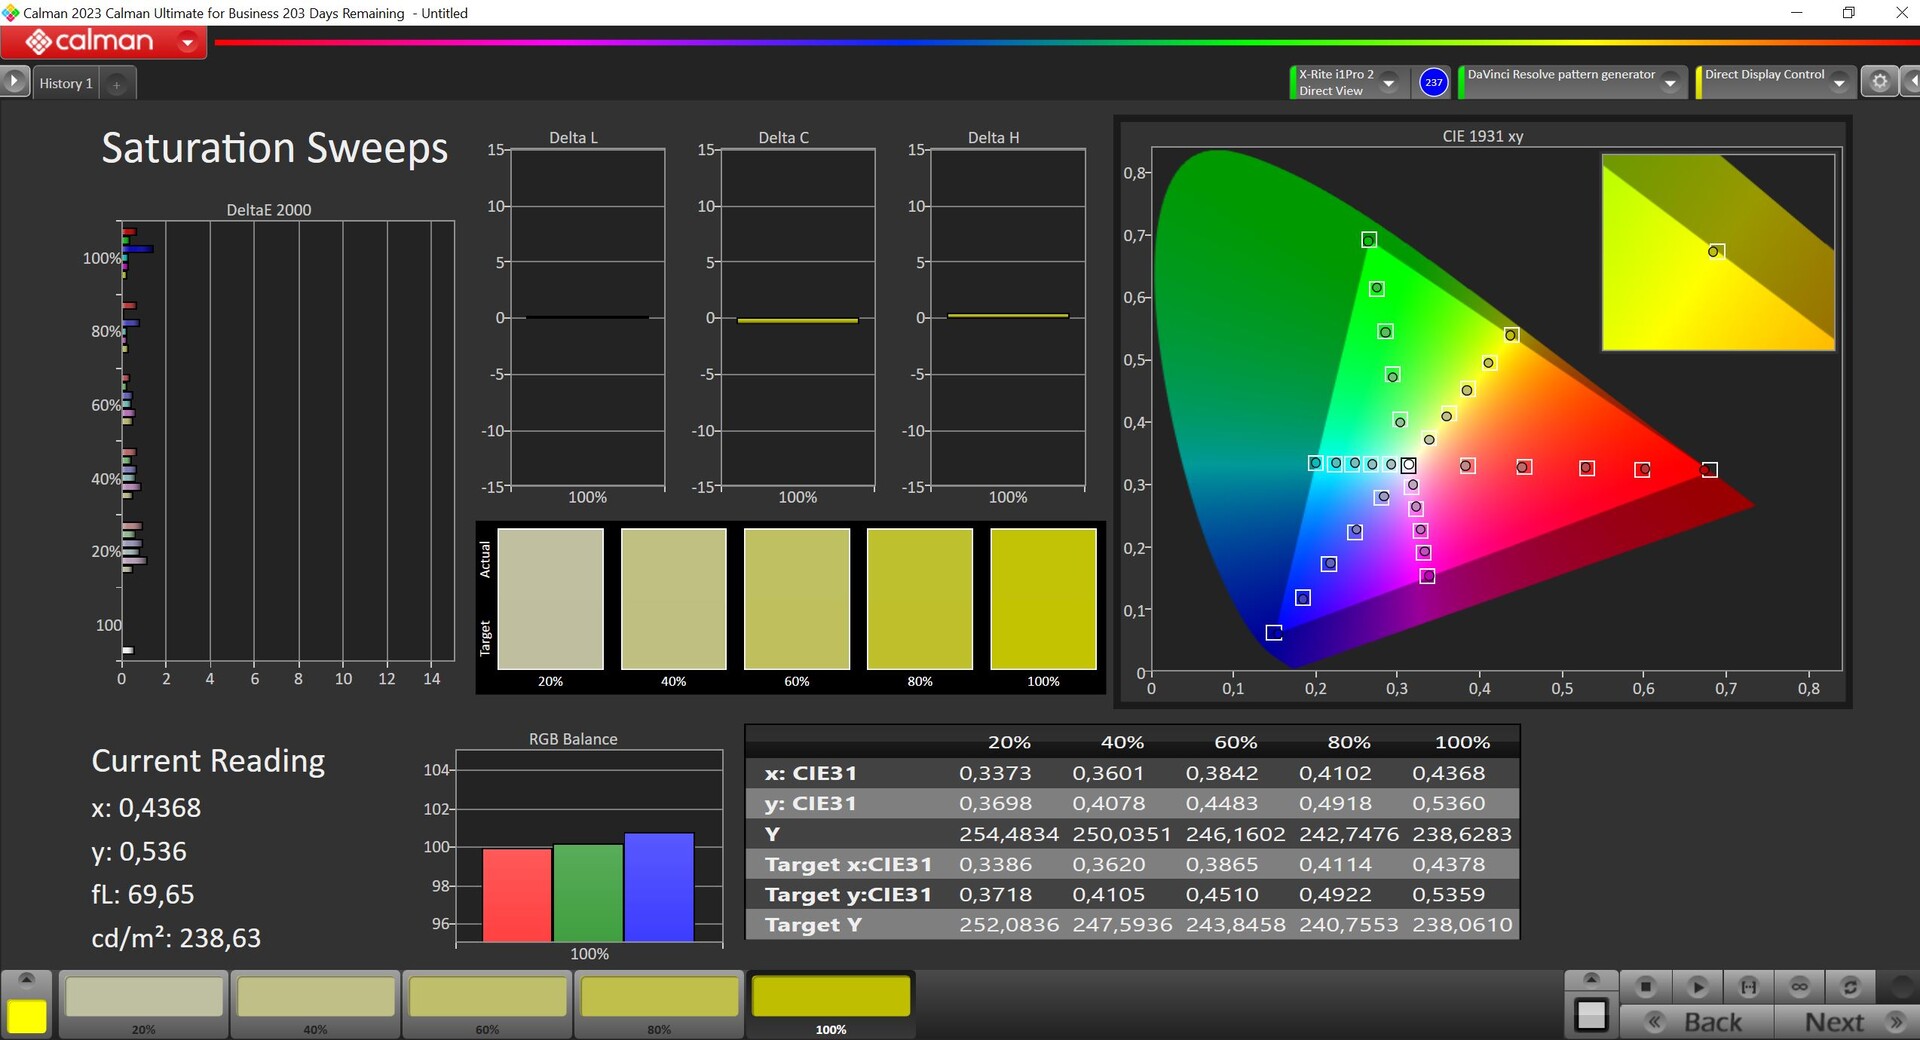
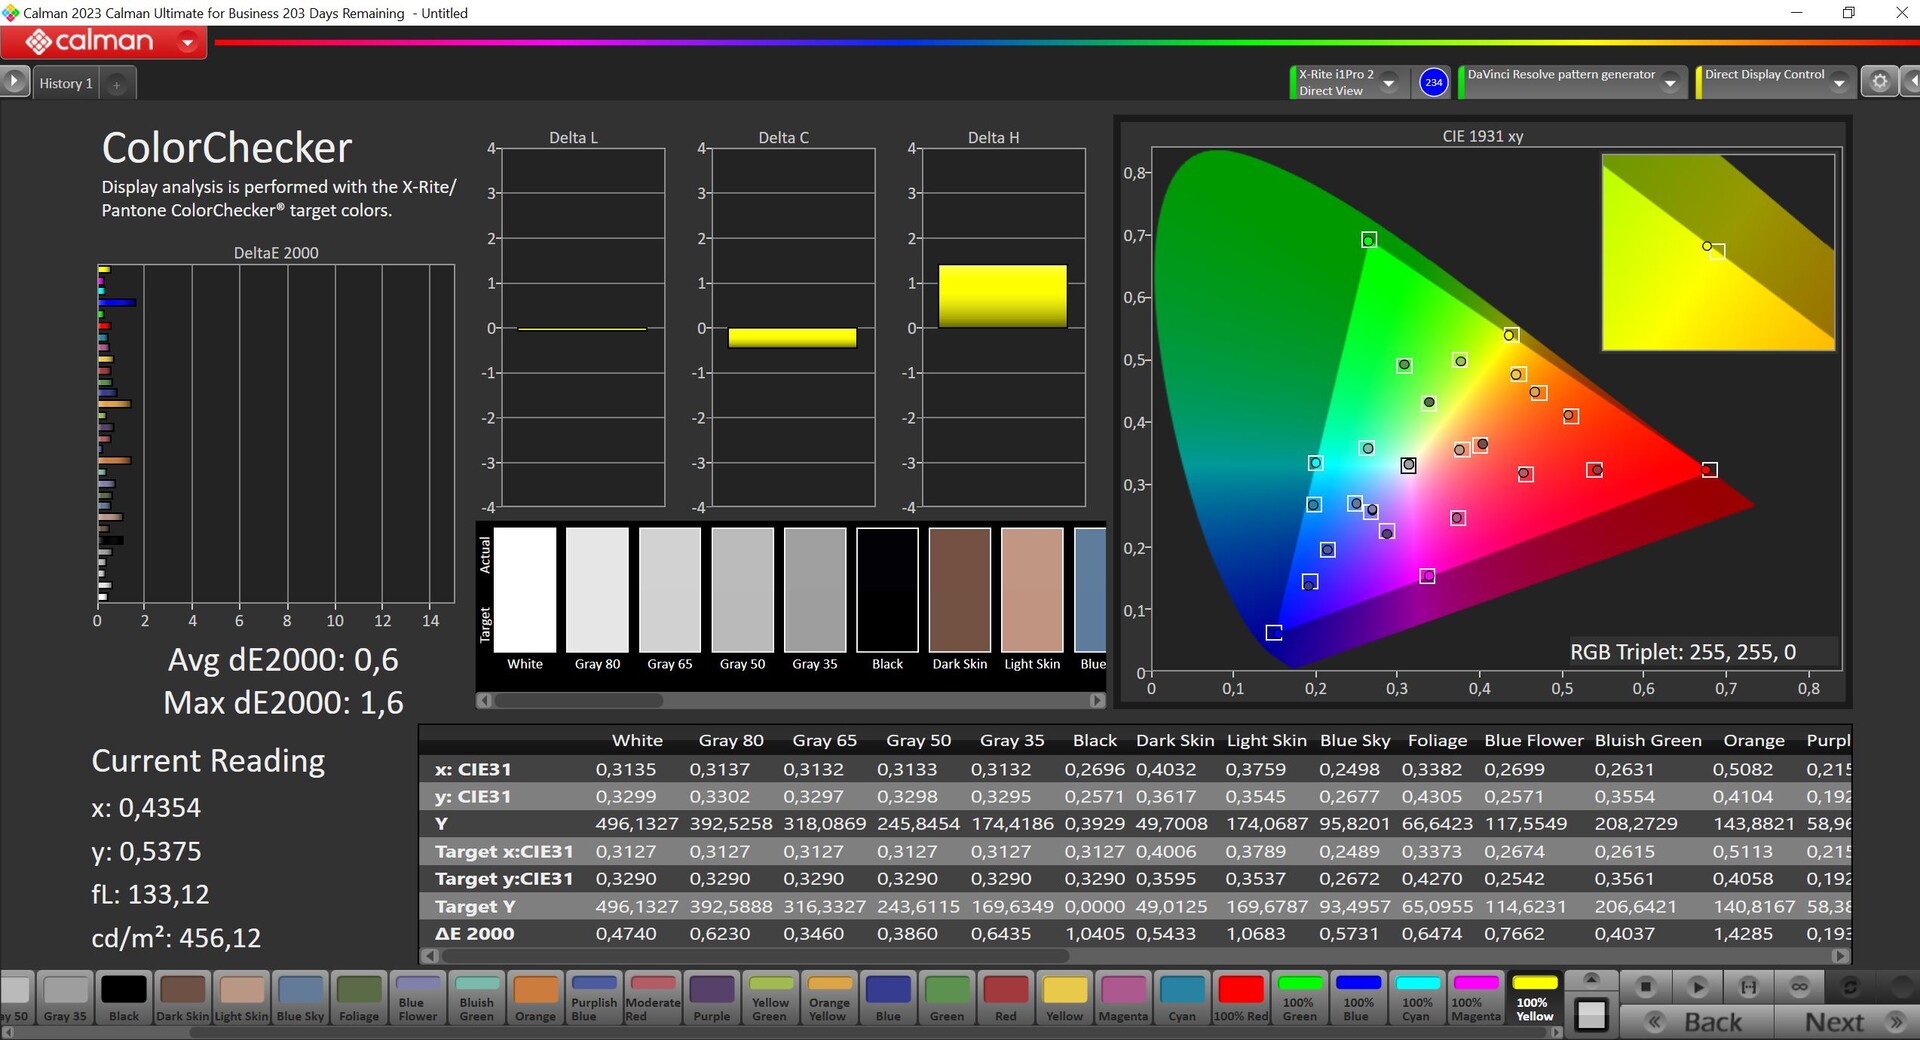
开箱后,面板的校准效果不错,灰度和色彩的 DeltaE 2000 偏差(与 P3 参考值相比)均低于 3。 较小的模型我们的专业 CalMAN 软件分析(X-Rite i1 Pro 2)记录了轻微的蓝色色调和接近过冷的冷色温。通过校准(上面有免费下载的配置文件),我们控制住了这两种情况,偏差也明显降低。不过,最大亮度降低了约 20 cd/m²。完全覆盖 P3 色彩空间。
Display Response Times
| ↔ Response Time Black to White | ||
|---|---|---|
| 15.6 ms ... rise ↗ and fall ↘ combined | ↗ 5.2 ms rise | 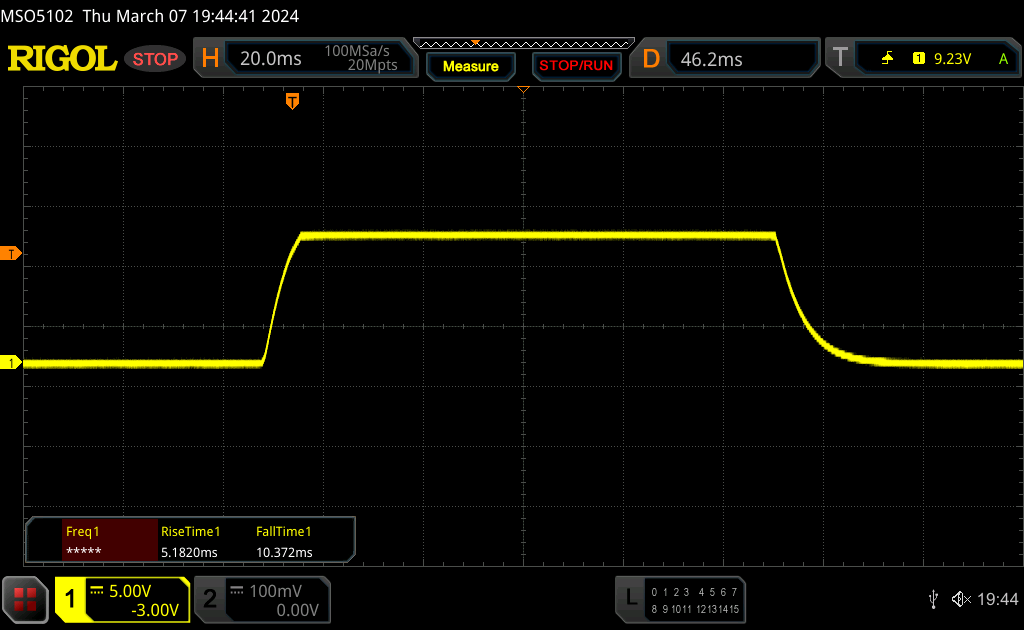 |
| ↘ 10.4 ms fall | ||
| The screen shows good response rates in our tests, but may be too slow for competitive gamers. In comparison, all tested devices range from 0.1 (minimum) to 240 (maximum) ms. » 37 % of all devices are better. This means that the measured response time is better than the average of all tested devices (19.9 ms). | ||
| ↔ Response Time 50% Grey to 80% Grey | ||
| 35.3 ms ... rise ↗ and fall ↘ combined | ↗ 16.4 ms rise | 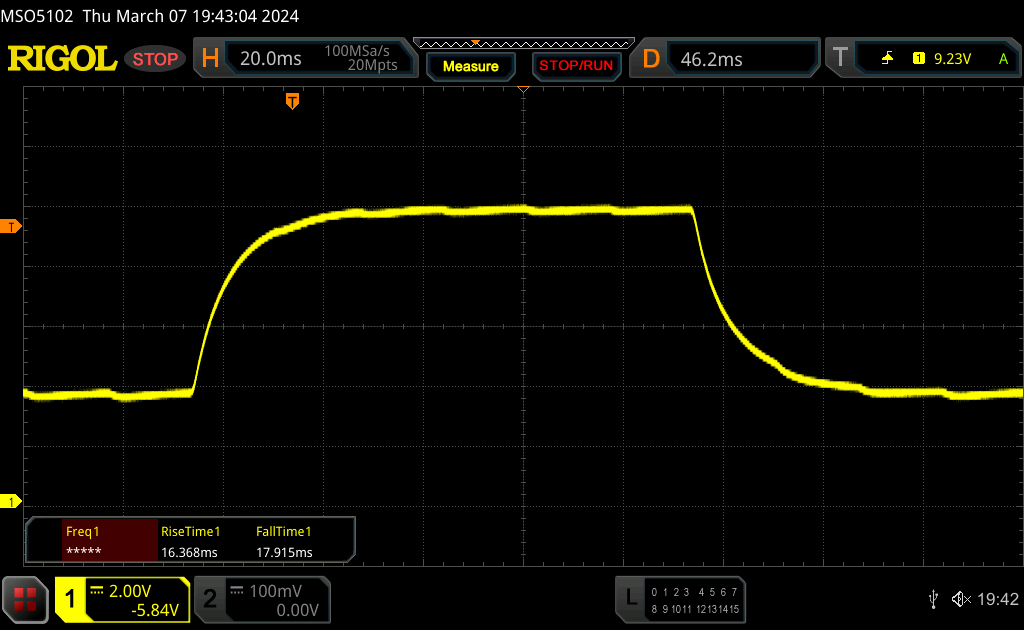 |
| ↘ 17.9 ms fall | ||
| The screen shows slow response rates in our tests and will be unsatisfactory for gamers. In comparison, all tested devices range from 0.165 (minimum) to 636 (maximum) ms. » 50 % of all devices are better. This means that the measured response time is worse than the average of all tested devices (31.1 ms). | ||
Screen Flickering / PWM (Pulse-Width Modulation)
| Screen flickering / PWM not detected | 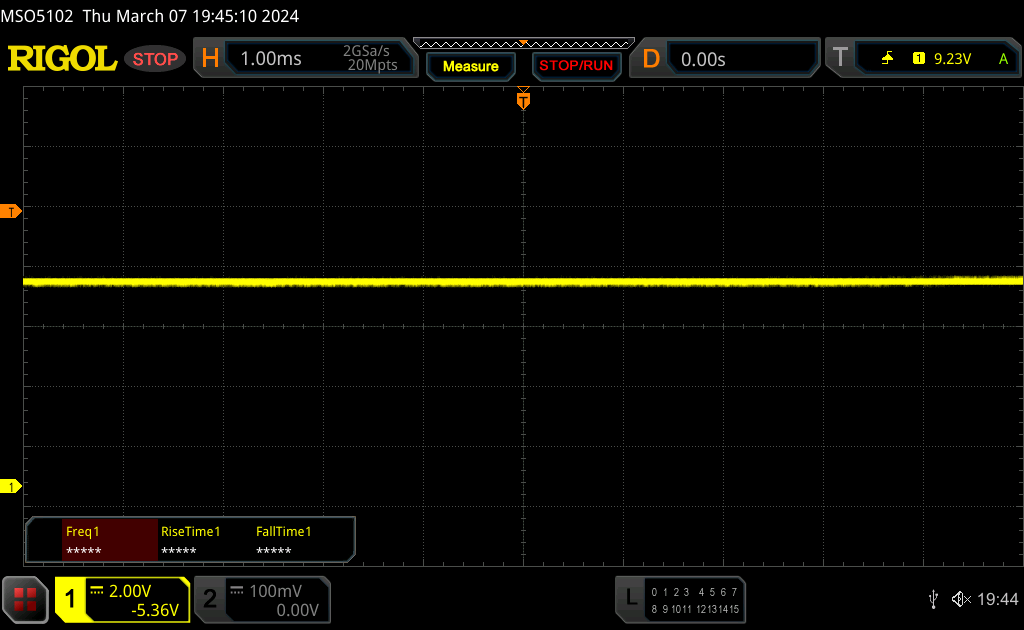 | ||
In comparison: 52 % of all tested devices do not use PWM to dim the display. If PWM was detected, an average of 7784 (minimum: 5 - maximum: 343500) Hz was measured. | |||
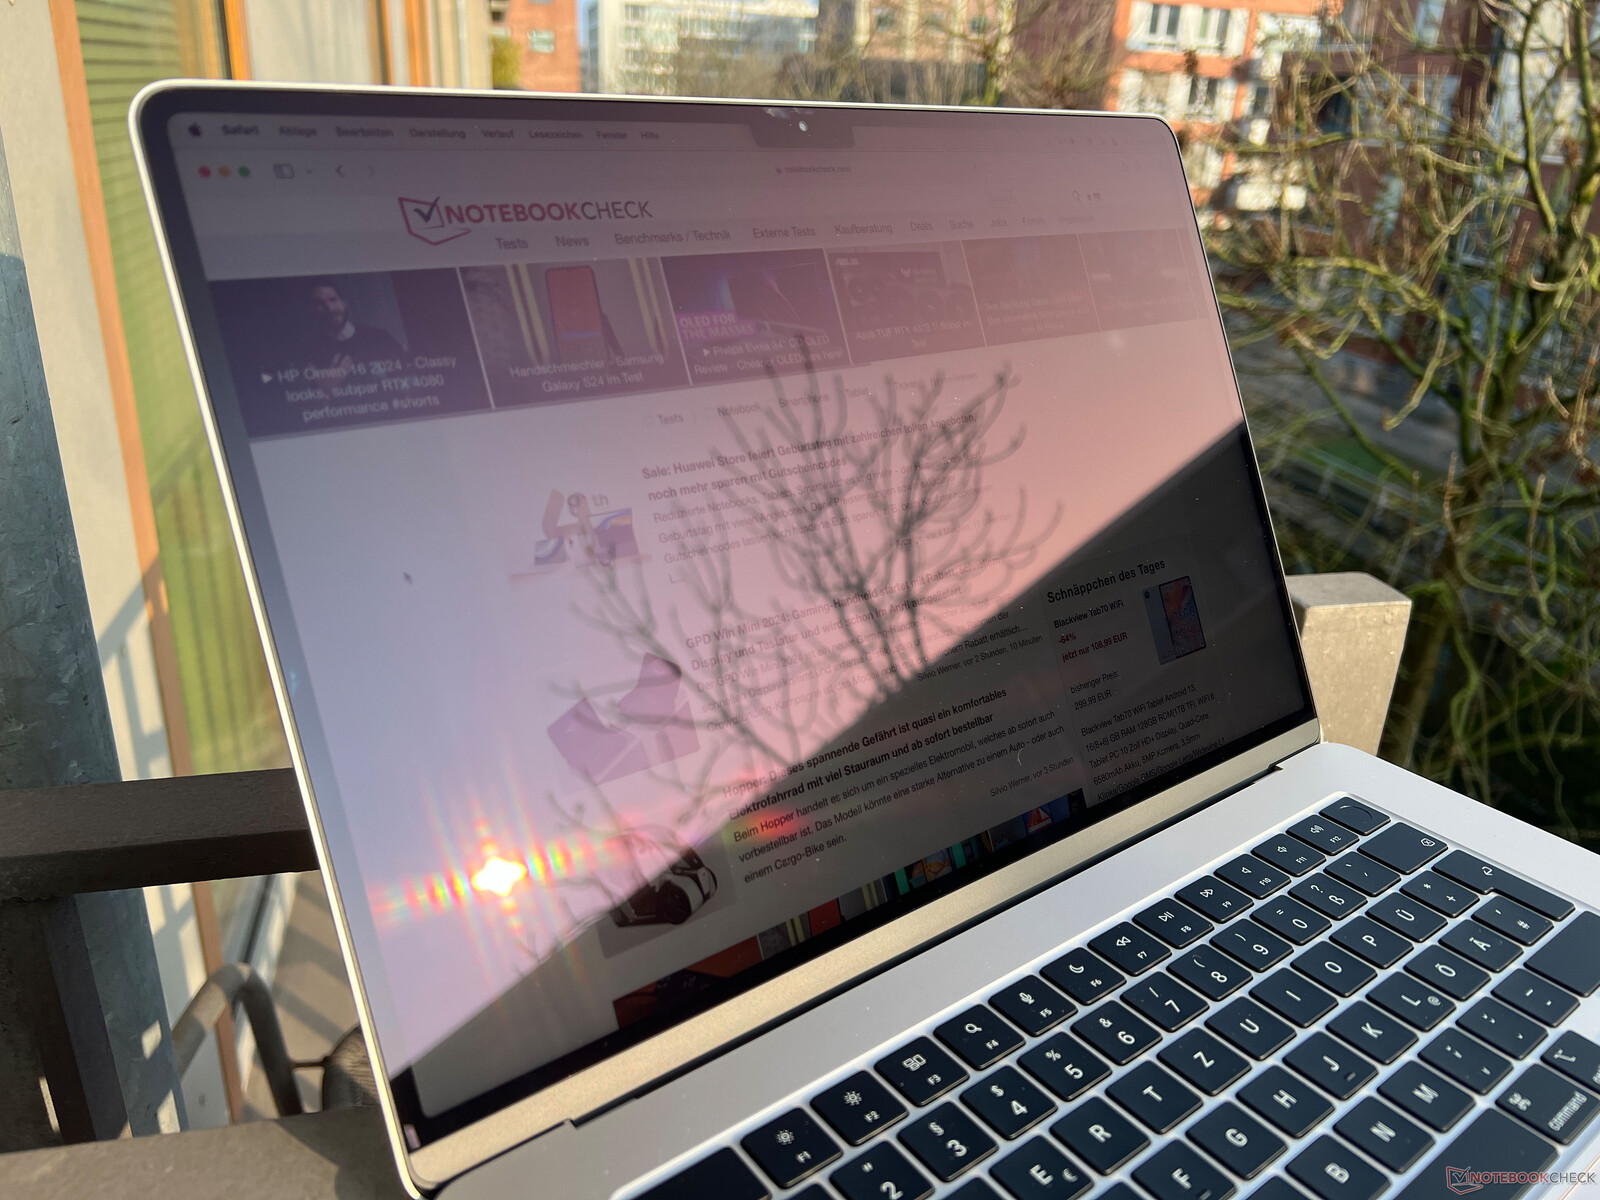
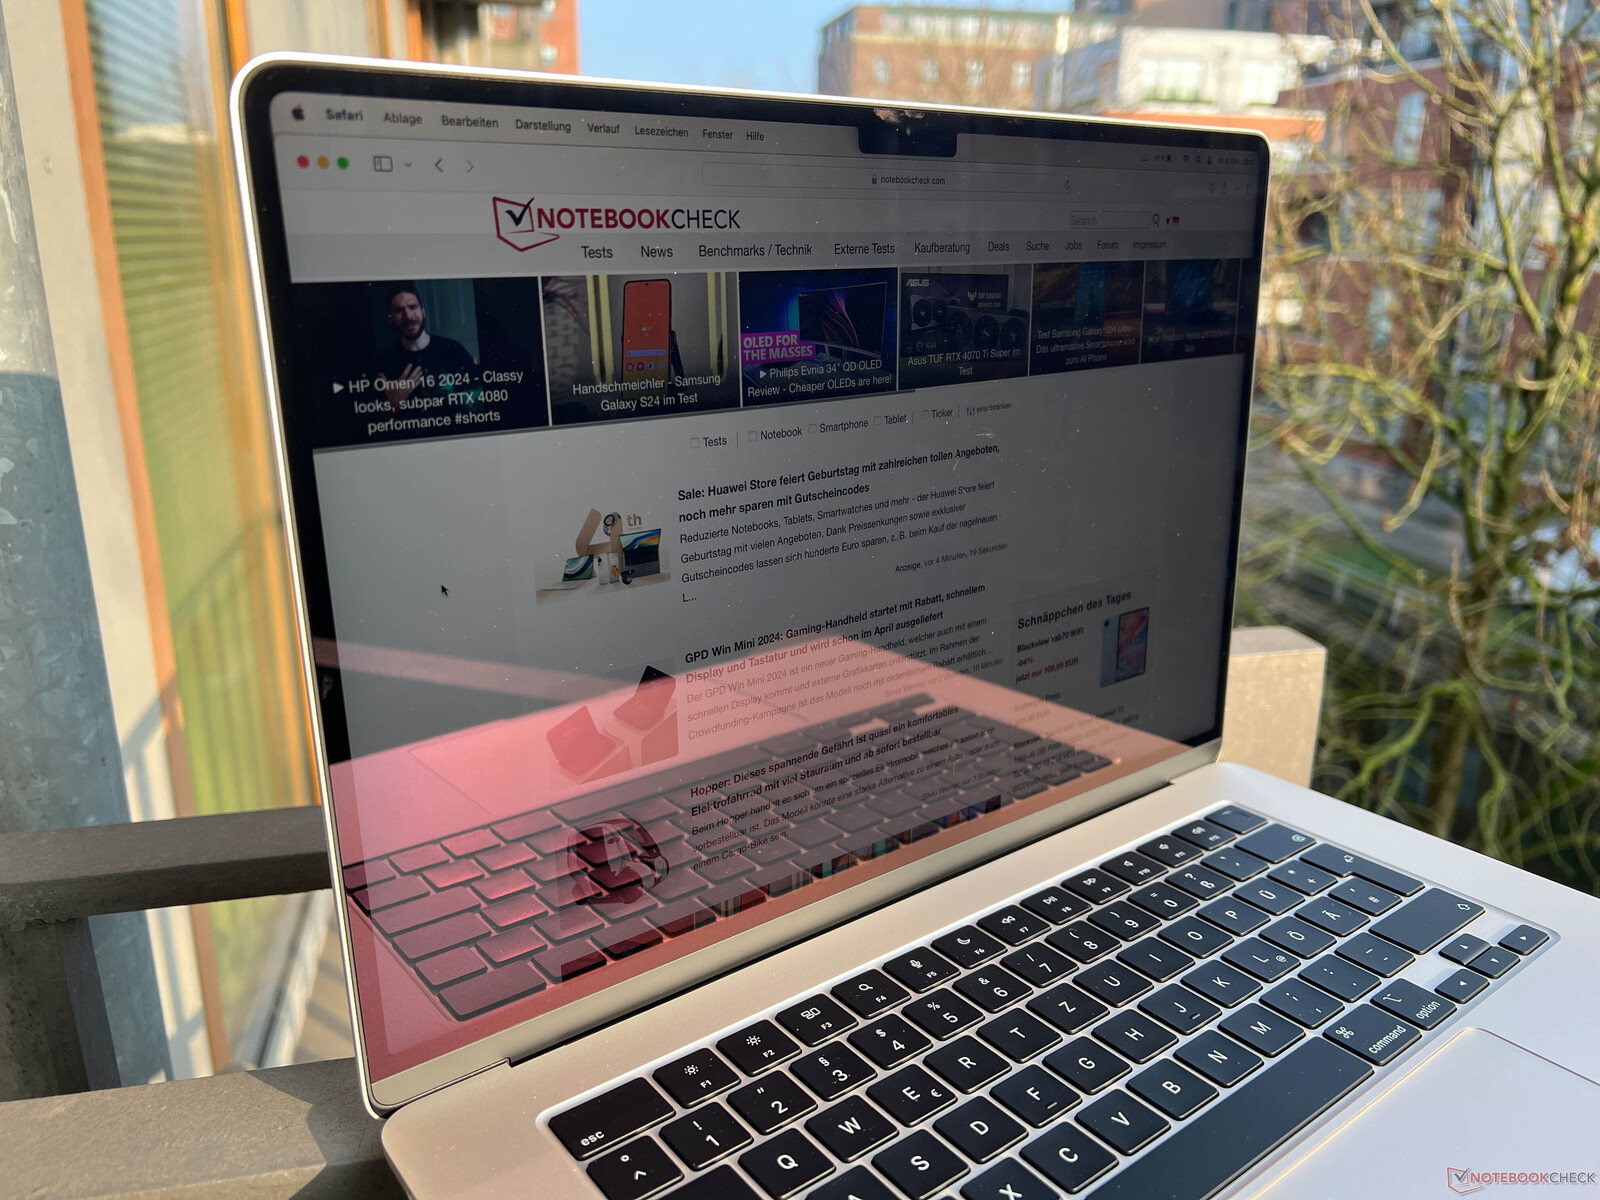
虽然 Macbook Air 的显示屏是亮面的,但它不像大多数配备 OLED 面板或触摸屏的 Windows 笔记本电脑那样反光。这意味着,只要阳光不直接照射到屏幕上,你仍然可以在明亮的环境中顺利工作。可视角度稳定性非常好。

性能 - Air 15 始终配备速度更快的 M3 SoC
与较小的 MacBook Air 13 不同,15 英寸机型只提供 M3 SoC 及其更快的 10 核图形处理器。此外,你还可以选择 8、16 或 24 GB 的焊接内存和最大容量为 2 TB 的固态硬盘。电源适配器(35 瓦或 70 瓦)的选择不会影响 MacBook Air M3 的性能。
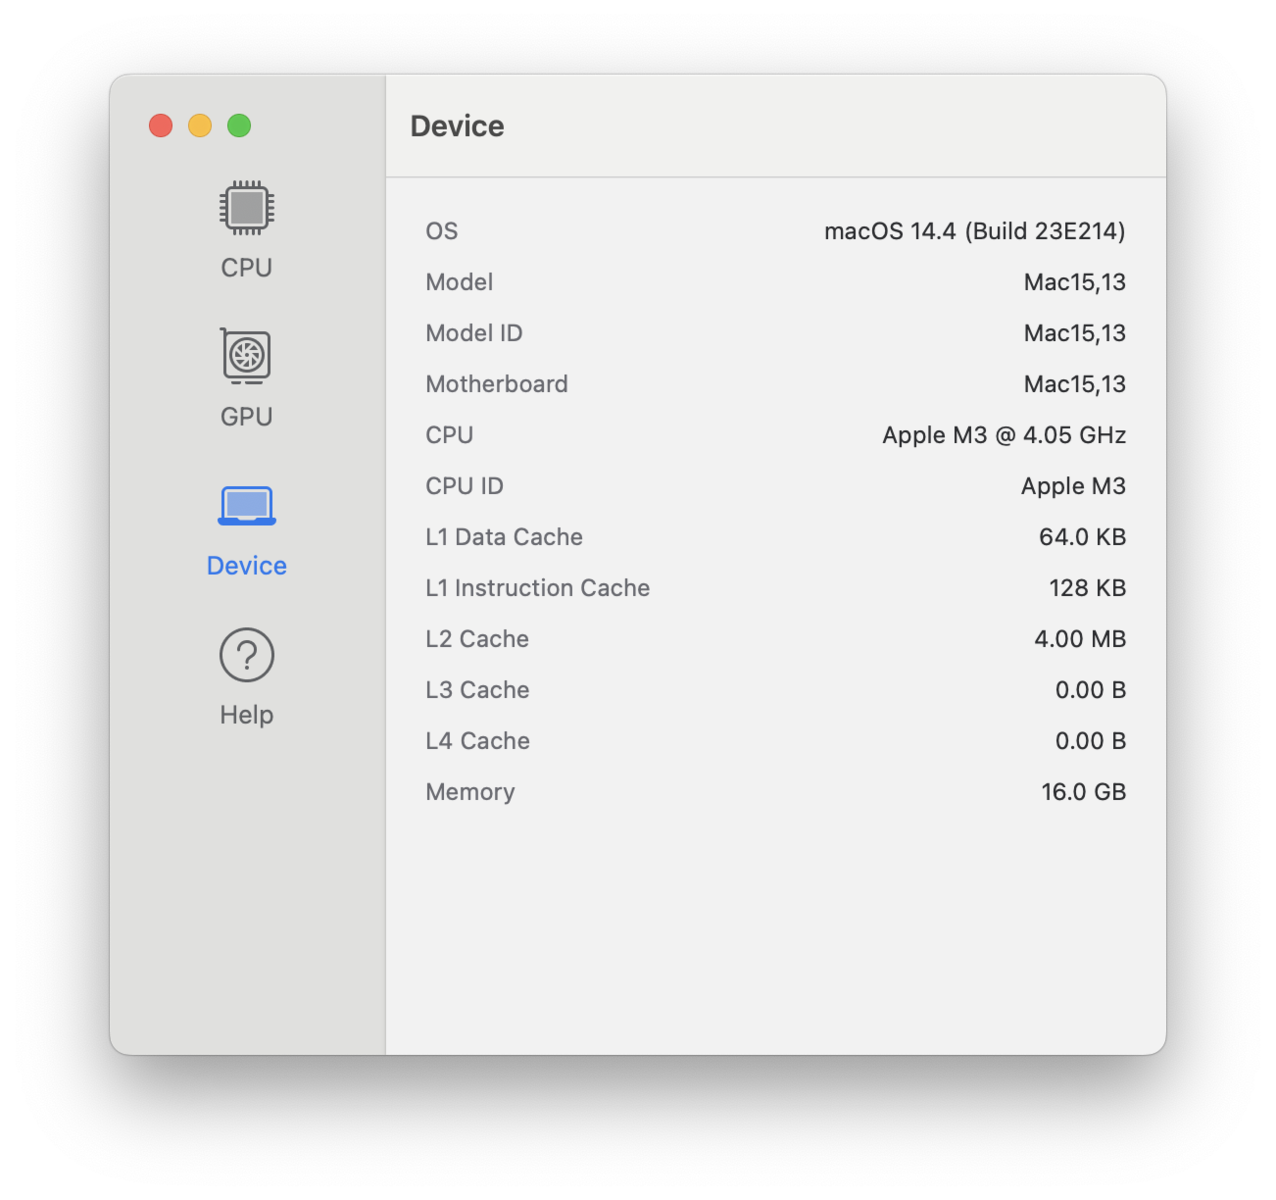
Prozessor -Apple M3 in 3 nm
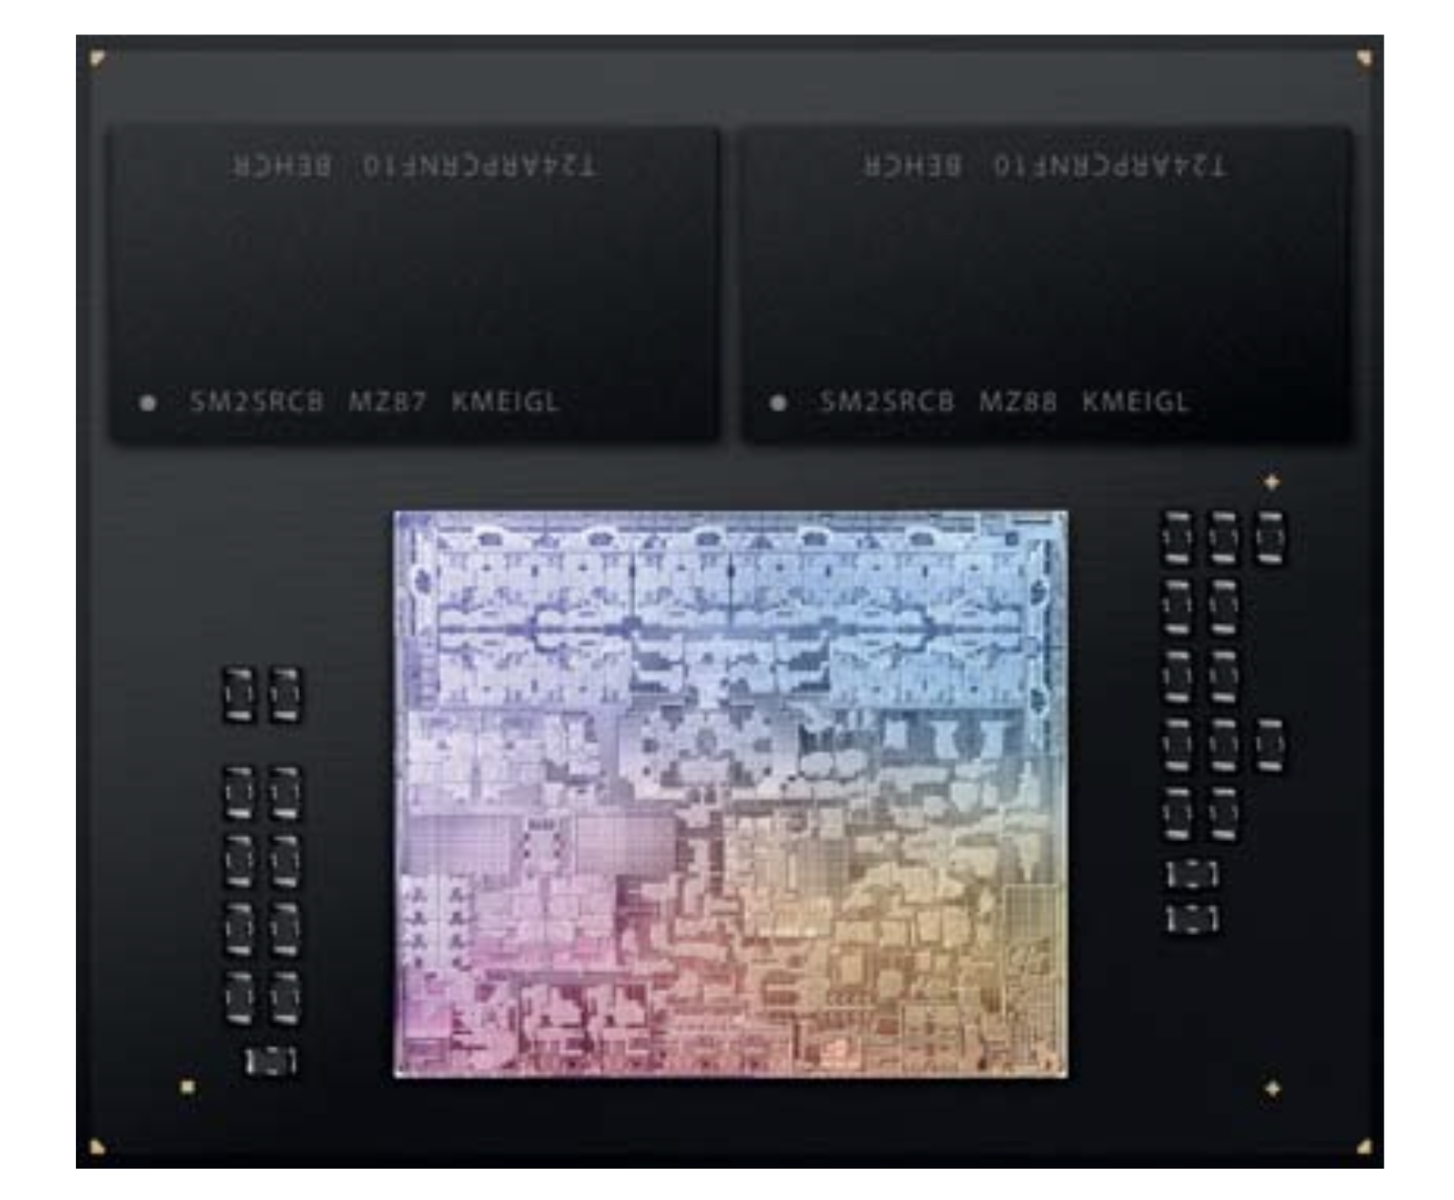
M3 SoC Apple M3 SoC是Apple 首款采用 3 纳米工艺制造的芯片。其内核配置与旧的 M2 SoC但由于改进了制造工艺,Apple 能够在不大幅增加功耗的情况下提高时钟频率。现在,四个性能内核的最高主频为 4.056 GHz(或当所有内核都处于紧张状态时约为 3.6 GHz),而四个效率内核的最高主频为 2.748 GHz。在多核测试中,处理器的功耗短暂达到约 21 瓦,然后下降并最终稳定在约 12 瓦(R23 多核:9085 点意味着减少约 12%)。这使得性能下降幅度低于 MacBook Air 13。在简短测试中,性能与 MacBook Pro 14 M3当然,由于采用了主动散热技术,性能保持稳定。
与旧版 M2 SoC 相比,性能平均提高了约 20%。结果是,在多核测试中,M3 SoC 的速度普遍低于其 16 英寸竞争对手,CPU 的功耗是后者的四倍。
在单核测试中,Apple ,性能比 M2 提高了 20%,从而缩小了与英特尔和 AMD 的差距。只有部分酷睿 i9 CPU 仍有优势。这些都是令人印象深刻的结果,尤其是考虑到 5 瓦多一点的低单核功耗。在我们的分析文章中,我们已经对 M3 SoC 的效率进行了分析。 分析文章中.在电池模式下,MacBook Air 15 M3 的 CPU 性能保持稳定。其他 CPU 基准测试 这里.
Geekbench 6.7: Multi-Core | Single-Core
Geekbench 5.5: Multi-Core | Single-Core
Cinebench 2024: CPU Multi Core | CPU Single Core
| Geekbench 6.7 / Multi-Core | |
| Apple MacBook Pro 16 2023 M3 Pro | |
| Apple MacBook Pro 14 2023 M3 Pro | |
| MSI Prestige 16 B1MG-001US | |
| Asus VivoBook S15 K5504 | |
| Average of class Subnotebook (2244 - 20325, n=62, last 2 years) | |
| Apple MacBook Air 15 M3 | |
| Average Apple M3 (11752 - 12066, n=7) | |
| LG Gram SuperSlim (2023) | |
| Apple MacBook Air 15 2023 M2 16 GB | |
| Geekbench 6.7 / Single-Core | |
| Apple MacBook Pro 16 2023 M3 Pro | |
| Apple MacBook Air 15 M3 | |
| Apple MacBook Pro 14 2023 M3 Pro | |
| Average Apple M3 (2994 - 3130, n=7) | |
| Average of class Subnotebook (960 - 4195, n=61, last 2 years) | |
| Asus VivoBook S15 K5504 | |
| Apple MacBook Air 15 2023 M2 16 GB | |
| LG Gram SuperSlim (2023) | |
| MSI Prestige 16 B1MG-001US | |
| Cinebench 2024 / CPU Multi Core | |
| Apple MacBook Pro 16 2023 M3 Pro | |
| Apple MacBook Pro 14 2023 M3 Pro | |
| MSI Prestige 16 B1MG-001US | |
| Average of class Subnotebook (148 - 1471, n=65, last 2 years) | |
| Average Apple M3 (576 - 712, n=4) | |
| Apple MacBook Air 15 M3 | |
| Apple MacBook Air 15 2023 M2 16 GB | |
| Cinebench 2024 / CPU Single Core | |
| Apple MacBook Pro 14 2023 M3 Pro | |
| Apple MacBook Pro 16 2023 M3 Pro | |
| Apple MacBook Air 15 M3 | |
| Average Apple M3 (140 - 142, n=4) | |
| Apple MacBook Air 15 2023 M2 16 GB | |
| Average of class Subnotebook (35 - 200, n=54, last 2 years) | |
系统性能
在日常使用中,旧款 MacBook Air 15 M2已经是一款速度极快的设备,M3 SoC 也是如此。最重要的是,在本地应用程序中,它的性能非常出色,而在合成基准测试中,新款 MacBook Air 15 M3 几乎总是领先于 Windows 竞争产品。
基于英特尔处理器的 Mac 应用程序可以通过 Rosetta 2 进行模拟,效果非常好。虽然在速度上存在差异(尤其是在复杂的应用程序上),但运行起来同样完美无瑕。人工智能是当前非常热门的话题,而Apple 也在其神经引擎中安装了 NPU,自 M1 芯片并将其用于信息中的单词预测。喜欢使用包括 Copilot 在内的微软办公套件的用户不必担心这个问题,因为该功能是通过云提供的,这意味着与 Windows 设备没有区别。
WebXPRT 3: Overall
WebXPRT 4: Overall
Mozilla Kraken 1.1: Total
Jetstream 2: 2.0 Total
| CrossMark / Overall | |
| Huawei MateBook 16s i9 | |
| Acer Swift Go SFG16-71 | |
| Apple MacBook Air 15 M3 | |
| Average Apple M3, Apple M3 10-Core GPU (1847 - 1857, n=3) | |
| Asus VivoBook S15 K5504 | |
| MSI Prestige 16 B1MG-001US | |
| LG Gram SuperSlim (2023) | |
| Average of class Subnotebook (365 - 2356, n=59, last 2 years) | |
| Samsung Galaxy Book3 15, Core i5-1335U | |
| CrossMark / Productivity | |
| Huawei MateBook 16s i9 | |
| Acer Swift Go SFG16-71 | |
| Apple MacBook Air 15 M3 | |
| Average Apple M3, Apple M3 10-Core GPU (1716 - 1729, n=3) | |
| Asus VivoBook S15 K5504 | |
| MSI Prestige 16 B1MG-001US | |
| LG Gram SuperSlim (2023) | |
| Average of class Subnotebook (364 - 2277, n=59, last 2 years) | |
| Samsung Galaxy Book3 15, Core i5-1335U | |
| CrossMark / Creativity | |
| Huawei MateBook 16s i9 | |
| Apple MacBook Air 15 M3 | |
| Average Apple M3, Apple M3 10-Core GPU (2183 - 2210, n=3) | |
| Asus VivoBook S15 K5504 | |
| Acer Swift Go SFG16-71 | |
| MSI Prestige 16 B1MG-001US | |
| Average of class Subnotebook (372 - 2743, n=59, last 2 years) | |
| LG Gram SuperSlim (2023) | |
| Samsung Galaxy Book3 15, Core i5-1335U | |
| CrossMark / Responsiveness | |
| Huawei MateBook 16s i9 | |
| Acer Swift Go SFG16-71 | |
| LG Gram SuperSlim (2023) | |
| MSI Prestige 16 B1MG-001US | |
| Asus VivoBook S15 K5504 | |
| Apple MacBook Air 15 M3 | |
| Average Apple M3, Apple M3 10-Core GPU (1364 - 1367, n=3) | |
| Average of class Subnotebook (312 - 1854, n=59, last 2 years) | |
| Samsung Galaxy Book3 15, Core i5-1335U | |
| WebXPRT 3 / Overall | |
| Apple MacBook Air 15 M3 | |
| Average Apple M3, Apple M3 10-Core GPU (423 - 448, n=3) | |
| Huawei MateBook 16s i9 | |
| Average of class Subnotebook (156 - 530, n=55, last 2 years) | |
| Asus VivoBook S15 K5504 | |
| Acer Swift Go SFG16-71 | |
| MSI Prestige 16 B1MG-001US | |
| LG Gram SuperSlim (2023) | |
| Samsung Galaxy Book3 15, Core i5-1335U | |
| WebXPRT 4 / Overall | |
| Apple MacBook Air 15 M3 | |
| Average Apple M3, Apple M3 10-Core GPU (313 - 315, n=2) | |
| Huawei MateBook 16s i9 | |
| Average of class Subnotebook (132 - 378, n=60, last 2 years) | |
| Acer Swift Go SFG16-71 | |
| MSI Prestige 16 B1MG-001US | |
| Samsung Galaxy Book3 15, Core i5-1335U | |
| LG Gram SuperSlim (2023) | |
| Mozilla Kraken 1.1 / Total | |
| Samsung Galaxy Book3 15, Core i5-1335U | |
| MSI Prestige 16 B1MG-001US | |
| LG Gram SuperSlim (2023) | |
| Asus VivoBook S15 K5504 | |
| Acer Swift Go SFG16-71 | |
| Average of class Subnotebook (234 - 1104, n=60, last 2 years) | |
| Huawei MateBook 16s i9 | |
| Average Apple M3, Apple M3 10-Core GPU (363 - 373, n=3) | |
| Apple MacBook Air 15 M3 | |
| Jetstream 2 / 2.0 Total | |
| Average of class Subnotebook (117 - 476, n=28, last 2 years) | |
| Apple MacBook Air 15 M3 | |
| Average Apple M3, Apple M3 10-Core GPU (305 - 318, n=3) | |
| LG Gram SuperSlim (2023) | |
| Samsung Galaxy Book3 15, Core i5-1335U | |
* ... smaller is better
大容量存储器
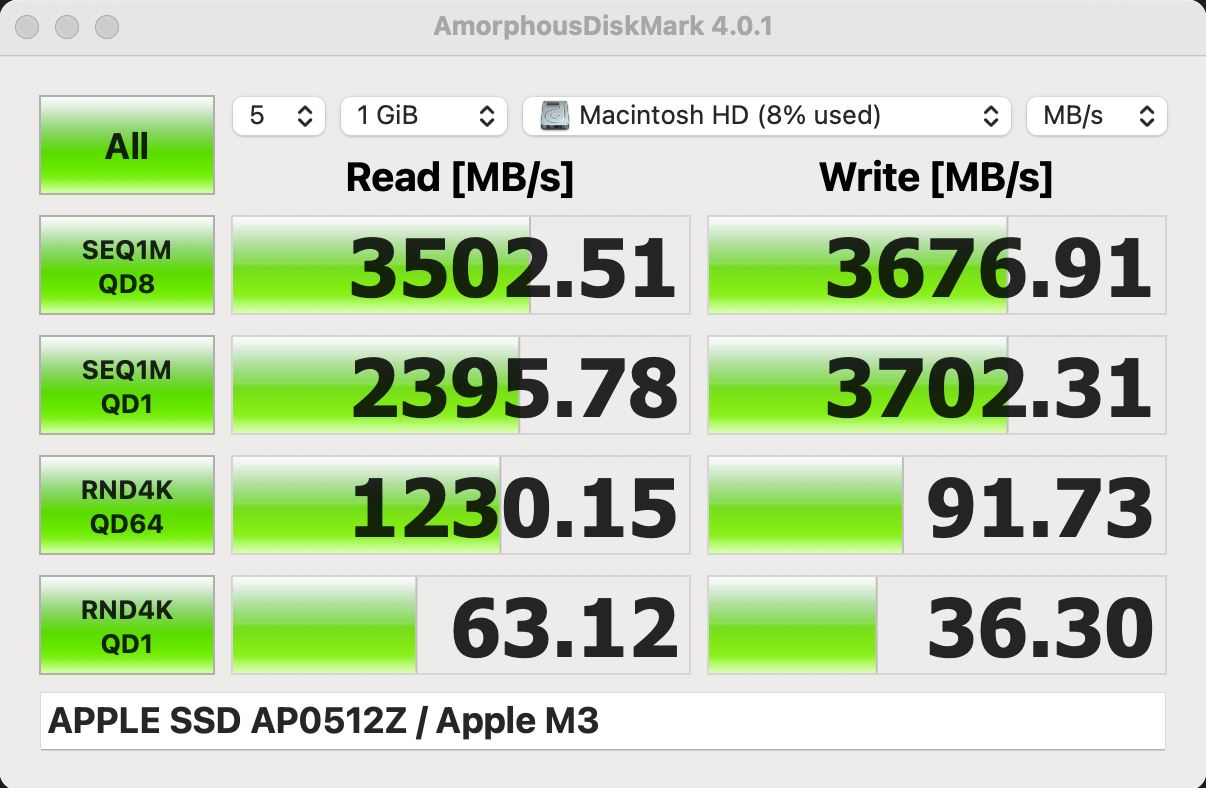
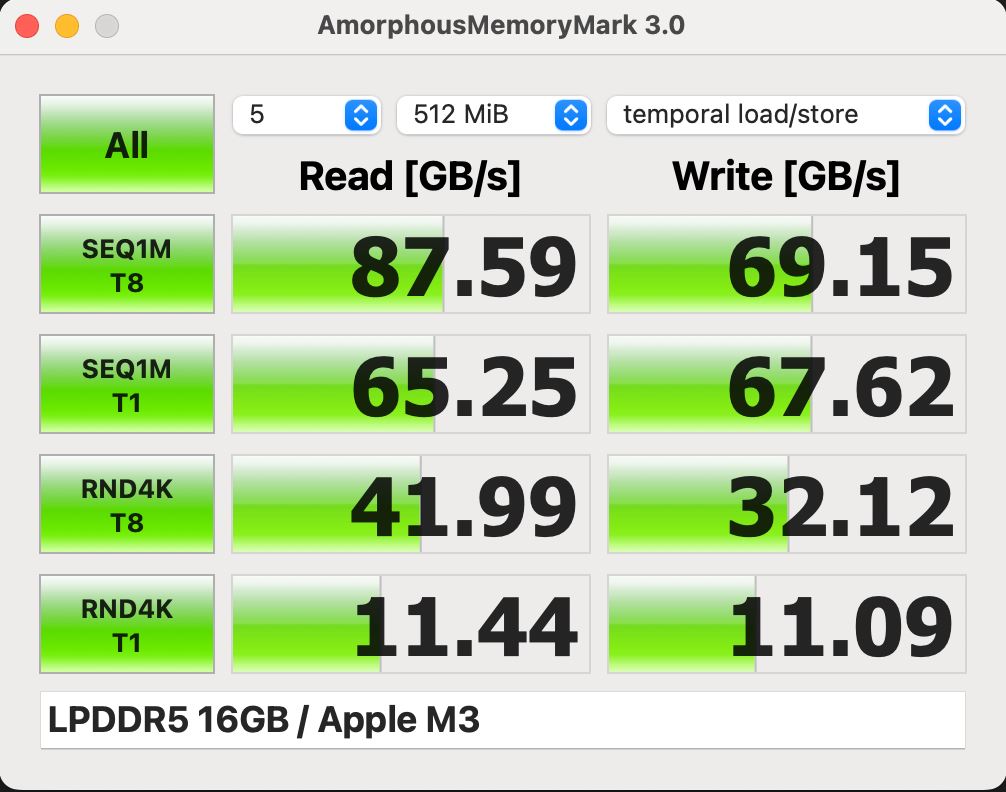
与 Pro 机型不同,Apple 的 Air 采用了 PCIe 3.0 固态硬盘。我们的评测设备安装了 512 GB 版本(AP0512Z),其传输速度达到了预期水平,最高可达 3.5 GB/s。在日常使用中,这意味着没有任何限制。同样,我们预计 256 GB 型号的性能会大大降低(约 50%),我们将尽快对其进行检查。首次启动后,用户有 465 GB 的可用空间。Air M3 可配置最大容量为 2 TB 的固态硬盘。其他固态硬盘基准测试 这里.
图形卡
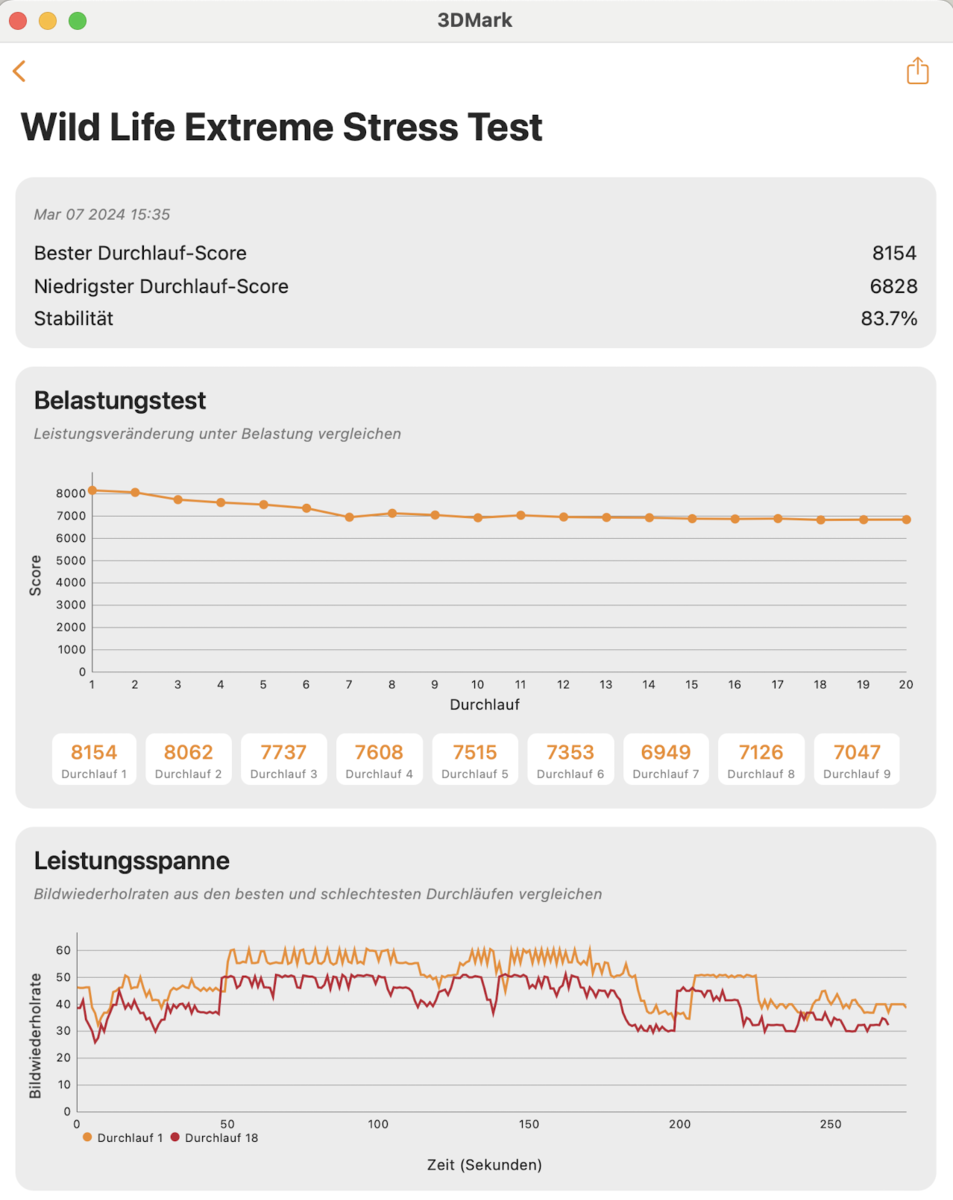
我们的评测设备配备了 10 核 M3 GPU,我们已经熟悉了它。 MacBook Pro 14 M3.最大功耗约为 15 瓦,性能基本与 MacBook Pro 相同。不过,在连续负载情况下,Air 的性能也会略有下降。在 3DMark WildLife Extreme 压力测试中,运行 20 次后,Air 的性能下降了约 17%,这使它比较小的 MBA 13 M3 更稳定。 更小的 MBA 13.在图形处理器性能方面,我们也观察到与旧的 10 核 M2 图形处理器相比有 20% 的优势。在电池模式下,图形处理性能保持不变,更多基准测试请点击这里。
MacBook 上的游戏速度正在慢慢加快,《全面战争:法老》或《博德之门 3》等游戏都可以在 MacBook 上运行。但是,《博德之门 3》在高分辨率下的要求过高,这意味着你必须激活 FSR。这样即使在 1080p/high 下也能达到 35fps 左右。不过,使用 FSR 时,至少应选择 "质量"设置,否则图形质量会受到明显影响。古墓丽影》或Witcher 3 等模拟游戏也能在 MacBook 上运行,但根据游戏名称的不同,可能会有一些限制,性能也会受到一定影响。
| Blender / v3.3 Classroom METAL | |
| Apple MacBook Air 15 2023 M2 16 GB | |
| Apple MacBook Air 15 M3 | |
| Average Apple M3 10-Core GPU (121 - 134, n=3) | |
| Average of class Subnotebook (76.3 - 227, n=5, last 2 years) | |
| Apple MacBook Pro 14 2023 M2 Pro | |
| Apple MacBook Pro 14 2023 M3 Pro | |
| Apple MacBook Pro 16 2023 M3 Pro | |
| Blender / v3.3 Classroom CPU | |
| Samsung Galaxy Book3 15, Core i5-1335U | |
| LG Gram SuperSlim (2023) | |
| Apple MacBook Air 15 2023 M2 16 GB | |
| Average Apple M3 10-Core GPU (491 - 761, n=3) | |
| Average of class Subnotebook (241 - 861, n=59, last 2 years) | |
| Apple MacBook Air 15 M3 | |
| Acer Swift Go SFG16-71 | |
| Asus VivoBook S15 K5504 | |
| MSI Prestige 16 B1MG-001US | |
| Apple MacBook Pro 14 2023 M3 Pro | |
| Huawei MateBook 16s i9 | |
| Apple MacBook Pro 14 2023 M2 Pro | |
| Apple MacBook Pro 16 2023 M3 Pro | |
* ... smaller is better
| low | med. | high | ultra | |
|---|---|---|---|---|
| The Witcher 3 (2015) | 36 | 24 | ||
| Shadow of the Tomb Raider (2018) | 113 | 44 | 38 | 32 |
| Baldur's Gate 3 (2023) | 32 | 26 | 22 | 19 |
| Total War Pharaoh (2023) | 133 | 83 | 44 | 35 |
排放 - 静音和良好的扬声器
噪音排放
与速度相当的 Windows 设备相比,MacBook Air 15 的最大优势仍然是其被动散热。无论你用它做什么(使用两台外接显示器时也是如此),它始终是静音的,没有任何电子噪音。
| Apple MacBook Air 15 M3 M3 10-Core GPU, M3, Apple SSD AP0512Z | Asus VivoBook S15 K5504 Iris Xe G7 96EUs, i9-13900H, WD PC SN560 SDDPNQE-1T00 | MSI Prestige 16 B1MG-001US Arc 8-Core, Ultra 7 155H, Samsung PM9A1 MZVL22T0HBLB | Acer Swift Go SFG16-71 Iris Xe G7 96EUs, i7-13700H, Micron 2400 MTFDKBA1T0QFM | Huawei MateBook 16s i9 Iris Xe G7 96EUs, i9-13900H, 321JN1024GB-TX01 | LG Gram SuperSlim (2023) Iris Xe G7 96EUs, i7-1360P, SK hynix PC801 HFS001TEJ9X101N | Samsung Galaxy Book3 15, Core i5-1335U Iris Xe G7 80EUs, i5-1335U, Samsung PM991a MZ9LQ512HBLU-00BD1 | |
|---|---|---|---|---|---|---|---|
| Noise | |||||||
| off / environment * (dB) | 25.3 | 24.5 | 25.7 | 25.7 | 25.2 | 25.2 | |
| Idle Minimum * (dB) | 25.3 | 24.5 | 26.1 | 25.7 | 25.2 | 25.2 | |
| Idle Average * (dB) | 25.3 | 26.3 | 26.1 | 28.4 | 25.2 | 25.2 | |
| Idle Maximum * (dB) | 25.3 | 26.3 | 27.2 | 28.4 | 25.2 | 31.6 | |
| Load Average * (dB) | 43.5 | 36.5 | 44.2 | 45.3 | 43.1 | 45.4 | |
| Load Maximum * (dB) | 50.75 | 52.9 | 47.5 | 45.6 | 43.3 | 45.4 | |
| Witcher 3 ultra * (dB) | 46.3 |
* ... smaller is better
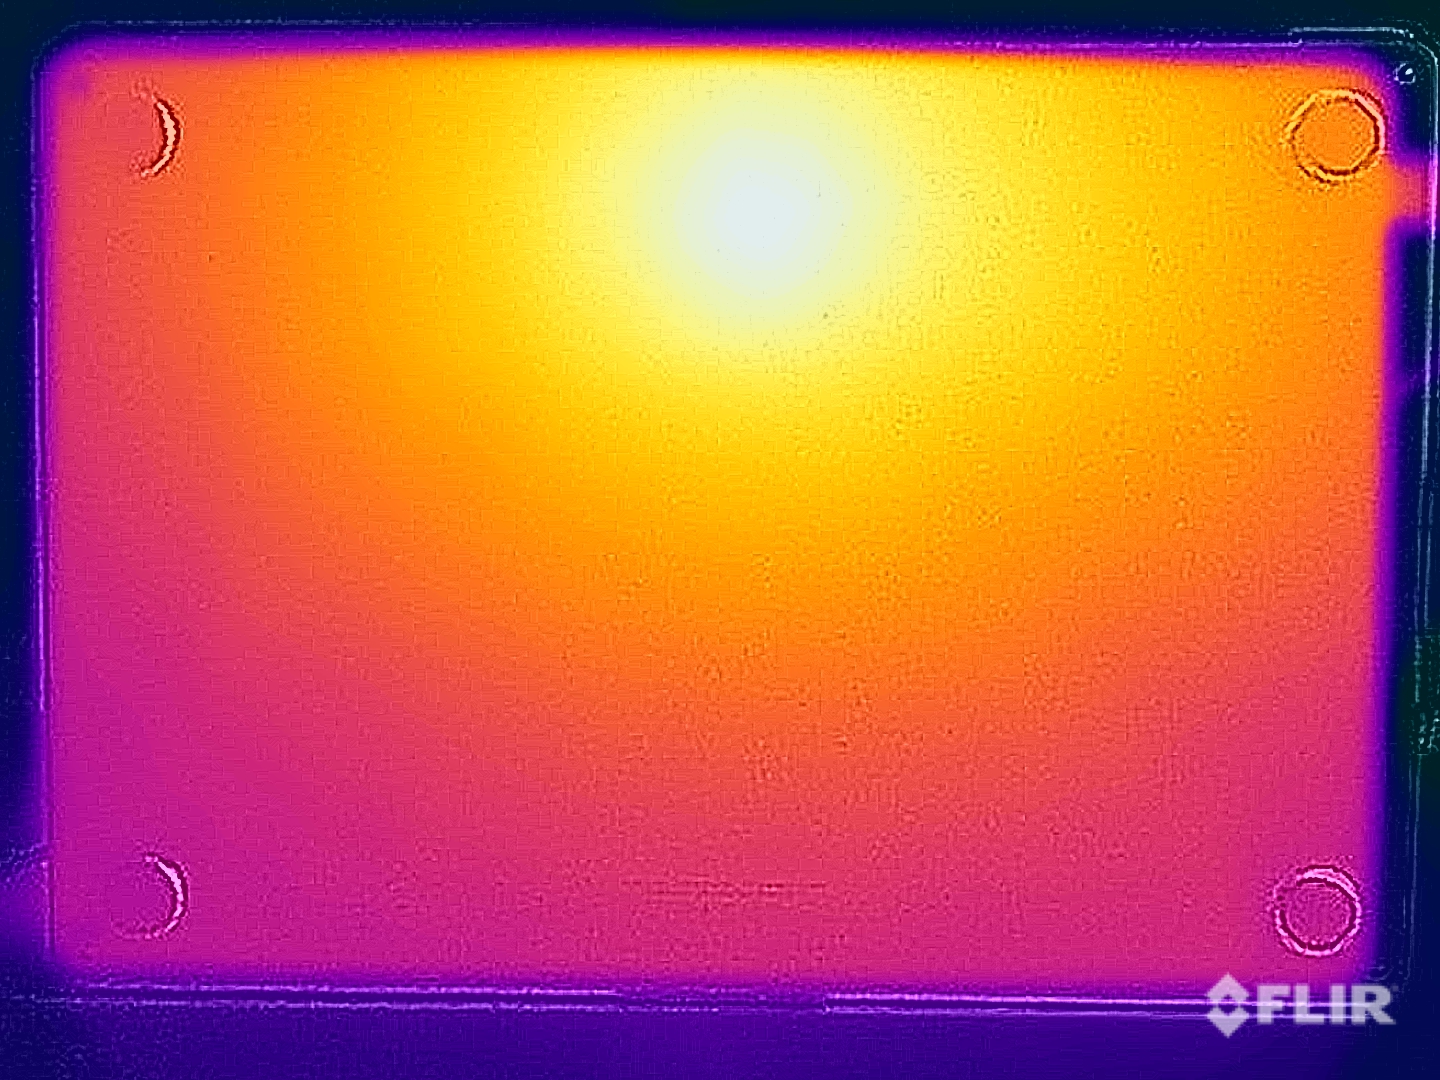
温度
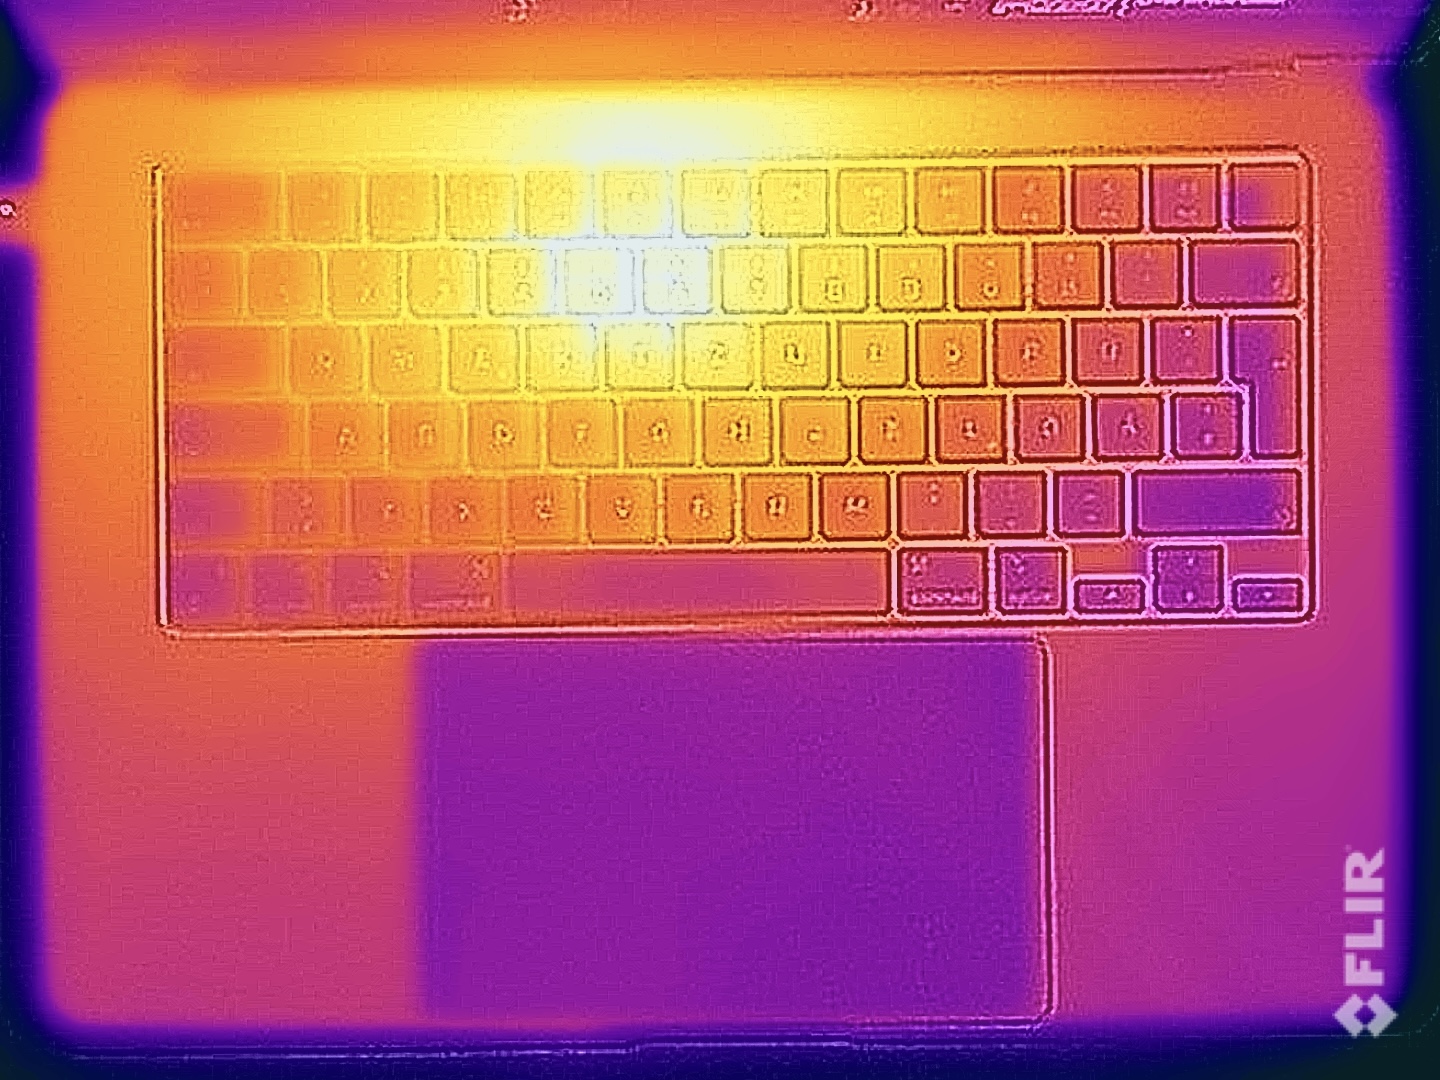
尽管采用了被动散热,Apple ,但机箱温度仍然得到了控制,在空闲运行或执行要求不高的任务时,笔记本电脑几乎不会发热。在一小时的压力测试后,我们在底座上下两侧的中上部区域测得的热点温度接近 44 °C。当然,这很明显,但在使用时不会造成任何限制。
(±) The maximum temperature on the upper side is 44.3 °C / 112 F, compared to the average of 35.9 °C / 97 F, ranging from 21.4 to 59 °C for the class Subnotebook.
(±) The bottom heats up to a maximum of 43.4 °C / 110 F, compared to the average of 39.2 °C / 103 F
(+) In idle usage, the average temperature for the upper side is 22.8 °C / 73 F, compared to the device average of 30.8 °C / 87 F.
(+) The palmrests and touchpad are reaching skin temperature as a maximum (32.7 °C / 90.9 F) and are therefore not hot.
(-) The average temperature of the palmrest area of similar devices was 28.2 °C / 82.8 F (-4.5 °C / -8.1 F).
| Apple MacBook Air 15 M3 Apple M3, Apple M3 10-Core GPU | Asus VivoBook S15 K5504 Intel Core i9-13900H, Intel Iris Xe Graphics G7 96EUs | MSI Prestige 16 B1MG-001US Intel Core Ultra 7 155H, Intel Arc 8-Core iGPU | Acer Swift Go SFG16-71 Intel Core i7-13700H, Intel Iris Xe Graphics G7 96EUs | Huawei MateBook 16s i9 Intel Core i9-13900H, Intel Iris Xe Graphics G7 96EUs | LG Gram SuperSlim (2023) Intel Core i7-1360P, Intel Iris Xe Graphics G7 96EUs | Samsung Galaxy Book3 15, Core i5-1335U Intel Core i5-1335U, Intel Iris Xe Graphics G7 80EUs | |
|---|---|---|---|---|---|---|---|
| Heat | -50% | -7% | -22% | -17% | -33% | -19% | |
| Maximum Upper Side * (°C) | 44.3 | 51.5 -16% | 48.8 -10% | 44.4 -0% | 43.2 2% | 43.9 1% | 45.9 -4% |
| Maximum Bottom * (°C) | 43.4 | 62.4 -44% | 47.6 -10% | 48 -11% | 44.7 -3% | 50.4 -16% | 43.5 -0% |
| Idle Upper Side * (°C) | 23.1 | 41.7 -81% | 24.2 -5% | 31.9 -38% | 32.1 -39% | 35.8 -55% | 31.1 -35% |
| Idle Bottom * (°C) | 23.3 | 37.2 -60% | 23.6 -1% | 31.9 -37% | 30.1 -29% | 37.5 -61% | 31.6 -36% |
* ... smaller is better
压力测试
在综合负载情况下,新款 MacBook Air 15 M3 的性能比前代产品略胜一筹,而且较大的机型还能比较小的机型更长时间地保持这种性能。与 MacBook Air 13 M3一样,MacBook 现在优先考虑 GPU 性能,而它的前代产品 前代产品CPU 和 GPU 之间的关系更为平衡。
发言人
大型 MacBook Air 继续提供 6 扬声器音响系统,音效依然非常宽敞和出色。体积较大的 MacBook Pro 16在这方面提供了更好的效果,但考虑到 Air 的底座非常纤薄,其音效也非常出色。
Apple MacBook Air 15 M3 audio analysis
(+) | speakers can play relatively loud (85.1 dB)
Bass 100 - 315 Hz
(±) | reduced bass - on average 8.8% lower than median
(+) | bass is linear (5.8% delta to prev. frequency)
Mids 400 - 2000 Hz
(+) | balanced mids - only 2.3% away from median
(+) | mids are linear (3.7% delta to prev. frequency)
Highs 2 - 16 kHz
(+) | balanced highs - only 3.5% away from median
(+) | highs are linear (3.5% delta to prev. frequency)
Overall 100 - 16.000 Hz
(+) | overall sound is linear (8.4% difference to median)
Compared to same class
» 2% of all tested devices in this class were better, 1% similar, 97% worse
» The best had a delta of 5%, average was 18%, worst was 53%
Compared to all devices tested
» 2% of all tested devices were better, 1% similar, 97% worse
» The best had a delta of 4%, average was 24%, worst was 134%
Huawei MateBook 16s i9 audio analysis
(+) | speakers can play relatively loud (87.6 dB)
Bass 100 - 315 Hz
(±) | reduced bass - on average 10.5% lower than median
(±) | linearity of bass is average (10.6% delta to prev. frequency)
Mids 400 - 2000 Hz
(+) | balanced mids - only 4.1% away from median
(+) | mids are linear (5% delta to prev. frequency)
Highs 2 - 16 kHz
(±) | higher highs - on average 5.4% higher than median
(+) | highs are linear (6.1% delta to prev. frequency)
Overall 100 - 16.000 Hz
(+) | overall sound is linear (11.7% difference to median)
Compared to same class
» 19% of all tested devices in this class were better, 3% similar, 77% worse
» The best had a delta of 5%, average was 17%, worst was 45%
Compared to all devices tested
» 8% of all tested devices were better, 3% similar, 89% worse
» The best had a delta of 4%, average was 24%, worst was 134%
Apple MacBook Pro 16 2023 M3 Pro audio analysis
(+) | speakers can play relatively loud (84.3 dB)
Bass 100 - 315 Hz
(±) | reduced bass - on average 5% lower than median
(+) | bass is linear (5.6% delta to prev. frequency)
Mids 400 - 2000 Hz
(+) | balanced mids - only 1.2% away from median
(+) | mids are linear (3.1% delta to prev. frequency)
Highs 2 - 16 kHz
(+) | balanced highs - only 2.4% away from median
(+) | highs are linear (2.4% delta to prev. frequency)
Overall 100 - 16.000 Hz
(+) | overall sound is linear (5.3% difference to median)
Compared to same class
» 1% of all tested devices in this class were better, 1% similar, 98% worse
» The best had a delta of 5%, average was 17%, worst was 45%
Compared to all devices tested
» 0% of all tested devices were better, 0% similar, 100% worse
» The best had a delta of 4%, average was 24%, worst was 134%
能源管理 - 运行时间长
耗电量
在全亮度条件下,功耗比旧型号略高一些(全亮度条件下约为 1 瓦),但最大亮度仅略有提高。在负载情况下,35 瓦的电源适配器再次成为限制因素,在使用功率更大的电源适配器进行压力测试之初,我们测得的功耗为 66 瓦,随后稳步下降。在使用 35 瓦电源适配器时,电池必须对差异进行补偿。
| Off / Standby | |
| Idle | |
| Load |
|
Key:
min: | |
| Apple MacBook Air 15 M3 M3, M3 10-Core GPU, Apple SSD AP0512Z, IPS, 2880x1864, 15.3" | Apple MacBook Air 15 2023 M2 16 GB M2, M2 10-Core GPU, Apple SSD AP1024Z, IPS, 2880x1864, 15.3" | Asus VivoBook S15 K5504 i9-13900H, Iris Xe G7 96EUs, WD PC SN560 SDDPNQE-1T00, OLED, 2880x1620, 15.6" | MSI Prestige 16 B1MG-001US Ultra 7 155H, Arc 8-Core, Samsung PM9A1 MZVL22T0HBLB, IPS, 2560x1600, 16" | Acer Swift Go SFG16-71 i7-13700H, Iris Xe G7 96EUs, Micron 2400 MTFDKBA1T0QFM, OLED, 3200x2000, 16" | Huawei MateBook 16s i9 i9-13900H, Iris Xe G7 96EUs, 321JN1024GB-TX01, IPS, 2560x1680, 16" | LG Gram SuperSlim (2023) i7-1360P, Iris Xe G7 96EUs, SK hynix PC801 HFS001TEJ9X101N, OLED, 1920x1080, 15.6" | Samsung Galaxy Book3 15, Core i5-1335U i5-1335U, Iris Xe G7 80EUs, Samsung PM991a MZ9LQ512HBLU-00BD1, IPS, 1920x1080, 15.6" | Average Apple M3 10-Core GPU | Average of class Subnotebook | |
|---|---|---|---|---|---|---|---|---|---|---|
| Power Consumption | 6% | -92% | -67% | -67% | -104% | -29% | -2% | -2% | -20% | |
| Idle Minimum * (Watt) | 2.15 | 2.2 -2% | 5.73 -167% | 3 -40% | 5.8 -170% | 5.8 -170% | 4.2 -95% | 3.5 -63% | 2.1 ? 2% | 3.86 ? -80% |
| Idle Average * (Watt) | 11.2 | 10 11% | 14.5 -29% | 9.5 15% | 6 46% | 7.7 31% | 8.9 21% | 7 37% | 10.6 ? 5% | 6.61 ? 41% |
| Idle Maximum * (Watt) | 11.5 | 10.1 12% | 15.6 -36% | 12 -4% | 6.9 40% | 10.6 8% | 10.3 10% | 7.6 34% | 10.9 ? 5% | 8 ? 30% |
| Load Average * (Watt) | 35.8 | 33.6 6% | 40.5 -13% | 68.3 -91% | 59 -65% | 76.9 -115% | 47 -31% | 33 8% | 35.5 ? 1% | 42.2 ? -18% |
| Witcher 3 ultra * (Watt) | 29.6 | 27.8 6% | 74.9 -153% | 59.8 -102% | 61.1 -106% | 76.7 -159% | 43.8 -48% | 32.7 -10% | ||
| Load Maximum * (Watt) | 37.2 | 37.2 -0% | 94 -153% | 104.8 -182% | 92 -147% | 118 -217% | 49 -32% | 44 -18% | 46.4 ? -25% | 64.5 ? -73% |
* ... smaller is better
Power consumption Witcher 3 / stress test
Power consumption with an external monitor
电池寿命
电池容量仍为 66.5 Wh,Wi-Fi 在 150 cd/m² 下的运行时间约为 17 小时(最大亮度降低了 7 大级和 3 小级),比上一代产品长了几分钟。微星 Prestige 16 能比前者多出约 80 分钟,但电池容量也大了约 50%。在全屏亮度下,我们记录了 6 小时 40 分钟,比旧款短了半小时,全屏亮度下的空闲耗电量略高。我们将在稍后提供进一步的电池运行时间。
在打开笔记本电脑的情况下,随机提供的 35 瓦电源适配器只需要不到 3 个小时就能为设备完全充电。如果使用功率更大的电源适配器,这个时间可以缩短到 2 小时左右。
| Apple MacBook Air 15 M3 M3, M3 10-Core GPU, 66.5 Wh | Apple MacBook Air 15 2023 M2 16 GB M2, M2 10-Core GPU, 66.5 Wh | Asus VivoBook S15 K5504 i9-13900H, Iris Xe G7 96EUs, 75 Wh | MSI Prestige 16 B1MG-001US Ultra 7 155H, Arc 8-Core, 99.9 Wh | Acer Swift Go SFG16-71 i7-13700H, Iris Xe G7 96EUs, 65 Wh | Huawei MateBook 16s i9 i9-13900H, Iris Xe G7 96EUs, 84 Wh | LG Gram SuperSlim (2023) i7-1360P, Iris Xe G7 96EUs, 60 Wh | Samsung Galaxy Book3 15, Core i5-1335U i5-1335U, Iris Xe G7 80EUs, 54 Wh | Average of class Subnotebook | |
|---|---|---|---|---|---|---|---|---|---|
| Battery runtime | 3% | -24% | 6% | -40% | -17% | -9% | -50% | -20% | |
| H.264 (h) | 18.6 | 16.8 -10% | 9 -52% | 14.7 -21% | 7.1 -62% | 15.4 ? -17% | |||
| WiFi v1.3 (h) | 16.9 | 16.6 -2% | 8.5 -50% | 18.3 8% | 7.8 -54% | 13.1 -22% | 12.5 -26% | 6.6 -61% | 14 ? -17% |
| Load (h) | 2.7 | 3.3 22% | 3.5 30% | 2.8 4% | 2 -26% | 2.4 -11% | 3.2 19% | 2 -26% | 1.969 ? -27% |
Pros
Cons
评语:MacBook Air 15 从 M3 中获益,但价格依然昂贵
MacBook Air 15 M3 没有给人带来任何惊喜,虽然它配备了 M3 SoC 和更快的 Wi-Fi 模块,但并不值得升级。 MacBook Air 15 M2 - 相比,它并不值得升级。与较小的 MacBook Air 13 M3 不同的是,不得不说的是,总体而言,竞争对手的多核性能更好,而且只要安装了专用显卡,在图形处理性能方面就能享受到优势。然而,这并不是 Air 的目标,Apple ,继续努力保持与 Pro 机型的距离。这一点在端口数量有限的情况下尤为明显。
不过,MacBook Air 的优势也是显而易见的,因为它非常纤薄,而且由于采用了被动散热技术,设备始终保持静音。目前还没有任何一款被动散热的 Windows 设备能达到这样的性能指标。当然,也有其他设备能提供更高的性能、更好的屏幕或更长的电池续航时间,但通常不会集于一身。毋庸置疑,Air 并不是每个用户的理想选择。但是,如果你正在寻找一款能够处理日常任务的设备,那么你就必须努力从其他制造商那里找到一款性能相当、功能齐全的产品。
Apple MacBook Air 15 采用 M3 处理器,速度更快。尽管价格仍然很高,而且你不得不在某些方面(如端口)做出妥协,但如果你正在寻找一款适合日常使用的大屏幕、持续静音的伴侣,那么你会再次发现它是一款非常出色和全面的产品。
说到显示屏,Apple ,虽然速度缓慢,但确实有些落后于竞争对手。IPS 面板的图像质量仍然不错,PWM 也没有出现。不过,对于一款高端设备来说,60 Hz 的频率已经不能算是最新的了,同样也不支持 HDR 内容。M3 处理器的性能也没有完全保持稳定,但情况要比较小的 MacBook Air M3 稍好一些。Windows 系统的竞争对手在使用一段时间后也会出现性能下降,尤其是在多核情况下。
基本机型的价格为 1,299 美元,配备 8 GB 内存和 256 GB 固态硬盘。对于简单的任务来说,这个价格也许足够了,但它已经跟不上时代的步伐了。我们的评测机则有趣得多,因为它配备了 16 GB 内存和 512 GB 固态硬盘。最重要的是,它现在是预配置机型(以前只有 8/256 GB 和 8/512 GB),而且该机型现在还将作为标准版,届时也将打折。新款 Air 在发布时已经有了更便宜的价格。
价格和供应情况
全新 MacBook Air 15 M3 现已上市。我们的评测配置零售价为 1,699 美元,可在Apple .com 上购买。.基本型号在亚马逊的售价为 1,299 美元。
Apple MacBook Air 15 M3
- 03/09/2024 v7 (old)
Andreas Osthoff
Transparency
The selection of devices to be reviewed is made by our editorial team. The test sample was provided to the author as a loan by the manufacturer or retailer for the purpose of this review. The lender had no influence on this review, nor did the manufacturer receive a copy of this review before publication. There was no obligation to publish this review. As an independent media company, Notebookcheck is not subjected to the authority of manufacturers, retailers or publishers.
This is how Notebookcheck is testing
Every year, Notebookcheck independently reviews hundreds of laptops and smartphones using standardized procedures to ensure that all results are comparable. We have continuously developed our test methods for around 20 years and set industry standards in the process. In our test labs, high-quality measuring equipment is utilized by experienced technicians and editors. These tests involve a multi-stage validation process. Our complex rating system is based on hundreds of well-founded measurements and benchmarks, which maintains objectivity. Further information on our test methods can be found here.
Price comparison

