Aorus 15 YE5 评测:省钱的高端游戏笔记本电脑

仅凭低廉的价格,Aorus 15 YE 就已经是一款有趣的游戏笔记本电脑。从外观上看,它时尚纤薄,价格实惠,甚至还包括 Thunderbolt 4 和 DDR5。相比之下,它的内部则安装了(强劲的)上一代硬件,即不太高端的酷睿 i5-12500H和上一代 Nvidia 旗舰机型 RTX 3080 Ti.这一切使 Aorus 15 YE5 成为 1500 美元内最强大的游戏笔记本电脑之一。
尽管 Aorus 15 YE5 的 CPU 和 GPU 都是上一代产品,但它仍需要与当前的竞争对手一较高下,以证明自己是否能跟上时代的步伐,以及是否能真正做到物有所值。随后,我们将把它与目前配备RTX 4060 或RTX 4070 的笔记本电脑进行对比,如Aorus 15 BSF (RTX4070)、Captiva Advanced Gaming I74-121 (RTX 4060)、HP Victus 16 (RTX 4070)、HP Omen 16 (RTX 4080) 和更昂贵的Dell XPS 15 9530 (RTX 4070)。
潜在的竞争对手比较
Rating | Date | Model | Weight | Height | Size | Resolution | Price |
|---|---|---|---|---|---|---|---|
| 86.6 % v7 (old) | 12 / 2023 | Aorus 15 YE5-54DEB34SH i5-12500H, GeForce RTX 3080 Ti Laptop GPU | 2.3 kg | 27 mm | 15.60" | 2560x1440 | |
| 85.7 % v7 (old) | 08 / 2023 | Aorus 15 BSF i7-13700H, GeForce RTX 4070 Laptop GPU | 2.4 kg | 20.9 mm | 15.60" | 2560x1440 | |
| 85.7 % v7 (old) | 09 / 2023 | Captiva Advanced Gaming I74-121 i5-13500H, GeForce RTX 4060 Laptop GPU | 2.3 kg | 29 mm | 15.60" | 1920x1080 | |
| 85.1 % v7 (old) | 09 / 2023 | HP Victus 16-r0077ng i7-13700H, GeForce RTX 4070 Laptop GPU | 2.4 kg | 24 mm | 16.10" | 1920x1080 | |
| 90.3 % v7 (old) | 04 / 2023 | Dell XPS 15 9530 RTX 4070 i7-13700H, GeForce RTX 4070 Laptop GPU | 1.9 kg | 18 mm | 15.60" | 3456x2160 | |
| 87.4 % v7 (old) | 07 / 2023 | HP Omen 16-wf000 i7-13700HX, GeForce RTX 4080 Laptop GPU | 2.4 kg | 23.6 mm | 16.10" | 2560x1440 |
外壳与连接:现代而简约
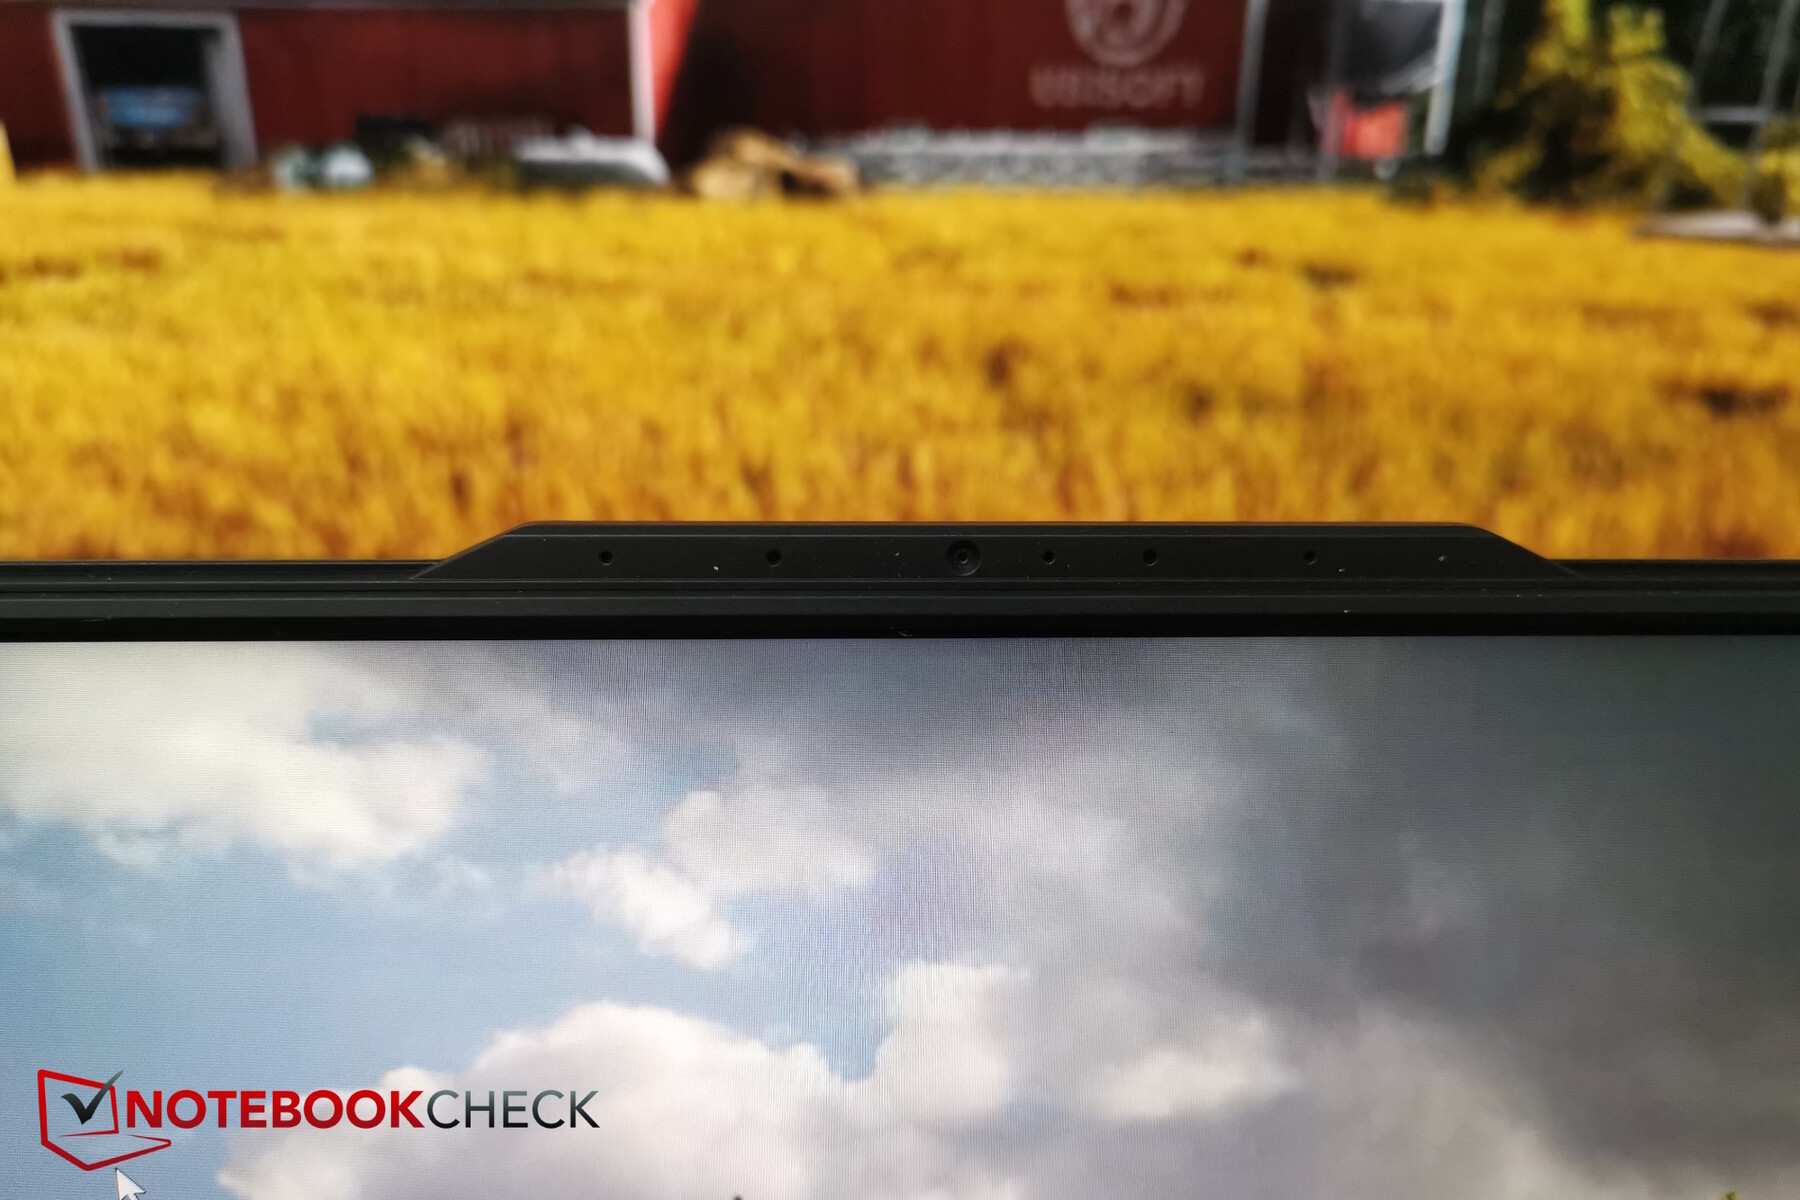
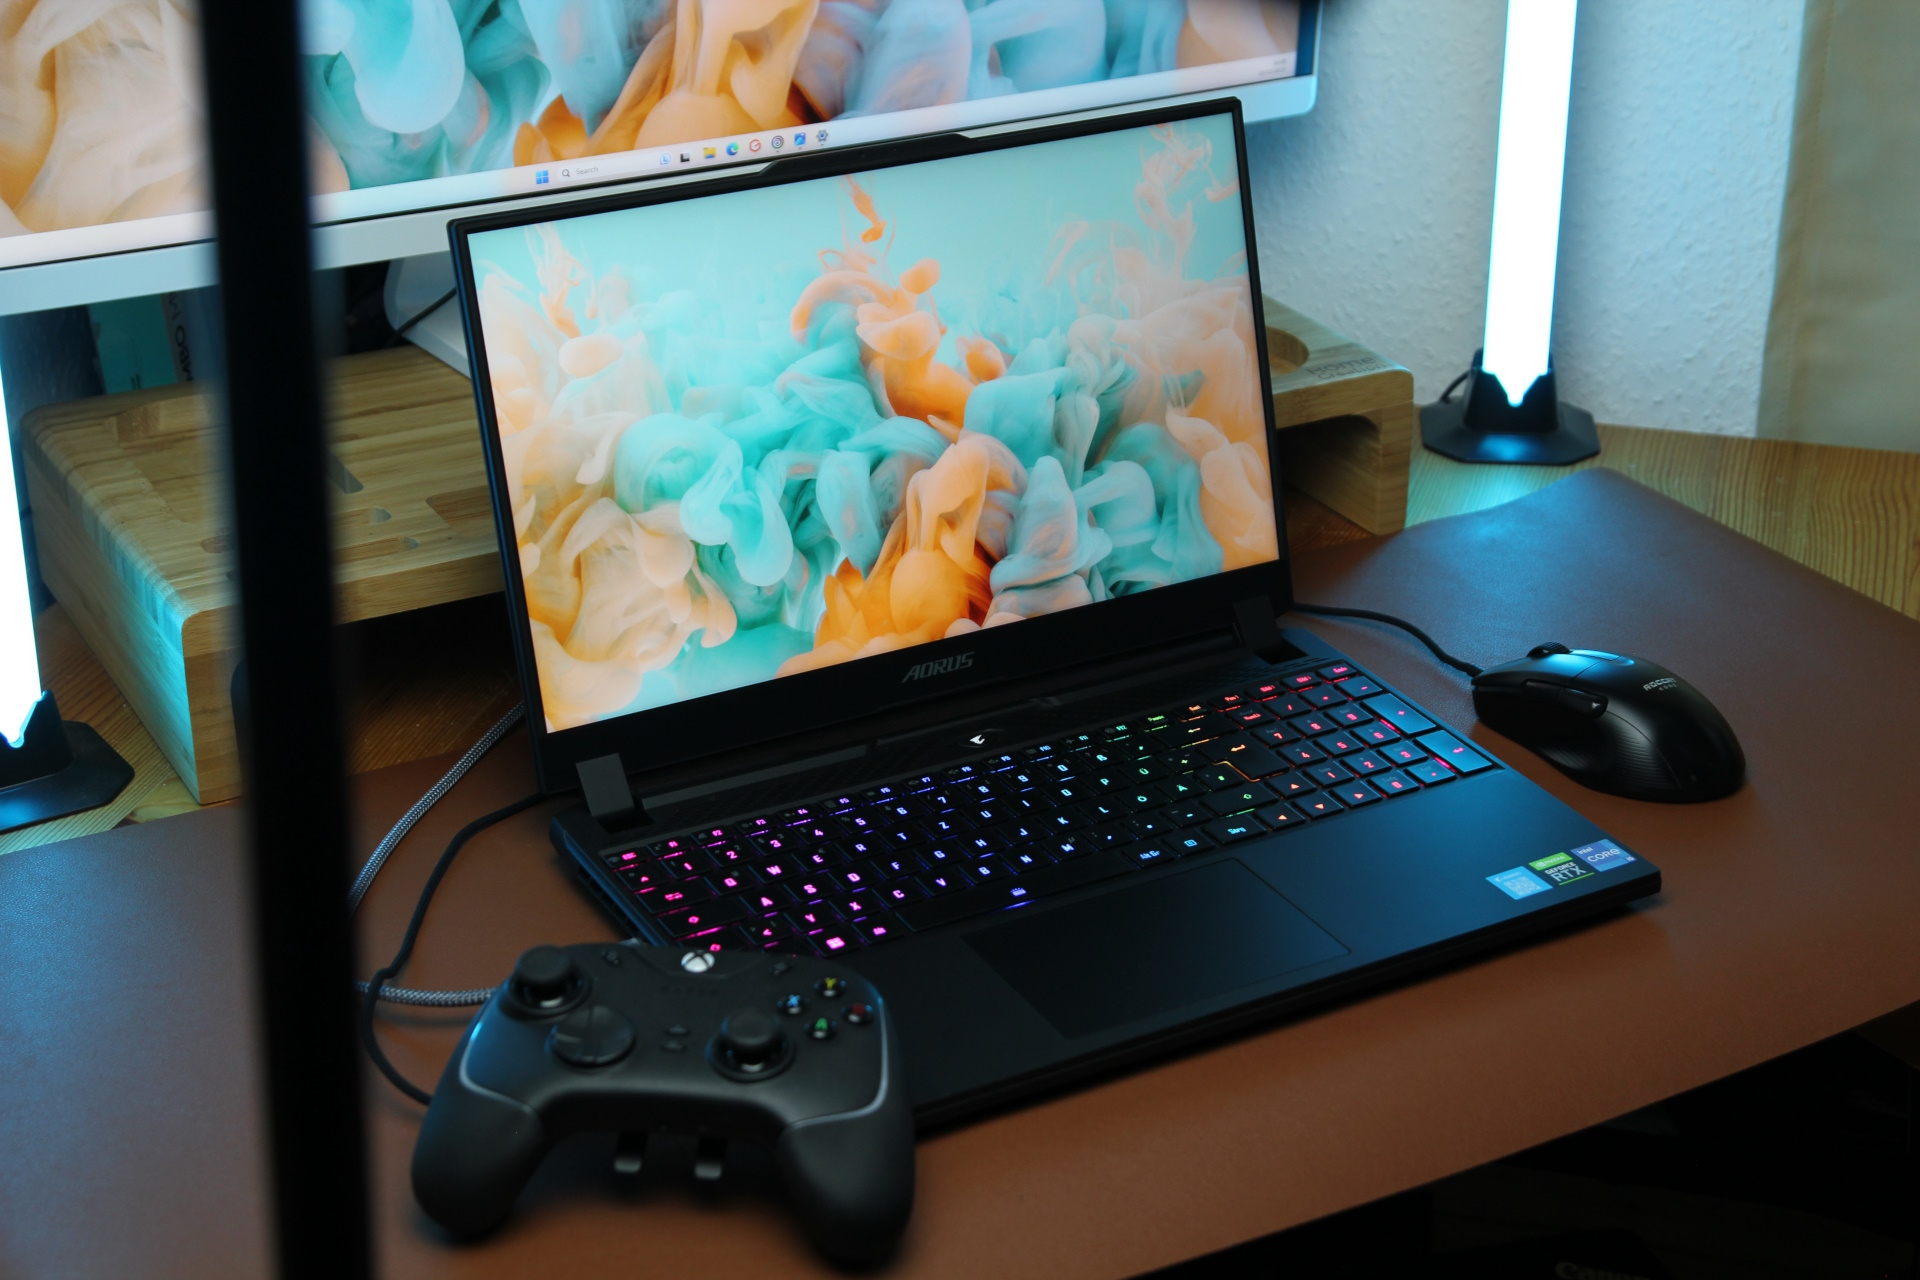
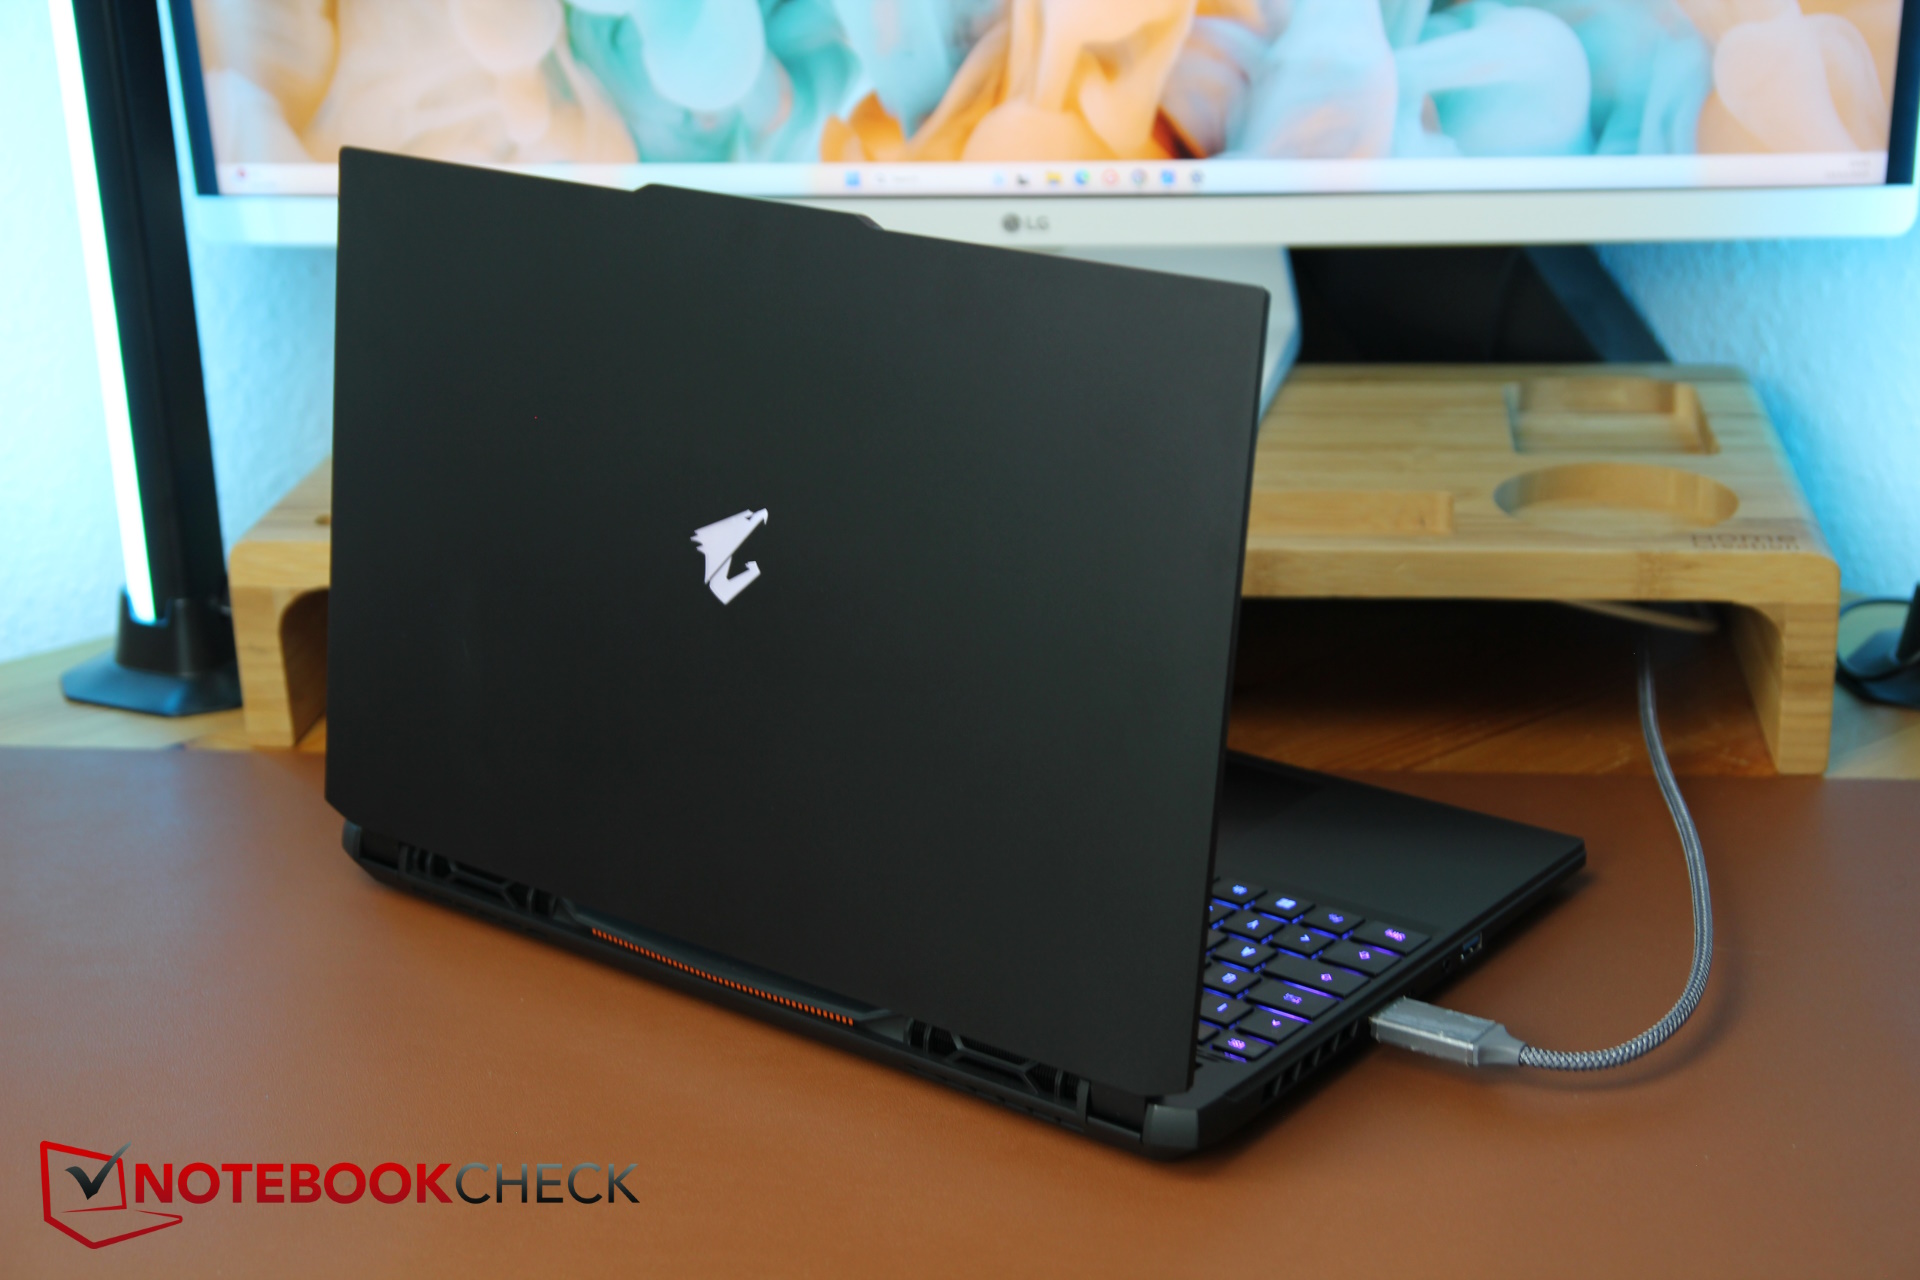
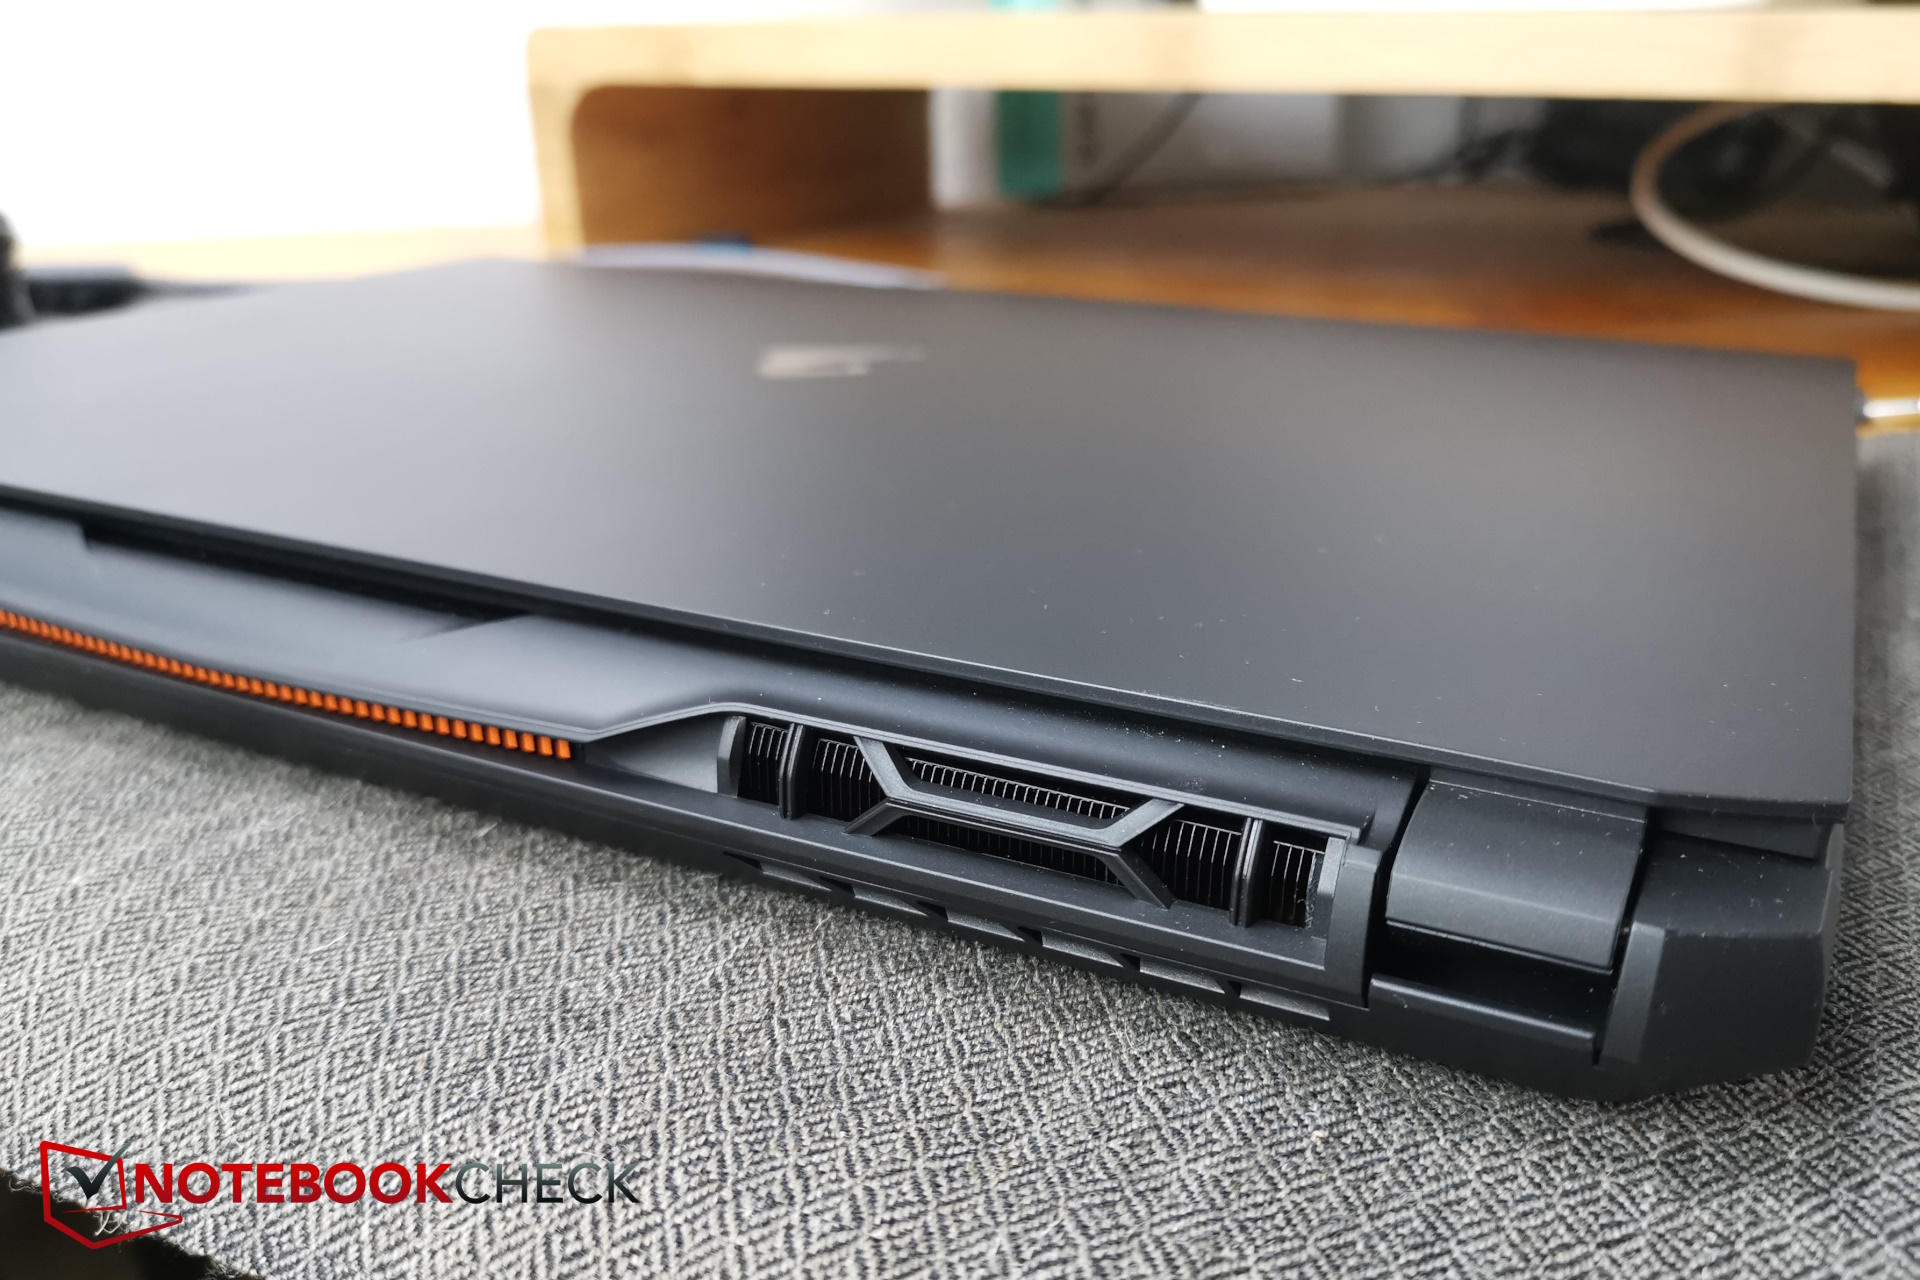
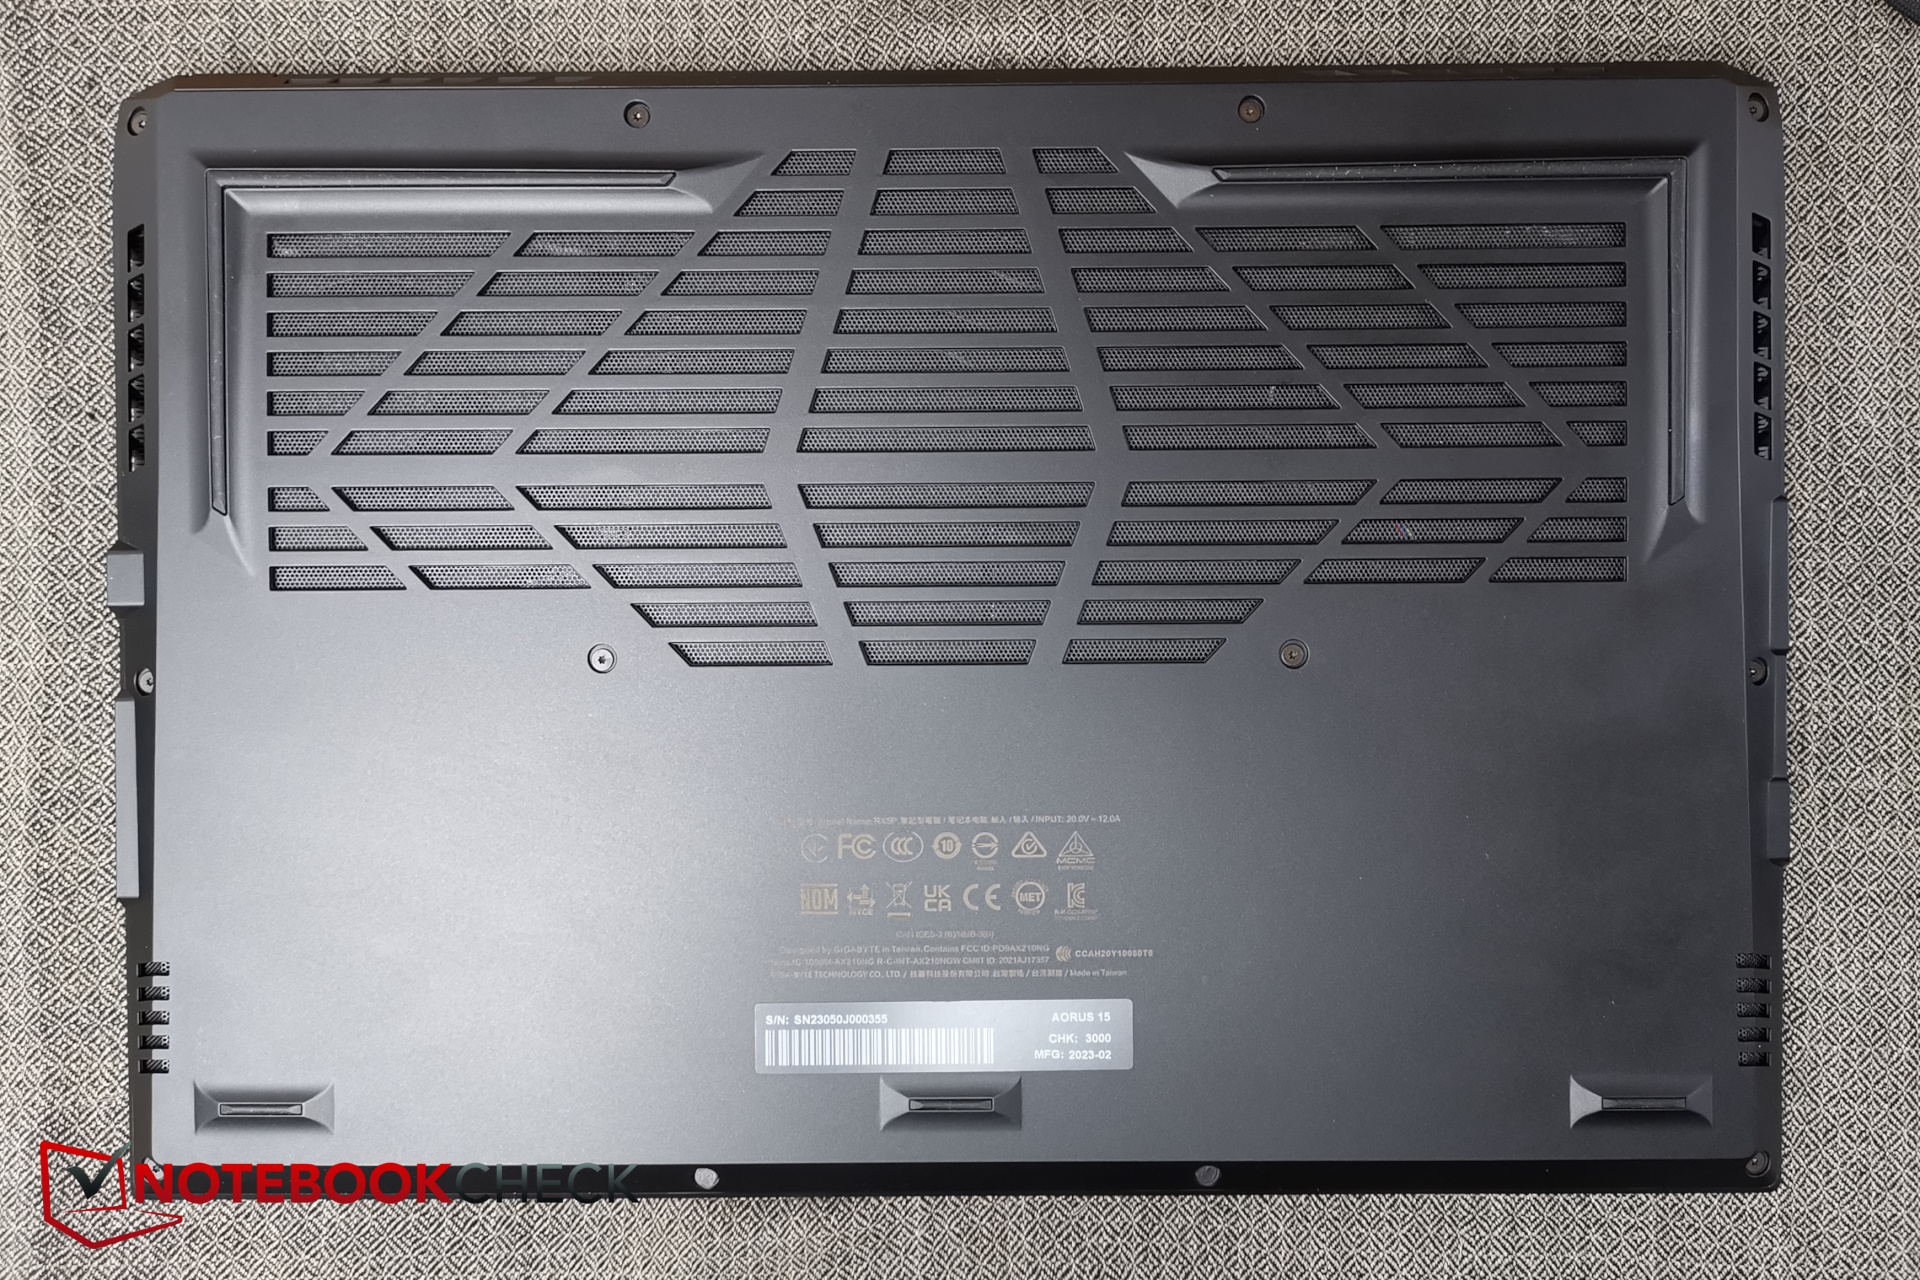
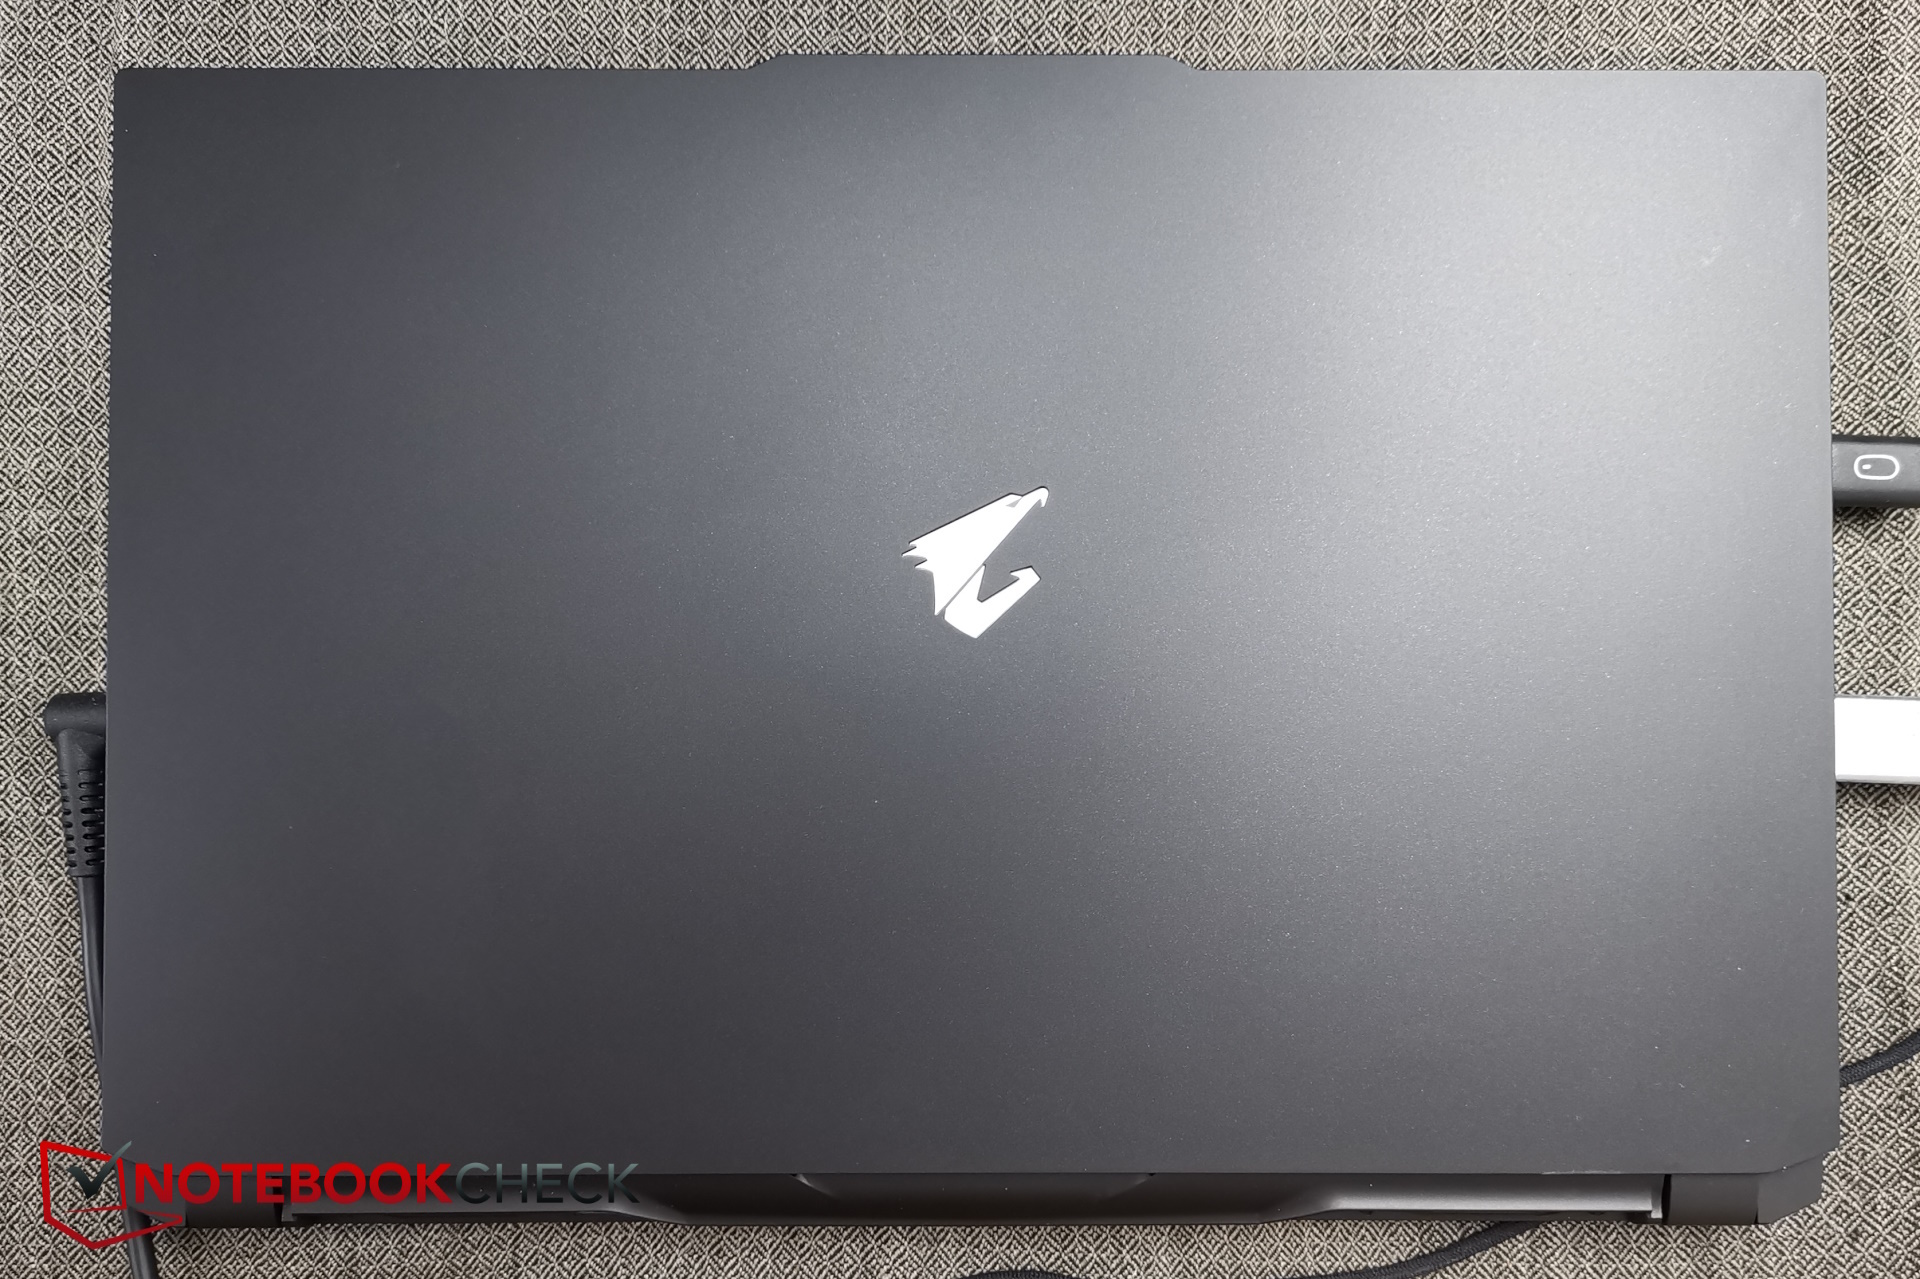
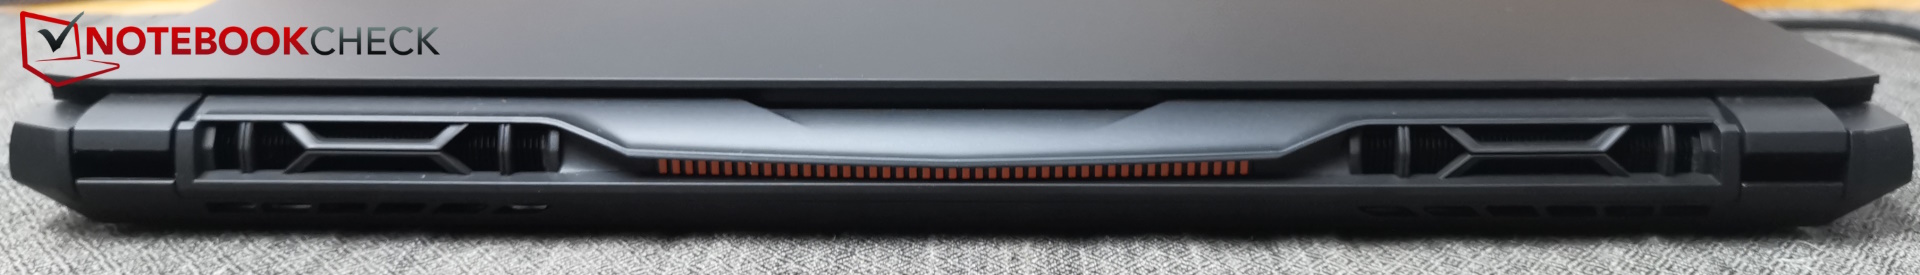
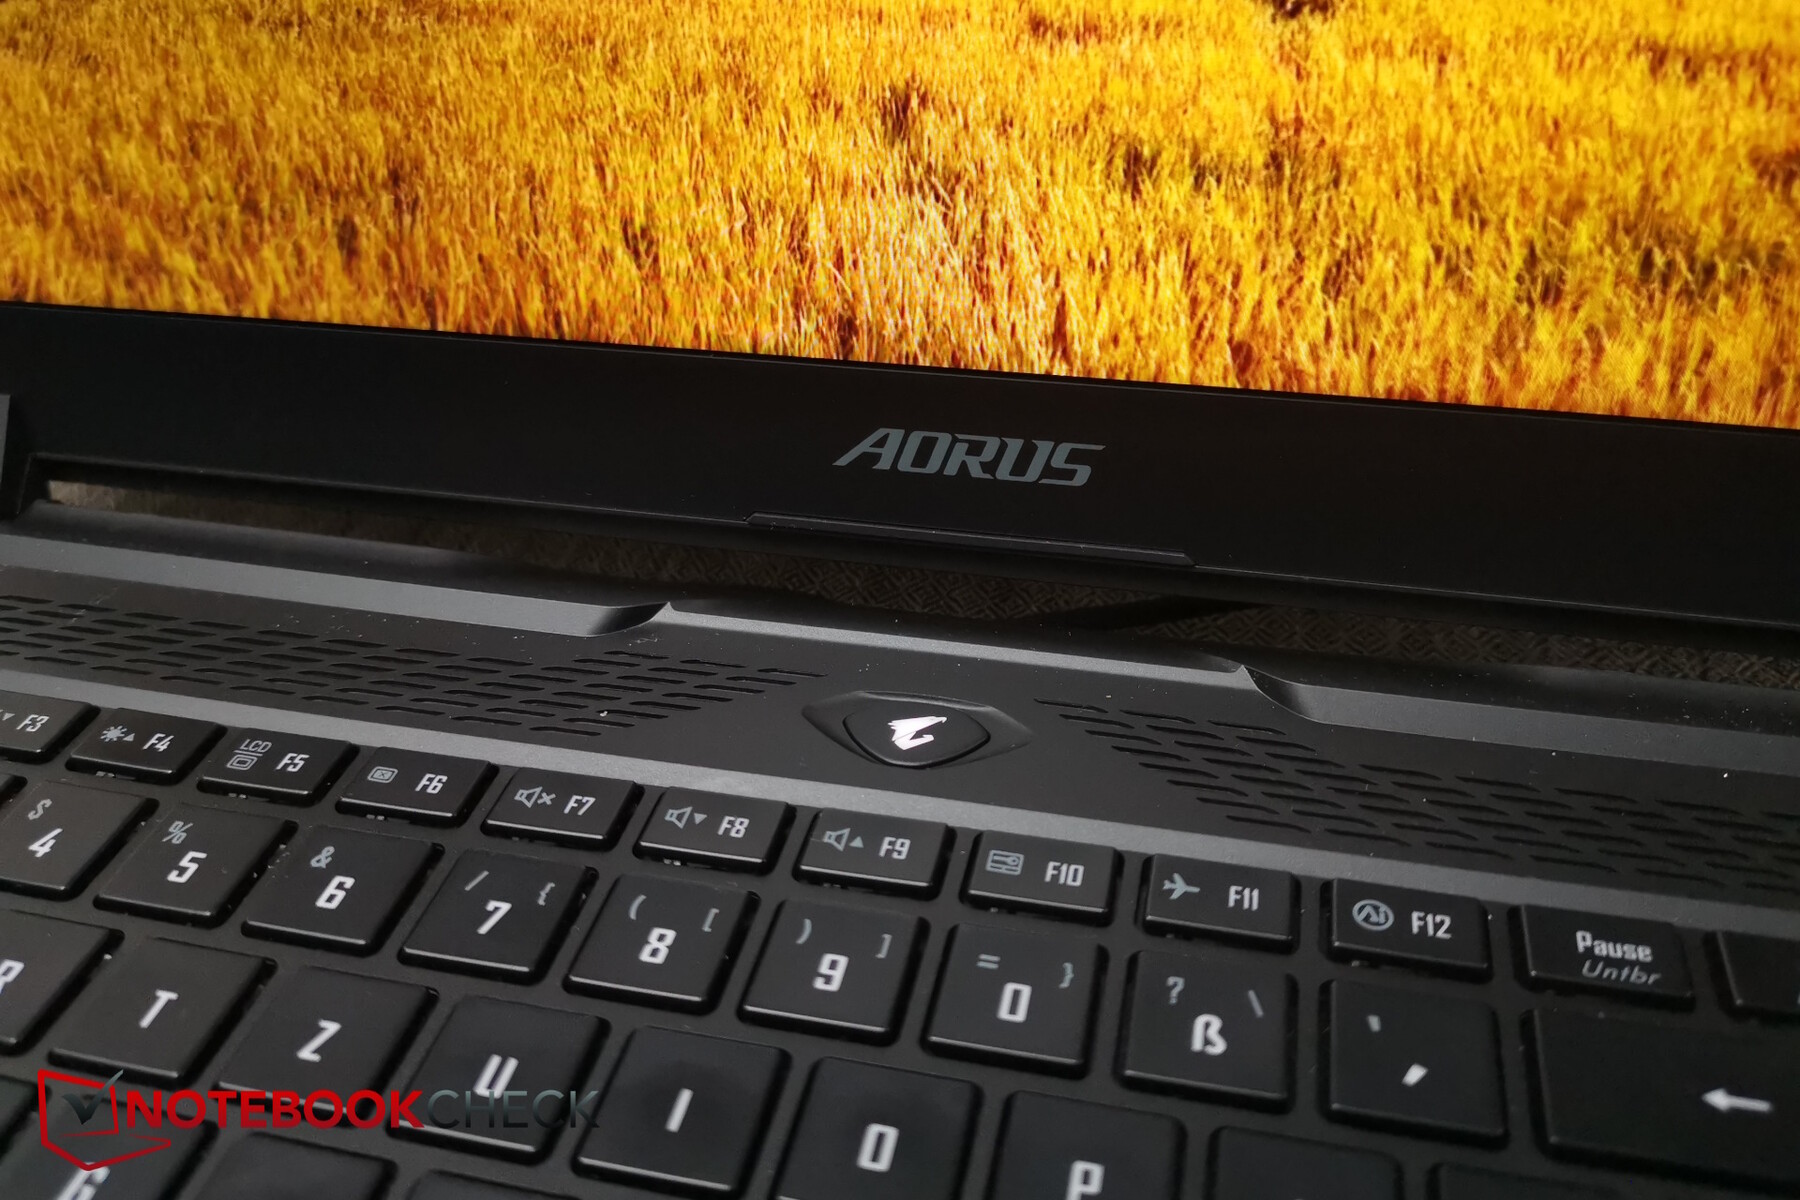
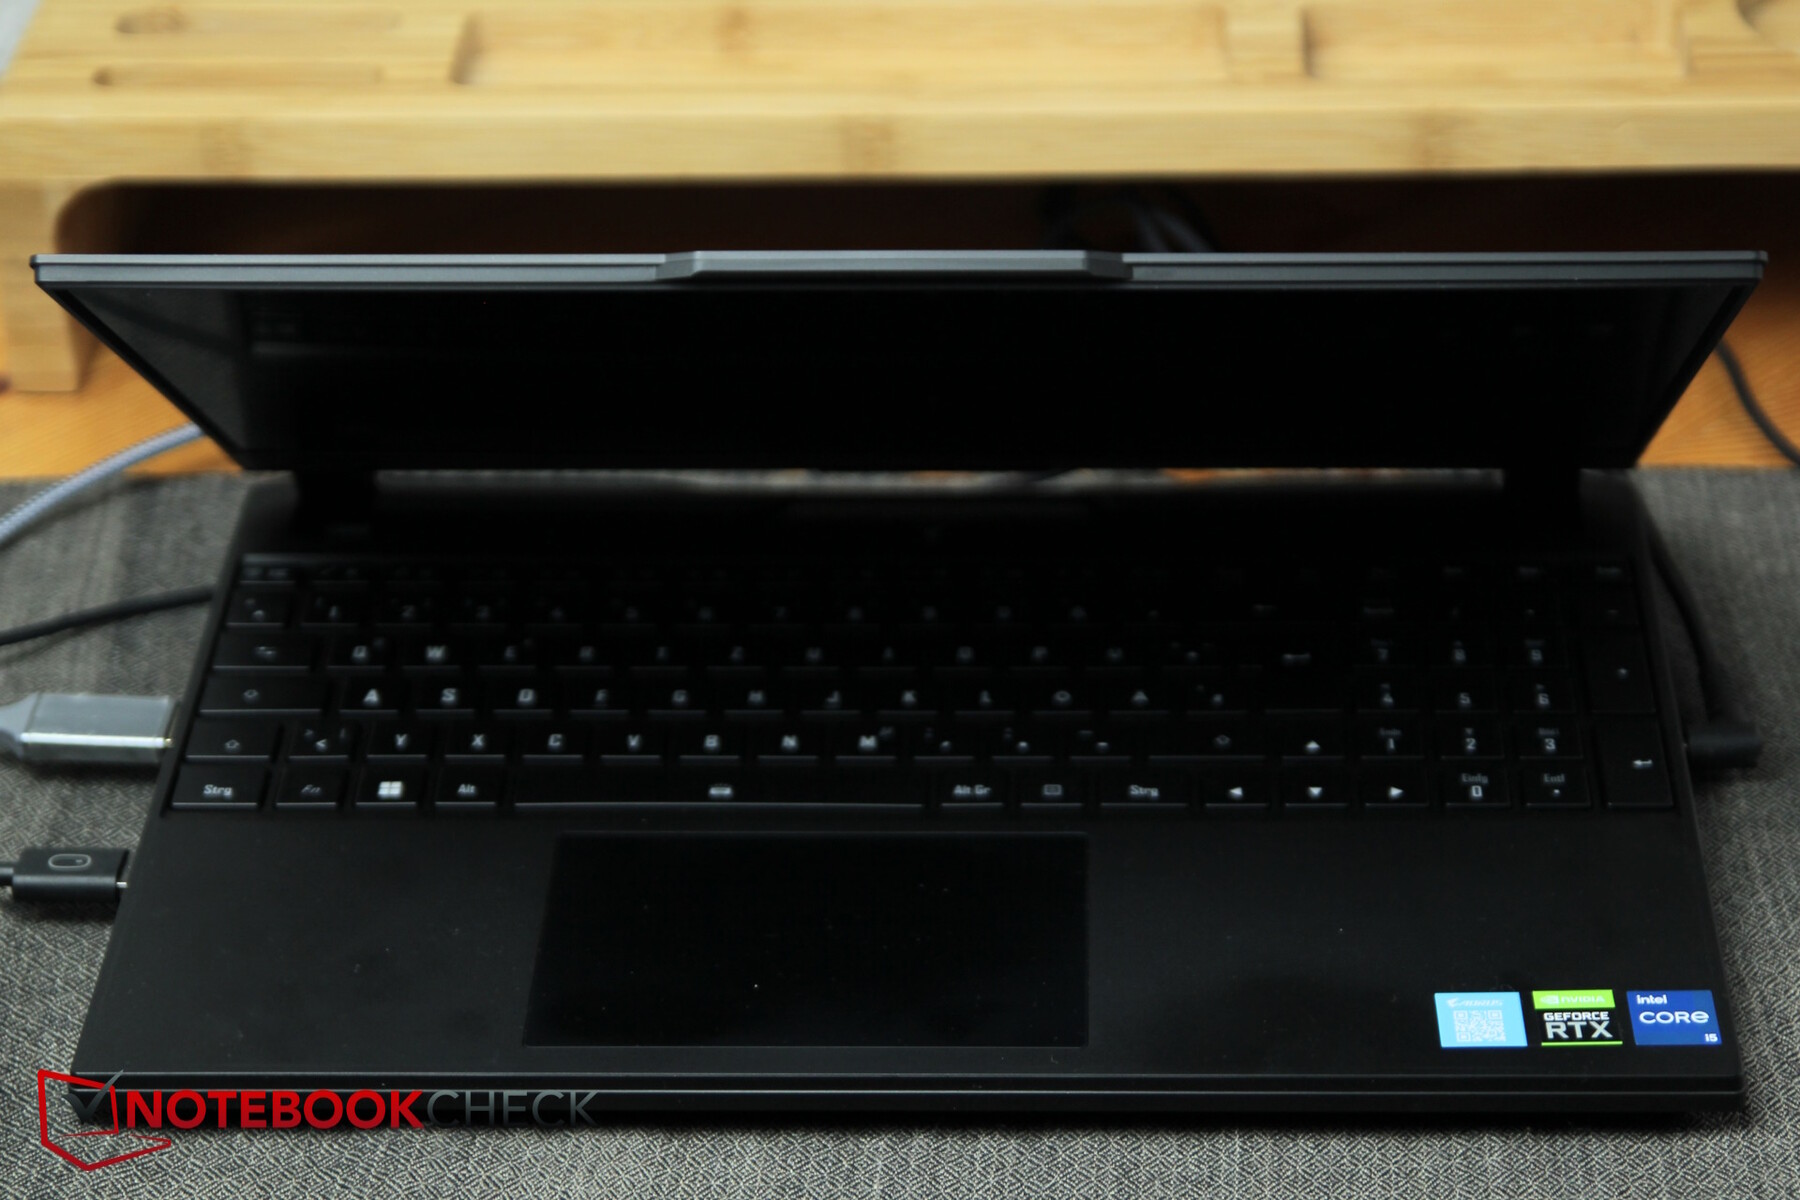
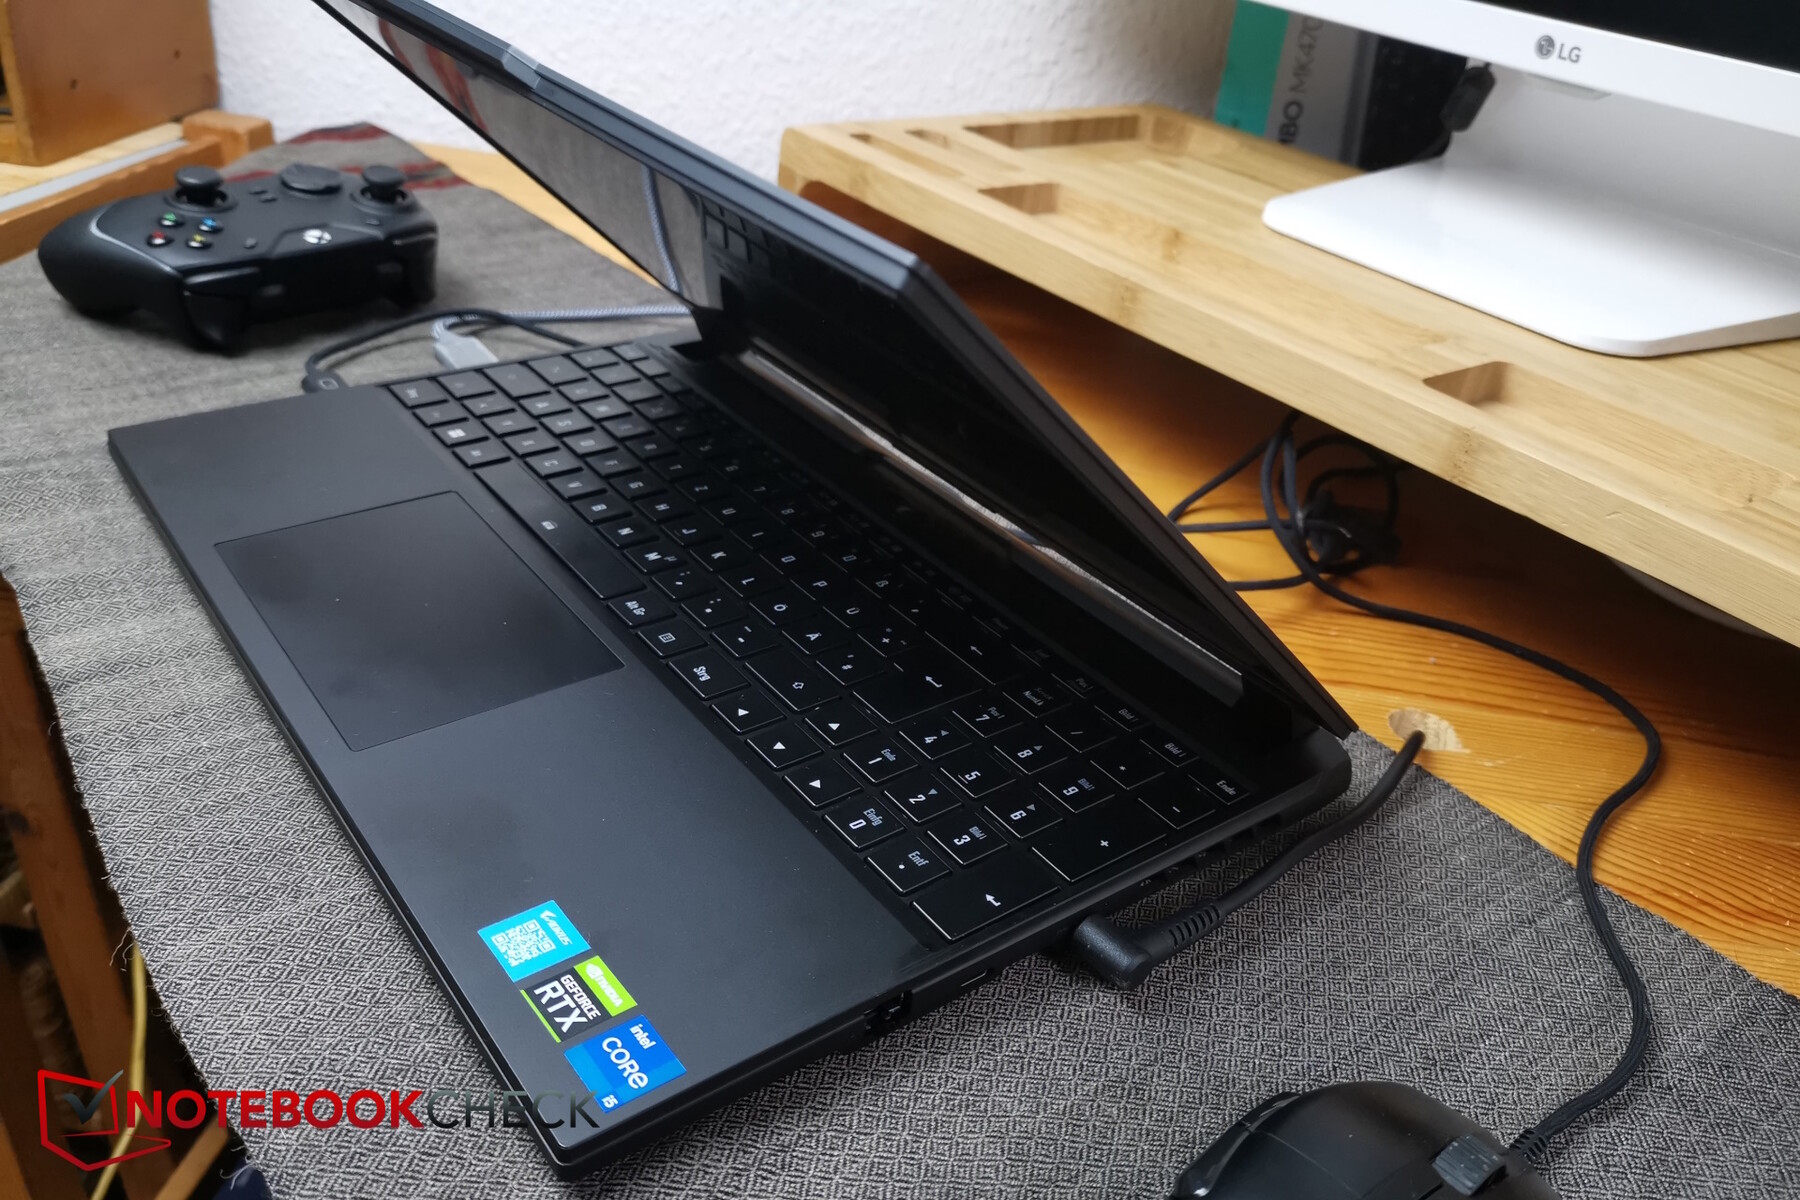
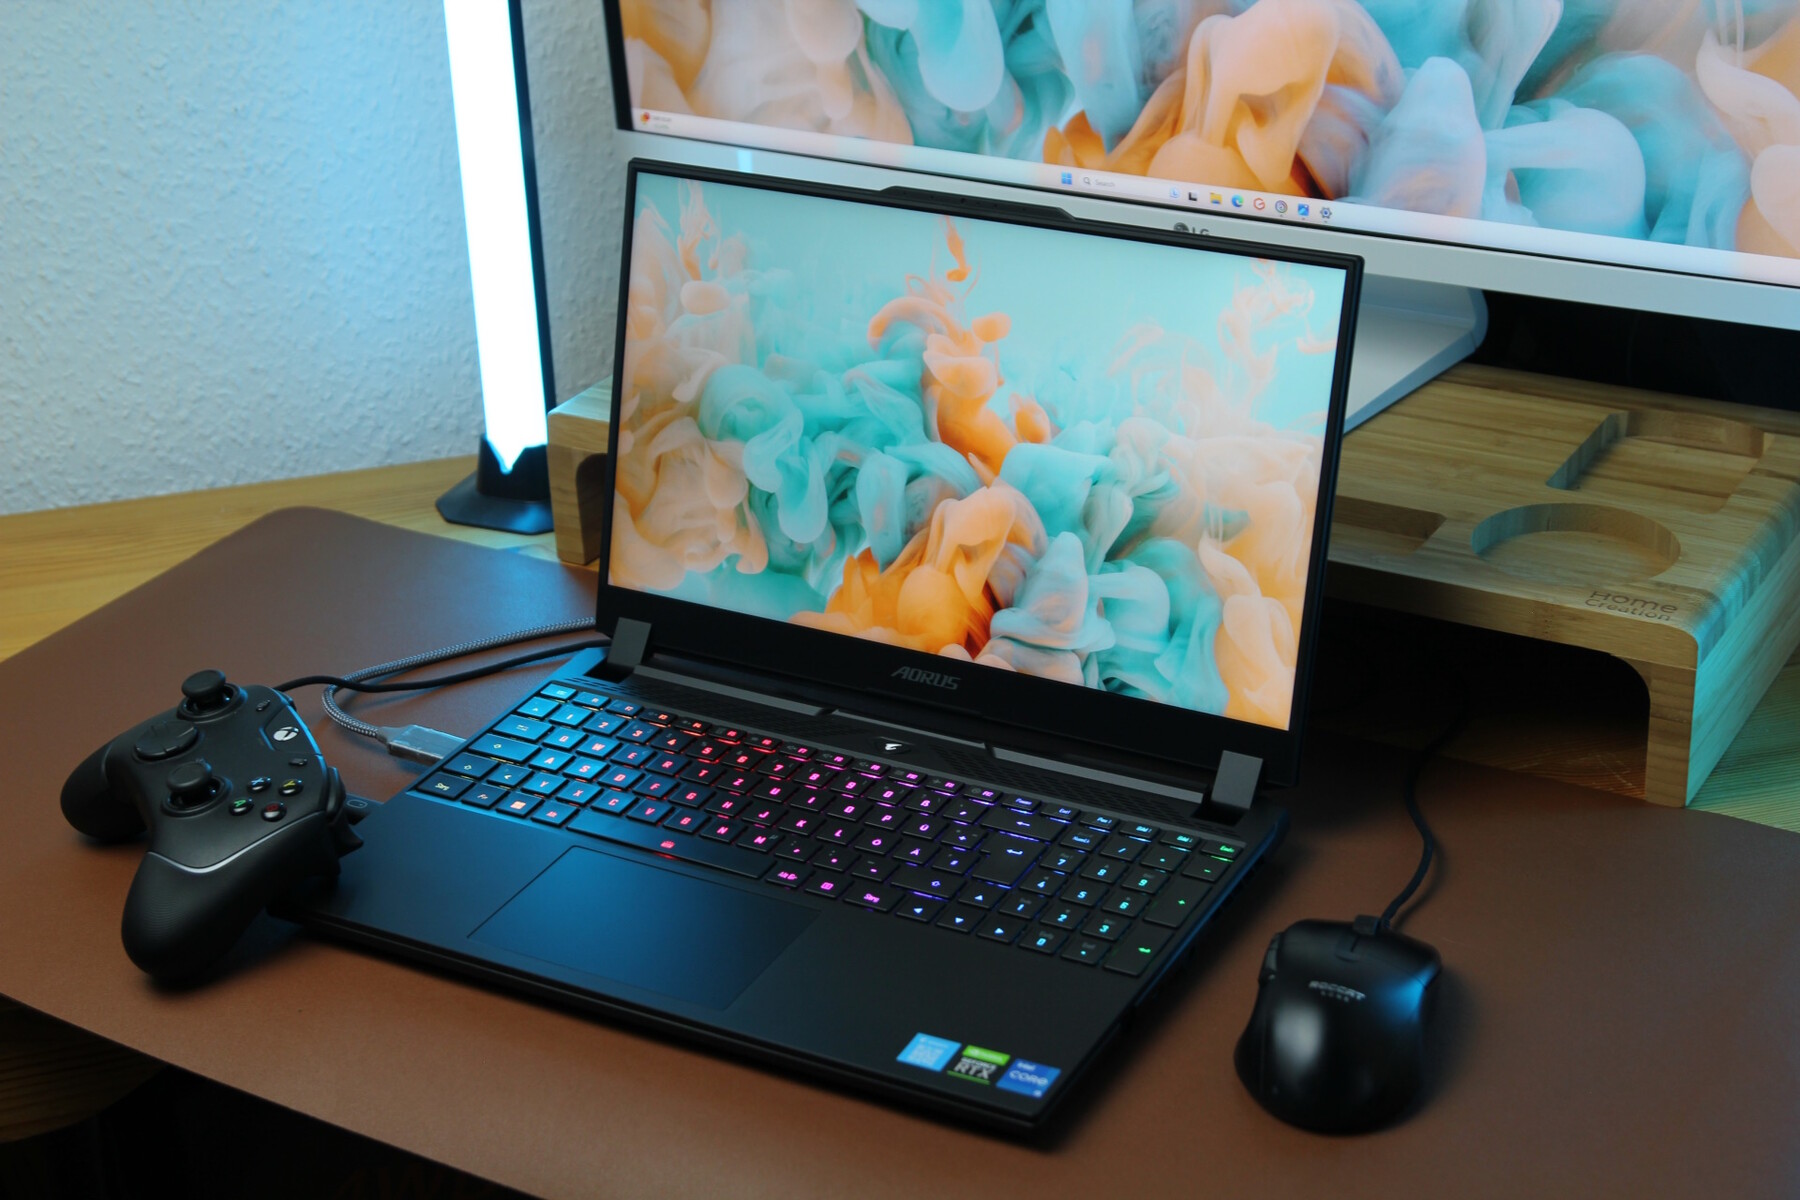
从外观上看,Aorus 看起来相当现代和吸引人。这要归功于其黑色磨砂、纤薄的外观设计--尽管这款笔记本电脑实际上并没有那么纤薄(最多 27 毫米)。同时,它在时尚的同时还保持了独特性,例如,背部风扇栅格的结构和在那里出现的小橘色,以及特别设计的斜角边缘。银色的 Aorus 徽标将你的注意力吸引到设备顶部。机盖的前上边缘有一个小凹槽,用于放置网络摄像头和扬声器--此外,单手打开笔记本电脑时,它还能给你带来非常好的握持感。
机壳的所有侧面均由光滑的塑料制成。这看起来很棒,但与某些竞争对手相比,它不那么耐扭曲。当你在键盘上打字时,键盘不会有任何松动,这意味着它的稳定性总体上还不错。
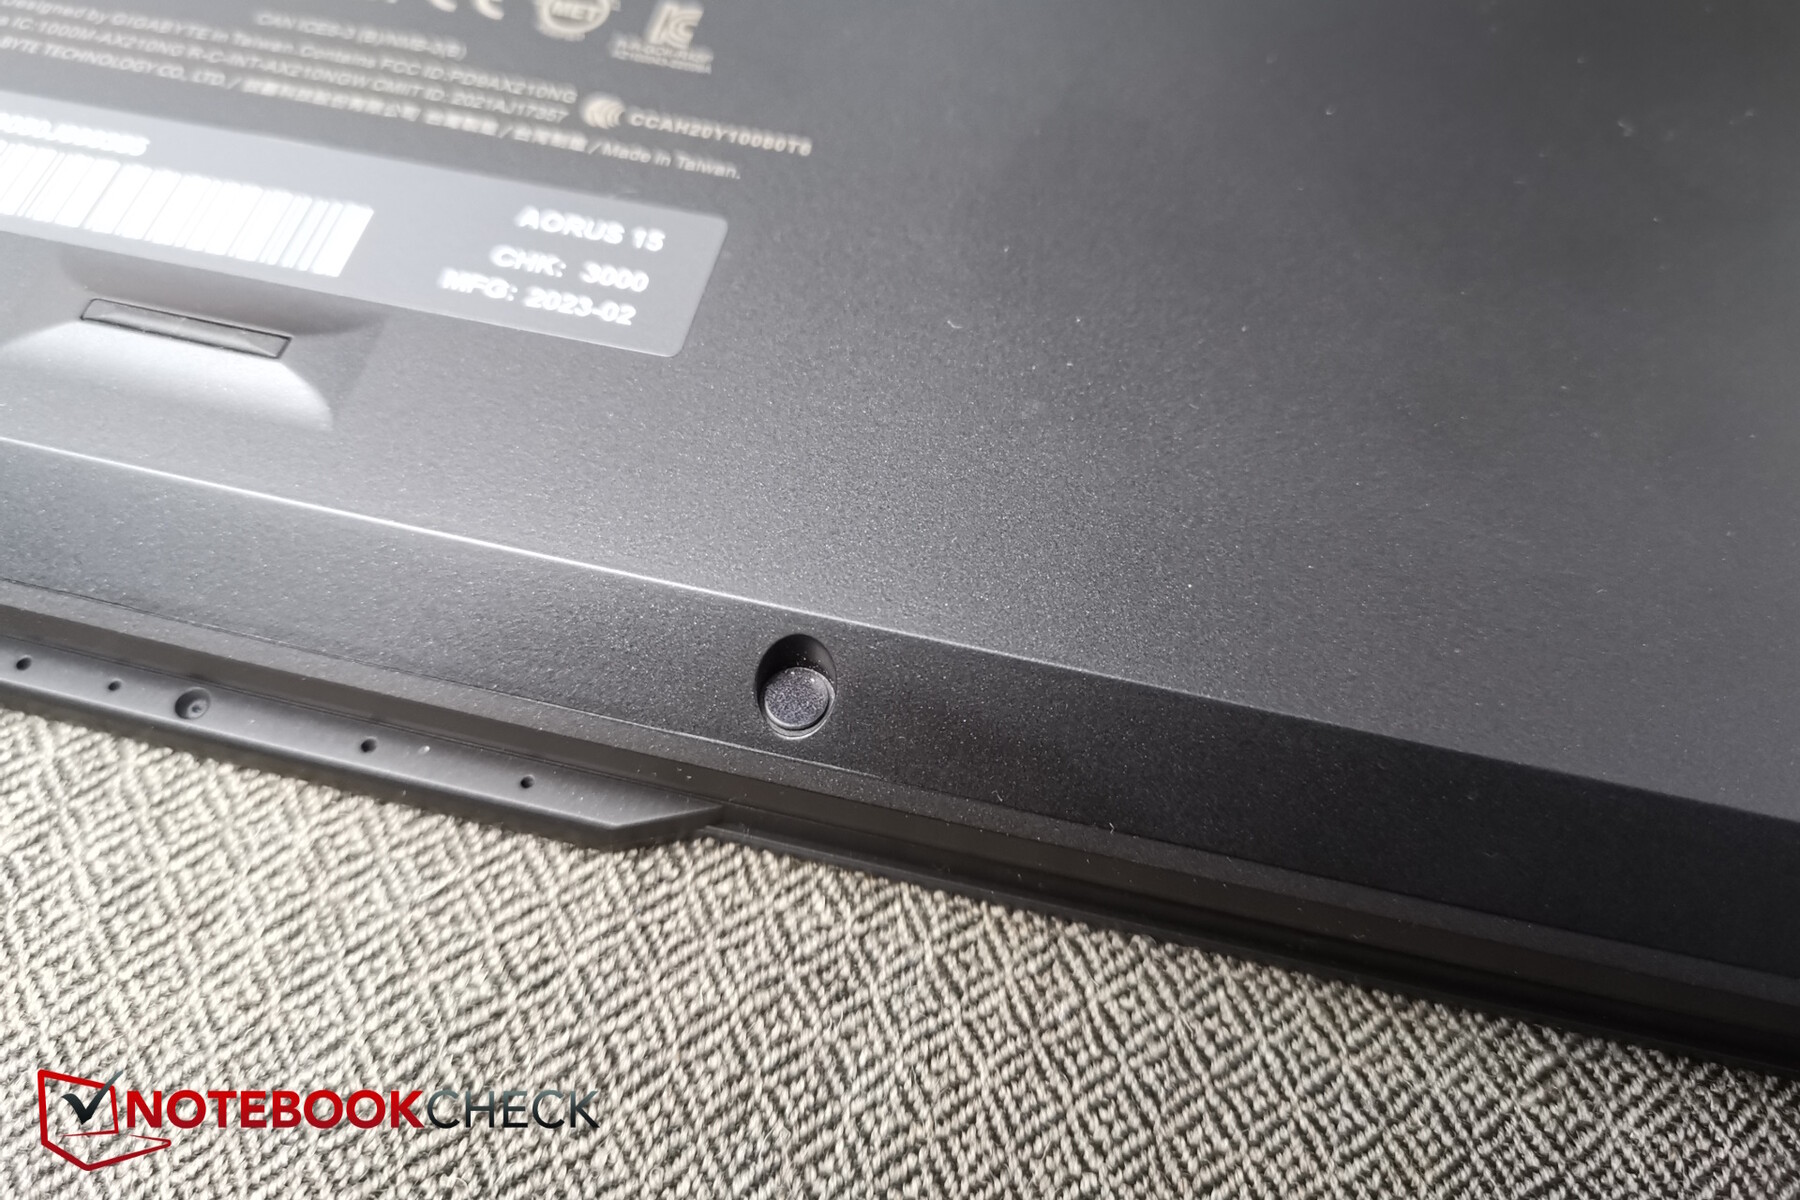
我们没有打开 Aorus,因为两颗 Torx 螺钉被贴纸覆盖,我们不想为了借用的 Cyberport 而损坏这些螺钉。
连接性
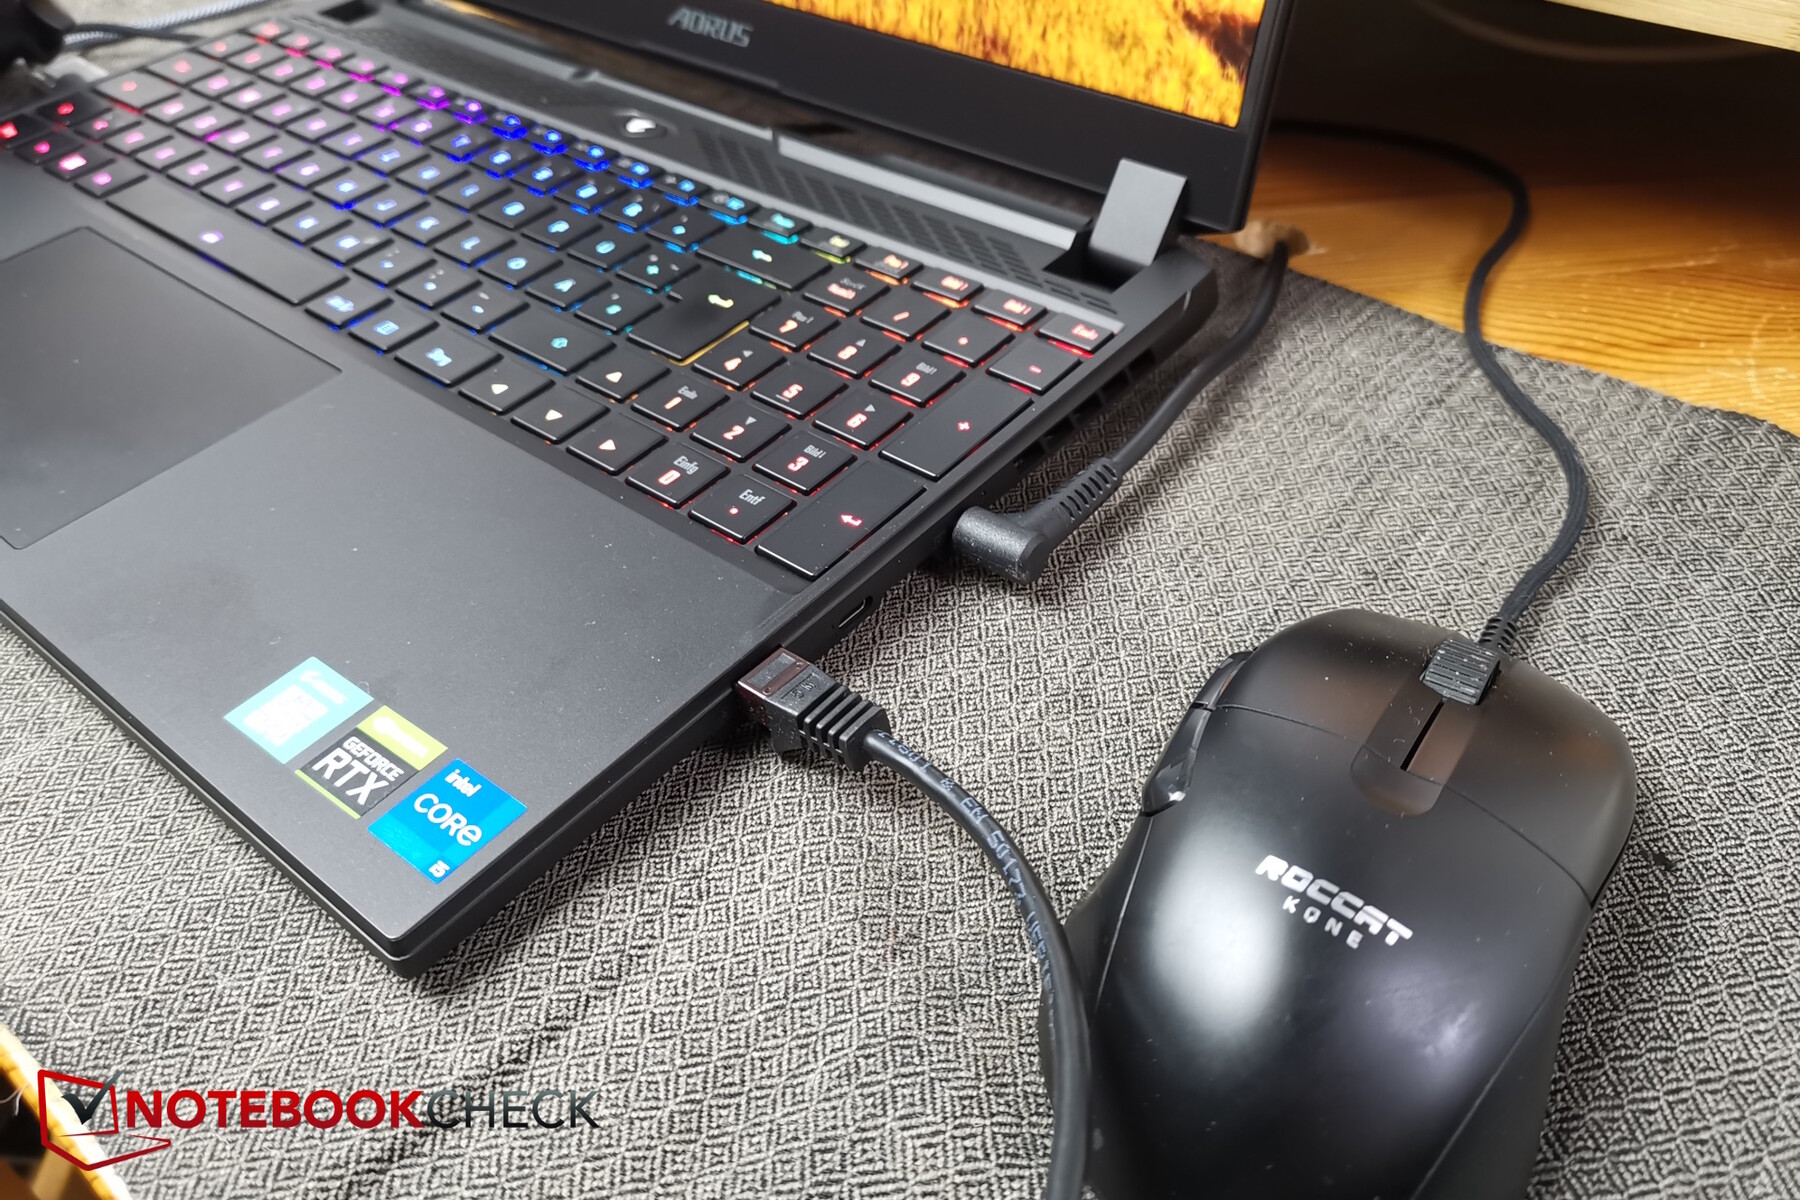
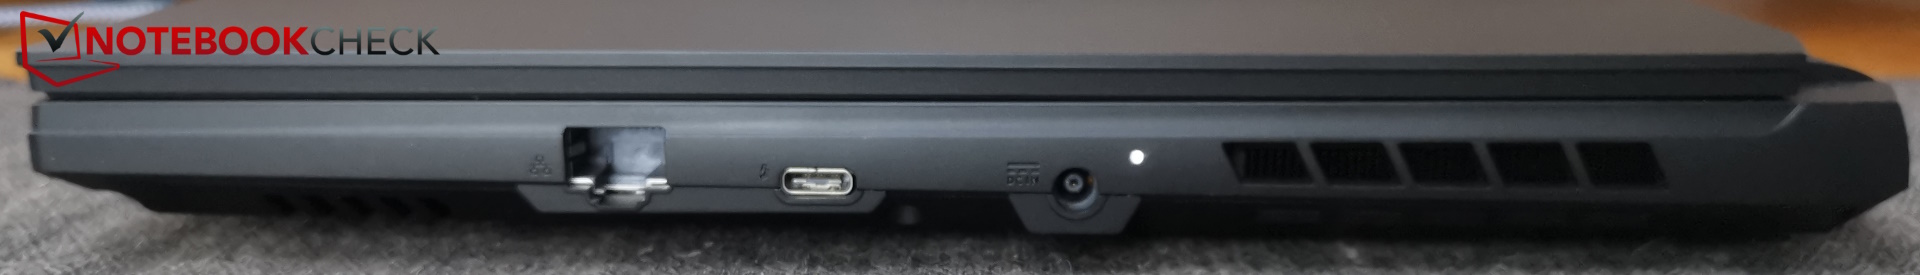
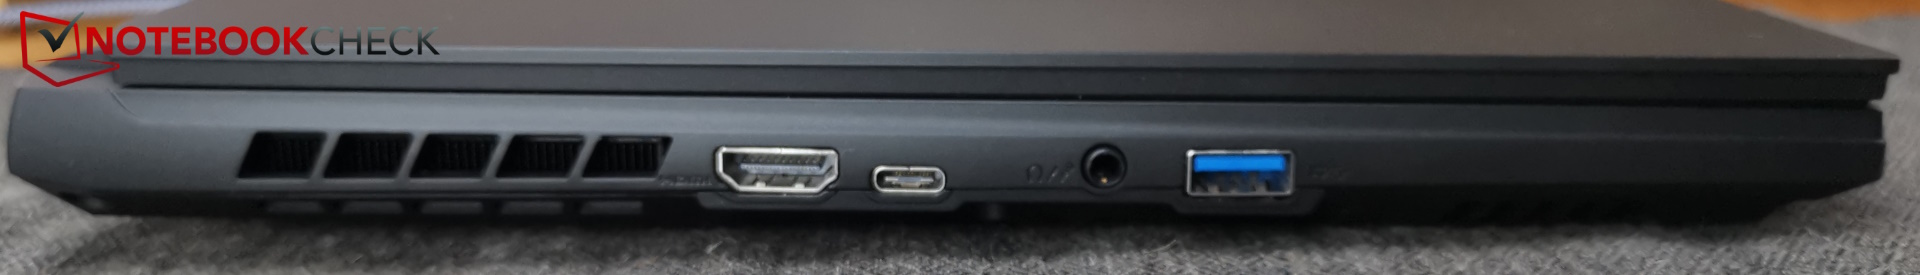
Aorus 笔记本电脑的连接选项非常现代,同时也保持在最低水平。在三个 USB 端口中,只有一个是 Type-A,这还远远不够。反过来,两个 Type-C 端口中有一个支持 Thunderbolt 4。除了第四个 USB 接口外,该设备还缺少一个 SD 读卡器、一个 Kensington 锁和一个专用 DisplayPort(通过 USB-C 接口提供 2 个)。
尽管端口数量不多,但它们的布局并不理想--用于刚性网线的 RJ45 端口位于右侧,而且朝前。Aorus 背面的空间一如既往地没有使用。它只容纳了风扇插座。
WiFi 和摄像头
无论是 6 GHz(WiFi 6E)还是 5 GHz 网络,它的无线局域网传输速率都是同类产品中最高的。
遗憾的是,该设备的网络摄像头仍然是上一代产品:它的分辨率只有 720p,色彩偏差很大,控制中心也没有快门。


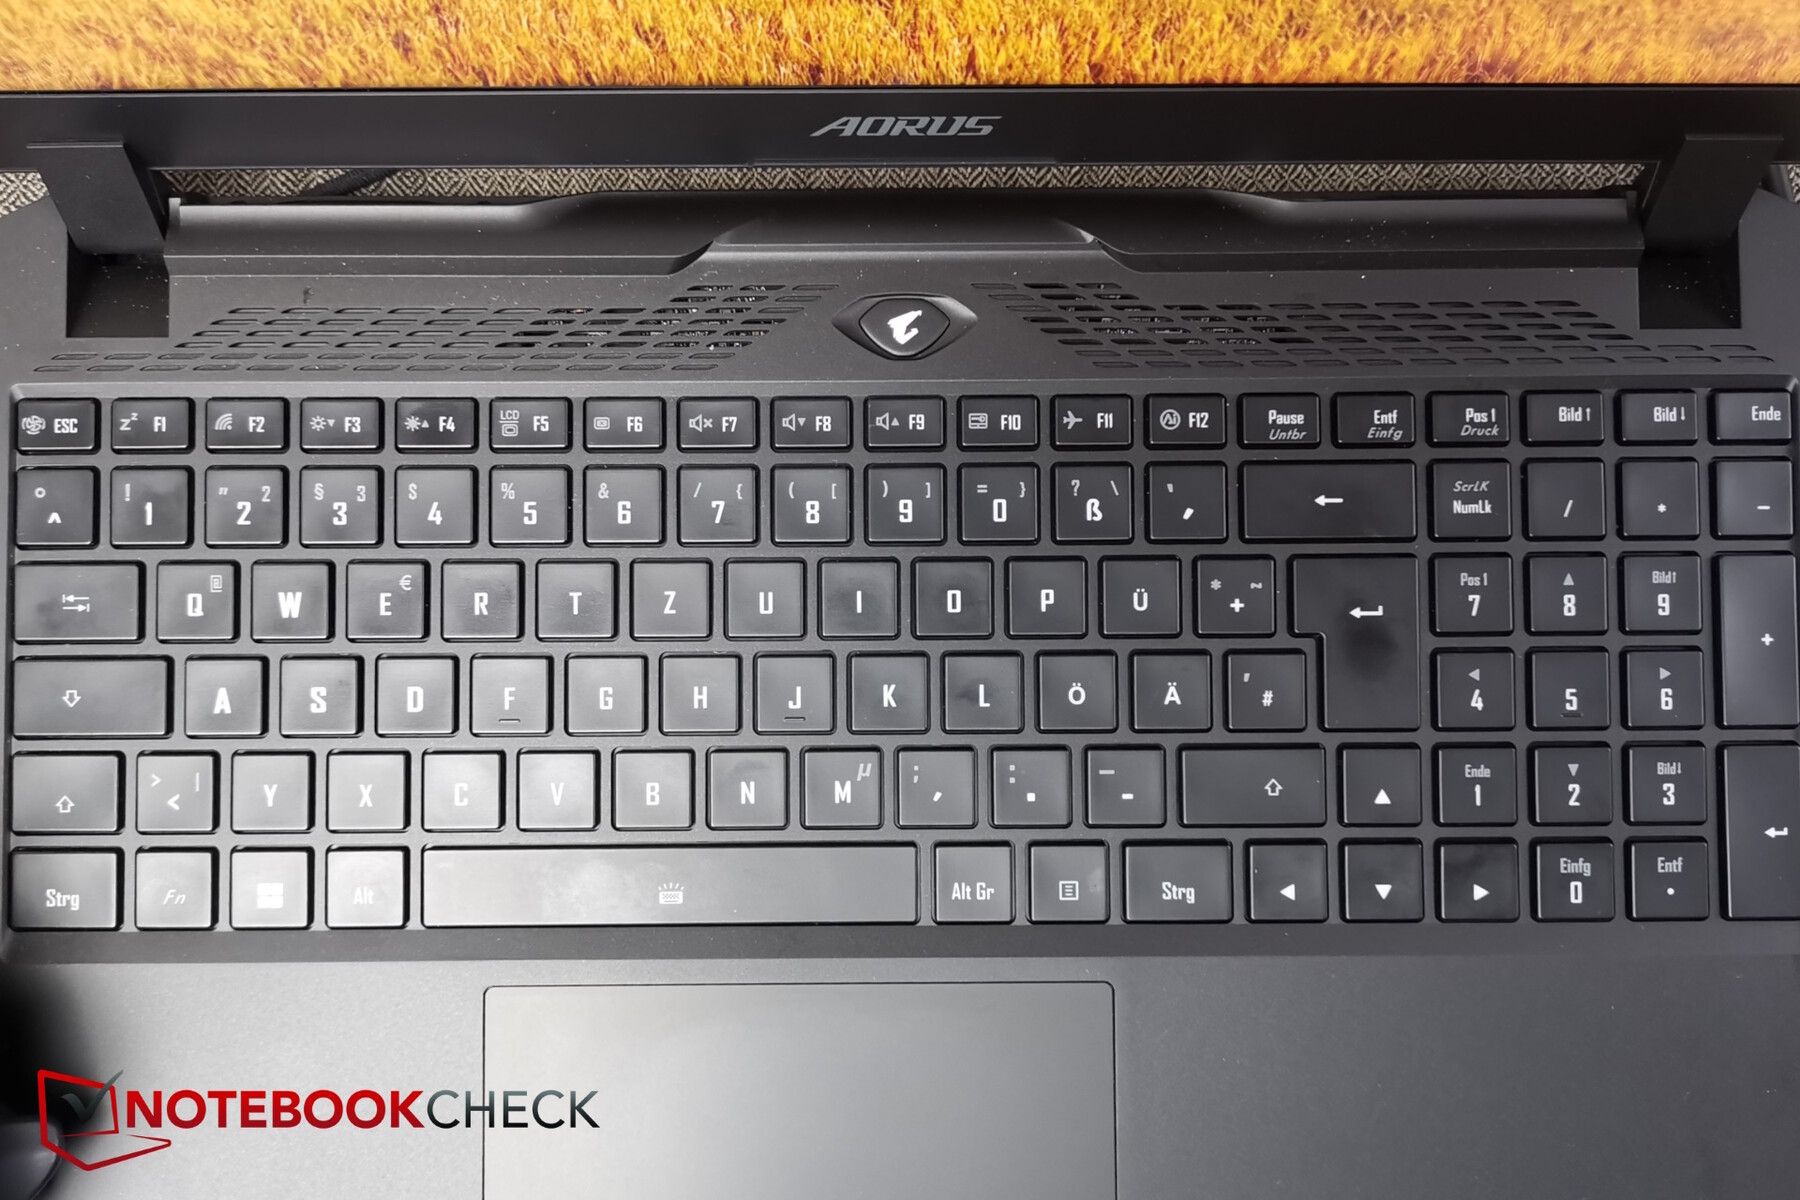
输入设备 - 多于实心,但有深色特殊按键标签
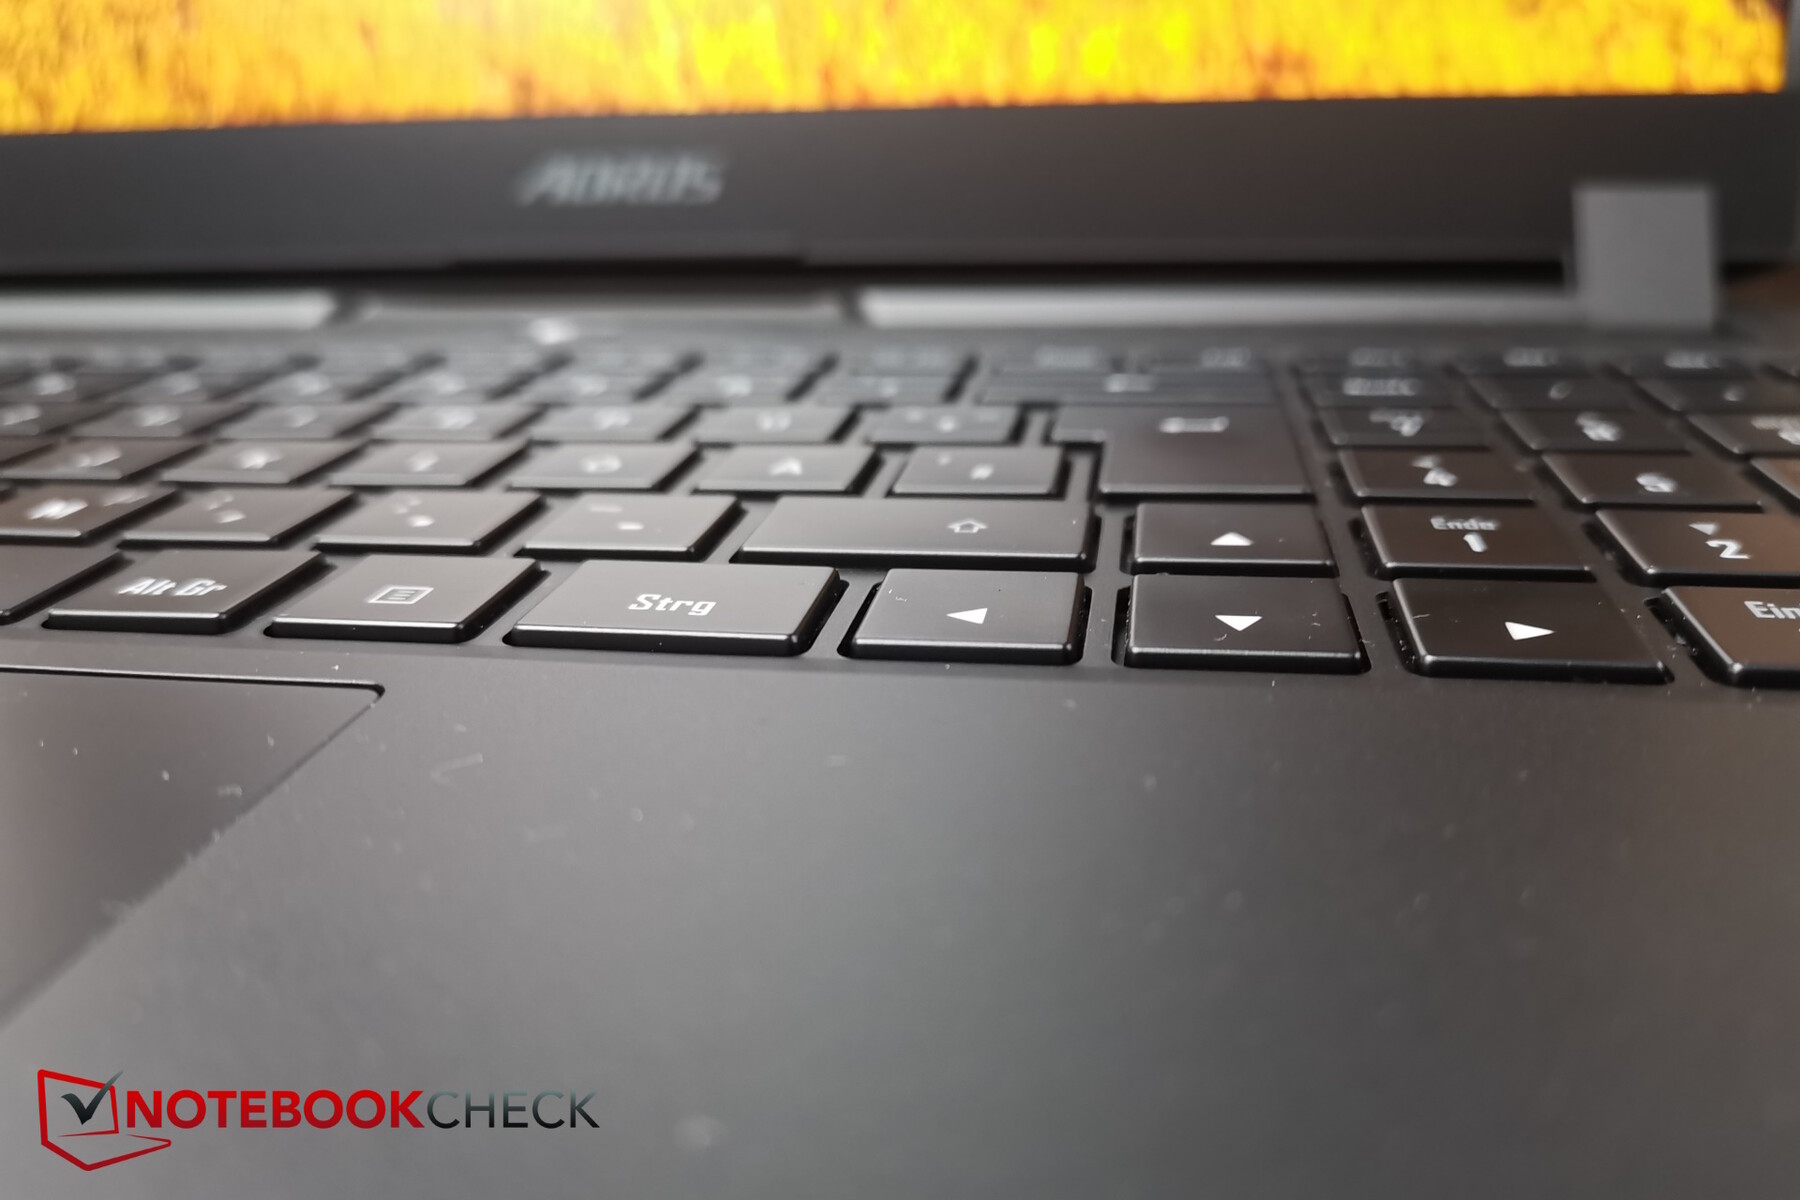
按键布局非常整齐--键盘略低于笔记本底座。方向键的大小也很正常,右侧还有一个数字小键盘。
按键只有中低升程,但在键入时仍然感觉出奇的舒适,这也得益于其良好的反馈。键入时的噪音偏小,因此也适用于低噪音环境。
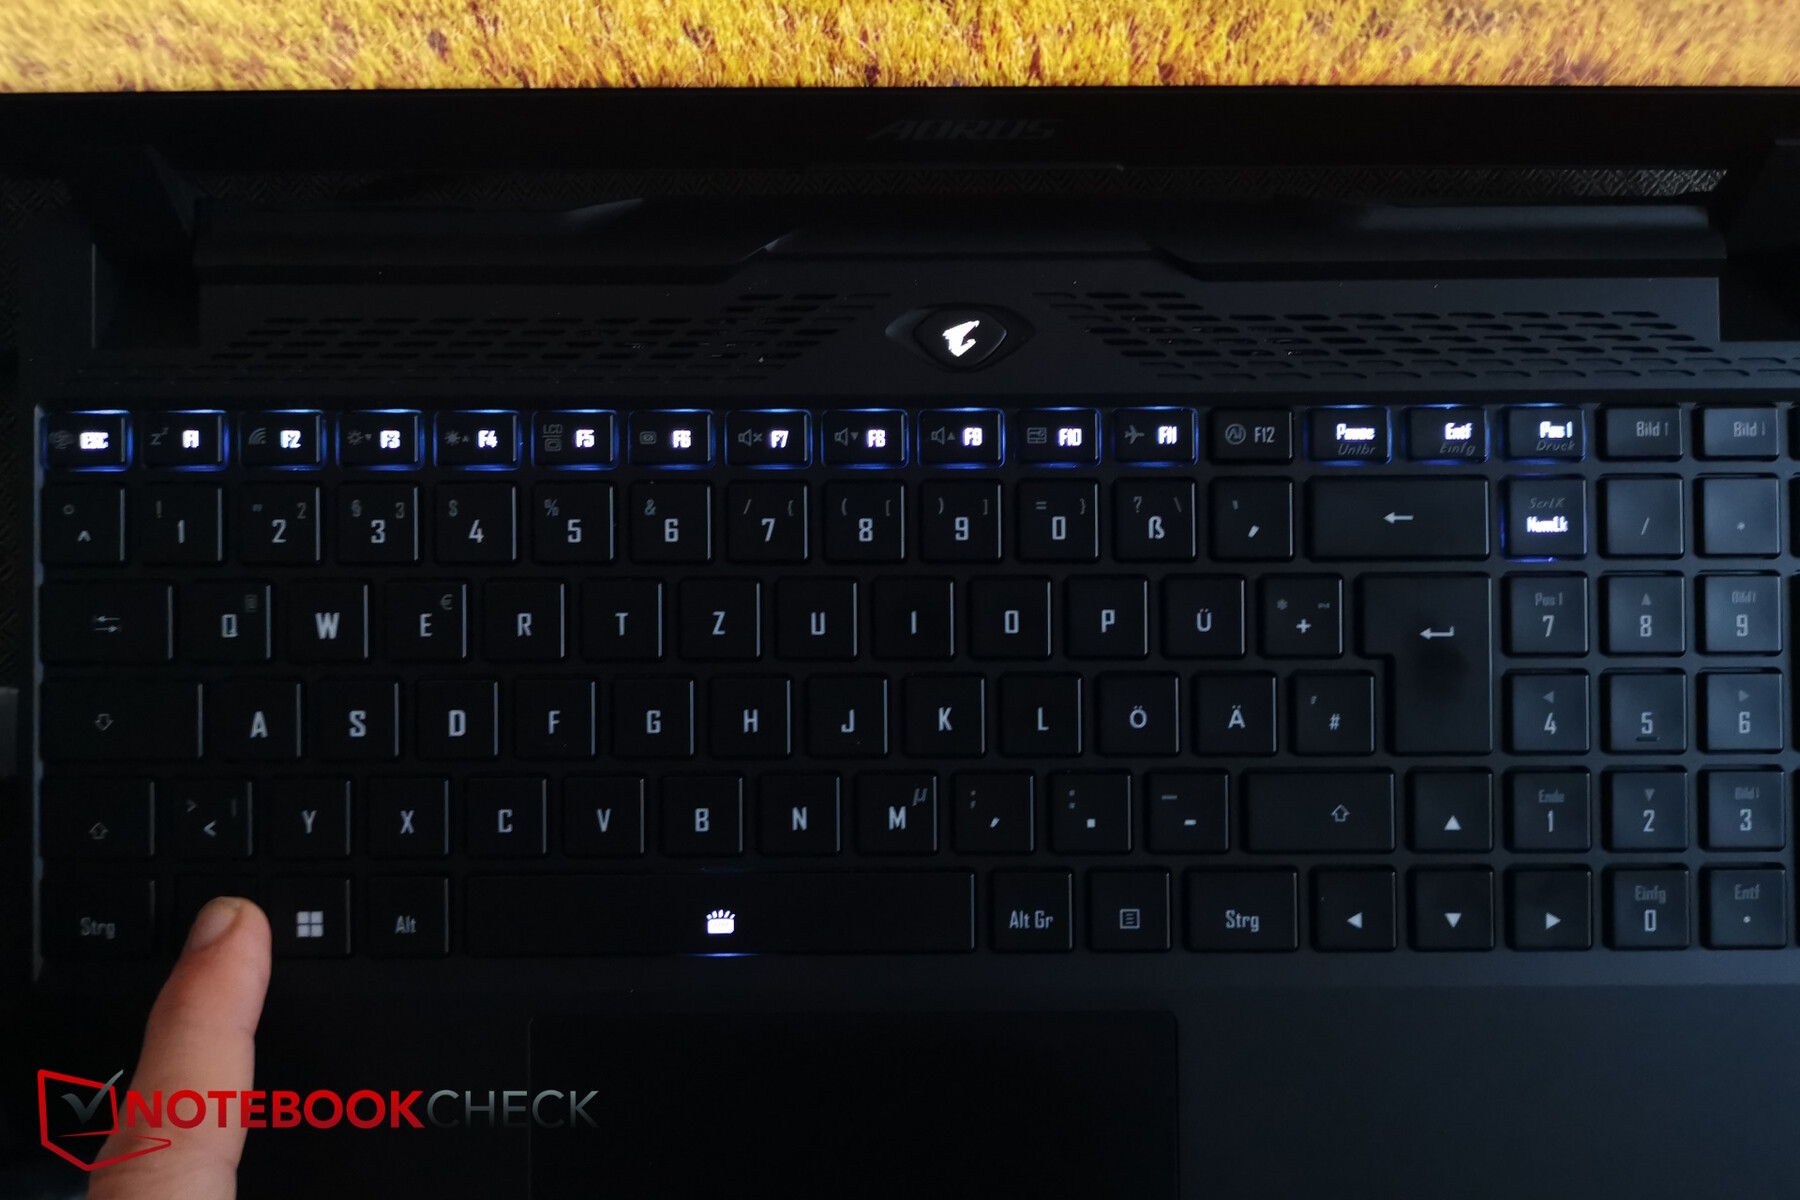
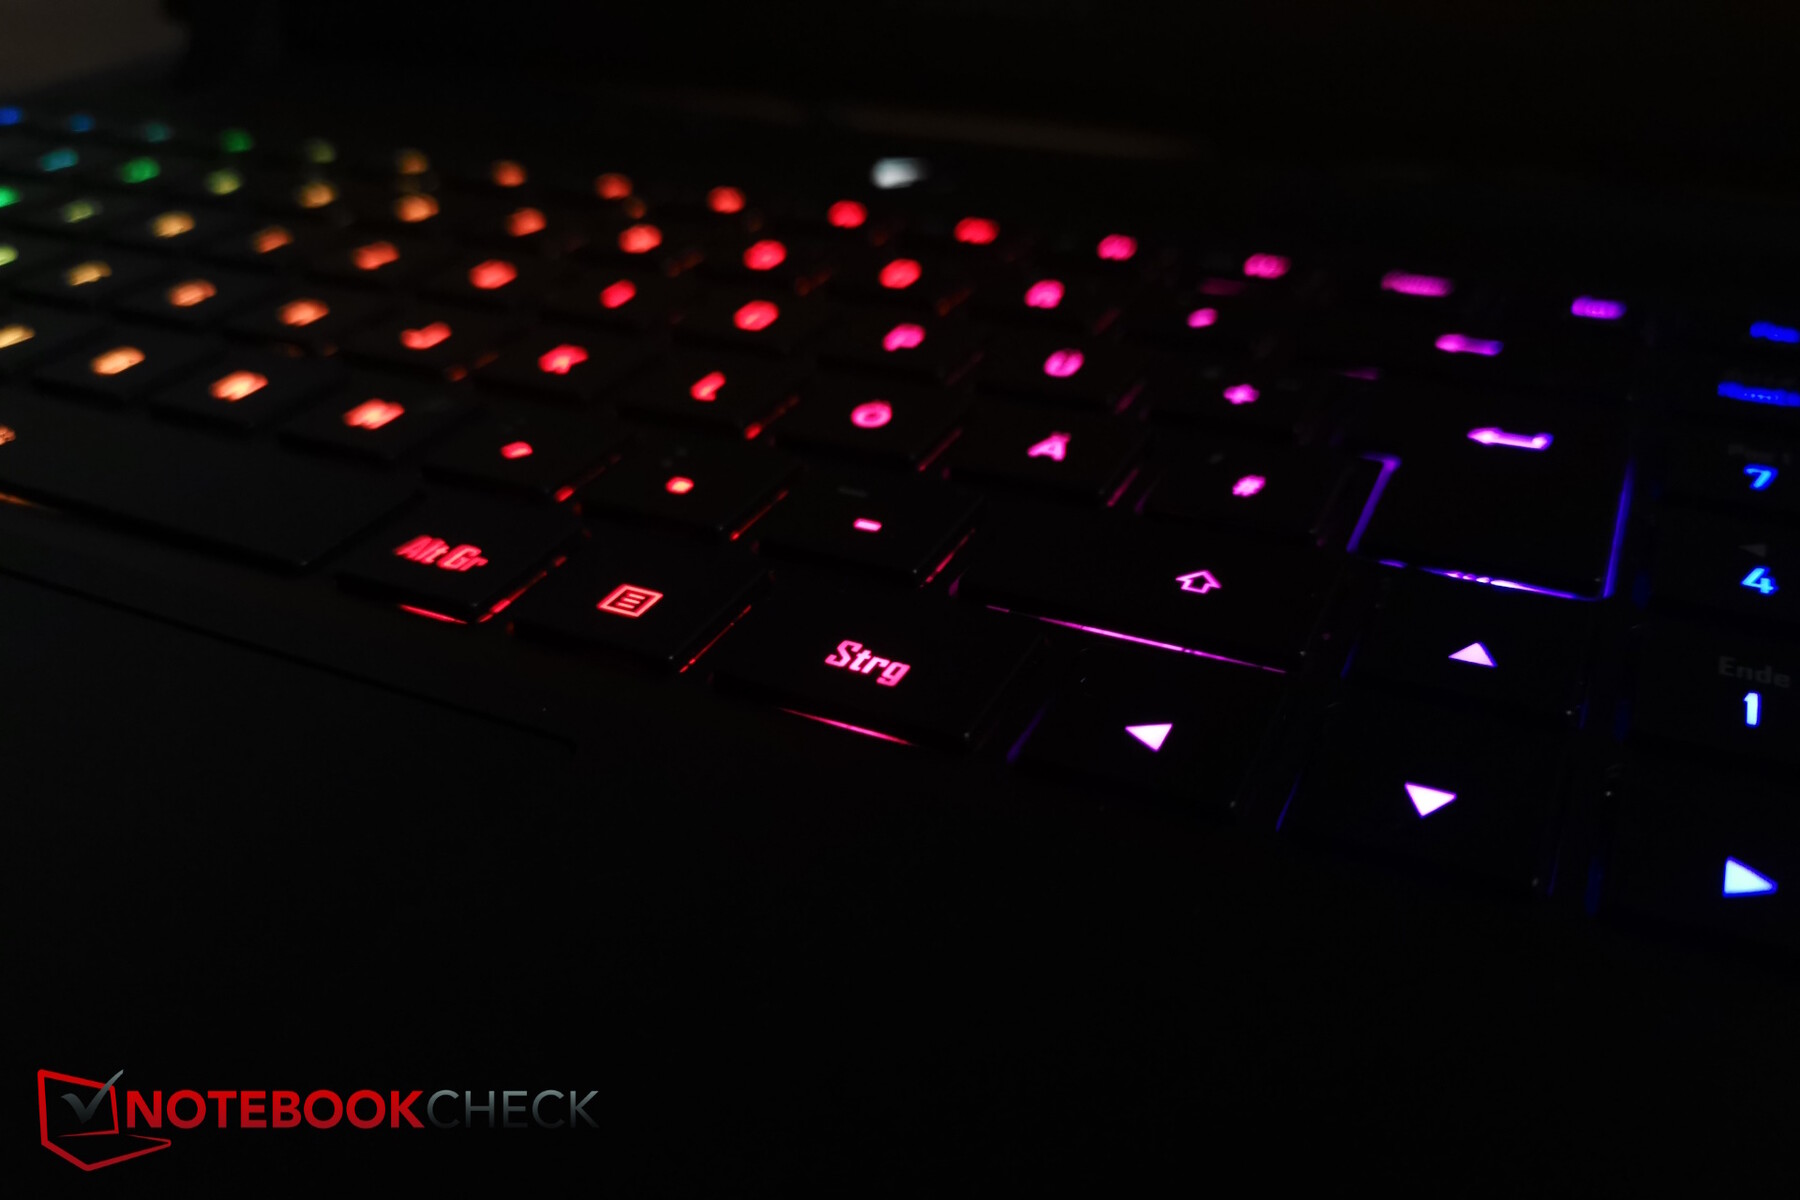
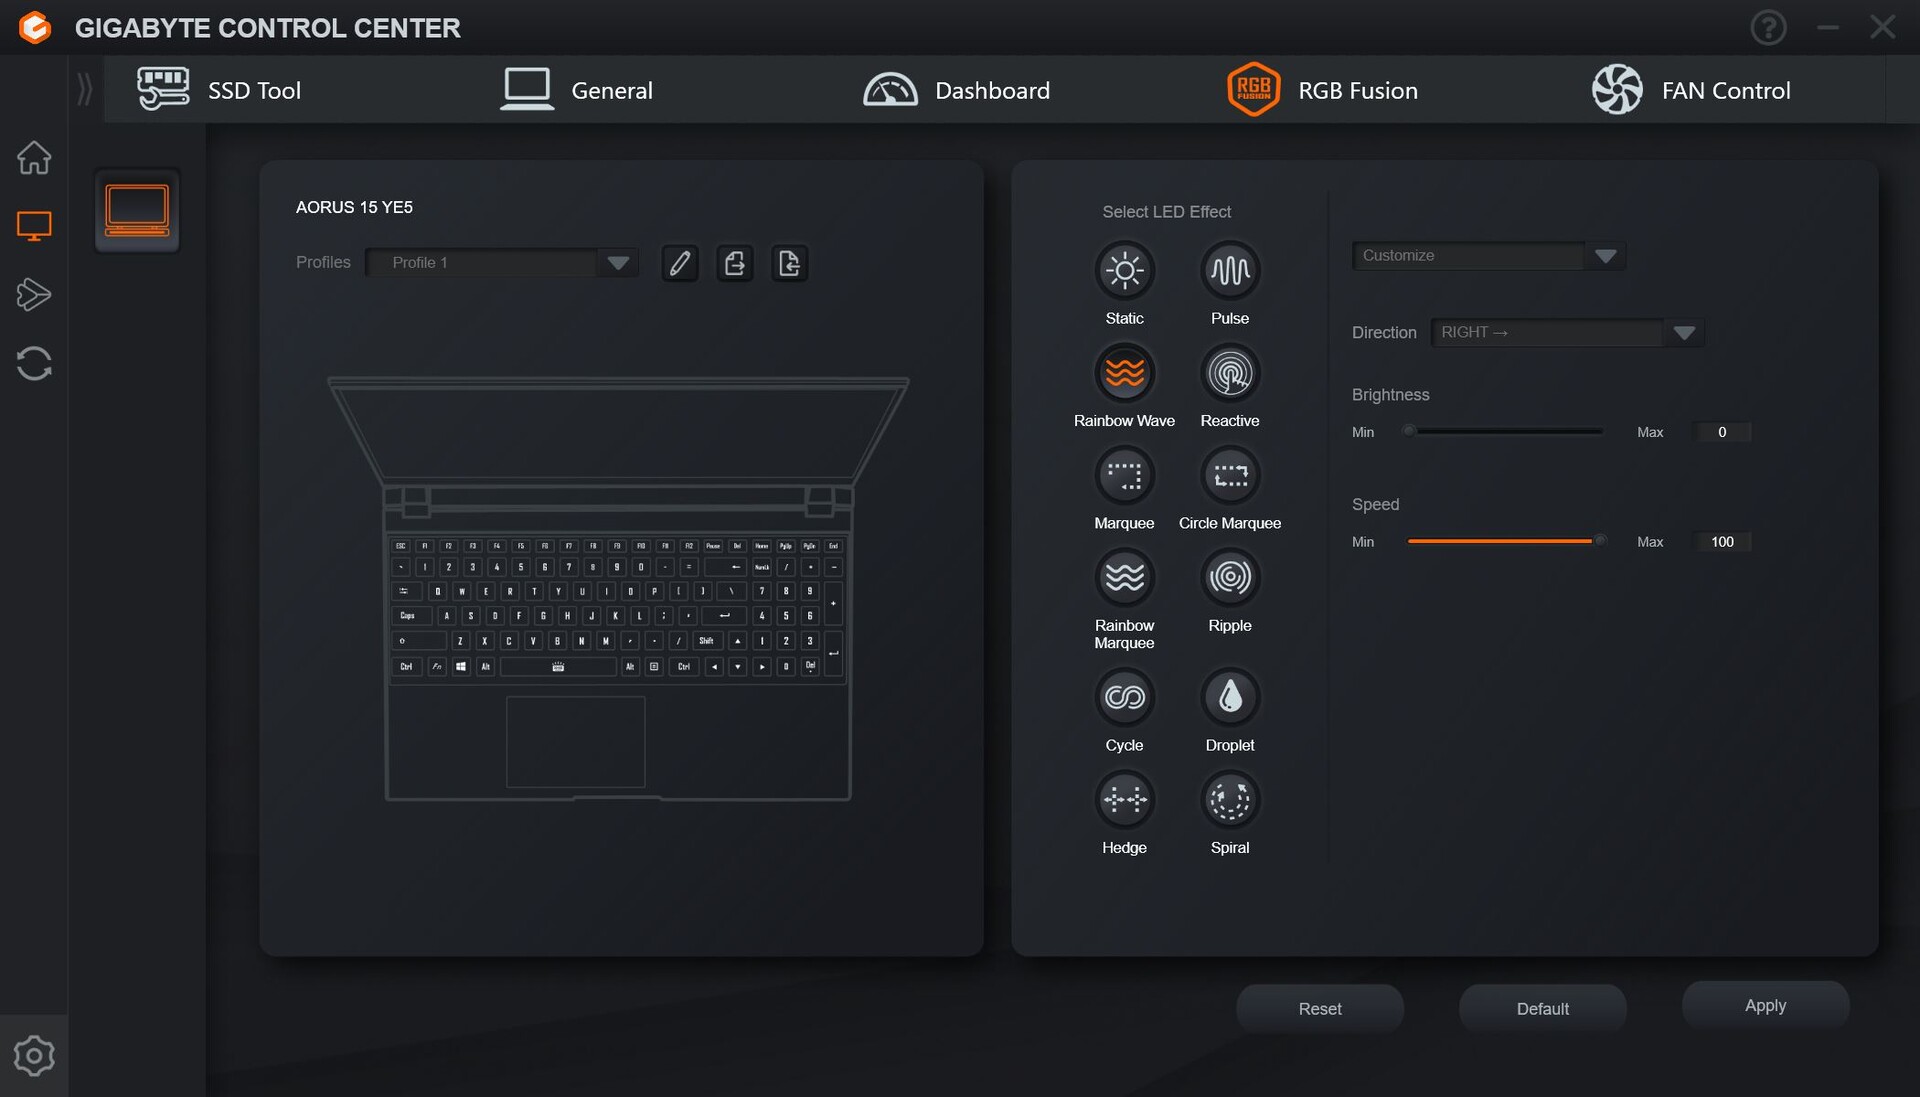
按键的背光可以实现各种 RGB 效果,但不能为每个按键单独设置,不过这些按键可以为某些效果(雨滴)亮起不同的颜色。实用:如果按下 fn 键,所有可与 fn 键组合创建特殊功能的按键都会亮起。不过,只有普通按键的标签(如 "F7")会发光,而特殊功能("静音")则不会发光,这导致在黑暗环境中无法识别 F 键的特殊功能。
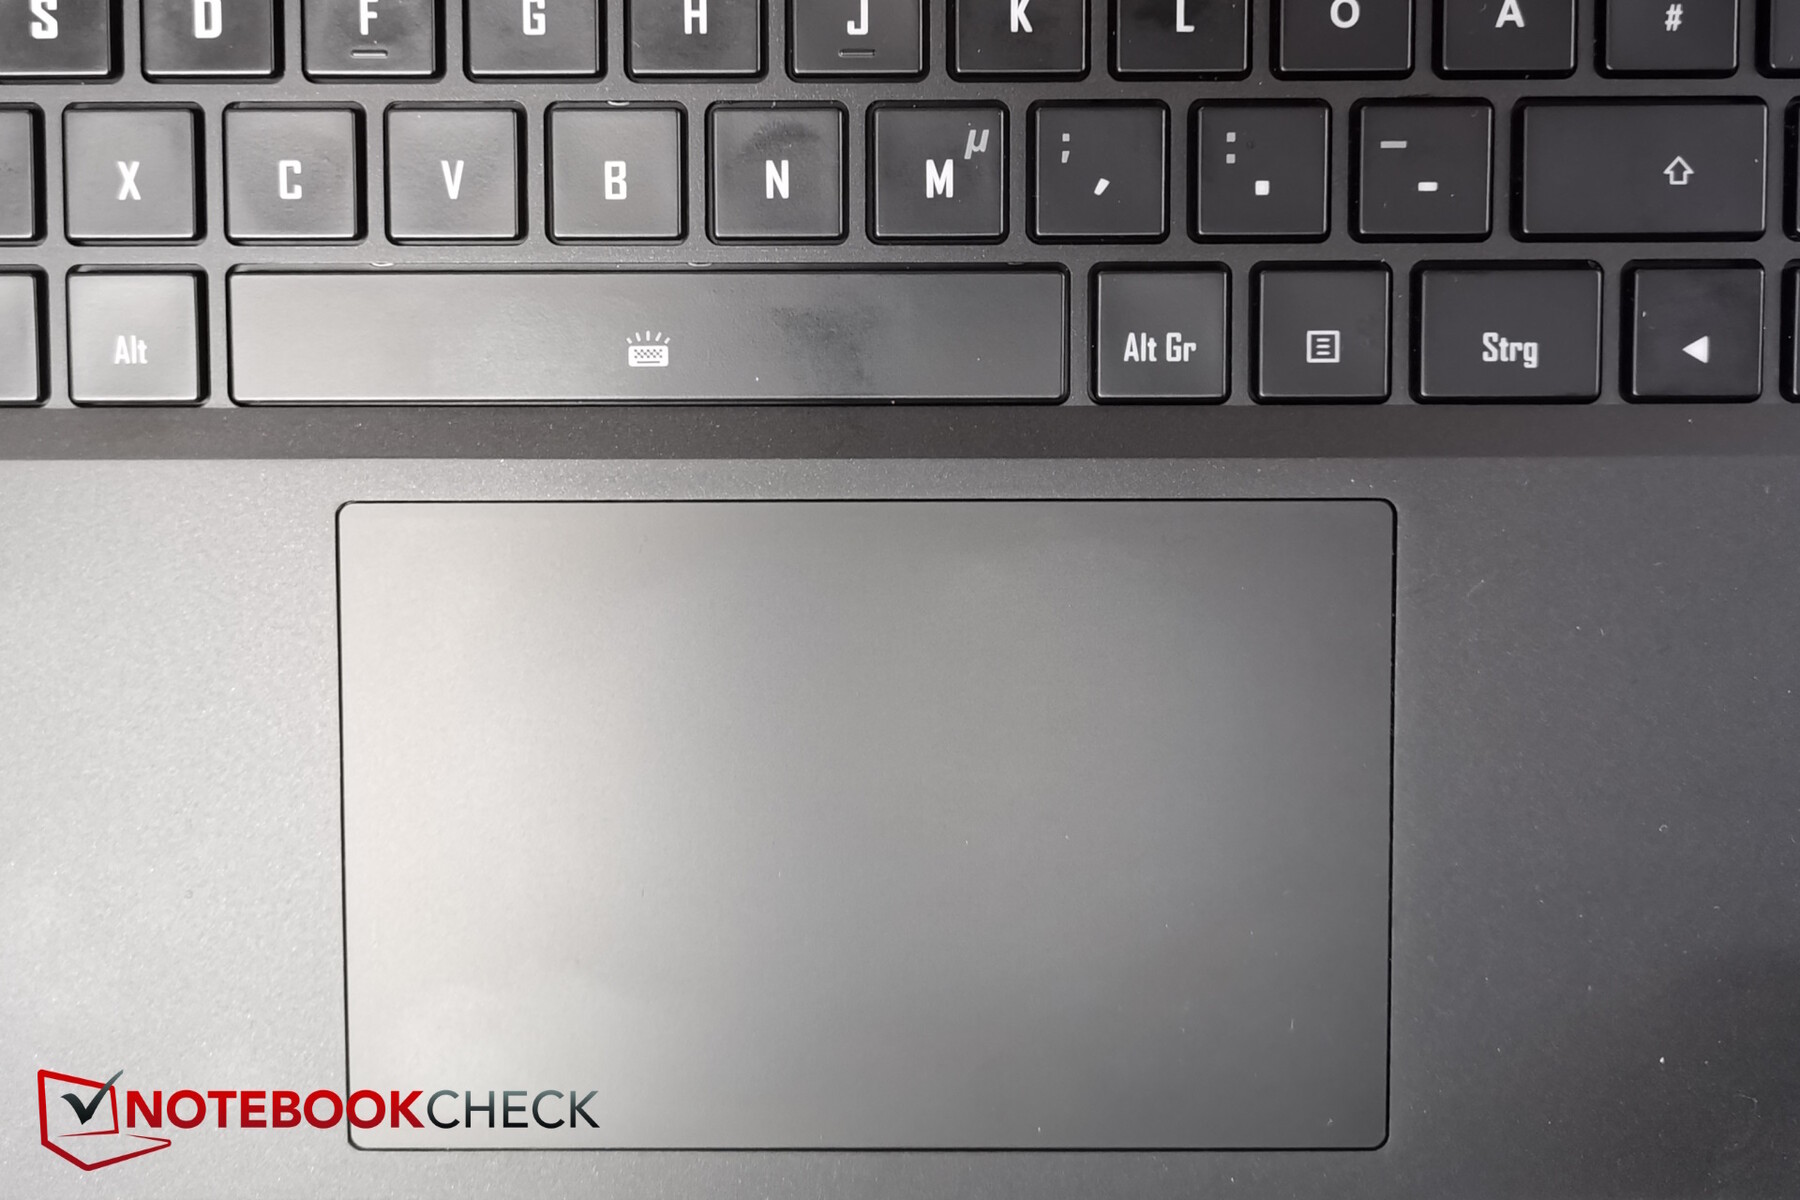
触摸板足够大(21.1 x 7.6 厘米),即使你的手没有完全干透,触摸起来也很顺滑。集成的点击按钮需要很大的力度,这意味着其压力点非常清晰。点击噪音适中。
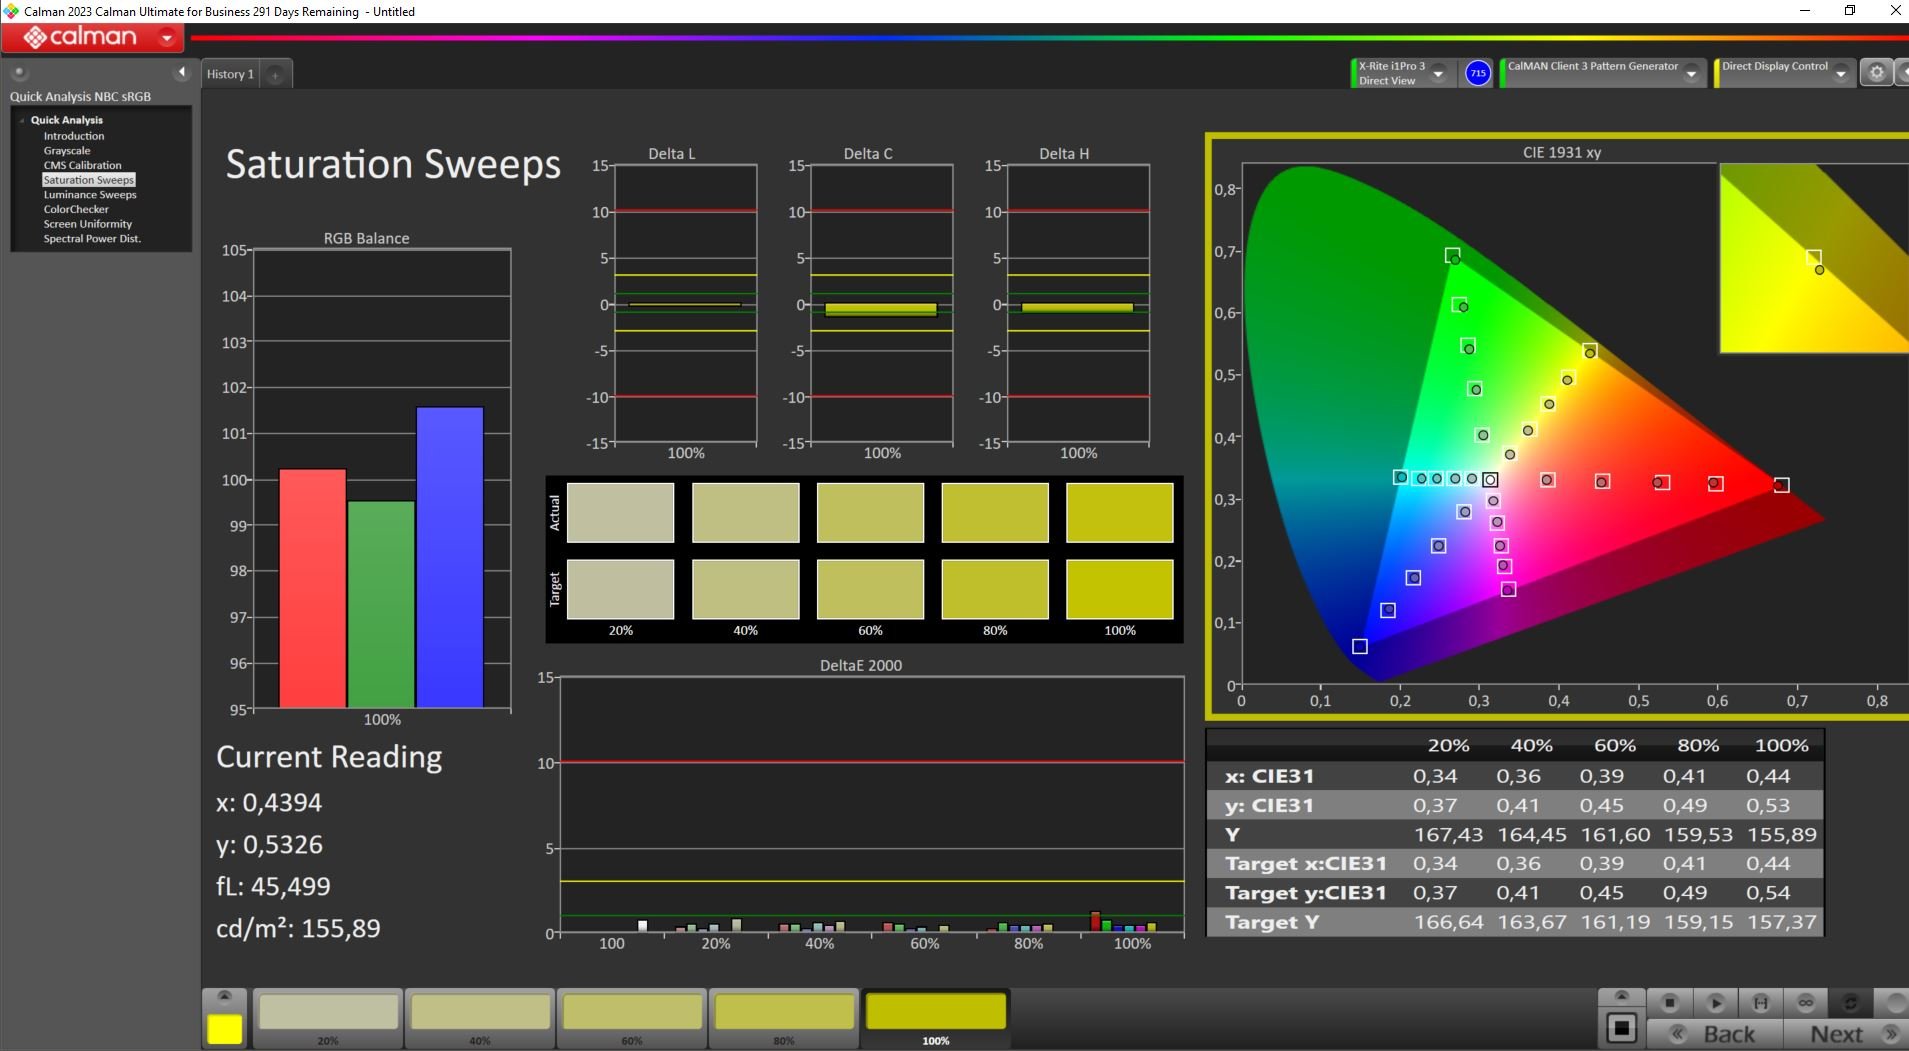
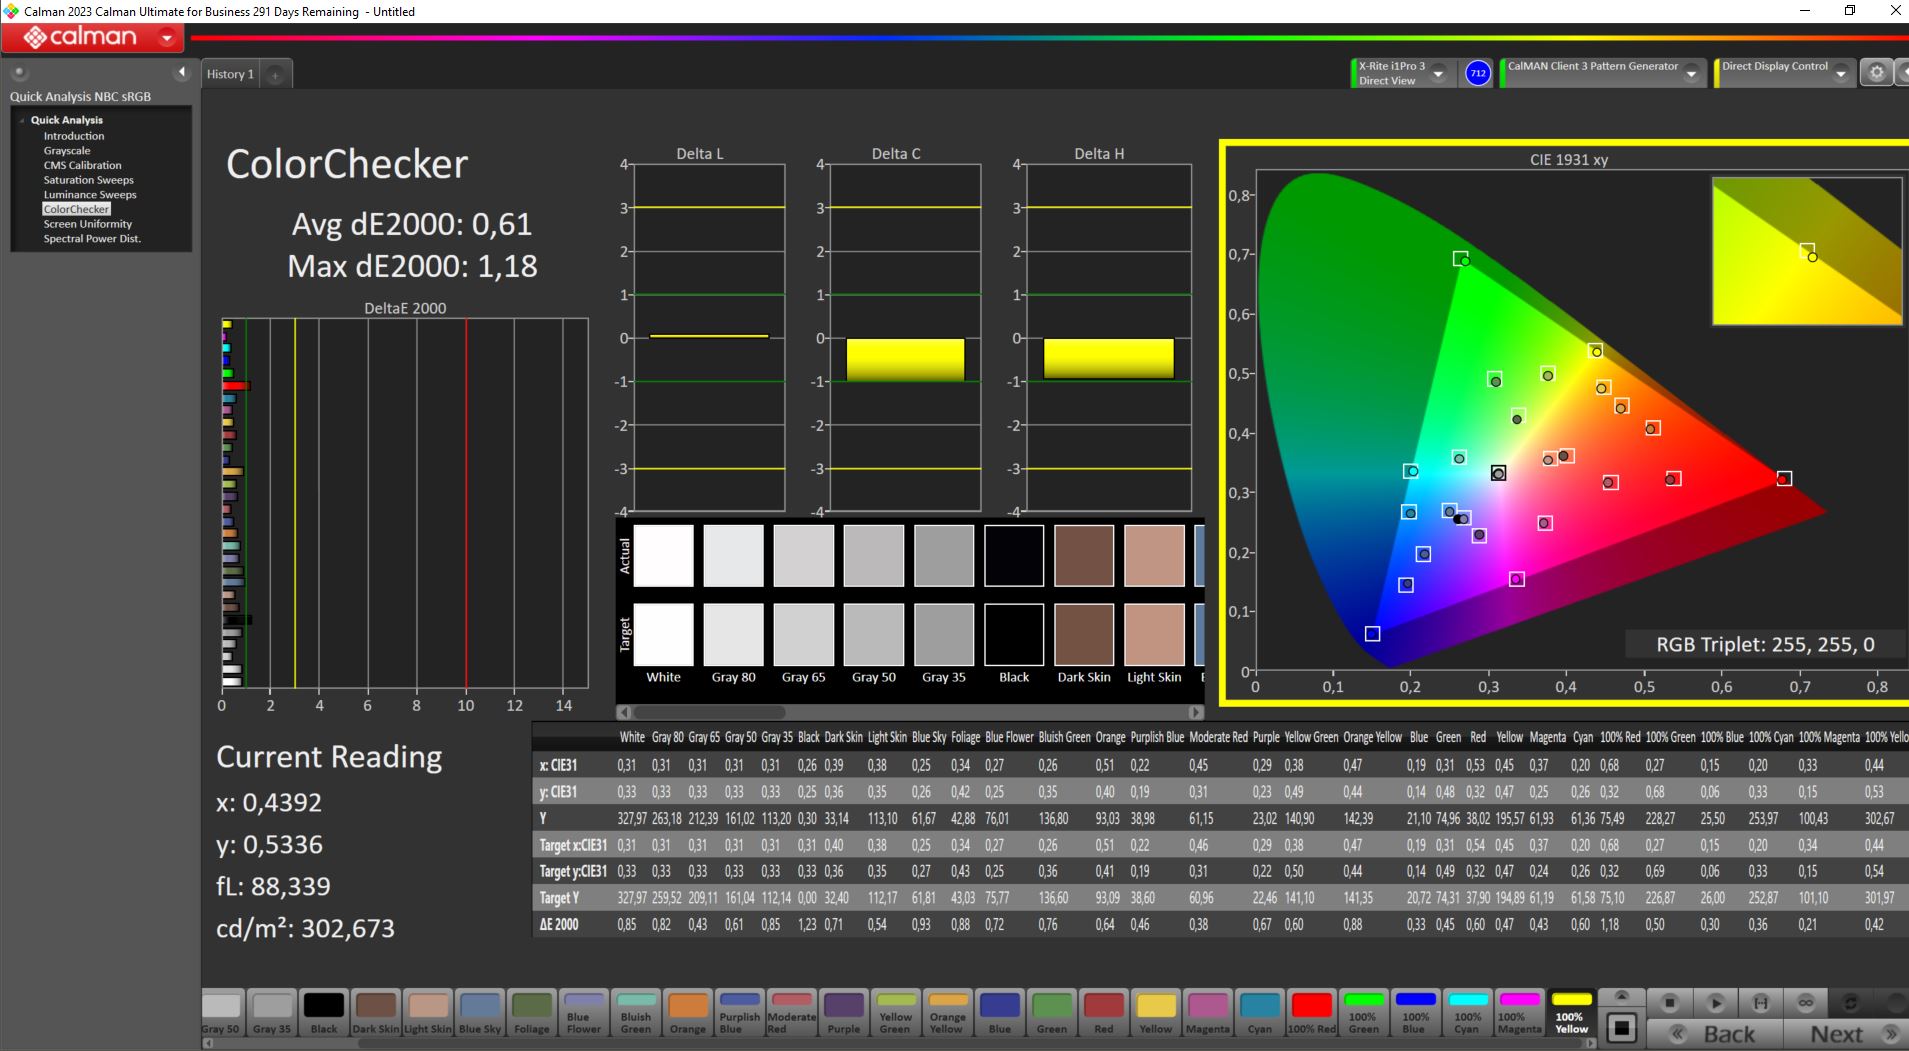
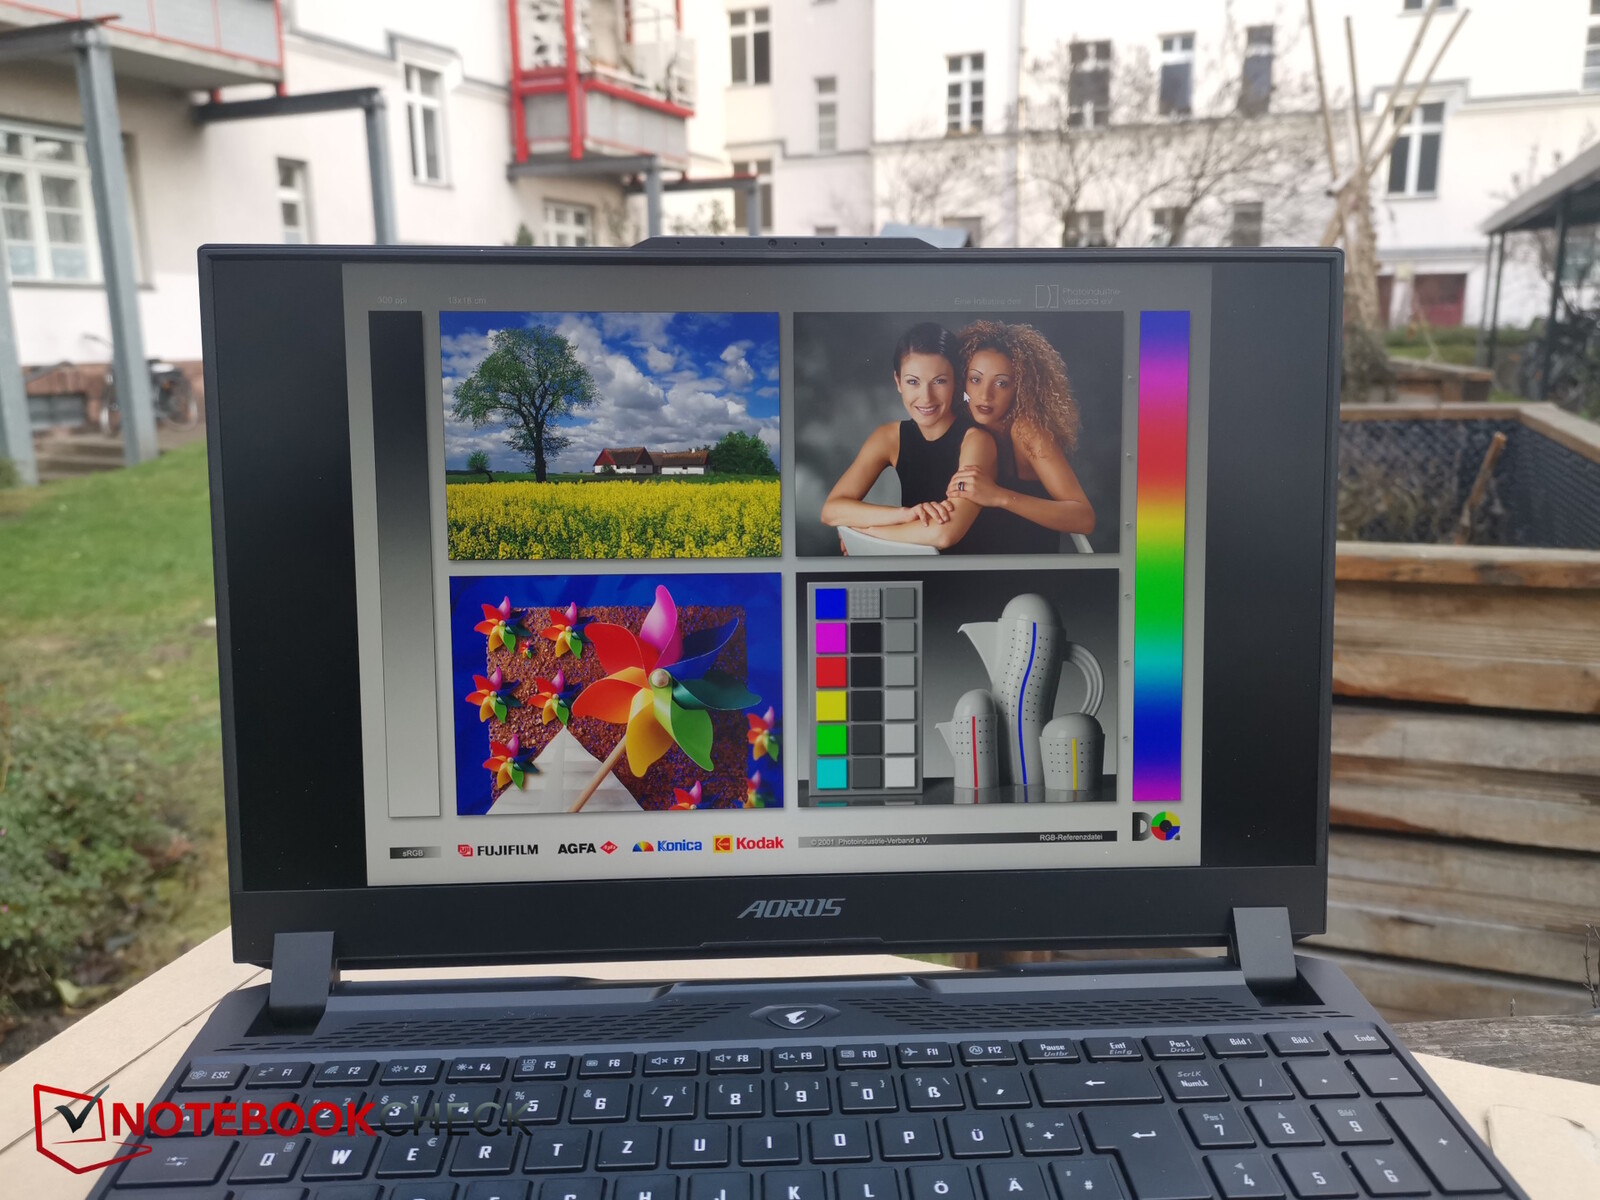
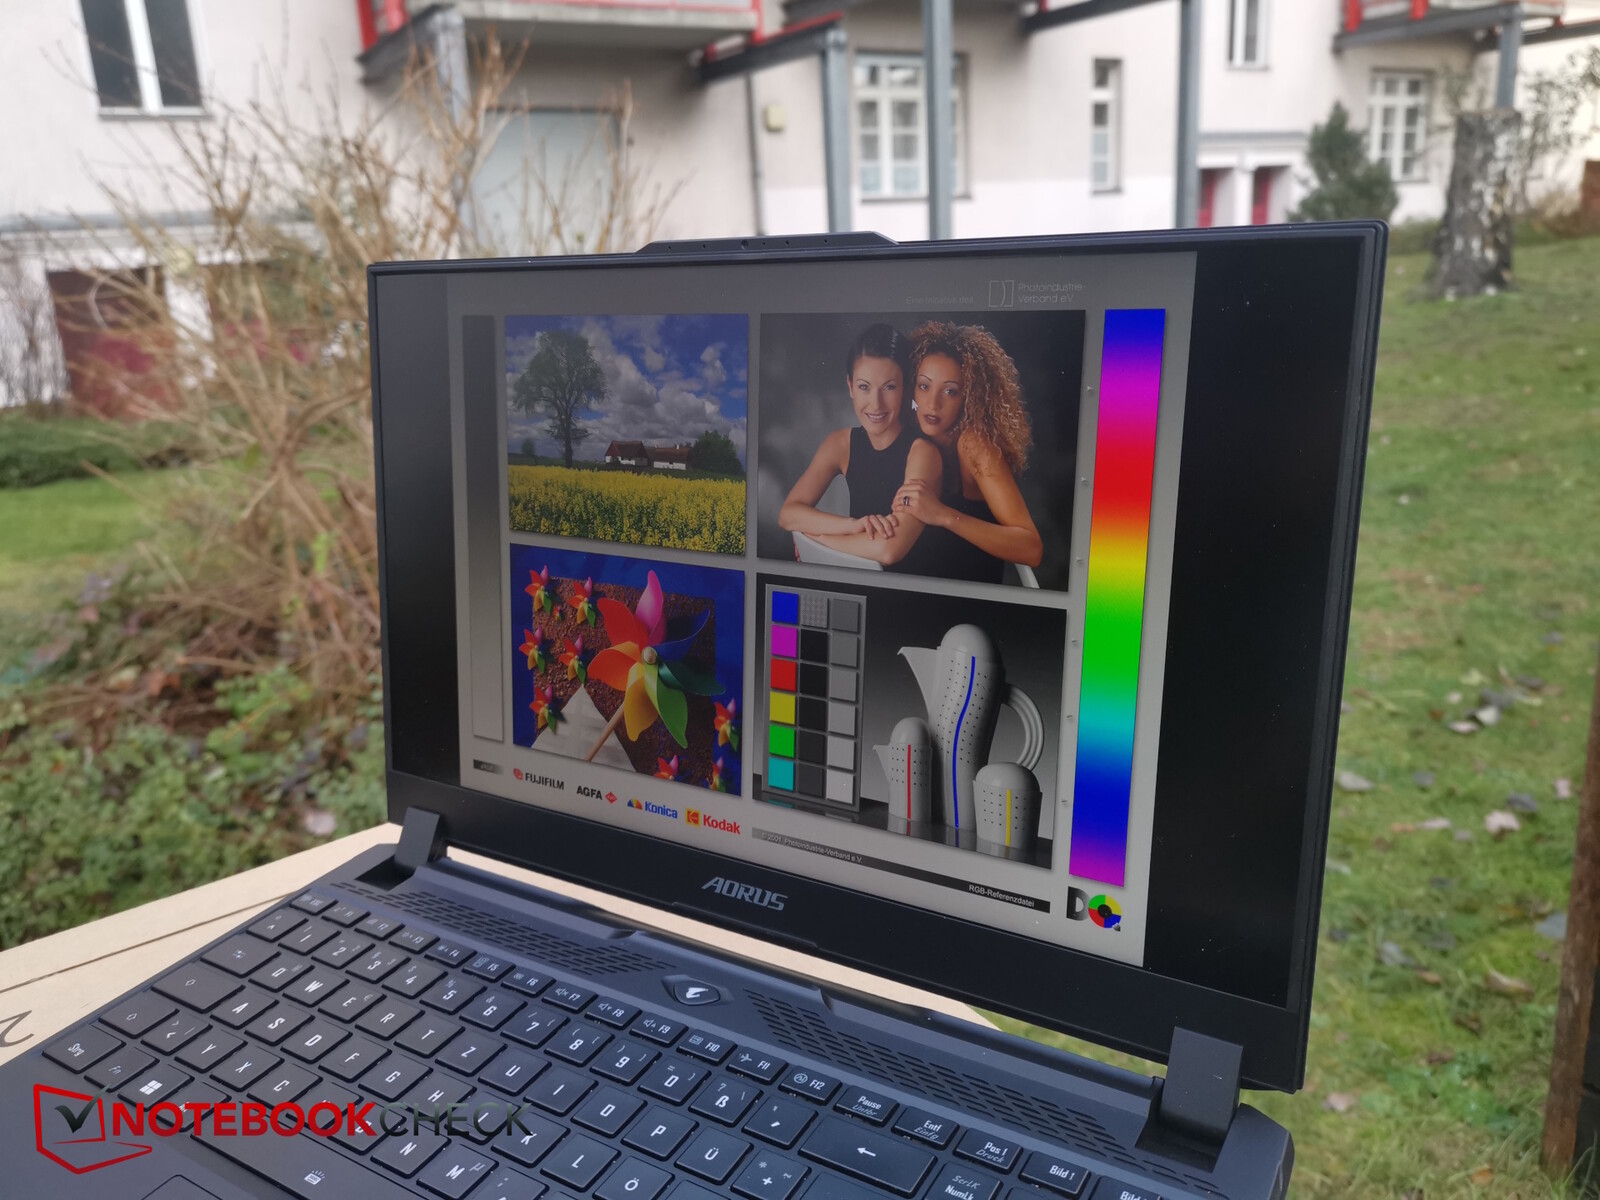
显示屏 - 1440p,色彩准确度高
这款 Aorus 笔记本电脑的 WQHD 雾面显示屏由奇美公司制造,并已用于 华硕 ROG Zephyrus G15中使用过。这款产品非常成功,因此在 2023 年也不会显得过时。2560 x 1440 像素的分辨率、165Hz 的刷新率、相对较快的响应时间和色彩空间覆盖率(100% sRGB、97% Display P3)同样令人印象深刻。屏幕亮度和对比度则一般。此外,还有一款刷新率为 360 赫兹的全高清机型。
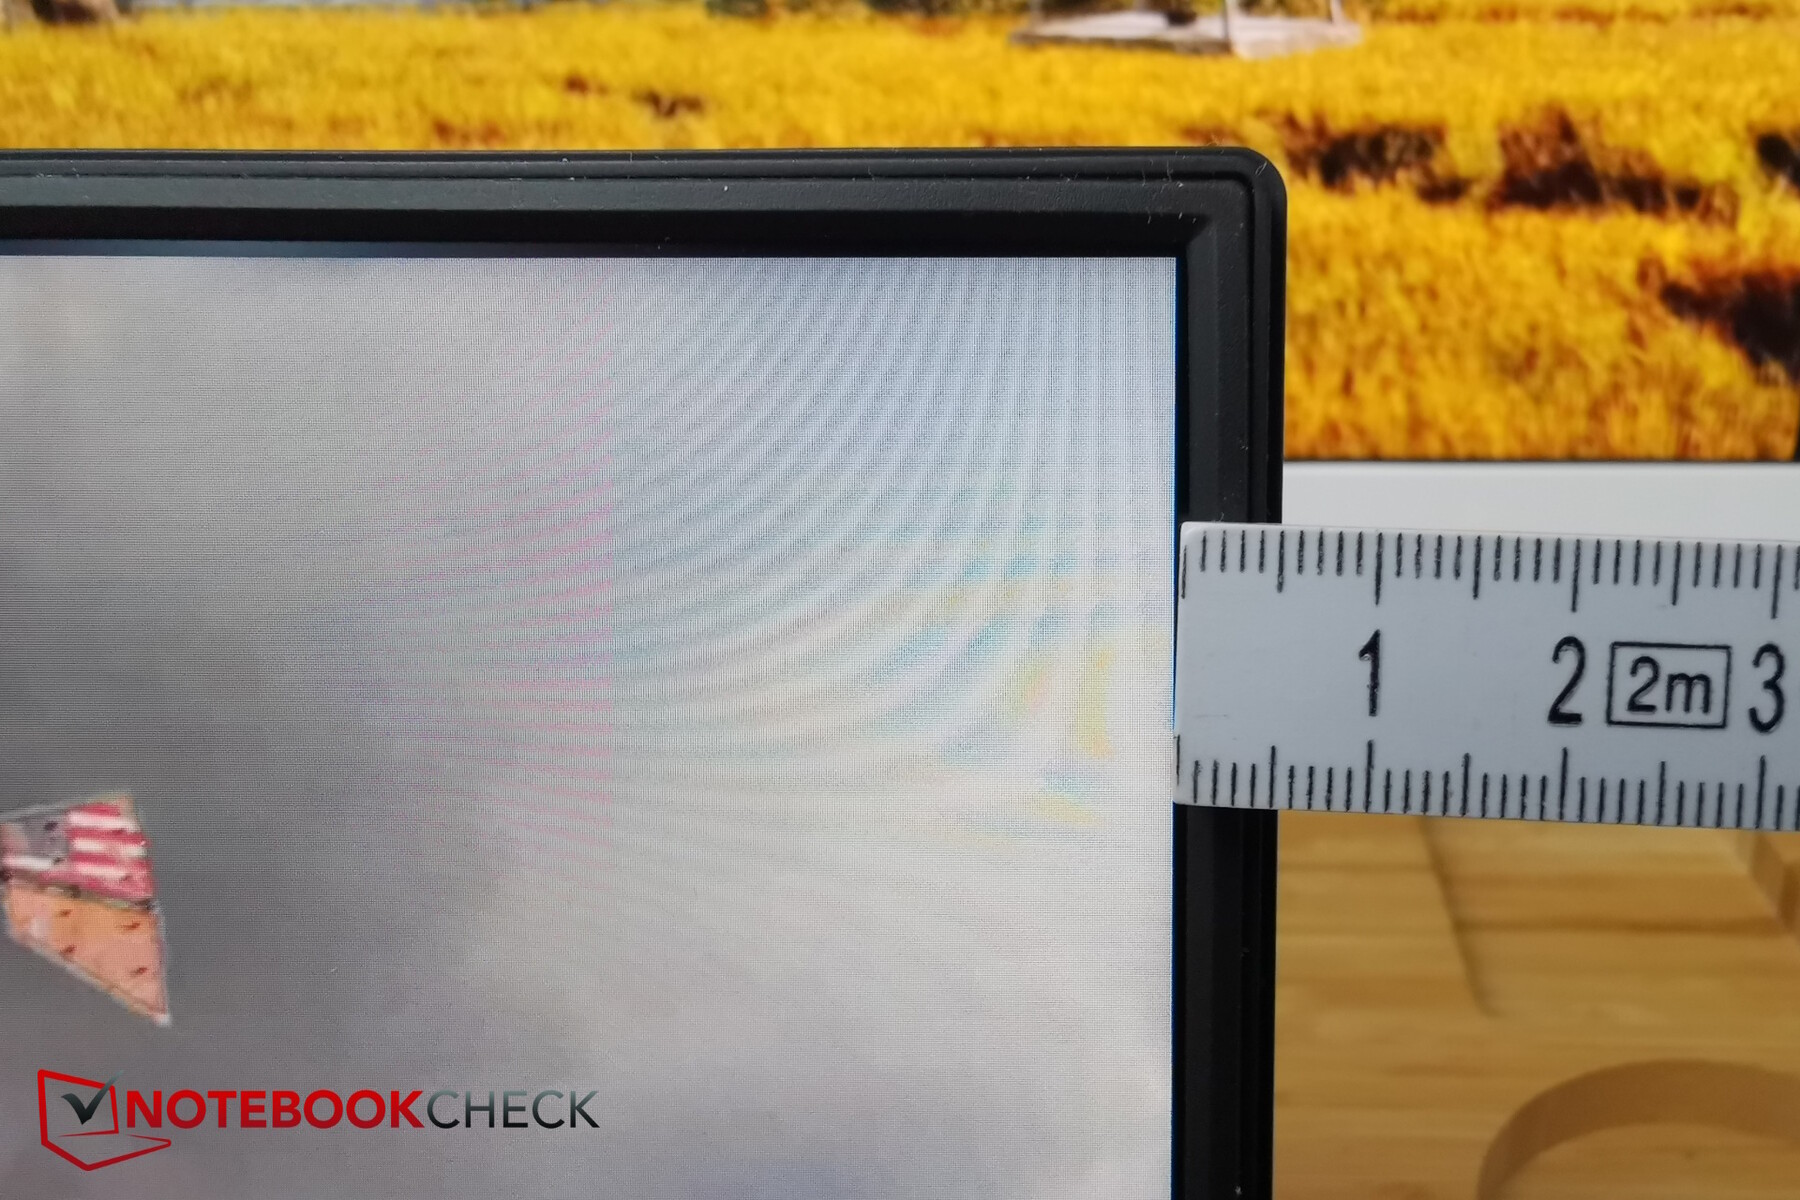
左下角和右上角边缘的背光出血现象非常明显,这一点不太理想。不过,PWM 并未用于亮度控制。其响应时间充其量只能算一般。

| |||||||||||||||||||||||||
Brightness Distribution: 81 %
Center on Battery: 350 cd/m²
Contrast: 939:1 (Black: 0.38 cd/m²)
ΔE ColorChecker Calman: 2.27 | ∀{0.5-29.43 Ø4.71}
calibrated: 0.61
ΔE Greyscale Calman: 3.67 | ∀{0.09-98 Ø4.96}
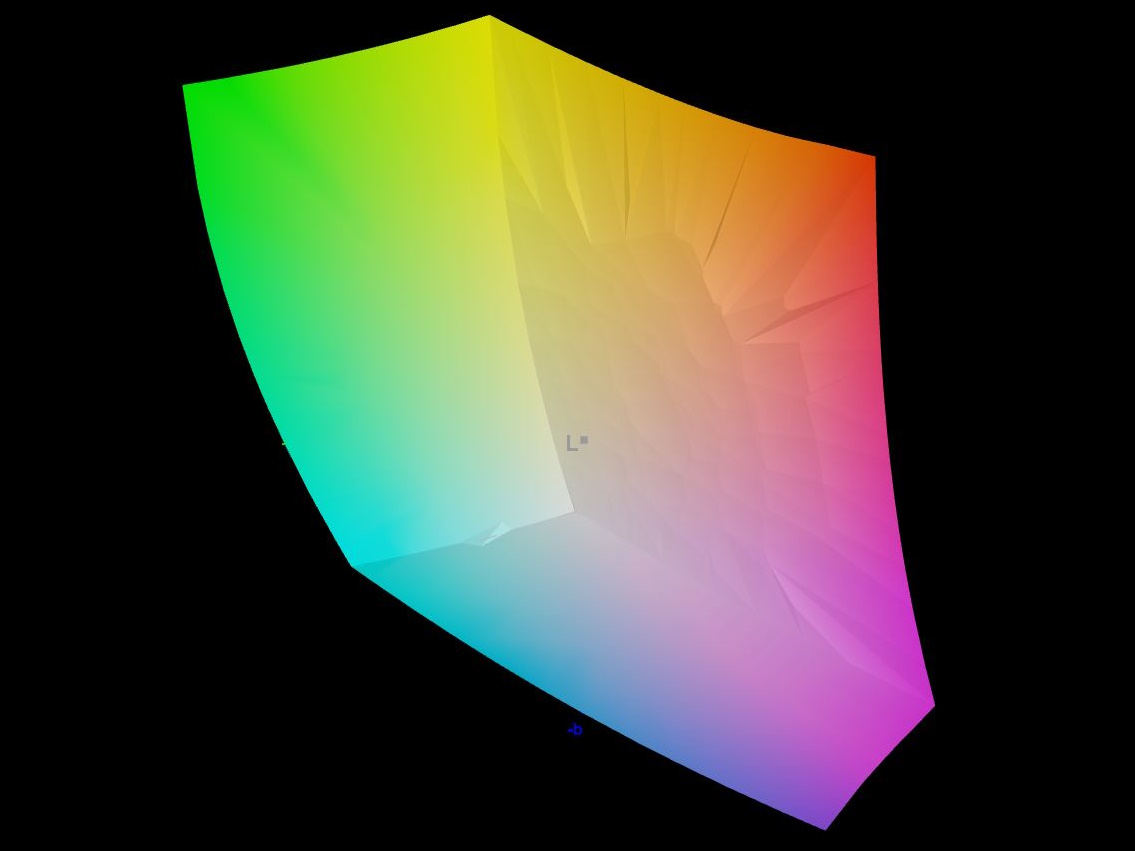
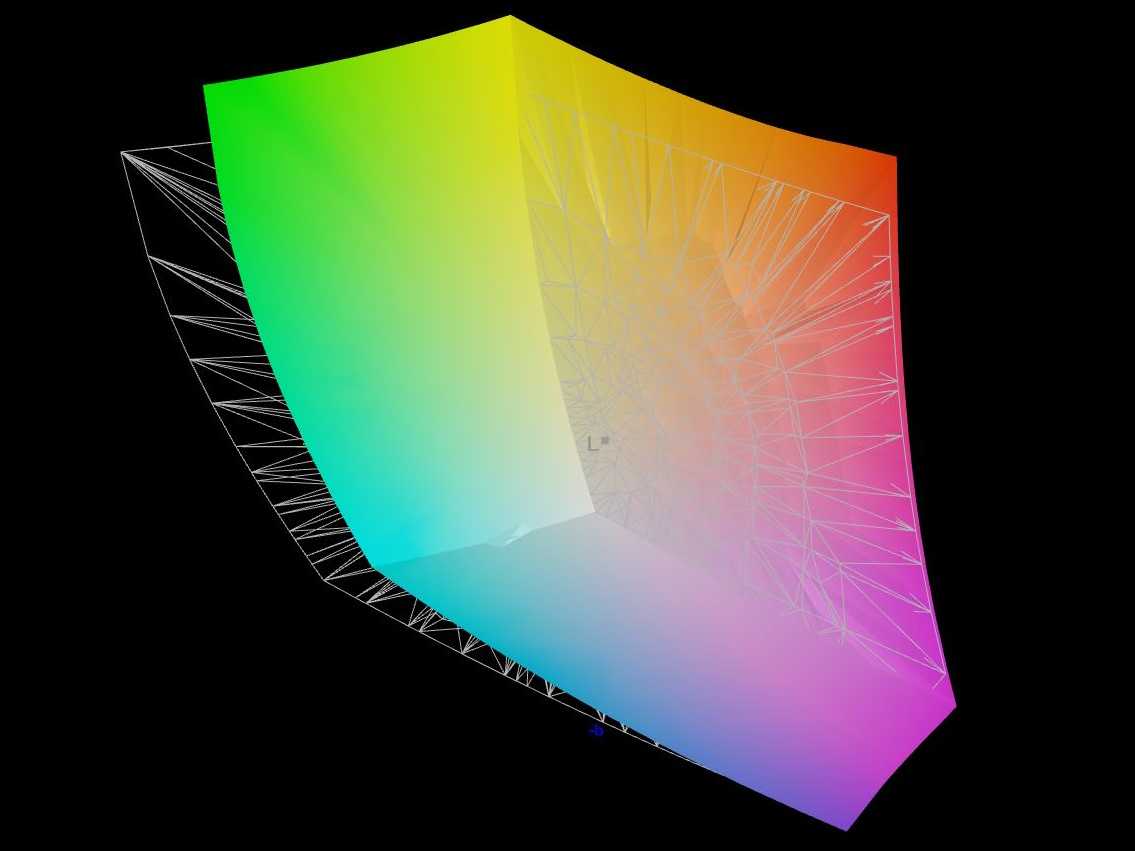
85.9% AdobeRGB 1998 (Argyll 3D)
100% sRGB (Argyll 3D)
97.7% Display P3 (Argyll 3D)
Gamma: 2.38
CCT: 7899 K
| Aorus 15 YE5-54DEB34SH Chi Mei CMN1540 (CMN N156KME-GNA), IPS, 2560x1440, 15.6" | Aorus 15 BSF Sharp LQ156T1JW05, IPS, 2560x1440, 15.6" | Captiva Advanced Gaming I74-121 BOE08B3, IPS, 1920x1080, 15.6" | HP Victus 16-r0077ng CMN162D, IPS, 1920x1080, 16.1" | Dell XPS 15 9530 RTX 4070 Samsung 156XG01, OLED, 3456x2160, 15.6" | HP Omen 16-wf000 BOE0B7D, IPS, 2560x1440, 16.1" | |
|---|---|---|---|---|---|---|
| Display | 0% | -21% | -18% | 6% | -16% | |
| Display P3 Coverage (%) | 97.7 | 98.2 1% | 64 -34% | 66.7 -32% | 99.8 2% | 69 -29% |
| sRGB Coverage (%) | 100 | 99.9 0% | 93.2 -7% | 98 -2% | 100 0% | 99.2 -1% |
| AdobeRGB 1998 Coverage (%) | 85.9 | 85.7 0% | 66 -23% | 69 -20% | 98.4 15% | 71.2 -17% |
| Response Times | 40% | 55% | 30% | 87% | 47% | |
| Response Time Grey 50% / Grey 80% * (ms) | 18.9 ? | 11.3 ? 40% | 5 ? 74% | 13.3 ? 30% | 1.68 ? 91% | 4.6 ? 76% |
| Response Time Black / White * (ms) | 11.7 ? | 7 ? 40% | 7.55 ? 35% | 8.2 ? 30% | 1.94 ? 83% | 9.7 ? 17% |
| PWM Frequency (Hz) | 239 | |||||
| Screen | -34% | -28% | 15% | -36% | 7% | |
| Brightness middle (cd/m²) | 357 | 299 -16% | 346 -3% | 308 -14% | 389.5 9% | 310.9 -13% |
| Brightness (cd/m²) | 322 | 282 -12% | 324 1% | 285 -11% | 392 22% | 296 -8% |
| Brightness Distribution (%) | 81 | 82 1% | 90 11% | 85 5% | 98 21% | 91 12% |
| Black Level * (cd/m²) | 0.38 | 0.31 18% | 0.35 8% | 0.25 34% | 0.35 8% | |
| Contrast (:1) | 939 | 965 3% | 989 5% | 1232 31% | 888 -5% | |
| Colorchecker dE 2000 * | 2.27 | 2.24 1% | 4.12 -81% | 1.3 43% | 4.95 -118% | 2.18 4% |
| Colorchecker dE 2000 max. * | 4.72 | 4.29 9% | 7.78 -65% | 2.76 42% | 8.65 -83% | 3.58 24% |
| Colorchecker dE 2000 calibrated * | 0.61 | 2.62 -330% | 1.22 -100% | 0.92 -51% | 1.53 -151% | 0.52 15% |
| Greyscale dE 2000 * | 3.67 | 3 18% | 4.81 -31% | 1.7 54% | 2 46% | 2.8 24% |
| Gamma | 2.38 92% | 2.086 105% | 2.31 95% | 2.167 102% | 2.27 97% | 2.18 101% |
| CCT | 7899 82% | 6289 103% | 7633 85% | 6767 96% | 6265 104% | 6002 108% |
| Total Average (Program / Settings) | 2% /
-16% | 2% /
-15% | 9% /
10% | 19% /
-5% | 13% /
8% |
* ... smaller is better
虽然显示器没有经过最佳校准,但我们使用 X-Rite Fab 测量设备和 Calman 软件进行了校准,将灰度和色彩的 DeltaE 值(对(色彩)偏差很重要)降至远低于 1。加上其良好的色彩空间覆盖率(见下面最后一排图片),该显示器也适用于半专业的图像和视频编辑。

Display Response Times
| ↔ Response Time Black to White | ||
|---|---|---|
| 11.7 ms ... rise ↗ and fall ↘ combined | ↗ 7.2 ms rise | 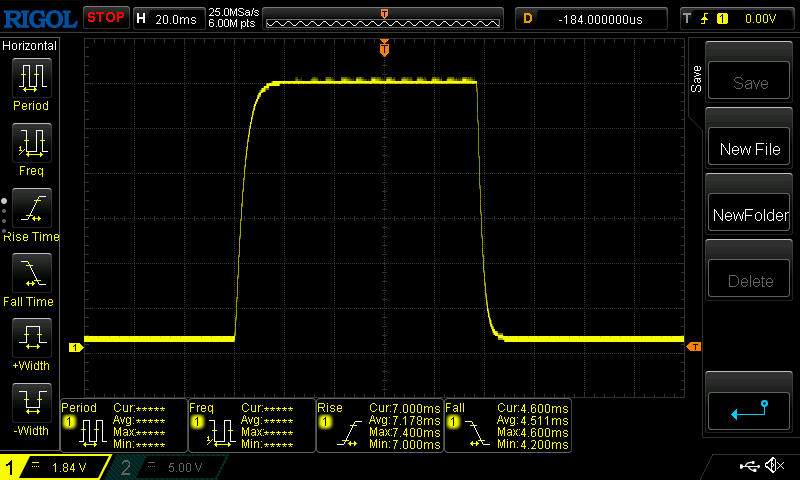 |
| ↘ 4.5 ms fall | ||
| The screen shows good response rates in our tests, but may be too slow for competitive gamers. In comparison, all tested devices range from 0.1 (minimum) to 240 (maximum) ms. » 32 % of all devices are better. This means that the measured response time is better than the average of all tested devices (19.8 ms). | ||
| ↔ Response Time 50% Grey to 80% Grey | ||
| 18.9 ms ... rise ↗ and fall ↘ combined | ↗ 9.4 ms rise | 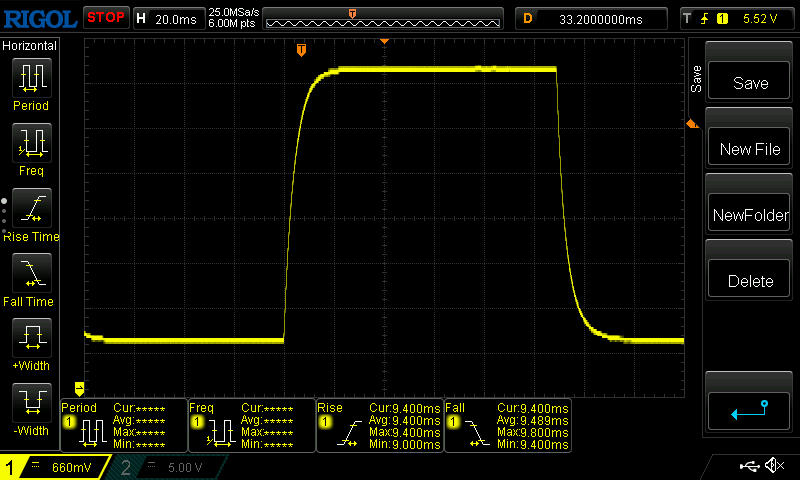 |
| ↘ 9.5 ms fall | ||
| The screen shows good response rates in our tests, but may be too slow for competitive gamers. In comparison, all tested devices range from 0.165 (minimum) to 636 (maximum) ms. » 33 % of all devices are better. This means that the measured response time is better than the average of all tested devices (31 ms). | ||
Screen Flickering / PWM (Pulse-Width Modulation)
| Screen flickering / PWM not detected | 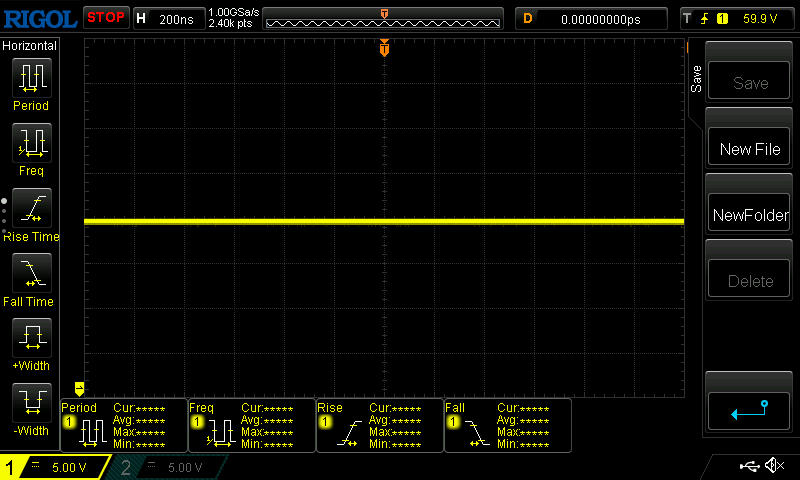 | ||
In comparison: 52 % of all tested devices do not use PWM to dim the display. If PWM was detected, an average of 7754 (minimum: 5 - maximum: 343500) Hz was measured. | |||
得益于超过 300 尼特的亮度和亚光表面,该笔记本电脑的屏幕内容在阴暗环境下依然清晰可见。

性能 - 上一代产品依然出色
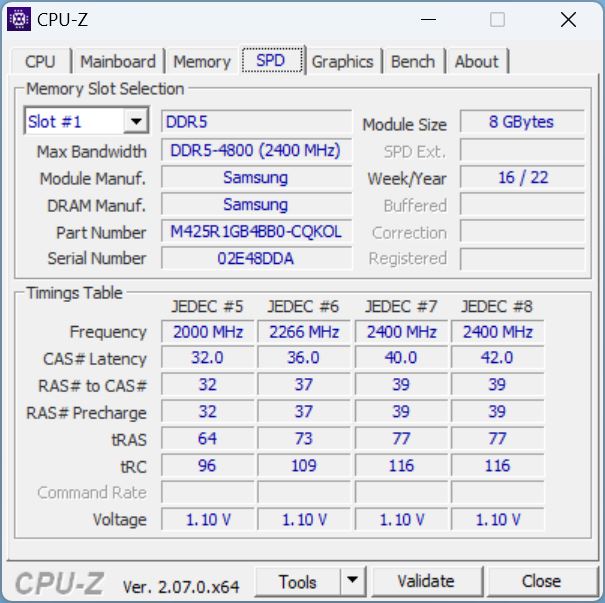
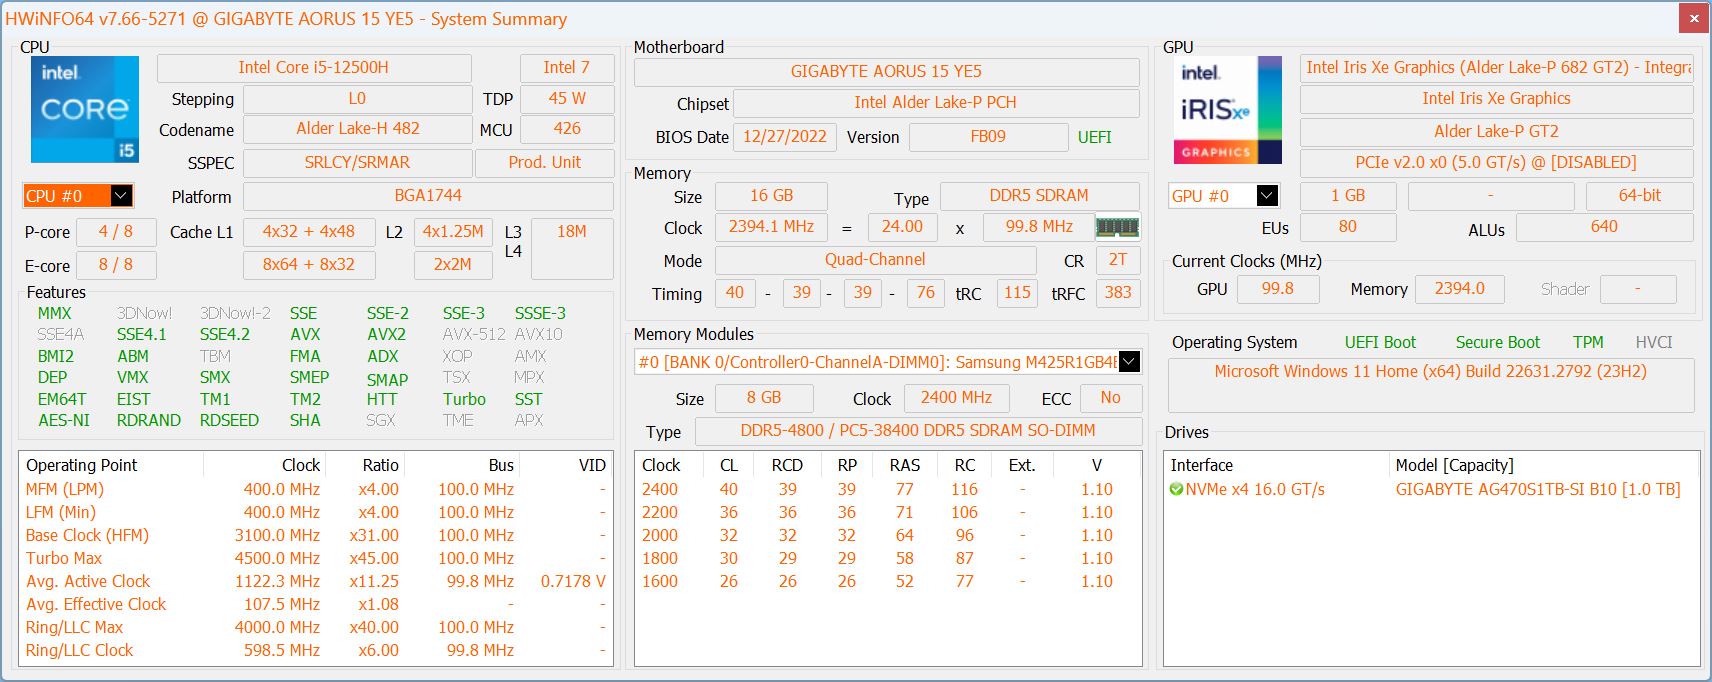
上一代 CPU 和 GPU 为系统提供动力。较旧的 酷睿 i5-12500H可使用 16 GB 现代 DDR5 4800 内存和技嘉 1 TB NVMe SSD。再加上 RTX 3080 Ti,Aorus 15 YE5 绝对可以被归类为高端游戏玩家--尽管它采用的是上一代的中端 CPU。
测试条件
Ex works,笔记本电脑没有预装控制中心 - 如果需要,应该可以从技嘉支持网站下载。如果需要,也可以从技嘉支持网站下载。
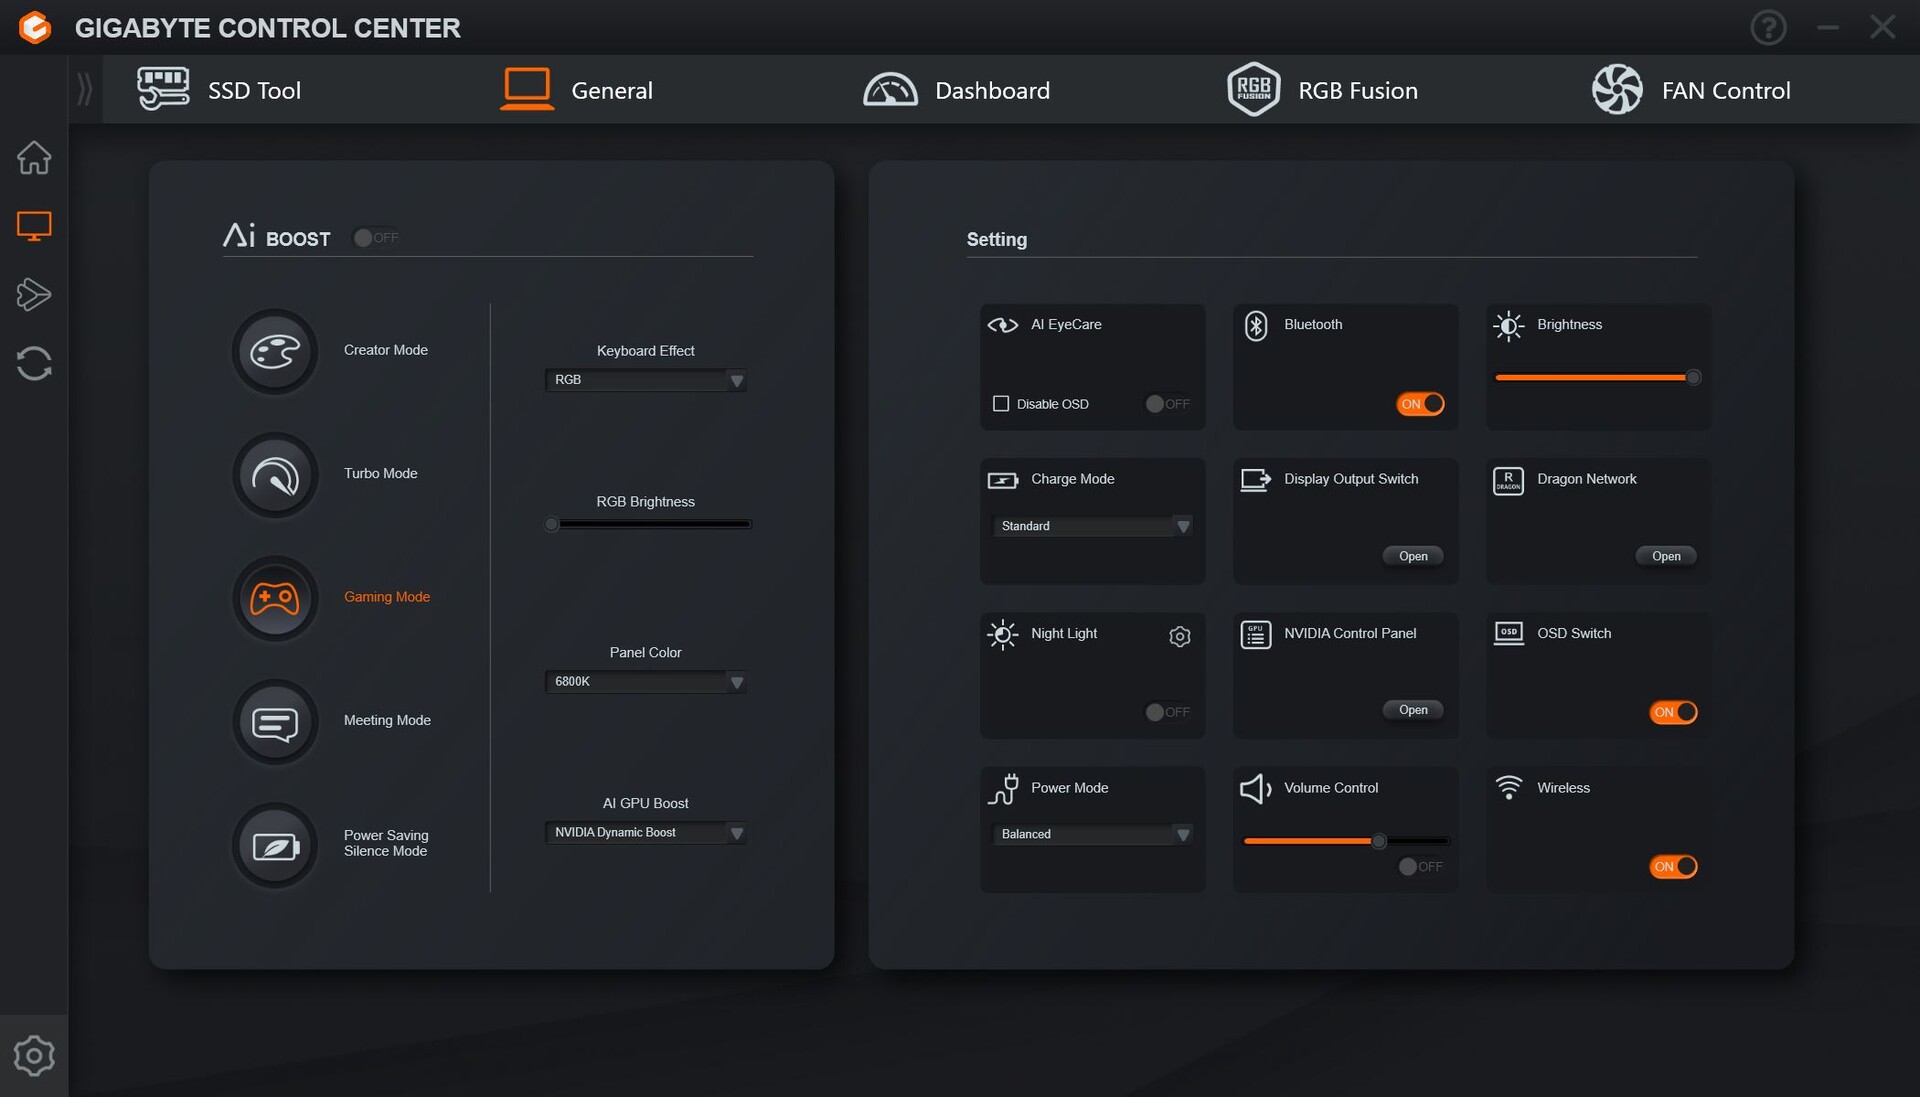
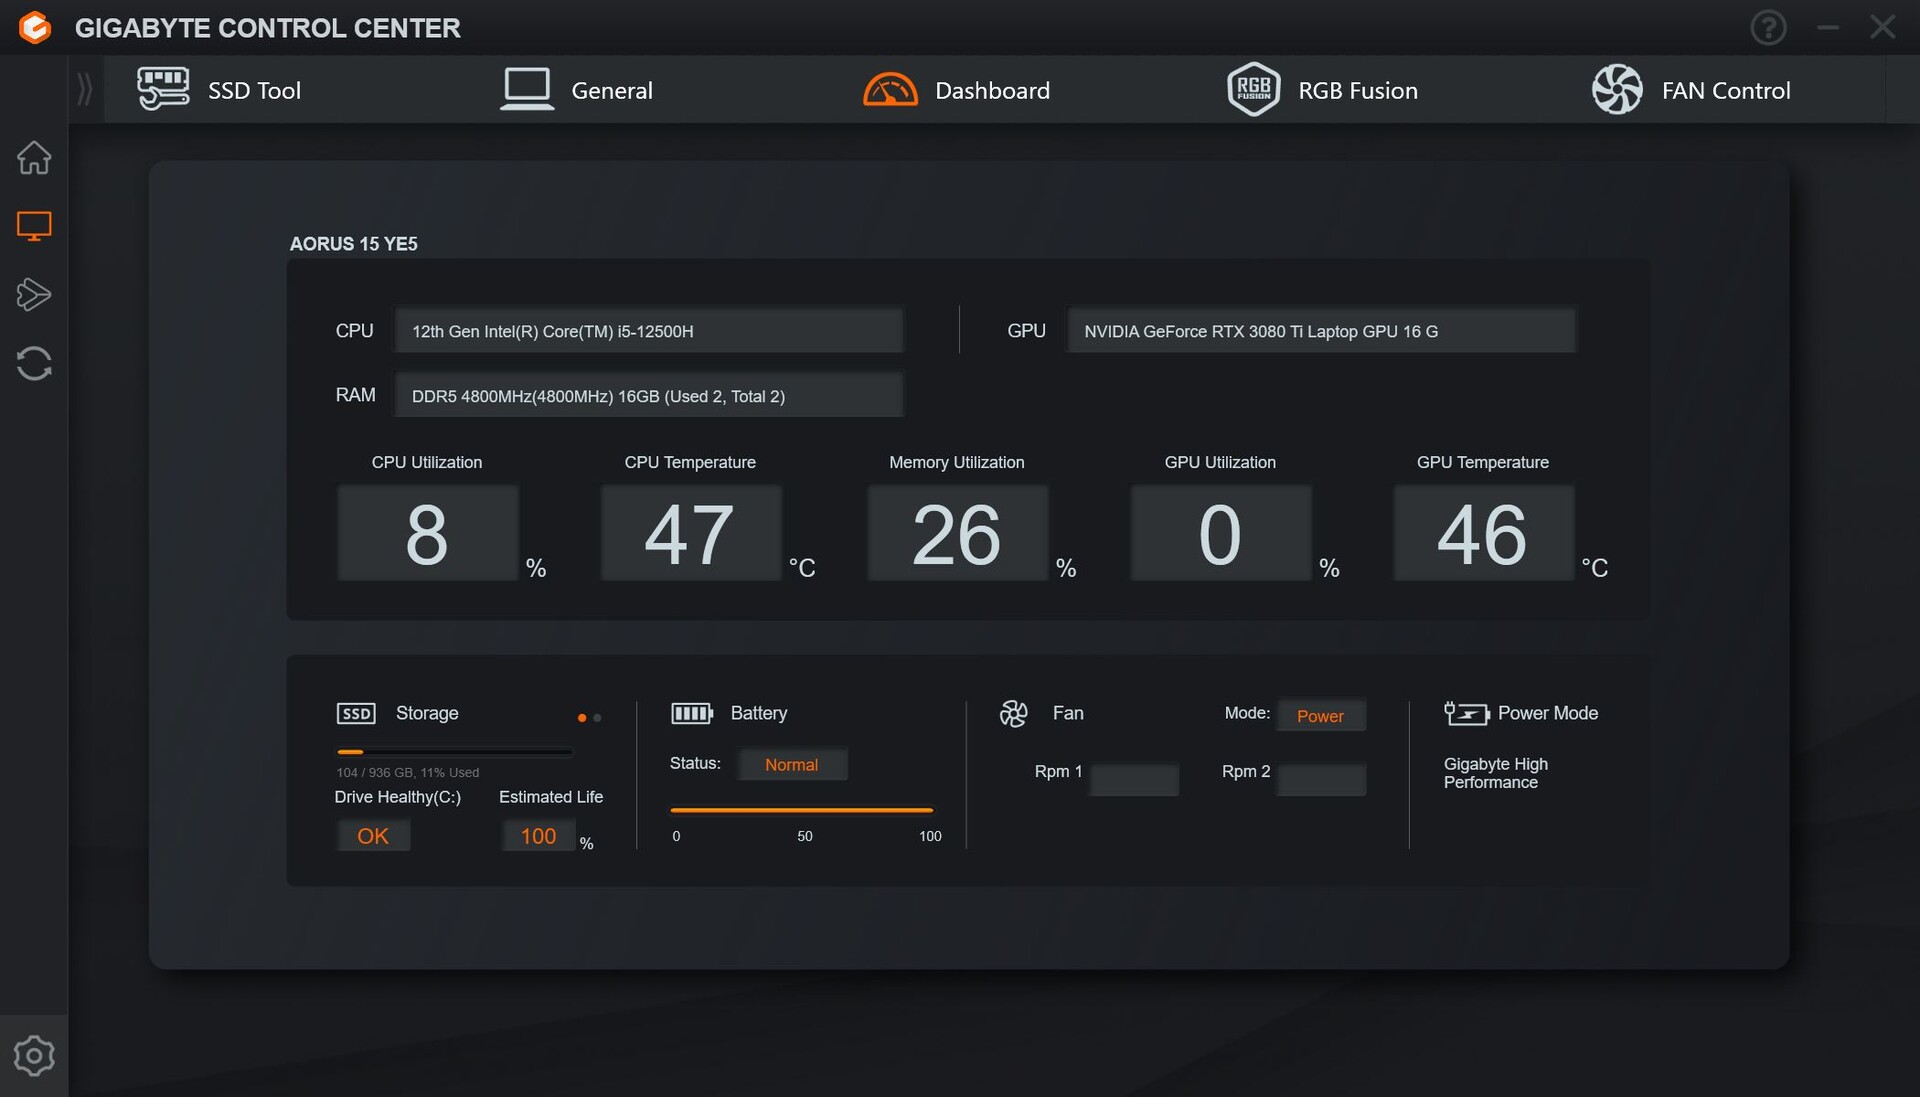
技嘉控制中心包含许多重要设置,可控制性能、键盘背光和固态硬盘。菜单的结构可以做得更好一些,因为主屏幕似乎没有显示任何有用的信息--你应该首先选择笔记本电脑本身或固态硬盘来获取更多信息。不过,你也可以在相关菜单中进行同样的操作,这就是为什么主屏幕显得特别无意义的原因。我们还错过了切换 GPU 的选项。
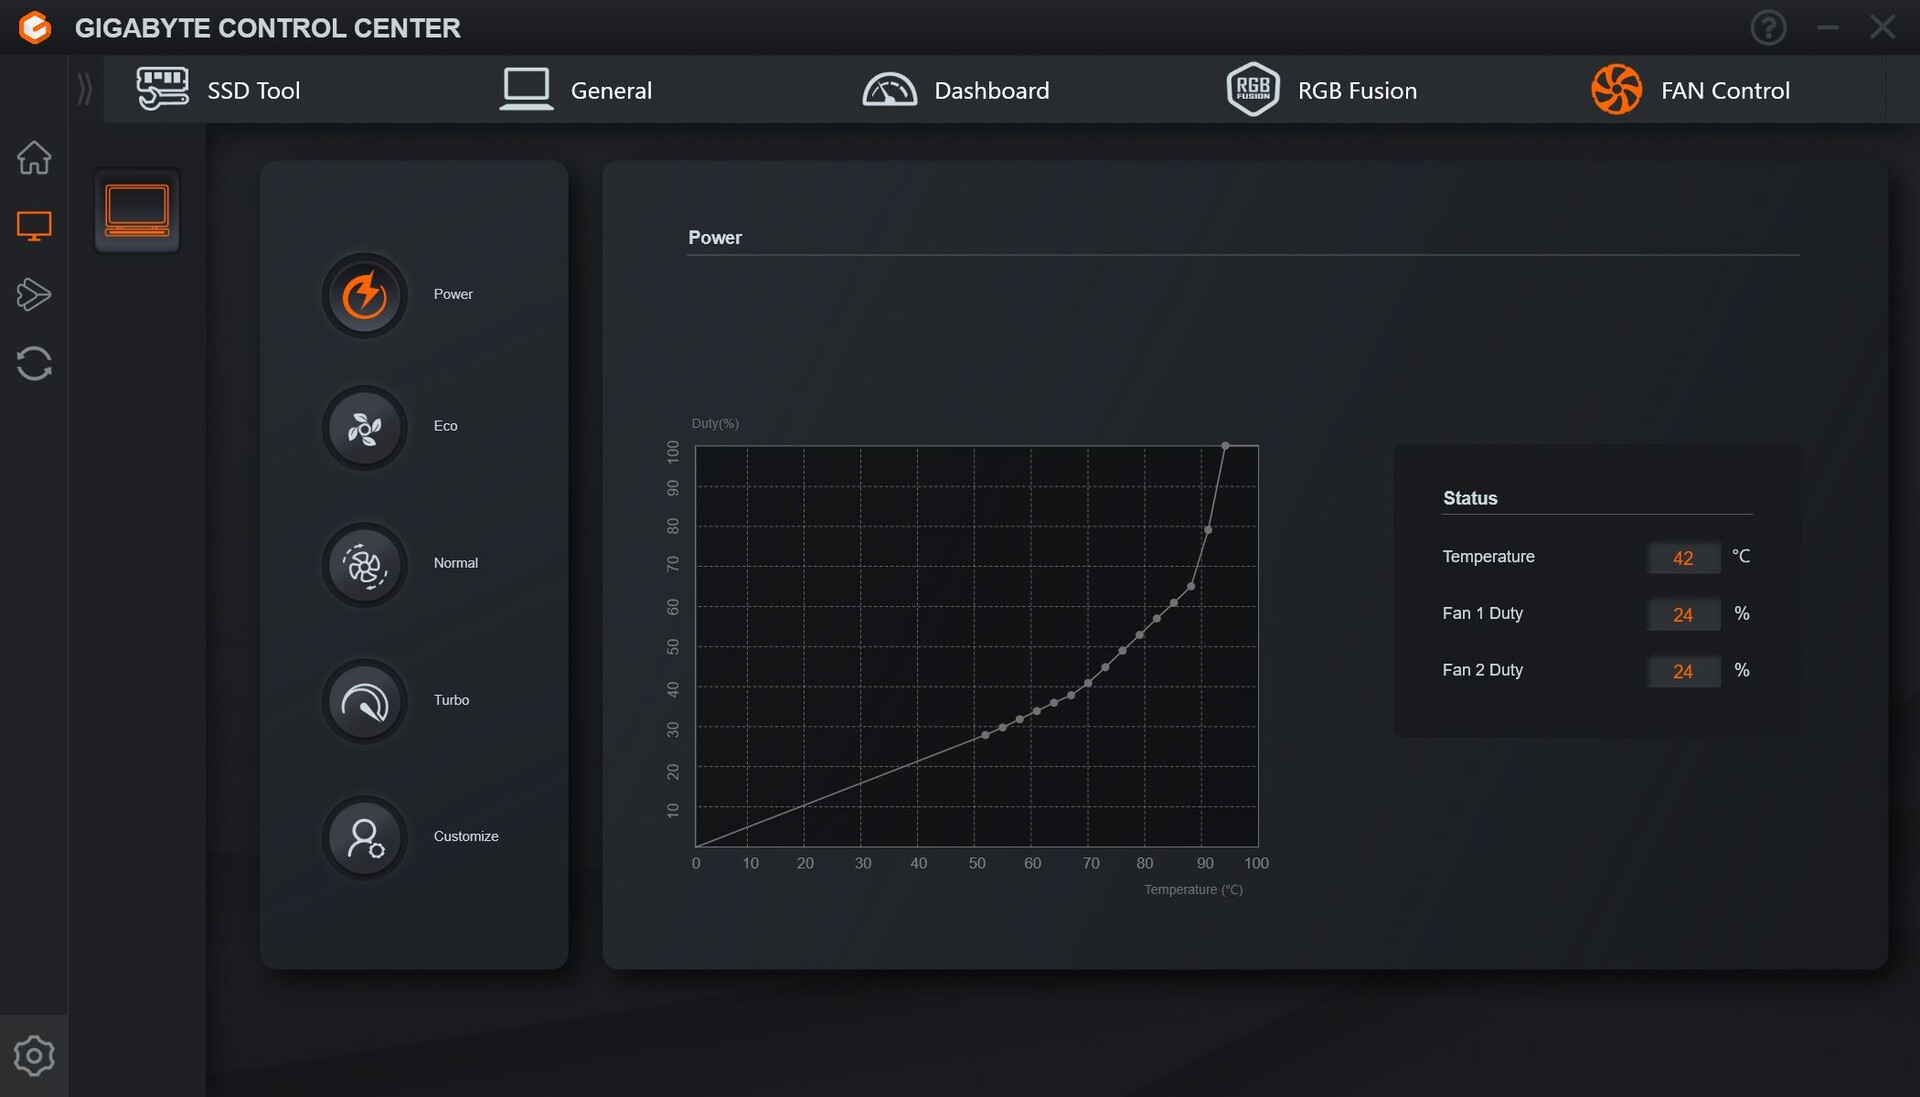
除此之外,还有性能模式、风扇曲线、可单独调节的性能模式和其他各种选项。我们使用游戏模式进行了基准测试。在使用更强大的涡轮增压模式时,风扇始终全速运转。
说说它的待机模式:Aorus(包括 Aorus 15G的笔记本电脑(包括 Aorus 15G),只要稍微合上笔记本盖子,笔记本电脑就会切换到待机模式,这似乎是一个普遍现象。例如,如果您正在使用外接显示器,并想将笔记本盖稍微向前折叠一下,这就非常恼人。然而,系统在 40 至 45 度左右就会关闭,这实在是太早了,会让人神经紧张。笔记本电脑应该在实际关闭时才关闭,而不是关闭到一半就关闭。
处理器
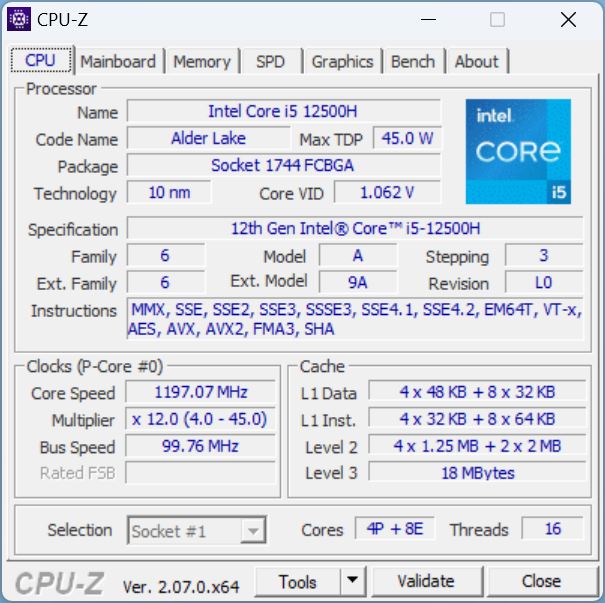
这款笔记本电脑配备了 Alder Lake CPU - Core i5-12500H。 酷睿 i5-12500H- 配备 4 个 P 核心和 8 个 E 核心。加起来共有 8 个内核和 16 个线程。这款老式的中高档 CPU 为制造商节省了成本。
在 Cinebench R15 循环测试中,它的性能在前两次运行中略有下降,随后保持稳定。
在所有 CPU 测试中,13 代 CPU 的速度明显优于 12 代 CPU。
在 Captiva配备了 i5-13500H领先约 13%。其他采用更好的 i7-13700H 处理器的竞争者的性能比 Captiva 低 8%(惠普 Victus)。惠普 Victus)到明显高出 22%(Aorus 15 BSFAorus 15 BSF).
| Cinebench R15 | 多线程得分(第一次运行) | CPU 功耗(瓦特 |
|---|---|---|
| AI Boost | 2,277 | 85 |
| Turbo | 2,283 | 85 |
| 游戏 | 2,283 | 85,降至 55 |
| 创作者 | 2,239 | 85 |
| 会议 | 836 | 30,迅速降至 15 |
| 省电模式 | 724 | 30,降至 15 |
| 电池 | 1,670 | 45 |
Cinebench R15 Multi continuous test
Cinebench R23: Multi Core | Single Core
Cinebench R20: CPU (Multi Core) | CPU (Single Core)
Cinebench R15: CPU Multi 64Bit | CPU Single 64Bit
Blender: v2.79 BMW27 CPU
7-Zip 18.03: 7z b 4 | 7z b 4 -mmt1
Geekbench 5.5: Multi-Core | Single-Core
HWBOT x265 Benchmark v2.2: 4k Preset
LibreOffice : 20 Documents To PDF
R Benchmark 2.5: Overall mean
| CPU Performance rating | |
| Average of class Gaming | |
| HP Omen 16-wf000 -1! | |
| Aorus 15 BSF | |
| Dell XPS 15 9530 RTX 4070 | |
| Captiva Advanced Gaming I74-121 | |
| HP Victus 16-r0077ng | |
| Aorus 15 YE5-54DEB34SH | |
| Average Intel Core i5-12500H | |
| Cinebench R23 / Multi Core | |
| Average of class Gaming (10488 - 42661, n=107, last 2 years) | |
| HP Omen 16-wf000 | |
| Aorus 15 BSF | |
| Captiva Advanced Gaming I74-121 | |
| Dell XPS 15 9530 RTX 4070 | |
| HP Victus 16-r0077ng | |
| Aorus 15 YE5-54DEB34SH | |
| Average Intel Core i5-12500H (11330 - 14686, n=9) | |
| Cinebench R23 / Single Core | |
| Average of class Gaming (1166 - 2415, n=107, last 2 years) | |
| Aorus 15 BSF | |
| HP Omen 16-wf000 | |
| Dell XPS 15 9530 RTX 4070 | |
| Captiva Advanced Gaming I74-121 | |
| Aorus 15 YE5-54DEB34SH | |
| HP Victus 16-r0077ng | |
| Average Intel Core i5-12500H (1558 - 1701, n=9) | |
| Cinebench R20 / CPU (Multi Core) | |
| Average of class Gaming (4029 - 16433, n=106, last 2 years) | |
| HP Omen 16-wf000 | |
| Aorus 15 BSF | |
| Captiva Advanced Gaming I74-121 | |
| Dell XPS 15 9530 RTX 4070 | |
| HP Victus 16-r0077ng | |
| Average Intel Core i5-12500H (4687 - 5640, n=9) | |
| Aorus 15 YE5-54DEB34SH | |
| Cinebench R20 / CPU (Single Core) | |
| Average of class Gaming (442 - 913, n=106, last 2 years) | |
| Aorus 15 BSF | |
| HP Omen 16-wf000 | |
| Dell XPS 15 9530 RTX 4070 | |
| Captiva Advanced Gaming I74-121 | |
| Aorus 15 YE5-54DEB34SH | |
| HP Victus 16-r0077ng | |
| Average Intel Core i5-12500H (602 - 656, n=9) | |
| Cinebench R15 / CPU Multi 64Bit | |
| Average of class Gaming (1578 - 6330, n=105, last 2 years) | |
| HP Omen 16-wf000 | |
| Aorus 15 BSF | |
| Dell XPS 15 9530 RTX 4070 | |
| Captiva Advanced Gaming I74-121 | |
| HP Victus 16-r0077ng | |
| Aorus 15 YE5-54DEB34SH | |
| Average Intel Core i5-12500H (1970 - 2283, n=10) | |
| Cinebench R15 / CPU Single 64Bit | |
| Average of class Gaming (188.8 - 350, n=106, last 2 years) | |
| Aorus 15 BSF | |
| Dell XPS 15 9530 RTX 4070 | |
| HP Omen 16-wf000 | |
| Captiva Advanced Gaming I74-121 | |
| Aorus 15 YE5-54DEB34SH | |
| HP Victus 16-r0077ng | |
| Average Intel Core i5-12500H (220 - 250, n=9) | |
| Blender / v2.79 BMW27 CPU | |
| Aorus 15 YE5-54DEB34SH | |
| Average Intel Core i5-12500H (223 - 288, n=9) | |
| Aorus 15 BSF | |
| Dell XPS 15 9530 RTX 4070 | |
| HP Victus 16-r0077ng | |
| Captiva Advanced Gaming I74-121 | |
| Average of class Gaming (79 - 330, n=104, last 2 years) | |
| 7-Zip 18.03 / 7z b 4 | |
| Average of class Gaming (33491 - 148086, n=105, last 2 years) | |
| HP Omen 16-wf000 | |
| HP Victus 16-r0077ng | |
| Aorus 15 BSF | |
| Dell XPS 15 9530 RTX 4070 | |
| Captiva Advanced Gaming I74-121 | |
| Aorus 15 YE5-54DEB34SH | |
| Average Intel Core i5-12500H (44105 - 54380, n=9) | |
| 7-Zip 18.03 / 7z b 4 -mmt1 | |
| Average of class Gaming (4199 - 7436, n=105, last 2 years) | |
| Aorus 15 BSF | |
| Dell XPS 15 9530 RTX 4070 | |
| HP Omen 16-wf000 | |
| Captiva Advanced Gaming I74-121 | |
| HP Victus 16-r0077ng | |
| Aorus 15 YE5-54DEB34SH | |
| Average Intel Core i5-12500H (5151 - 5563, n=9) | |
| Geekbench 5.5 / Multi-Core | |
| Average of class Gaming (6460 - 28263, n=105, last 2 years) | |
| HP Omen 16-wf000 | |
| Aorus 15 BSF | |
| Dell XPS 15 9530 RTX 4070 | |
| HP Victus 16-r0077ng | |
| Aorus 15 YE5-54DEB34SH | |
| Captiva Advanced Gaming I74-121 | |
| Average Intel Core i5-12500H (7962 - 10828, n=9) | |
| Geekbench 5.5 / Single-Core | |
| Average of class Gaming (986 - 2474, n=105, last 2 years) | |
| Dell XPS 15 9530 RTX 4070 | |
| HP Omen 16-wf000 | |
| Aorus 15 BSF | |
| Captiva Advanced Gaming I74-121 | |
| HP Victus 16-r0077ng | |
| Aorus 15 YE5-54DEB34SH | |
| Average Intel Core i5-12500H (1471 - 1693, n=9) | |
| HWBOT x265 Benchmark v2.2 / 4k Preset | |
| Average of class Gaming (11.5 - 44.4, n=105, last 2 years) | |
| HP Omen 16-wf000 | |
| Captiva Advanced Gaming I74-121 | |
| Dell XPS 15 9530 RTX 4070 | |
| HP Victus 16-r0077ng | |
| Aorus 15 BSF | |
| Aorus 15 YE5-54DEB34SH | |
| Average Intel Core i5-12500H (12 - 16.6, n=9) | |
| LibreOffice / 20 Documents To PDF | |
| HP Victus 16-r0077ng | |
| Aorus 15 YE5-54DEB34SH | |
| Captiva Advanced Gaming I74-121 | |
| Average of class Gaming (33.2 - 88.8, n=105, last 2 years) | |
| Average Intel Core i5-12500H (40.1 - 58.5, n=9) | |
| Aorus 15 BSF | |
| HP Omen 16-wf000 | |
| Dell XPS 15 9530 RTX 4070 | |
| R Benchmark 2.5 / Overall mean | |
| Aorus 15 YE5-54DEB34SH | |
| Average Intel Core i5-12500H (0.4748 - 0.535, n=9) | |
| HP Victus 16-r0077ng | |
| Captiva Advanced Gaming I74-121 | |
| HP Omen 16-wf000 | |
| Aorus 15 BSF | |
| Dell XPS 15 9530 RTX 4070 | |
| Average of class Gaming (0.3439 - 0.759, n=106, last 2 years) | |
* ... smaller is better
AIDA64: FP32 Ray-Trace | FPU Julia | CPU SHA3 | CPU Queen | FPU SinJulia | FPU Mandel | CPU AES | CPU ZLib | FP64 Ray-Trace | CPU PhotoWorxx
| Performance rating | |
| Average of class Gaming | |
| Aorus 15 BSF | |
| Captiva Advanced Gaming I74-121 | |
| Dell XPS 15 9530 RTX 4070 | |
| HP Victus 16-r0077ng | |
| Aorus 15 YE5-54DEB34SH | |
| Average Intel Core i5-12500H | |
| AIDA64 / FP32 Ray-Trace | |
| Average of class Gaming (10227 - 85542, n=105, last 2 years) | |
| Captiva Advanced Gaming I74-121 | |
| HP Victus 16-r0077ng | |
| Dell XPS 15 9530 RTX 4070 | |
| Aorus 15 BSF | |
| Aorus 15 YE5-54DEB34SH | |
| Average Intel Core i5-12500H (6851 - 13947, n=9) | |
| AIDA64 / FPU Julia | |
| Average of class Gaming (51376 - 238426, n=105, last 2 years) | |
| Captiva Advanced Gaming I74-121 | |
| HP Victus 16-r0077ng | |
| Aorus 15 BSF | |
| Dell XPS 15 9530 RTX 4070 | |
| Aorus 15 YE5-54DEB34SH | |
| Average Intel Core i5-12500H (29874 - 68178, n=9) | |
| AIDA64 / CPU SHA3 | |
| Average of class Gaming (2180 - 10115, n=105, last 2 years) | |
| Captiva Advanced Gaming I74-121 | |
| HP Victus 16-r0077ng | |
| Aorus 15 BSF | |
| Dell XPS 15 9530 RTX 4070 | |
| Aorus 15 YE5-54DEB34SH | |
| Average Intel Core i5-12500H (2287 - 3337, n=9) | |
| AIDA64 / CPU Queen | |
| Average of class Gaming (49785 - 173351, n=90, last 2 years) | |
| Aorus 15 BSF | |
| Dell XPS 15 9530 RTX 4070 | |
| HP Victus 16-r0077ng | |
| Captiva Advanced Gaming I74-121 | |
| Aorus 15 YE5-54DEB34SH | |
| Average Intel Core i5-12500H (77935 - 80703, n=9) | |
| AIDA64 / FPU SinJulia | |
| Average of class Gaming (4424 - 33636, n=105, last 2 years) | |
| Aorus 15 BSF | |
| Dell XPS 15 9530 RTX 4070 | |
| HP Victus 16-r0077ng | |
| Captiva Advanced Gaming I74-121 | |
| Aorus 15 YE5-54DEB34SH | |
| Average Intel Core i5-12500H (6590 - 7431, n=9) | |
| AIDA64 / FPU Mandel | |
| Average of class Gaming (25115 - 128721, n=105, last 2 years) | |
| Captiva Advanced Gaming I74-121 | |
| HP Victus 16-r0077ng | |
| Dell XPS 15 9530 RTX 4070 | |
| Aorus 15 BSF | |
| Aorus 15 YE5-54DEB34SH | |
| Average Intel Core i5-12500H (18252 - 34041, n=9) | |
| AIDA64 / CPU AES | |
| Captiva Advanced Gaming I74-121 | |
| Aorus 15 BSF | |
| Aorus 15 YE5-54DEB34SH | |
| Average of class Gaming (39258 - 247074, n=105, last 2 years) | |
| Average Intel Core i5-12500H (50298 - 111567, n=9) | |
| HP Victus 16-r0077ng | |
| Dell XPS 15 9530 RTX 4070 | |
| AIDA64 / CPU ZLib | |
| Average of class Gaming (574 - 2531, n=105, last 2 years) | |
| Captiva Advanced Gaming I74-121 | |
| HP Victus 16-r0077ng | |
| Aorus 15 YE5-54DEB34SH | |
| Dell XPS 15 9530 RTX 4070 | |
| Aorus 15 BSF | |
| Average Intel Core i5-12500H (746 - 924, n=9) | |
| AIDA64 / FP64 Ray-Trace | |
| Average of class Gaming (5509 - 45446, n=105, last 2 years) | |
| Captiva Advanced Gaming I74-121 | |
| HP Victus 16-r0077ng | |
| Dell XPS 15 9530 RTX 4070 | |
| Aorus 15 BSF | |
| Aorus 15 YE5-54DEB34SH | |
| Average Intel Core i5-12500H (3848 - 7405, n=9) | |
| AIDA64 / CPU PhotoWorxx | |
| Average of class Gaming (12271 - 89891, n=105, last 2 years) | |
| Dell XPS 15 9530 RTX 4070 | |
| HP Victus 16-r0077ng | |
| Aorus 15 BSF | |
| Aorus 15 YE5-54DEB34SH | |
| Average Intel Core i5-12500H (13686 - 43813, n=9) | |
| Captiva Advanced Gaming I74-121 | |
系统性能
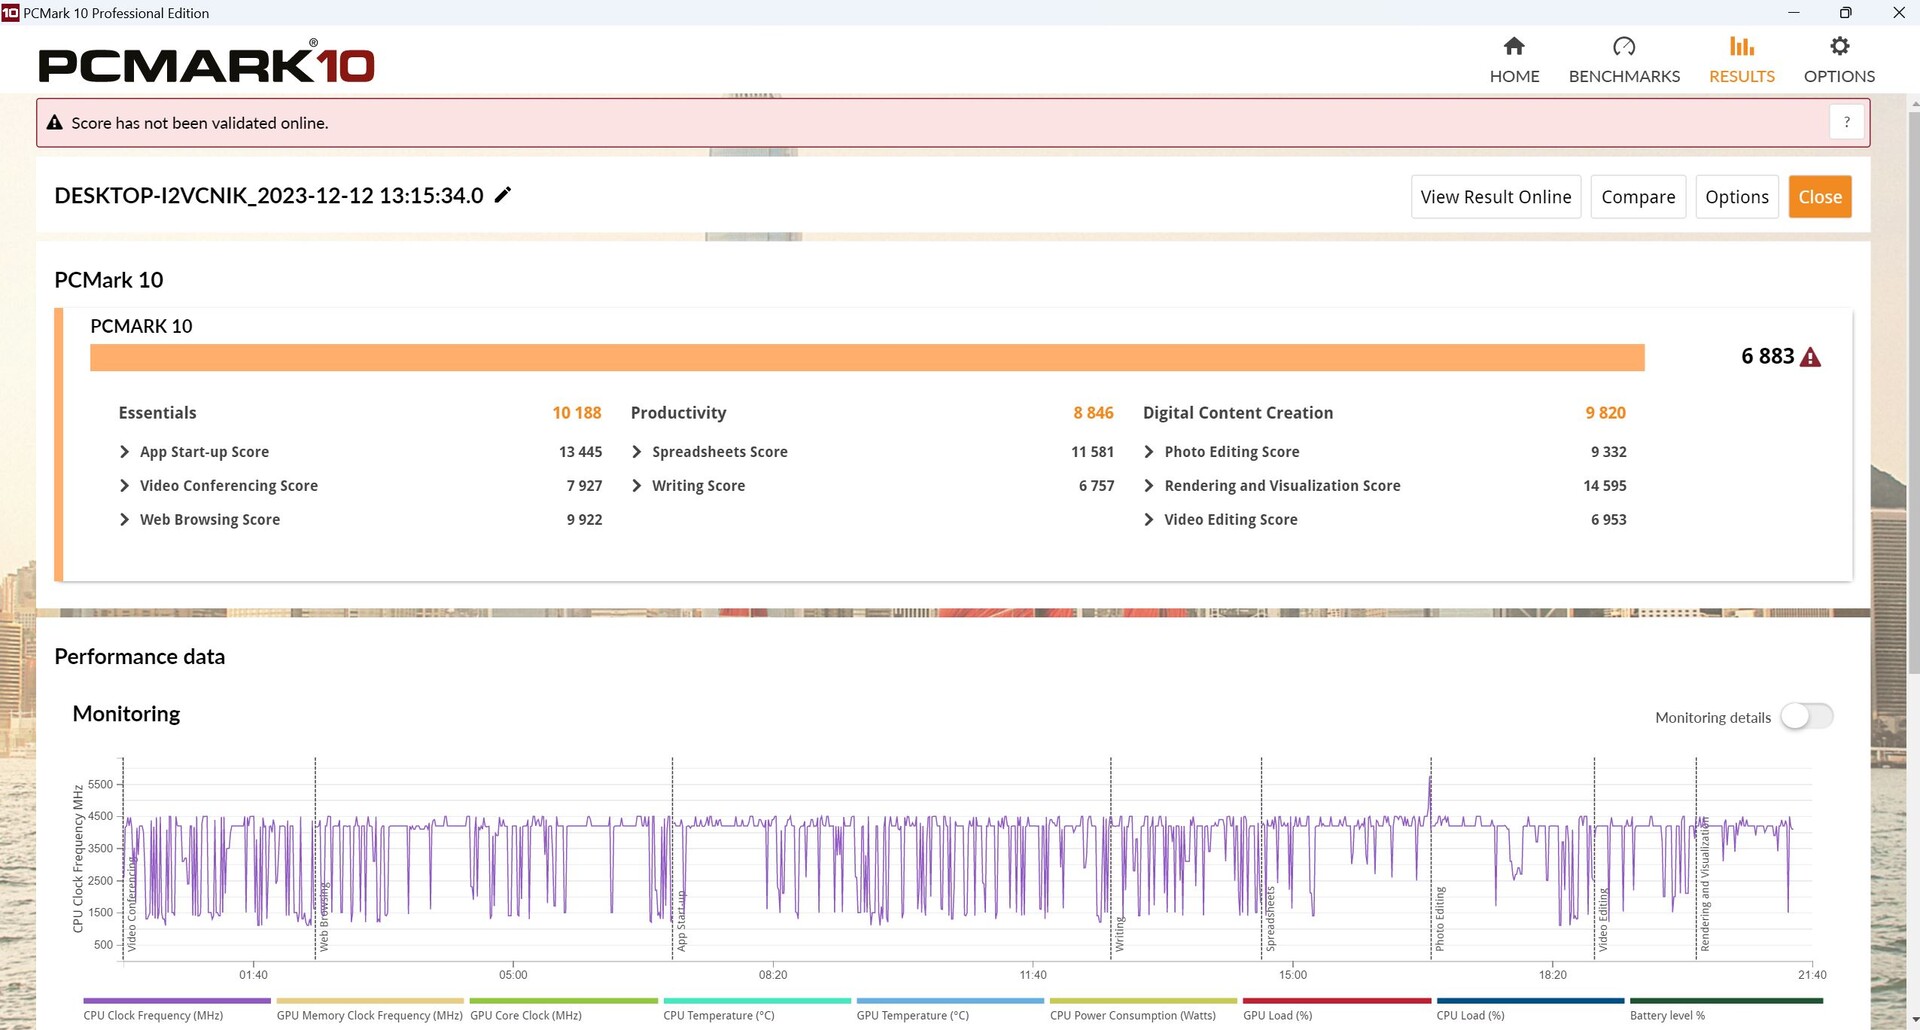
在 PCMark 10 中,采用后续 CPU 的 Captiva 领先约 7%,而在 CrossMark 中,两款设备的表现相同。
CrossMark: Overall | Productivity | Creativity | Responsiveness
WebXPRT 3: Overall
WebXPRT 4: Overall
Mozilla Kraken 1.1: Total
| PCMark 10 / Score | |
| Average of class Gaming (5828 - 12414, n=93, last 2 years) | |
| HP Omen 16-wf000 | |
| Captiva Advanced Gaming I74-121 | |
| Aorus 15 BSF | |
| Dell XPS 15 9530 RTX 4070 | |
| HP Victus 16-r0077ng | |
| Aorus 15 YE5-54DEB34SH | |
| Average Intel Core i5-12500H, NVIDIA GeForce RTX 3080 Ti Laptop GPU (n=1) | |
| PCMark 10 / Essentials | |
| Captiva Advanced Gaming I74-121 | |
| Dell XPS 15 9530 RTX 4070 | |
| Aorus 15 BSF | |
| HP Victus 16-r0077ng | |
| Average of class Gaming (8810 - 11935, n=97, last 2 years) | |
| HP Omen 16-wf000 | |
| Aorus 15 YE5-54DEB34SH | |
| Average Intel Core i5-12500H, NVIDIA GeForce RTX 3080 Ti Laptop GPU (n=1) | |
| PCMark 10 / Productivity | |
| Average of class Gaming (6845 - 25323, n=95, last 2 years) | |
| HP Omen 16-wf000 | |
| Captiva Advanced Gaming I74-121 | |
| Aorus 15 BSF | |
| HP Victus 16-r0077ng | |
| Aorus 15 YE5-54DEB34SH | |
| Average Intel Core i5-12500H, NVIDIA GeForce RTX 3080 Ti Laptop GPU (n=1) | |
| Dell XPS 15 9530 RTX 4070 | |
| PCMark 10 / Digital Content Creation | |
| Average of class Gaming (7602 - 19954, n=95, last 2 years) | |
| HP Omen 16-wf000 | |
| Aorus 15 BSF | |
| Dell XPS 15 9530 RTX 4070 | |
| Captiva Advanced Gaming I74-121 | |
| HP Victus 16-r0077ng | |
| Aorus 15 YE5-54DEB34SH | |
| Average Intel Core i5-12500H, NVIDIA GeForce RTX 3080 Ti Laptop GPU (n=1) | |
| CrossMark / Overall | |
| Aorus 15 BSF | |
| Average of class Gaming (1366 - 2409, n=94, last 2 years) | |
| Dell XPS 15 9530 RTX 4070 | |
| HP Omen 16-wf000 | |
| Captiva Advanced Gaming I74-121 | |
| Aorus 15 YE5-54DEB34SH | |
| Average Intel Core i5-12500H, NVIDIA GeForce RTX 3080 Ti Laptop GPU (n=1) | |
| CrossMark / Productivity | |
| Aorus 15 BSF | |
| Average of class Gaming (1386 - 2254, n=94, last 2 years) | |
| Dell XPS 15 9530 RTX 4070 | |
| Captiva Advanced Gaming I74-121 | |
| Aorus 15 YE5-54DEB34SH | |
| Average Intel Core i5-12500H, NVIDIA GeForce RTX 3080 Ti Laptop GPU (n=1) | |
| HP Omen 16-wf000 | |
| CrossMark / Creativity | |
| Average of class Gaming (1343 - 2786, n=94, last 2 years) | |
| Dell XPS 15 9530 RTX 4070 | |
| Aorus 15 BSF | |
| HP Omen 16-wf000 | |
| Aorus 15 YE5-54DEB34SH | |
| Average Intel Core i5-12500H, NVIDIA GeForce RTX 3080 Ti Laptop GPU (n=1) | |
| Captiva Advanced Gaming I74-121 | |
| CrossMark / Responsiveness | |
| Aorus 15 BSF | |
| Average of class Gaming (1226 - 2334, n=94, last 2 years) | |
| Dell XPS 15 9530 RTX 4070 | |
| Captiva Advanced Gaming I74-121 | |
| Aorus 15 YE5-54DEB34SH | |
| Average Intel Core i5-12500H, NVIDIA GeForce RTX 3080 Ti Laptop GPU (n=1) | |
| HP Omen 16-wf000 | |
| WebXPRT 3 / Overall | |
| Dell XPS 15 9530 RTX 4070 | |
| Average of class Gaming (220 - 532, n=98, last 2 years) | |
| Aorus 15 BSF | |
| HP Omen 16-wf000 | |
| HP Victus 16-r0077ng | |
| HP Victus 16-r0077ng | |
| Captiva Advanced Gaming I74-121 | |
| Captiva Advanced Gaming I74-121 | |
| Aorus 15 YE5-54DEB34SH | |
| Average Intel Core i5-12500H, NVIDIA GeForce RTX 3080 Ti Laptop GPU (n=1) | |
| WebXPRT 4 / Overall | |
| Average of class Gaming (165 - 354, n=98, last 2 years) | |
| Dell XPS 15 9530 RTX 4070 | |
| Aorus 15 BSF | |
| HP Omen 16-wf000 | |
| HP Victus 16-r0077ng | |
| HP Victus 16-r0077ng | |
| Aorus 15 YE5-54DEB34SH | |
| Average Intel Core i5-12500H, NVIDIA GeForce RTX 3080 Ti Laptop GPU (n=1) | |
| Captiva Advanced Gaming I74-121 | |
| Captiva Advanced Gaming I74-121 | |
| Mozilla Kraken 1.1 / Total | |
| Aorus 15 YE5-54DEB34SH | |
| Average Intel Core i5-12500H, NVIDIA GeForce RTX 3080 Ti Laptop GPU (n=1) | |
| HP Victus 16-r0077ng | |
| HP Victus 16-r0077ng | |
| Captiva Advanced Gaming I74-121 | |
| Captiva Advanced Gaming I74-121 | |
| HP Omen 16-wf000 | |
| Dell XPS 15 9530 RTX 4070 | |
| Aorus 15 BSF | |
| Average of class Gaming (391 - 590, n=100, last 2 years) | |
* ... smaller is better
| PCMark 10 Score | 6883 points | |
Help | ||
| AIDA64 / Memory Copy | |
| Average of class Gaming (21750 - 129946, n=105, last 2 years) | |
| Dell XPS 15 9530 RTX 4070 | |
| HP Victus 16-r0077ng | |
| Aorus 15 BSF | |
| Aorus 15 YE5-54DEB34SH | |
| Average Intel Core i5-12500H (23850 - 66598, n=9) | |
| Captiva Advanced Gaming I74-121 | |
| AIDA64 / Memory Read | |
| Average of class Gaming (22956 - 118858, n=105, last 2 years) | |
| Dell XPS 15 9530 RTX 4070 | |
| HP Victus 16-r0077ng | |
| Aorus 15 BSF | |
| Aorus 15 YE5-54DEB34SH | |
| Average Intel Core i5-12500H (24879 - 68013, n=9) | |
| Captiva Advanced Gaming I74-121 | |
| AIDA64 / Memory Write | |
| Aorus 15 BSF | |
| Average of class Gaming (22297 - 135096, n=105, last 2 years) | |
| Dell XPS 15 9530 RTX 4070 | |
| HP Victus 16-r0077ng | |
| Aorus 15 YE5-54DEB34SH | |
| Average Intel Core i5-12500H (23543 - 58797, n=9) | |
| Captiva Advanced Gaming I74-121 | |
| AIDA64 / Memory Latency | |
| Average of class Gaming (75.3 - 259, n=105, last 2 years) | |
| Aorus 15 YE5-54DEB34SH | |
| Average Intel Core i5-12500H (83.8 - 114.7, n=9) | |
| HP Victus 16-r0077ng | |
| Aorus 15 BSF | |
| Dell XPS 15 9530 RTX 4070 | |
| Captiva Advanced Gaming I74-121 | |
* ... smaller is better
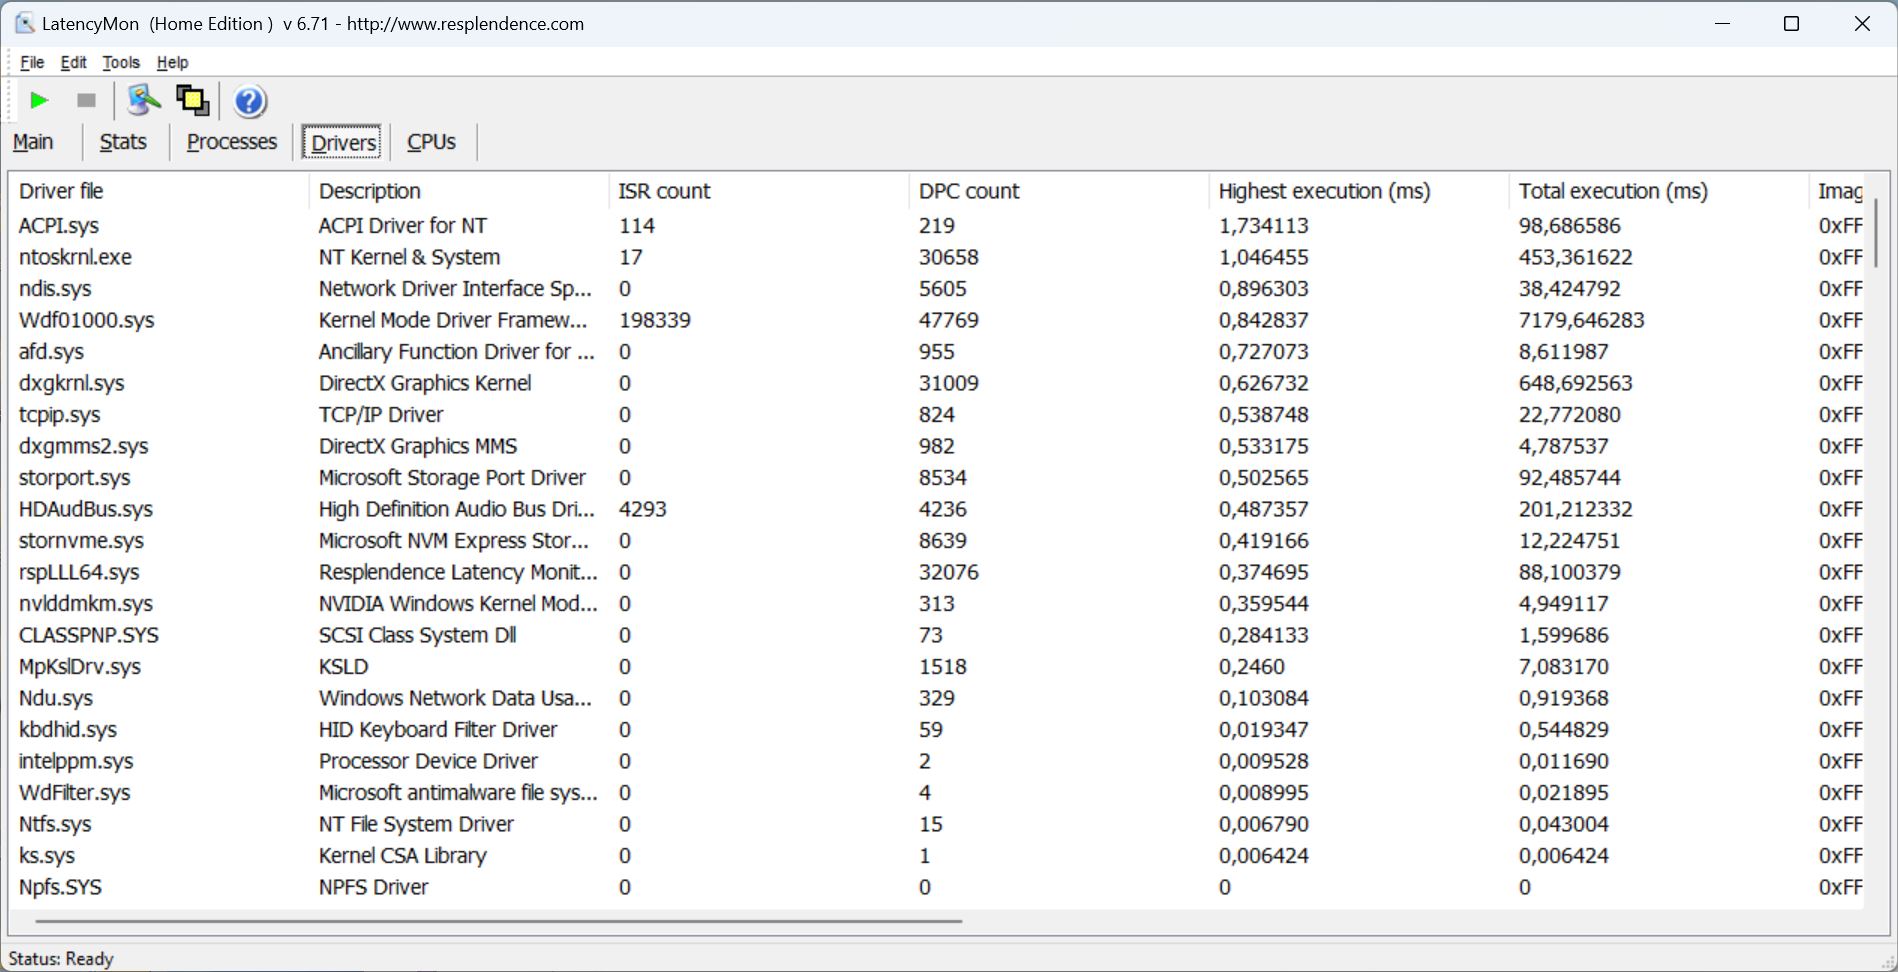
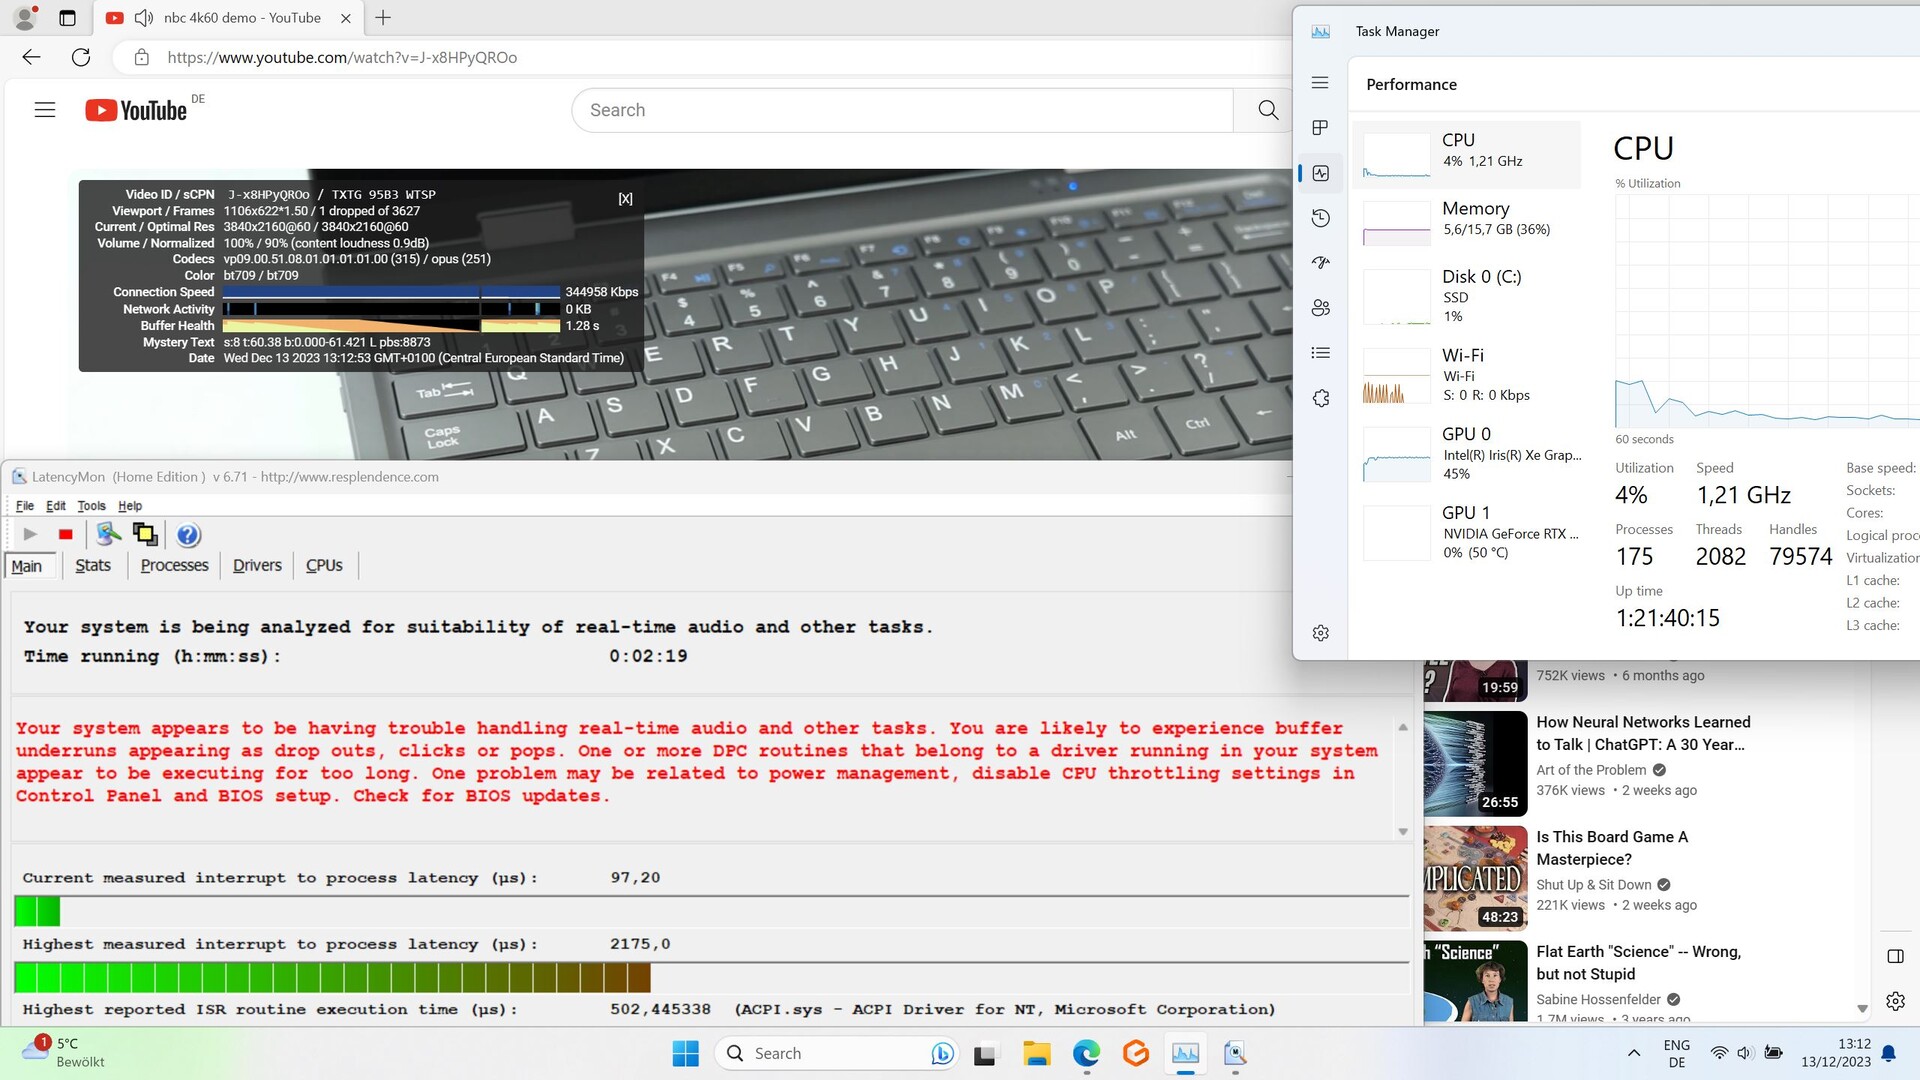
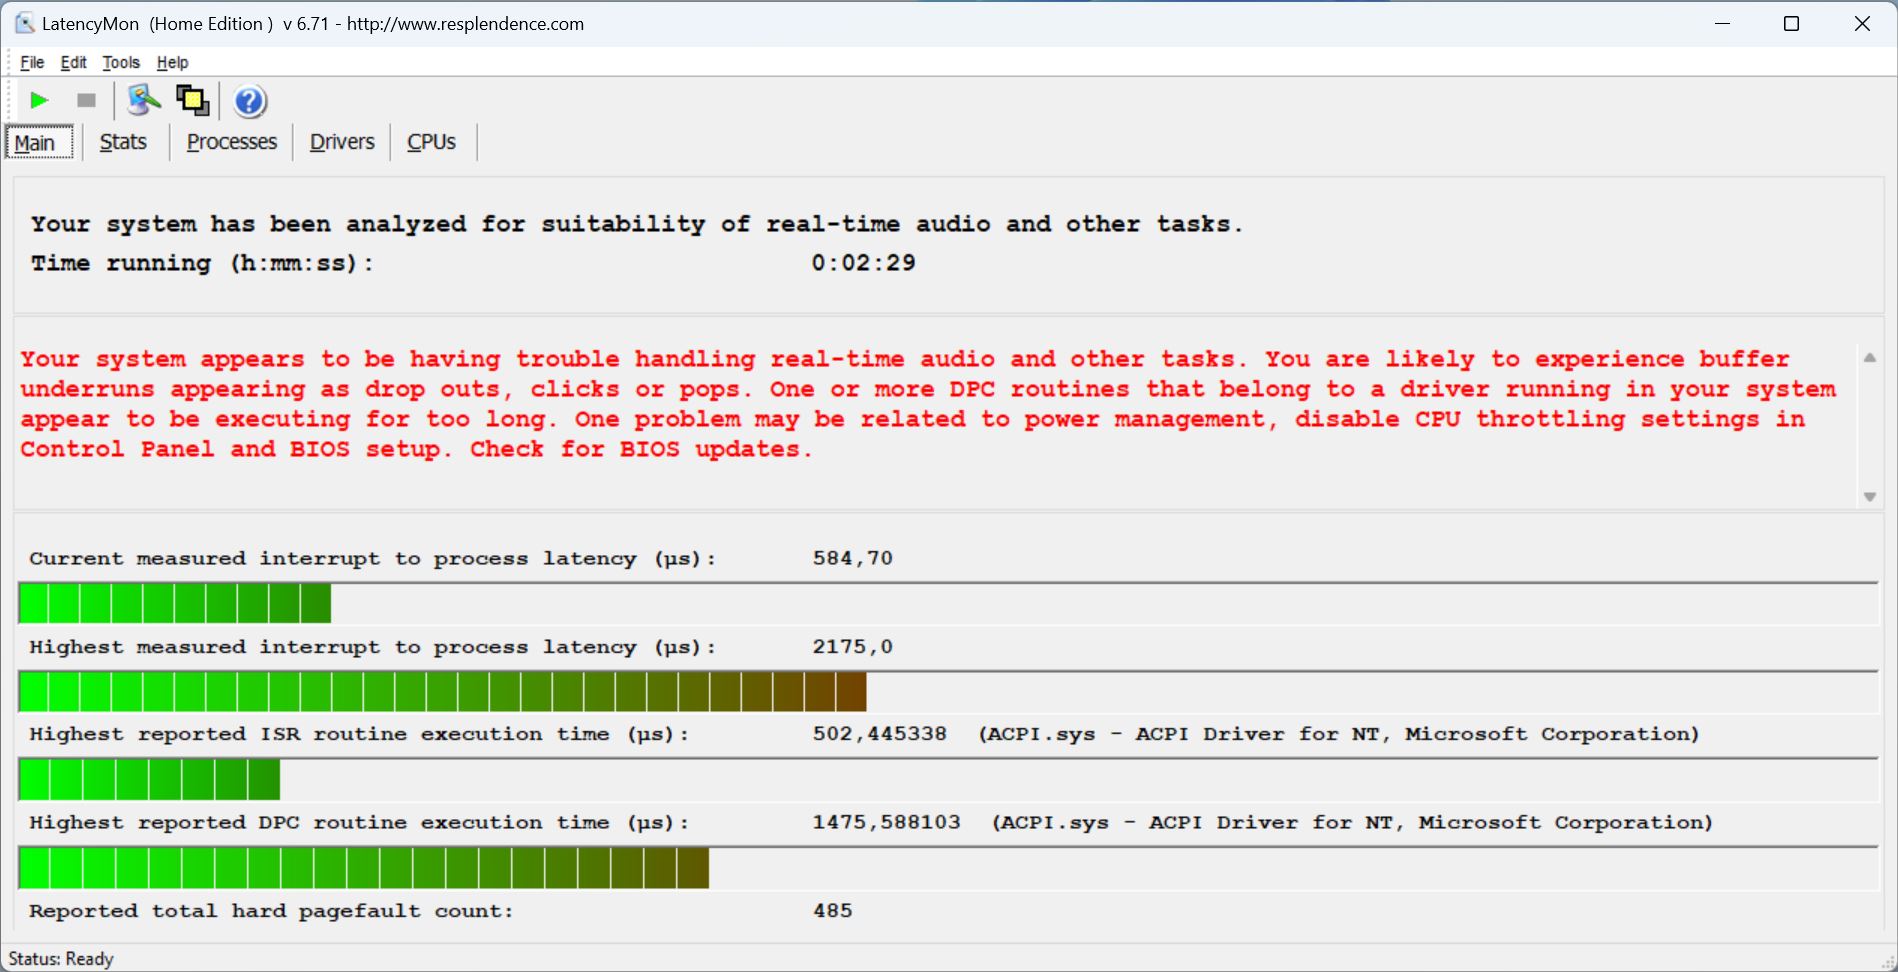
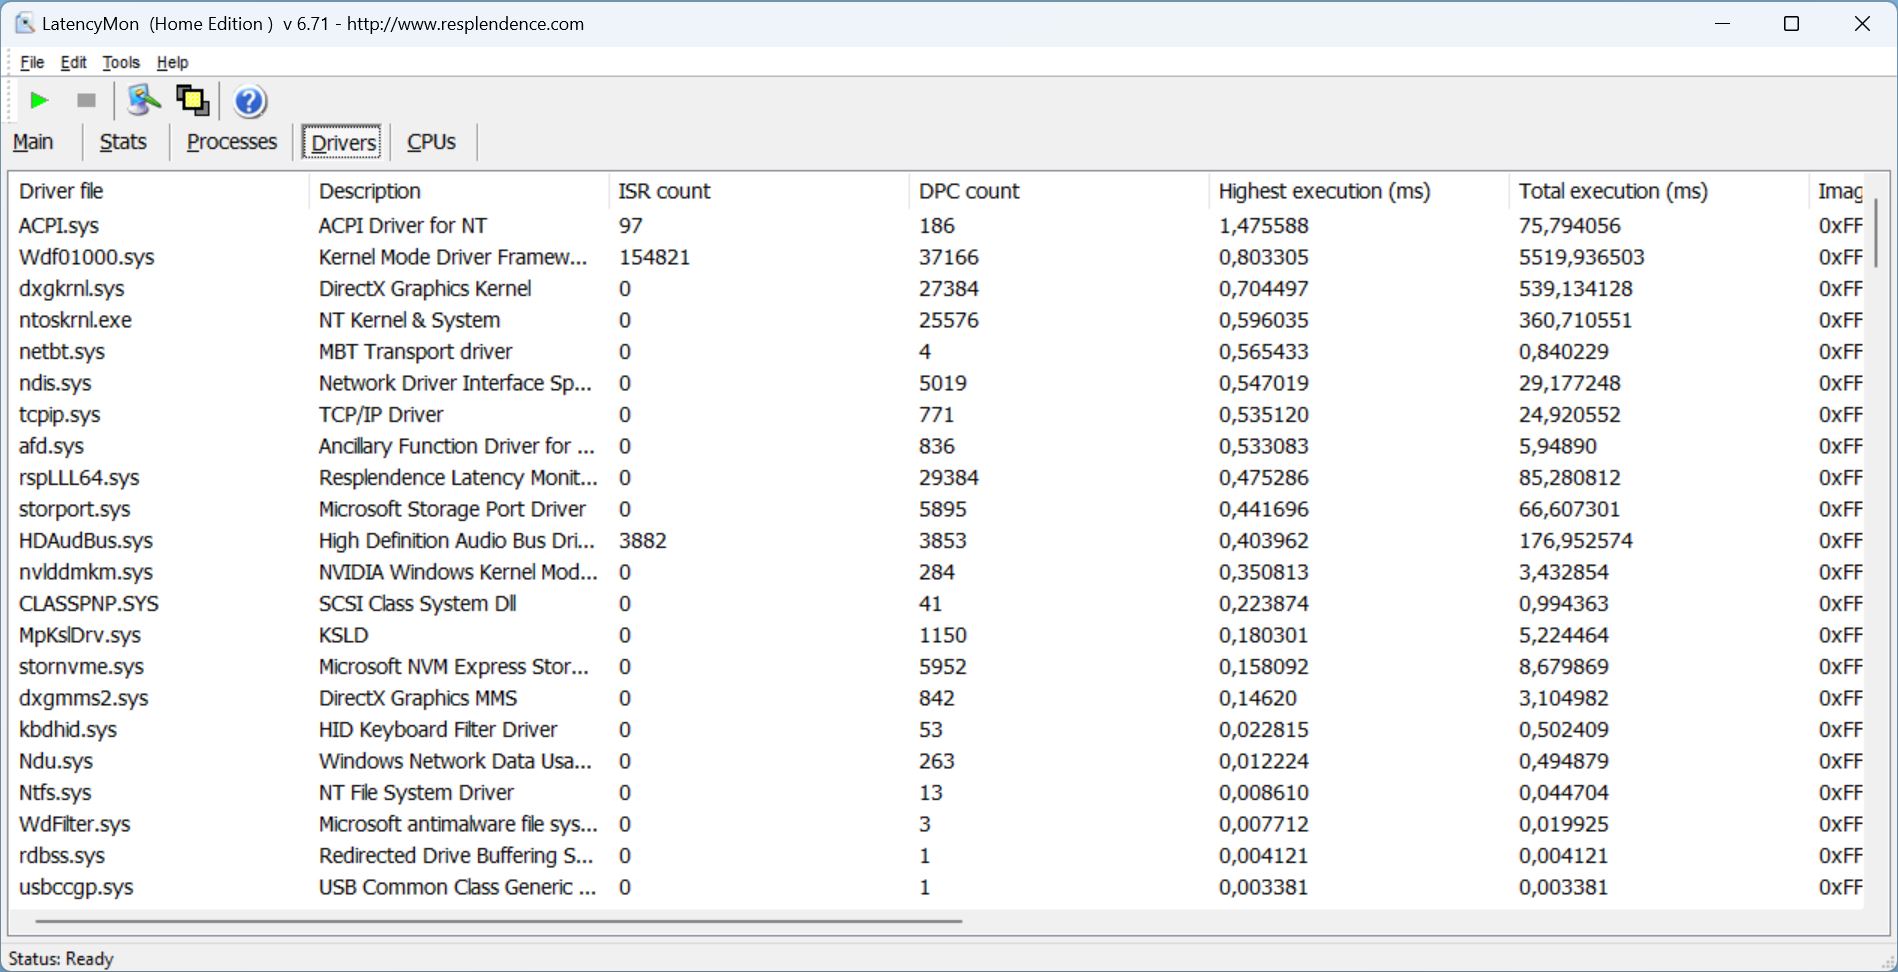
DPC 延迟
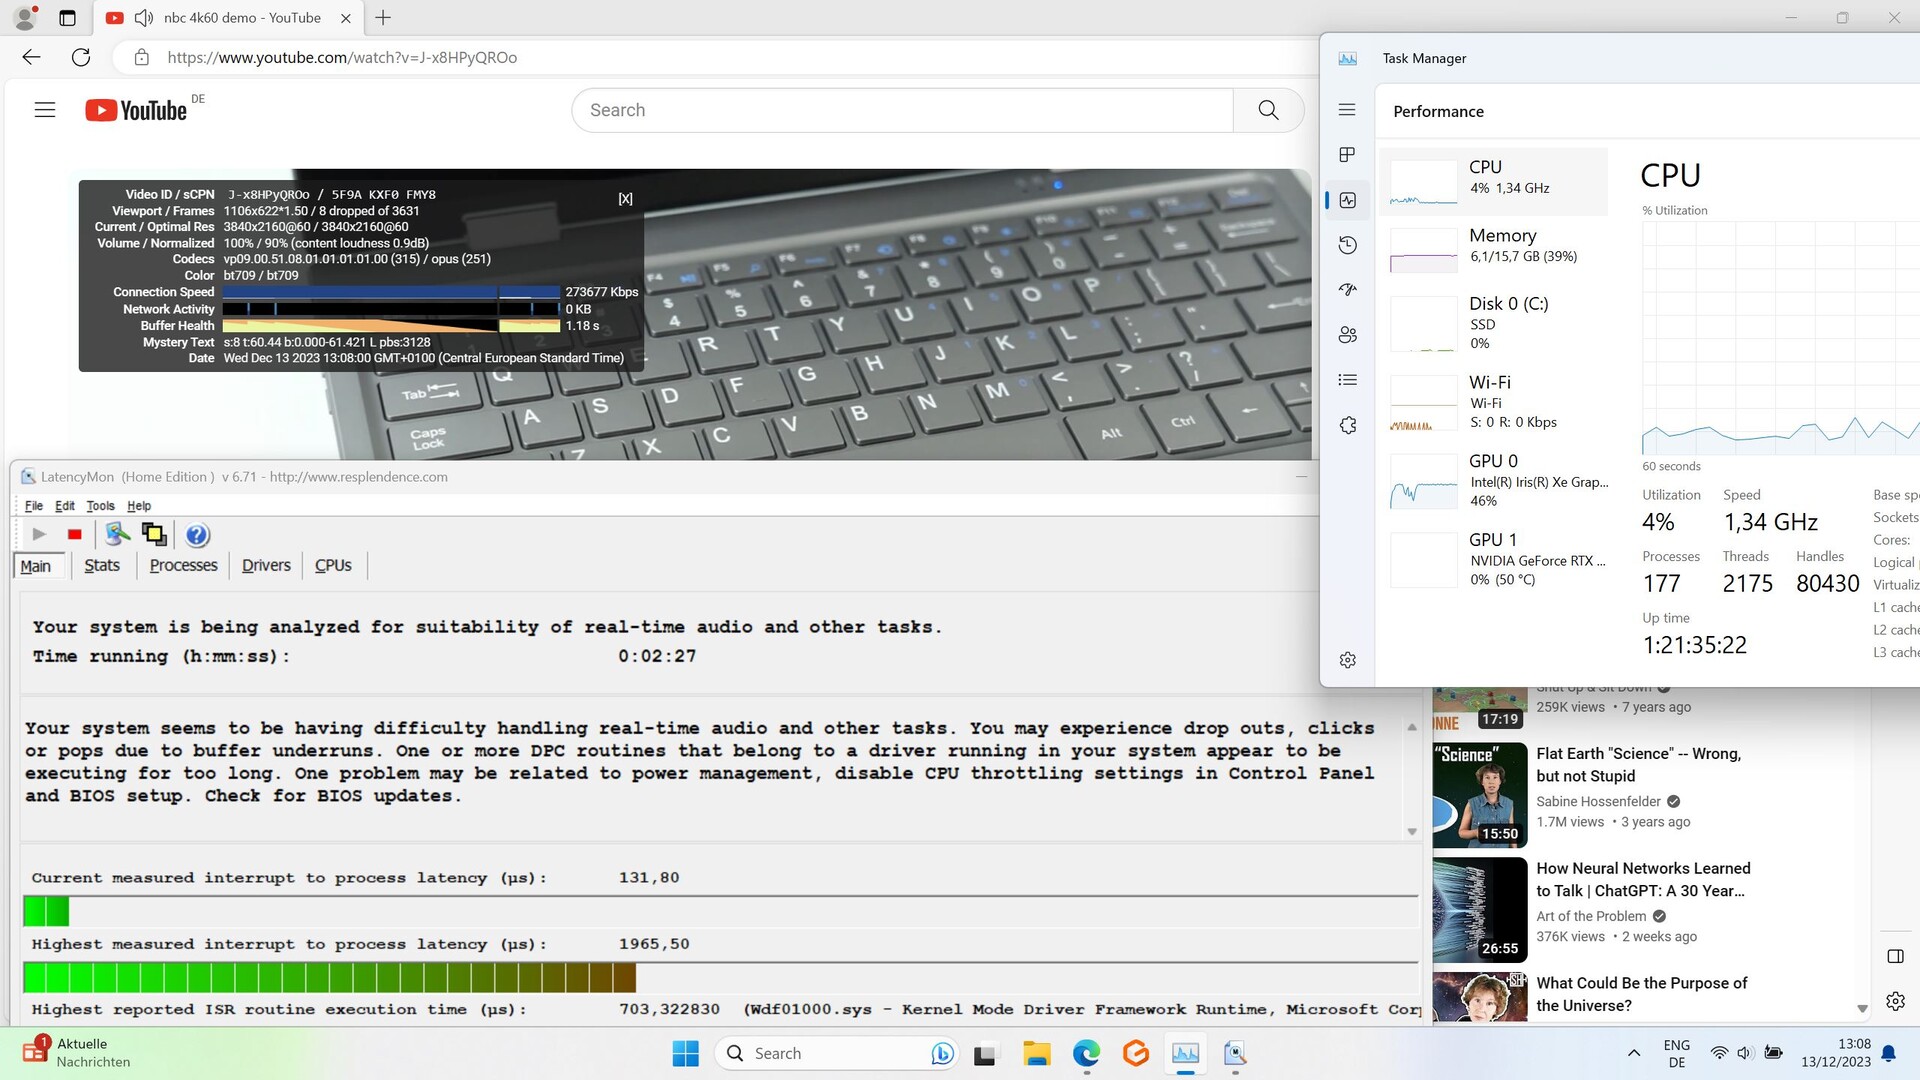
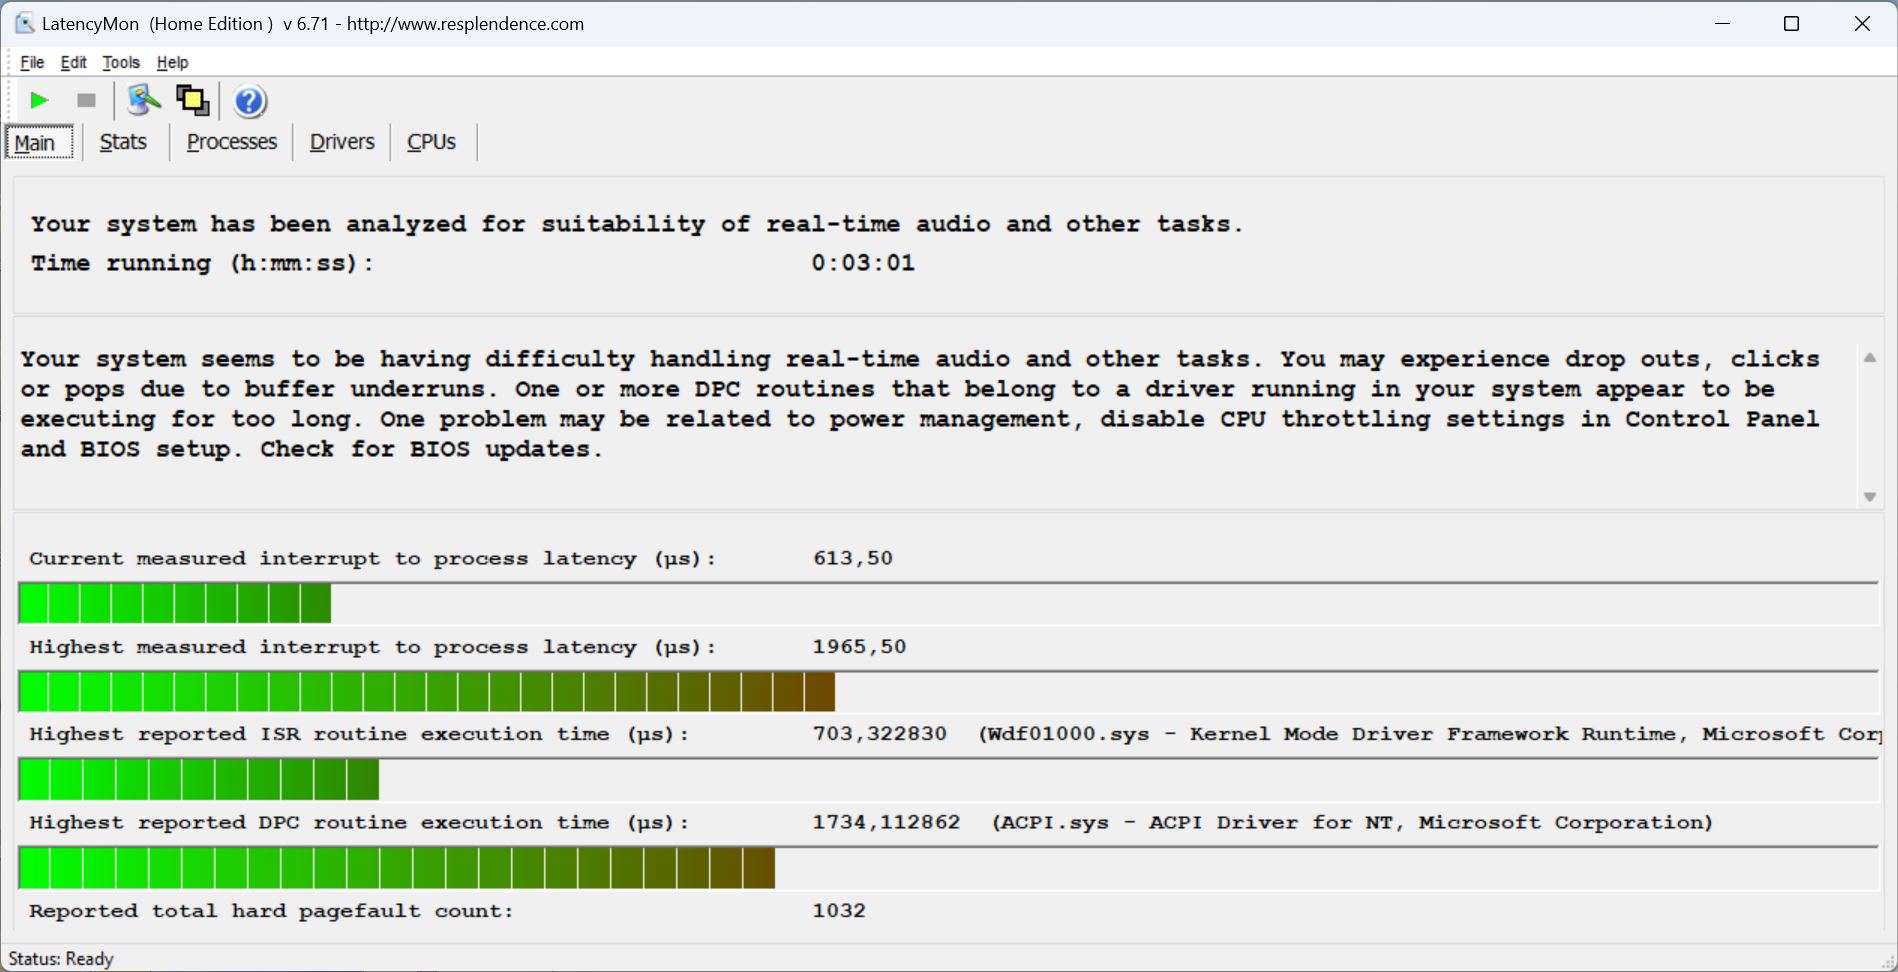
由于控制中心不提供平衡模式,我们使用会议模式和创作者模式对笔记本电脑进行了测试。前者在打开多个浏览器标签页时出现了一些延迟问题,在播放 4K/60-fps 的 YouTube 视频时,这些问题变得更加严重,导致了 8 次丢帧。
如果你认为使用功能更强大的创作者模式后情况会有所改观,那就大错特错了。我们已经注意到打开浏览器时延迟增加。另一方面,视频运行时只出现了一次丢帧。
| DPC Latencies / LatencyMon - interrupt to process latency (max), Web, Youtube, Prime95 | |
| HP Omen 16-wf000 | |
| Aorus 15 YE5-54DEB34SH | |
| HP Victus 16-r0077ng | |
| Aorus 15 BSF | |
| Dell XPS 15 9530 RTX 4070 | |
| Captiva Advanced Gaming I74-121 | |
* ... smaller is better
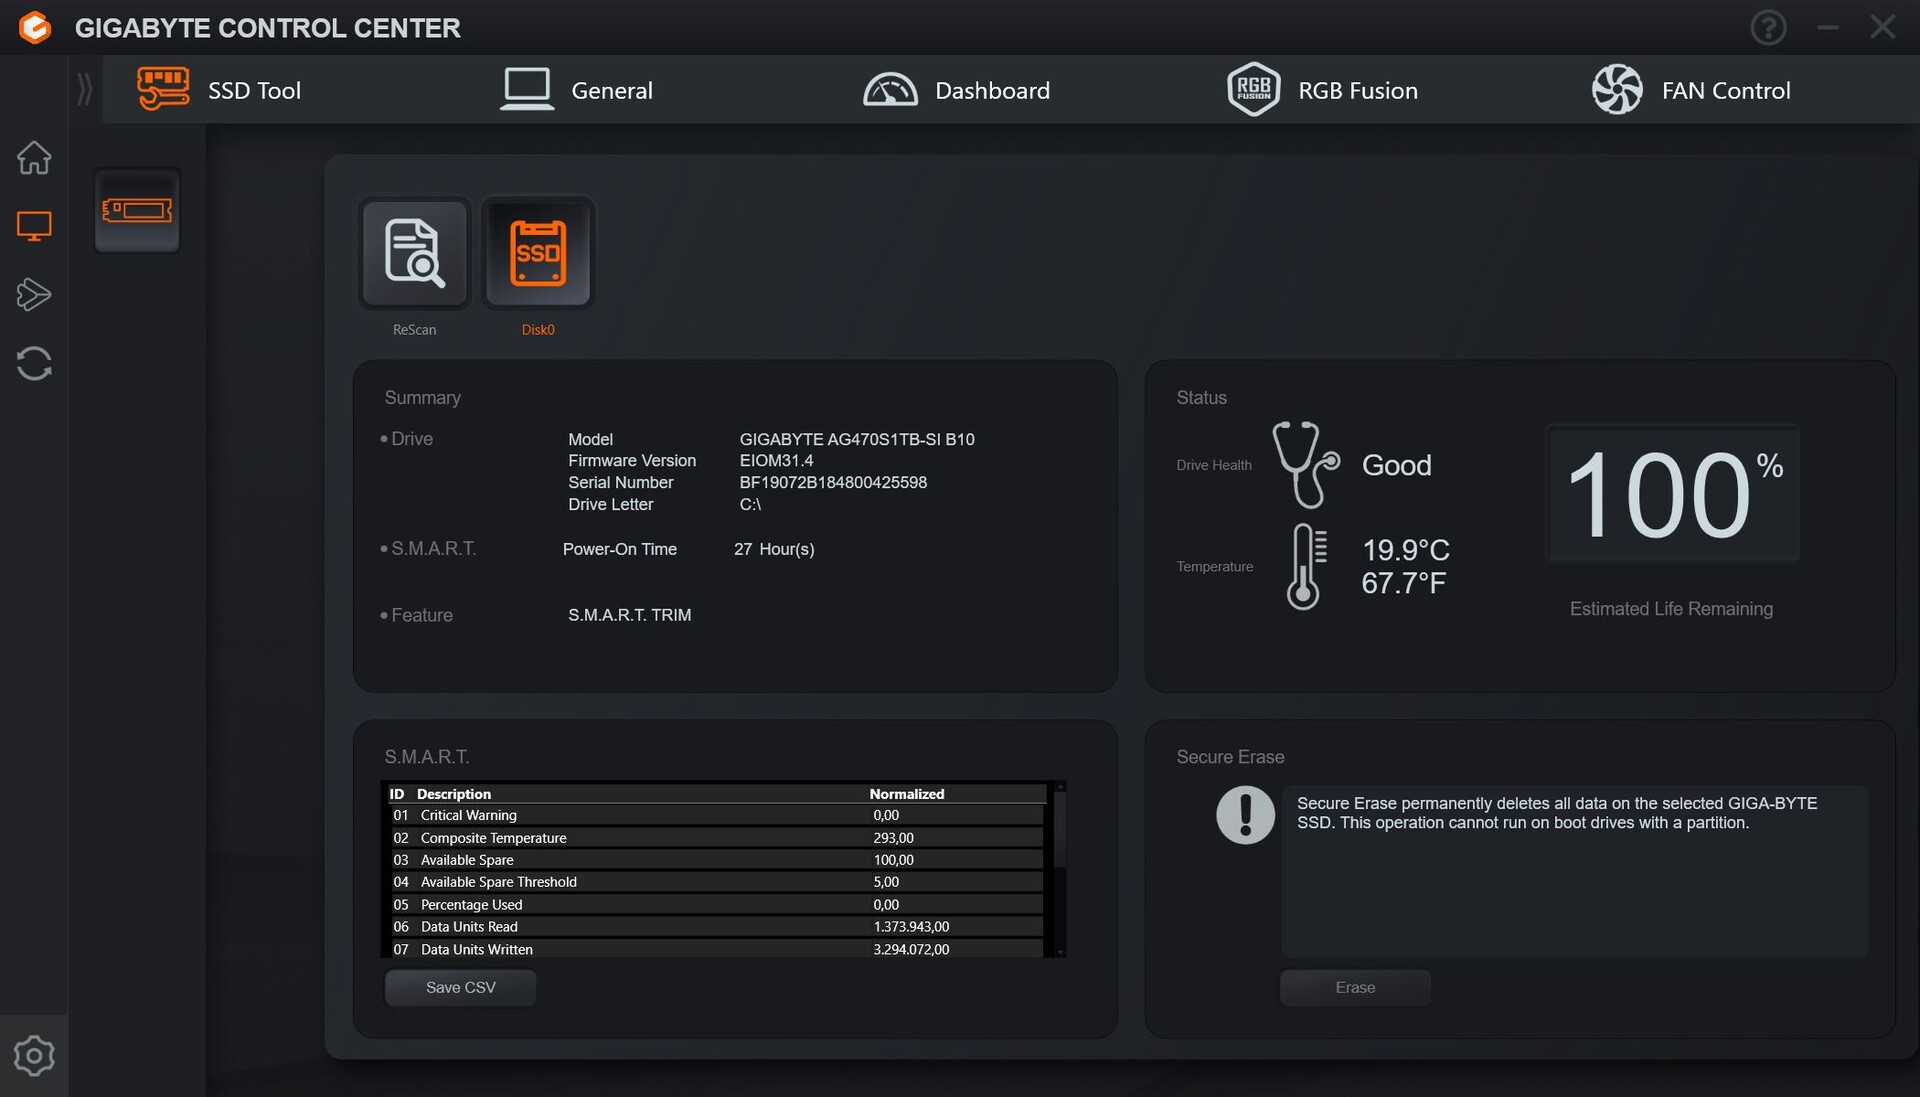
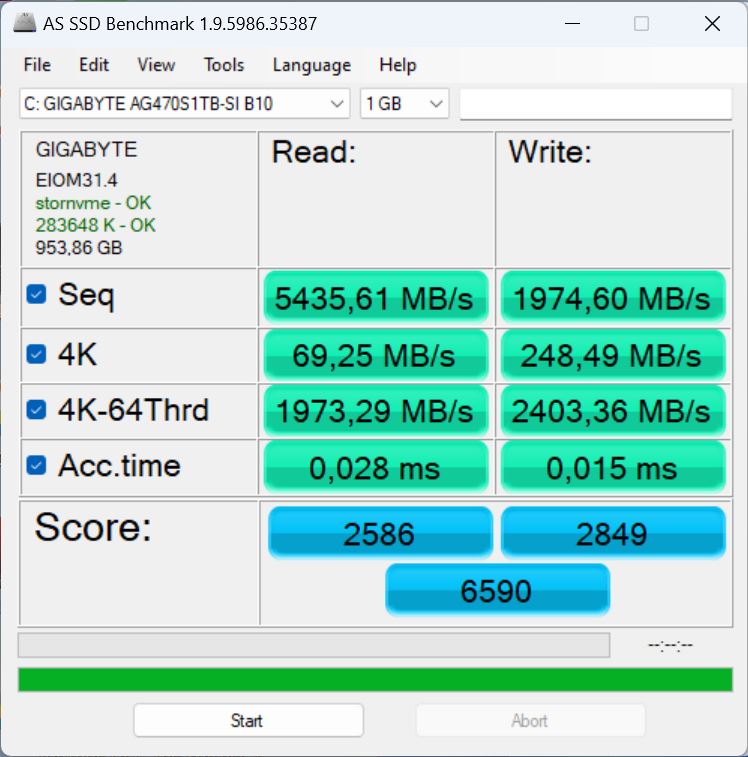
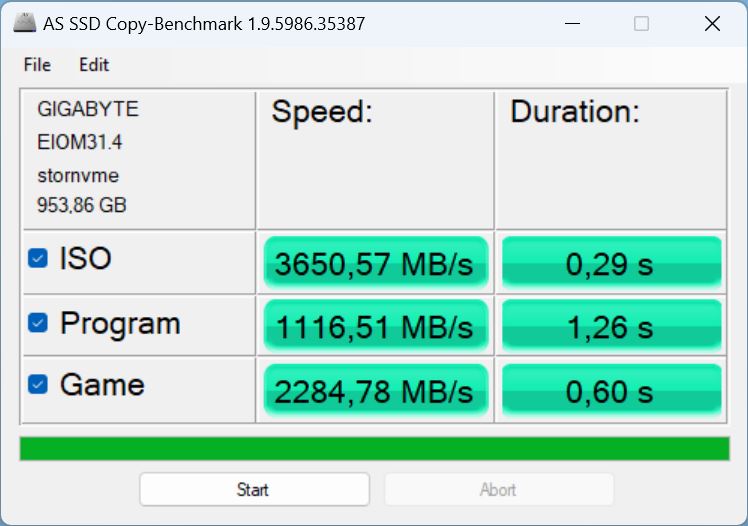
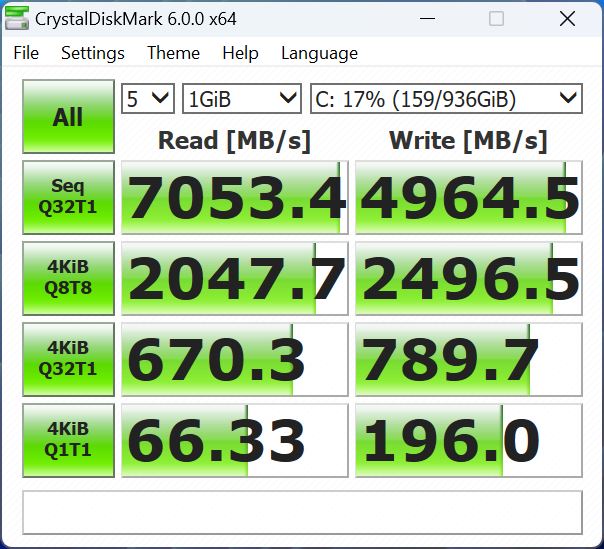
存储设备
安装了 1 TB 存储空间的技嘉 AG470S1TB-SI B10 是一款快速的高端 PCIe Gen 4 NVMe 固态硬盘。在我们的 固态硬盘最佳排行榜中,它目前排在第 3 位,表现出色。
在 Aorus 15 YE5 中,它可能无法充分发挥自己的潜力(比参考型号落后 12%),但它仍然比竞争对手的固态硬盘更快。唯一的例外是当前一代的 Aorus 15。它使用了相同的固态硬盘,但速度快了 28%。即便如此,我们测试样本的性能仍然非常出色,最重要的是,它在连续使用过程中保持稳定,没有出现节流问题。

* ... smaller is better
Reading continuous performance: DiskSpd Read Loop, Queue Depth 8
图形卡
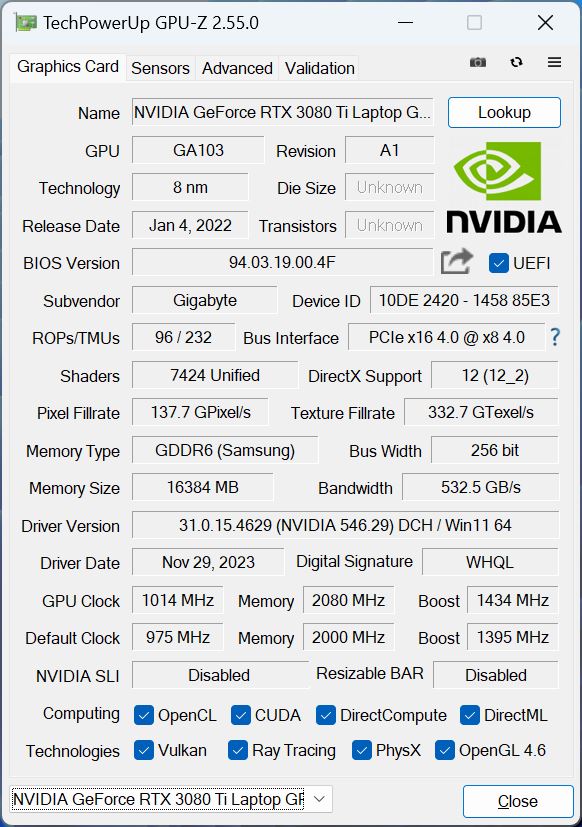
前旗舰机型 Geforce RTX 3080 Ti配备 16GB 内存,作为笔记本电脑的显卡负责 3D 计算。不过,在最大可能的 165 瓦功率中,它的功率只有 130 瓦。这款功能强大的安培芯片不如当前的 Ada Lovelace 架构高效,可能会产生更多热量。
在合成 3DMark 基准测试中,我们的 Aorus 超越了搭载了 RTX 4060和 RTX 4070.我们的 RTX 3080 Ti 在几乎所有测试中都遥遥领先,即使只有几个百分点的差距。不过,它们之间的差距很小,但在所有测试中都保持不变。
在电池模式下,RTX 3080 Ti 在Fire Strike 中的性能从 31110 分下降到只有 6921 分,降幅高达 78%!
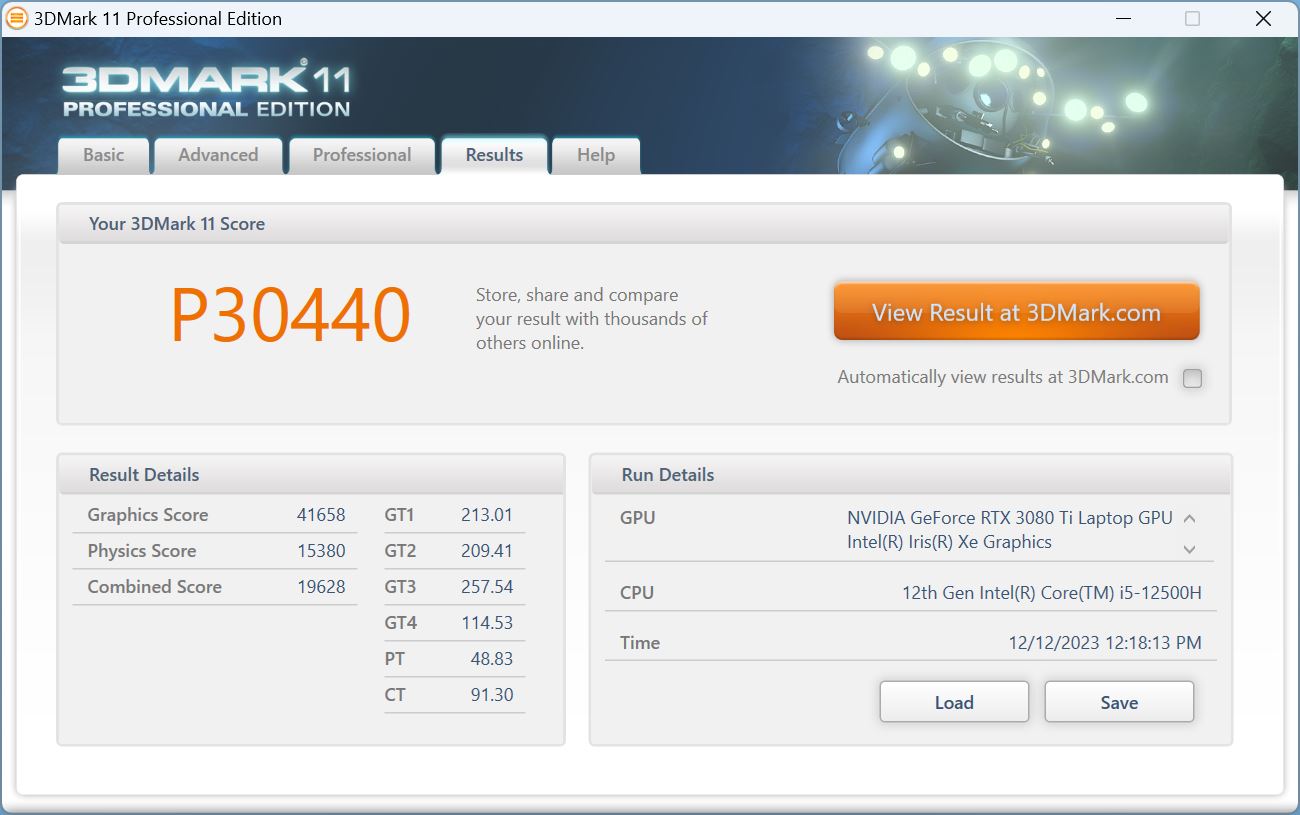
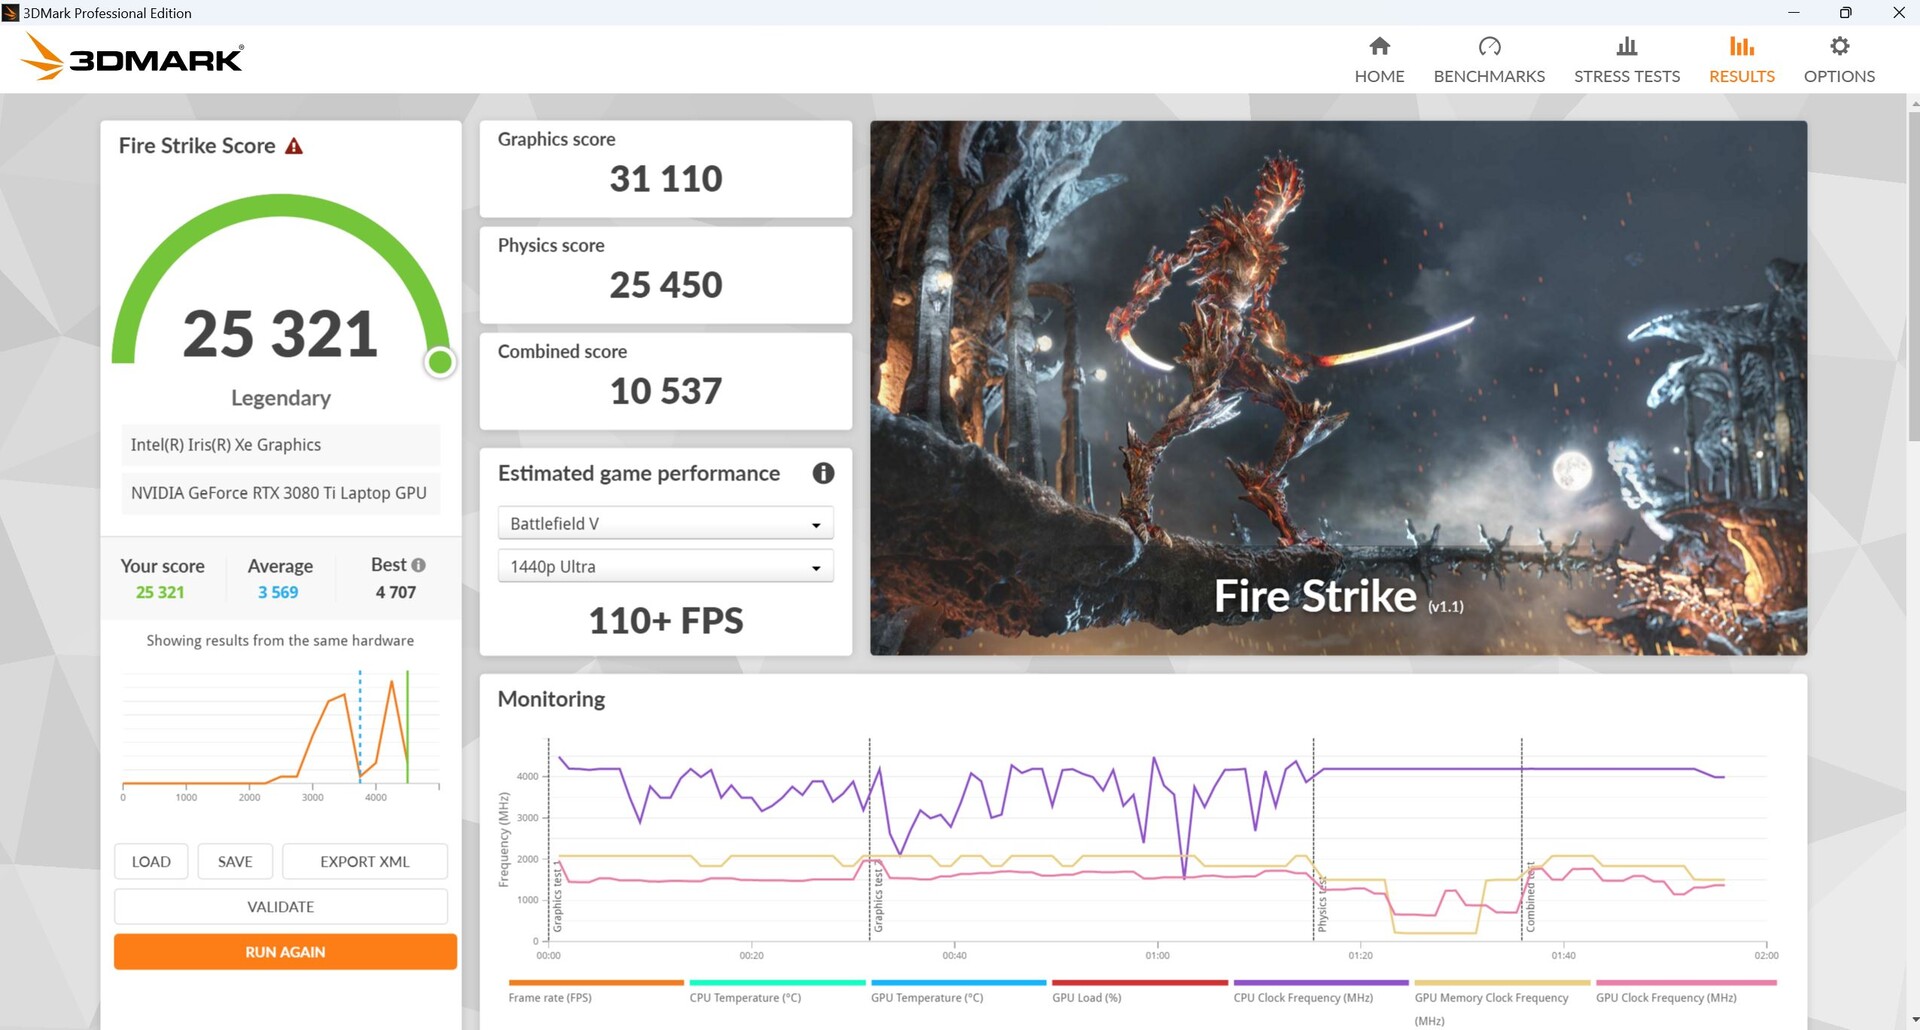
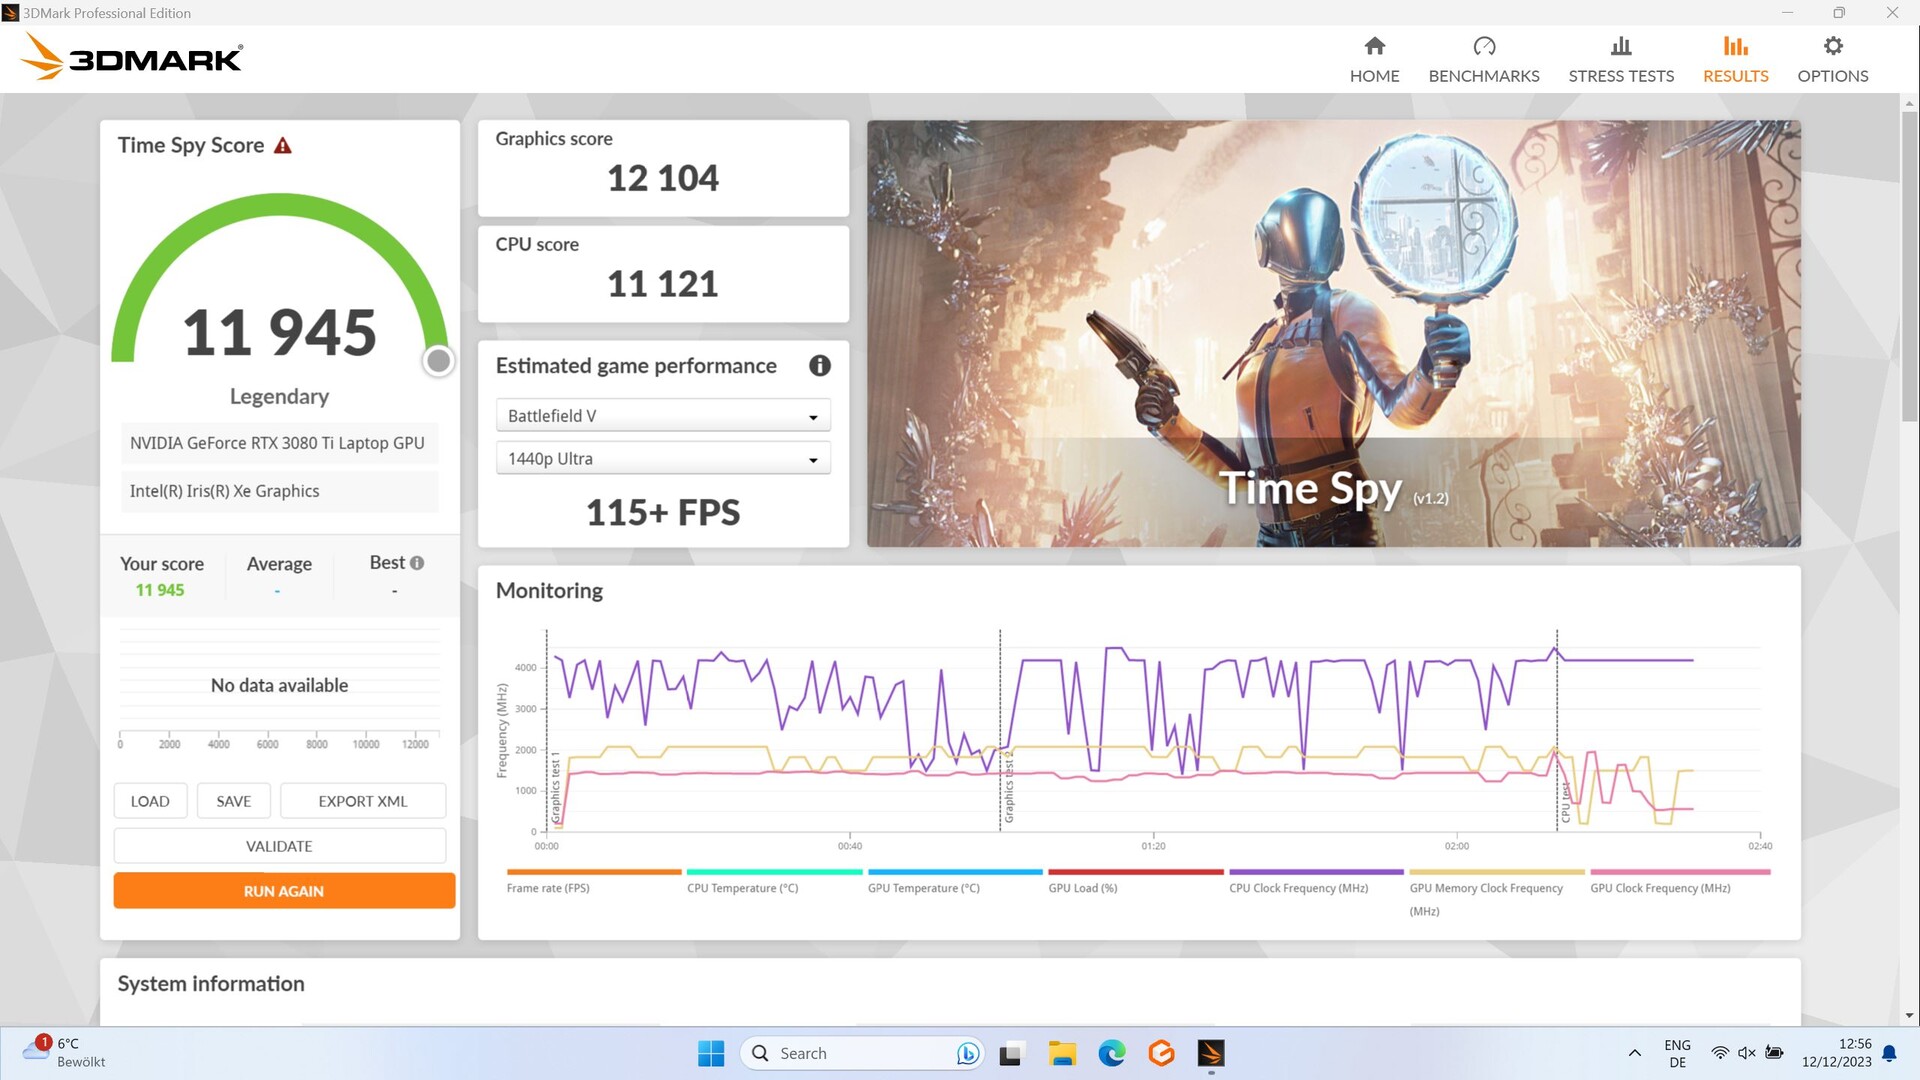
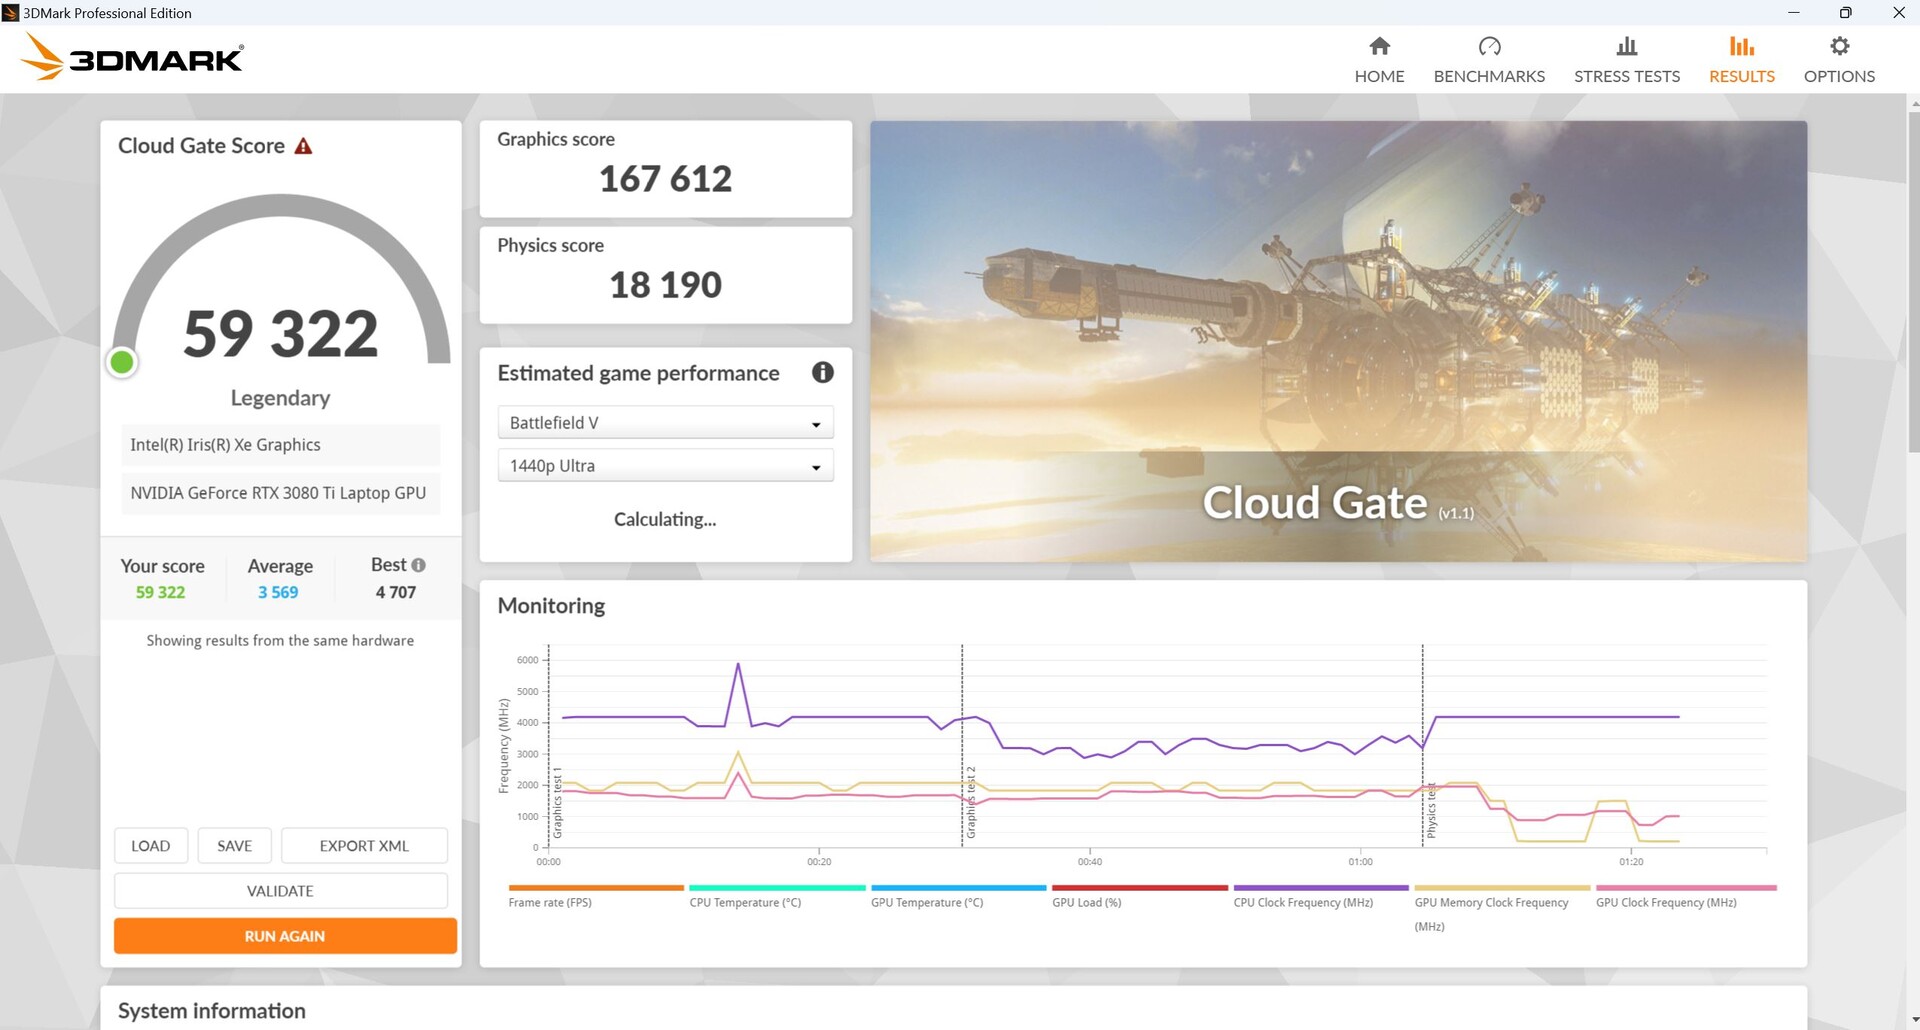
| 3DMark 11 Performance | 30440 points | |
| 3DMark Cloud Gate Standard Score | 59322 points | |
| 3DMark Fire Strike Score | 25321 points | |
| 3DMark Time Spy Score | 11945 points | |
Help | ||
* ... smaller is better
游戏
在游戏中,我们的 Aorus 与 新一代 Aorus(配备 RTX 4070不相上下,甚至还以微弱优势击败了它。所有其他配备 RTX 4070 的竞争对手也都以微弱优势落败。搭载 配备 RTX 4080 的 Omen 16在所有游戏测试中都比排名第二的 Aorus 快约 18%。在以 CPU 为核心的游戏中,它的性能落后于竞争对手,这是因为它采用了性能平平的 i5-12500H.
在对各种模式进行比较时,可以发现在Witcher 3 中,涡轮、人工智能和游戏模式的 GPU 性能几乎相同。唯一的区别是,在涡轮模式下 GPU 的温度明显降低,但噪音也明显增大。
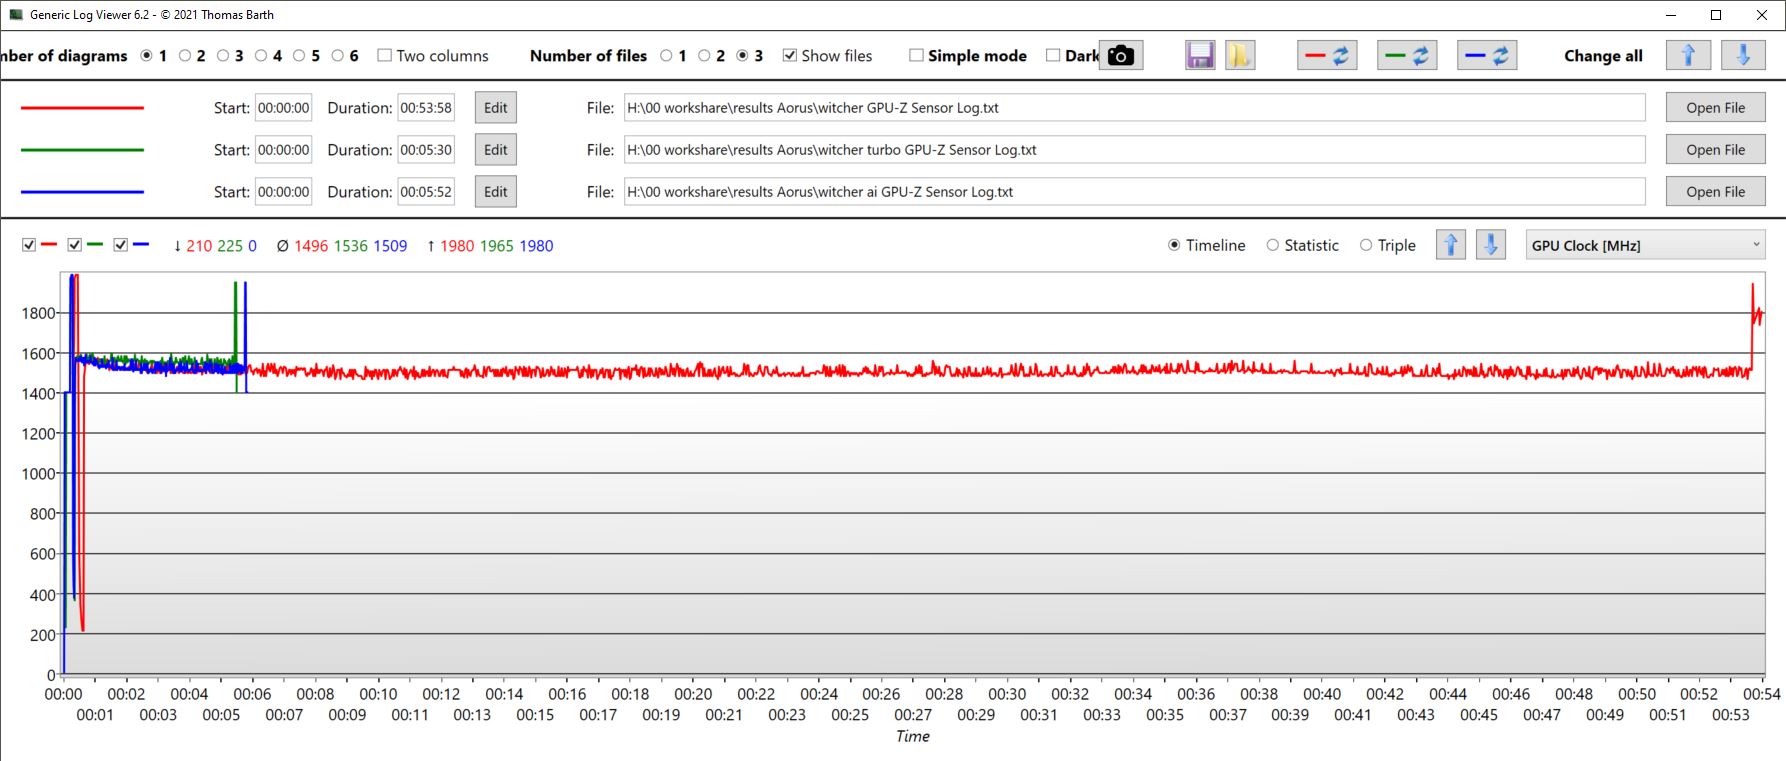
创造者模式(此次为蓝色曲线)的表现稍差,耗电量没有那么大,而且温度也稍低。在噪音排放部分,我们列出了运行 Witcher 3 时的各种模式及其对 FPS 和噪音排放的影响。
| Performance rating - Percent | |
| Average of class Gaming | |
| HP Omen 16-wf000 | |
| Aorus 15 YE5-54DEB34SH -1! | |
| Aorus 15 BSF -1! | |
| Captiva Advanced Gaming I74-121 | |
| HP Victus 16-r0077ng | |
| Dell XPS 15 9530 RTX 4070 | |
| The Witcher 3 - 1920x1080 Ultra Graphics & Postprocessing (HBAO+) | |
| Average of class Gaming (104.7 - 240, n=7, last 2 years) | |
| HP Omen 16-wf000 | |
| Aorus 15 YE5-54DEB34SH | |
| Aorus 15 BSF | |
| HP Victus 16-r0077ng | |
| Captiva Advanced Gaming I74-121 | |
| Dell XPS 15 9530 RTX 4070 | |
| GTA V - 1920x1080 Highest AA:4xMSAA + FX AF:16x | |
| Average of class Gaming (48.3 - 186.9, n=94, last 2 years) | |
| Aorus 15 YE5-54DEB34SH | |
| Captiva Advanced Gaming I74-121 | |
| HP Omen 16-wf000 | |
| HP Victus 16-r0077ng | |
| Dell XPS 15 9530 RTX 4070 | |
| Final Fantasy XV Benchmark - 1920x1080 High Quality | |
| HP Omen 16-wf000 | |
| Average of class Gaming (41 - 215, n=95, last 2 years) | |
| Aorus 15 YE5-54DEB34SH | |
| Aorus 15 BSF | |
| HP Victus 16-r0077ng | |
| Captiva Advanced Gaming I74-121 | |
| Dell XPS 15 9530 RTX 4070 | |
| Strange Brigade - 1920x1080 ultra AA:ultra AF:16 | |
| HP Omen 16-wf000 | |
| Average of class Gaming (76.3 - 458, n=87, last 2 years) | |
| Aorus 15 BSF | |
| HP Victus 16-r0077ng | |
| Captiva Advanced Gaming I74-121 | |
| Dell XPS 15 9530 RTX 4070 | |
| Dota 2 Reborn - 1920x1080 ultra (3/3) best looking | |
| HP Omen 16-wf000 | |
| Average of class Gaming (84.8 - 248, n=107, last 2 years) | |
| Aorus 15 BSF | |
| Captiva Advanced Gaming I74-121 | |
| Aorus 15 YE5-54DEB34SH | |
| Dell XPS 15 9530 RTX 4070 | |
| HP Victus 16-r0077ng | |
| X-Plane 11.11 - 1920x1080 high (fps_test=3) | |
| HP Omen 16-wf000 | |
| Aorus 15 BSF | |
| Captiva Advanced Gaming I74-121 | |
| Average of class Gaming (55.5 - 143.5, n=109, last 2 years) | |
| HP Victus 16-r0077ng | |
| Aorus 15 YE5-54DEB34SH | |
| Dell XPS 15 9530 RTX 4070 | |
Witcher 3 FPS diagram
| low | med. | high | ultra | QHD | 4K | |
|---|---|---|---|---|---|---|
| GTA V (2015) | 184.4 | 180.8 | 176 | 118 | ||
| The Witcher 3 (2015) | 385 | 306 | 222 | 120 | 86 | |
| Dota 2 Reborn (2015) | 167.6 | 154.1 | 146.4 | 138.9 | 140.1 | |
| Final Fantasy XV Benchmark (2018) | 206 | 151.7 | 119.2 | 92.2 | ||
| X-Plane 11.11 (2018) | 134.1 | 121.3 | 94.9 | 85.4 | ||
| Far Cry 5 (2018) | 165 | 137 | 131 | 124 | 116 |
排放与功率 - 比 RTX 3080 Ti 所显示的更好
噪音排放
在涡轮增压模式下,风扇始终接近极限,即 52 至 55 分贝。而在其他模式下,风扇则更多地根据情况工作。下表列出了在播放《TheWitcher 3 》约 10 分钟后不同模式下的噪音排放水平。总体而言,相对于其性能而言,其噪音排放可以说是适中的,而且由于有多种模式,可以对其进行非常灵活的调节。无论是 Captiva和 惠普 Victus在 3D 应用中表现较差,但噪音却差不多,Captiva 甚至更大。
在游戏模式下,笔记本电脑空转时风扇也会工作,尽管声音很小。在会议模式或节能模式下,风扇通常很安静。在模拟平均负载情况下(3DMark06),选择游戏模式时,噪音逐渐增加,最高达到 43 分贝。在节能模式下,同样的测试仅为 27 分贝。
| 性能模式/Witcher 3 | 最高帧频 | 平均帧频 | 噪音排放(分贝) | 消耗(瓦特 |
|---|---|---|---|---|
| Turbo | 124 | 118 | 52.68 | 199 |
| AI | 122 | 116 | 44.78 | 197 |
| 游戏 | 125 | 116 | 46.77 | 196 |
| 创作者 | 115 | 110 | 44.78 | 185 |
| 会议 | 111 | 105 | 36.53 | 163 |
| 节能器 | 115 | 106 | 36.53 | 162 |
Noise level
| Idle |
| 23 / 23 / 26.42 dB(A) |
| Load |
| 43.5 / 50.21 dB(A) |
 | ||
30 dB silent 40 dB(A) audible 50 dB(A) loud |
||
min: | ||
| Aorus 15 YE5-54DEB34SH GeForce RTX 3080 Ti Laptop GPU, i5-12500H, Gigabyte AG470S1TB-SI B10 | Aorus 15 BSF GeForce RTX 4070 Laptop GPU, i7-13700H, Gigabyte AG470S1TB-SI B10 | Captiva Advanced Gaming I74-121 GeForce RTX 4060 Laptop GPU, i5-13500H, Samsung SSD 980 1TB MZ-V8V1T0BW | HP Victus 16-r0077ng GeForce RTX 4070 Laptop GPU, i7-13700H, Kioxia XG8 KXG80ZNV1T02 | Dell XPS 15 9530 RTX 4070 GeForce RTX 4070 Laptop GPU, i7-13700H, SK hynix PC801 HFS001TEJ9X101N | HP Omen 16-wf000 GeForce RTX 4080 Laptop GPU, i7-13700HX, SK hynix PC801 HFS002TEJ9X101N | |
|---|---|---|---|---|---|---|
| Noise | -20% | -3% | -9% | 10% | -13% | |
| off / environment * (dB) | 23 | 24 -4% | 23 -0% | 25 -9% | 23.1 -0% | 23 -0% |
| Idle Minimum * (dB) | 23 | 25 -9% | 23 -0% | 28 -22% | 23.1 -0% | 29.6 -29% |
| Idle Average * (dB) | 23 | 31 -35% | 25.67 -12% | 29 -26% | 23.1 -0% | 29.8 -30% |
| Idle Maximum * (dB) | 26.42 | 37 -40% | 25.67 3% | 30 -14% | 24.2 8% | 30.4 -15% |
| Load Average * (dB) | 43.5 | 51 -17% | 38.52 11% | 43 1% | 27.1 38% | 33.8 22% |
| Witcher 3 ultra * (dB) | 46.77 | 54.17 -16% | 46 2% | 40.1 14% | 57 -22% | |
| Load Maximum * (dB) | 50.21 | 57 -14% | 54.17 -8% | 48 4% | 44.6 11% | 58.3 -16% |
* ... smaller is better
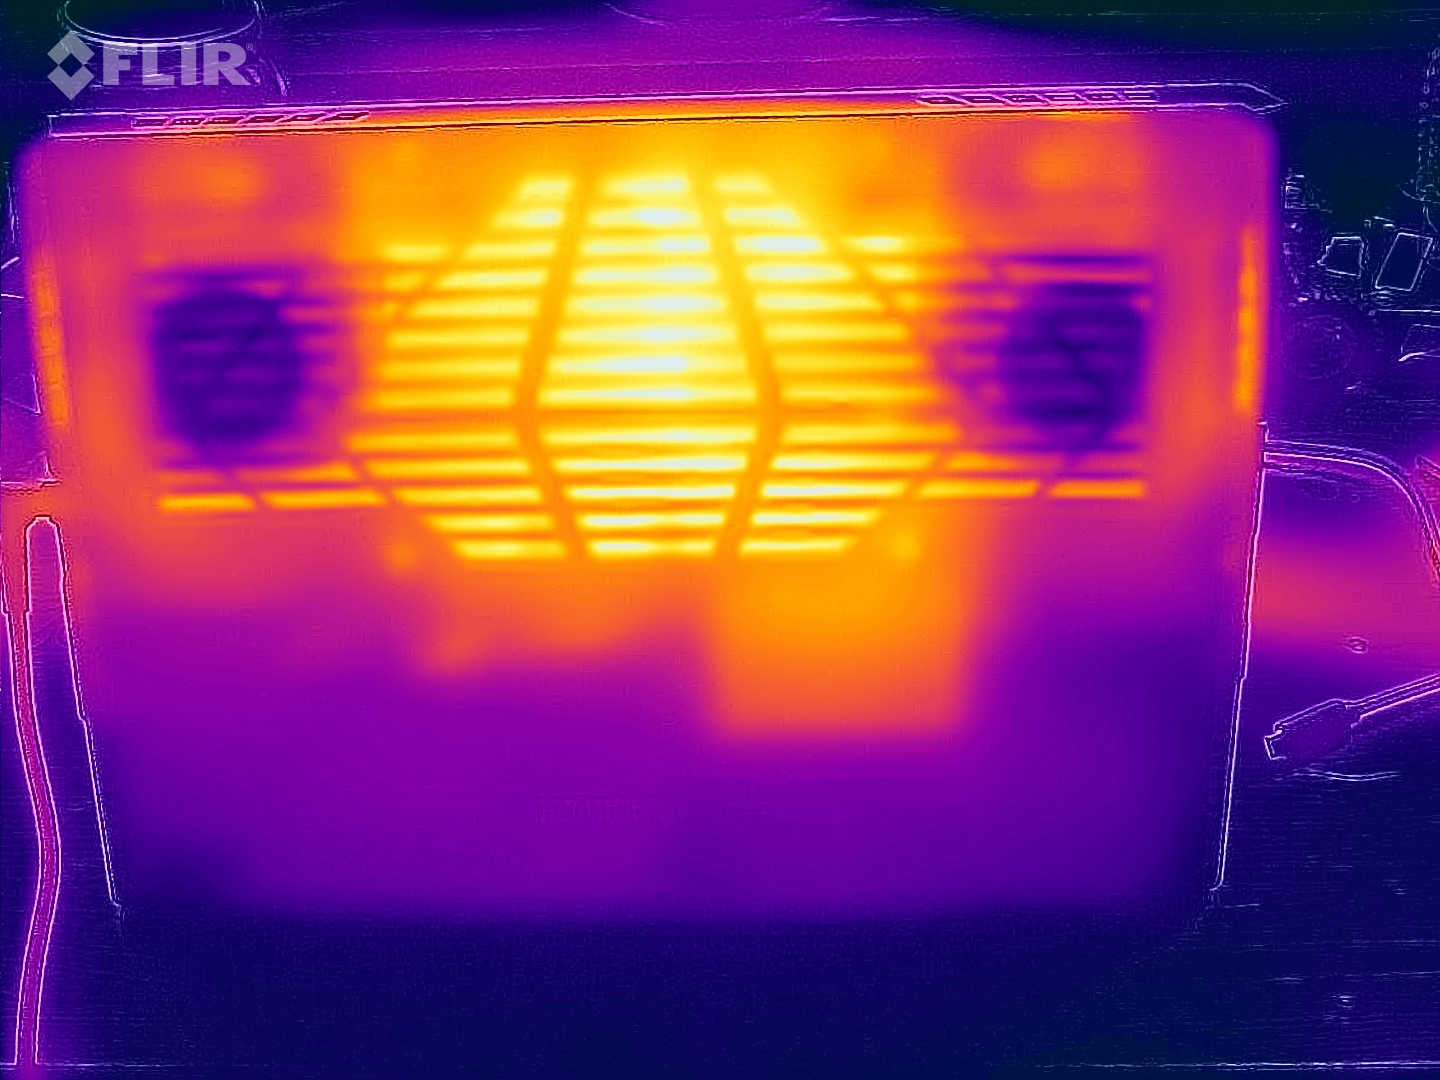
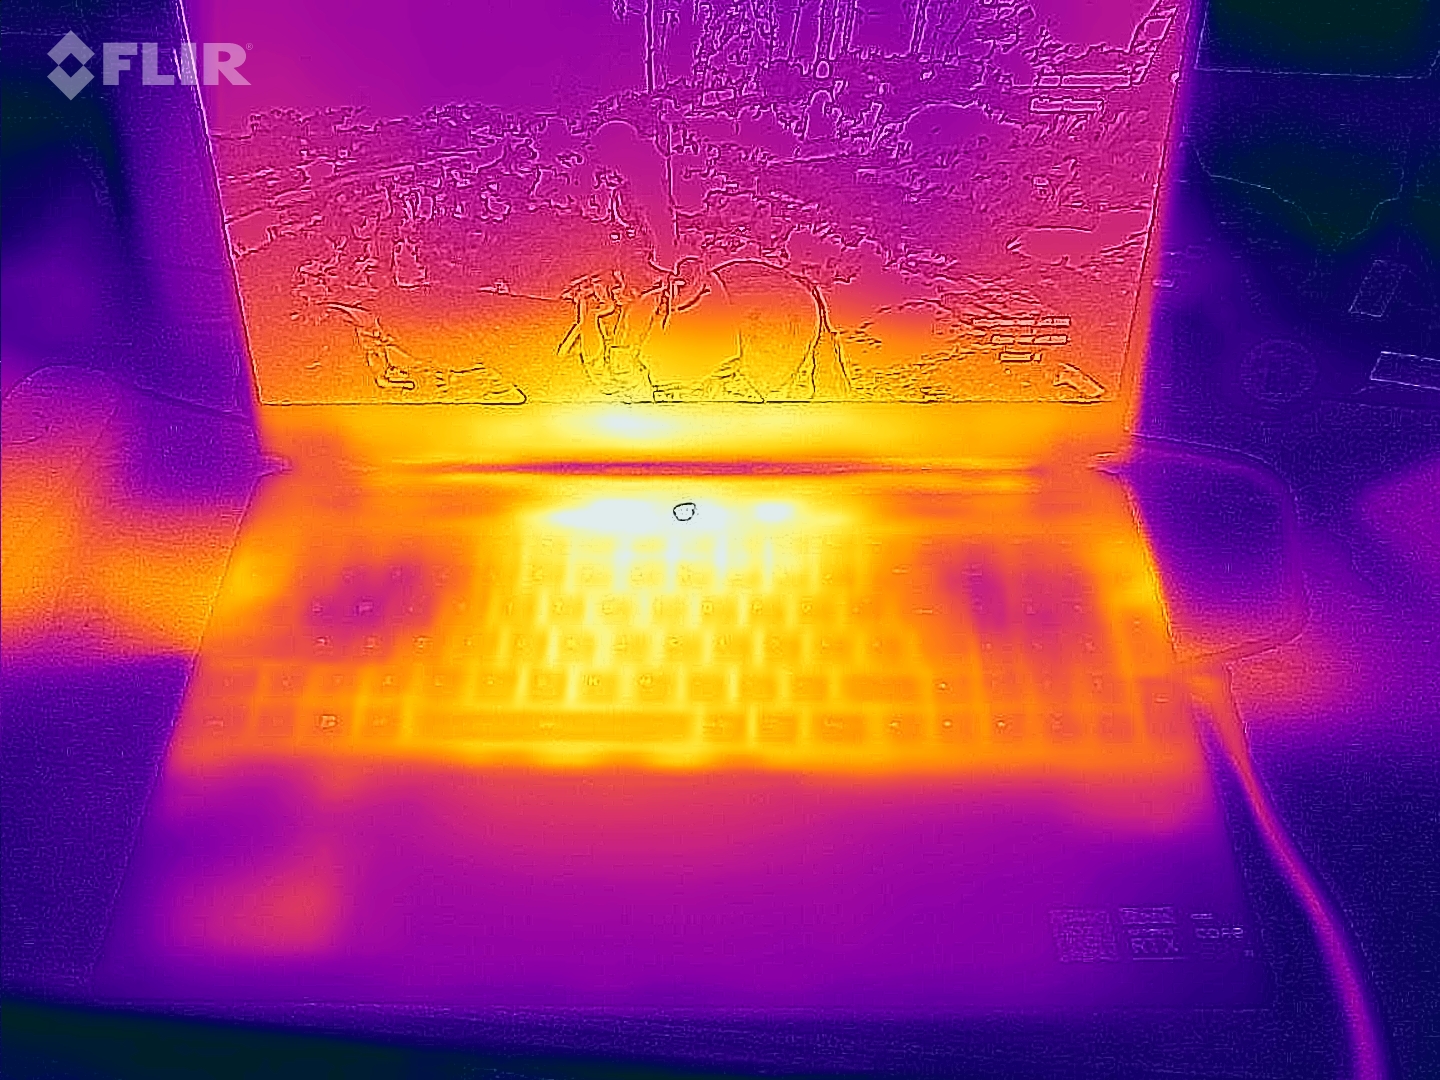
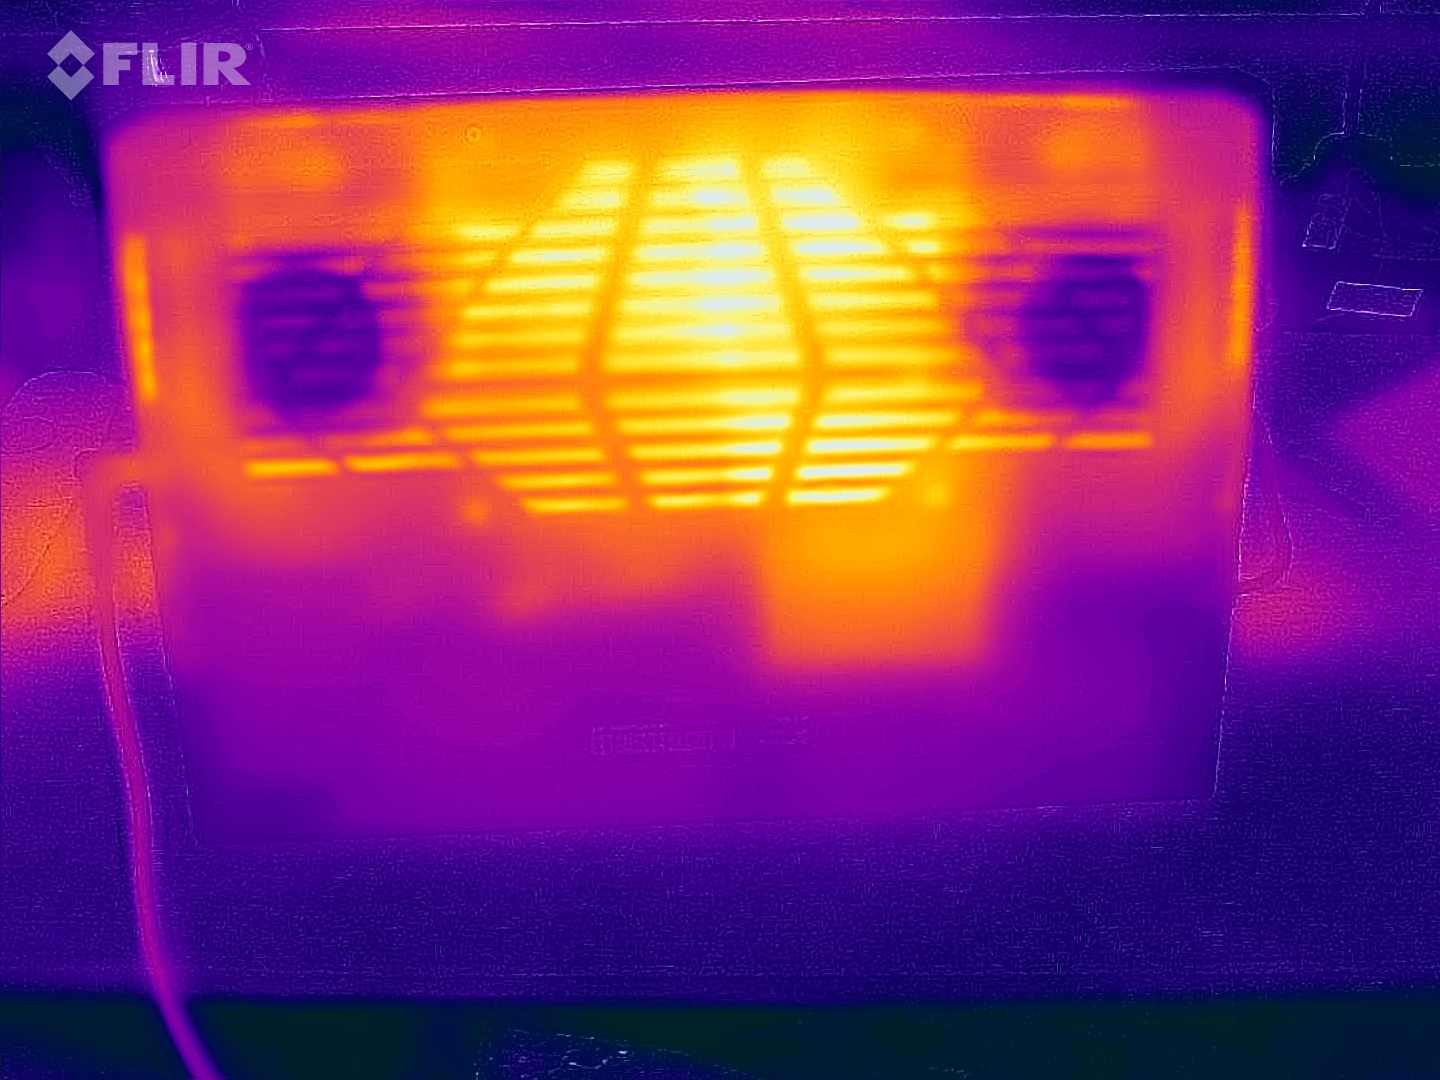
温度
在高负载情况下会发热,尤其是底部中央的显示屏。不过,在高达 50 °C的温度下,它的温度仍在典型游戏笔记本电脑的范围之内。顶部的温度甚至出奇地低,最高只有 43 °C。在涡轮增压模式下,温度甚至更低。
(±) The maximum temperature on the upper side is 43 °C / 109 F, compared to the average of 40.4 °C / 105 F, ranging from 21.2 to 68.8 °C for the class Gaming.
(-) The bottom heats up to a maximum of 50 °C / 122 F, compared to the average of 43.2 °C / 110 F
(+) In idle usage, the average temperature for the upper side is 27.3 °C / 81 F, compared to the device average of 33.9 °C / 93 F.
(+) Playing The Witcher 3, the average temperature for the upper side is 29.7 °C / 85 F, compared to the device average of 33.9 °C / 93 F.
(+) The palmrests and touchpad are cooler than skin temperature with a maximum of 26 °C / 78.8 F and are therefore cool to the touch.
(+) The average temperature of the palmrest area of similar devices was 28.8 °C / 83.8 F (+2.8 °C / 5 F).
| Aorus 15 YE5-54DEB34SH Intel Core i5-12500H, NVIDIA GeForce RTX 3080 Ti Laptop GPU | Aorus 15 BSF Intel Core i7-13700H, NVIDIA GeForce RTX 4070 Laptop GPU | Captiva Advanced Gaming I74-121 Intel Core i5-13500H, NVIDIA GeForce RTX 4060 Laptop GPU | HP Victus 16-r0077ng Intel Core i7-13700H, NVIDIA GeForce RTX 4070 Laptop GPU | Dell XPS 15 9530 RTX 4070 Intel Core i7-13700H, NVIDIA GeForce RTX 4070 Laptop GPU | HP Omen 16-wf000 Intel Core i7-13700HX, NVIDIA GeForce RTX 4080 Laptop GPU | |
|---|---|---|---|---|---|---|
| Heat | -8% | 4% | -8% | 1% | 5% | |
| Maximum Upper Side * (°C) | 43 | 48 -12% | 41 5% | 51 -19% | 45.6 -6% | 45 -5% |
| Maximum Bottom * (°C) | 50 | 47 6% | 42 16% | 54 -8% | 42 16% | 48.8 2% |
| Idle Upper Side * (°C) | 33 | 39 -18% | 32 3% | 37 -12% | 34.4 -4% | 29.2 12% |
| Idle Bottom * (°C) | 32 | 35 -9% | 35 -9% | 29 9% | 33.2 -4% | 28.8 10% |
* ... smaller is better
发言人
扬声器音量适中是一个积极的方面。不过,几乎没有低音,甚至中高音也不是特别均衡。
麦克风和耳机的 3.5 毫米组合插孔可用于连接外部音频设备。
Aorus 15 YE5-54DEB34SH audio analysis
(+) | speakers can play relatively loud (84.15 dB)
Bass 100 - 315 Hz
(-) | nearly no bass - on average 27.1% lower than median
(±) | linearity of bass is average (12.4% delta to prev. frequency)
Mids 400 - 2000 Hz
(±) | higher mids - on average 6.2% higher than median
(±) | linearity of mids is average (7.7% delta to prev. frequency)
Highs 2 - 16 kHz
(±) | higher highs - on average 7.4% higher than median
(±) | linearity of highs is average (7.5% delta to prev. frequency)
Overall 100 - 16.000 Hz
(±) | linearity of overall sound is average (22.5% difference to median)
Compared to same class
» 81% of all tested devices in this class were better, 5% similar, 14% worse
» The best had a delta of 6%, average was 18%, worst was 132%
Compared to all devices tested
» 66% of all tested devices were better, 6% similar, 28% worse
» The best had a delta of 4%, average was 23%, worst was 134%
Apple MacBook Pro 16 2021 M1 Pro audio analysis
(+) | speakers can play relatively loud (84.7 dB)
Bass 100 - 315 Hz
(+) | good bass - only 3.8% away from median
(+) | bass is linear (5.2% delta to prev. frequency)
Mids 400 - 2000 Hz
(+) | balanced mids - only 1.3% away from median
(+) | mids are linear (2.1% delta to prev. frequency)
Highs 2 - 16 kHz
(+) | balanced highs - only 1.9% away from median
(+) | highs are linear (2.7% delta to prev. frequency)
Overall 100 - 16.000 Hz
(+) | overall sound is linear (4.6% difference to median)
Compared to same class
» 0% of all tested devices in this class were better, 0% similar, 100% worse
» The best had a delta of 5%, average was 17%, worst was 45%
Compared to all devices tested
» 0% of all tested devices were better, 0% similar, 100% worse
» The best had a delta of 4%, average was 23%, worst was 134%
耗电量
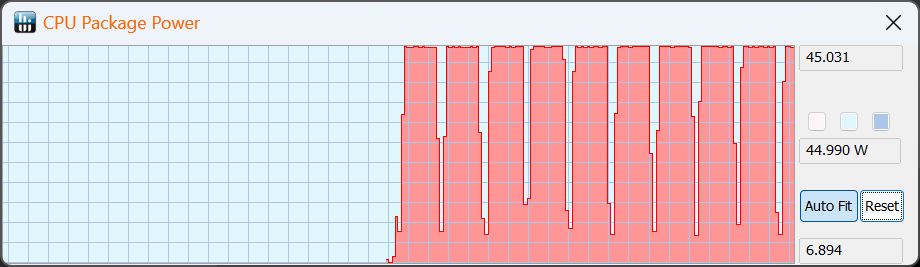
好吧,RTX 3080 Ti 并不完全节俭--从技术上讲,现在的 CPU/GPU 应该更加高效。
例如,要想在玩 Witcher 3 时和 Captiva 一样 "省 电",就必须将我们的 Aorus 设置为会议模式或节能模式。然而,游戏中的刷新率也达到了令人吃惊的水平(见噪音排放部分的表格)。
最重要的是,我们在 3DMark06 测试(平均负载)中测得的 150 瓦功耗非常低;相比之下,Captiva 的功耗仅为 85 瓦。
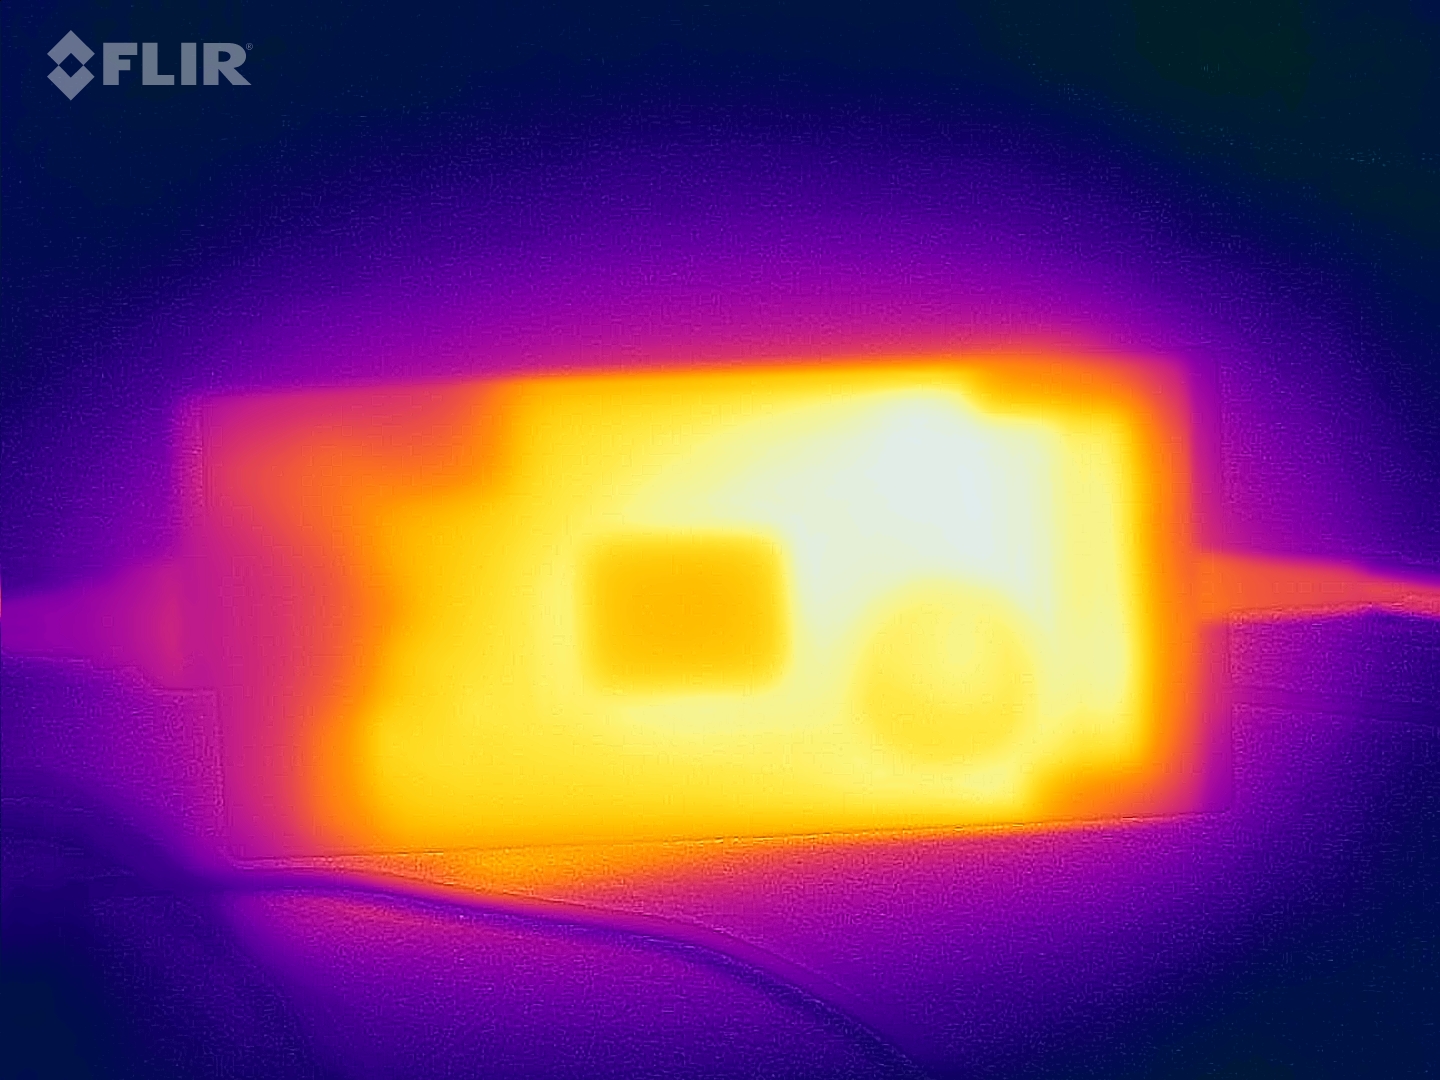
我们测得的最大值和临时值为 204 瓦,Delta 的 240 瓦电源可以轻松应对。
| Off / Standby | |
| Idle | |
| Load |
|
Key:
min: | |
| Aorus 15 YE5-54DEB34SH GeForce RTX 3080 Ti Laptop GPU, i5-12500H, Gigabyte AG470S1TB-SI B10 | Aorus 15 BSF GeForce RTX 4070 Laptop GPU, i7-13700H, Gigabyte AG470S1TB-SI B10 | Captiva Advanced Gaming I74-121 GeForce RTX 4060 Laptop GPU, i5-13500H, Samsung SSD 980 1TB MZ-V8V1T0BW | HP Victus 16-r0077ng GeForce RTX 4070 Laptop GPU, i7-13700H, Kioxia XG8 KXG80ZNV1T02 | Dell XPS 15 9530 RTX 4070 GeForce RTX 4070 Laptop GPU, i7-13700H, SK hynix PC801 HFS001TEJ9X101N | HP Omen 16-wf000 GeForce RTX 4080 Laptop GPU, i7-13700HX, SK hynix PC801 HFS002TEJ9X101N | |
|---|---|---|---|---|---|---|
| Power Consumption | 10% | 15% | 23% | 23% | -24% | |
| Idle 150cd/m2 * (Watt) | 16 | 12.4 22% | 18 -13% | 12.8 20% | 20.1 -26% | 23.2 -45% |
| 3DMark06 Return To Proxycon * (Watt) | 150 | 85 43% | ||||
| Witcher 3 ultra * (Watt) | 196 | 175.8 10% | 164 16% | 141.8 28% | 95.4 51% | 214 -9% |
| 1280x720 Prime95 28.10 and Furmark 1.25 * (Watt) | 204 | 210 -3% | 179 12% | 164.1 20% | 117.2 43% | 240 -18% |
* ... smaller is better
Power consumption Witcher 3 / stress test
Power consumption with external monitor
运行时间
Aorus 的运行时间令人失望,这可能是由于其空闲时的耗电量增加所致。技嘉安装了 99 瓦时的电池,但其运行时间仍与 Captiva的水平!配备 i7-13700H 和 RTX 4070 的新一代 Aorus BSF 的 99 瓦时电池续航时间延长了 65%,在 WLAN 测试中几乎是后者的两倍!它持续了 10 多个小时,而我们的 Aorus 持续了不到 5.5 个小时。
| Aorus 15 YE5-54DEB34SH i5-12500H, GeForce RTX 3080 Ti Laptop GPU, 99 Wh | Aorus 15 BSF i7-13700H, GeForce RTX 4070 Laptop GPU, 99 Wh | Captiva Advanced Gaming I74-121 i5-13500H, GeForce RTX 4060 Laptop GPU, 53 Wh | HP Victus 16-r0077ng i7-13700H, GeForce RTX 4070 Laptop GPU, 83 Wh | Dell XPS 15 9530 RTX 4070 i7-13700H, GeForce RTX 4070 Laptop GPU, 86 Wh | HP Omen 16-wf000 i7-13700HX, GeForce RTX 4080 Laptop GPU, 83 Wh | Average of class Gaming | |
|---|---|---|---|---|---|---|---|
| Battery runtime | 64% | -5% | 34% | 20% | -20% | 26% | |
| H.264 (h) | 5.3 | 9 70% | 4.9 -8% | 8.32 ? 57% | |||
| WiFi v1.3 (h) | 5.3 | 10.3 94% | 5.3 0% | 7.1 34% | 8 51% | 5.1 -4% | 7.11 ? 34% |
| Load (h) | 1.7 | 2.2 29% | 1.6 -6% | 1.5 -12% | 1.1 -35% | 1.502 ? -12% | |
| Reader / Idle (h) | 10.9 | 11.5 | 5.5 | 8.27 ? |
Pros
Cons
结论 - 绝对有竞争力!

12 代 CPU 和 RTX 3080 Ti 的组合绝非过去式,尤其是在(3D)性能方面。Aorus 15 YE5 可以击败配备 RTX 4070 的大多数其他游戏笔记本电脑,因此值得考虑,尤其是考虑到其低廉的价格。尽管如此,Aorus 并没有像许多竞争对手那样放弃雷电 4、快速固态硬盘或全面设计等现代功能。
它的效率不高,这主要体现在笔记本电脑的运行时间令人失望,尽管它的电池容量很大。老式的 720p 网络摄像头可能并不是绝对不能使用,但对于游戏玩家来说,这是一个明显的缺点。Aorus 15 YE5 的一个令人讨厌的典型特点是,只要将显示屏关闭 45 度,设备就会迅速切换到待机状态。
Aorus 15 YE5 以低廉的价格提供了非常强大的游戏性能,而不会像其他一些更昂贵的竞争对手那样显得廉价。它的上一代 GPU 在 3D 性能方面尤其令人印象深刻,而在效率和运行时间方面则有所欠缺。
市场上有一些价格相近的替代产品,如配备 RTX 4070 的微星 Katana。不过,在很多游戏中,Aorus 的速度应该会更快一些。此外,Katana 没有 Thunderbolt 4 功能,也没有高品质的感觉。反过来,微星的优势在于运行时间更长。惠普 惠普 Victus 16惠普 Victus 16 也有类似的表现--它的价格甚至更高一些,但速度和品质感都不如 Aorus。目前,您需要多花大约 300 美元才能购买到新一代 Aorus。
价格和供应情况
Aorus 15 YE5 目前的售价约为 1,500 美元。在撰写本文时,我们在美国的任何在线零售商处都找不到这款产品的销售信息。
Aorus 15 YE5-54DEB34SH
- 12/15/2023 v7 (old)
Christian Hintze
Transparency
The selection of devices to be reviewed is made by our editorial team. The test sample was provided to the author as a loan by the manufacturer or retailer for the purpose of this review. The lender had no influence on this review, nor did the manufacturer receive a copy of this review before publication. There was no obligation to publish this review. As an independent media company, Notebookcheck is not subjected to the authority of manufacturers, retailers or publishers.
This is how Notebookcheck is testing
Every year, Notebookcheck independently reviews hundreds of laptops and smartphones using standardized procedures to ensure that all results are comparable. We have continuously developed our test methods for around 20 years and set industry standards in the process. In our test labs, high-quality measuring equipment is utilized by experienced technicians and editors. These tests involve a multi-stage validation process. Our complex rating system is based on hundreds of well-founded measurements and benchmarks, which maintains objectivity. Further information on our test methods can be found here.
Price comparison

