戴尔XPS 13 9380 2019款(i5-8265U, 256GB, UHD)笔记本电脑评测
| SD Card Reader | |
| average JPG Copy Test (av. of 3 runs) | |
| Dell XPS 13 9380 2019 (Toshiba Exceria Pro SDXC 64 GB UHS-II) | |
| Dell XPS 13 9370 FHD i5 (Toshiba Exceria Pro M501 64 GB UHS-II) | |
| Dell XPS 13 9370 i7 UHD (Toshiba Exceria Pro UHS-II) | |
| Fujitsu Lifebook U938 (Toshiba Exceria Pro SDXC 64 GB UHS-II) | |
| HP Envy 13-ah0003ng (Toshiba Exceria Pro M501 microSDXC 64GB) | |
| Lenovo ThinkPad X280-20KES01S00 (Toshiba Excerie Pro M501) | |
| Average of class Subnotebook (23.7 - 188, n=9, last 2 years) | |
| maximum AS SSD Seq Read Test (1GB) | |
| Dell XPS 13 9370 i7 UHD (Toshiba Exceria Pro UHS-II) | |
| Dell XPS 13 9370 FHD i5 (Toshiba Exceria Pro M501 64 GB UHS-II) | |
| Dell XPS 13 9380 2019 (Toshiba Exceria Pro SDXC 64 GB UHS-II) | |
| Fujitsu Lifebook U938 (Toshiba Exceria Pro SDXC 64 GB UHS-II) | |
| Average of class Subnotebook (24.9 - 195, n=8, last 2 years) | |
| Lenovo ThinkPad X280-20KES01S00 (Toshiba Excerie Pro M501) | |
| HP Envy 13-ah0003ng (Toshiba Exceria Pro M501 microSDXC 64GB) | |
| |||||||||||||||||||||||||
Brightness Distribution: 85 %
Center on Battery: 404 cd/m²
Contrast: 1092:1 (Black: 0.37 cd/m²)
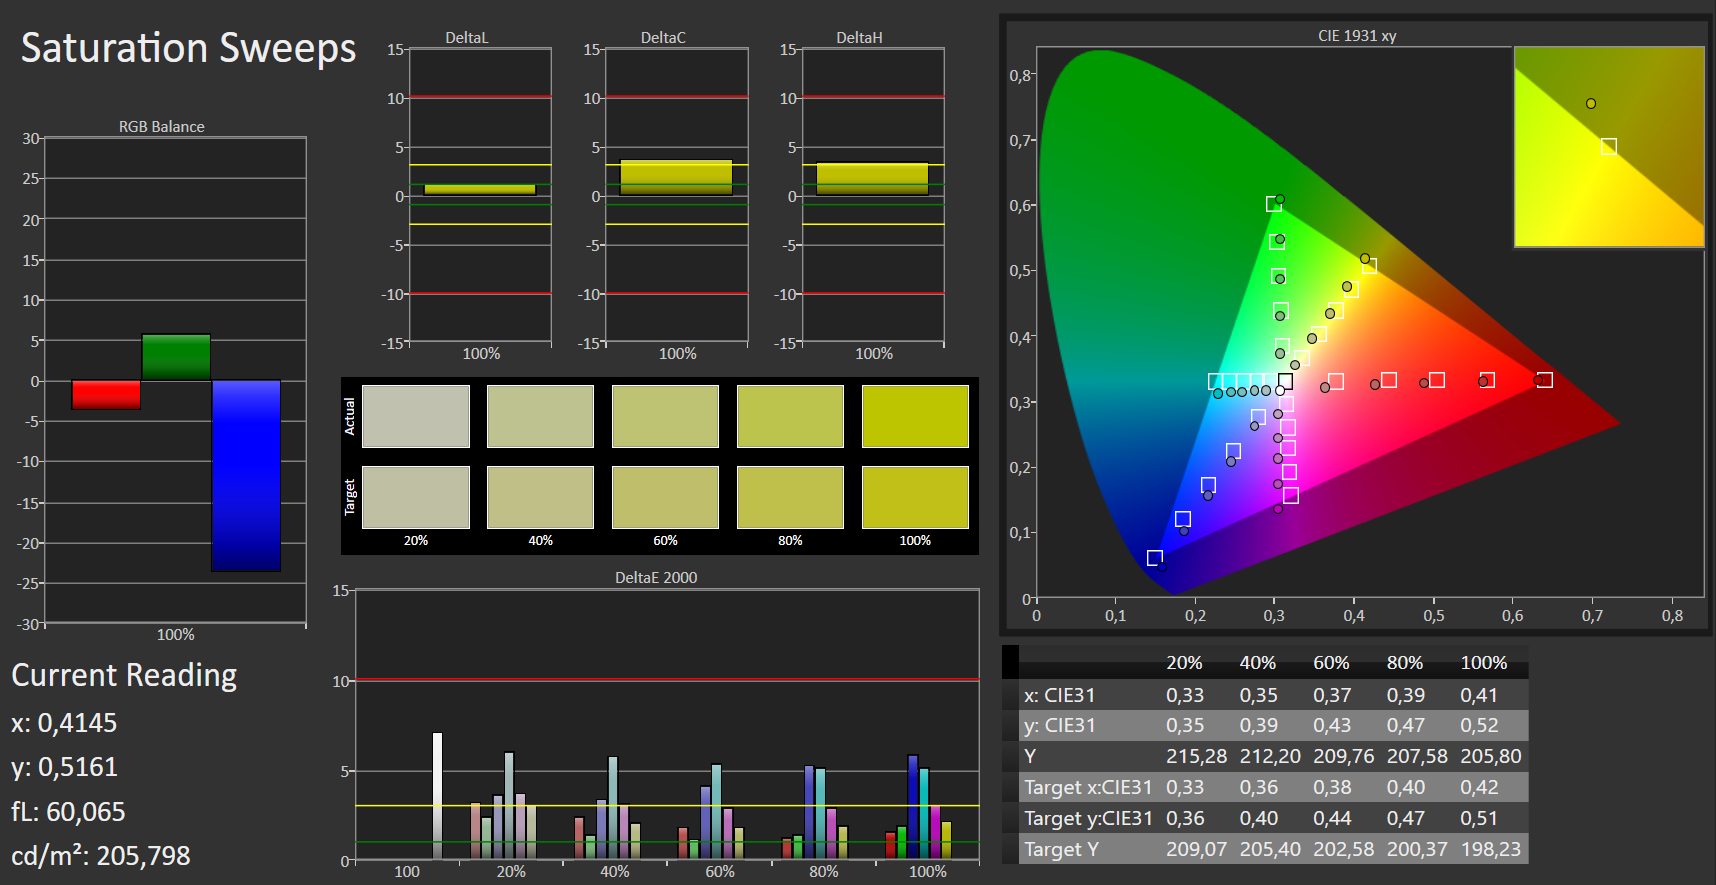
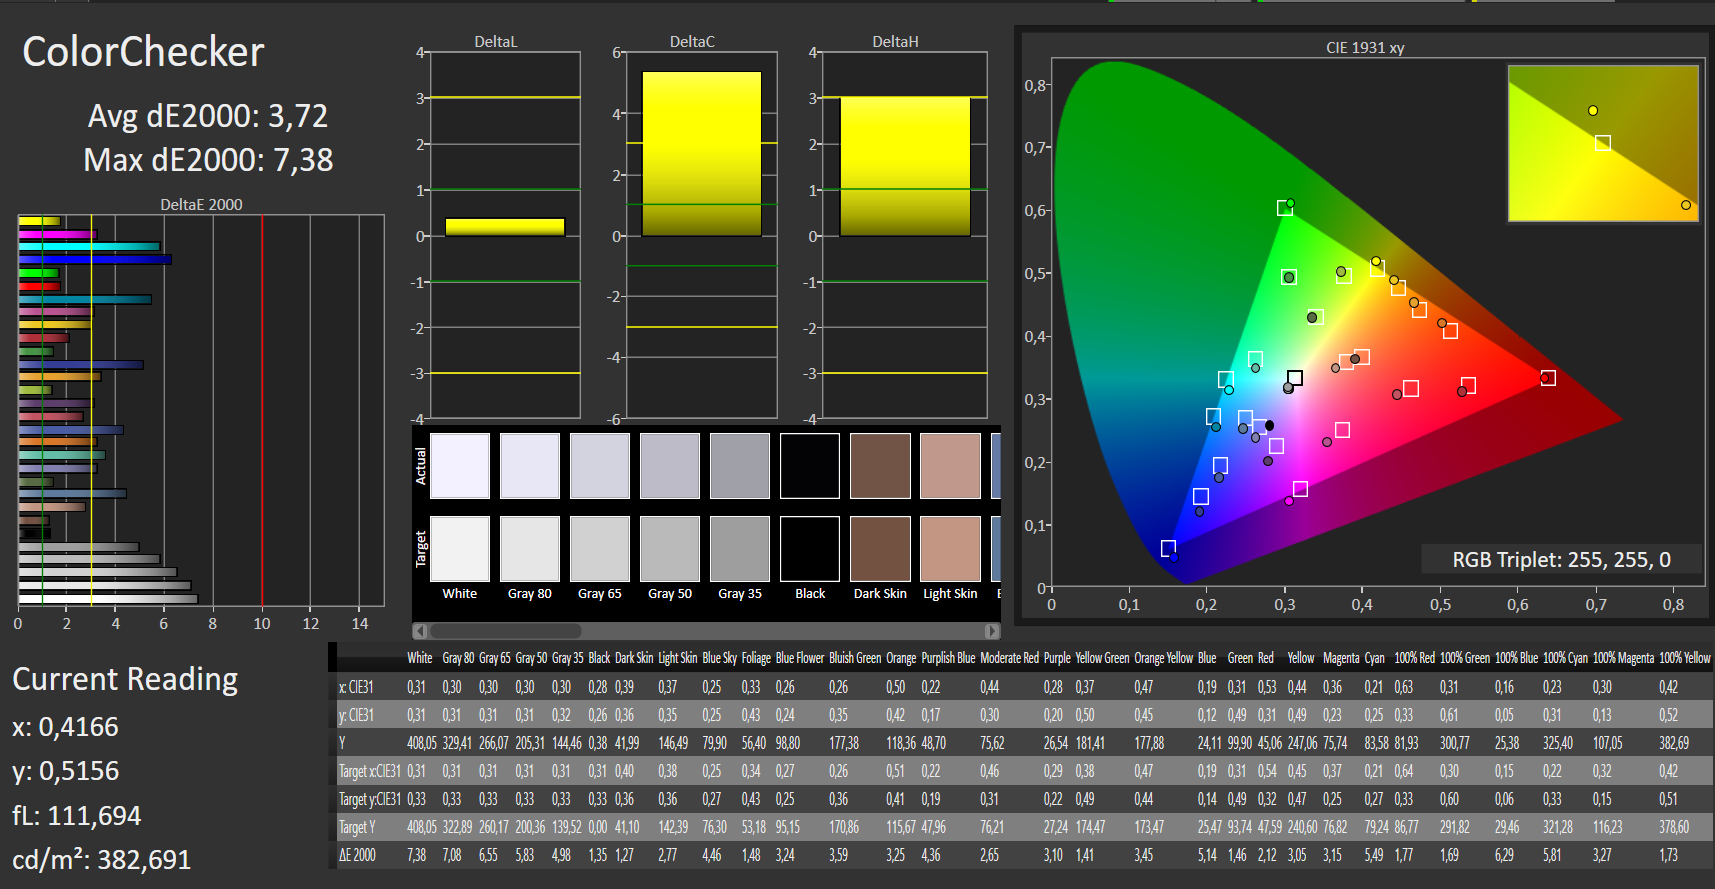
ΔE ColorChecker Calman: 3.72 | ∀{0.5-29.43 Ø4.73}
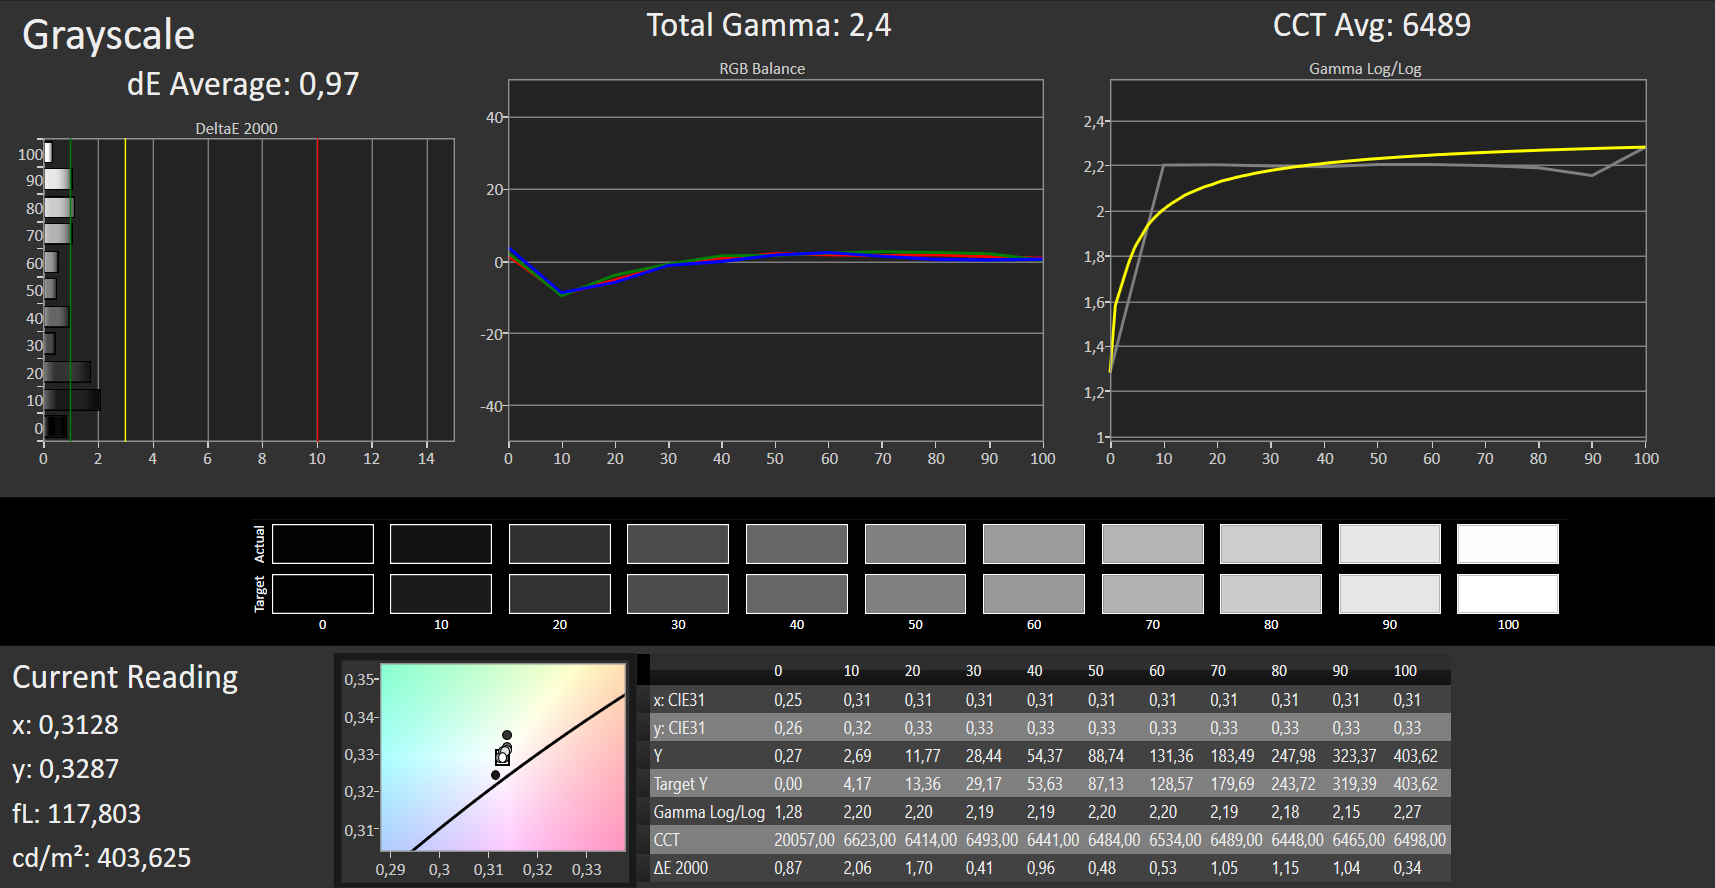
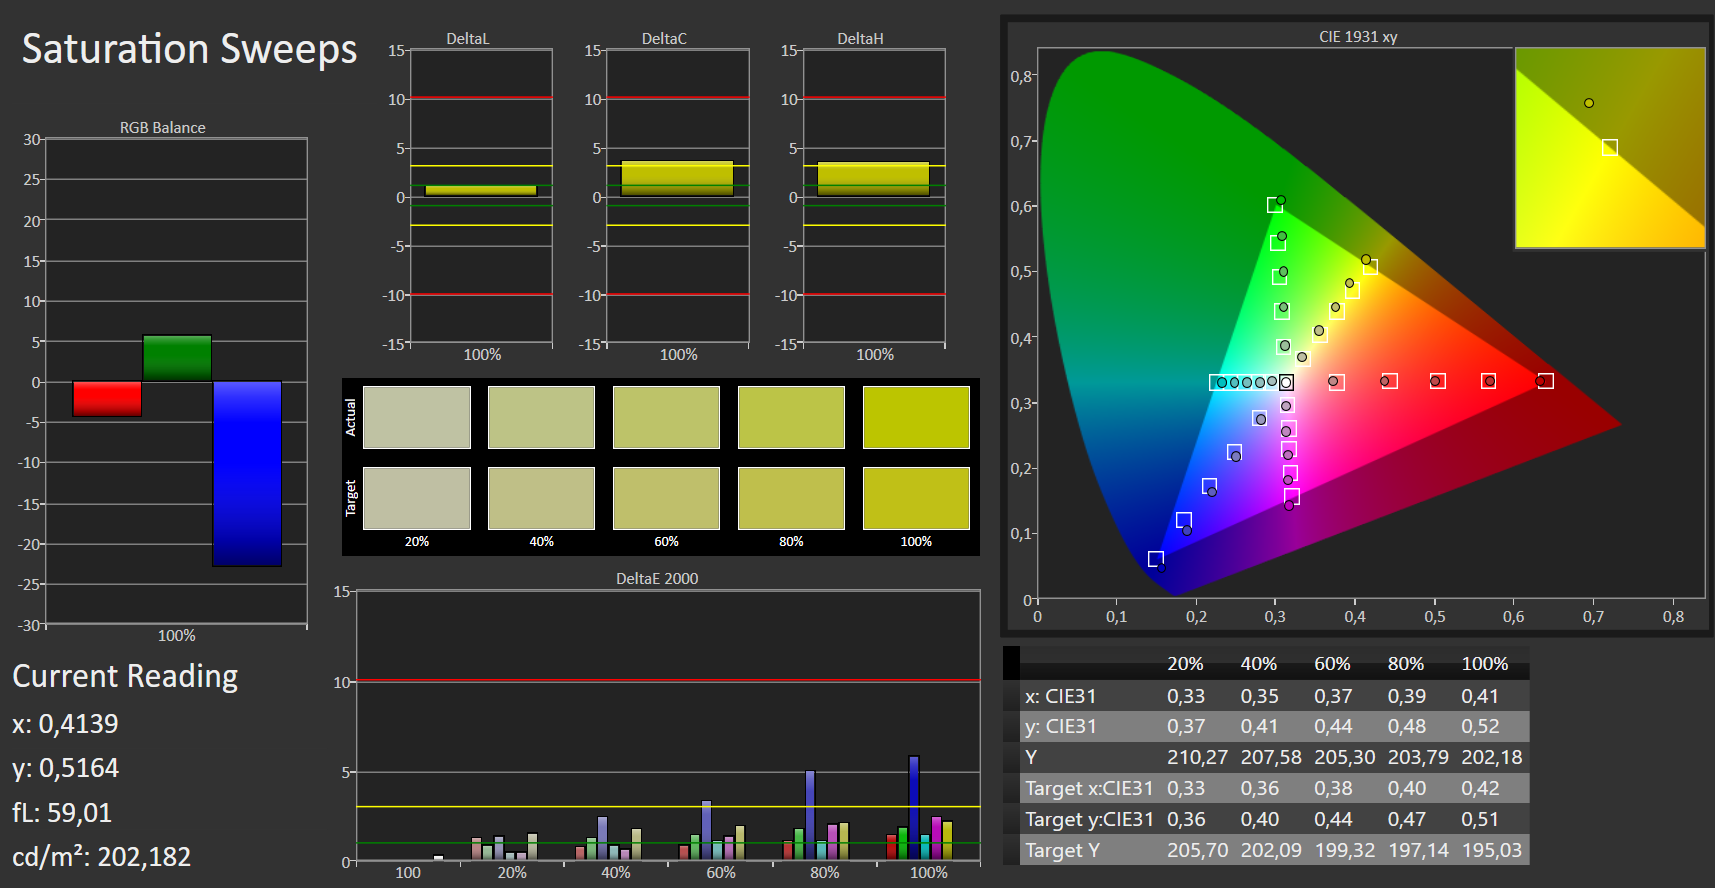
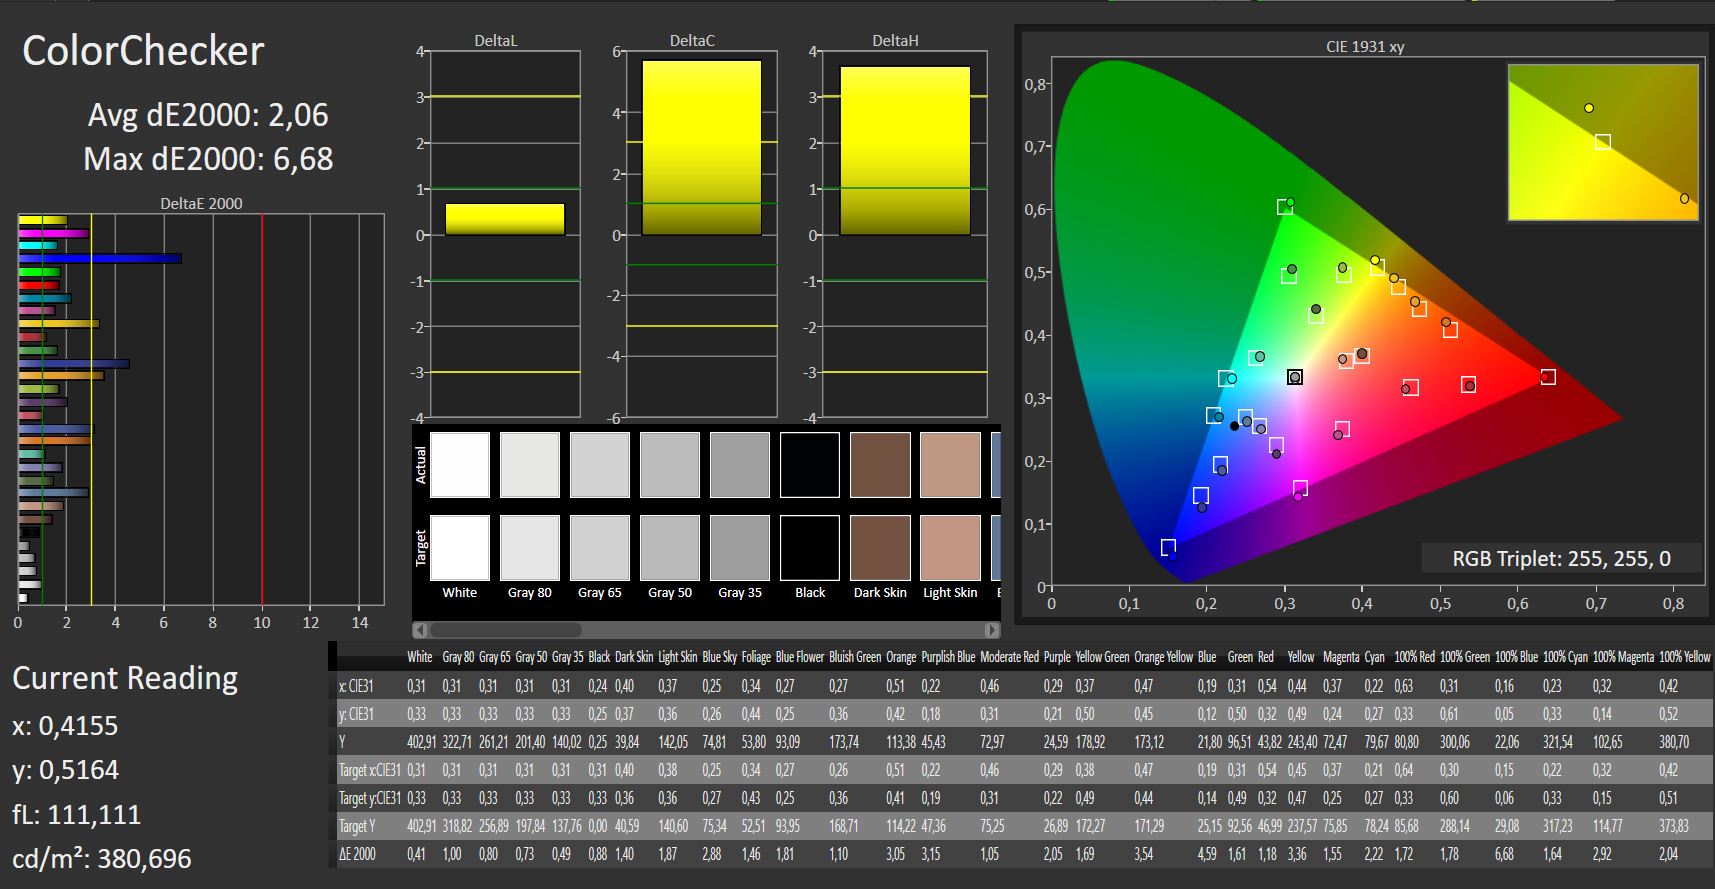
calibrated: 2.06
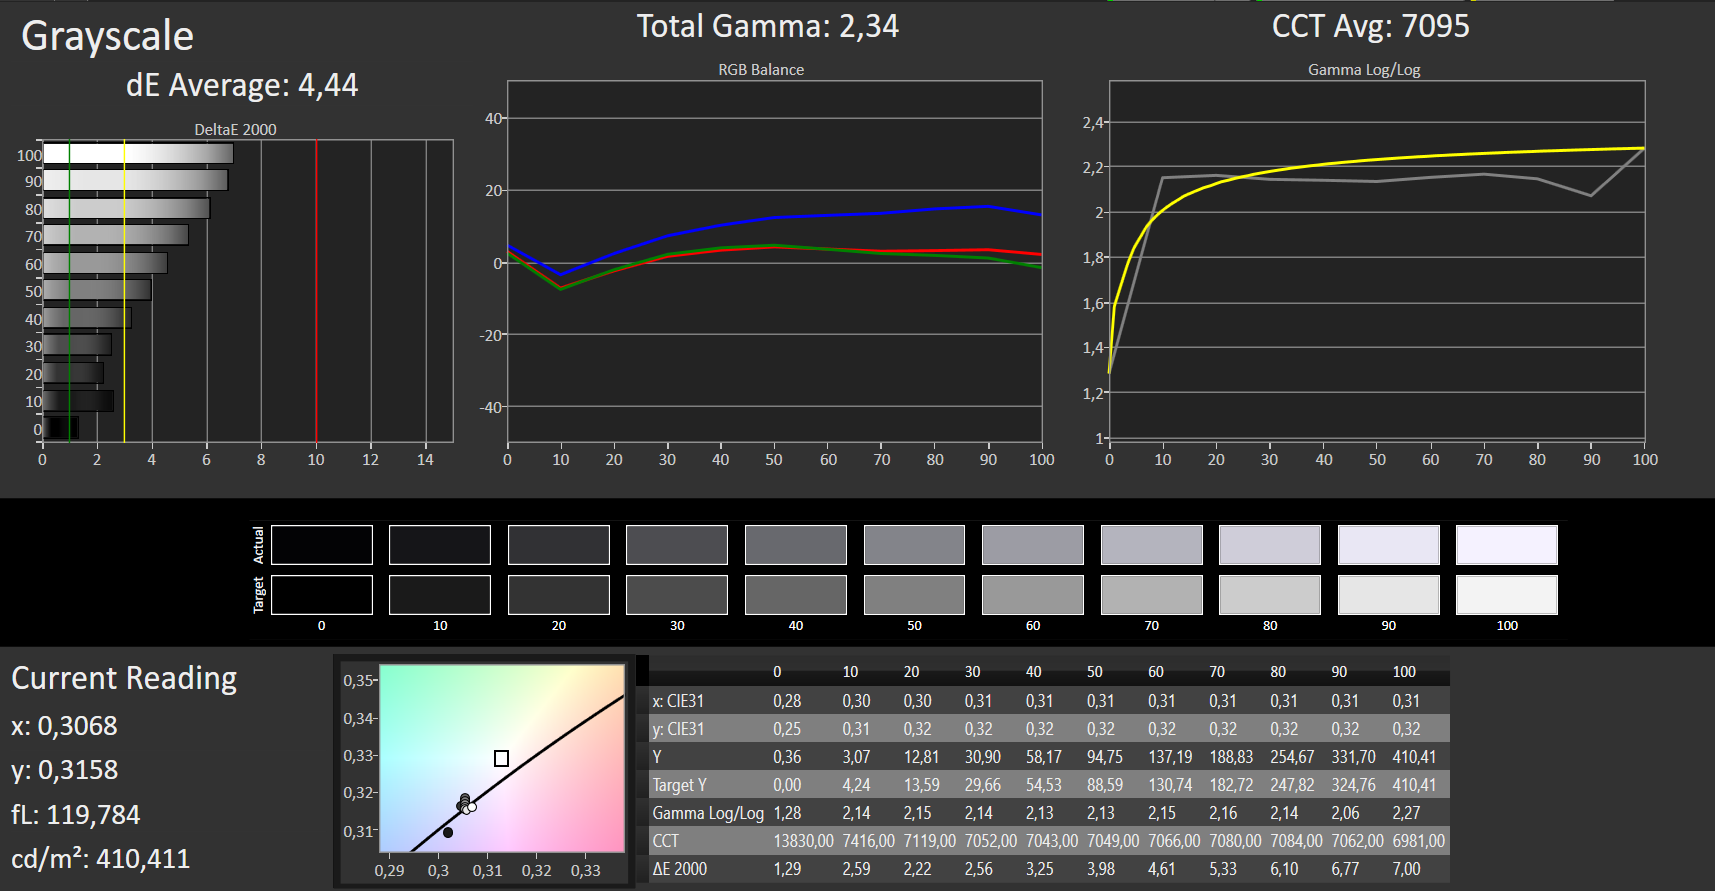
ΔE Greyscale Calman: 4.44 | ∀{0.09-98 Ø4.97}
93% sRGB (Argyll 1.6.3 3D)
60% AdobeRGB 1998 (Argyll 1.6.3 3D)
65.3% AdobeRGB 1998 (Argyll 3D)
93.1% sRGB (Argyll 3D)
64.7% Display P3 (Argyll 3D)
Gamma: 2.34
CCT: 7095 K
| Dell XPS 13 9380 2019 ID: AUO 282B B133ZAN Dell: 90NTH, , 3840x2160, 13.3" | Dell XPS 13 9370 i7 UHD ID: Sharp SHP148B, Name: LQ133D1, Dell P/N: 8XDHY, , 3840x2160, 13.3" | Dell XPS 13 9370 FHD i5 SHP1484, , 1920x1080, 13.3" | Apple MacBook Pro 13 2018 Touchbar i5 APPA03E, , 2560x1600, 13.3" | Lenovo ThinkPad X280-20KES01S00 B125HAN02.2, , 1920x1080, 12.5" | Fujitsu Lifebook U938 Sharp LQ133M1JW28, , 1920x1080, 13.3" | HP EliteBook 830 G5-3JX74EA IVO M133NVF3-R0, , 1920x1080, 13.3" | HP Envy 13-ah0003ng M133NVF3 R0, , 1920x1080, 13.3" | Huawei MateBook 13 i7 Chi Mei CMN8201, , 2160x1440, 13" | |
|---|---|---|---|---|---|---|---|---|---|
| Display | 6% | 6% | 31% | -31% | 4% | -2% | -13% | 5% | |
| Display P3 Coverage (%) | 64.7 | 68.9 6% | 68.9 6% | 98.5 52% | 44 -32% | 67.5 4% | 64.2 -1% | 54.8 -15% | 68.1 5% |
| sRGB Coverage (%) | 93.1 | 98.4 6% | 96.6 4% | 99.9 7% | 64.5 -31% | 94.5 2% | 89.2 -4% | 82.5 -11% | 97.7 5% |
| AdobeRGB 1998 Coverage (%) | 65.3 | 69.5 6% | 69.6 7% | 87.3 34% | 45.45 -30% | 68.7 5% | 65.2 0% | 56.6 -13% | 69.2 6% |
| Response Times | -21% | -18% | 16% | 25% | 23% | 35% | 40% | 19% | |
| Response Time Grey 50% / Grey 80% * (ms) | 58 ? | 69.6 ? -20% | 62.4 ? -8% | 46 ? 21% | 40 ? 31% | 43 ? 26% | 36 ? 38% | 31 ? 47% | 43.2 ? 26% |
| Response Time Black / White * (ms) | 36 ? | 44 ? -22% | 45.6 ? -27% | 32 ? 11% | 29.6 ? 18% | 29 ? 19% | 24.8 ? 31% | 24 ? 33% | 32 ? 11% |
| PWM Frequency (Hz) | 3759 ? | 1008 ? | 118000 ? | 217 ? | 1020 ? | 1000 ? | |||
| Screen | 12% | 10% | 34% | -18% | 6% | -8% | 19% | 5% | |
| Brightness middle (cd/m²) | 404 | 478.5 18% | 428 6% | 519 28% | 344 -15% | 344 -15% | 316 -22% | 289 -28% | 366.6 -9% |
| Brightness (cd/m²) | 389 | 466 20% | 405 4% | 504 30% | 313 -20% | 320 -18% | 326 -16% | 310 -20% | 360 -7% |
| Brightness Distribution (%) | 85 | 86 1% | 87 2% | 95 12% | 82 -4% | 77 -9% | 85 0% | 85 0% | 93 9% |
| Black Level * (cd/m²) | 0.37 | 0.43 -16% | 0.26 30% | 0.33 11% | 0.25 32% | 0.31 16% | 0.19 49% | 0.23 38% | 0.39 -5% |
| Contrast (:1) | 1092 | 1113 2% | 1646 51% | 1573 44% | 1376 26% | 1110 2% | 1663 52% | 1257 15% | 940 -14% |
| Colorchecker dE 2000 * | 3.72 | 3.09 17% | 3.8 -2% | 1.4 62% | 4.7 -26% | 2.72 27% | 4.5 -21% | 1.64 56% | 2.76 26% |
| Colorchecker dE 2000 max. * | 7.38 | 5.94 20% | 7.2 2% | 2.8 62% | 19.4 -163% | 5.92 20% | 12.1 -64% | 3.31 55% | 6.19 16% |
| Colorchecker dE 2000 calibrated * | 2.06 | 2.06 -0% | 2.9 -41% | 0.99 52% | 1.53 26% | ||||
| Greyscale dE 2000 * | 4.44 | 2.4 46% | 4.4 1% | 2.2 50% | 2.2 50% | 2.74 38% | 5 -13% | 1.71 61% | 4.2 5% |
| Gamma | 2.34 94% | 2.063 107% | 2.21 100% | 2.22 99% | 2.16 102% | 2.38 92% | 2.22 99% | 2.32 95% | 2.22 99% |
| CCT | 7095 92% | 6883 94% | 7067 92% | 6908 94% | 6252 104% | 6794 96% | 6018 108% | 6291 103% | 6271 104% |
| Color Space (Percent of AdobeRGB 1998) (%) | 60 | 69.47 16% | 62.8 5% | 77.3 29% | 41.2 -31% | 61 2% | 57.9 -3% | 52 -13% | 63.2 5% |
| Color Space (Percent of sRGB) (%) | 93 | 98.36 6% | 96.4 4% | 99.99 8% | 64.1 -31% | 94 1% | 87.3 -6% | 82 -12% | 97.6 5% |
| Total Average (Program / Settings) | -1% /
7% | -1% /
6% | 27% /
31% | -8% /
-15% | 11% /
8% | 8% /
-1% | 15% /
15% | 10% /
7% |
* ... smaller is better
Display Response Times
| ↔ Response Time Black to White | ||
|---|---|---|
| 36 ms ... rise ↗ and fall ↘ combined | ↗ 20 ms rise | 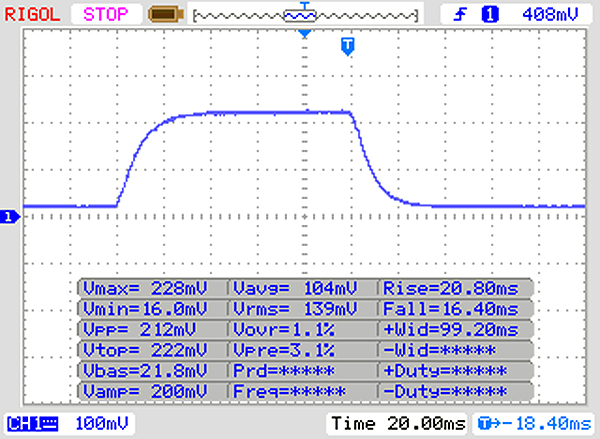 |
| ↘ 16 ms fall | ||
| The screen shows slow response rates in our tests and will be unsatisfactory for gamers. In comparison, all tested devices range from 0.1 (minimum) to 240 (maximum) ms. » 94 % of all devices are better. This means that the measured response time is worse than the average of all tested devices (19.9 ms). | ||
| ↔ Response Time 50% Grey to 80% Grey | ||
| 58 ms ... rise ↗ and fall ↘ combined | ↗ 26 ms rise | 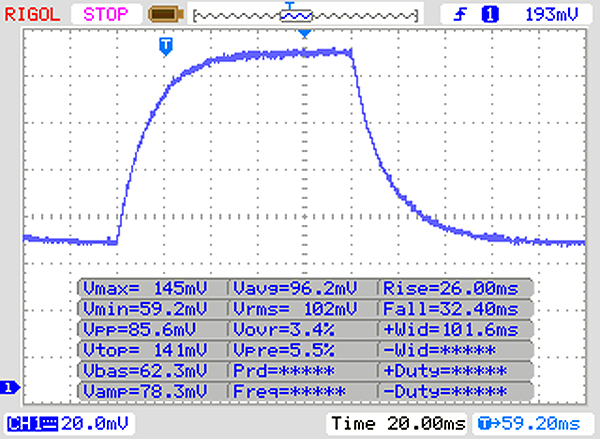 |
| ↘ 32 ms fall | ||
| The screen shows slow response rates in our tests and will be unsatisfactory for gamers. In comparison, all tested devices range from 0.165 (minimum) to 636 (maximum) ms. » 94 % of all devices are better. This means that the measured response time is worse than the average of all tested devices (31.1 ms). | ||
Screen Flickering / PWM (Pulse-Width Modulation)
| Screen flickering / PWM not detected | 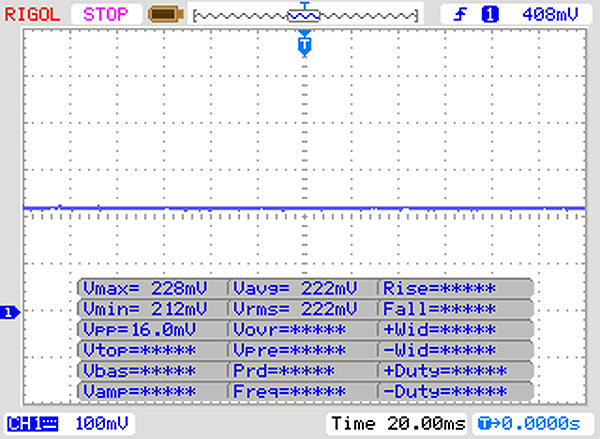 | ||
In comparison: 52 % of all tested devices do not use PWM to dim the display. If PWM was detected, an average of 7801 (minimum: 5 - maximum: 343500) Hz was measured. | |||
| PCMark 8 Home Score Accelerated v2 | 3519 points | |
| PCMark 8 Work Score Accelerated v2 | 4302 points | |
| PCMark 10 Score | 3835 points | |
Help | ||
| Dell XPS 13 9380 2019 SK hynix PC401 HFS256GD9TNG | Dell XPS 13 9370 FHD i5 Toshiba XG5 KXG50ZNV256G | Apple MacBook Pro 13 2018 Touchbar i5 | Lenovo ThinkPad X280-20KES01S00 Samsung SSD PM981 MZVLB512HAJQ | Fujitsu Lifebook U938 Micron 1100 MTFDDAV256TBN | HP EliteBook 830 G5-3JX74EA Samsung SSD PM961 1TB M.2 PCIe 3.0 x4 NVMe (MZVLW1T0) | HP Envy 13-ah0003ng SK Hynix BC501 HFM512GDJTNG | Huawei MateBook 13 i7 Samsung SSD PM981 MZVLB512HAJQ | Average SK hynix PC401 HFS256GD9TNG | |
|---|---|---|---|---|---|---|---|---|---|
| CrystalDiskMark 5.2 / 6 | 47% | 3% | 58% | -32% | 56% | 6% | 100% | 12% | |
| Write 4K (MB/s) | 84.6 | 128.2 52% | 43.24 -49% | 125.3 48% | 80.5 -5% | 108.5 28% | 112.9 33% | 159.4 88% | 101.8 ? 20% |
| Read 4K (MB/s) | 38.52 | 48.09 25% | 14.07 -63% | 43.5 13% | 26.14 -32% | 40.53 5% | 38.69 0% | 47.31 23% | 40.9 ? 6% |
| Write Seq (MB/s) | 557 | 1088 95% | 887 59% | 112 -80% | 396.8 -29% | 1026 84% | 654 17% | 1899 241% | 673 ? 21% |
| Read Seq (MB/s) | 1393 | 1877 35% | 1515 9% | 2273 63% | 473.1 -66% | 2080 49% | 642 -54% | 2173 56% | 1464 ? 5% |
| Write 4K Q32T1 (MB/s) | 339.5 | 367.1 8% | 225.3 -34% | 641 89% | 264.2 -22% | 451 33% | 305.9 -10% | 368.1 8% | 294 ? -13% |
| Read 4K Q32T1 (MB/s) | 255.4 | 411.9 61% | 346.5 36% | 392 53% | 244 -4% | 269.7 6% | 351.6 38% | 526 106% | 302 ? 18% |
| Write Seq Q32T1 (MB/s) | 558 | 1078 93% | 859 54% | 1903 241% | 464.6 -17% | 1770 217% | 869 56% | 1914 243% | 760 ? 36% |
| Read Seq Q32T1 (MB/s) | 2541 | 2771 9% | 2915 15% | 3398 34% | 525 -79% | 3214 26% | 1683 -34% | 3487 37% | 2561 ? 1% |
| AS SSD | 6% | 90% | -41% | 114% | 12% | 119% | -19% | ||
| Seq Read (MB/s) | 2035 | 1442 -29% | 2316 14% | 455.5 -78% | 2423 19% | 494.3 -76% | 1889 -7% | 1882 ? -8% | |
| Seq Write (MB/s) | 658 | 1694 157% | 1385 110% | 364.5 -45% | 1141 73% | 720 9% | 1812 175% | 593 ? -10% | |
| 4K Read (MB/s) | 39.74 | 9.7 -76% | 47.2 19% | 24.41 -39% | 47.17 19% | 38.35 -3% | 55.5 40% | 38.9 ? -2% | |
| 4K Write (MB/s) | 105.7 | 20 -81% | 105.3 0% | 73.8 -30% | 115.6 9% | 98.4 -7% | 118.4 12% | 100.2 ? -5% | |
| 4K-64 Read (MB/s) | 461 | 957 108% | 1218 164% | 235.7 -49% | 1144 148% | 611 33% | 1257 173% | 452 ? -2% | |
| 4K-64 Write (MB/s) | 300.1 | 162 -46% | 1309 336% | 308.8 3% | 1571 423% | 712 137% | 1571 423% | 290 ? -3% | |
| Access Time Read * (ms) | 0.061 | 0.041 33% | 0.099 -62% | 0.04 34% | 0.061 -0% | 0.041 33% | 0.1118 ? -83% | ||
| Access Time Write * (ms) | 0.051 | 0.036 29% | 0.057 -12% | 0.031 39% | 0.037 27% | 0.032 37% | 0.1111 ? -118% | ||
| Score Read (Points) | 704 | 1497 113% | 306 -57% | 1433 104% | 698 -1% | 1502 113% | 679 ? -4% | ||
| Score Write (Points) | 471 | 1553 230% | 419 -11% | 1801 282% | 883 87% | 1871 297% | 450 ? -4% | ||
| Score Total (Points) | 1479 | 3774 155% | 885 -40% | 3910 164% | 1961 33% | 4147 180% | 1423 ? -4% | ||
| Copy ISO MB/s (MB/s) | 893 | 1068 20% | 442.4 -50% | 2452 175% | 860 -4% | 1800 102% | 748 ? -16% | ||
| Copy Program MB/s (MB/s) | 287.9 | 327.5 14% | 163.9 -43% | 421.9 47% | 244 -15% | 385.6 34% | 358 ? 24% | ||
| Copy Game MB/s (MB/s) | 618 | 717 16% | 275.8 -55% | 991 60% | 282 -54% | 982 59% | 423 ? -32% | ||
| Total Average (Program / Settings) | 47% /
47% | 5% /
4% | 74% /
78% | -37% /
-37% | 85% /
93% | 9% /
10% | 110% /
112% | -4% /
-8% |
* ... smaller is better

| 3DMark 11 Performance | 2053 points | |
| 3DMark Cloud Gate Standard Score | 9514 points | |
Help | ||
| Thief - 1024x768 Very Low Preset | |
| Average Intel UHD Graphics 620 (16.3 - 34.3, n=10) | |
| Dell XPS 13 9380 2019 | |
| Rise of the Tomb Raider - 1024x768 Lowest Preset | |
| Apple MacBook Pro 13 2018 Touchbar i5 | |
| HP EliteBook 830 G5-3JX74EA | |
| Dell XPS 13 9370 i7 UHD | |
| Lenovo ThinkPad X280-20KES01S00 | |
| Average Intel UHD Graphics 620 (10.4 - 110.7, n=82) | |
| Dell XPS 13 9380 2019 | |
| Fujitsu Lifebook U938 | |
| F1 2018 - 1280x720 Ultra Low Preset | |
| HP Envy 13-ah0003ng | |
| Apple MacBook Pro 13 2018 Touchbar i5 | |
| Dell XPS 13 9380 2019 | |
| Average Intel UHD Graphics 620 (31 - 35.8, n=5) | |
| Shadow of the Tomb Raider - 1280x720 Lowest Preset | |
| Average of class Subnotebook (41 - 109, n=8, last 2 years) | |
| HP Envy 13-ah0003ng | |
| Apple MacBook Pro 13 2018 Touchbar i5 | |
| Dell XPS 13 9380 2019 | |
| Average Intel UHD Graphics 620 (12 - 21.7, n=13) | |
| FIFA 19 - 1920x1080 High Preset AA:2x MS | |
| Dell XPS 13 9380 2019 | |
| HP Envy 13-ah0003ng | |
| Average Intel UHD Graphics 620 (20.7 - 51, n=2) | |
| Darksiders III - 1280x720 Low | |
| Dell XPS 13 9380 2019 | |
| Average Intel UHD Graphics 620 (16.5 - 30.4, n=4) | |
| low | med. | high | ultra | |
|---|---|---|---|---|
| BioShock Infinite (2013) | 71.3 | 37.4 | 31.2 | 9.8 |
| Thief (2014) | 23.9 | 12.8 | ||
| Rise of the Tomb Raider (2016) | 20.5 | 17.4 | 6.9 | |
| F1 2018 (2018) | 33 | 15 | 14 | |
| Shadow of the Tomb Raider (2018) | 15 | 10 | ||
| FIFA 19 (2018) | 48 | 53.4 | 51 | |
| Darksiders III (2018) | 26.3 | 7.3 |
Noise level
| Idle |
| 30.4 / 30.4 / 30.4 dB(A) |
| Load |
| 31.7 / 38.1 dB(A) |
 | ||
30 dB silent 40 dB(A) audible 50 dB(A) loud |
||
min: | ||
(-) The maximum temperature on the upper side is 47.2 °C / 117 F, compared to the average of 35.9 °C / 97 F, ranging from 21.4 to 59 °C for the class Subnotebook.
(±) The bottom heats up to a maximum of 43.3 °C / 110 F, compared to the average of 39.2 °C / 103 F
(+) In idle usage, the average temperature for the upper side is 26.4 °C / 80 F, compared to the device average of 30.8 °C / 87 F.
(+) The palmrests and touchpad are reaching skin temperature as a maximum (32.4 °C / 90.3 F) and are therefore not hot.
(-) The average temperature of the palmrest area of similar devices was 28.2 °C / 82.8 F (-4.2 °C / -7.5 F).
Dell XPS 13 9380 2019 audio analysis
(-) | not very loud speakers (70 dB)
Bass 100 - 315 Hz
(-) | nearly no bass - on average 20.4% lower than median
(±) | linearity of bass is average (9.4% delta to prev. frequency)
Mids 400 - 2000 Hz
(±) | higher mids - on average 6.9% higher than median
(±) | linearity of mids is average (10.2% delta to prev. frequency)
Highs 2 - 16 kHz
(+) | balanced highs - only 3.6% away from median
(+) | highs are linear (5% delta to prev. frequency)
Overall 100 - 16.000 Hz
(±) | linearity of overall sound is average (26.6% difference to median)
Compared to same class
» 88% of all tested devices in this class were better, 1% similar, 10% worse
» The best had a delta of 5%, average was 18%, worst was 53%
Compared to all devices tested
» 82% of all tested devices were better, 3% similar, 15% worse
» The best had a delta of 4%, average was 24%, worst was 134%
Apple MacBook Pro 13 2018 Touchbar i5 audio analysis
(+) | speakers can play relatively loud (83.4 dB)
Bass 100 - 315 Hz
(±) | reduced bass - on average 6.9% lower than median
(+) | bass is linear (6.7% delta to prev. frequency)
Mids 400 - 2000 Hz
(+) | balanced mids - only 1.9% away from median
(+) | mids are linear (3.8% delta to prev. frequency)
Highs 2 - 16 kHz
(+) | balanced highs - only 3.6% away from median
(+) | highs are linear (6.3% delta to prev. frequency)
Overall 100 - 16.000 Hz
(+) | overall sound is linear (9.5% difference to median)
Compared to same class
» 5% of all tested devices in this class were better, 2% similar, 93% worse
» The best had a delta of 5%, average was 18%, worst was 53%
Compared to all devices tested
» 4% of all tested devices were better, 1% similar, 95% worse
» The best had a delta of 4%, average was 24%, worst was 134%
HP Envy 13-ah0003ng audio analysis
(-) | not very loud speakers (71.9 dB)
Bass 100 - 315 Hz
(-) | nearly no bass - on average 23.3% lower than median
(±) | linearity of bass is average (12.4% delta to prev. frequency)
Mids 400 - 2000 Hz
(+) | balanced mids - only 2.2% away from median
(+) | mids are linear (4.8% delta to prev. frequency)
Highs 2 - 16 kHz
(+) | balanced highs - only 1.3% away from median
(+) | highs are linear (4.4% delta to prev. frequency)
Overall 100 - 16.000 Hz
(±) | linearity of overall sound is average (16.8% difference to median)
Compared to same class
» 43% of all tested devices in this class were better, 7% similar, 49% worse
» The best had a delta of 5%, average was 18%, worst was 53%
Compared to all devices tested
» 29% of all tested devices were better, 8% similar, 63% worse
» The best had a delta of 4%, average was 24%, worst was 134%
| Off / Standby | |
| Idle | |
| Load |
|
Key:
min: | |
| Dell XPS 13 9380 2019 i5-8265U, UHD Graphics 620, SK hynix PC401 HFS256GD9TNG, IPS, 3840x2160, 13.3" | Dell XPS 13 9370 FHD i5 i5-8250U, UHD Graphics 620, Toshiba XG5 KXG50ZNV256G, IPS, 1920x1080, 13.3" | Dell XPS 13 9370 i7 UHD i5-8550U, UHD Graphics 620, Toshiba XG5 KXG50ZNV512G, IPS, 3840x2160, 13.3" | Apple MacBook Pro 13 2018 Touchbar i5 i5-8259U, Iris Plus Graphics 655, , IPS, 2560x1600, 13.3" | Lenovo ThinkPad X280-20KES01S00 i5-8250U, UHD Graphics 620, Samsung SSD PM981 MZVLB512HAJQ, IPS LED, 1920x1080, 12.5" | Fujitsu Lifebook U938 i5-8250U, UHD Graphics 620, Micron 1100 MTFDDAV256TBN, IPS, 1920x1080, 13.3" | HP EliteBook 830 G5-3JX74EA i5-8550U, UHD Graphics 620, Samsung SSD PM961 1TB M.2 PCIe 3.0 x4 NVMe (MZVLW1T0), IPS LED, 1920x1080, 13.3" | HP Envy 13-ah0003ng i5-8550U, GeForce MX150, SK Hynix BC501 HFM512GDJTNG, IPS, 1920x1080, 13.3" | Huawei MateBook 13 i7 i7-8565U, GeForce MX150, Samsung SSD PM981 MZVLB512HAJQ, IPS, 2160x1440, 13" | Average Intel UHD Graphics 620 | Average of class Subnotebook | |
|---|---|---|---|---|---|---|---|---|---|---|---|
| Power Consumption | 22% | -2% | -8% | 15% | 36% | 3% | 4% | -17% | 13% | 5% | |
| Idle Minimum * (Watt) | 4.8 | 3.14 35% | 5 -4% | 2.3 52% | 3.11 35% | 2.4 50% | 4.5 6% | 5.3 -10% | 3.5 27% | 3.81 ? 21% | 3.78 ? 21% |
| Idle Average * (Watt) | 8.6 | 5.22 39% | 8.3 3% | 8.7 -1% | 5.01 42% | 5.5 36% | 6.4 26% | 7.3 15% | 7.5 13% | 6.94 ? 19% | 6.6 ? 23% |
| Idle Maximum * (Watt) | 10.4 | 6 42% | 8.8 15% | 12.2 -17% | 8.11 22% | 6 42% | 9.2 12% | 9.3 11% | 12.4 -19% | 8.75 ? 16% | 7.93 ? 24% |
| Load Average * (Watt) | 37.9 | 38.5 -2% | 46.4 -22% | 53.3 -41% | 44.6 -18% | 31 18% | 35.7 6% | 39 -3% | 64.2 -69% | 35 ? 8% | 41.8 ? -10% |
| Load Maximum * (Watt) | 48.5 | 50.4 -4% | 48.6 -0% | 64 -32% | 51.7 -7% | 32.6 33% | 65.4 -35% | 46 5% | 65.7 -35% | 47.5 ? 2% | 64.7 ? -33% |
| Witcher 3 ultra * (Watt) | 52.5 |
* ... smaller is better
| Dell XPS 13 9380 2019 i5-8265U, UHD Graphics 620, 52 Wh | Dell XPS 13 9370 FHD i5 i5-8250U, UHD Graphics 620, 52 Wh | Apple MacBook Pro 13 2018 Touchbar i5 i5-8259U, Iris Plus Graphics 655, 58 Wh | Lenovo ThinkPad X280-20KES01S00 i5-8250U, UHD Graphics 620, 50 Wh | Fujitsu Lifebook U938 i5-8250U, UHD Graphics 620, 50 Wh | HP EliteBook 830 G5-3JX74EA i5-8550U, UHD Graphics 620, 49 Wh | HP Envy 13-ah0003ng i5-8550U, GeForce MX150, 53.2 Wh | Huawei MateBook 13 i7 i7-8565U, GeForce MX150, 41.7 Wh | Average of class Subnotebook | |
|---|---|---|---|---|---|---|---|---|---|
| Battery runtime | 16% | 17% | 2% | 1% | -15% | -12% | -27% | 37% | |
| Reader / Idle (h) | 17.2 | 23.6 37% | 20.2 17% | 19.5 13% | 12.8 -26% | 15.5 -10% | 15.4 -10% | 27.8 ? 62% | |
| WiFi v1.3 (h) | 8.3 | 10.7 29% | 9.7 17% | 8.9 7% | 8.4 1% | 7.1 -14% | 8 -4% | 7.6 -8% | 14 ? 69% |
| Load (h) | 2.4 | 2 -17% | 2 -17% | 2.1 -12% | 2.3 -4% | 1.9 -21% | 0.9 -62% | 1.942 ? -19% | |
| H.264 (h) | 13.9 | 10.9 | 9.5 | 7.2 | 8 | 6.3 | 15.8 ? | ||
| Witcher 3 ultra (h) | 1.6 |
Pros
Cons
戴尔推出了XPS 13的下一次更新,但这些变化很小,并没有从前一代产品XPS 13 9370(2018)改变太多,但买家肯定有理由从9360(2016)升级过来。9360的Kaby Lake双核CPU明显差于目前的四核CPU。
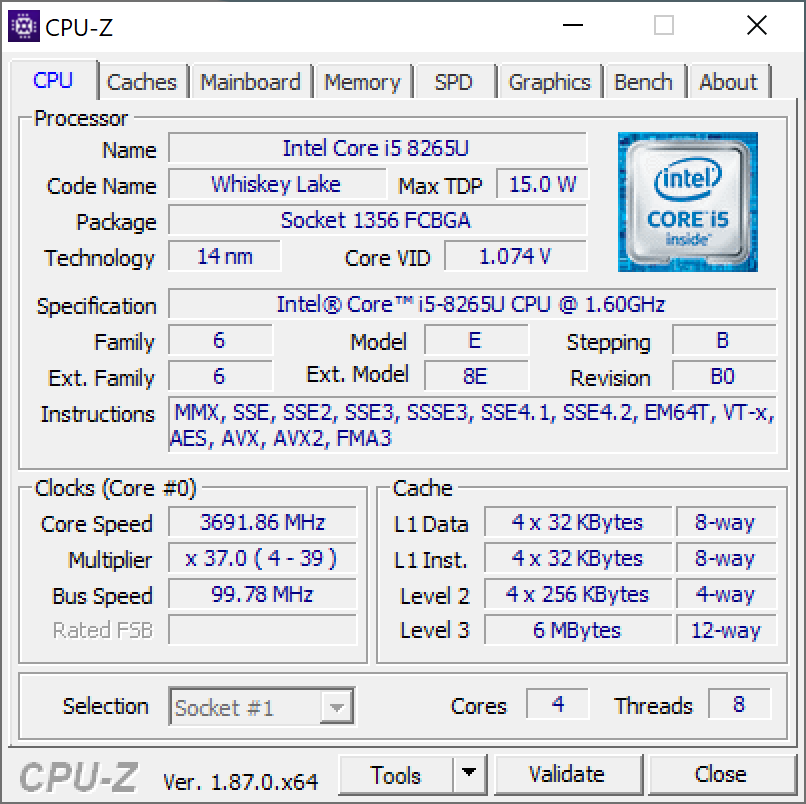
戴尔显然重新设计了温度控制。与2018款的四核处理器相比,性能更好,但仅限于持续的工作负载。许多超极本必须在持续负载下降低CPU速度以降低温度; XPS则可以继续高速运行。 2019款 XPS 13的CPU频率与最大Turbo时钟相比平均只降低了8%,并且比2018款XPS 13 9370中的Kaby Lake-R四核CPU更快。
“2019 XPS 13仅在持续工作负载下将CPU频率降低8%,并且比2018 XPS 13中的Kaby Lake-R四核更快。”
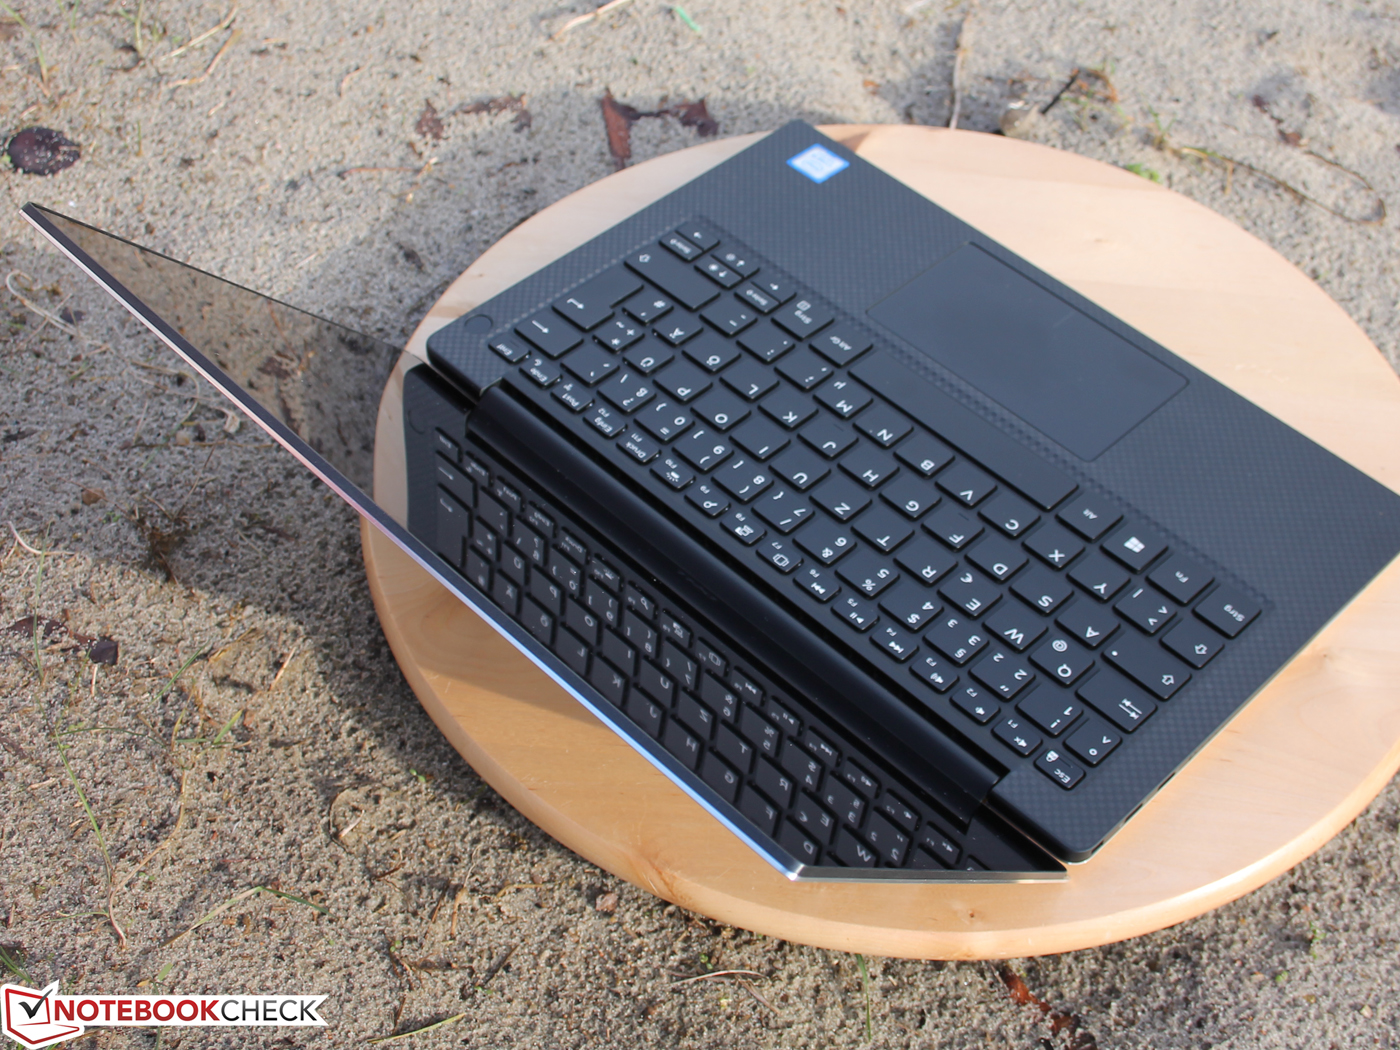
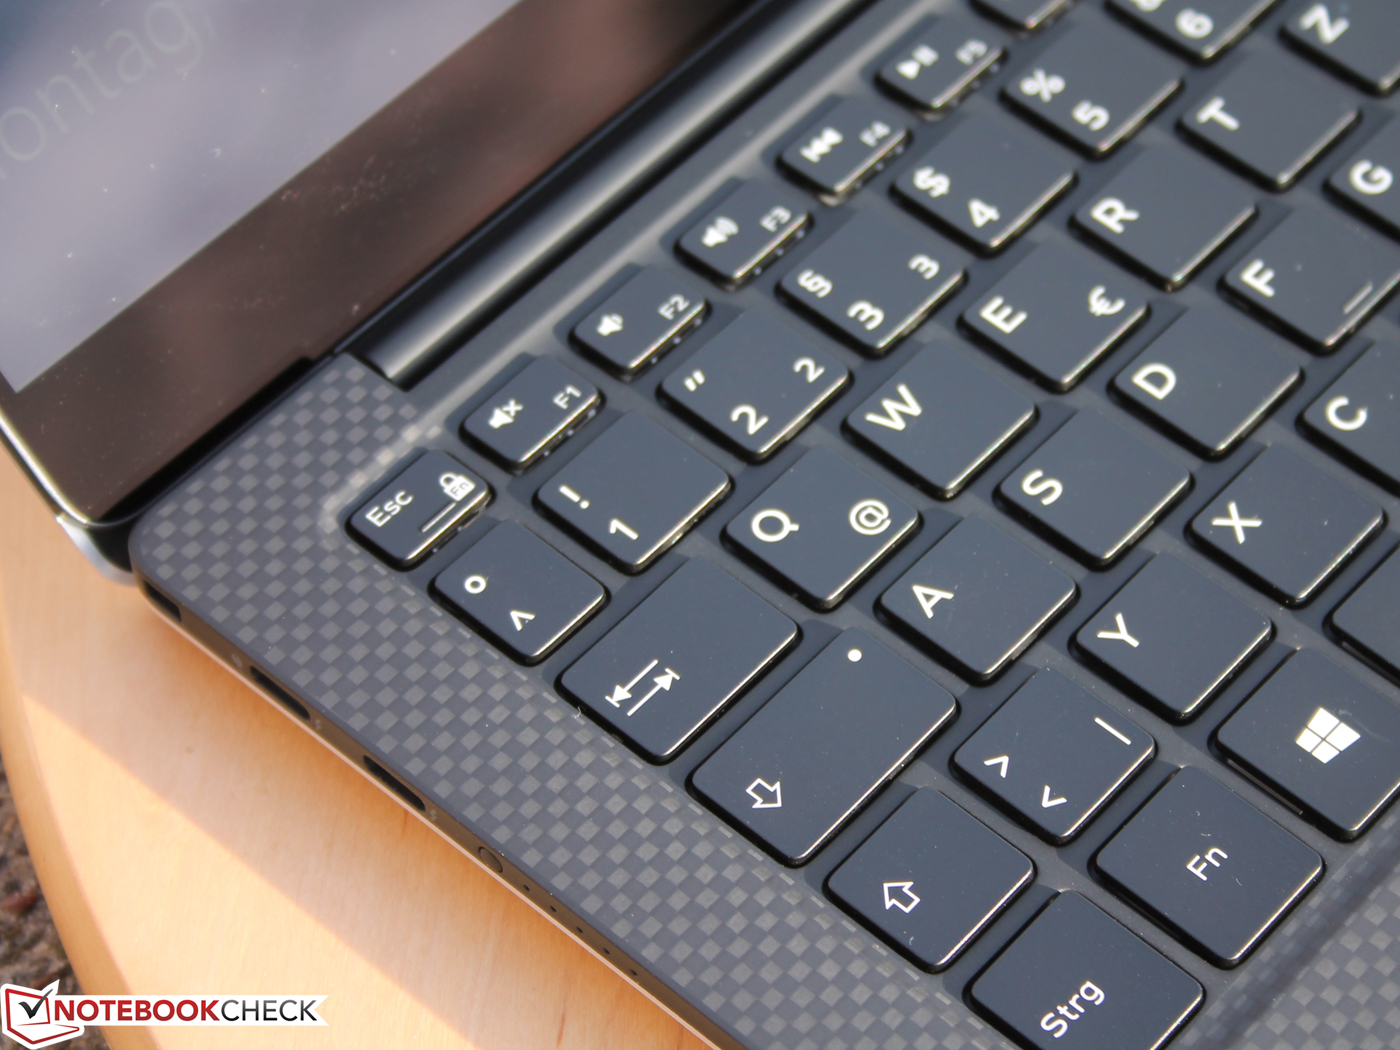
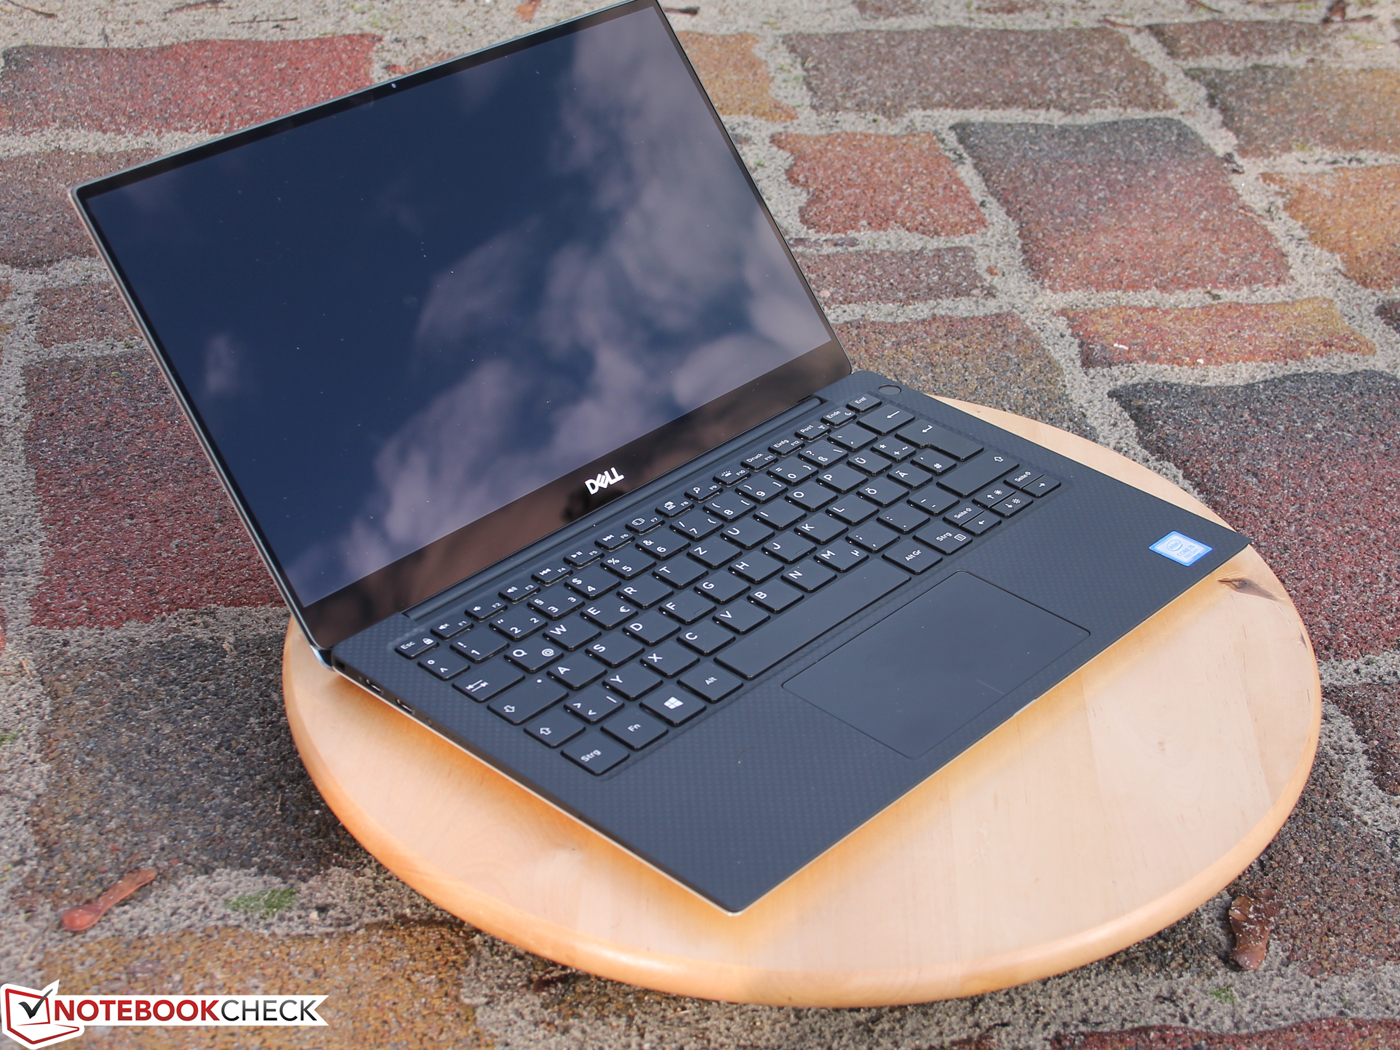
采用纤薄边框的表壳设计仍然非常吸引人。改变的网络摄像头位置(返回顶部)绝对是一个值得欢迎的变化。戴尔现在使用了AUO并非夏普的4K面板。我们认为亮度值仍然相似,但对比度较低,sRGB覆盖范围较小。
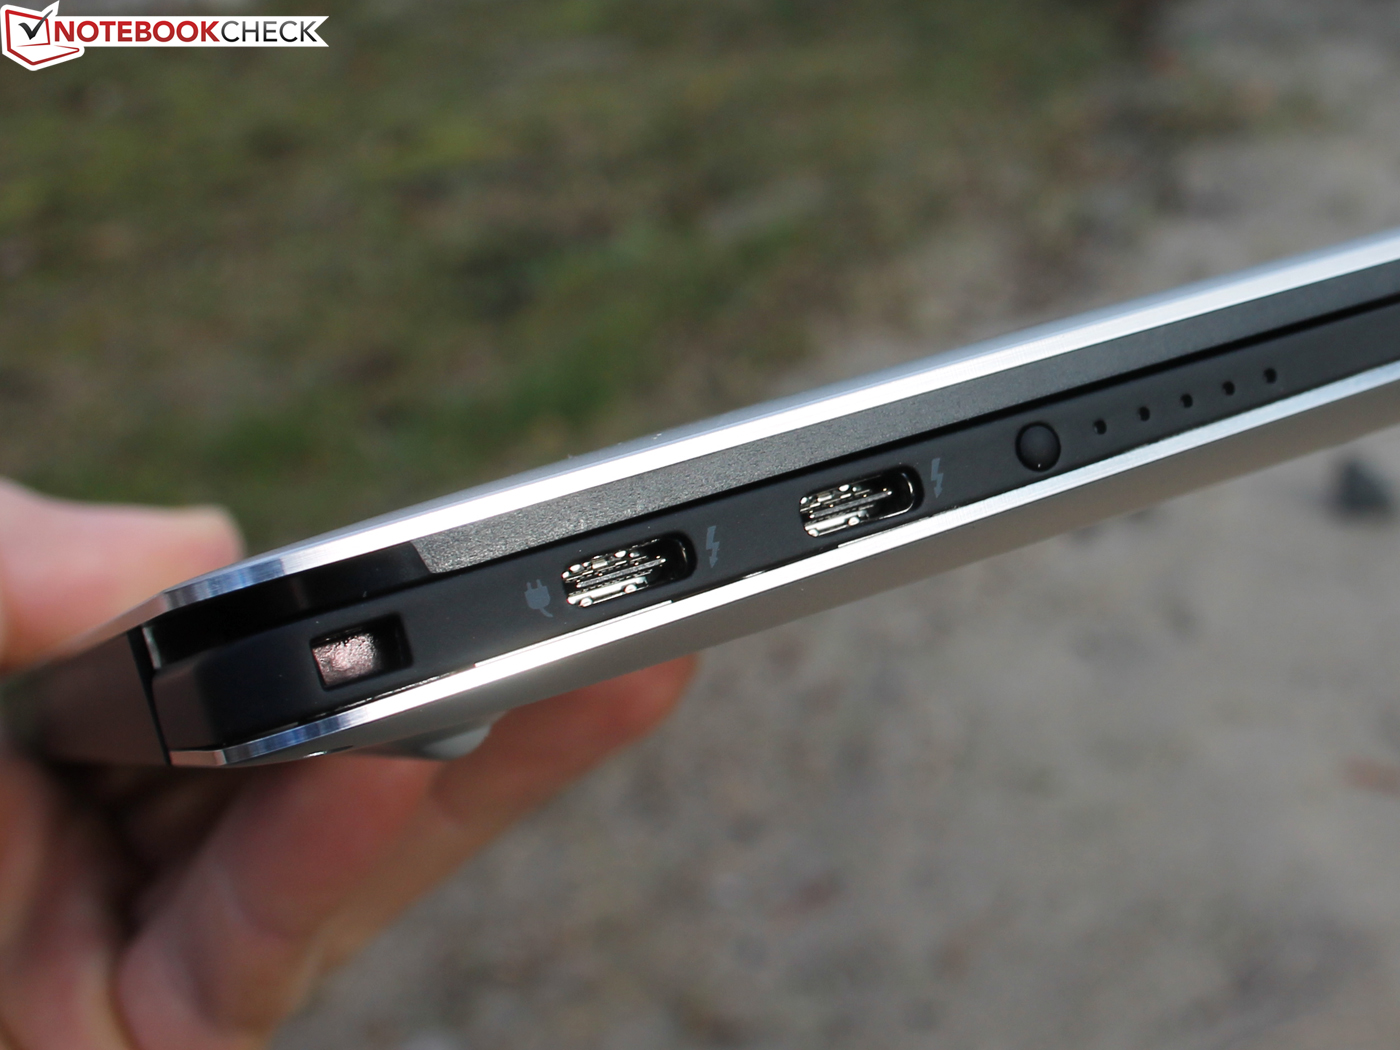
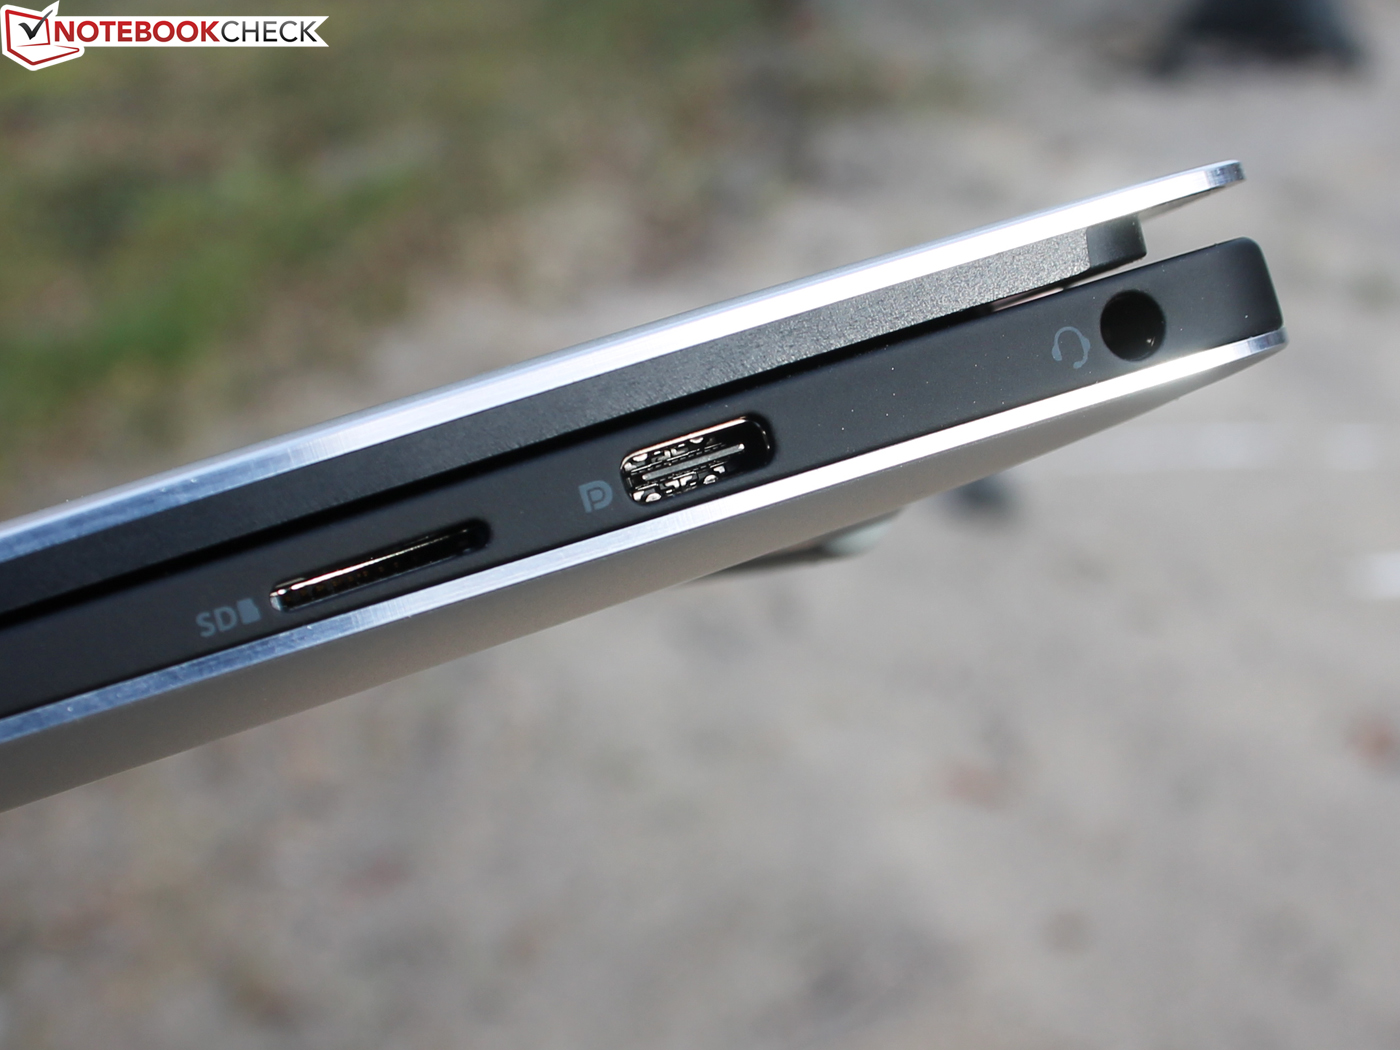
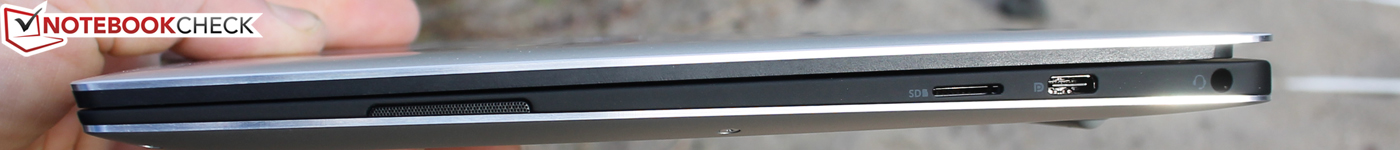
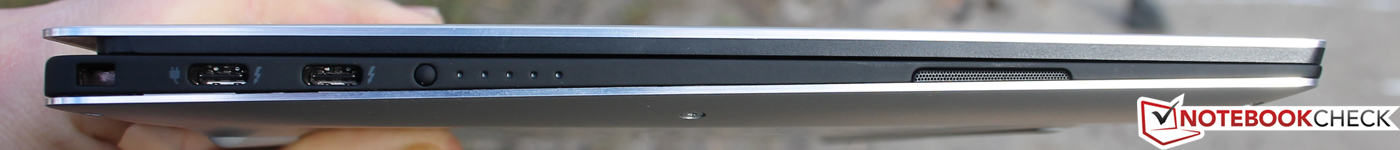
端口保持不变:两个雷电3端口和USB-C端口(带DisplayPort)适用于专业外设。
我们对续航感到满意:8小时的续航与2018 XPS 13 9370 UHD非常相近。我们迫切地希望看到XPS 13 9380的1080p SKU能否续航更长时间。毕竟9370 FHD的续航长达11个小时(Wi-Fi测试,+ 29%)。
任何对XPS 13以及其他流行的13英寸超极本如Spectre 13,Gram 13或ZenBook 13的低GPU性能感到失望的用户都应该看考虑华为MateBook 13 i7和HP Envy 13-ah0003ng配备的GeForce MX150,这比集成的UHD Graphics 620强大得多,也可以运行游戏。
这意味着XPS 13适用于不需要强大的GPU的用户,他们更喜欢完美的输入设备以及大量的接口。我们测试单元的UHD触摸版有着更短的电池运行时间和更低的对比度。如果您希望获得最佳移动性,我们建议购买1080p的SKU。我们也会在不久的将来评测这个版本。
Dell XPS 13 9380 2019
- 02/02/2019 v6 (old)
Sebastian Jentsch
Price comparison

