惠普 Spectre x360 13 (7500U, 4K超高清) 变形本简短评测
| Networking | |
| iperf3 transmit AX12 | |
| Dell XPS 15 9560 (i7-7700HQ, UHD) | |
| Dell XPS 13-9365 2-in-1 | |
| HP Spectre x360 13-ac033dx | |
| iperf3 receive AX12 | |
| Dell XPS 15 9560 (i7-7700HQ, UHD) | |
| HP Spectre x360 13-ac033dx | |
| Dell XPS 13-9365 2-in-1 | |
| |||||||||||||||||||||||||
Brightness Distribution: 83 %
Center on Battery: 302.6 cd/m²
Contrast: 1210:1 (Black: 0.25 cd/m²)
ΔE ColorChecker Calman: 2.4 | ∀{0.5-29.43 Ø4.71}
ΔE Greyscale Calman: 2.8 | ∀{0.09-98 Ø4.96}
97.1% sRGB (Argyll 1.6.3 3D)
65.5% AdobeRGB 1998 (Argyll 1.6.3 3D)
71.1% AdobeRGB 1998 (Argyll 3D)
96.8% sRGB (Argyll 3D)
69.4% Display P3 (Argyll 3D)
Gamma: 2.2
CCT: 6333 K
| HP Spectre x360 13-ac033dx LG Philips LGD054D, IPS, 13.3", 3840x2160 | Apple MacBook Pro 13 2016 (2.9 GHz) APPA033, , 13.3", 2560x1600 | Dell XPS 13-9365 2-in-1 IPS, 13.3", 1920x1080 | Lenovo Yoga 910-13IKB-80VF004CGE AU Optronics AUO323D / B139HAN03.2, IPS, 13.9", 3840x2160 | HP Spectre 13-v131ng CMN1374, IPS UWVA, 13.3", 1920x1080 | HP Spectre x360 13-w023dx Chi Mei CMN1367, IPS, 13.3", 1920x1080 | |
|---|---|---|---|---|---|---|
| Display | 23% | -30% | -9% | -8% | -7% | |
| Display P3 Coverage (%) | 69.4 | 99.2 43% | 47.32 -32% | 62.2 -10% | 64.6 -7% | 65.4 -6% |
| sRGB Coverage (%) | 96.8 | 99.9 3% | 71.1 -27% | 90.1 -7% | 88.8 -8% | 90.4 -7% |
| AdobeRGB 1998 Coverage (%) | 71.1 | 87.6 23% | 48.83 -31% | 63.5 -11% | 64.8 -9% | 65.8 -7% |
| Response Times | -39% | -8% | 8% | -7% | 17% | |
| Response Time Grey 50% / Grey 80% * (ms) | 42 ? | 47.2 ? -12% | 48 ? -14% | 46 ? -10% | 46 ? -10% | 33.2 ? 21% |
| Response Time Black / White * (ms) | 32 ? | 53 ? -66% | 32.8 ? -2% | 24 ? 25% | 33 ? -3% | 28 ? 12% |
| PWM Frequency (Hz) | 1042 ? | |||||
| Screen | 19% | -50% | -58% | -33% | -52% | |
| Brightness middle (cd/m²) | 302.6 | 569 88% | 322.6 7% | 348 15% | 404 34% | 334.6 11% |
| Brightness (cd/m²) | 282 | 542 92% | 306 9% | 310 10% | 382 35% | 319 13% |
| Brightness Distribution (%) | 83 | 90 8% | 91 10% | 80 -4% | 91 10% | 90 8% |
| Black Level * (cd/m²) | 0.25 | 0.56 -124% | 0.19 24% | 0.25 -0% | 0.35 -40% | 0.336 -34% |
| Contrast (:1) | 1210 | 1016 -16% | 1698 40% | 1392 15% | 1154 -5% | 996 -18% |
| Colorchecker dE 2000 * | 2.4 | 1.4 42% | 7.7 -221% | 7.86 -228% | 5.37 -124% | 6.21 -159% |
| Colorchecker dE 2000 max. * | 4.9 | 2.9 41% | 11.1 -127% | 13.43 -174% | 9.46 -93% | 12 -145% |
| Greyscale dE 2000 * | 2.8 | 1.8 36% | 7.9 -182% | 8.25 -195% | 6.44 -130% | 7.71 -175% |
| Gamma | 2.2 100% | 2.16 102% | 2.88 76% | 2.05 107% | 2.52 87% | 2.36 93% |
| CCT | 6333 103% | 6877 95% | 7044 92% | 6834 95% | 6738 96% | 6458 101% |
| Color Space (Percent of AdobeRGB 1998) (%) | 65.5 | 78.4 20% | 44.1 -33% | 58 -11% | 58 -11% | 58.6 -11% |
| Color Space (Percent of sRGB) (%) | 97.1 | 99.3 2% | 69.9 -28% | 90 -7% | 89 -8% | 90 -7% |
| Total Average (Program / Settings) | 1% /
12% | -29% /
-40% | -20% /
-39% | -16% /
-25% | -14% /
-34% |
* ... smaller is better
Display Response Times
| ↔ Response Time Black to White | ||
|---|---|---|
| 32 ms ... rise ↗ and fall ↘ combined | ↗ 18 ms rise | 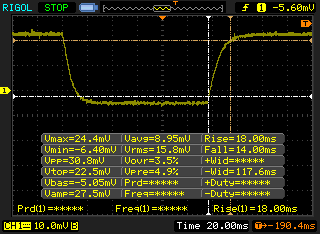 |
| ↘ 14 ms fall | ||
| The screen shows slow response rates in our tests and will be unsatisfactory for gamers. In comparison, all tested devices range from 0.1 (minimum) to 240 (maximum) ms. » 86 % of all devices are better. This means that the measured response time is worse than the average of all tested devices (19.8 ms). | ||
| ↔ Response Time 50% Grey to 80% Grey | ||
| 42 ms ... rise ↗ and fall ↘ combined | ↗ 20.8 ms rise | 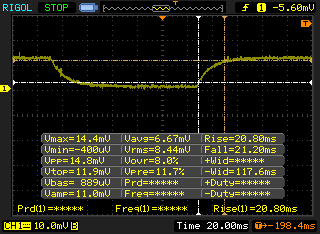 |
| ↘ 21.2 ms fall | ||
| The screen shows slow response rates in our tests and will be unsatisfactory for gamers. In comparison, all tested devices range from 0.165 (minimum) to 636 (maximum) ms. » 67 % of all devices are better. This means that the measured response time is worse than the average of all tested devices (30.9 ms). | ||
Screen Flickering / PWM (Pulse-Width Modulation)
| Screen flickering / PWM not detected | 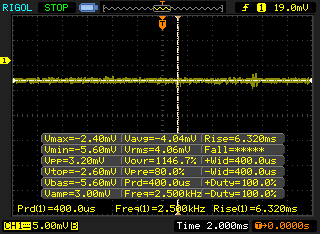 | ||
In comparison: 52 % of all tested devices do not use PWM to dim the display. If PWM was detected, an average of 7748 (minimum: 5 - maximum: 343500) Hz was measured. | |||
| wPrime 2.10 - 1024m | |
| Dell XPS 13-9365 2-in-1 | |
| Dell XPS 13 9360-4764 | |
| Dell Latitude 7280 | |
| HP Spectre x360 13-ac033dx | |
* ... smaller is better
| PCMark 8 | |
| Home Score Accelerated v2 | |
| HP Spectre 13-v131ng | |
| Apple MacBook Air 13 inch 2015-03 | |
| Lenovo Yoga 910-13IKB-80VF004CGE | |
| Dell XPS 13-9365 2-in-1 | |
| HP Spectre x360 13-ac033dx | |
| Work Score Accelerated v2 | |
| HP Spectre 13-v131ng | |
| Dell XPS 13-9365 2-in-1 | |
| Apple MacBook Air 13 inch 2015-03 | |
| HP Spectre x360 13-ac033dx | |
| Creative Score Accelerated v2 | |
| HP Spectre 13-v131ng | |
| Apple MacBook Air 13 inch 2015-03 | |
| HP Spectre x360 13-ac033dx | |
| Dell XPS 13-9365 2-in-1 | |
| PCMark 8 Home Score Accelerated v2 | 3023 points | |
| PCMark 8 Creative Score Accelerated v2 | 4432 points | |
| PCMark 8 Work Score Accelerated v2 | 3706 points | |
Help | ||
| HP Spectre x360 13-ac033dx Samsung PM961 NVMe MZVLW512HMJP | Apple MacBook Air 13 inch 2015-03 Apple SSD SD0256F | Dell XPS 13-9365 2-in-1 Toshiba NVMe THNSN5256GPUK | Lenovo Yoga 910-13IKB-80VF004CGE Samsung PM951 NVMe MZVLV512 | HP Spectre 13-v131ng Samsung PM961 NVMe MZVLW512HMJP | |
|---|---|---|---|---|---|
| CrystalDiskMark 3.0 | -25% | -27% | -6% | -4% | |
| Read Seq (MB/s) | 2065 | 1352 -35% | 1206 -42% | 1412 -32% | 1090 -47% |
| Write Seq (MB/s) | 1550 | 1111 -28% | 629 -59% | 578 -63% | 1088 -30% |
| Read 512 (MB/s) | 865 | 880 2% | 966 12% | 701 -19% | 753 -13% |
| Write 512 (MB/s) | 1229 | 1023 -17% | 410.7 -67% | 580 -53% | 911 -26% |
| Read 4k (MB/s) | 54.7 | 21.93 -60% | 32.93 -40% | 43.5 -20% | 57.5 5% |
| Write 4k (MB/s) | 139.4 | 30.94 -78% | 121.2 -13% | 159.7 15% | 140.2 1% |
| Read 4k QD32 (MB/s) | 518 | 339.5 -34% | 411 -21% | 570 10% | 497.1 -4% |
| Write 4k QD32 (MB/s) | 225.6 | 342.9 52% | 250.2 11% | 488.7 117% | 416 84% |

| 3DMark | |
| 1280x720 Cloud Gate Standard Graphics | |
| Apple MacBook Pro 13 2016 (2.9 GHz) | |
| Lenovo ThinkPad X1 Carbon 2017-20HQS03P00 | |
| Dell XPS 13-9365 2-in-1 | |
| Asus X302UV-FN016T | |
| HP Spectre x360 13-ac033dx | |
| HP EliteBook 820 G4 Z2V72ET | |
| Lenovo ThinkPad Yoga 370-20JJS00100 | |
| Acer TravelMate P249-M-5452 | |
| 1920x1080 Fire Strike Graphics | |
| Apple MacBook Pro 13 2016 (2.9 GHz) | |
| Asus X302UV-FN016T | |
| Lenovo ThinkPad X1 Carbon 2017-20HQS03P00 | |
| HP Spectre x360 13-ac033dx | |
| Dell XPS 13-9365 2-in-1 | |
| HP EliteBook 820 G4 Z2V72ET | |
| Lenovo ThinkPad Yoga 370-20JJS00100 | |
| Acer TravelMate P249-M-5452 | |
| 1920x1080 Ice Storm Extreme Graphics | |
| Asus X302UV-FN016T | |
| Dell XPS 13-9365 2-in-1 | |
| HP EliteBook 820 G4 Z2V72ET | |
| HP Spectre x360 13-ac033dx | |
| Acer TravelMate P249-M-5452 | |
| Lenovo ThinkPad Yoga 370-20JJS00100 | |
| 3DMark 11 Performance | 1735 points | |
| 3DMark Ice Storm Standard Score | 51912 points | |
| 3DMark Cloud Gate Standard Score | 6054 points | |
| 3DMark Fire Strike Score | 940 points | |
| 3DMark Fire Strike Extreme Score | 434 points | |
Help | ||
Noise level
| Idle |
| 28.7 / 34.2 / 35.8 dB(A) |
| Load |
| 35.8 / 39.6 dB(A) |
 | ||
30 dB silent 40 dB(A) audible 50 dB(A) loud |
||
min: | ||
| HP Spectre x360 13-ac033dx HD Graphics 620, i7-7500U, Samsung PM961 NVMe MZVLW512HMJP | Apple MacBook Pro 13 2016 (2.9 GHz) Iris Graphics 550, 6267U, Apple SSD AP0256 | Dell XPS 13-9365 2-in-1 HD Graphics 615, i7-7Y75, Toshiba NVMe THNSN5256GPUK | Lenovo Yoga 910-13IKB-80VF004CGE HD Graphics 620, i7-7500U, Samsung PM951 NVMe MZVLV512 | HP Spectre 13-v131ng HD Graphics 620, i7-7500U, Samsung PM961 NVMe MZVLW512HMJP | |
|---|---|---|---|---|---|
| Noise | 6% | 1% | 0% | ||
| off / environment * (dB) | 28.7 | 30.2 -5% | 31.7 -10% | 30.4 -6% | |
| Idle Minimum * (dB) | 28.7 | 30.2 -5% | 31.7 -10% | 30.4 -6% | |
| Idle Average * (dB) | 34.2 | 30.2 12% | 31.7 7% | 30.4 11% | |
| Idle Maximum * (dB) | 35.8 | 30.2 16% | 31.7 11% | 30.4 15% | |
| Load Average * (dB) | 35.8 | 33 8% | 38.4 -7% | 40 -12% | |
| Load Maximum * (dB) | 39.6 | 36.2 9% | 34.7 12% | 40 -1% |
* ... smaller is better
(-) The maximum temperature on the upper side is 48 °C / 118 F, compared to the average of 35.4 °C / 96 F, ranging from 19.6 to 60 °C for the class Convertible.
(-) The bottom heats up to a maximum of 45.4 °C / 114 F, compared to the average of 36.9 °C / 98 F
(+) In idle usage, the average temperature for the upper side is 23.7 °C / 75 F, compared to the device average of 30.3 °C / 87 F.
(+) The palmrests and touchpad are cooler than skin temperature with a maximum of 31.6 °C / 88.9 F and are therefore cool to the touch.
(-) The average temperature of the palmrest area of similar devices was 28 °C / 82.4 F (-3.6 °C / -6.5 F).
HP Spectre x360 13-ac033dx audio analysis
(-) | not very loud speakers (67.1 dB)
Bass 100 - 315 Hz
(-) | nearly no bass - on average 16.9% lower than median
(-) | bass is not linear (15.8% delta to prev. frequency)
Mids 400 - 2000 Hz
(+) | balanced mids - only 3% away from median
(+) | mids are linear (6.9% delta to prev. frequency)
Highs 2 - 16 kHz
(+) | balanced highs - only 3% away from median
(±) | linearity of highs is average (9.5% delta to prev. frequency)
Overall 100 - 16.000 Hz
(±) | linearity of overall sound is average (23.4% difference to median)
Compared to same class
» 71% of all tested devices in this class were better, 5% similar, 25% worse
» The best had a delta of 6%, average was 20%, worst was 57%
Compared to all devices tested
» 70% of all tested devices were better, 6% similar, 24% worse
» The best had a delta of 4%, average was 23%, worst was 134%
Apple MacBook 12 (Early 2016) 1.1 GHz audio analysis
(+) | speakers can play relatively loud (83.6 dB)
Bass 100 - 315 Hz
(±) | reduced bass - on average 11.3% lower than median
(±) | linearity of bass is average (14.2% delta to prev. frequency)
Mids 400 - 2000 Hz
(+) | balanced mids - only 2.4% away from median
(+) | mids are linear (5.5% delta to prev. frequency)
Highs 2 - 16 kHz
(+) | balanced highs - only 2% away from median
(+) | highs are linear (4.5% delta to prev. frequency)
Overall 100 - 16.000 Hz
(+) | overall sound is linear (10.2% difference to median)
Compared to same class
» 7% of all tested devices in this class were better, 2% similar, 90% worse
» The best had a delta of 5%, average was 18%, worst was 53%
Compared to all devices tested
» 5% of all tested devices were better, 1% similar, 94% worse
» The best had a delta of 4%, average was 23%, worst was 134%
| Off / Standby | |
| Idle | |
| Load |
|
Key:
min: | |
| HP Spectre x360 13-ac033dx i7-7500U, HD Graphics 620, Samsung PM961 NVMe MZVLW512HMJP, IPS, 3840x2160, 13.3" | Apple MacBook Pro 13 2016 (2.9 GHz) 6267U, Iris Graphics 550, Apple SSD AP0256, , 2560x1600, 13.3" | Dell XPS 13-9365 2-in-1 i7-7Y75, HD Graphics 615, Toshiba NVMe THNSN5256GPUK, IPS, 1920x1080, 13.3" | Lenovo Yoga 910-13IKB-80VF004CGE i7-7500U, HD Graphics 620, Samsung PM951 NVMe MZVLV512, IPS, 3840x2160, 13.9" | HP Spectre 13-v131ng i7-7500U, HD Graphics 620, Samsung PM961 NVMe MZVLW512HMJP, IPS UWVA, 1920x1080, 13.3" | HP Spectre x360 13-w023dx i7-7500U, HD Graphics 620, Samsung PM951 NVMe MZVLV512, IPS, 1920x1080, 13.3" | |
|---|---|---|---|---|---|---|
| Power Consumption | -7% | 42% | 17% | 15% | 12% | |
| Idle Minimum * (Watt) | 5.3 | 2.1 60% | 3.1 42% | 4.3 19% | 3.6 32% | 5.5 -4% |
| Idle Average * (Watt) | 9.6 | 7.6 21% | 4.3 55% | 6.3 34% | 6.4 33% | 6.7 30% |
| Idle Maximum * (Watt) | 10.1 | 8.2 19% | 4.9 51% | 9 11% | 9.2 9% | 7.1 30% |
| Load Average * (Watt) | 34.4 | 56.4 -64% | 24.3 29% | 32.7 5% | 34 1% | 33.1 4% |
| Load Maximum * (Watt) | 34.8 | 59.8 -72% | 22.8 34% | 28.8 17% | 34.4 1% | 35.2 -1% |
* ... smaller is better
| HP Spectre x360 13-ac033dx i7-7500U, HD Graphics 620, 57.8 Wh | Apple MacBook Pro 13 2016 (2.9 GHz) 6267U, Iris Graphics 550, 49.2 Wh | Dell XPS 13-9365 2-in-1 i7-7Y75, HD Graphics 615, 46 Wh | Lenovo Yoga 910-13IKB-80VF004CGE i7-7500U, HD Graphics 620, 78 Wh | HP Spectre 13-v131ng i7-7500U, HD Graphics 620, 38 Wh | HP Spectre x360 13-w023dx i7-7500U, HD Graphics 620, 57.8 Wh | |
|---|---|---|---|---|---|---|
| Battery runtime | -19% | 34% | 36% | -23% | 21% | |
| Reader / Idle (h) | 13.2 | 16.2 23% | 17.8 35% | 12 -9% | 20.6 56% | |
| WiFi v1.3 (h) | 9 | 9.4 4% | 11.4 27% | 10.7 19% | 6.6 -27% | 9.3 3% |
| Load (h) | 1.9 | 1.1 -42% | 2.9 53% | 2.9 53% | 1.3 -32% | 2 5% |
Pros
Cons
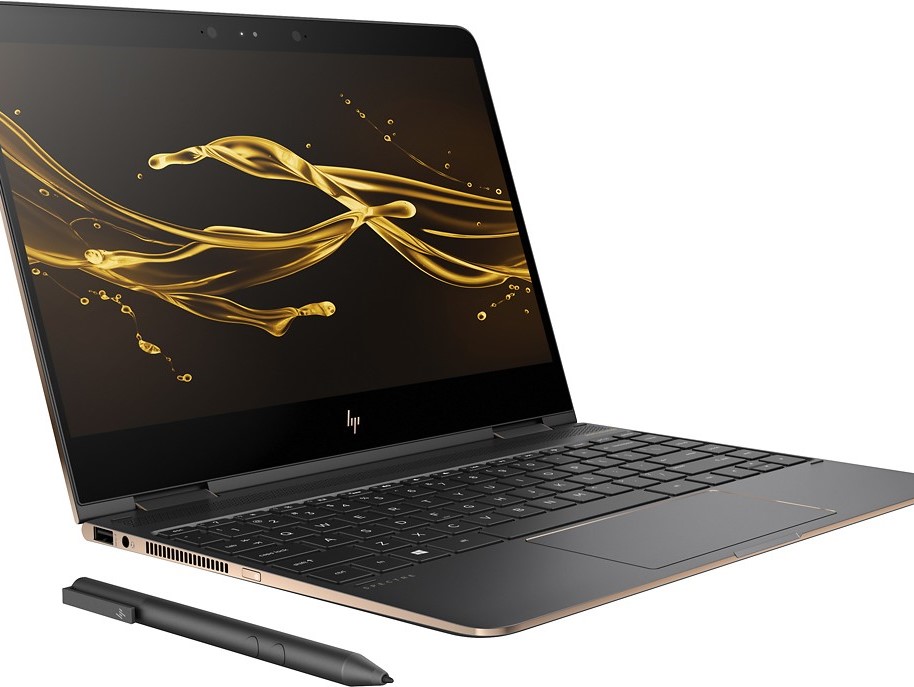
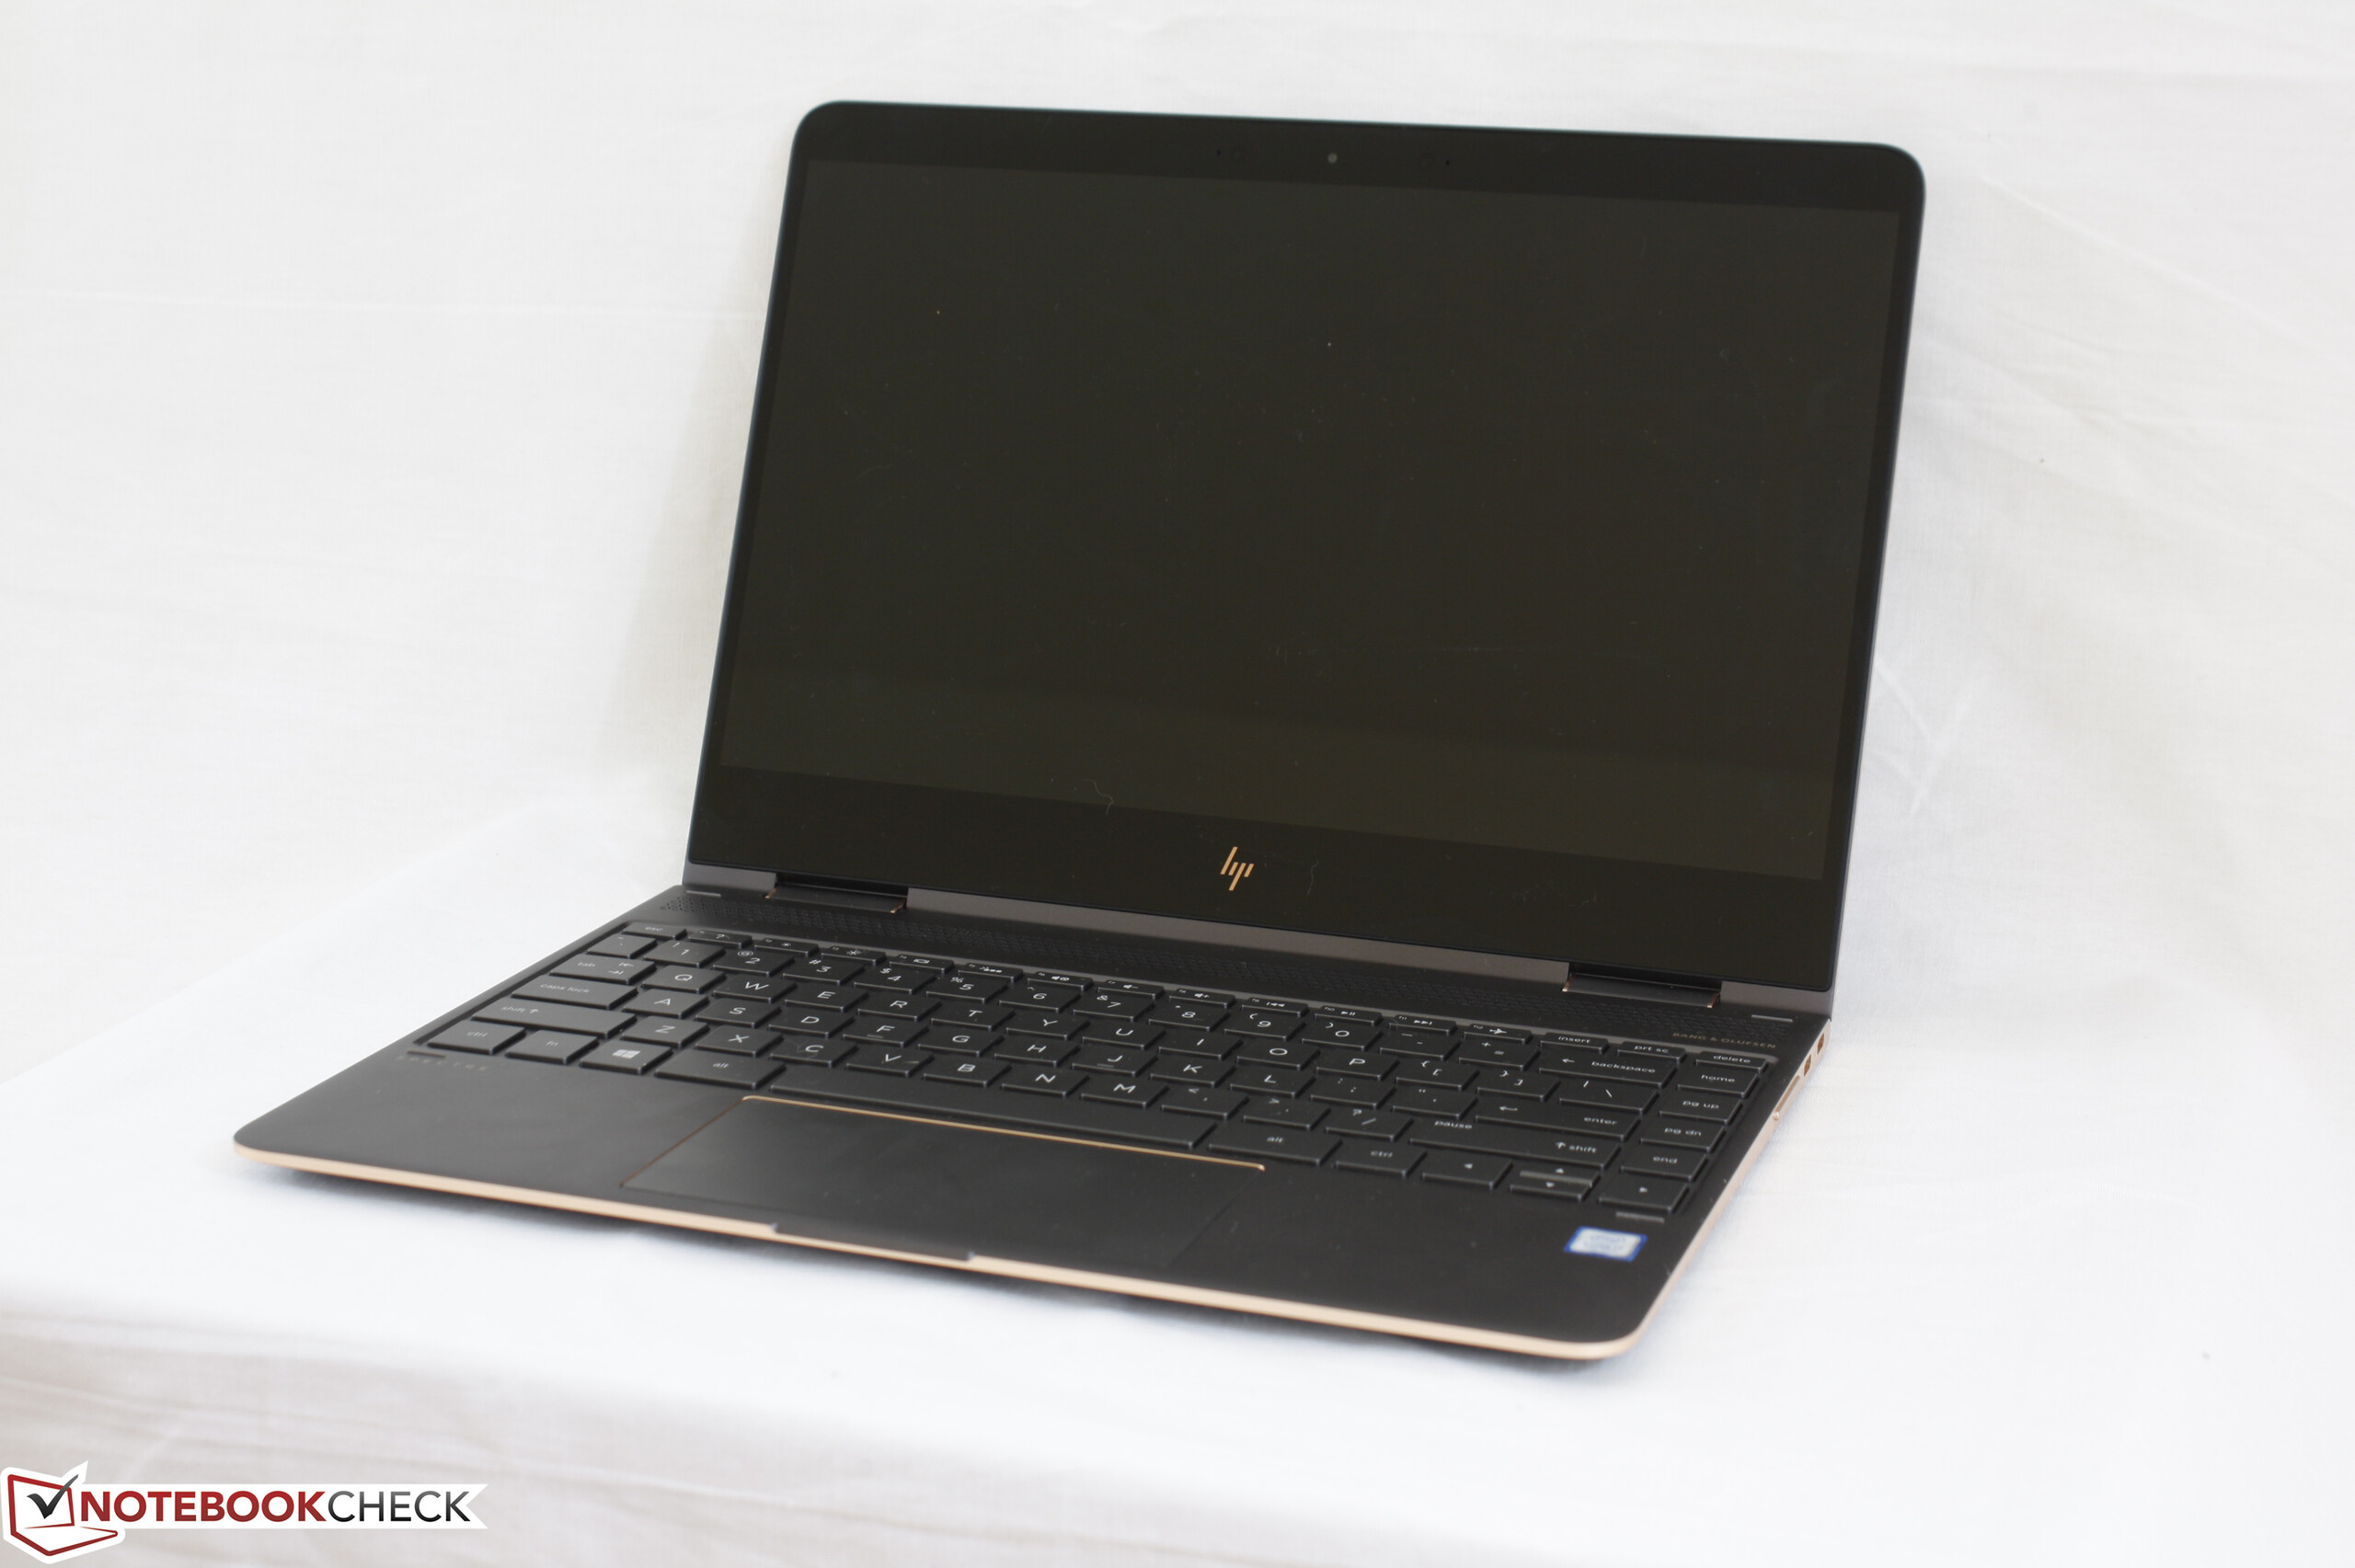
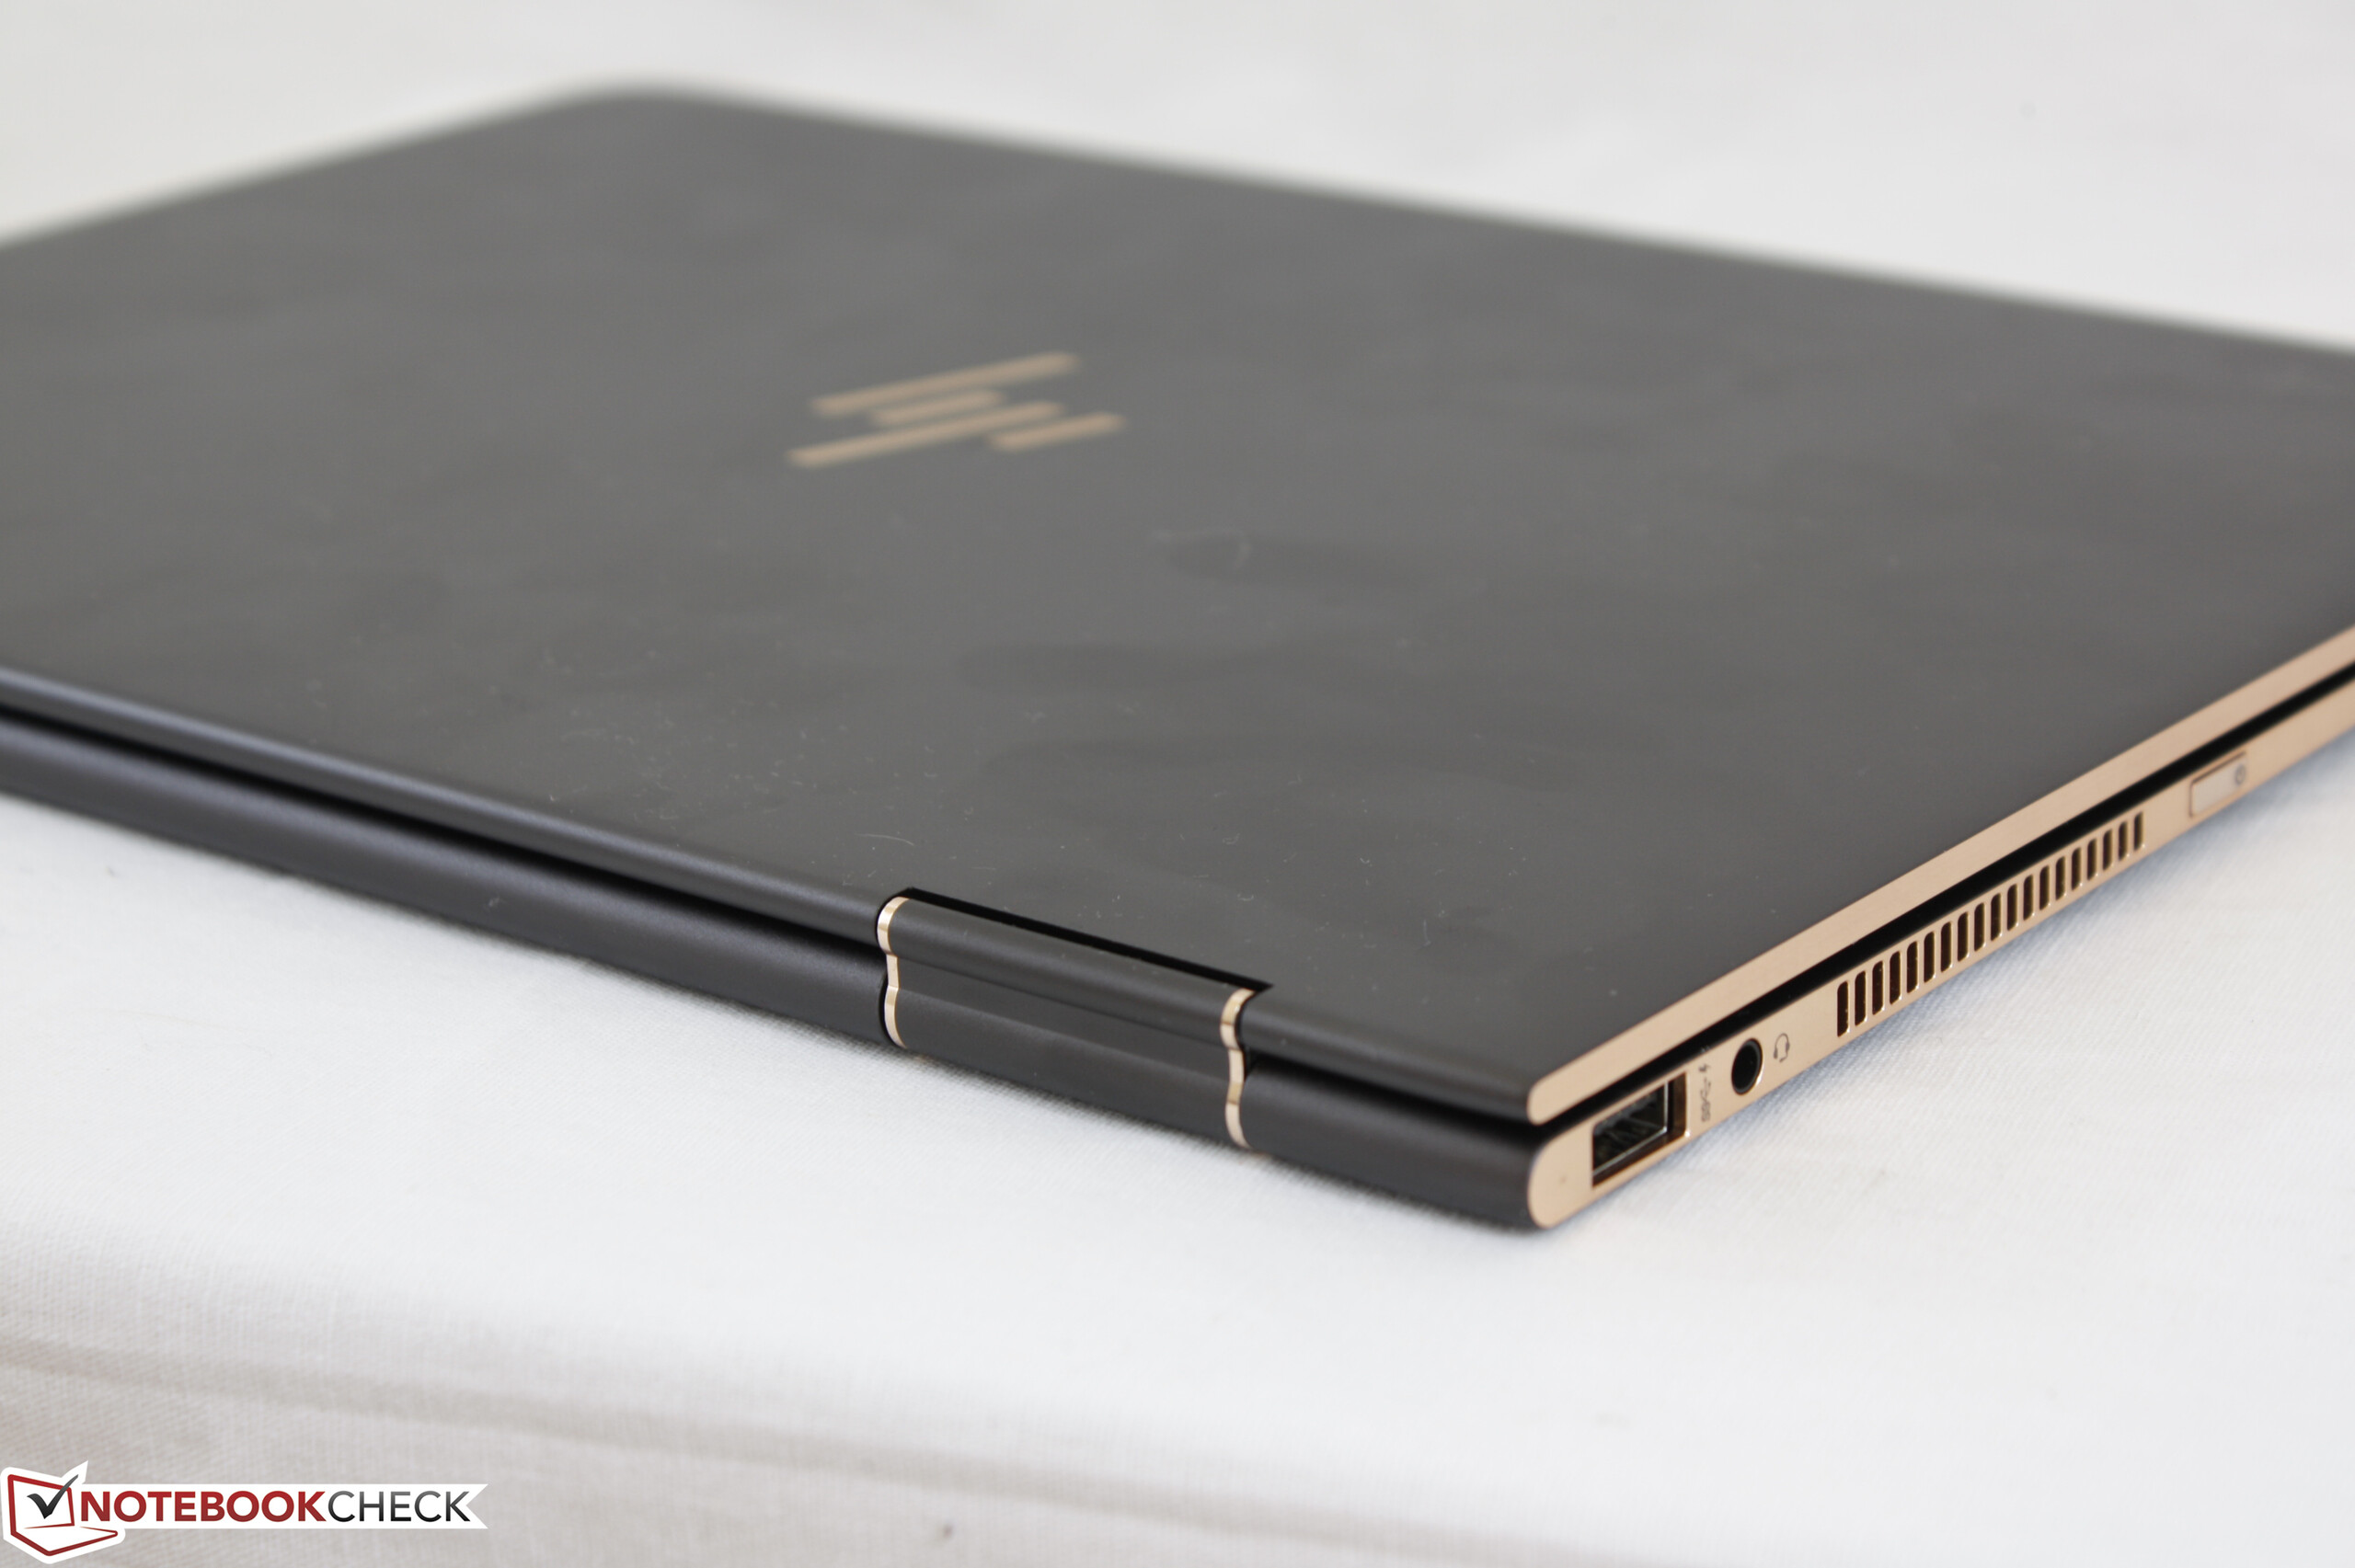
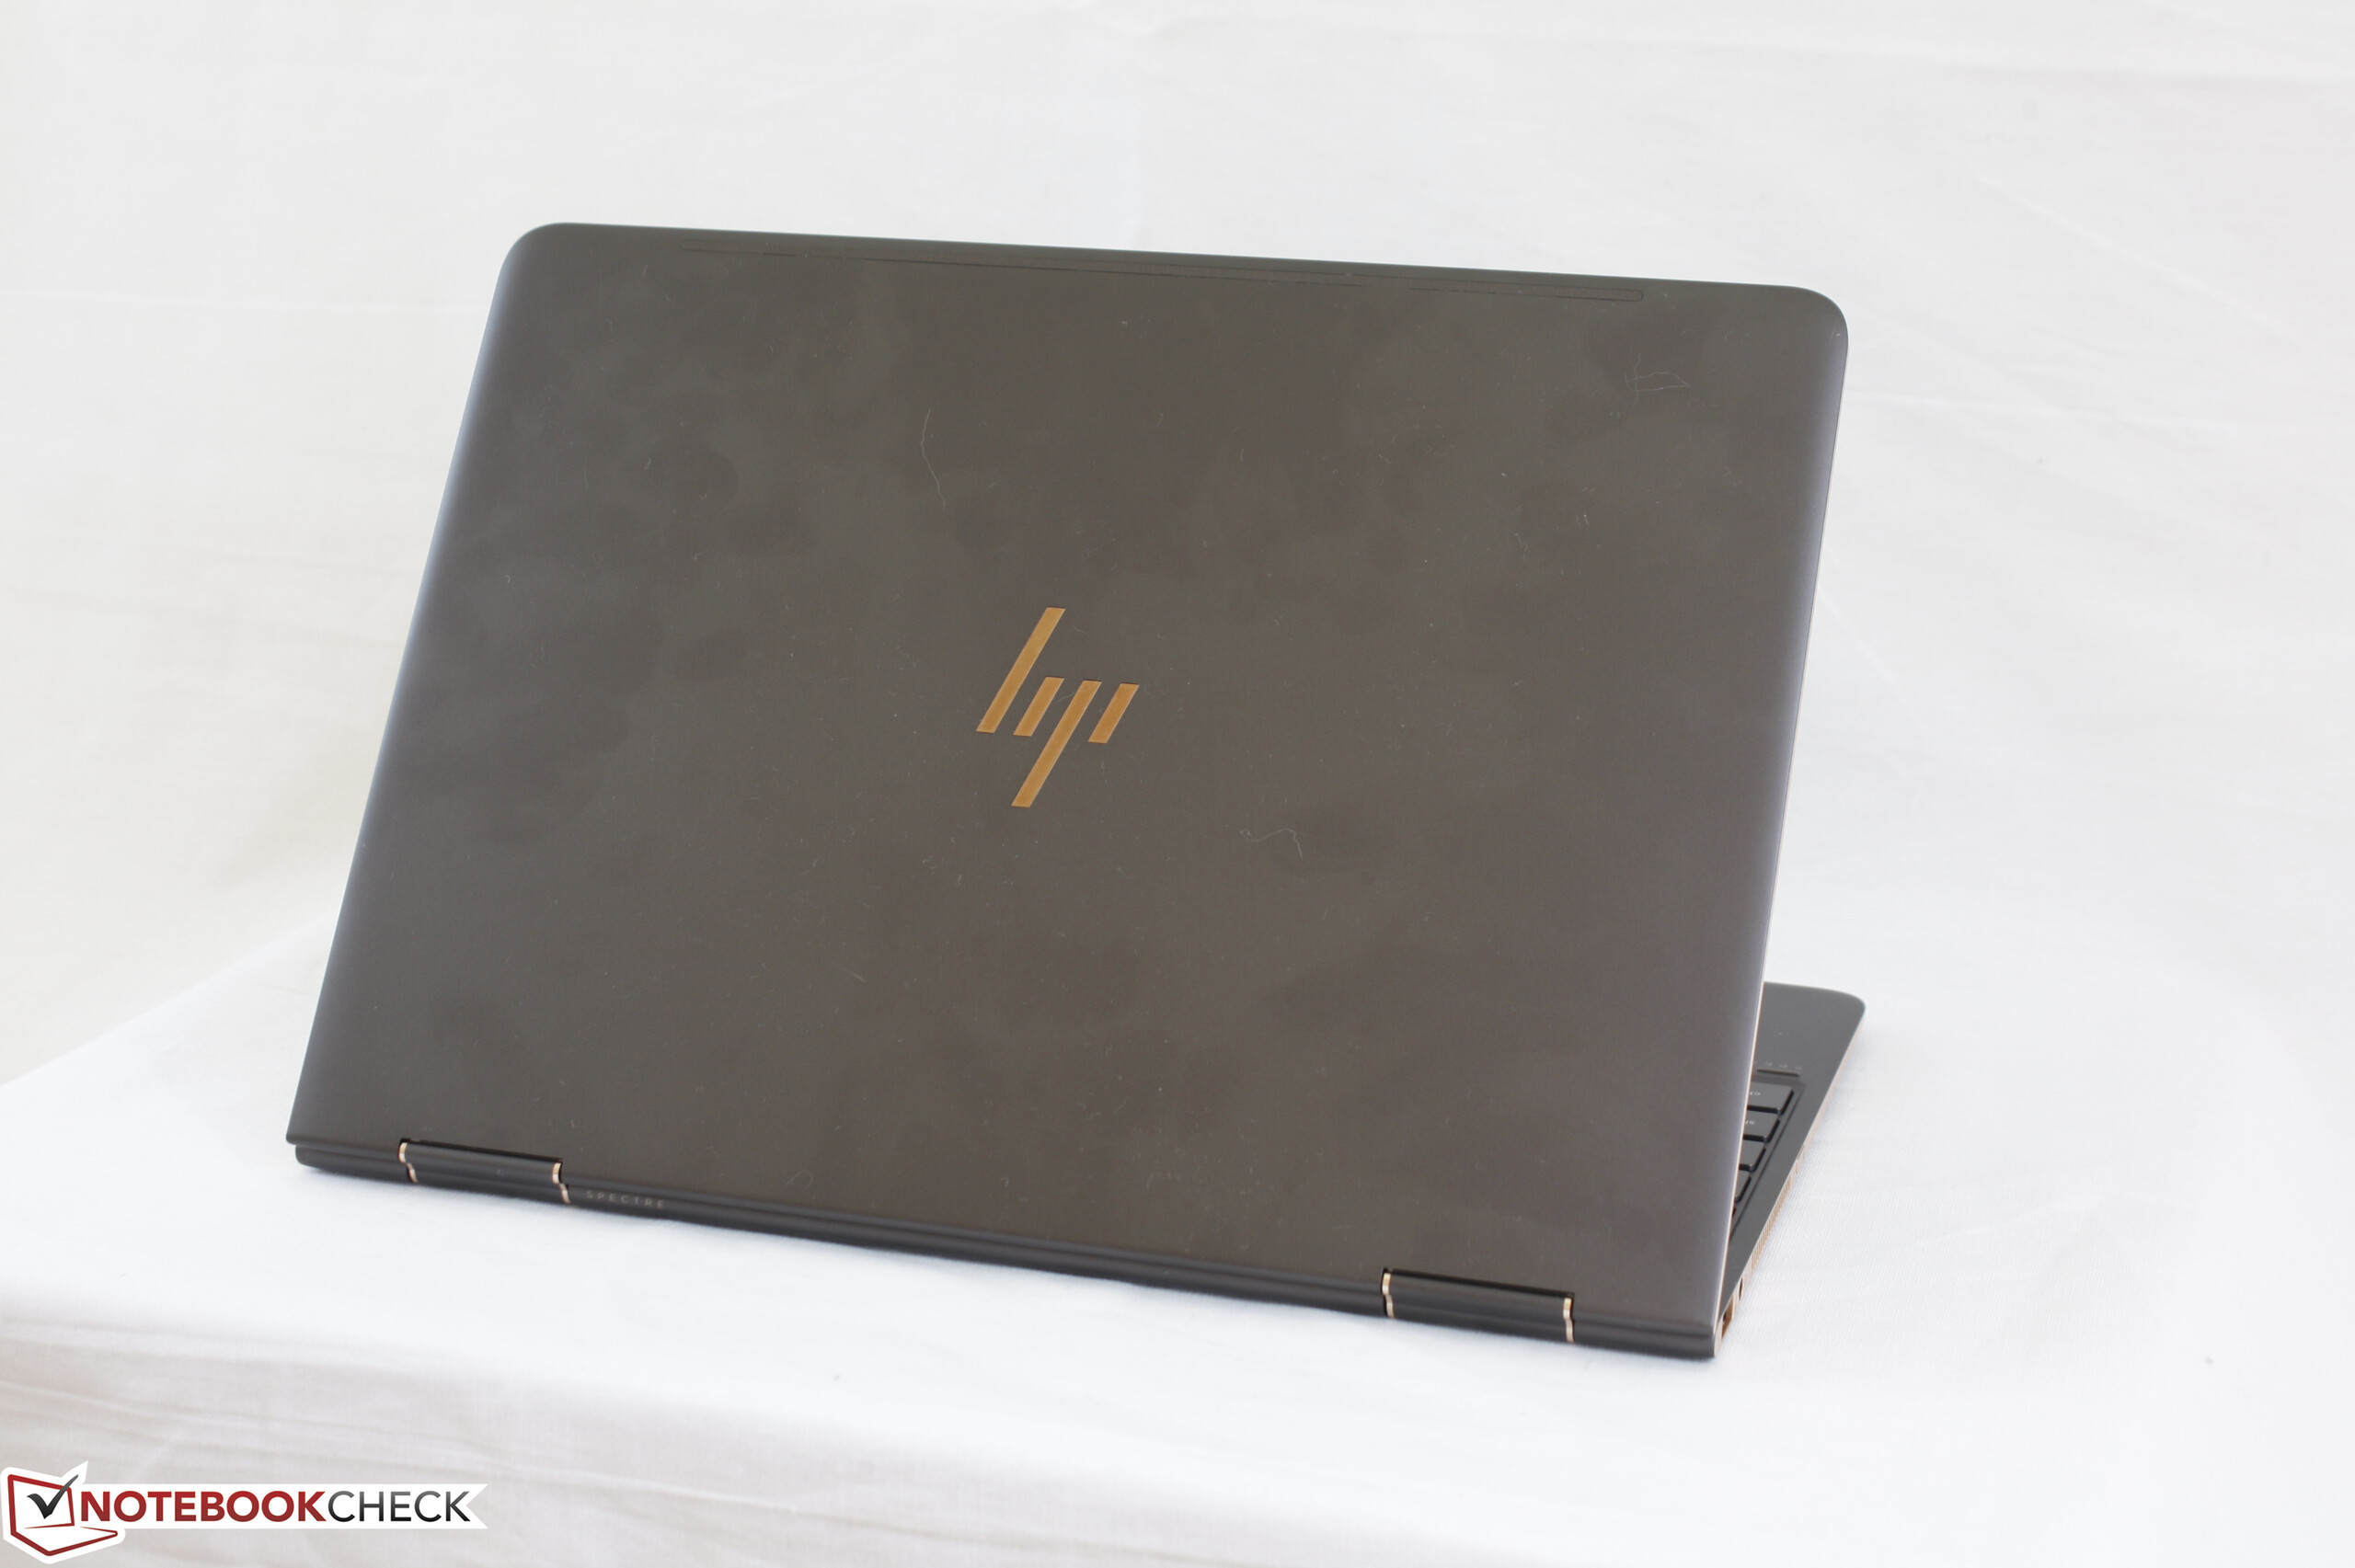
惠普为Spectre x360 13搭配了4K超高清屏幕和手写笔支持,让它可以更好地作为平板电脑发挥优势。它仍然沿用了2016年的轻盈易用二合一设计,是最实用的变形本之一。
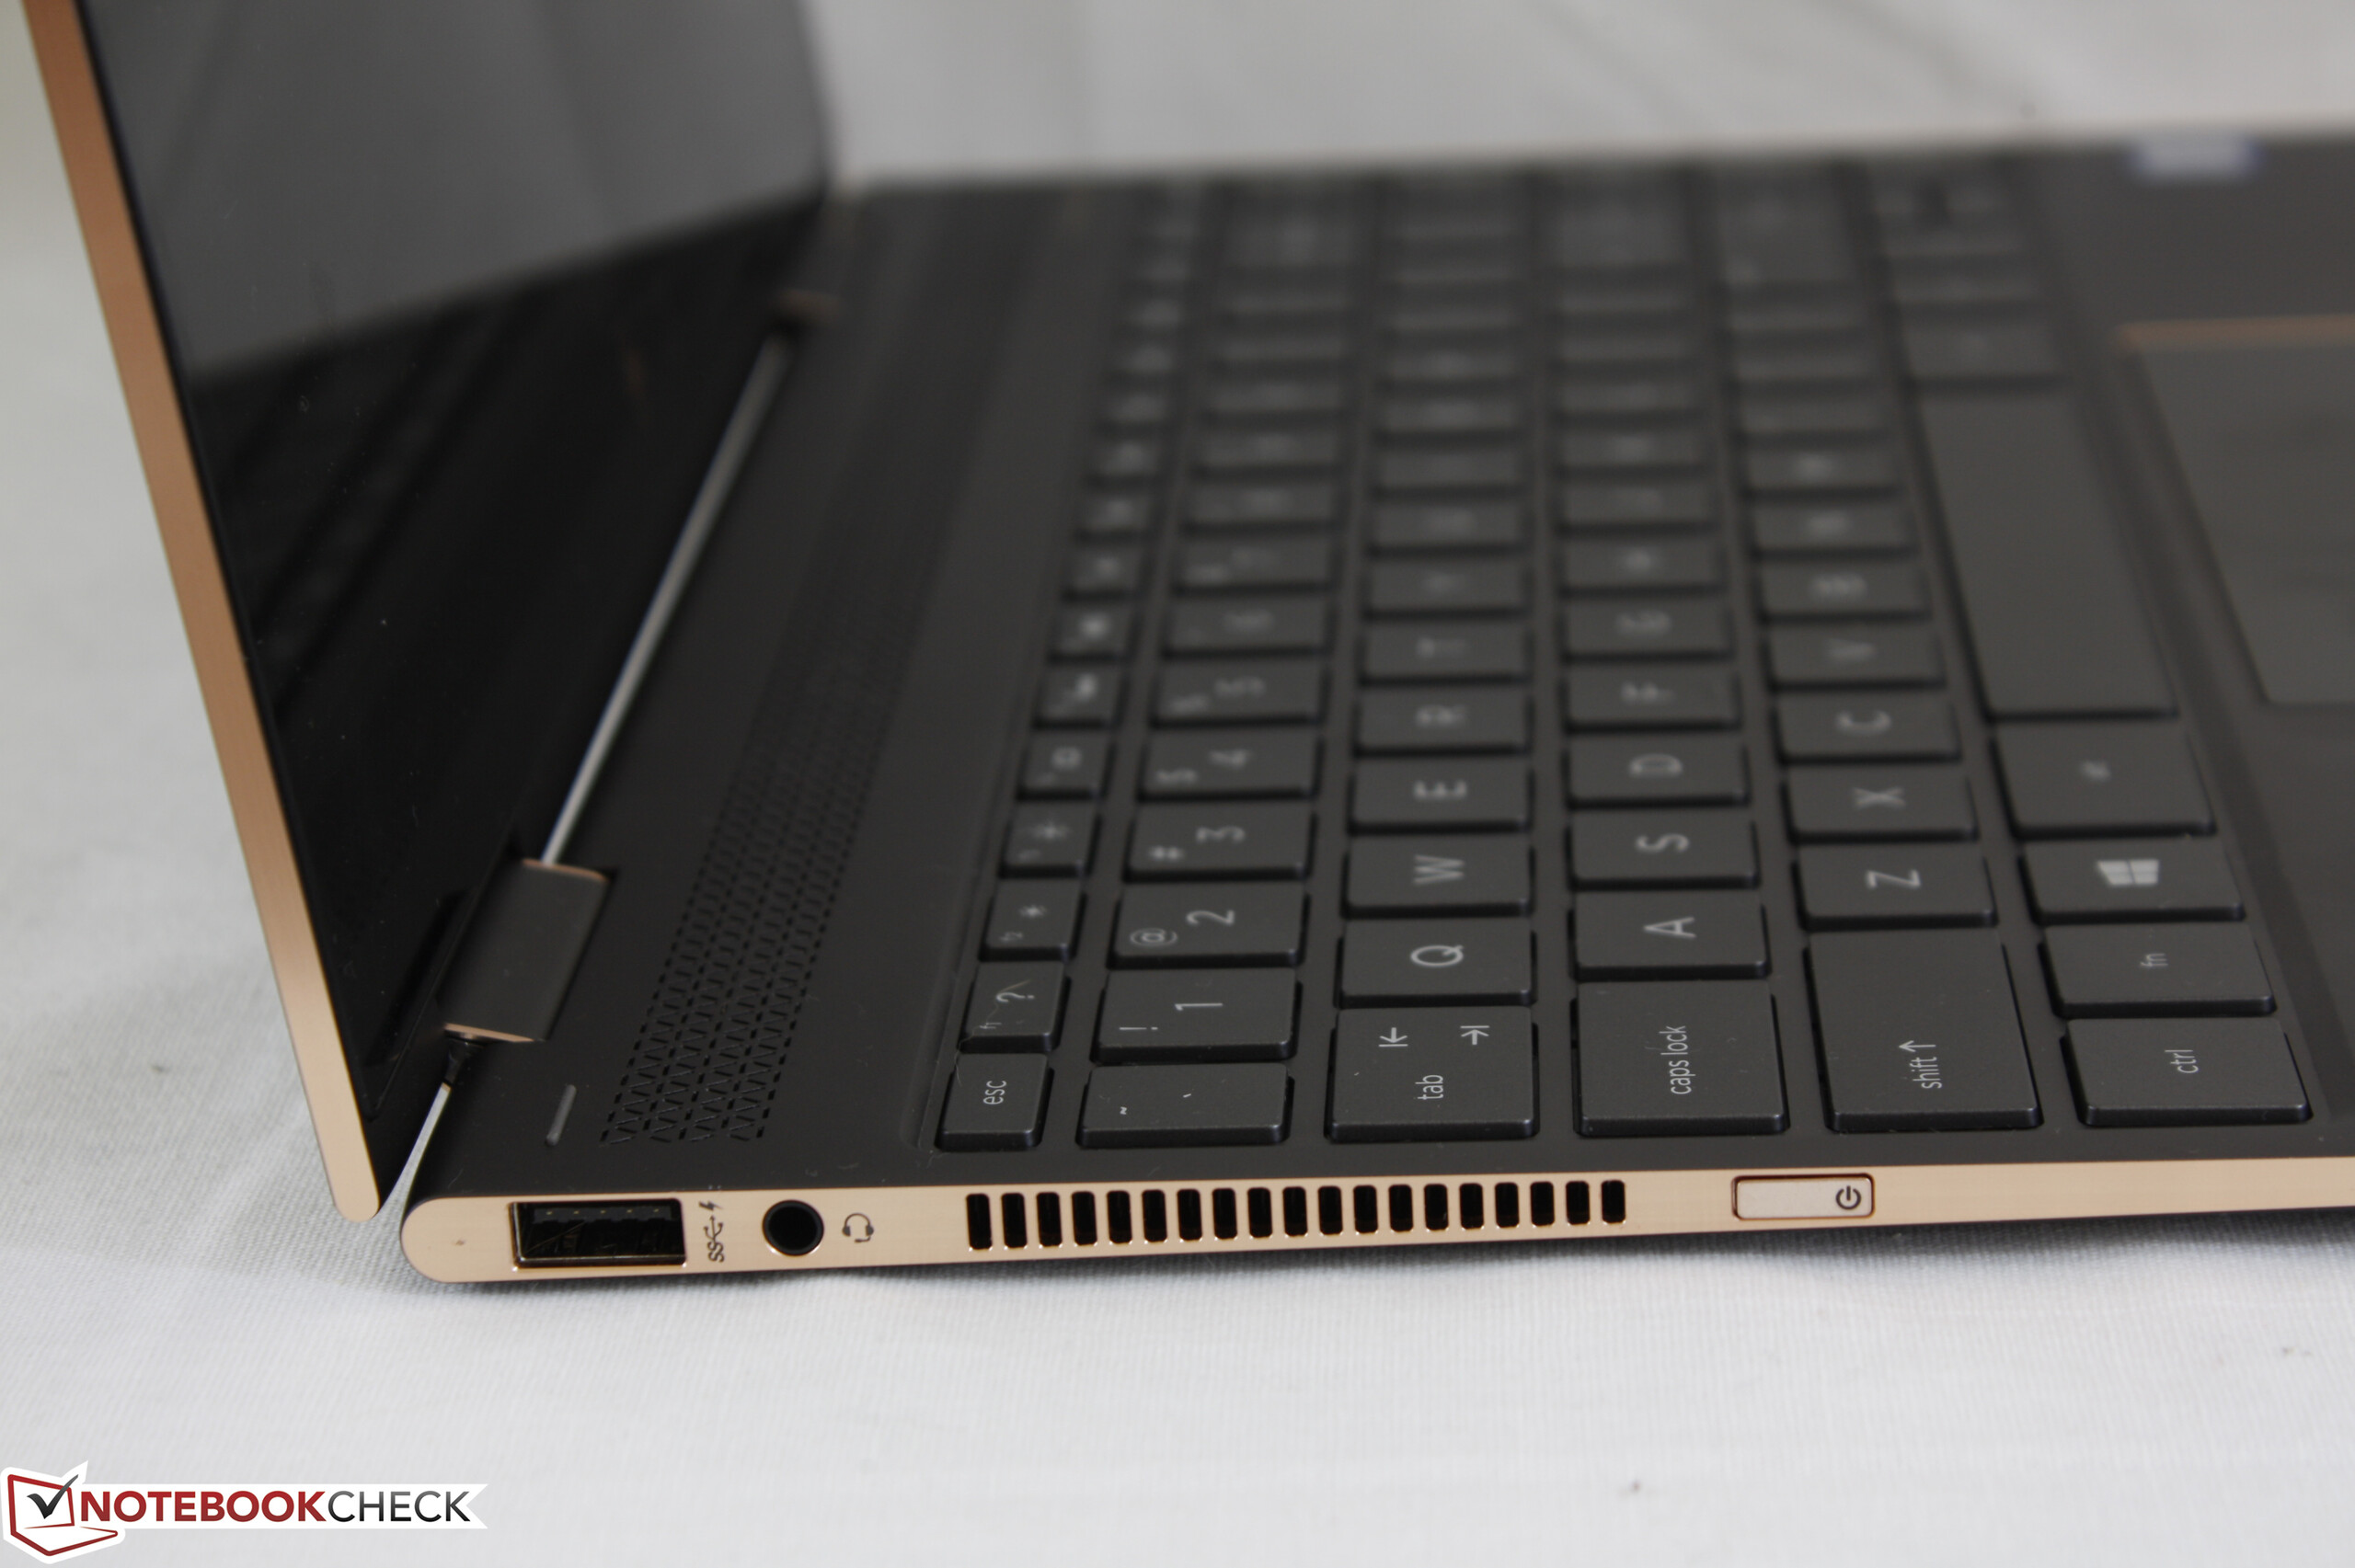
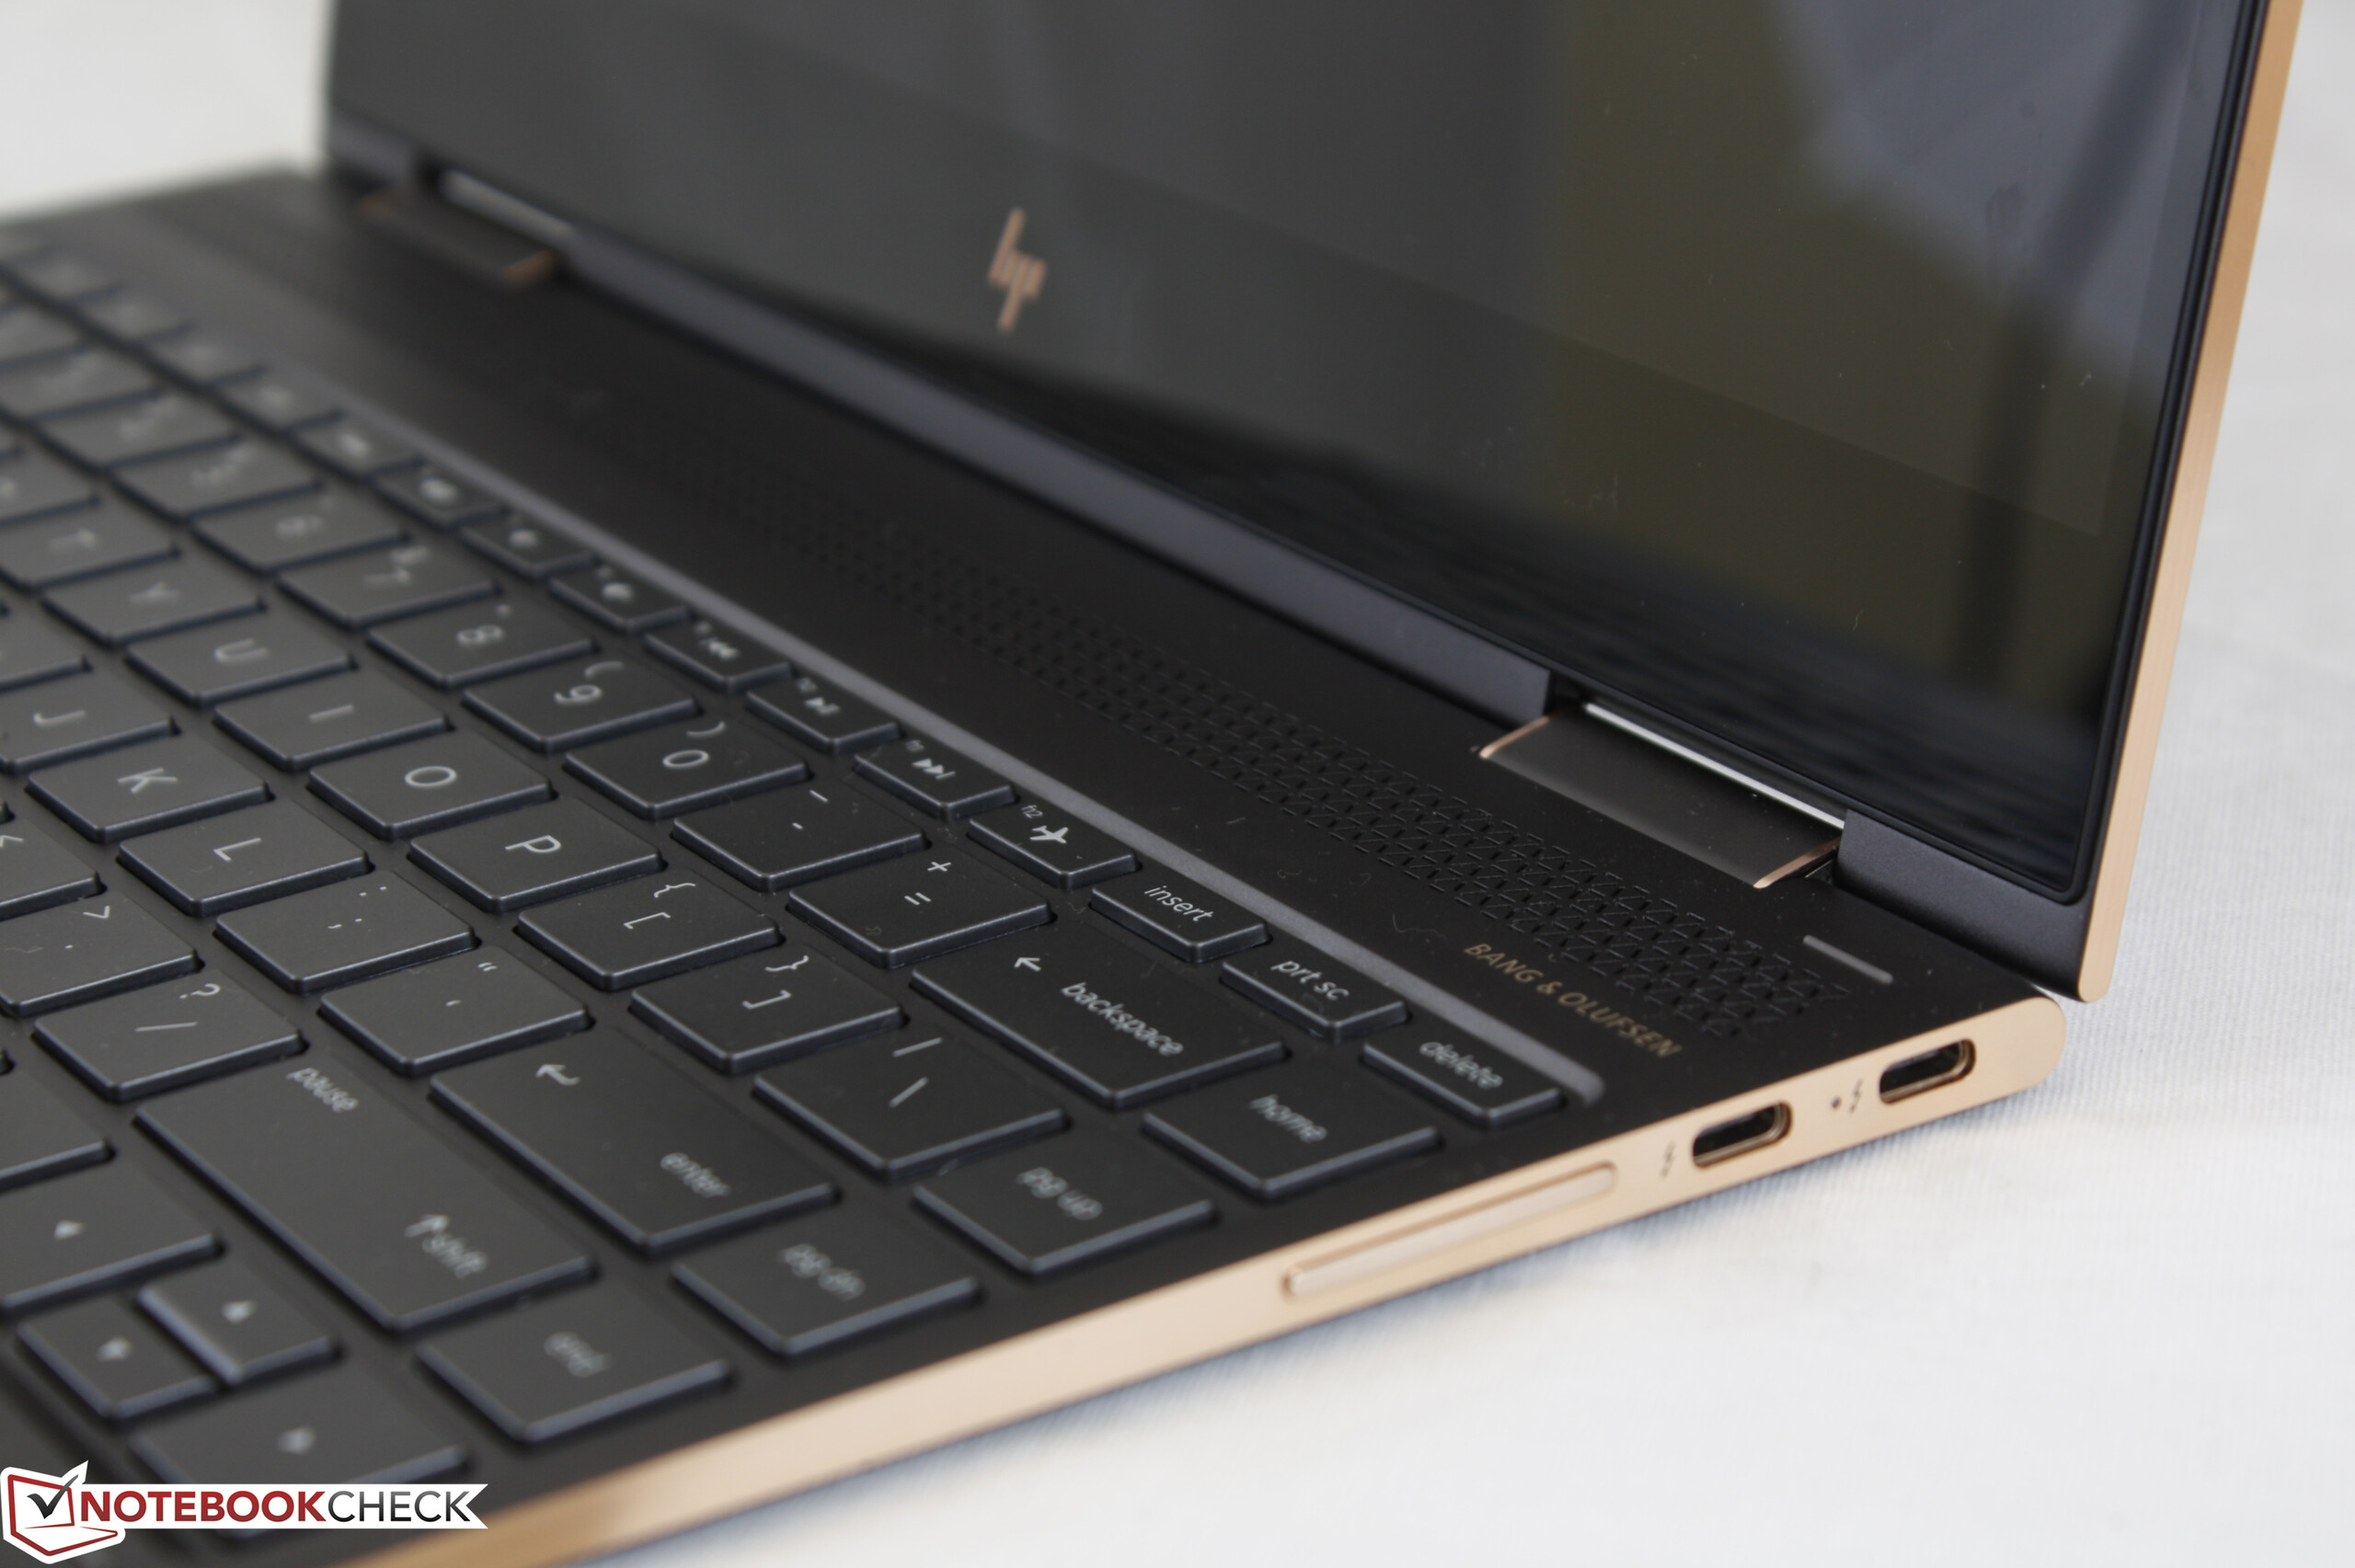
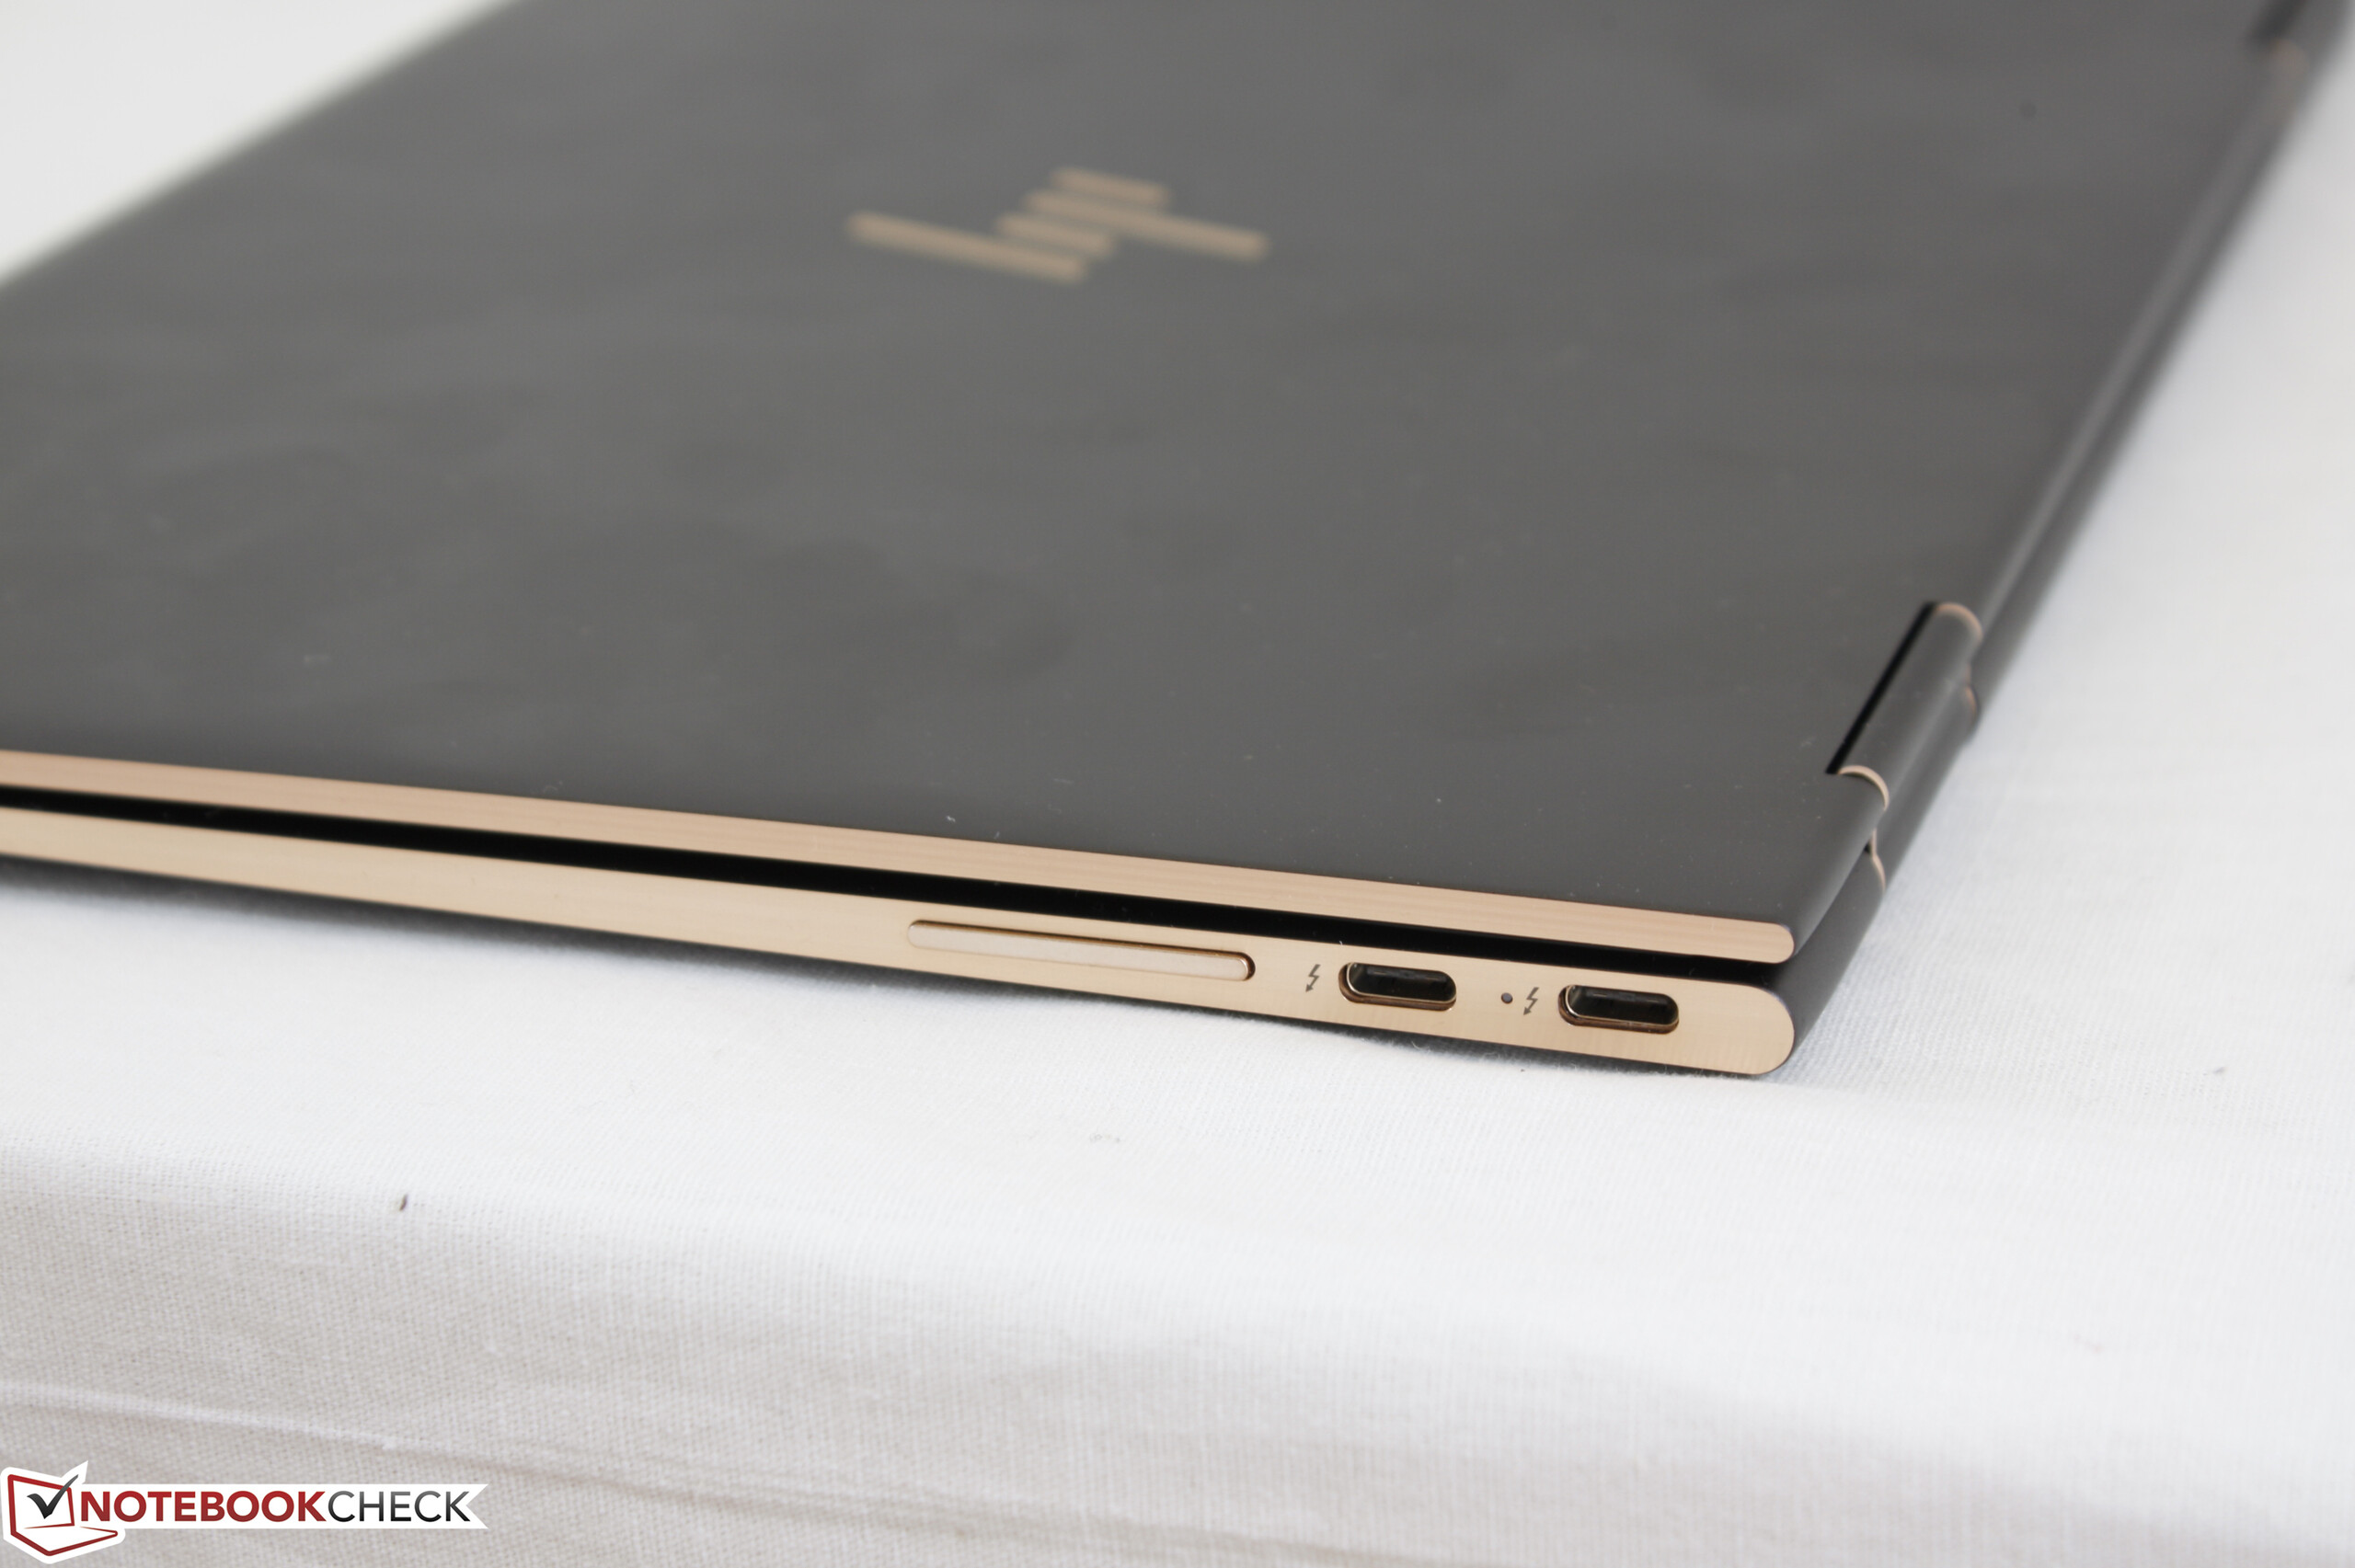
除了之前提到的一些小更新,惠普在其他方面也没有让我们失望。例如,它增加了一个SD读卡器,手动风扇控制软件和更明亮的屏幕背光,这应该可以让它从2016年的全高清机型得到足够的区分度。由于提供了附赠的主动式手写笔,Spectre x360 13也更加适合户外使用,不过它的屏幕亮度仍然还有提高的空间。
XPS 13 9365和Yoga 910都在我们测试2016年版Spectre x360 13之后在市场上表现抢眼,它们也各有自己的优缺点。戴尔设备相对更轻更小巧,而没有牺牲屏幕尺寸,但是它没有提供4K全高清机型,被动散热的处理器也相对较慢。另一方面,Yoga 910相比惠普设备更笨重一些,搭配相似的4K超高清屏幕和i7-7500U处理器,不过它缺少对主动式手写笔的支持。在这两者之间,全新Spectre x360 13在便携性和硬件性能间取得了最佳的平衡。
这个2017年的小更新为在2016年底推出的Spectre x360 13配备了4K全高清屏幕和主动式手写笔。除此之外它的变化不大,不过也没关系——这台变形本在尺寸和性能间找到了出色的平衡,可以适合各个模式的使用。
注:本文是基于完整评测的缩减版本,阅读完整的英文评测,请点击这里。
HP Spectre x360 13-ac033dx
- 04/05/2017 v6 (old)
Allen Ngo
Price comparison
