惠普 Spectre 13 (酷睿 i7, 全高清) 笔记本电脑简短评测
| Networking | |
| iperf3 transmit AX12 | |
| Apple MacBook Pro 13 2016 (2.9 GHz) | |
| HP Spectre 13-v131ng | |
| Dell XPS 13 9360 FHD i5 | |
| iperf3 receive AX12 | |
| Apple MacBook Pro 13 2016 (2.9 GHz) | |
| Dell XPS 13 9360 FHD i5 | |
| HP Spectre 13-v131ng | |
| |||||||||||||||||||||||||
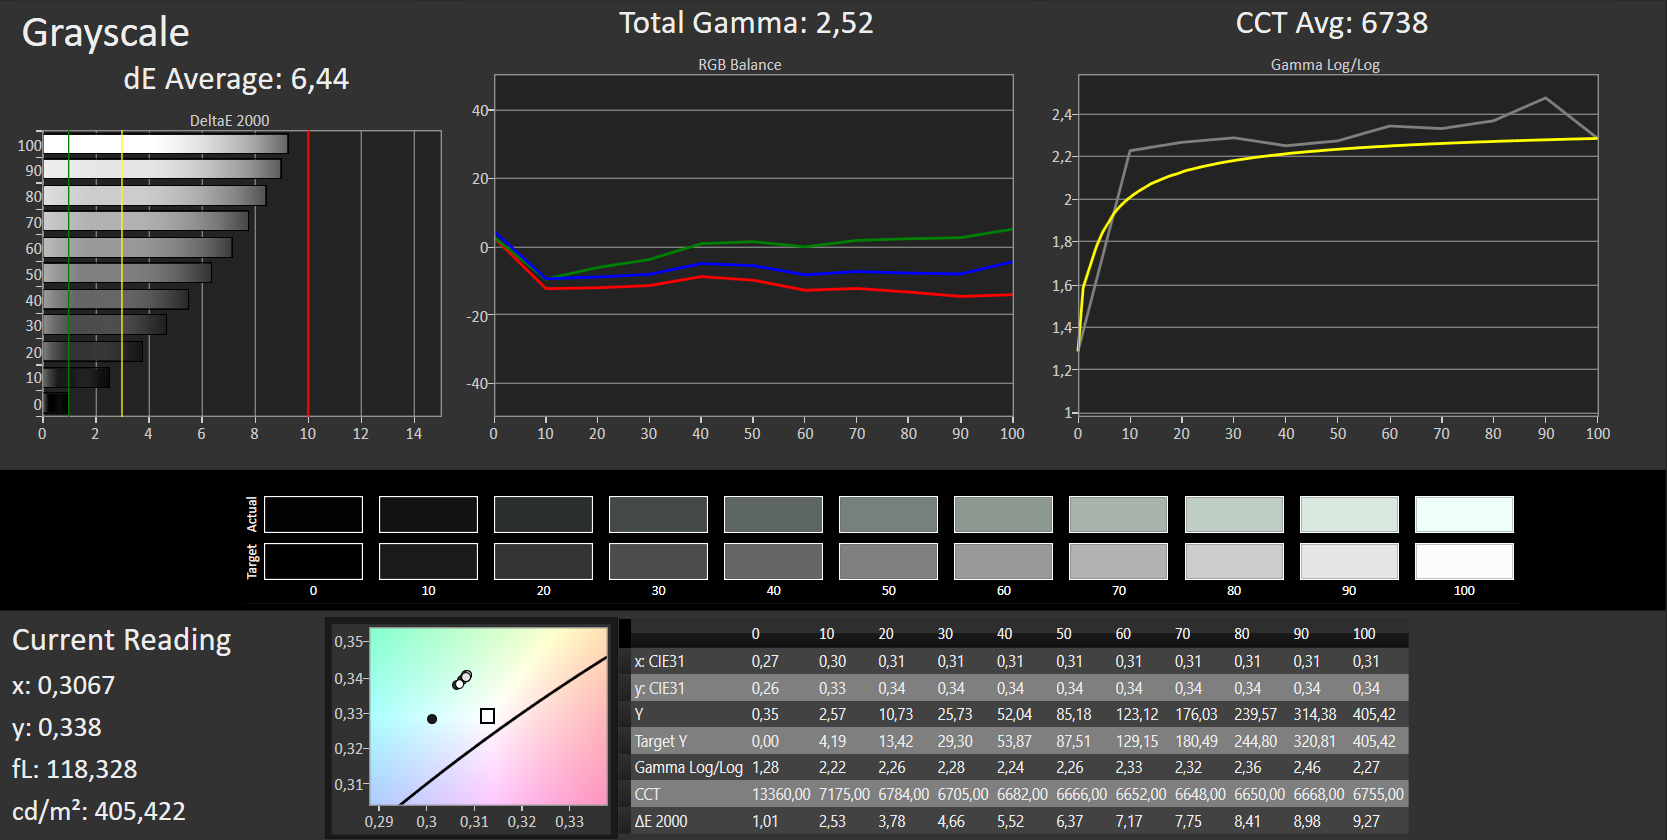
Brightness Distribution: 91 %
Center on Battery: 384 cd/m²
Contrast: 1154:1 (Black: 0.35 cd/m²)
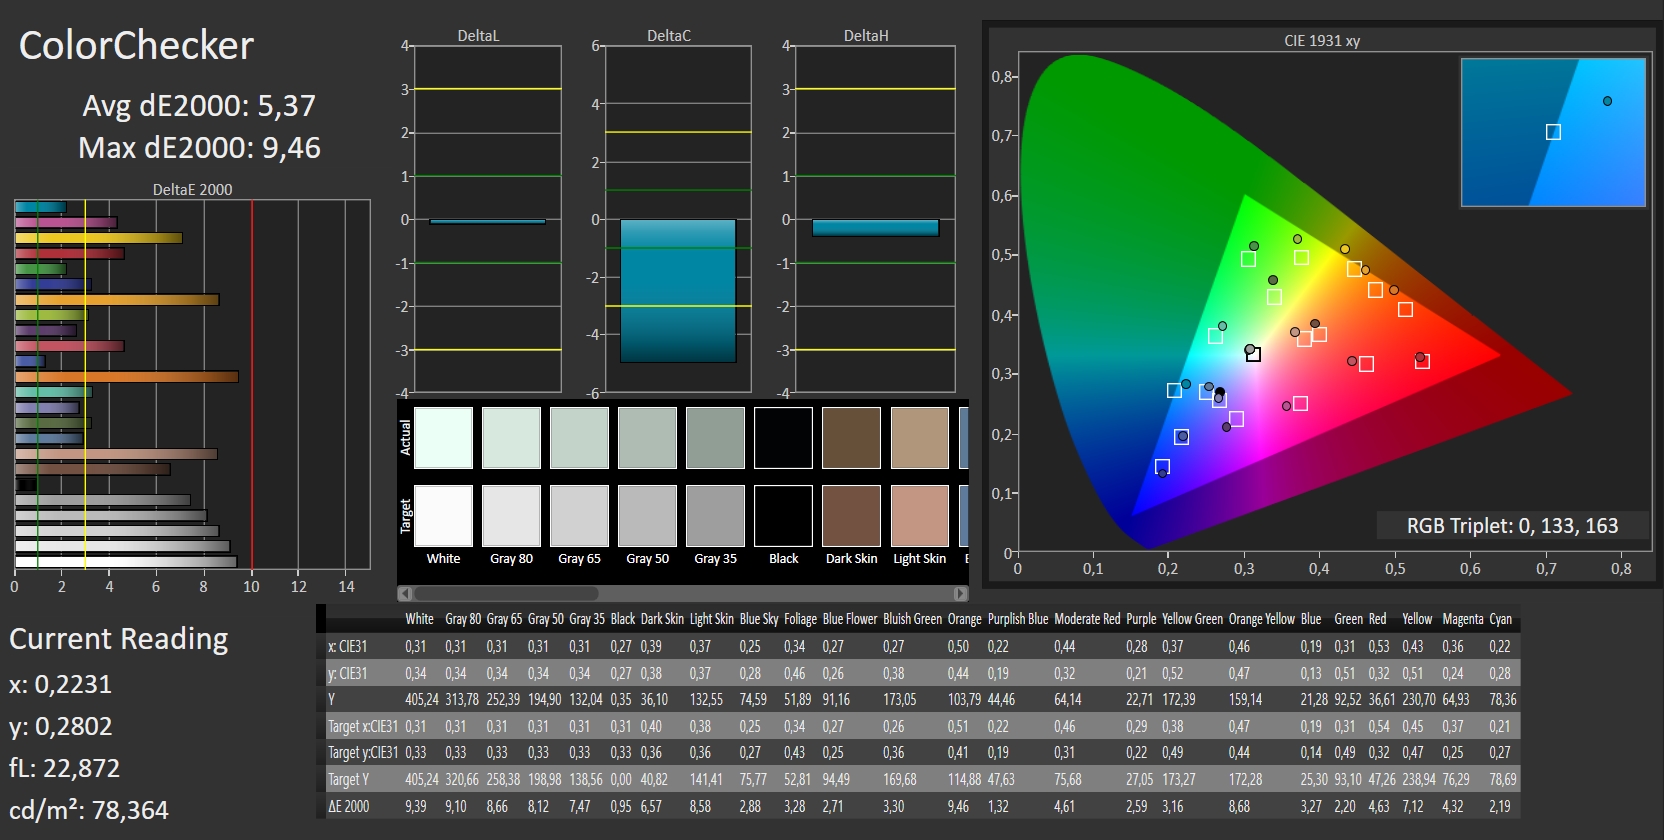
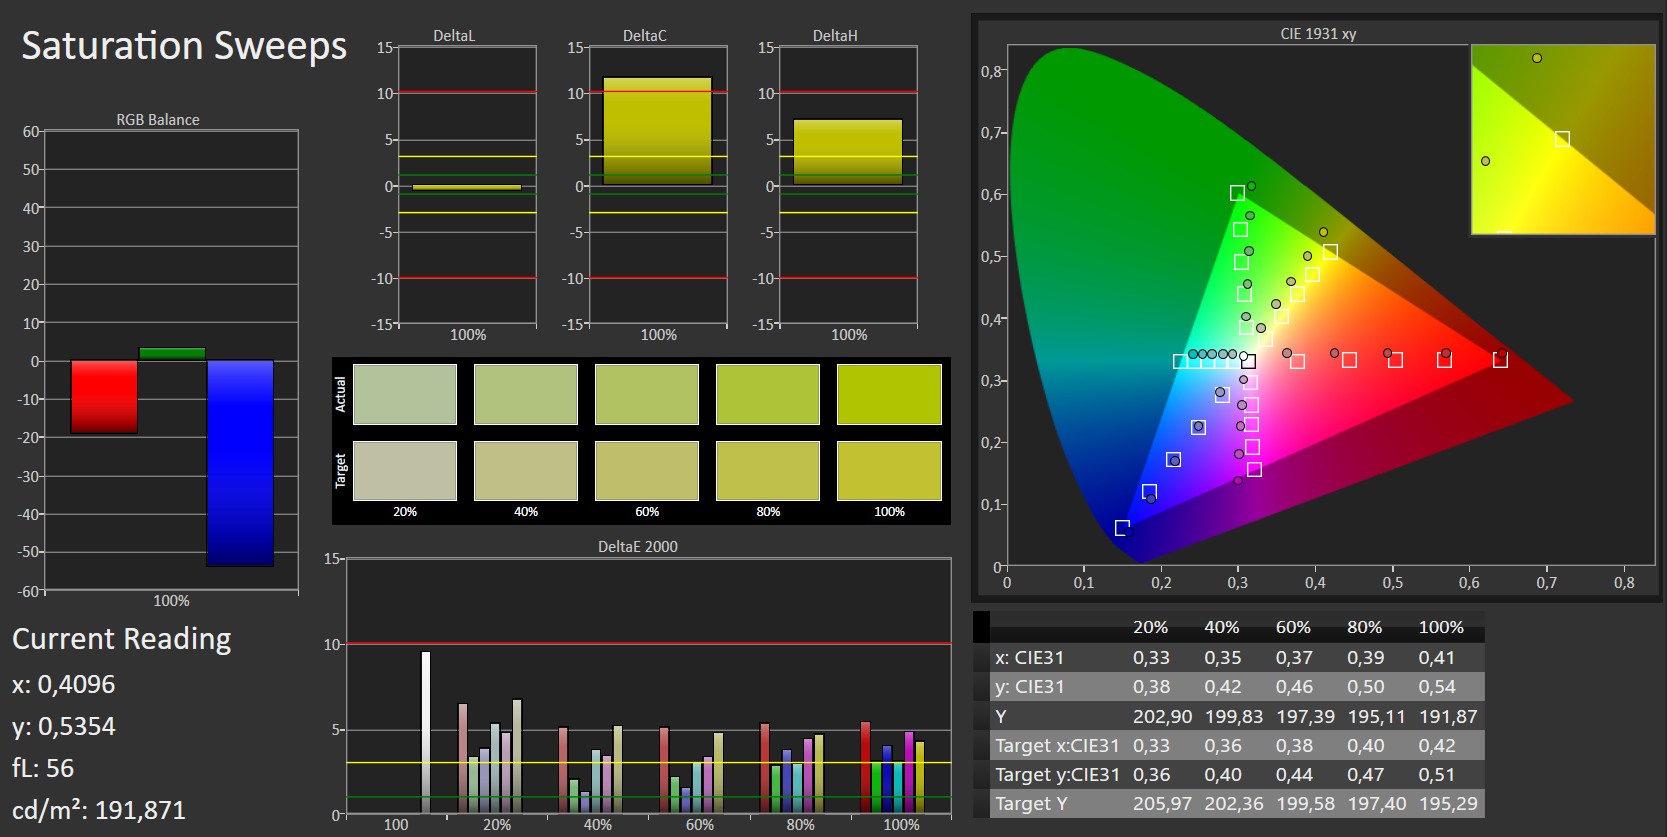
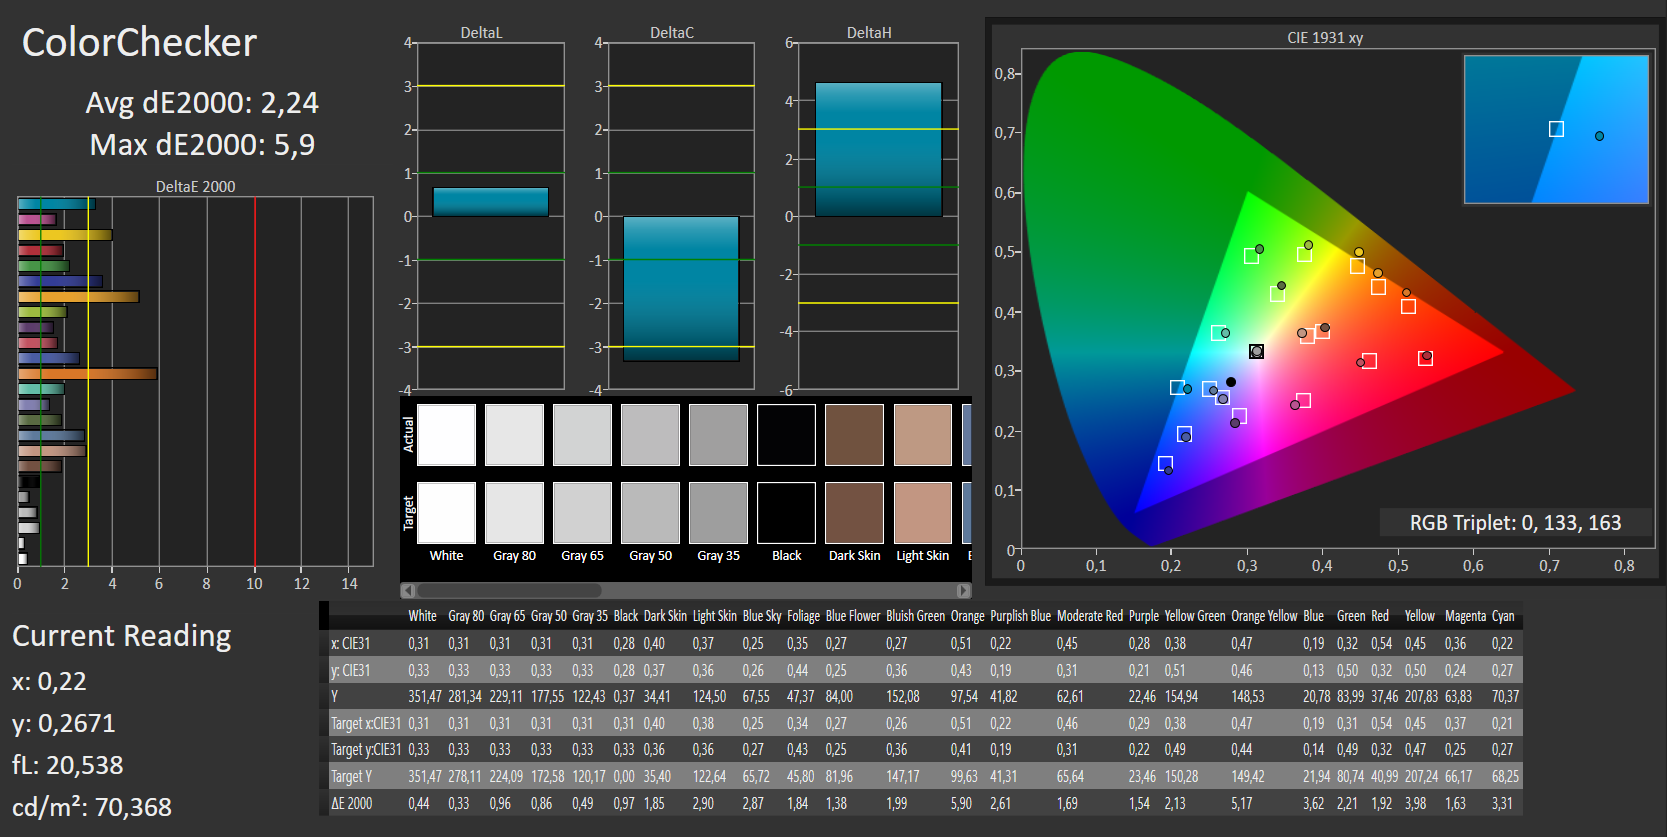
ΔE ColorChecker Calman: 5.37 | ∀{0.5-29.43 Ø4.71}
ΔE Greyscale Calman: 6.44 | ∀{0.09-98 Ø4.96}
89% sRGB (Argyll 1.6.3 3D)
58% AdobeRGB 1998 (Argyll 1.6.3 3D)
64.8% AdobeRGB 1998 (Argyll 3D)
88.8% sRGB (Argyll 3D)
64.6% Display P3 (Argyll 3D)
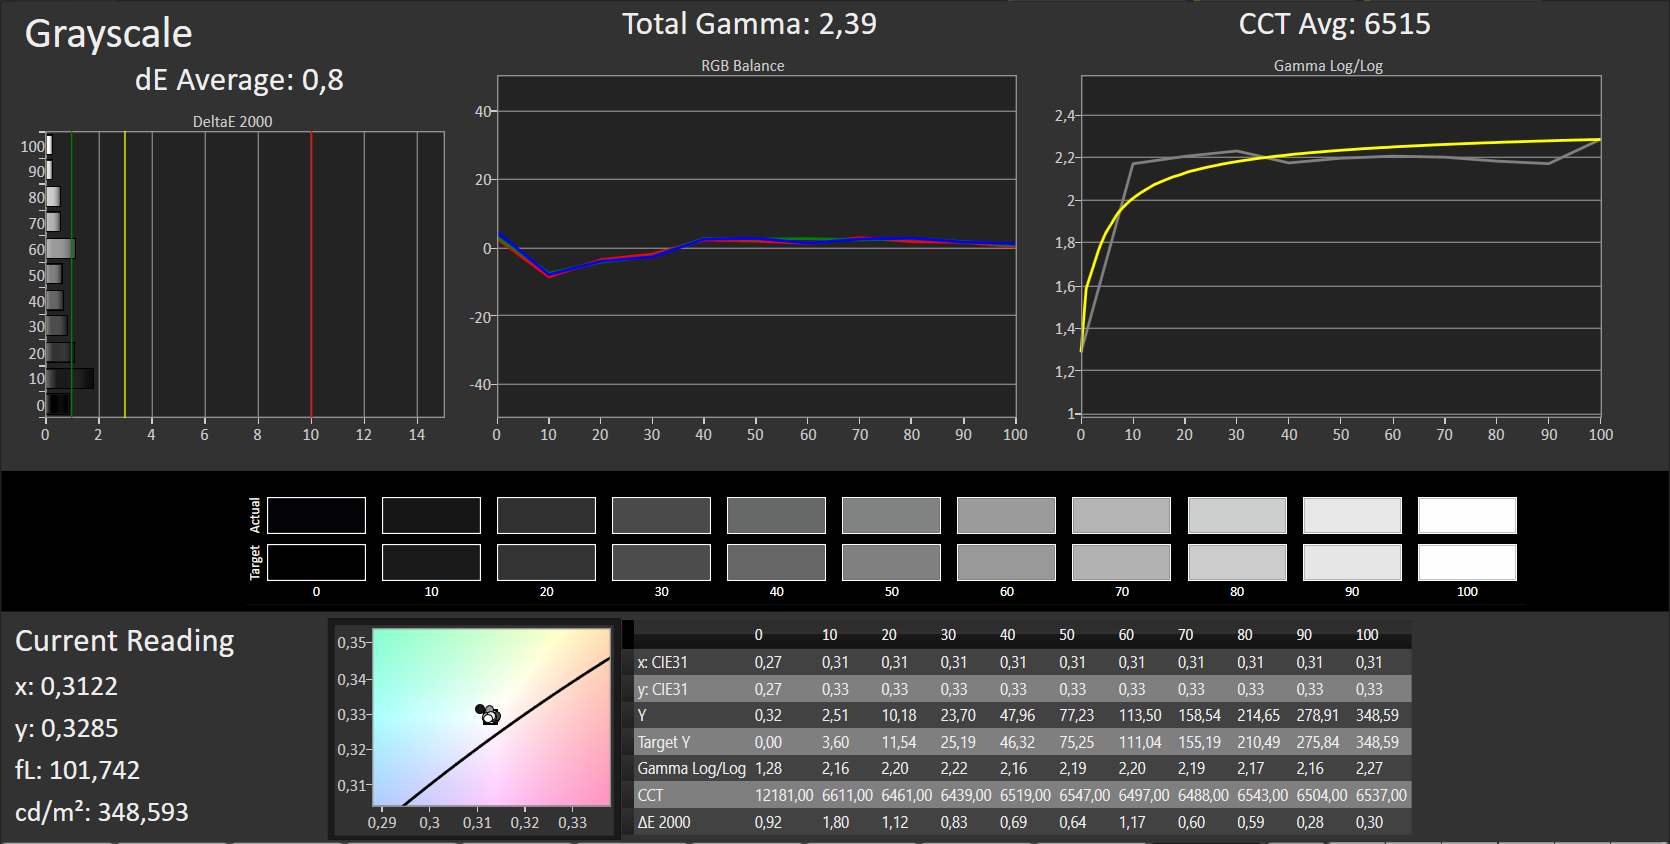
Gamma: 2.52
CCT: 6738 K
| HP Spectre 13-v131ng CMN1374, 1920x1080, 13.3" | HP Spectre 13 1920x1080, 13.3" | Apple MacBook Pro 13 2016 (2.9 GHz) APPA033, 2560x1600, 13.3" | Dell XPS 13 9360 FHD i5 Sharp SHP1449 LQ133M1, 1920x1080, 13.3" | Asus Zenbook UX305CA-FB055T Samsung 133YL04-P02, 3200x1800, 13.3" | HP EliteBook 1030 G1-X2F03EA Sharp SHP1465, 3200x1800, 13.3" | |
|---|---|---|---|---|---|---|
| Display | 4% | 34% | -21% | -6% | 6% | |
| Display P3 Coverage (%) | 64.6 | 65.6 2% | 99.2 54% | 48.94 -24% | 59.1 -9% | 67.6 5% |
| sRGB Coverage (%) | 88.8 | 94.7 7% | 99.9 13% | 73.3 -17% | 85.5 -4% | 94.7 7% |
| AdobeRGB 1998 Coverage (%) | 64.8 | 67.5 4% | 87.6 35% | 50.5 -22% | 61 -6% | 69 6% |
| Response Times | -6% | -32% | 14% | 18% | 15% | |
| Response Time Grey 50% / Grey 80% * (ms) | 46 ? | 50.8 ? -10% | 47.2 ? -3% | 32.8 ? 29% | 38 ? 17% | 42.4 ? 8% |
| Response Time Black / White * (ms) | 33 ? | 33.2 ? -1% | 53 ? -61% | 33.2 ? -1% | 27 ? 18% | 25.6 ? 22% |
| PWM Frequency (Hz) | 1429 ? | |||||
| Screen | 19% | 27% | 0% | -6% | 10% | |
| Brightness middle (cd/m²) | 404 | 300.5 -26% | 569 41% | 351.2 -13% | 390 -3% | 401 -1% |
| Brightness (cd/m²) | 382 | 305 -20% | 542 42% | 325 -15% | 352 -8% | 369 -3% |
| Brightness Distribution (%) | 91 | 76 -16% | 90 -1% | 89 -2% | 81 -11% | 85 -7% |
| Black Level * (cd/m²) | 0.35 | 0.184 47% | 0.56 -60% | 0.195 44% | 0.69 -97% | 0.35 -0% |
| Contrast (:1) | 1154 | 1633 42% | 1016 -12% | 1801 56% | 565 -51% | 1146 -1% |
| Colorchecker dE 2000 * | 5.37 | 2.64 51% | 1.4 74% | 7.4 -38% | 3.04 43% | 3.5 35% |
| Colorchecker dE 2000 max. * | 9.46 | 5.06 47% | 2.9 69% | 9.08 4% | 7.01 26% | 6.33 33% |
| Greyscale dE 2000 * | 6.44 | 2.8 57% | 1.8 72% | 6.71 -4% | 2.88 55% | 4.13 36% |
| Gamma | 2.52 87% | 2.16 102% | 2.16 102% | 2.74 80% | 2.43 91% | 2.28 96% |
| CCT | 6738 96% | 6999 93% | 6877 95% | 7222 90% | 6848 95% | 6508 100% |
| Color Space (Percent of AdobeRGB 1998) (%) | 58 | 60.9 5% | 78.4 35% | 50.48 -13% | 55 -5% | 61.56 6% |
| Color Space (Percent of sRGB) (%) | 89 | 94.3 6% | 99.3 12% | 73.31 -18% | 85 -4% | 94.64 6% |
| Total Average (Program / Settings) | 6% /
13% | 10% /
21% | -2% /
-2% | 2% /
-3% | 10% /
10% |
* ... smaller is better
Display Response Times
| ↔ Response Time Black to White | ||
|---|---|---|
| 33 ms ... rise ↗ and fall ↘ combined | ↗ 21 ms rise | 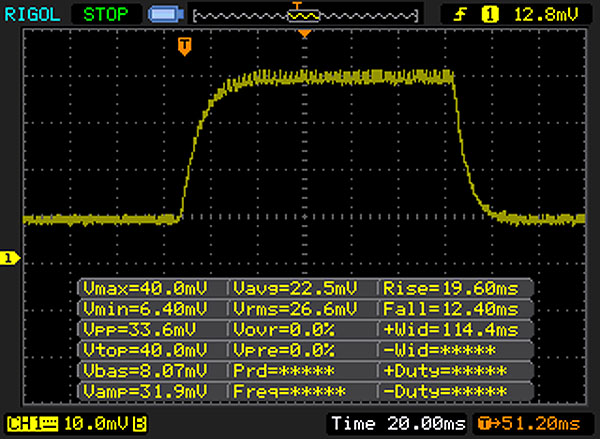 |
| ↘ 12 ms fall | ||
| The screen shows slow response rates in our tests and will be unsatisfactory for gamers. In comparison, all tested devices range from 0.1 (minimum) to 240 (maximum) ms. » 89 % of all devices are better. This means that the measured response time is worse than the average of all tested devices (19.8 ms). | ||
| ↔ Response Time 50% Grey to 80% Grey | ||
| 46 ms ... rise ↗ and fall ↘ combined | ↗ 26 ms rise | 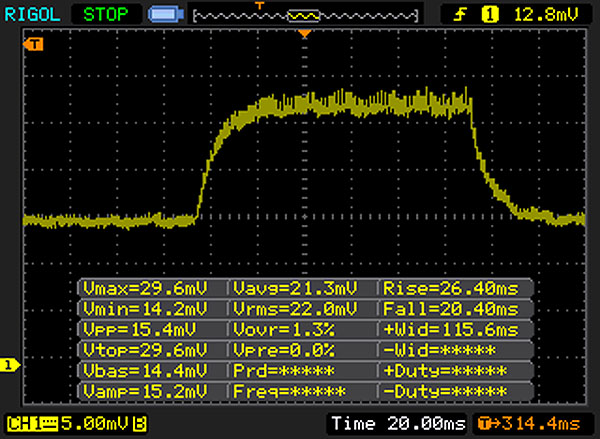 |
| ↘ 20 ms fall | ||
| The screen shows slow response rates in our tests and will be unsatisfactory for gamers. In comparison, all tested devices range from 0.165 (minimum) to 636 (maximum) ms. » 79 % of all devices are better. This means that the measured response time is worse than the average of all tested devices (31 ms). | ||
Screen Flickering / PWM (Pulse-Width Modulation)
| Screen flickering / PWM not detected | ||
In comparison: 52 % of all tested devices do not use PWM to dim the display. If PWM was detected, an average of 7754 (minimum: 5 - maximum: 343500) Hz was measured. | ||
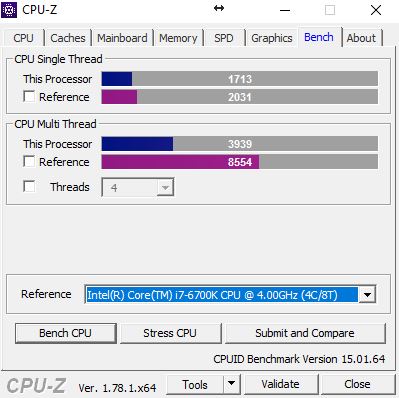
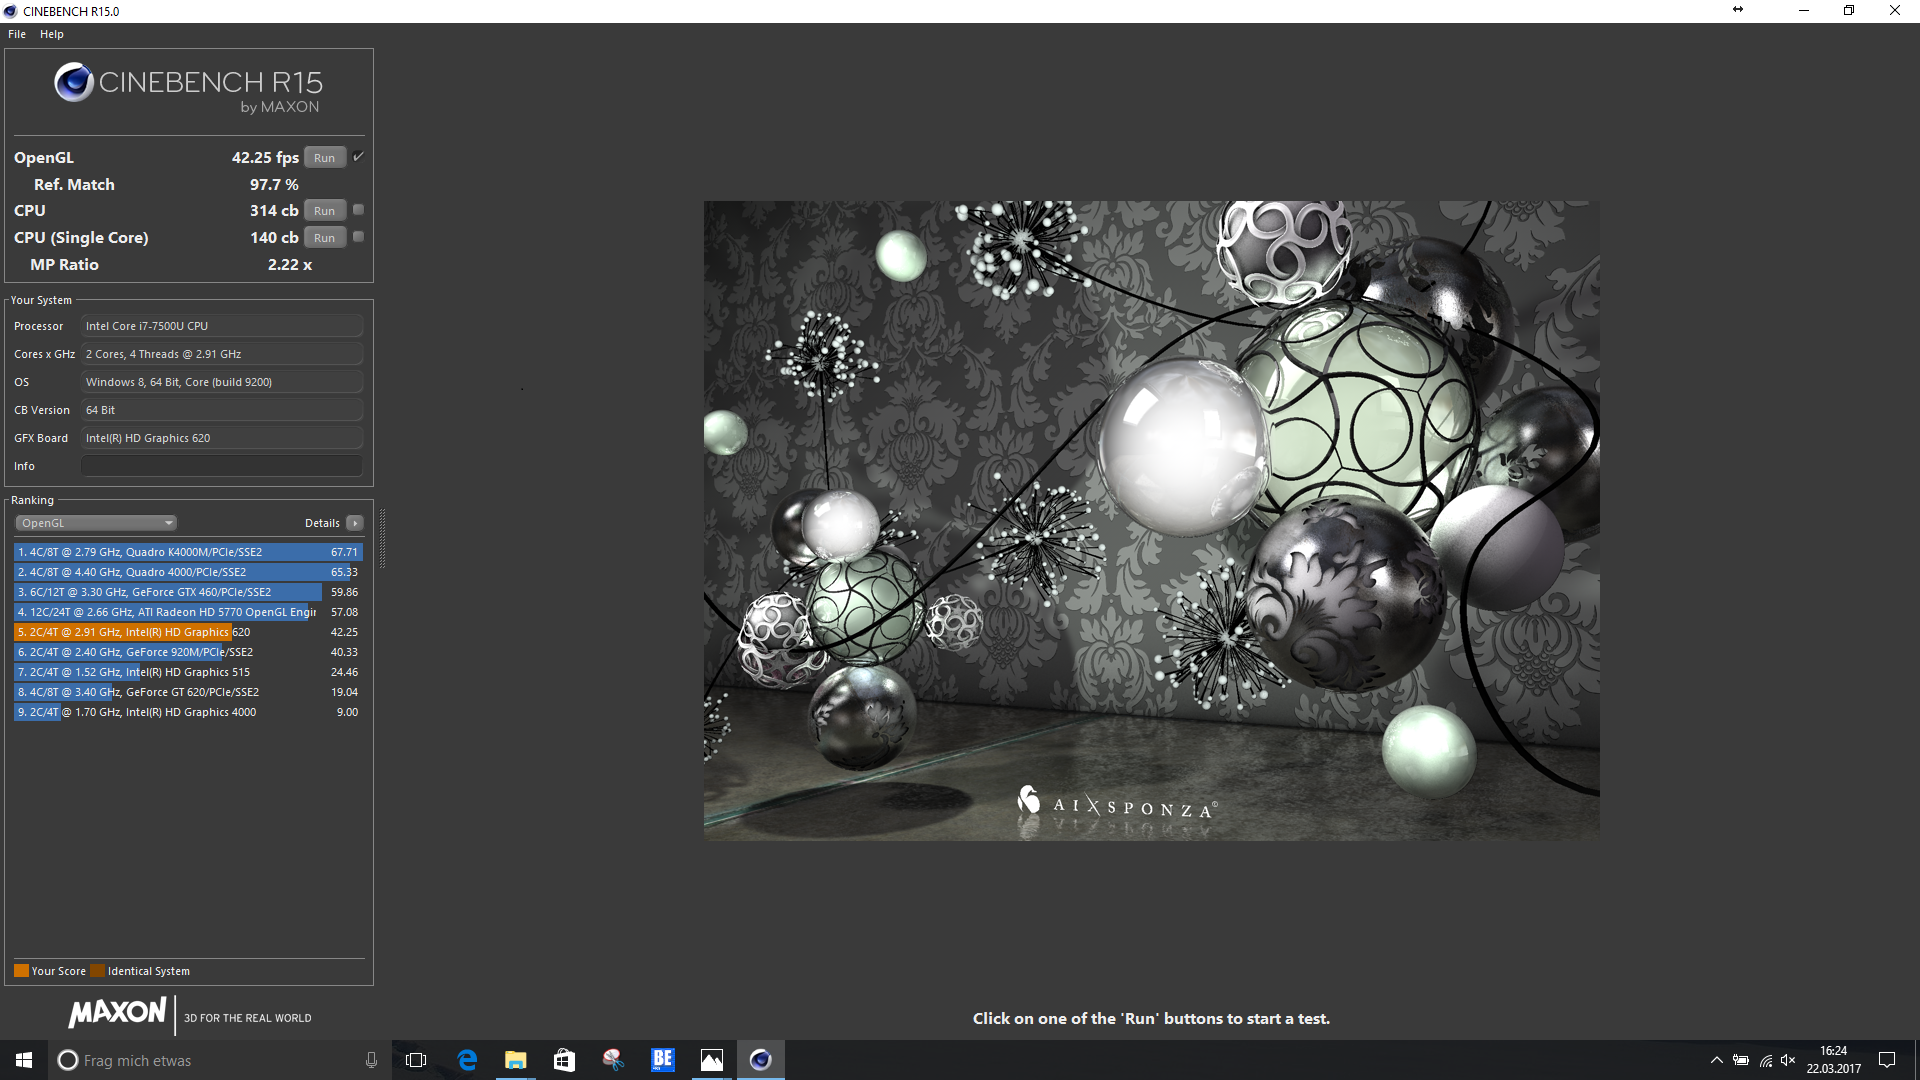
| Cinebench R15 | |
| CPU Single 64Bit | |
| HP Spectre 13-v131ng | |
| Apple MacBook Pro 13 2016 (2.9 GHz) | |
| HP Spectre 13 | |
| Dell XPS 13 9360 FHD i5 | |
| HP EliteBook 1030 G1-X2F03EA | |
| Asus Zenbook UX305CA-FB055T | |
| CPU Multi 64Bit | |
| Apple MacBook Pro 13 2016 (2.9 GHz) | |
| Dell XPS 13 9360 FHD i5 | |
| HP Spectre 13-v131ng | |
| HP EliteBook 1030 G1-X2F03EA | |
| HP Spectre 13 | |
| Asus Zenbook UX305CA-FB055T | |
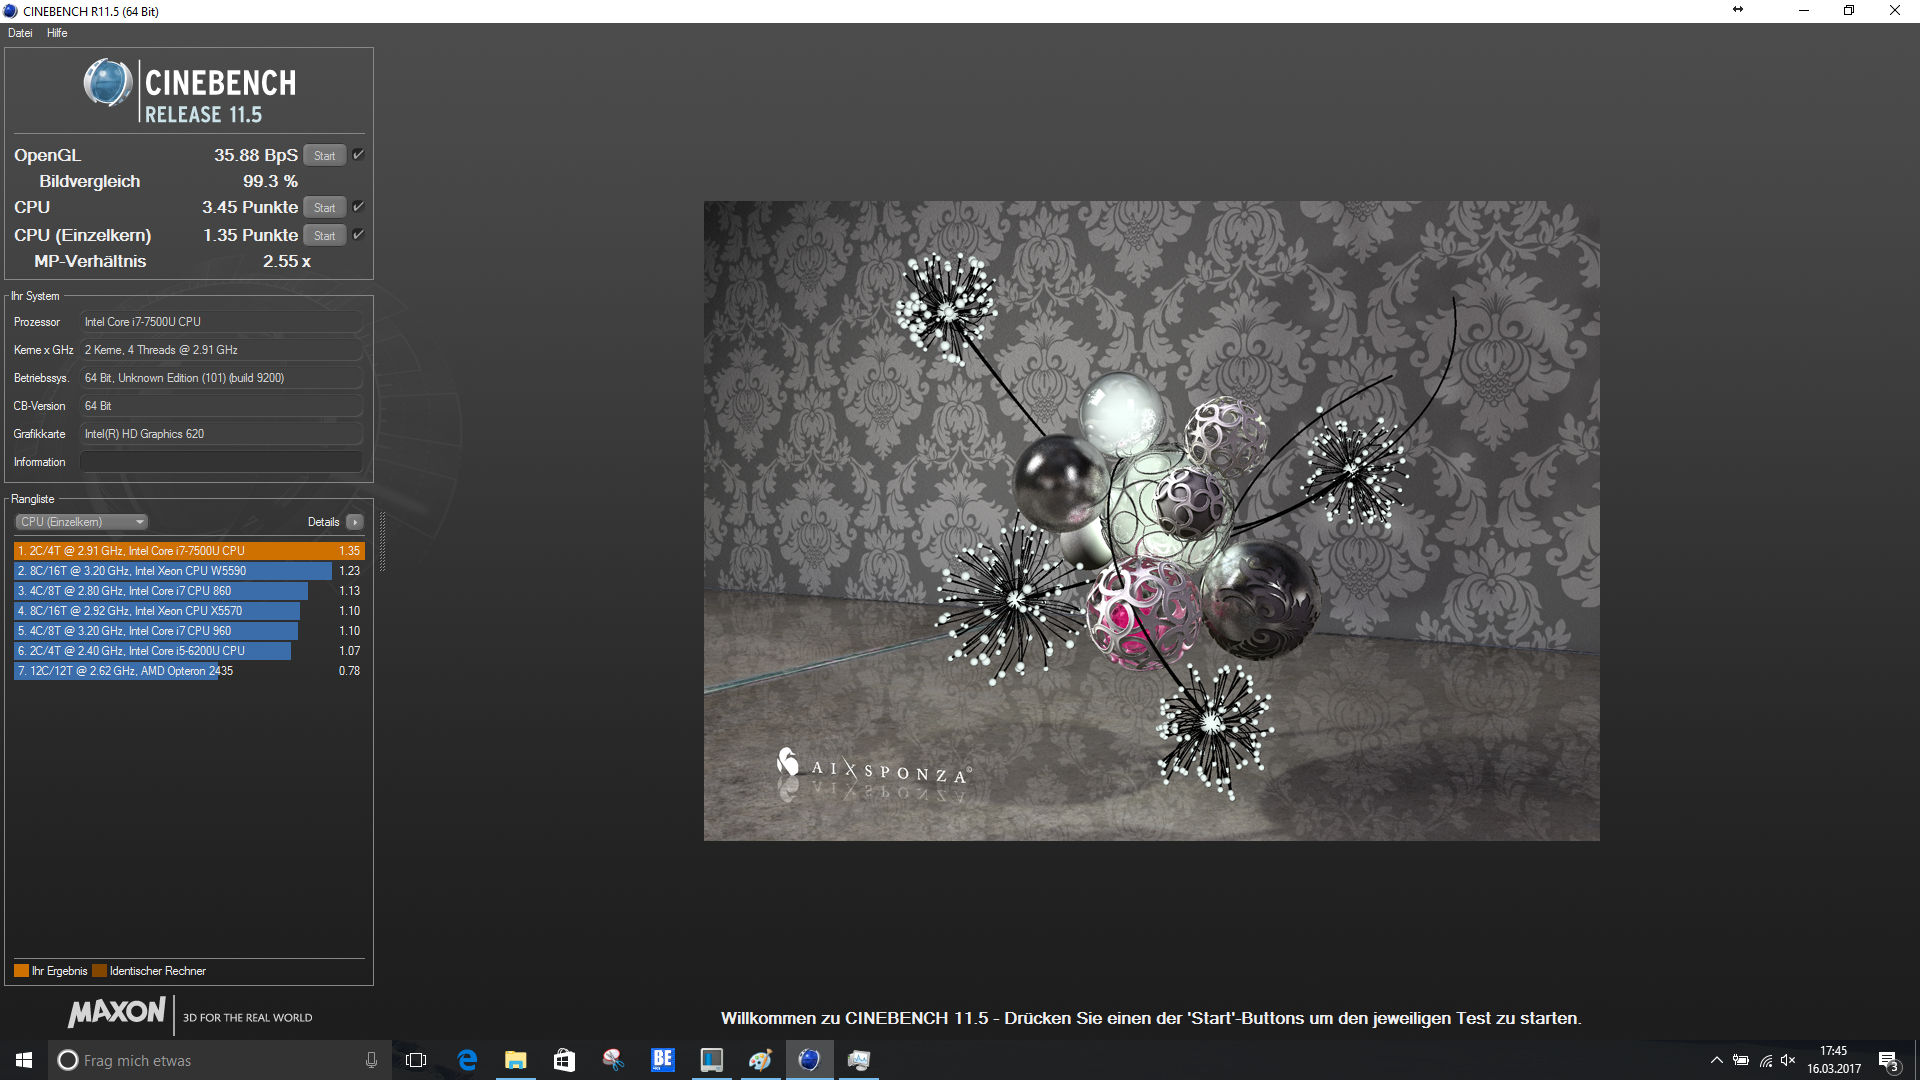
| Cinebench R11.5 | |
| CPU Single 64Bit | |
| Dell XPS 13 9360 FHD i5 | |
| HP Spectre 13 | |
| HP EliteBook 1030 G1-X2F03EA | |
| HP Spectre 13-v131ng | |
| Asus Zenbook UX305CA-FB055T | |
| CPU Multi 64Bit | |
| Dell XPS 13 9360 FHD i5 | |
| HP Spectre 13-v131ng | |
| HP EliteBook 1030 G1-X2F03EA | |
| HP Spectre 13 | |
| Asus Zenbook UX305CA-FB055T | |
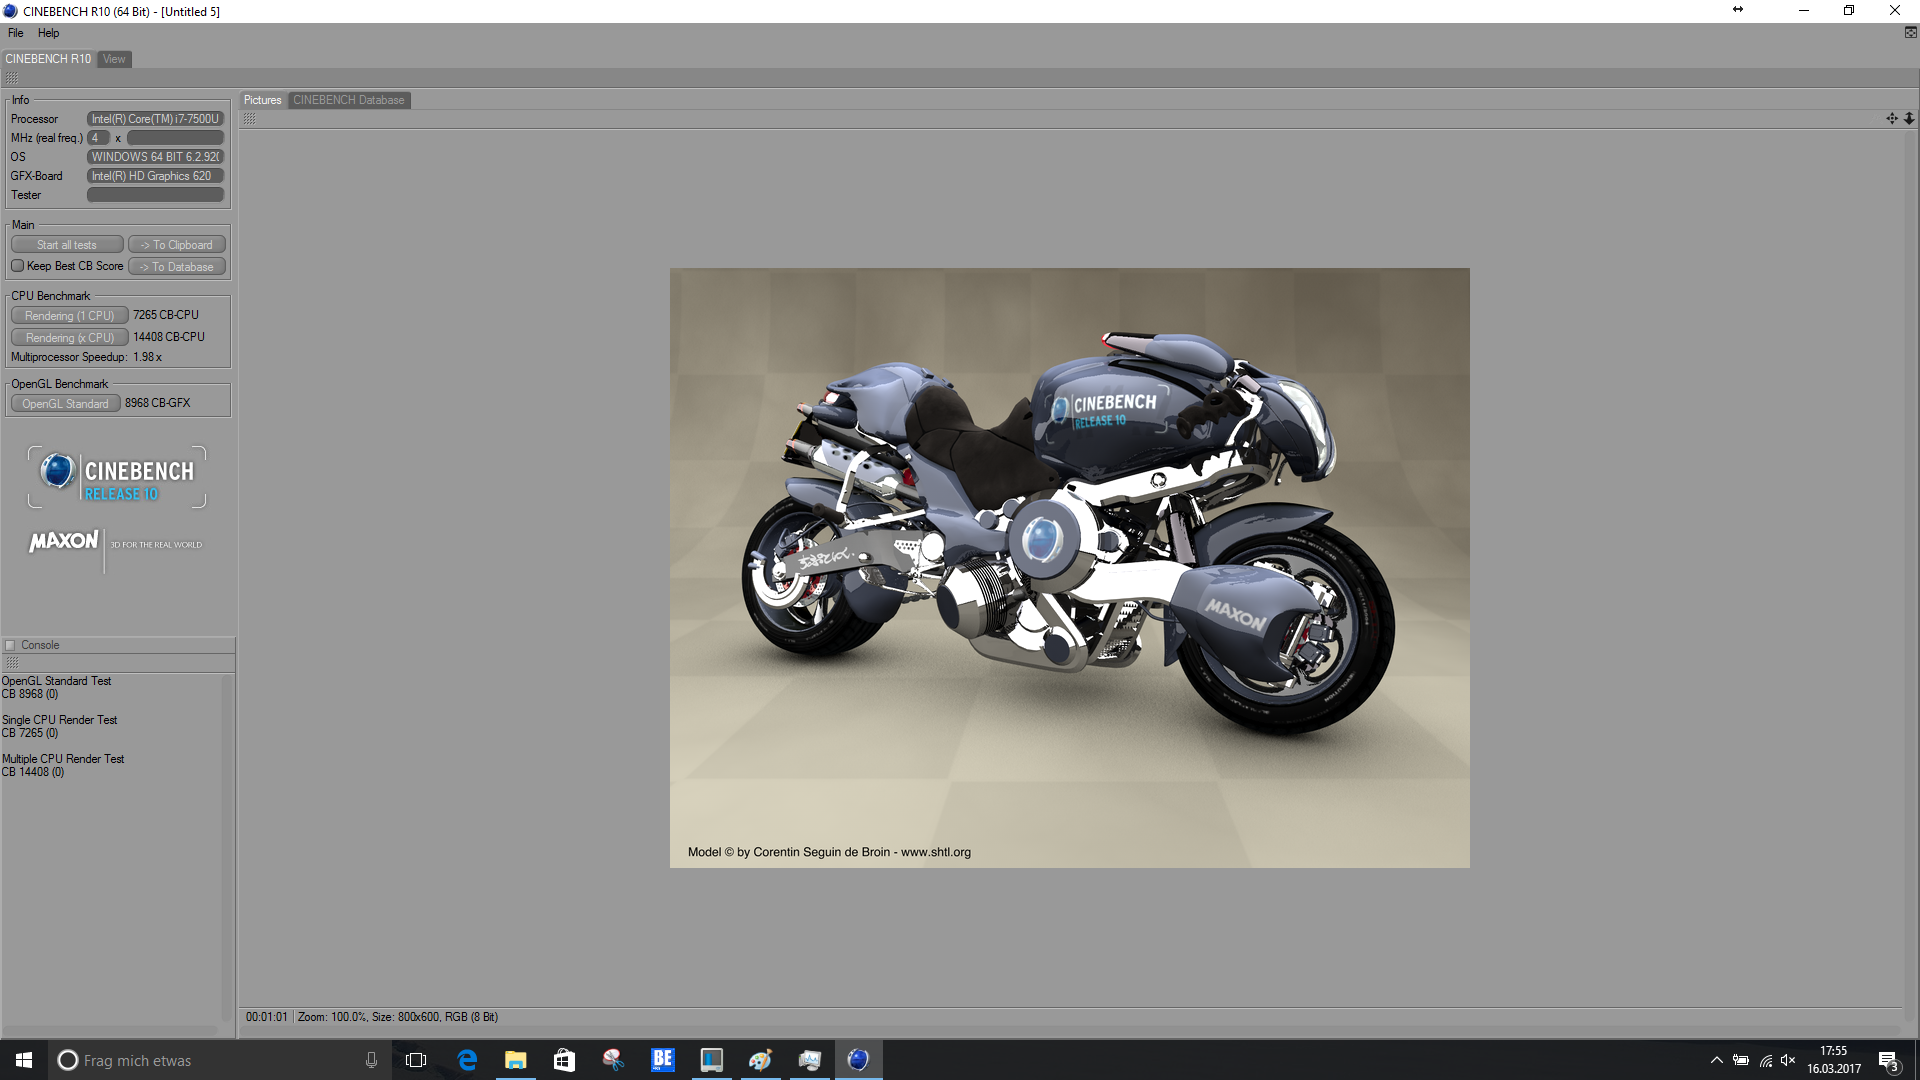
| Cinebench R10 | |
| Rendering Single CPUs 64Bit | |
| HP Spectre 13-v131ng | |
| Rendering Multiple CPUs 64Bit | |
| HP Spectre 13-v131ng | |
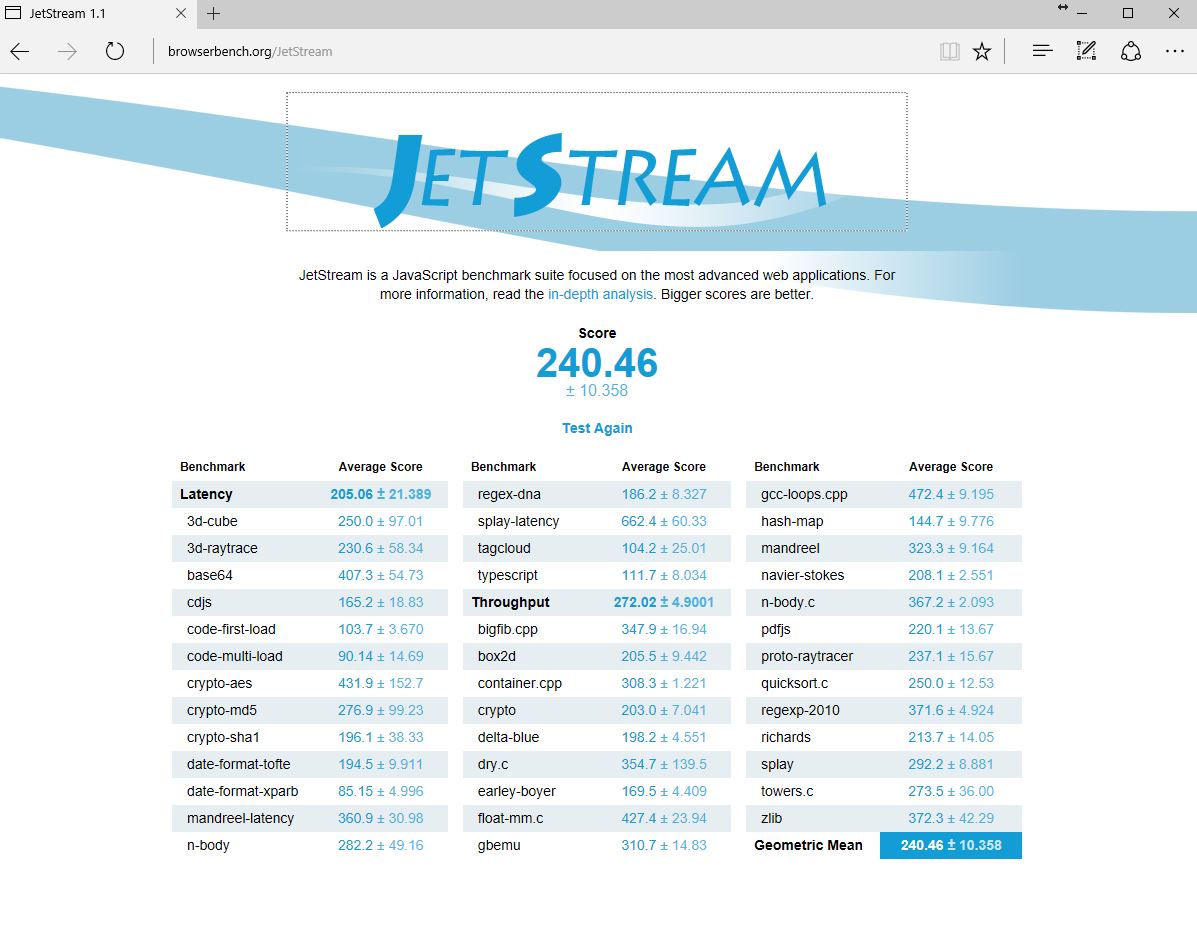
| JetStream 1.1 - 1.1 Total | |
| HP Spectre 13-v131ng | |
| Apple MacBook Pro 13 2016 (2.9 GHz) | |
| Apple MacBook Pro 13 2016 (2.9 GHz) | |
| HP EliteBook 1030 G1-X2F03EA | |
| Asus Zenbook UX305CA-FB055T | |
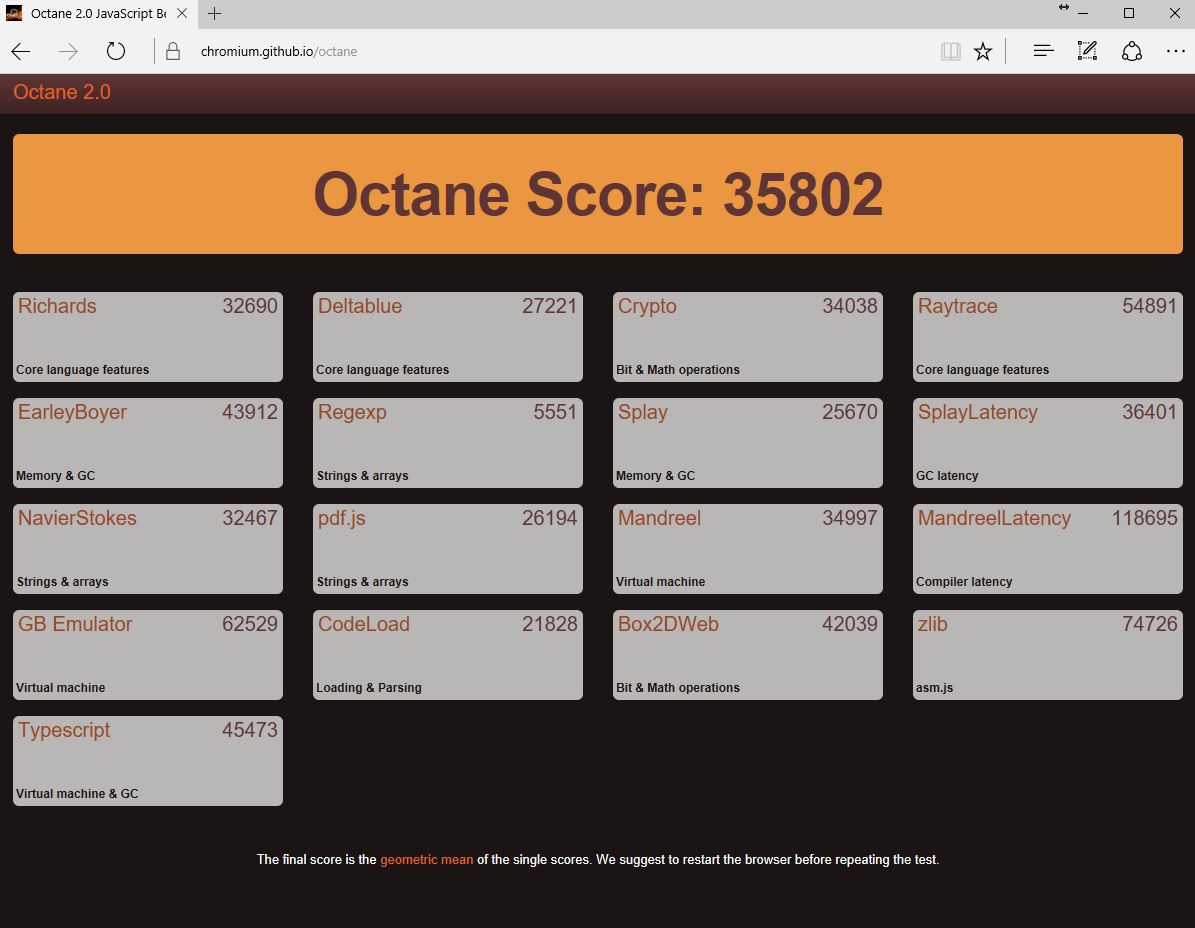
| Octane V2 - Total Score | |
| HP Spectre 13-v131ng | |
| Dell XPS 13 9360 FHD i5 | |
| HP EliteBook 1030 G1-X2F03EA | |
| Asus Zenbook UX305CA-FB055T | |
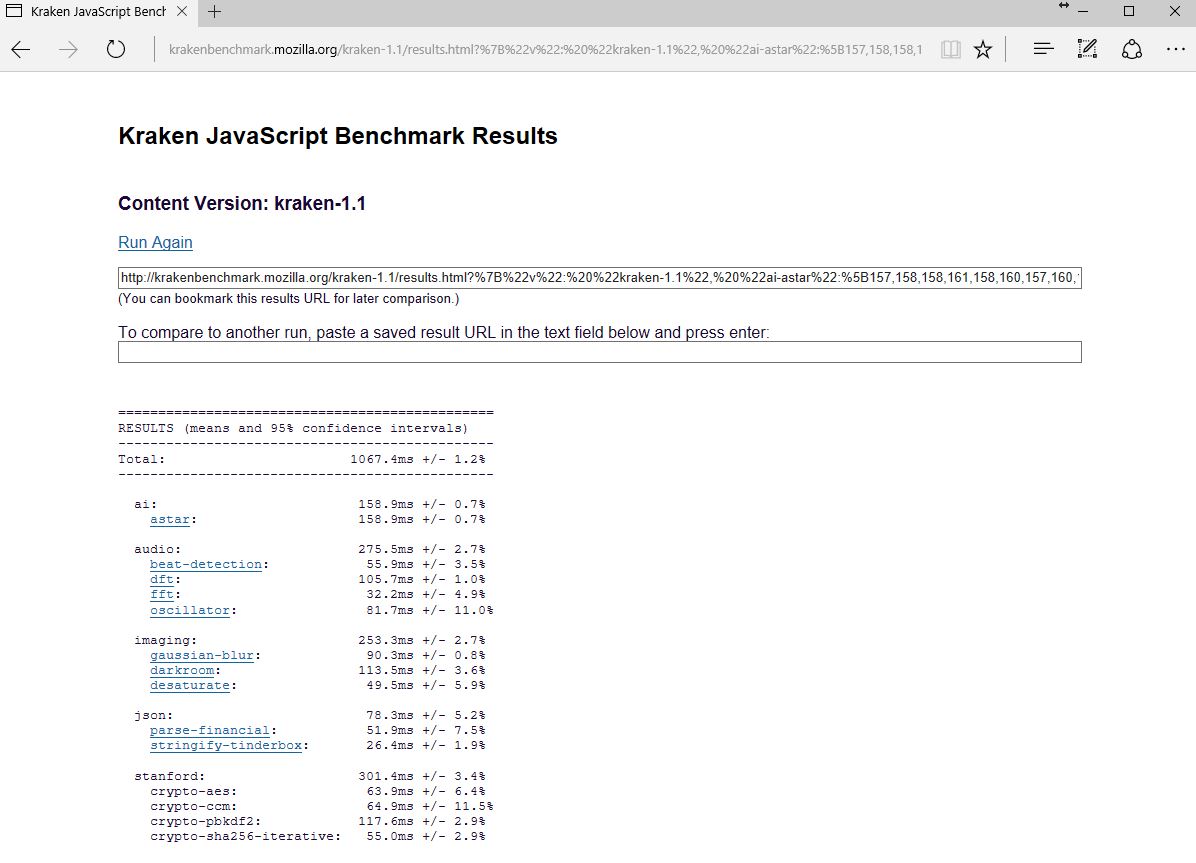
| Mozilla Kraken 1.1 - Total | |
| Asus Zenbook UX305CA-FB055T | |
| HP EliteBook 1030 G1-X2F03EA | |
| Apple MacBook Pro 13 2016 (2.9 GHz) | |
| Apple MacBook Pro 13 2016 (2.9 GHz) | |
| HP Spectre 13-v131ng | |
* ... smaller is better
| PCMark 8 | |
| Home Score Accelerated v2 | |
| HP Spectre 13-v131ng | |
| Apple MacBook Pro 13 2016 (2.9 GHz) | |
| HP Spectre 13 | |
| Dell XPS 13 9360 FHD i5 | |
| HP EliteBook 1030 G1-X2F03EA | |
| Asus Zenbook UX305CA-FB055T | |
| Work Score Accelerated v2 | |
| HP Spectre 13-v131ng | |
| Dell XPS 13 9360 FHD i5 | |
| HP Spectre 13 | |
| Apple MacBook Pro 13 2016 (2.9 GHz) | |
| HP EliteBook 1030 G1-X2F03EA | |
| Asus Zenbook UX305CA-FB055T | |
| Creative Score Accelerated v2 | |
| HP Spectre 13-v131ng | |
| HP Spectre 13 | |
| Dell XPS 13 9360 FHD i5 | |
| HP EliteBook 1030 G1-X2F03EA | |
| Asus Zenbook UX305CA-FB055T | |
| PCMark 7 | |
| Score | |
| HP Spectre 13-v131ng | |
| HP EliteBook 1030 G1-X2F03EA | |
| Asus Zenbook UX305CA-FB055T | |
| Productivity | |
| HP Spectre 13-v131ng | |
| Asus Zenbook UX305CA-FB055T | |
| HP EliteBook 1030 G1-X2F03EA | |
| PCMark Vantage Result | 17414 points | |
| PCMark 7 Score | 5610 points | |
| PCMark 8 Home Score Accelerated v2 | 3789 points | |
| PCMark 8 Creative Score Accelerated v2 | 4655 points | |
| PCMark 8 Work Score Accelerated v2 | 5053 points | |
Help | ||
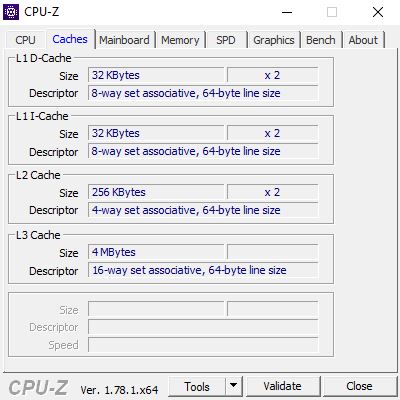
| HP Spectre 13-v131ng Samsung PM961 NVMe MZVLW512HMJP | HP Spectre 13 Samsung PM951 NVMe MZVLV256 | Apple MacBook Pro 13 2016 (2.9 GHz) Apple SSD AP0256 | Dell XPS 13 9360 FHD i5 Toshiba NVMe THNSN5256GPUK | Asus Zenbook UX305CA-FB055T Micron M600 MTFDDAV512MBF M.2 | HP EliteBook 1030 G1-X2F03EA Sandisk X300 SD7SN6S-512G-1006 | |
|---|---|---|---|---|---|---|
| CrystalDiskMark 3.0 | -28% | 9% | -19% | -49% | -56% | |
| Read Seq (MB/s) | 1090 | 1322 21% | 1662 52% | 1233 13% | 475.2 -56% | 387.5 -64% |
| Write Seq (MB/s) | 1088 | 305.5 -72% | 1336 23% | 733 -33% | 423.7 -61% | 348.7 -68% |
| Read 512 (MB/s) | 753 | 621 -18% | 1183 57% | 1036 38% | 404.8 -46% | 239.9 -68% |
| Write 512 (MB/s) | 911 | 306 -66% | 1481 63% | 439.9 -52% | 396.2 -57% | 335.3 -63% |
| Read 4k (MB/s) | 57.5 | 40.09 -30% | 16.1 -72% | 29.31 -49% | 28.57 -50% | 30.34 -47% |
| Write 4k (MB/s) | 140.2 | 119 -15% | 23.5 -83% | 116.9 -17% | 90.7 -35% | 75.9 -46% |
| Read 4k QD32 (MB/s) | 497.1 | 513 3% | 657 32% | 479.2 -4% | 288.9 -42% | 311.3 -37% |
| Write 4k QD32 (MB/s) | 416 | 231.5 -44% | 419 1% | 218.3 -48% | 242.3 -42% | 192.8 -54% |

| 3DMark | |
| 1280x720 Cloud Gate Standard Graphics | |
| Apple MacBook Pro 13 2016 (2.9 GHz) | |
| Dell XPS 13 9360 FHD i5 | |
| HP Spectre 13-v131ng | |
| HP Spectre 13 | |
| HP EliteBook 1030 G1-X2F03EA | |
| Asus Zenbook UX305CA-FB055T | |
| 1920x1080 Fire Strike Graphics | |
| Apple MacBook Pro 13 2016 (2.9 GHz) | |
| Dell XPS 13 9360 FHD i5 | |
| HP Spectre 13-v131ng | |
| HP Spectre 13 | |
| HP EliteBook 1030 G1-X2F03EA | |
| Asus Zenbook UX305CA-FB055T | |
| 3DMark 11 - 1280x720 Performance GPU | |
| Apple MacBook Pro 13 2016 (2.9 GHz) | |
| HP Spectre 13-v131ng | |
| Dell XPS 13 9360 FHD i5 | |
| HP Spectre 13 | |
| HP EliteBook 1030 G1-X2F03EA | |
| Asus Zenbook UX305CA-FB055T | |
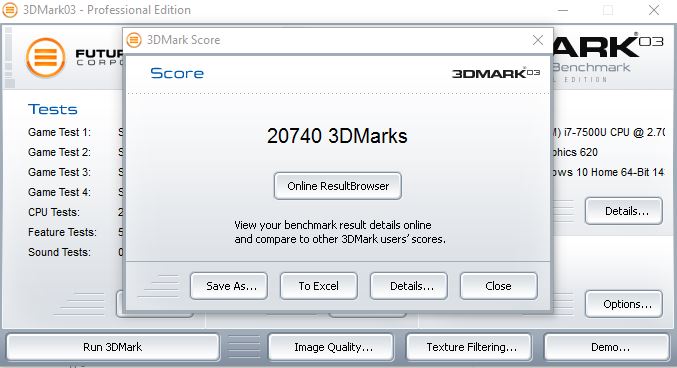
| 3DMark 03 Standard | 20740 points | |
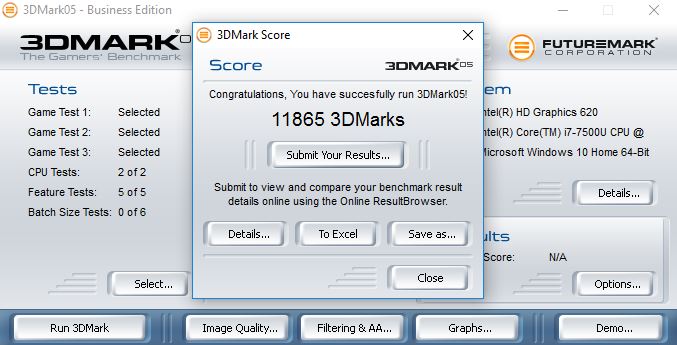
| 3DMark 05 Standard | 11865 points | |
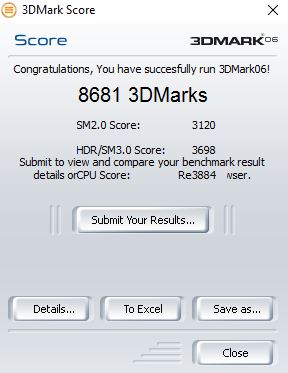
| 3DMark 06 Standard Score | 8681 points | |
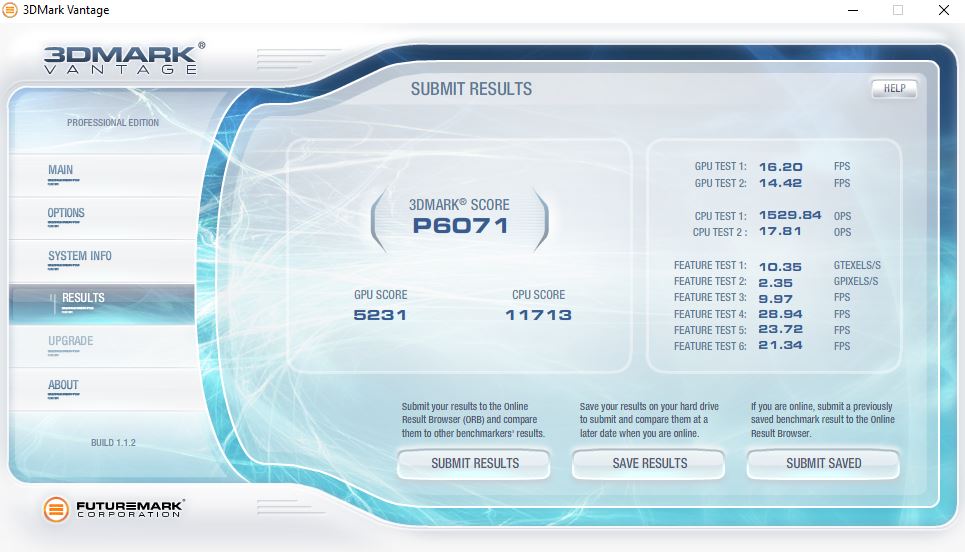
| 3DMark Vantage P Result | 6071 points | |
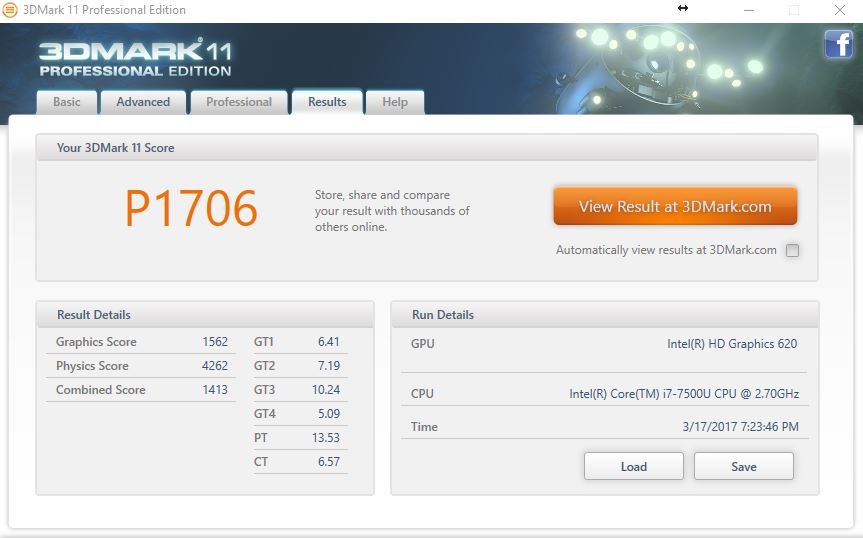
| 3DMark 11 Performance | 1706 points | |
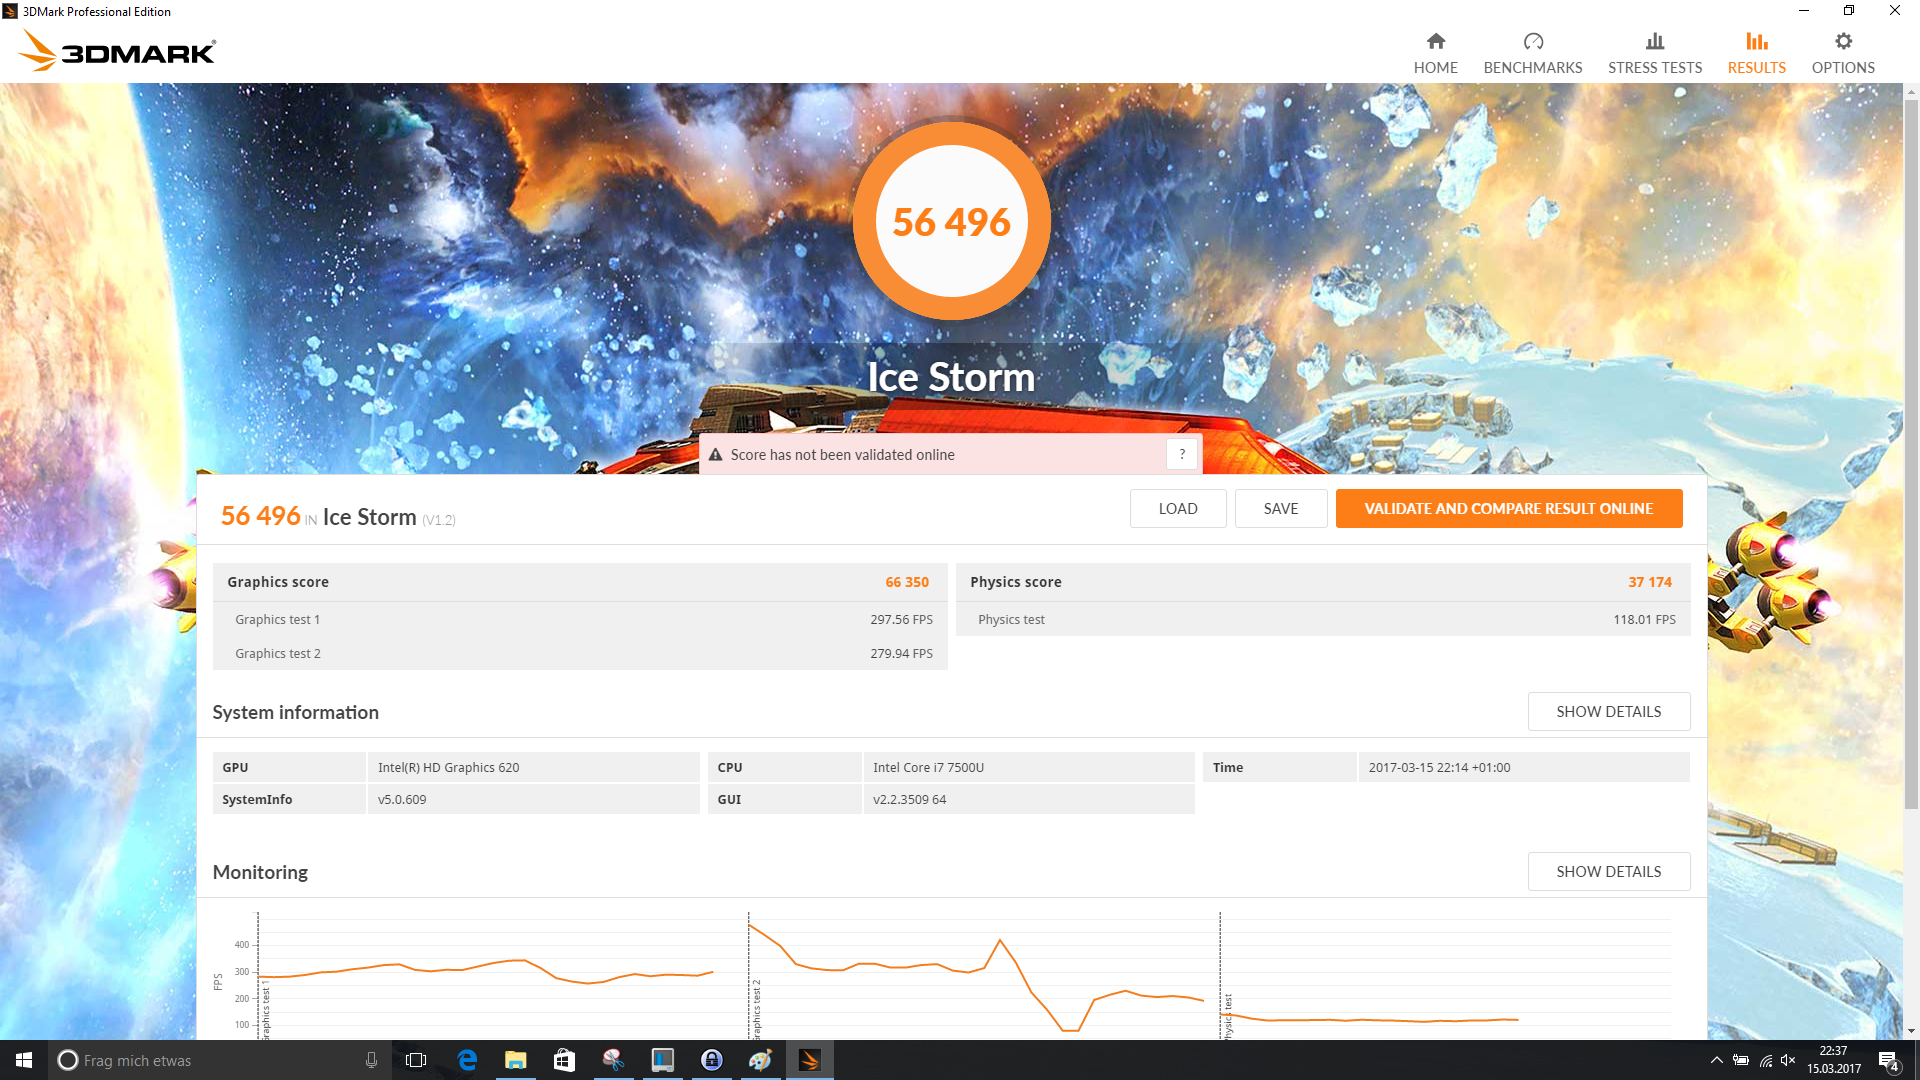
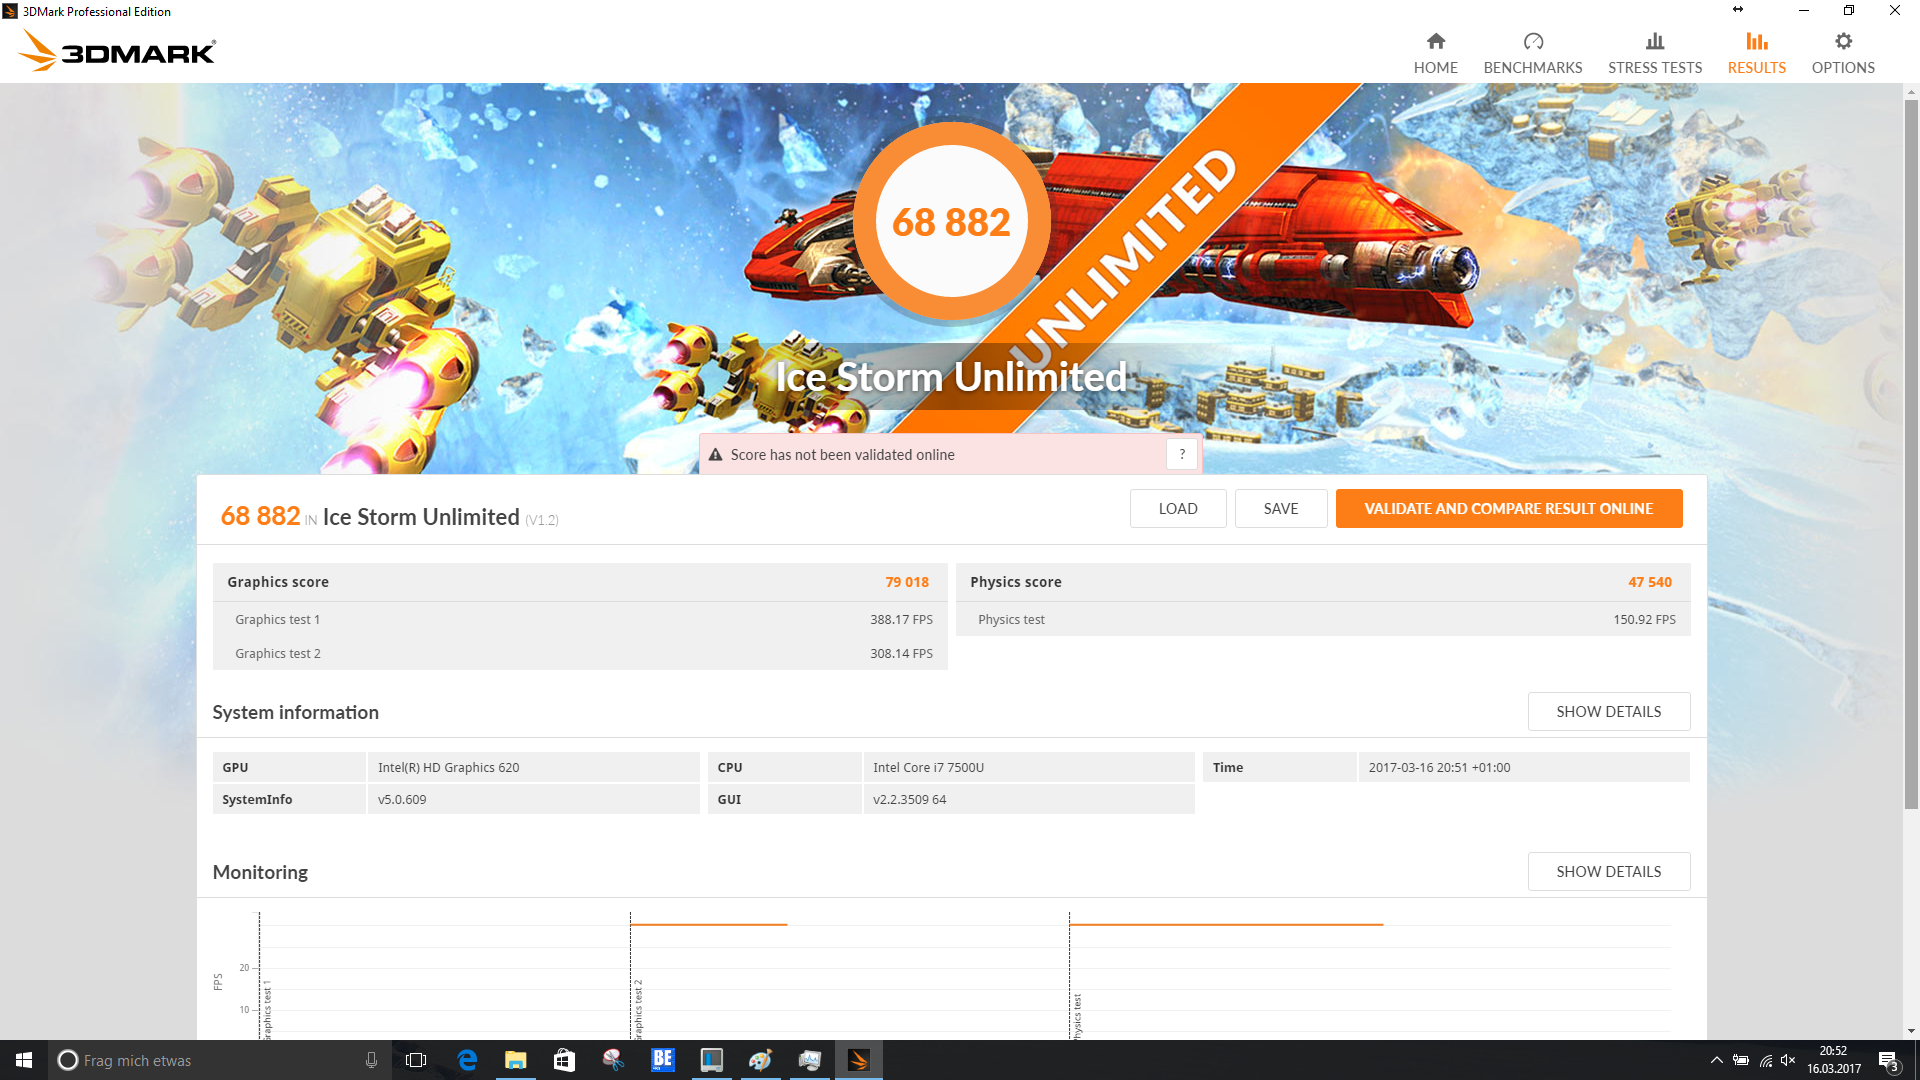
| 3DMark Ice Storm Standard Score | 56496 points | |
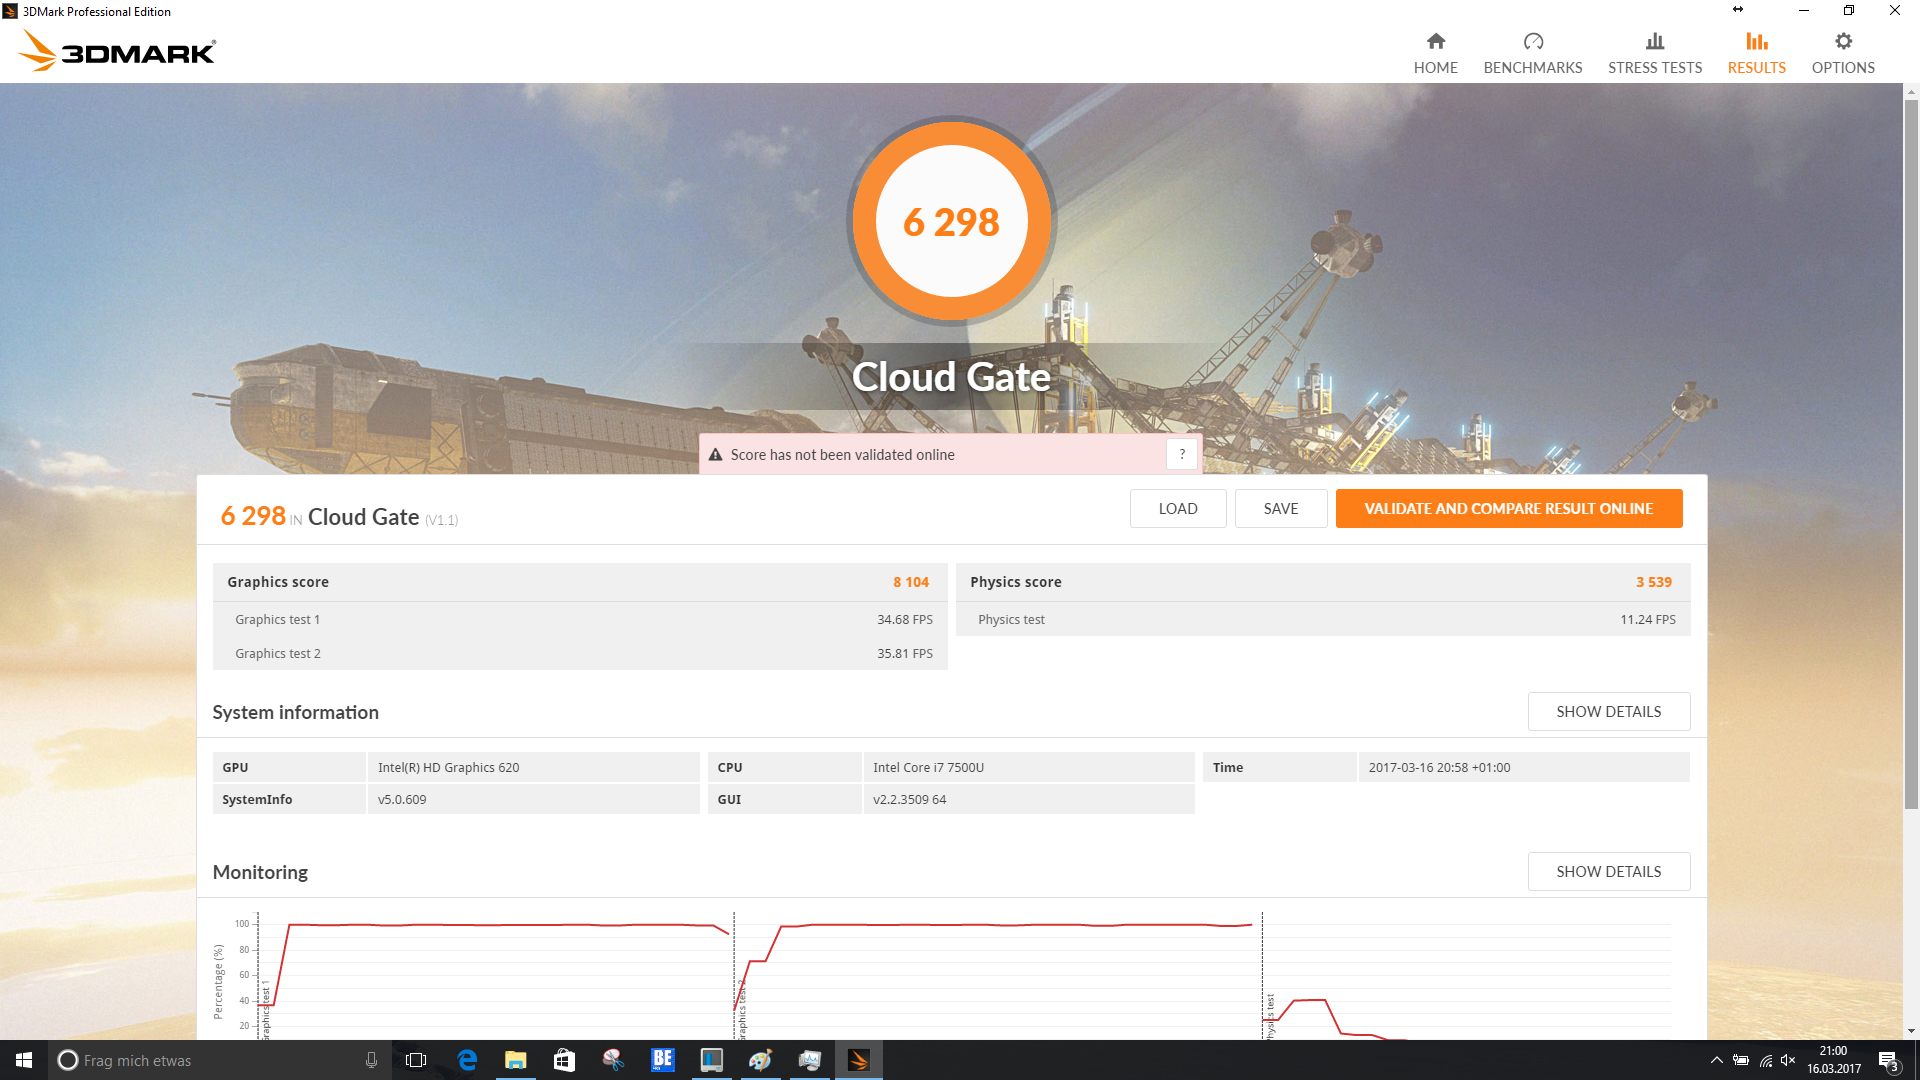
| 3DMark Cloud Gate Standard Score | 6298 points | |
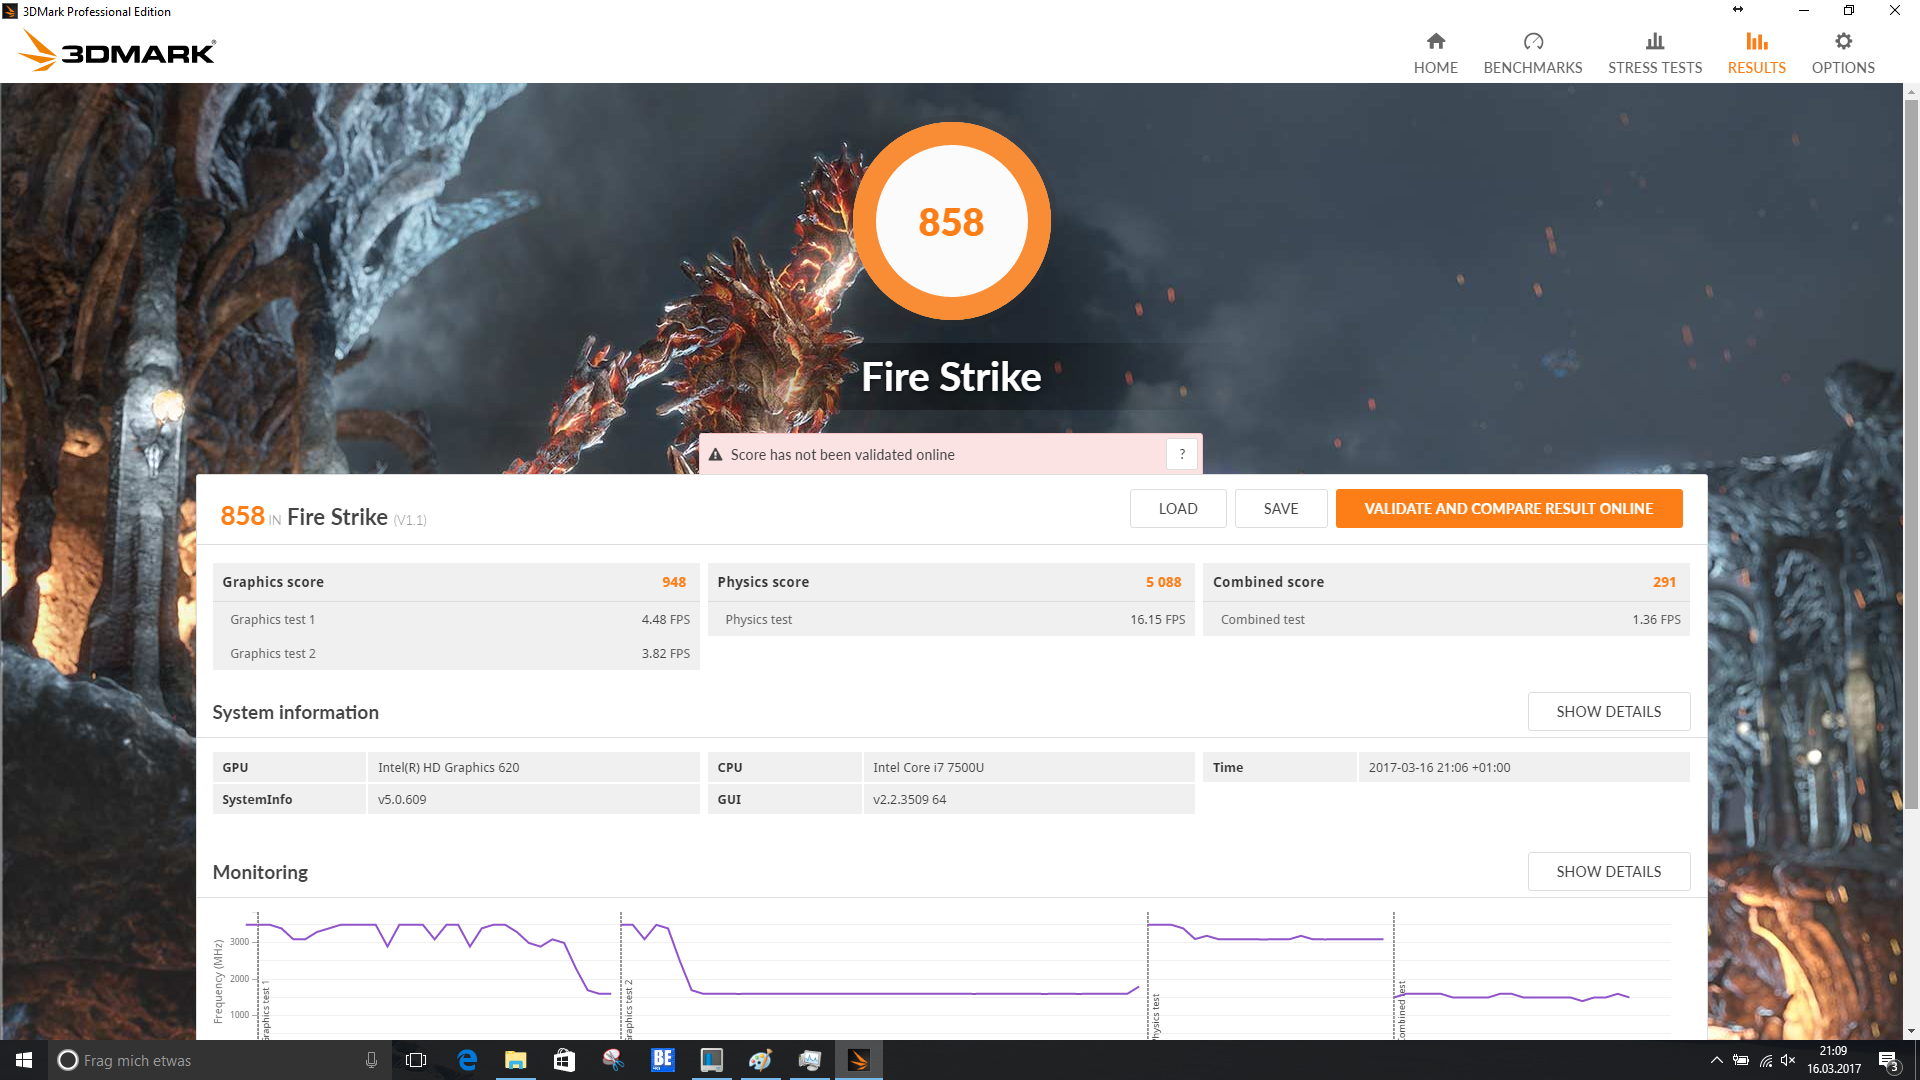
| 3DMark Fire Strike Score | 858 points | |
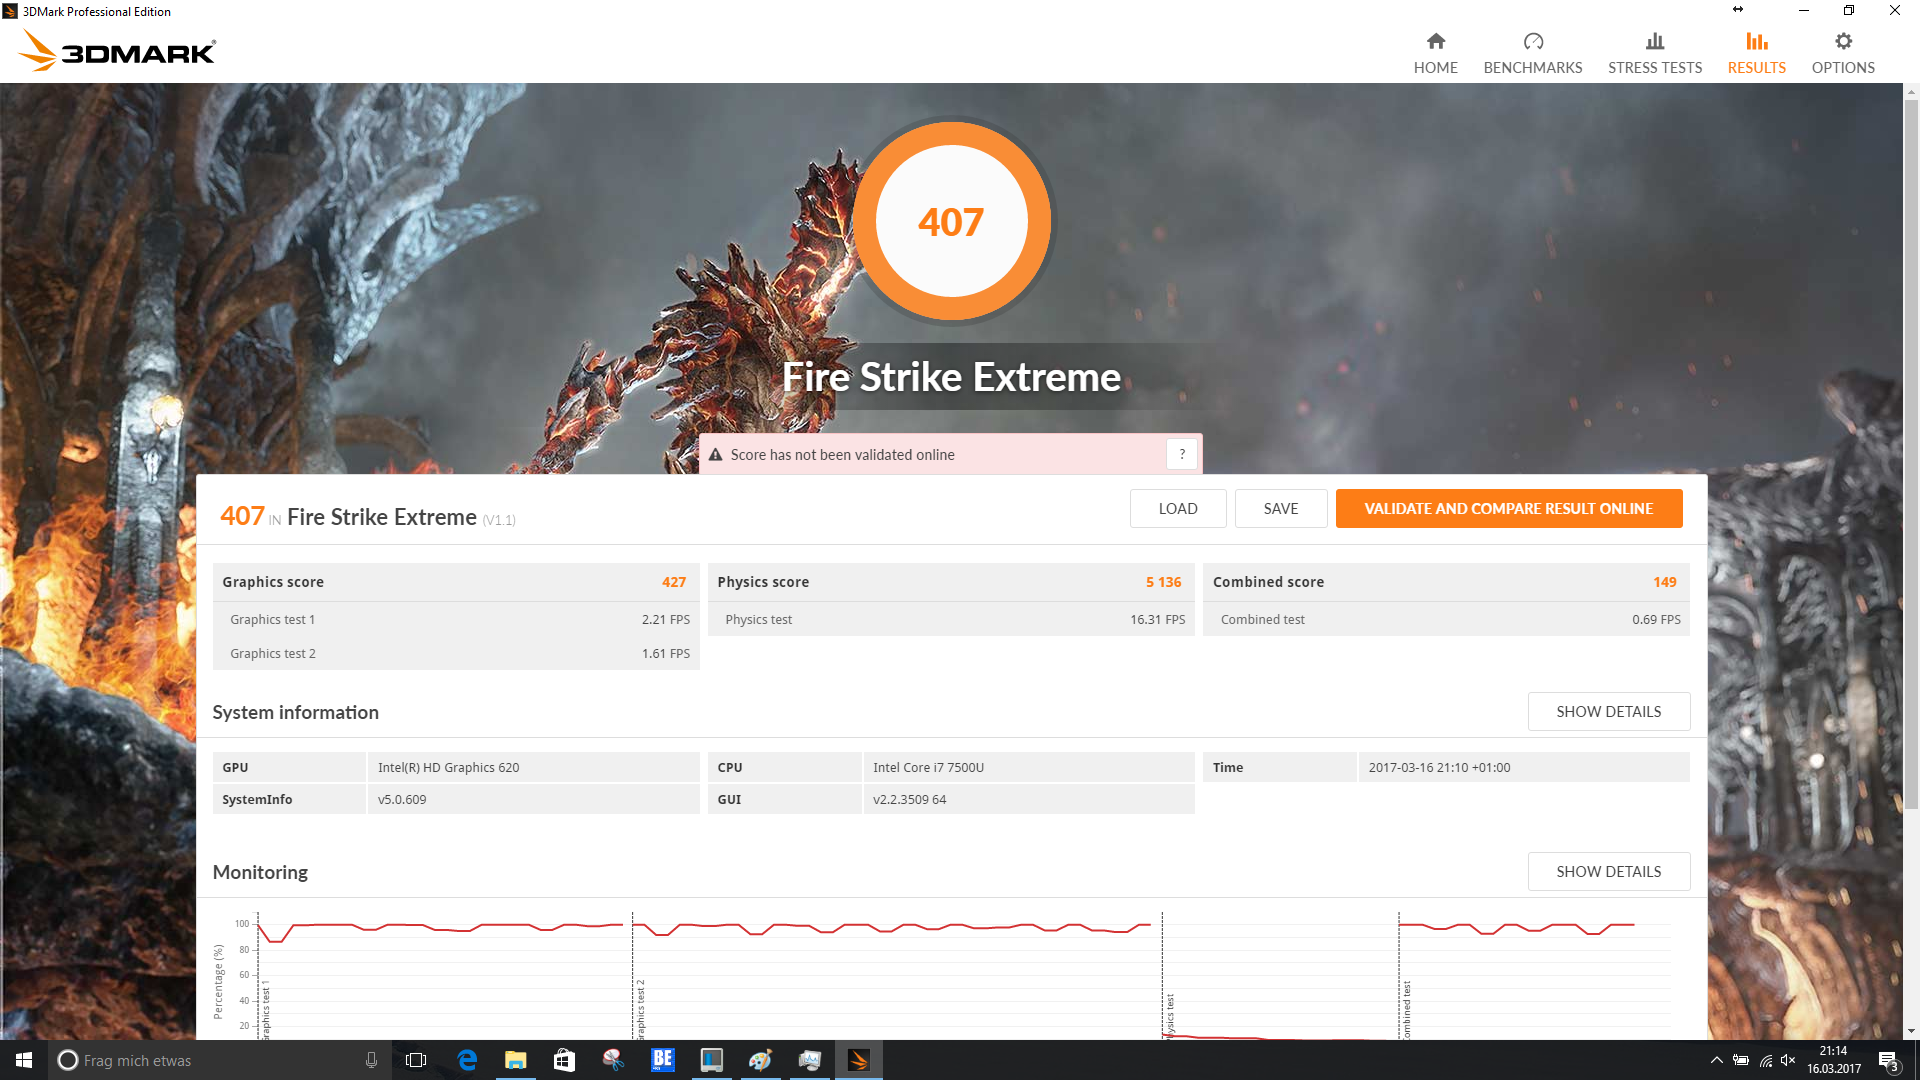
| 3DMark Fire Strike Extreme Score | 407 points | |
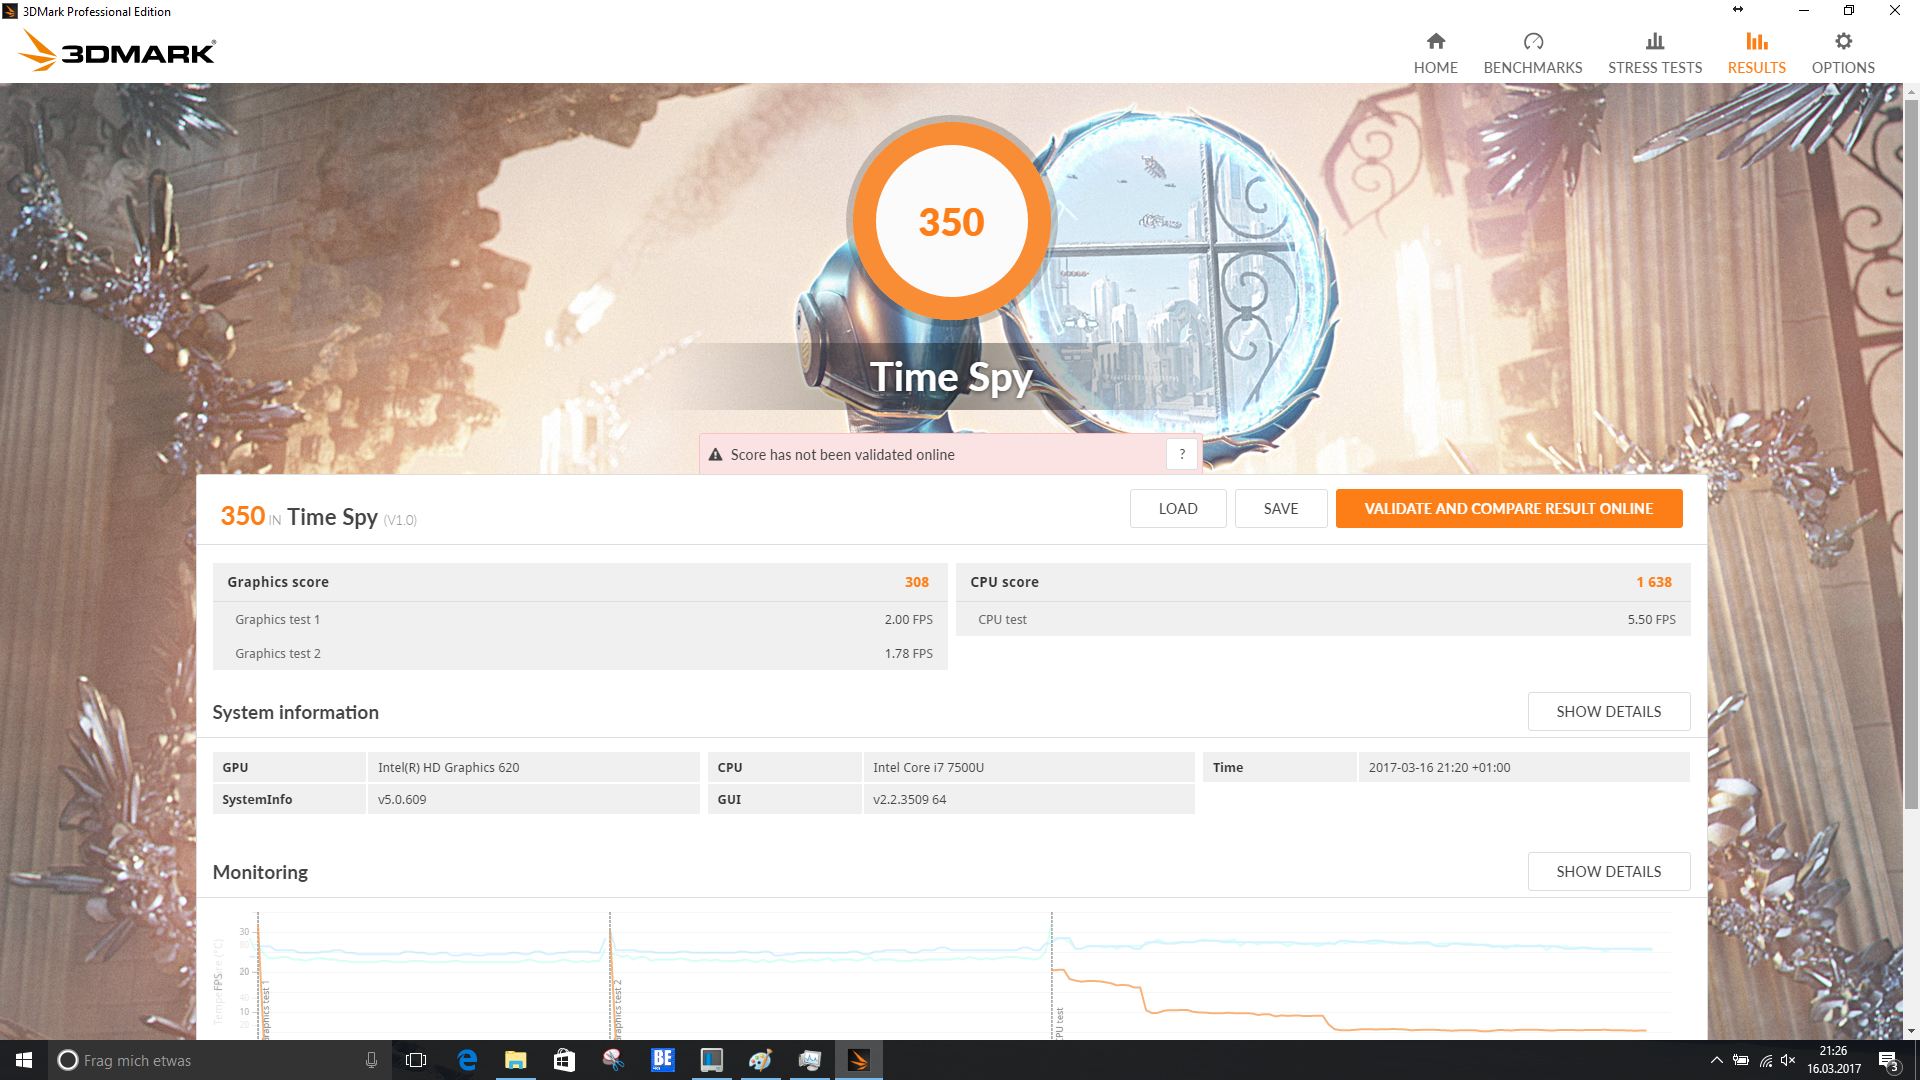
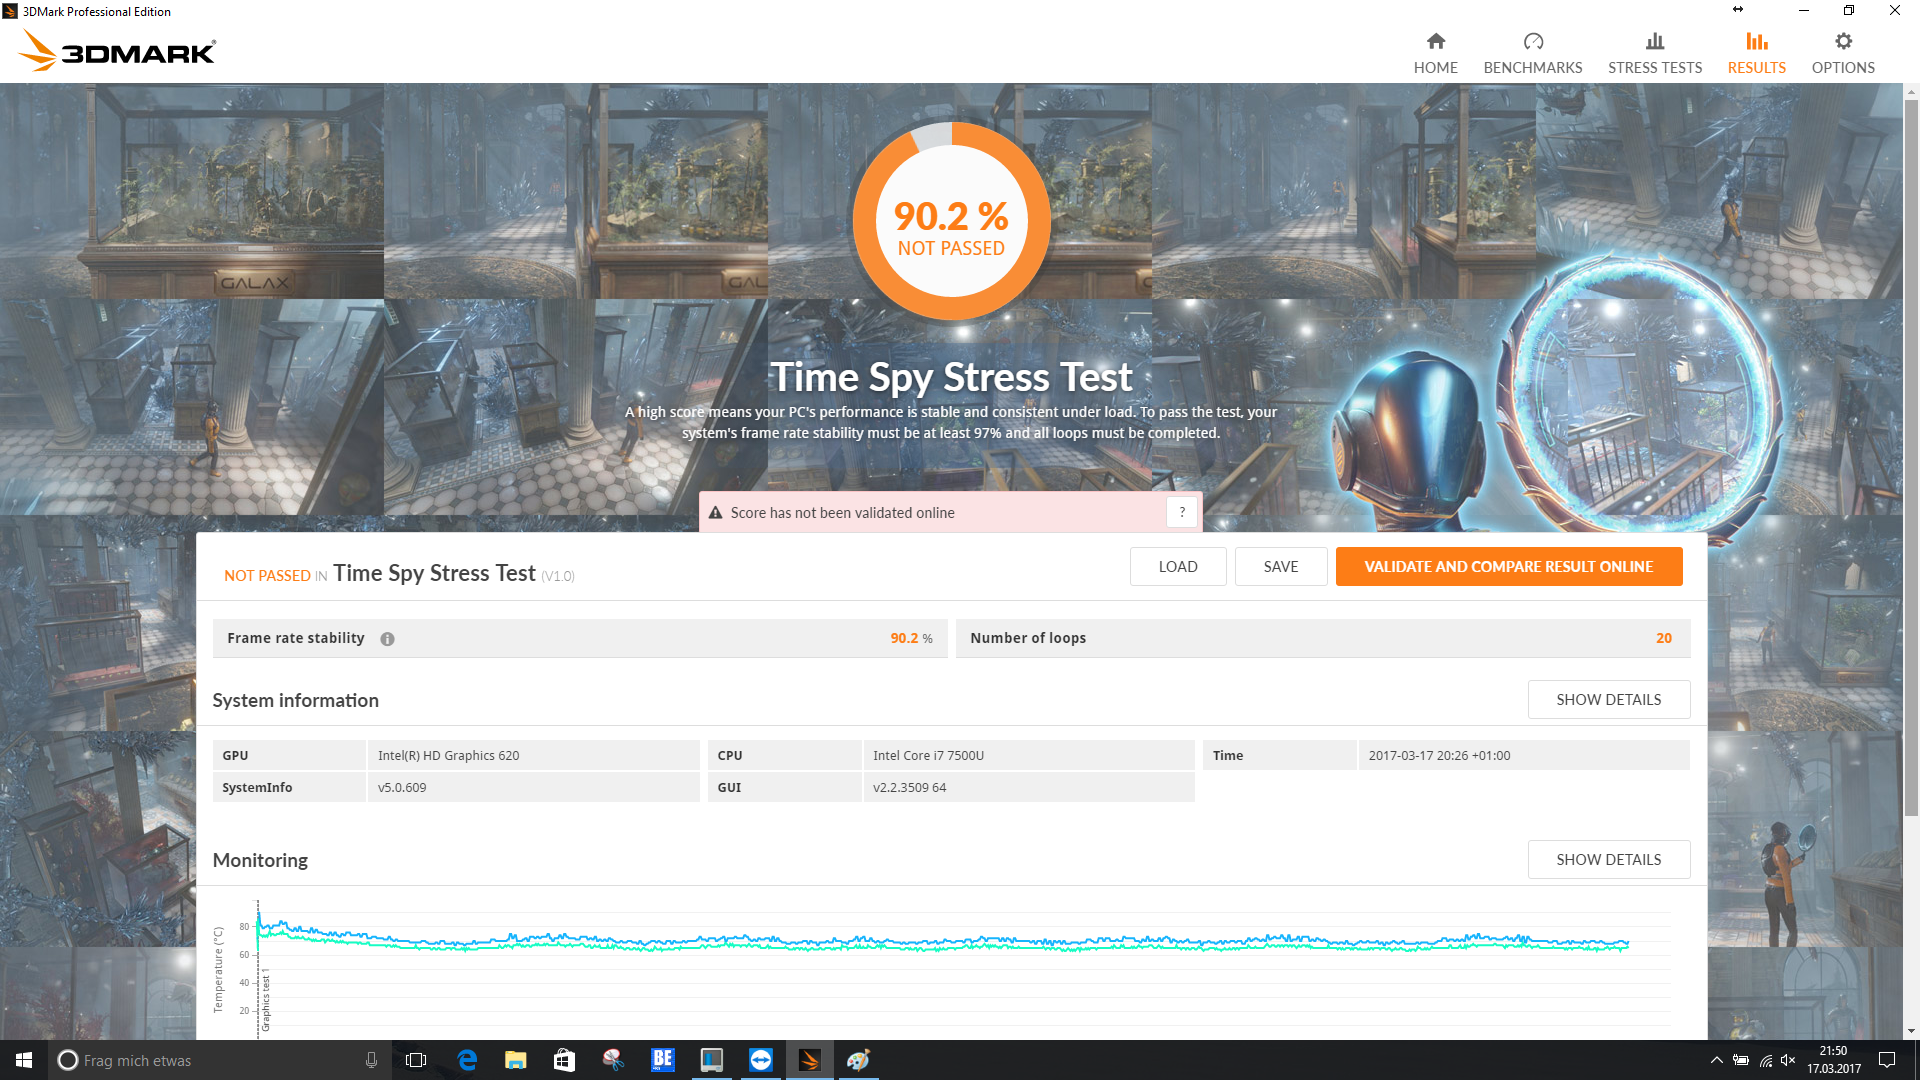
| 3DMark Time Spy Score | 350 points | |
Help | ||
| low | med. | high | ultra | |
|---|---|---|---|---|
| BioShock Infinite (2013) | 46.9 | 29.3 | 24.6 | 7.8 |
| Battlefield 4 (2013) | 35 | 27 | 17 | 6 |
| The Witcher 3 (2015) | 13 | 9 | 4 | |
| Rise of the Tomb Raider (2016) | 15 | 8 | 6 |
Noise level
| Idle |
| 30.4 / 30.4 / 30.4 dB(A) |
| Load |
| 40 / 40 dB(A) |
 | ||
30 dB silent 40 dB(A) audible 50 dB(A) loud |
||
min: | ||
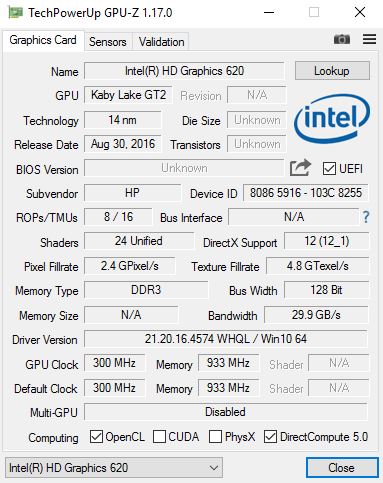
| HP Spectre 13-v131ng i7-7500U, HD Graphics 620 | HP Spectre 13 6500U, HD Graphics 520 | Apple MacBook Pro 13 2016 (2.9 GHz) 6267U, Iris Graphics 550 | Dell XPS 13 9360 FHD i5 i5-7200U, HD Graphics 620 | Asus Zenbook UX305CA-FB055T 6Y75, HD Graphics 515 | HP EliteBook 1030 G1-X2F03EA 6Y75, HD Graphics 515 | |
|---|---|---|---|---|---|---|
| Noise | 1% | 5% | 11% | 5% | ||
| off / environment * (dB) | 30.4 | 28.5 6% | 30.2 1% | 31.3 -3% | ||
| Idle Minimum * (dB) | 30.4 | 28.5 6% | 30.2 1% | 28.9 5% | 31.3 -3% | |
| Idle Average * (dB) | 30.4 | 30.9 -2% | 30.2 1% | 28.9 5% | 31.3 -3% | |
| Idle Maximum * (dB) | 30.4 | 31.6 -4% | 30.2 1% | 28.9 5% | 31.3 -3% | |
| Load Average * (dB) | 40 | 38.8 3% | 33 17% | 30.9 23% | 31.3 22% | |
| Load Maximum * (dB) | 40 | 41.4 -3% | 36.2 9% | 33.5 16% | 31.3 22% |
* ... smaller is better

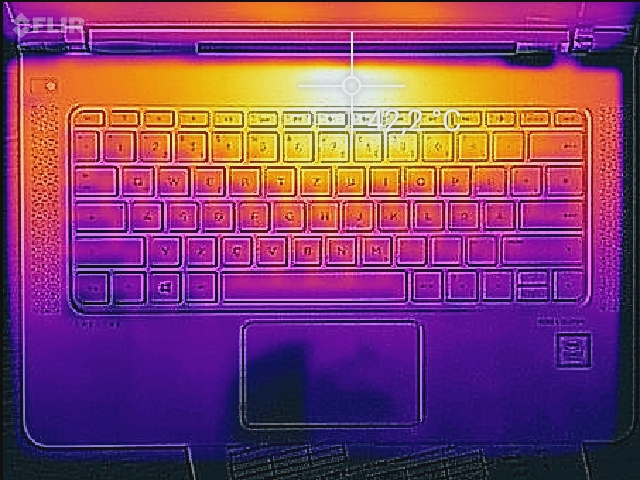
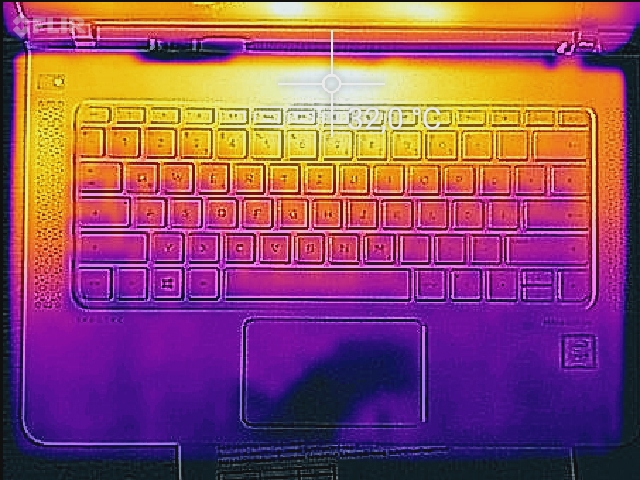
(-) The maximum temperature on the upper side is 54.2 °C / 130 F, compared to the average of 35.9 °C / 97 F, ranging from 21.4 to 59 °C for the class Subnotebook.
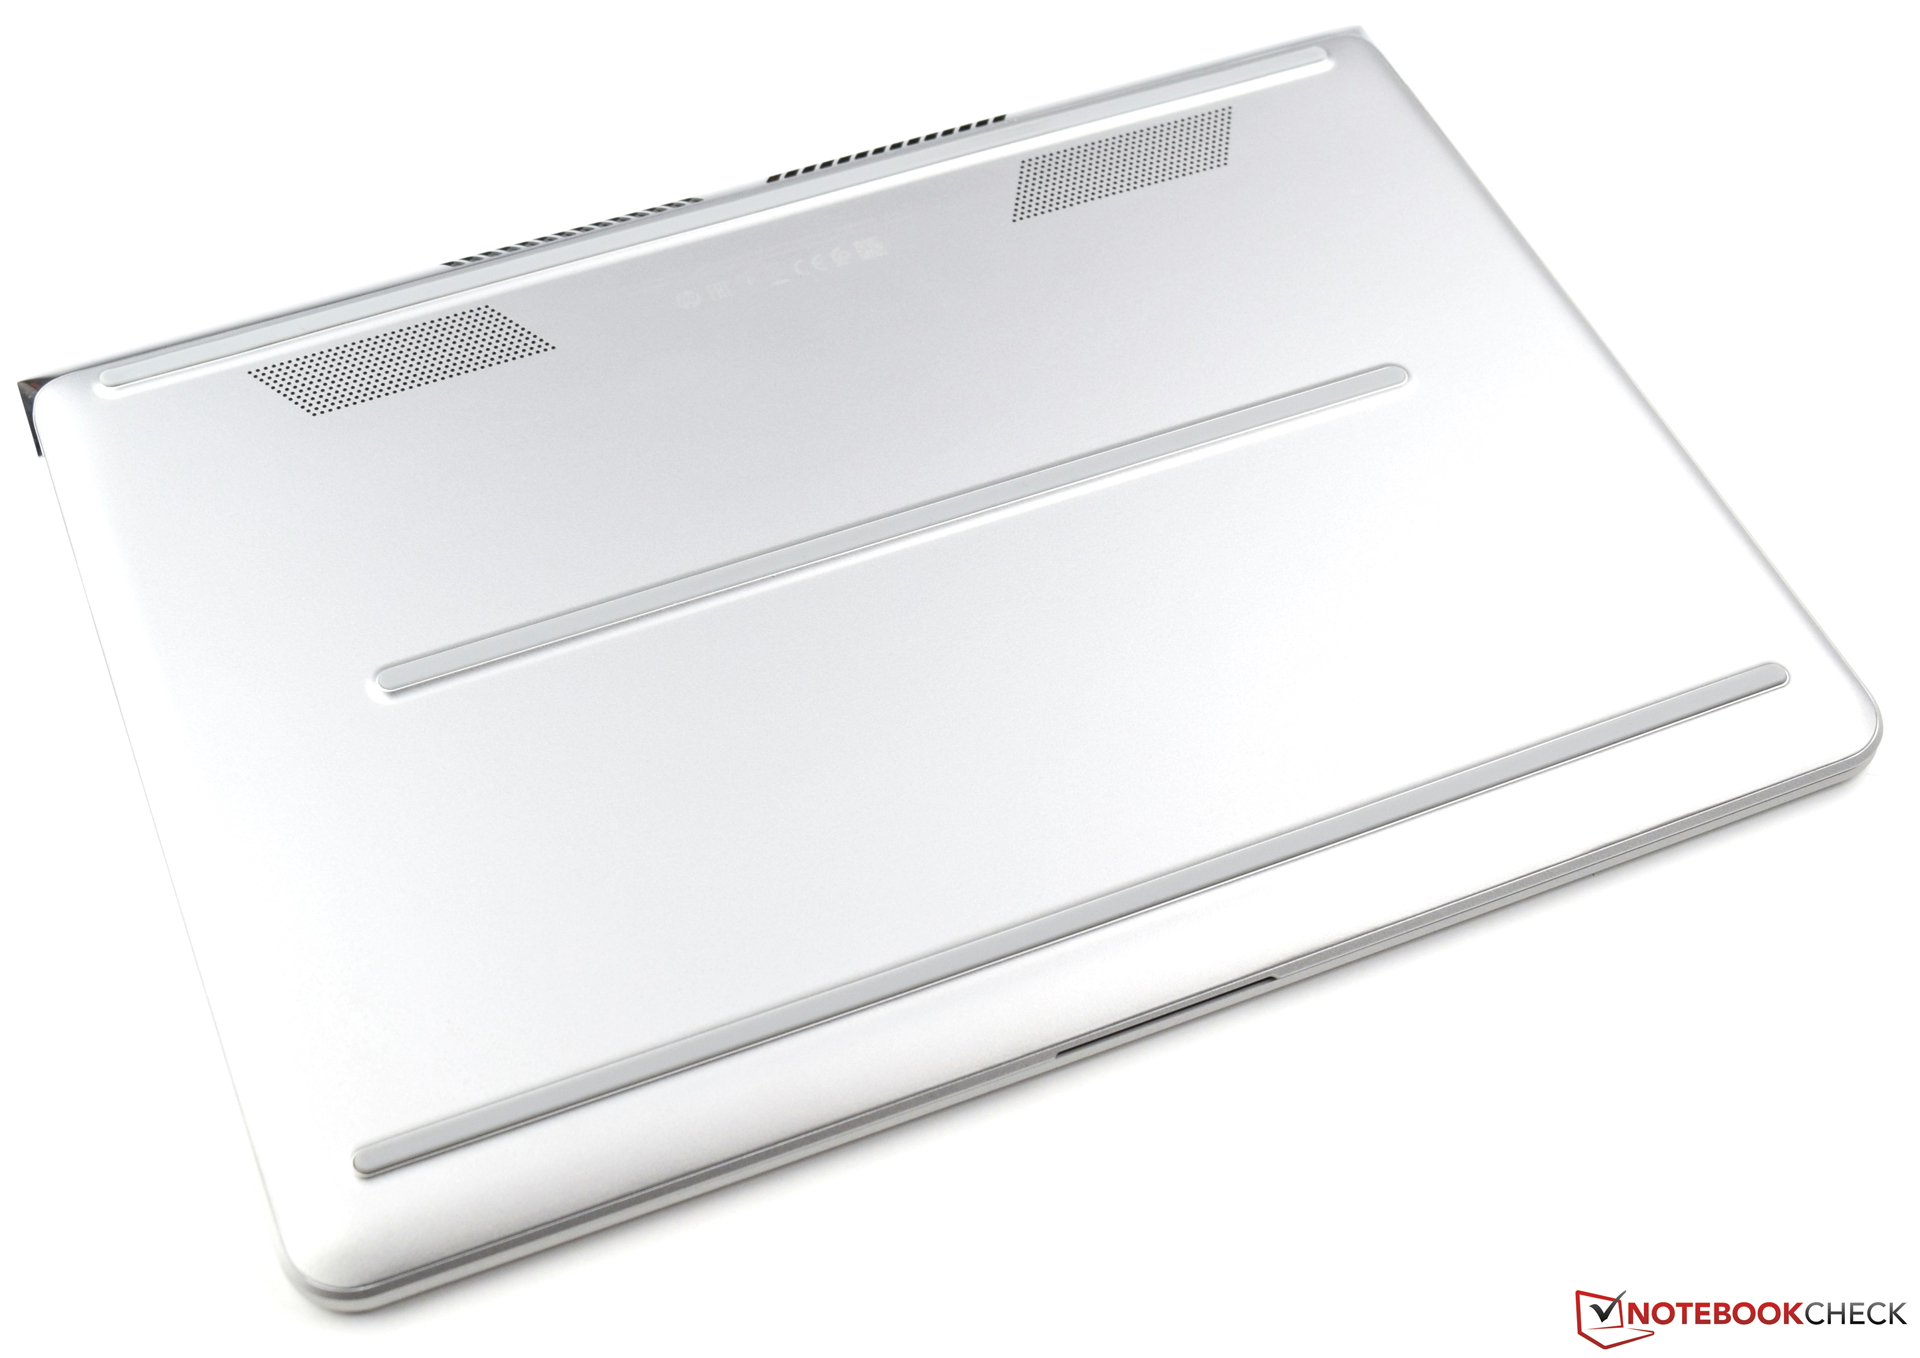
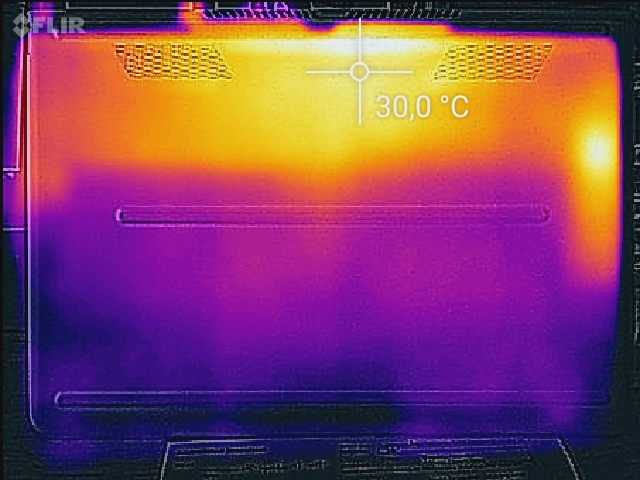
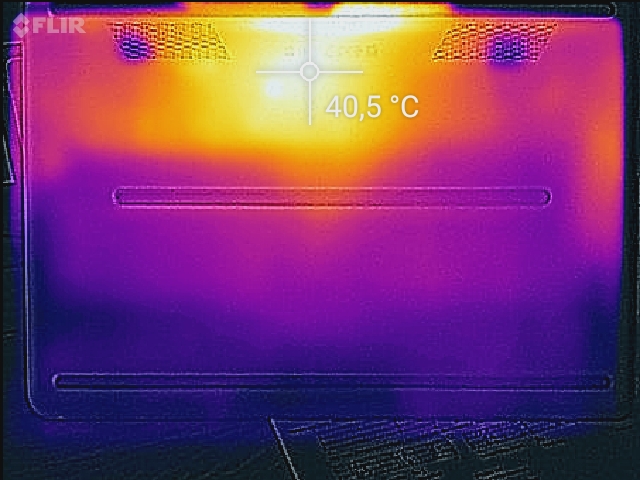
(+) The bottom heats up to a maximum of 37.7 °C / 100 F, compared to the average of 39.2 °C / 103 F
(+) In idle usage, the average temperature for the upper side is 24.9 °C / 77 F, compared to the device average of 30.8 °C / 87 F.
(+) The palmrests and touchpad are cooler than skin temperature with a maximum of 24 °C / 75.2 F and are therefore cool to the touch.
(+) The average temperature of the palmrest area of similar devices was 28.2 °C / 82.8 F (+4.2 °C / 7.6 F).
| HP Spectre 13-v131ng i7-7500U, HD Graphics 620 | HP Spectre 13 6500U, HD Graphics 520 | Apple MacBook Pro 13 2016 (2.9 GHz) 6267U, Iris Graphics 550 | Dell XPS 13 9360 FHD i5 i5-7200U, HD Graphics 620 | Asus Zenbook UX305CA-FB055T 6Y75, HD Graphics 515 | HP EliteBook 1030 G1-X2F03EA 6Y75, HD Graphics 515 | |
|---|---|---|---|---|---|---|
| Heat | -12% | 9% | 1% | 11% | -8% | |
| Maximum Upper Side * (°C) | 54.2 | 45.2 17% | 45 17% | 43.4 20% | 39.1 28% | 43.4 20% |
| Maximum Bottom * (°C) | 37.7 | 50.2 -33% | 39 -3% | 49.2 -31% | 38.7 -3% | 44.5 -18% |
| Idle Upper Side * (°C) | 29 | 32.4 -12% | 26 10% | 26.4 9% | 26 10% | 32.6 -12% |
| Idle Bottom * (°C) | 27.6 | 33 -20% | 24 13% | 26.4 4% | 25.7 7% | 33.5 -21% |
* ... smaller is better
HP Spectre 13-v131ng audio analysis
(-) | not very loud speakers (68 dB)
Bass 100 - 315 Hz
(-) | nearly no bass - on average 23.7% lower than median
(±) | linearity of bass is average (9.6% delta to prev. frequency)
Mids 400 - 2000 Hz
(±) | reduced mids - on average 5.1% lower than median
(±) | linearity of mids is average (7.6% delta to prev. frequency)
Highs 2 - 16 kHz
(±) | higher highs - on average 7.7% higher than median
(+) | highs are linear (3.1% delta to prev. frequency)
Overall 100 - 16.000 Hz
(±) | linearity of overall sound is average (28.6% difference to median)
Compared to same class
» 90% of all tested devices in this class were better, 2% similar, 7% worse
» The best had a delta of 5%, average was 18%, worst was 53%
Compared to all devices tested
» 86% of all tested devices were better, 3% similar, 11% worse
» The best had a delta of 4%, average was 23%, worst was 134%
Apple MacBook 12 (Early 2016) 1.1 GHz audio analysis
(+) | speakers can play relatively loud (83.6 dB)
Bass 100 - 315 Hz
(±) | reduced bass - on average 11.3% lower than median
(±) | linearity of bass is average (14.2% delta to prev. frequency)
Mids 400 - 2000 Hz
(+) | balanced mids - only 2.4% away from median
(+) | mids are linear (5.5% delta to prev. frequency)
Highs 2 - 16 kHz
(+) | balanced highs - only 2% away from median
(+) | highs are linear (4.5% delta to prev. frequency)
Overall 100 - 16.000 Hz
(+) | overall sound is linear (10.2% difference to median)
Compared to same class
» 7% of all tested devices in this class were better, 2% similar, 90% worse
» The best had a delta of 5%, average was 18%, worst was 53%
Compared to all devices tested
» 5% of all tested devices were better, 1% similar, 94% worse
» The best had a delta of 4%, average was 23%, worst was 134%
| Off / Standby | |
| Idle | |
| Load |
|
Key:
min: | |
| HP Spectre 13-v131ng i7-7500U, HD Graphics 620 | HP Spectre 13 6500U, HD Graphics 520 | Apple MacBook Pro 13 2016 (2.9 GHz) 6267U, Iris Graphics 550 | Dell XPS 13 9360 FHD i5 i5-7200U, HD Graphics 620 | Asus Zenbook UX305CA-FB055T 6Y75, HD Graphics 515 | HP EliteBook 1030 G1-X2F03EA 6Y75, HD Graphics 515 | |
|---|---|---|---|---|---|---|
| Power Consumption | -48% | -21% | 23% | 9% | -2% | |
| Idle Minimum * (Watt) | 3.6 | 8.6 -139% | 2.1 42% | 4.1 -14% | 4.2 -17% | 4 -11% |
| Idle Average * (Watt) | 6.4 | 11 -72% | 7.6 -19% | 4.2 34% | 8.4 -31% | 8 -25% |
| Idle Maximum * (Watt) | 9.2 | 11.3 -23% | 8.2 11% | 5.1 45% | 8.9 3% | 8.6 7% |
| Load Average * (Watt) | 34 | 33.8 1% | 56.4 -66% | 22.1 35% | 15.9 53% | 26.5 22% |
| Load Maximum * (Watt) | 34.4 | 36.2 -5% | 59.8 -74% | 29.4 15% | 22.5 35% | 34.8 -1% |
* ... smaller is better

| HP Spectre 13-v131ng i7-7500U, HD Graphics 620, 38 Wh | HP Spectre 13 6500U, HD Graphics 520, 38 Wh | Apple MacBook Pro 13 2016 (2.9 GHz) 6267U, Iris Graphics 550, 49.2 Wh | Dell XPS 13 9360 FHD i5 i5-7200U, HD Graphics 620, 60 Wh | Asus Zenbook UX305CA-FB055T 6Y75, HD Graphics 515, 45 Wh | HP EliteBook 1030 G1-X2F03EA 6Y75, HD Graphics 515, 40 Wh | |
|---|---|---|---|---|---|---|
| Battery runtime | -5% | 20% | 84% | 47% | 13% | |
| Reader / Idle (h) | 12 | 11.9 -1% | 21.6 80% | 16.9 41% | 10.3 -14% | |
| H.264 (h) | 6.1 | 8.1 33% | 7 15% | 6.3 3% | ||
| WiFi v1.3 (h) | 6.6 | 5.6 -15% | 9.4 42% | 11.3 71% | 6.7 2% | 5.1 -23% |
| Load (h) | 1.3 | 1.3 0% | 1.1 -15% | 2.6 100% | 3 131% | 2.4 85% |
Pros
Cons
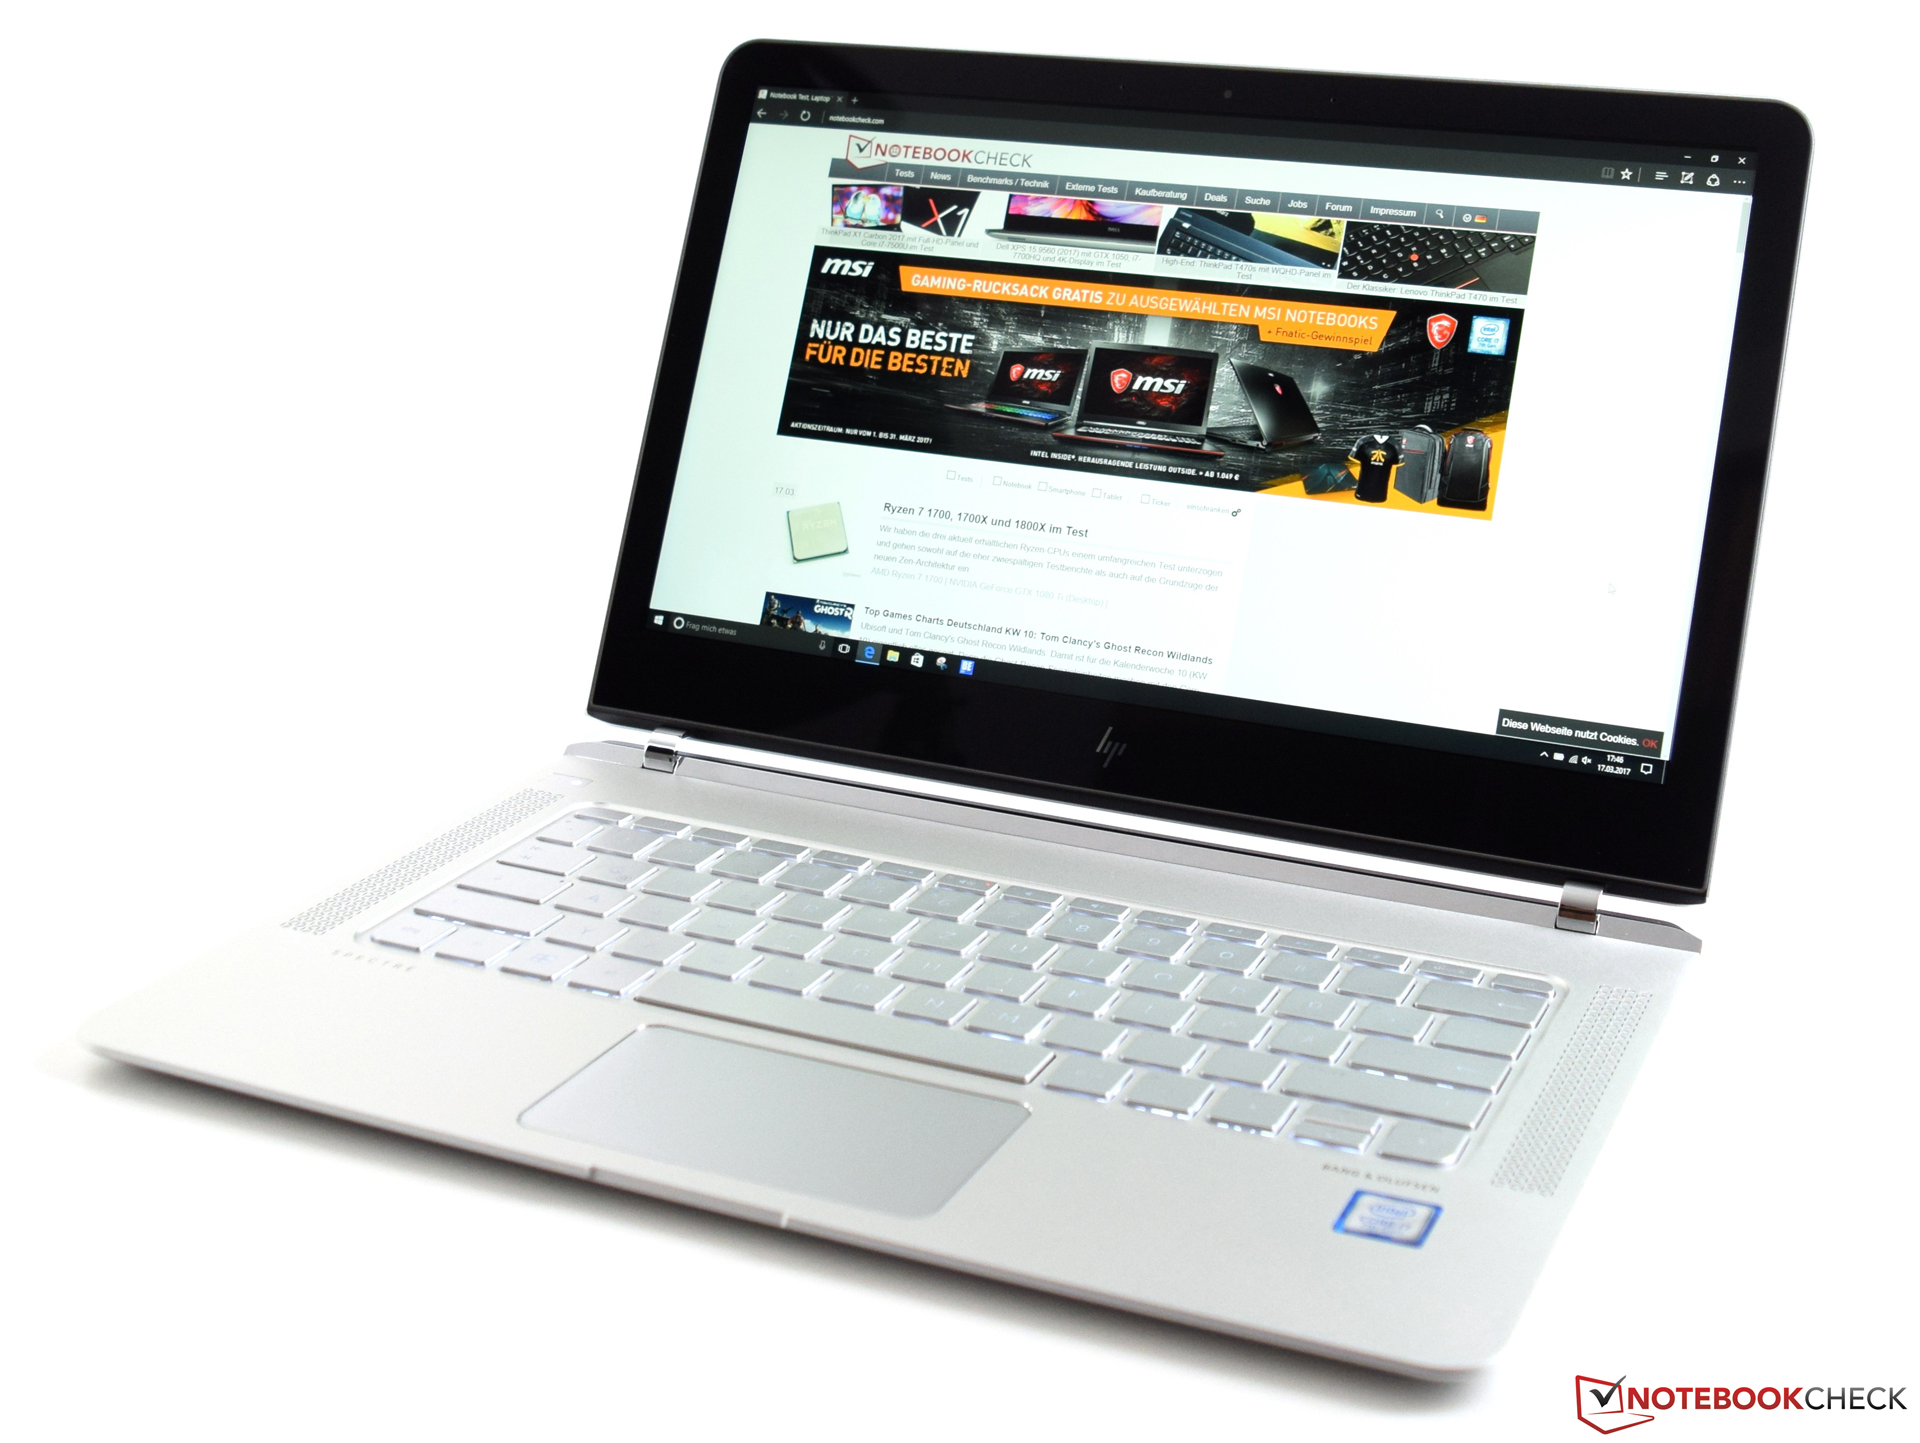
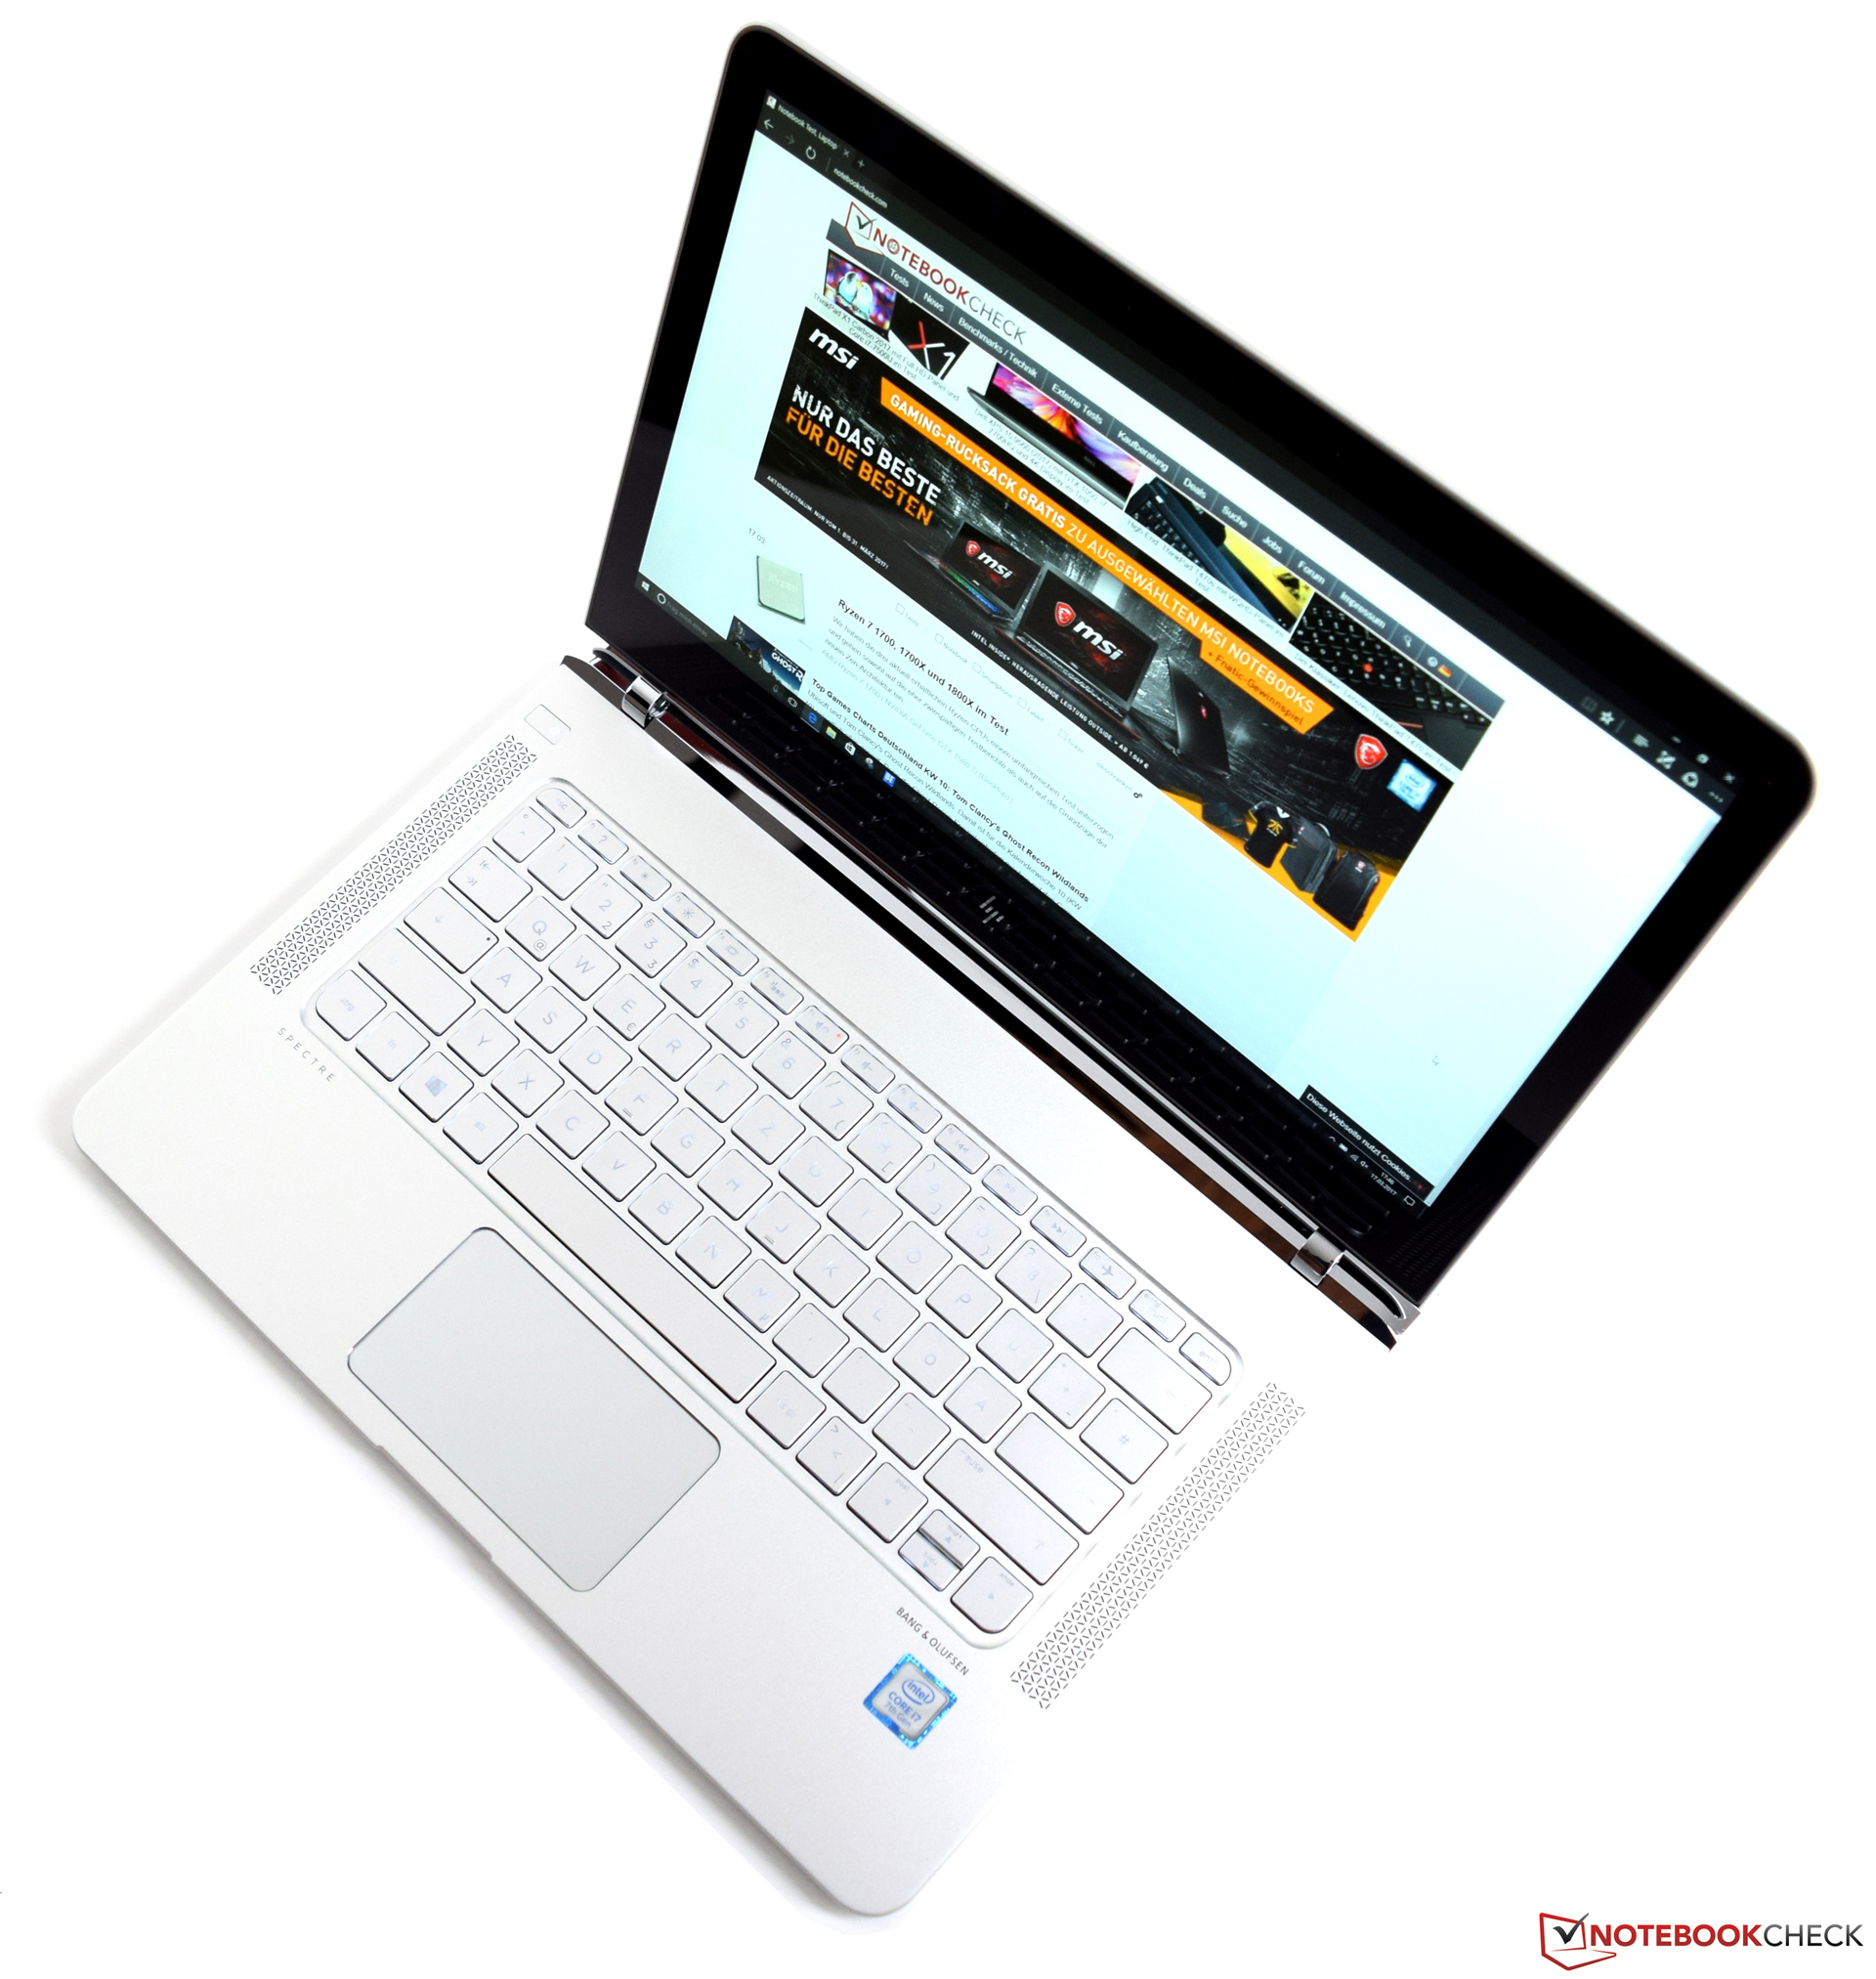
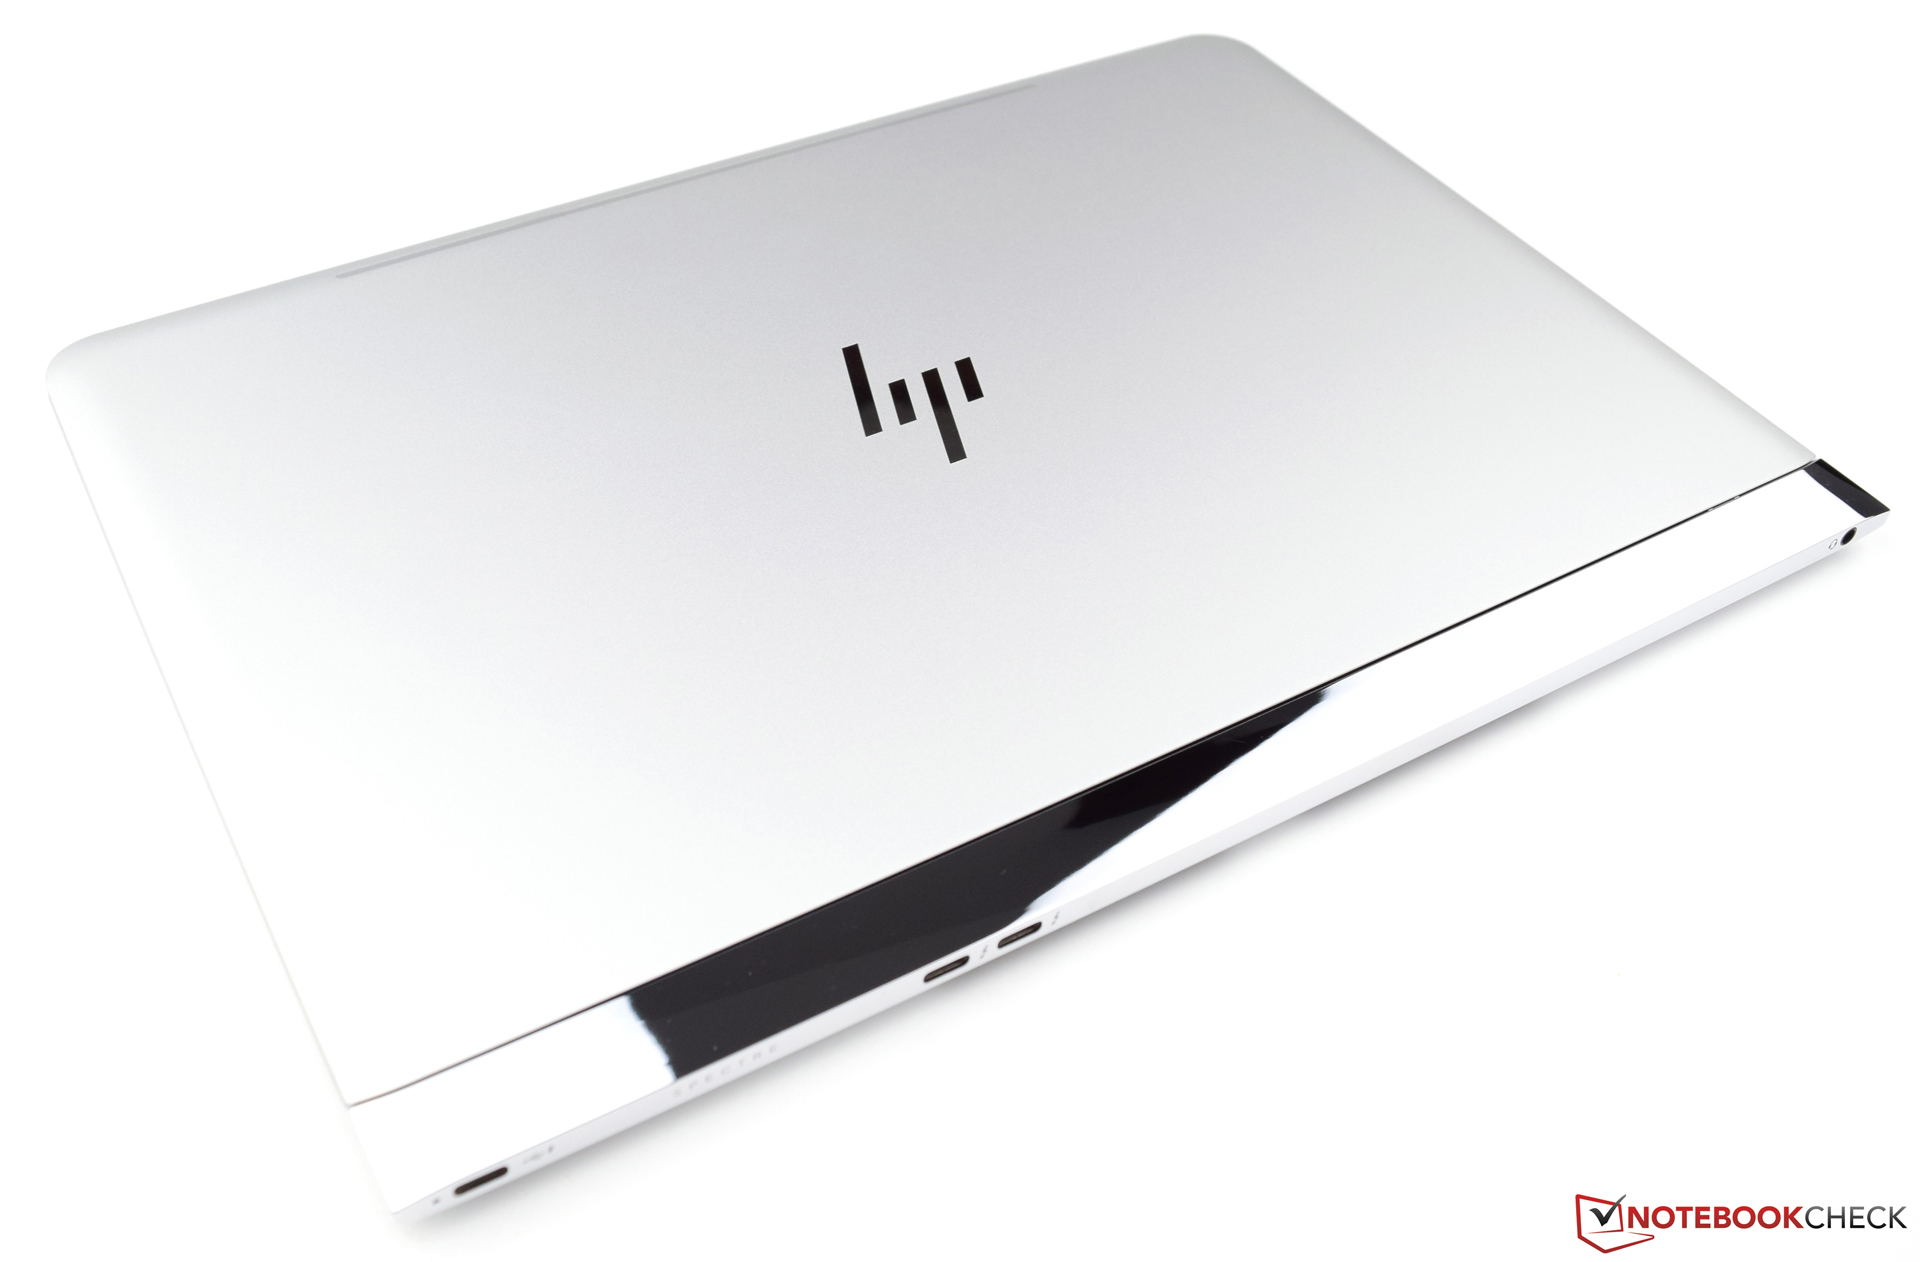
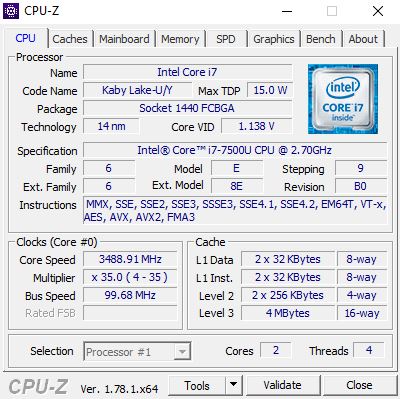
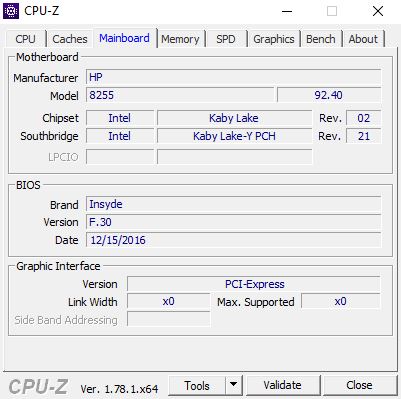
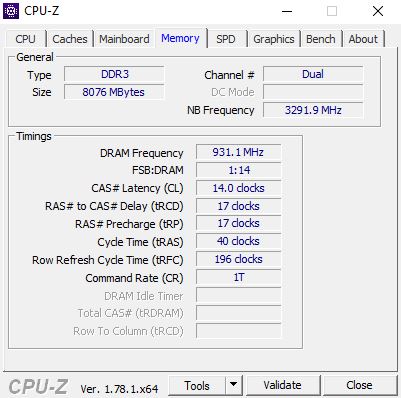
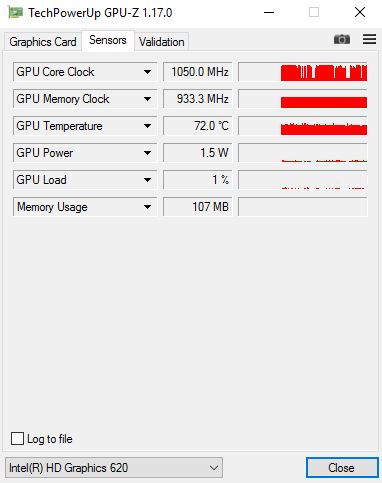
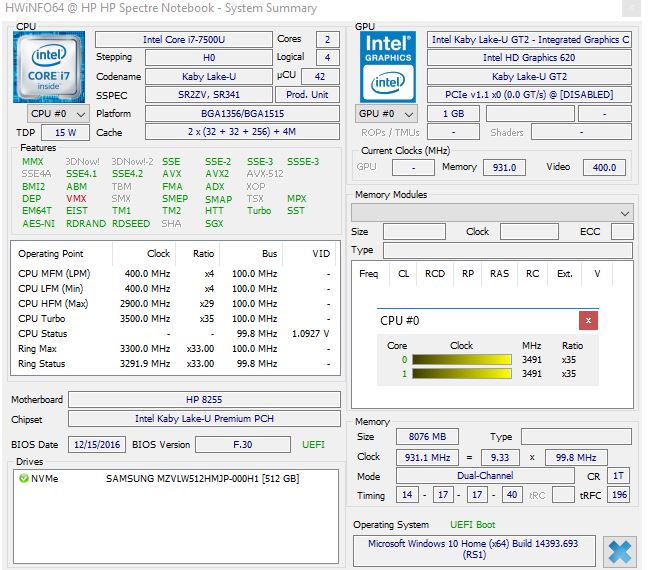
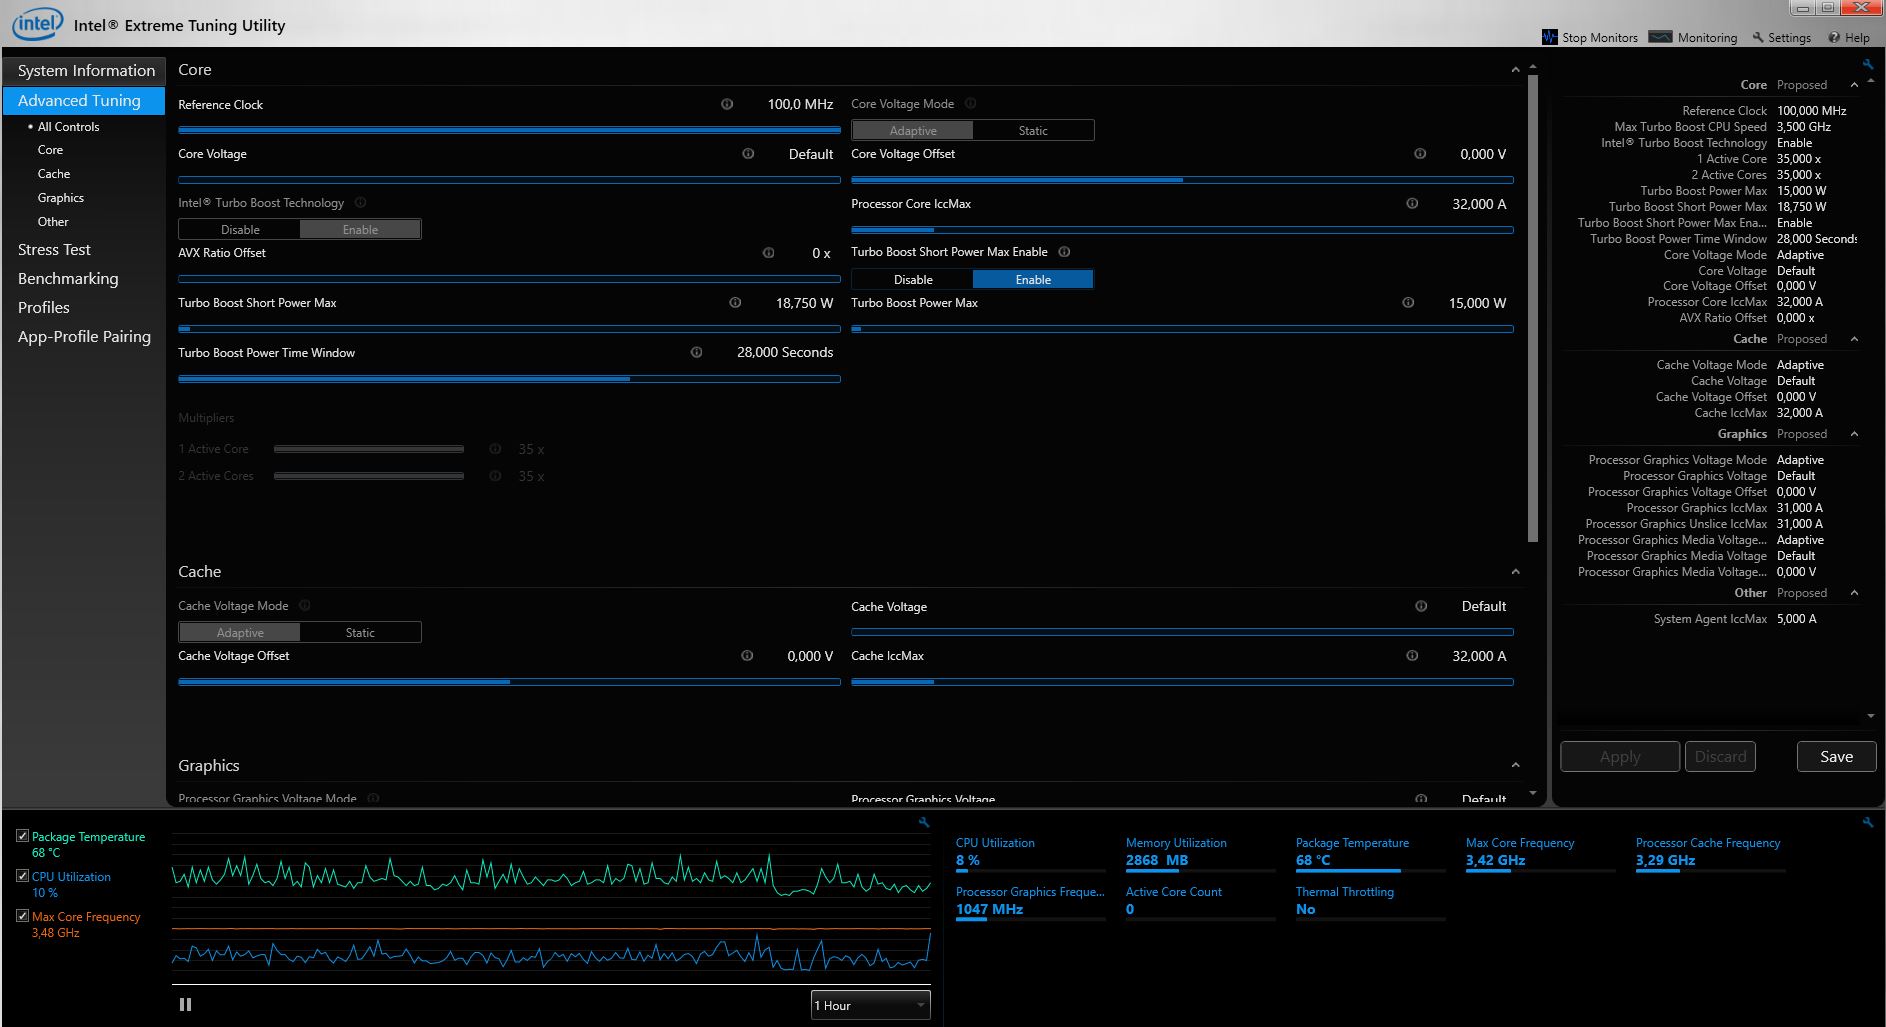
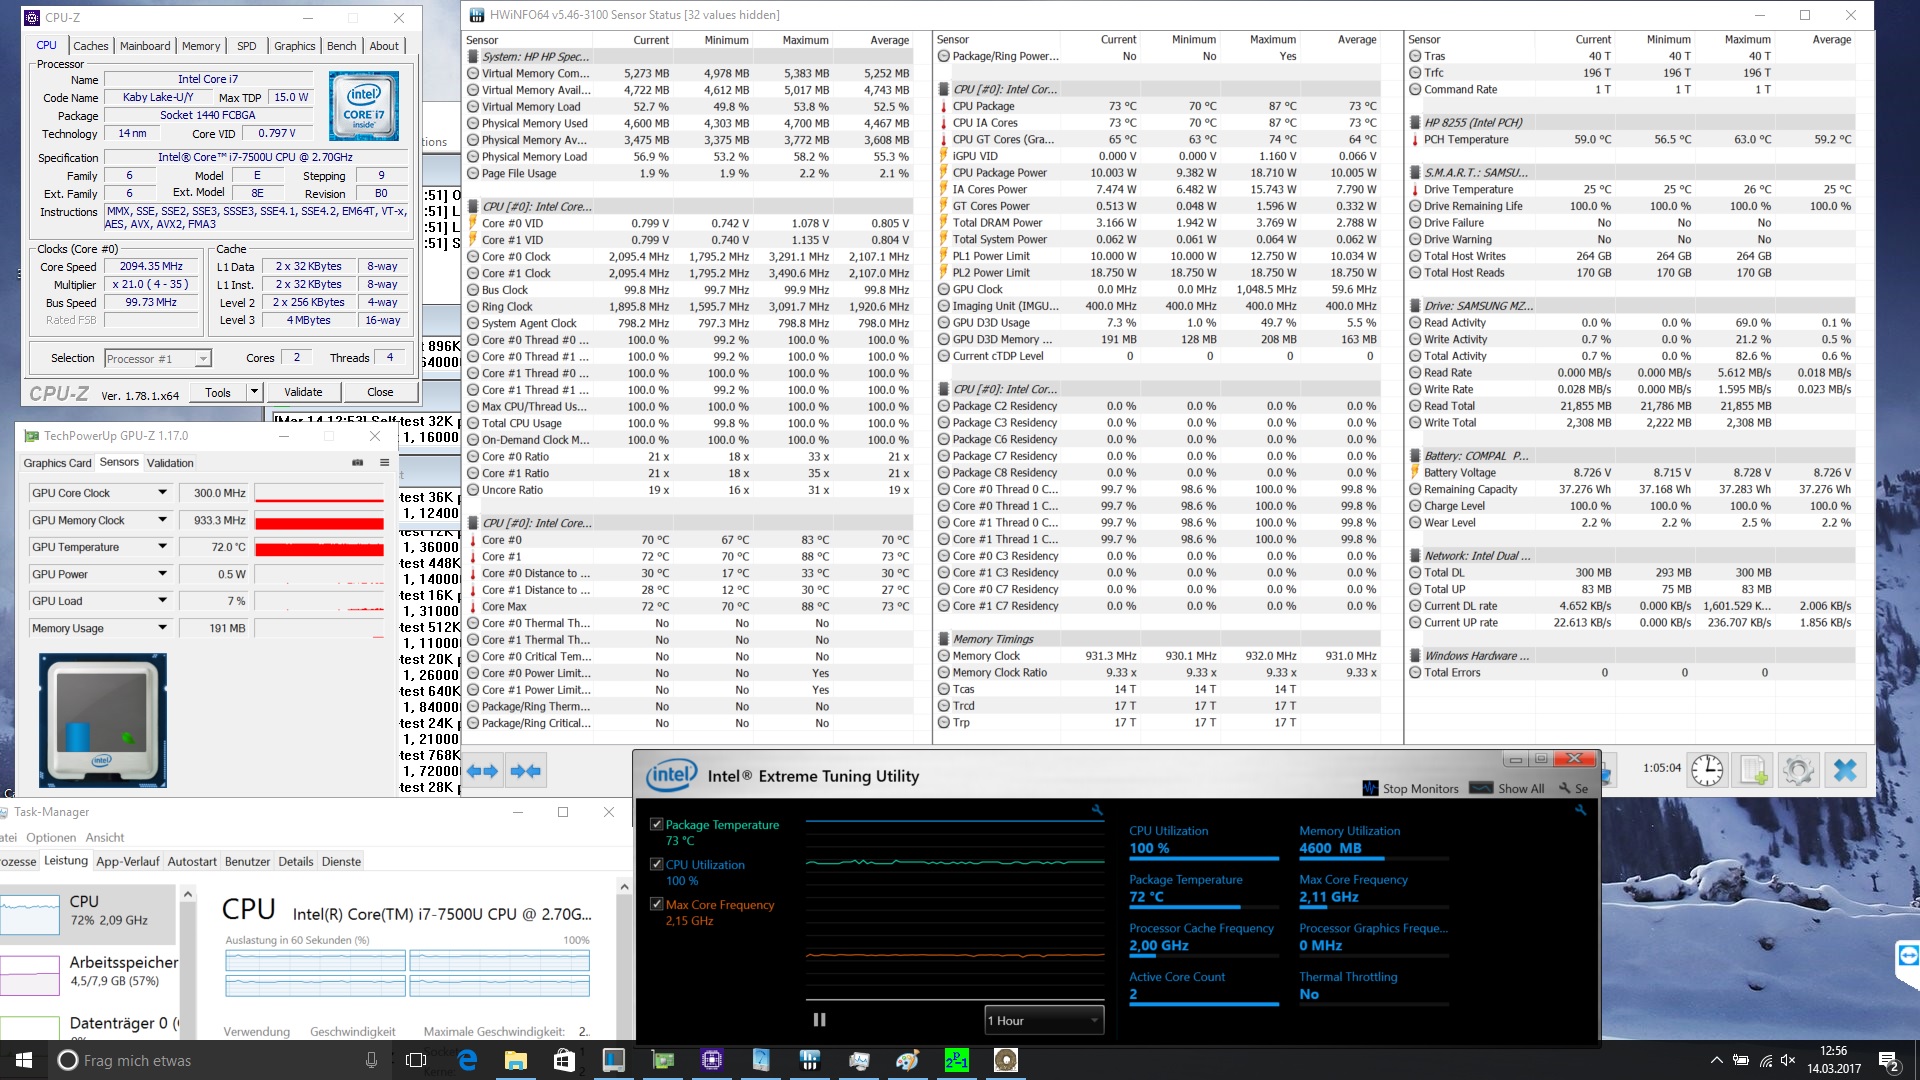
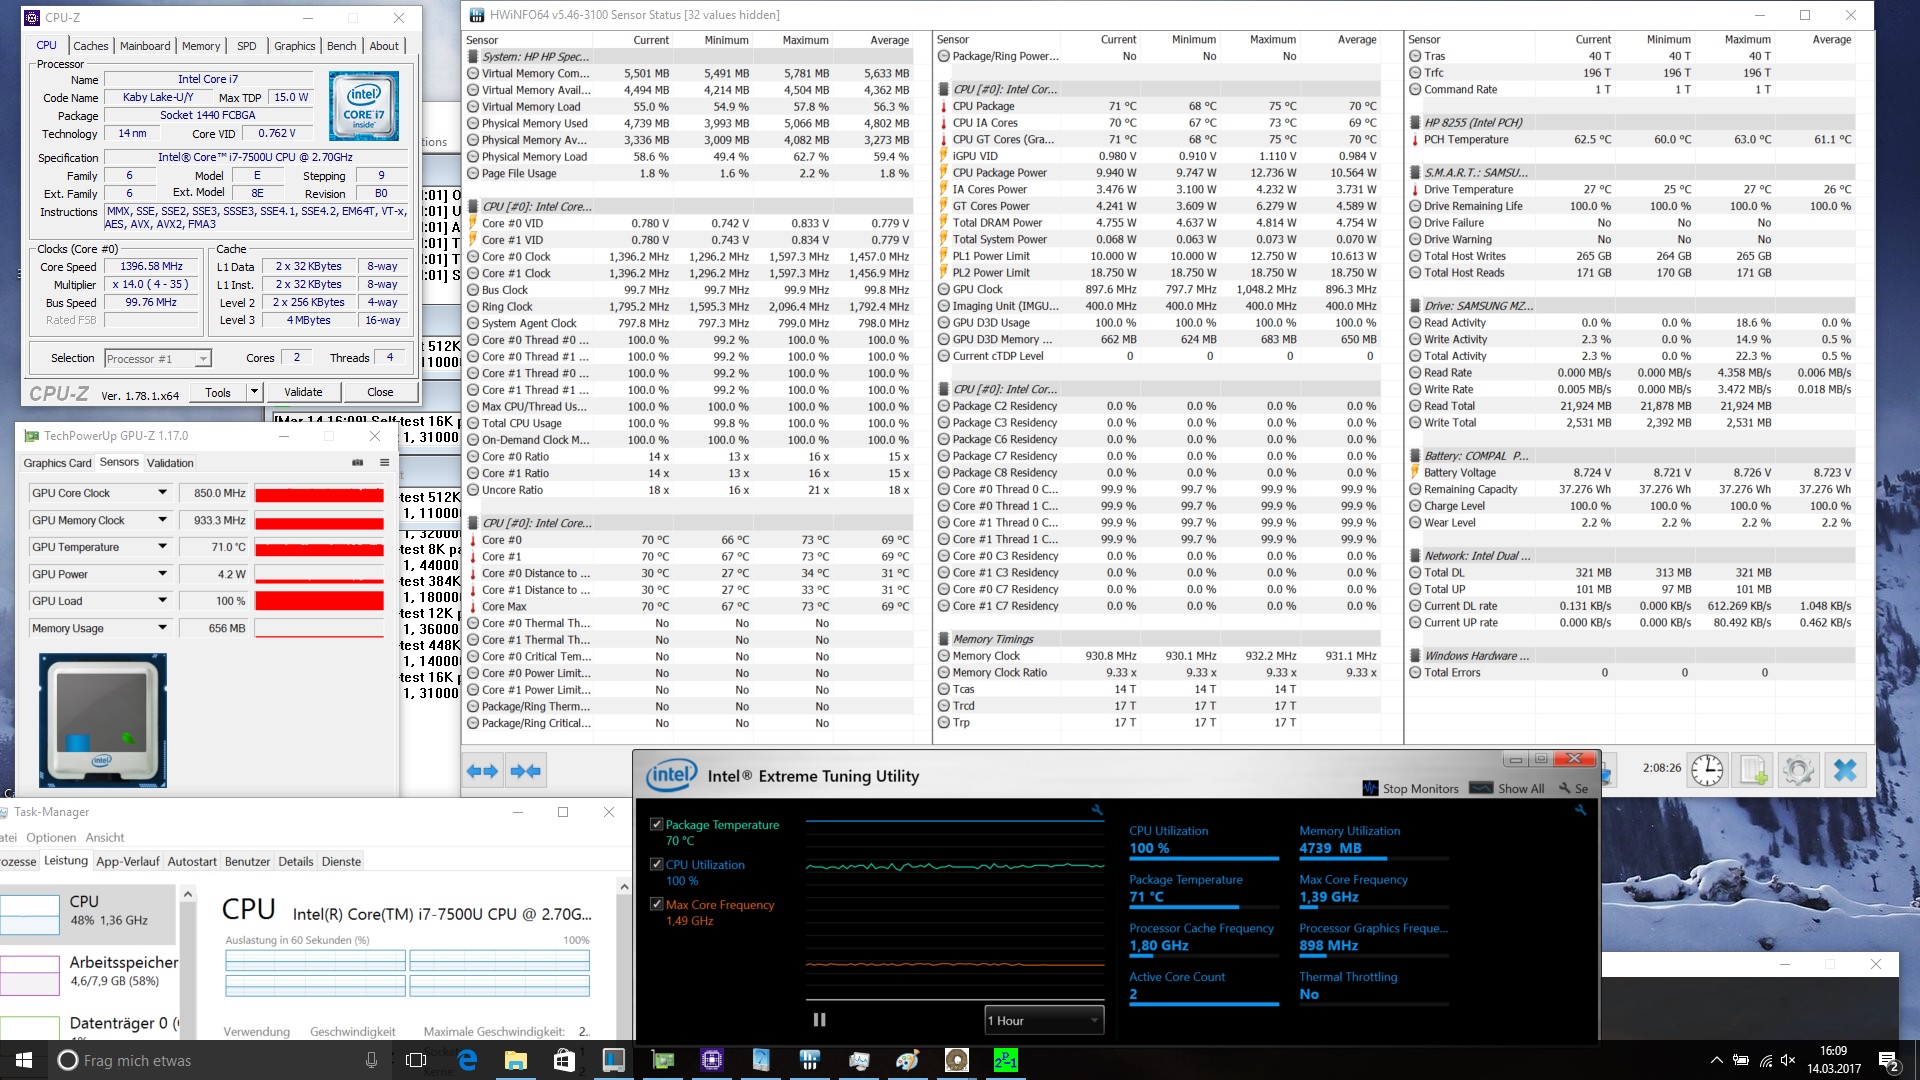
即使到了2017年,惠普Spectre 13仍毫无疑问是最薄的13.3寸笔记本电脑之一。生产商在便携性,设计和性能等方面间找到了一个很好的平衡。我们的测试机型搭配高速英特尔酷睿i7-7500U处理器,但是无法持续处于Turbo加速模式。但无论如何,它的性能可以保证非常优秀的整体表现,特别是结合NVMe高速固态硬盘的辅佐。我们认为尽管8GB DDR3内存在目前来说已经足够,但是16GB DDR4应该可以让它能够更好适合未来的需要。
对于把外观和设计放在首位、又不希望牺牲性能的用户来说,惠普Spectre 13是个很好的选择。这也是惠普设计Spectre 13的初衷所在。
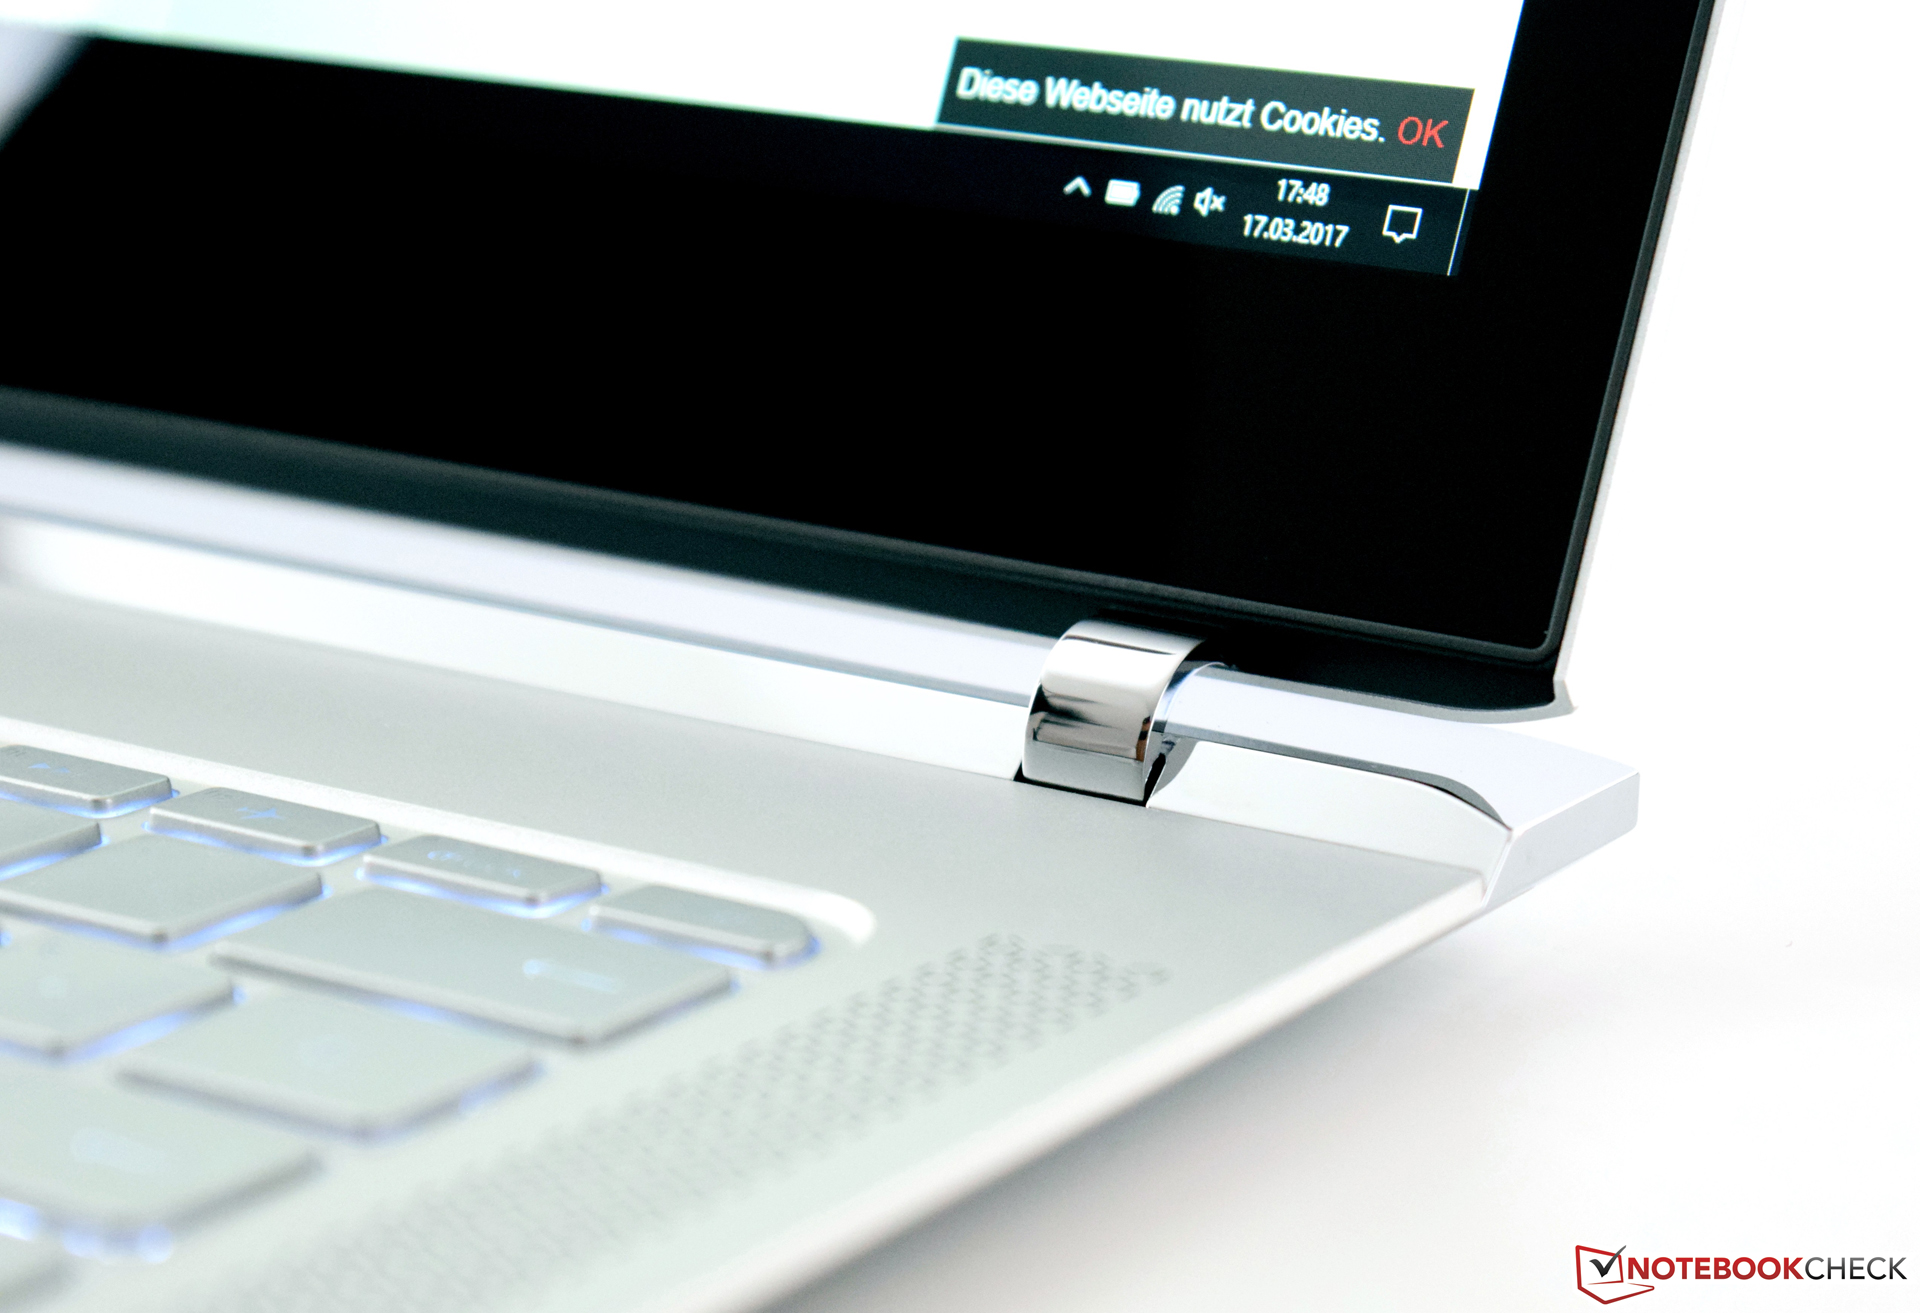
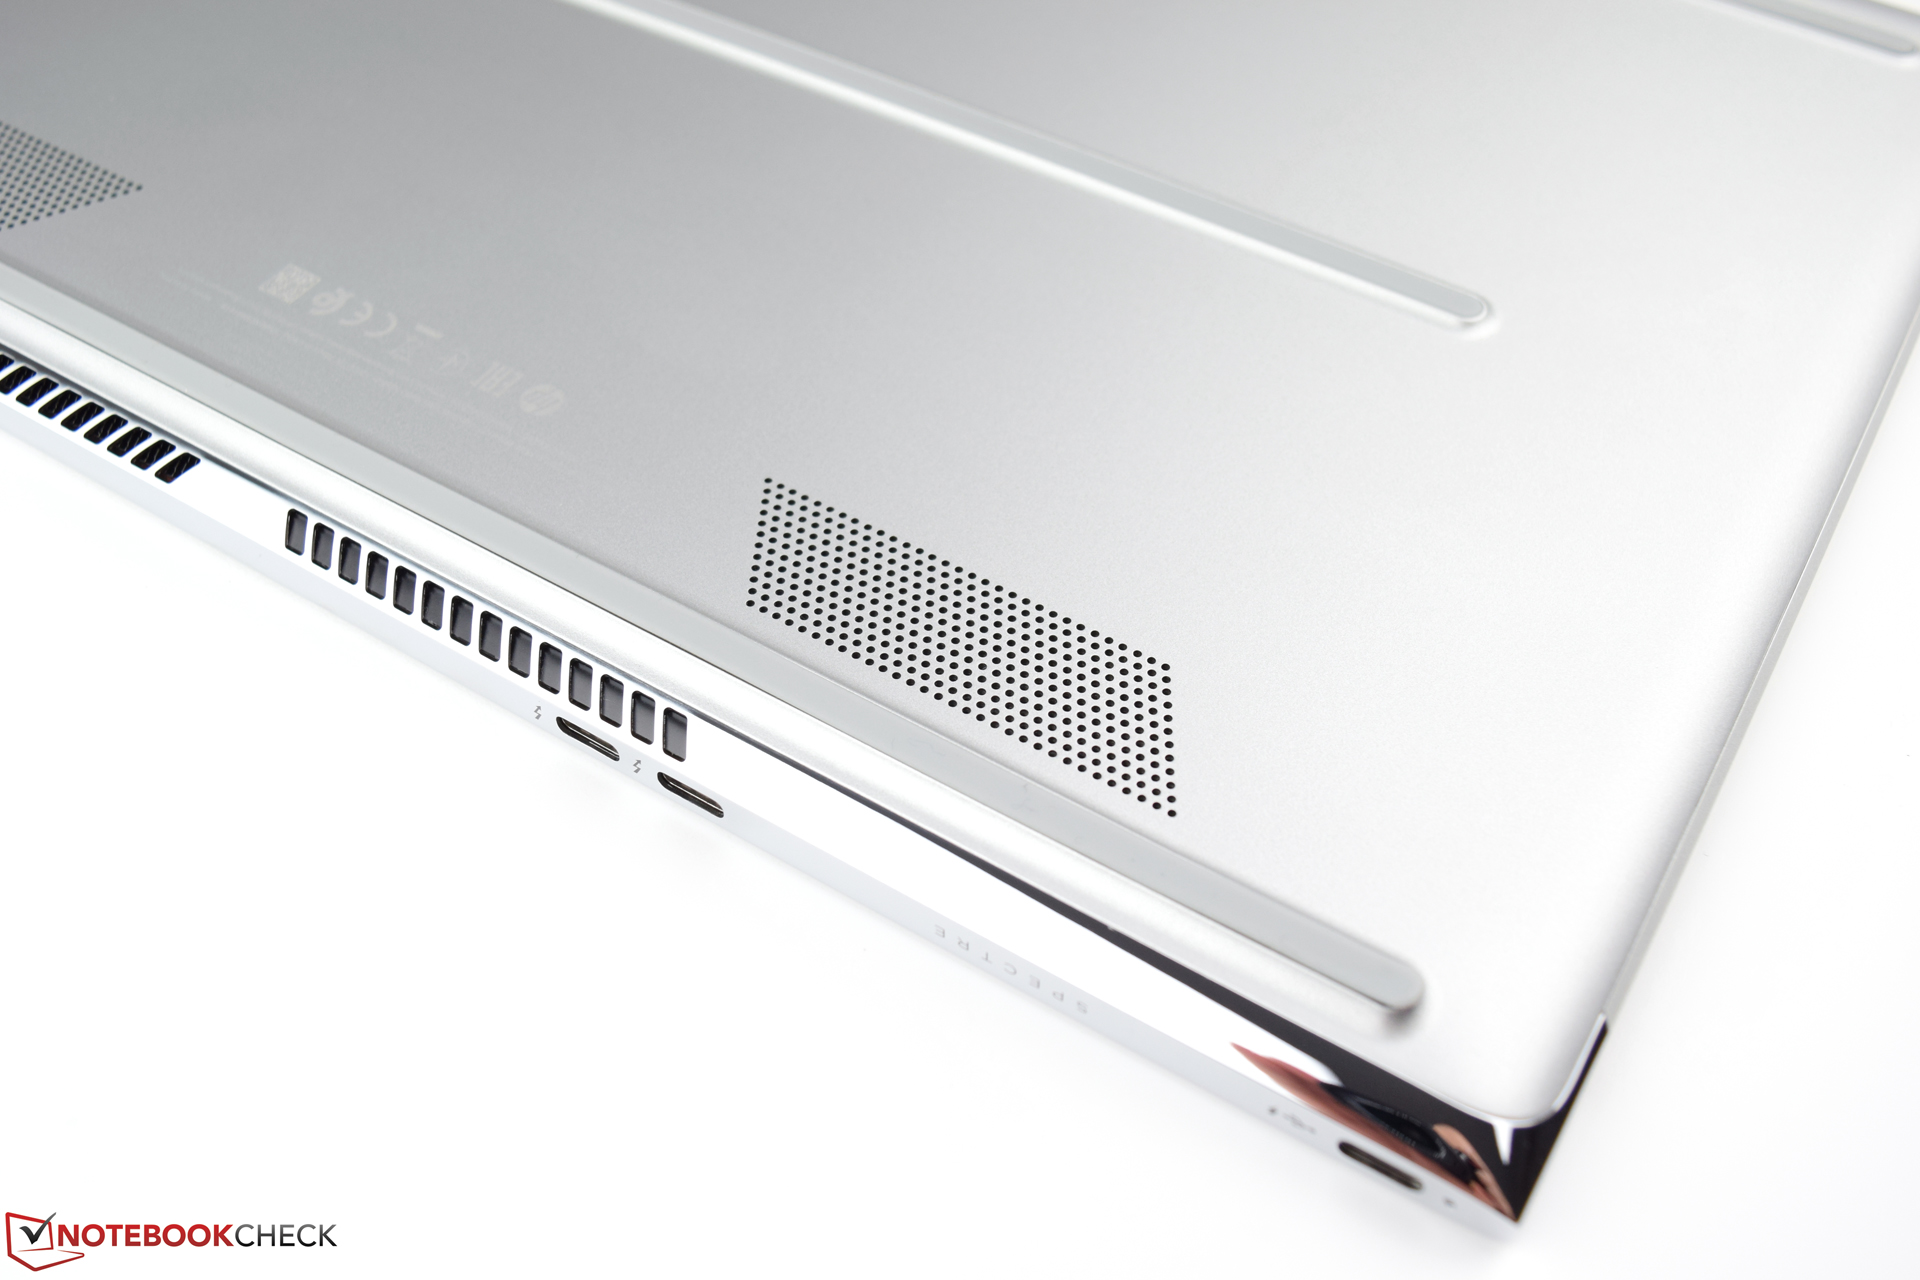
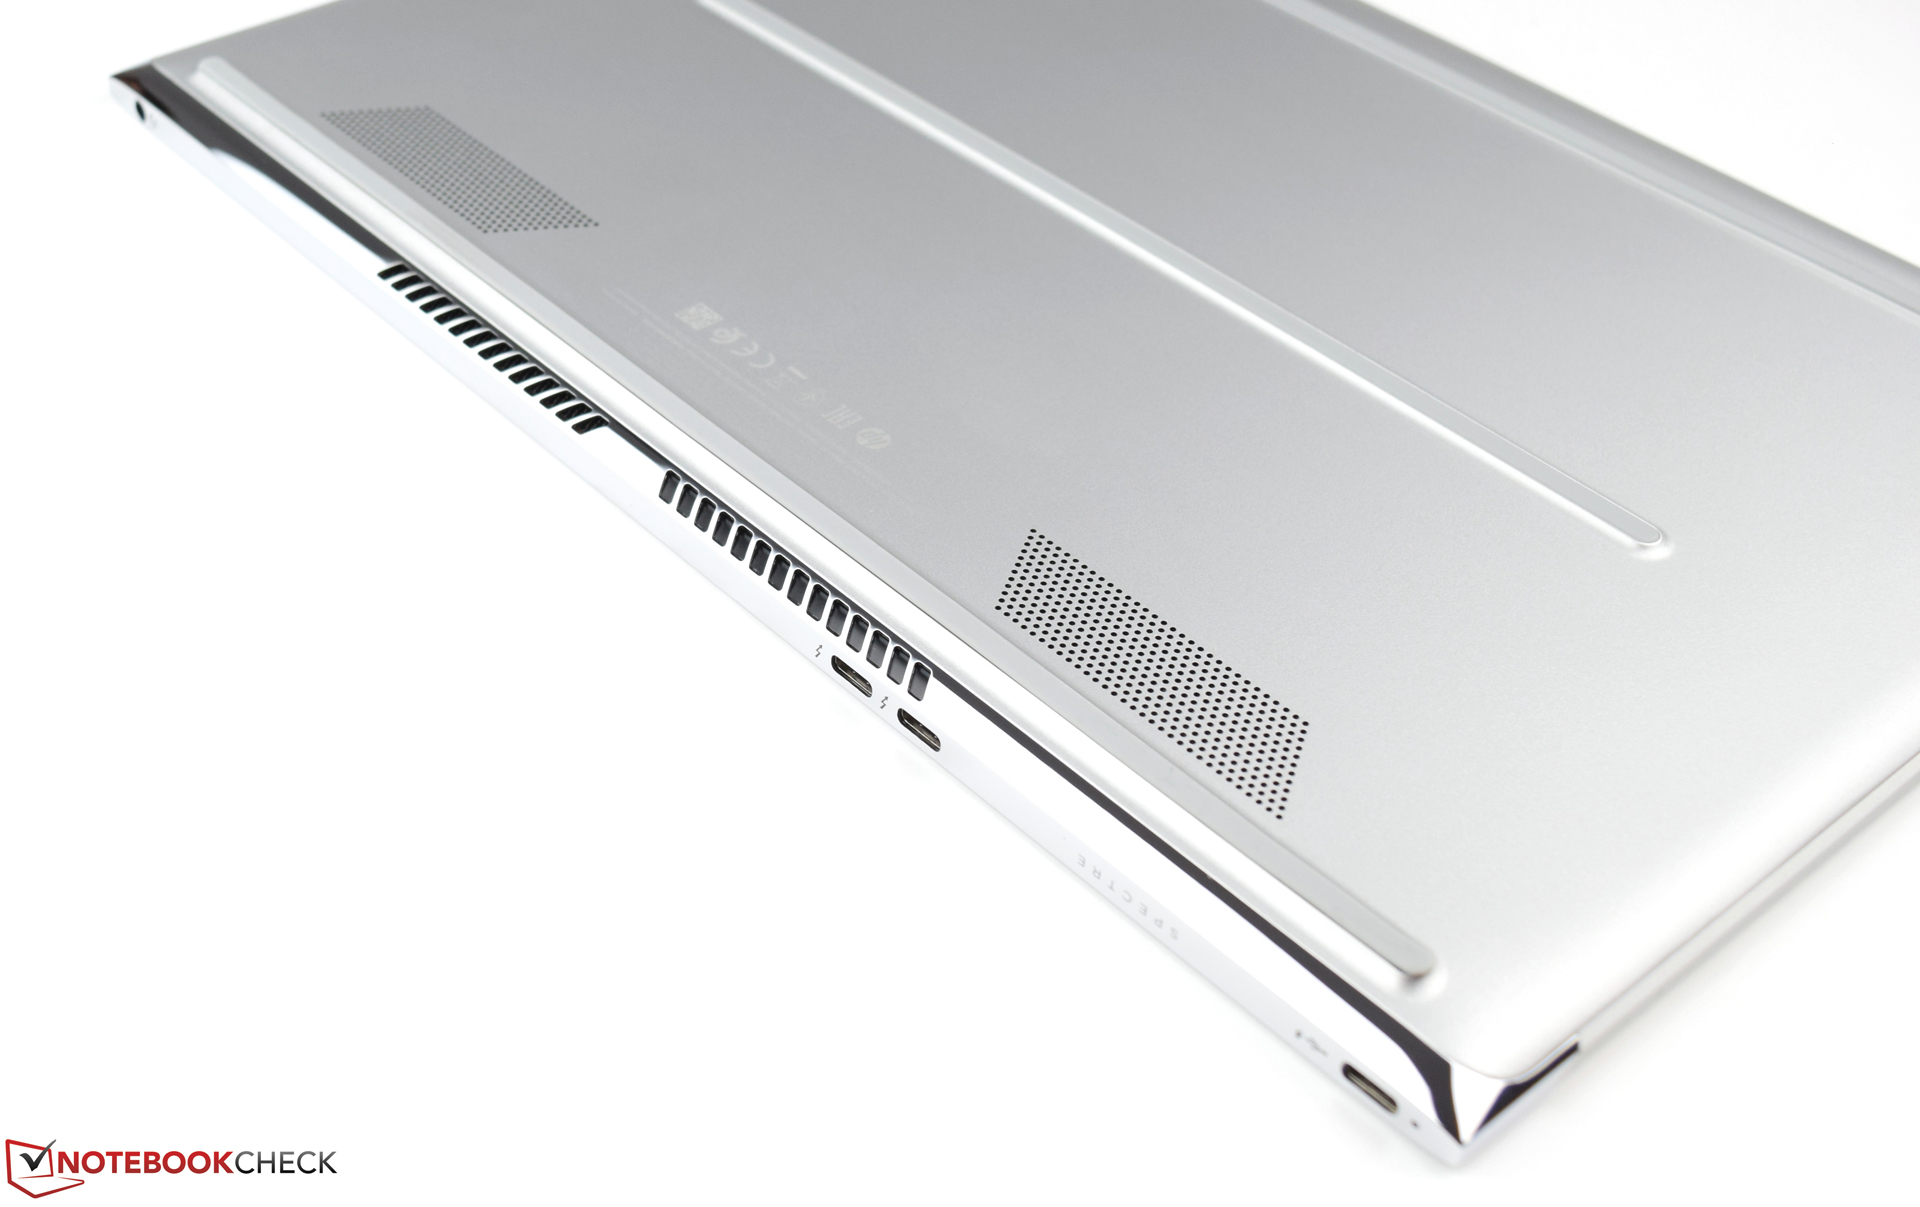
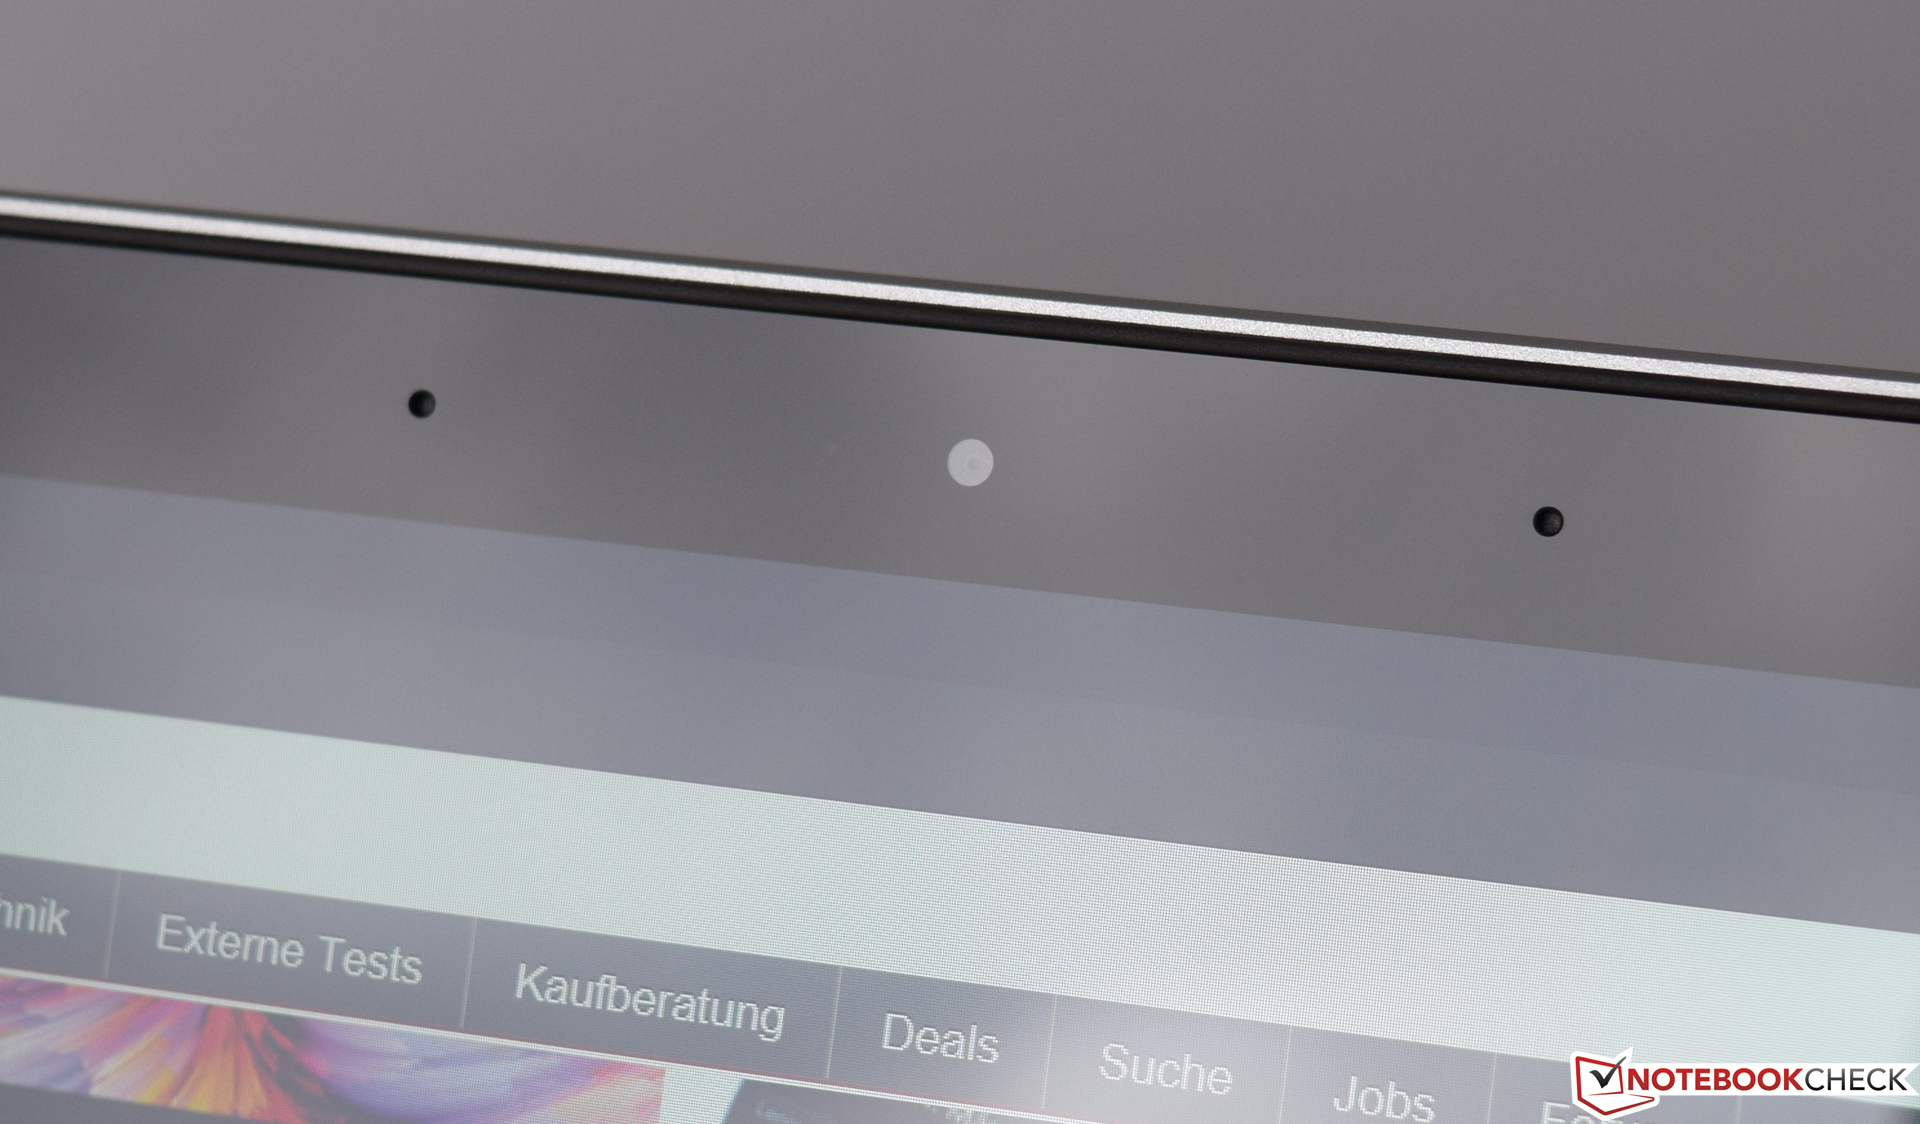
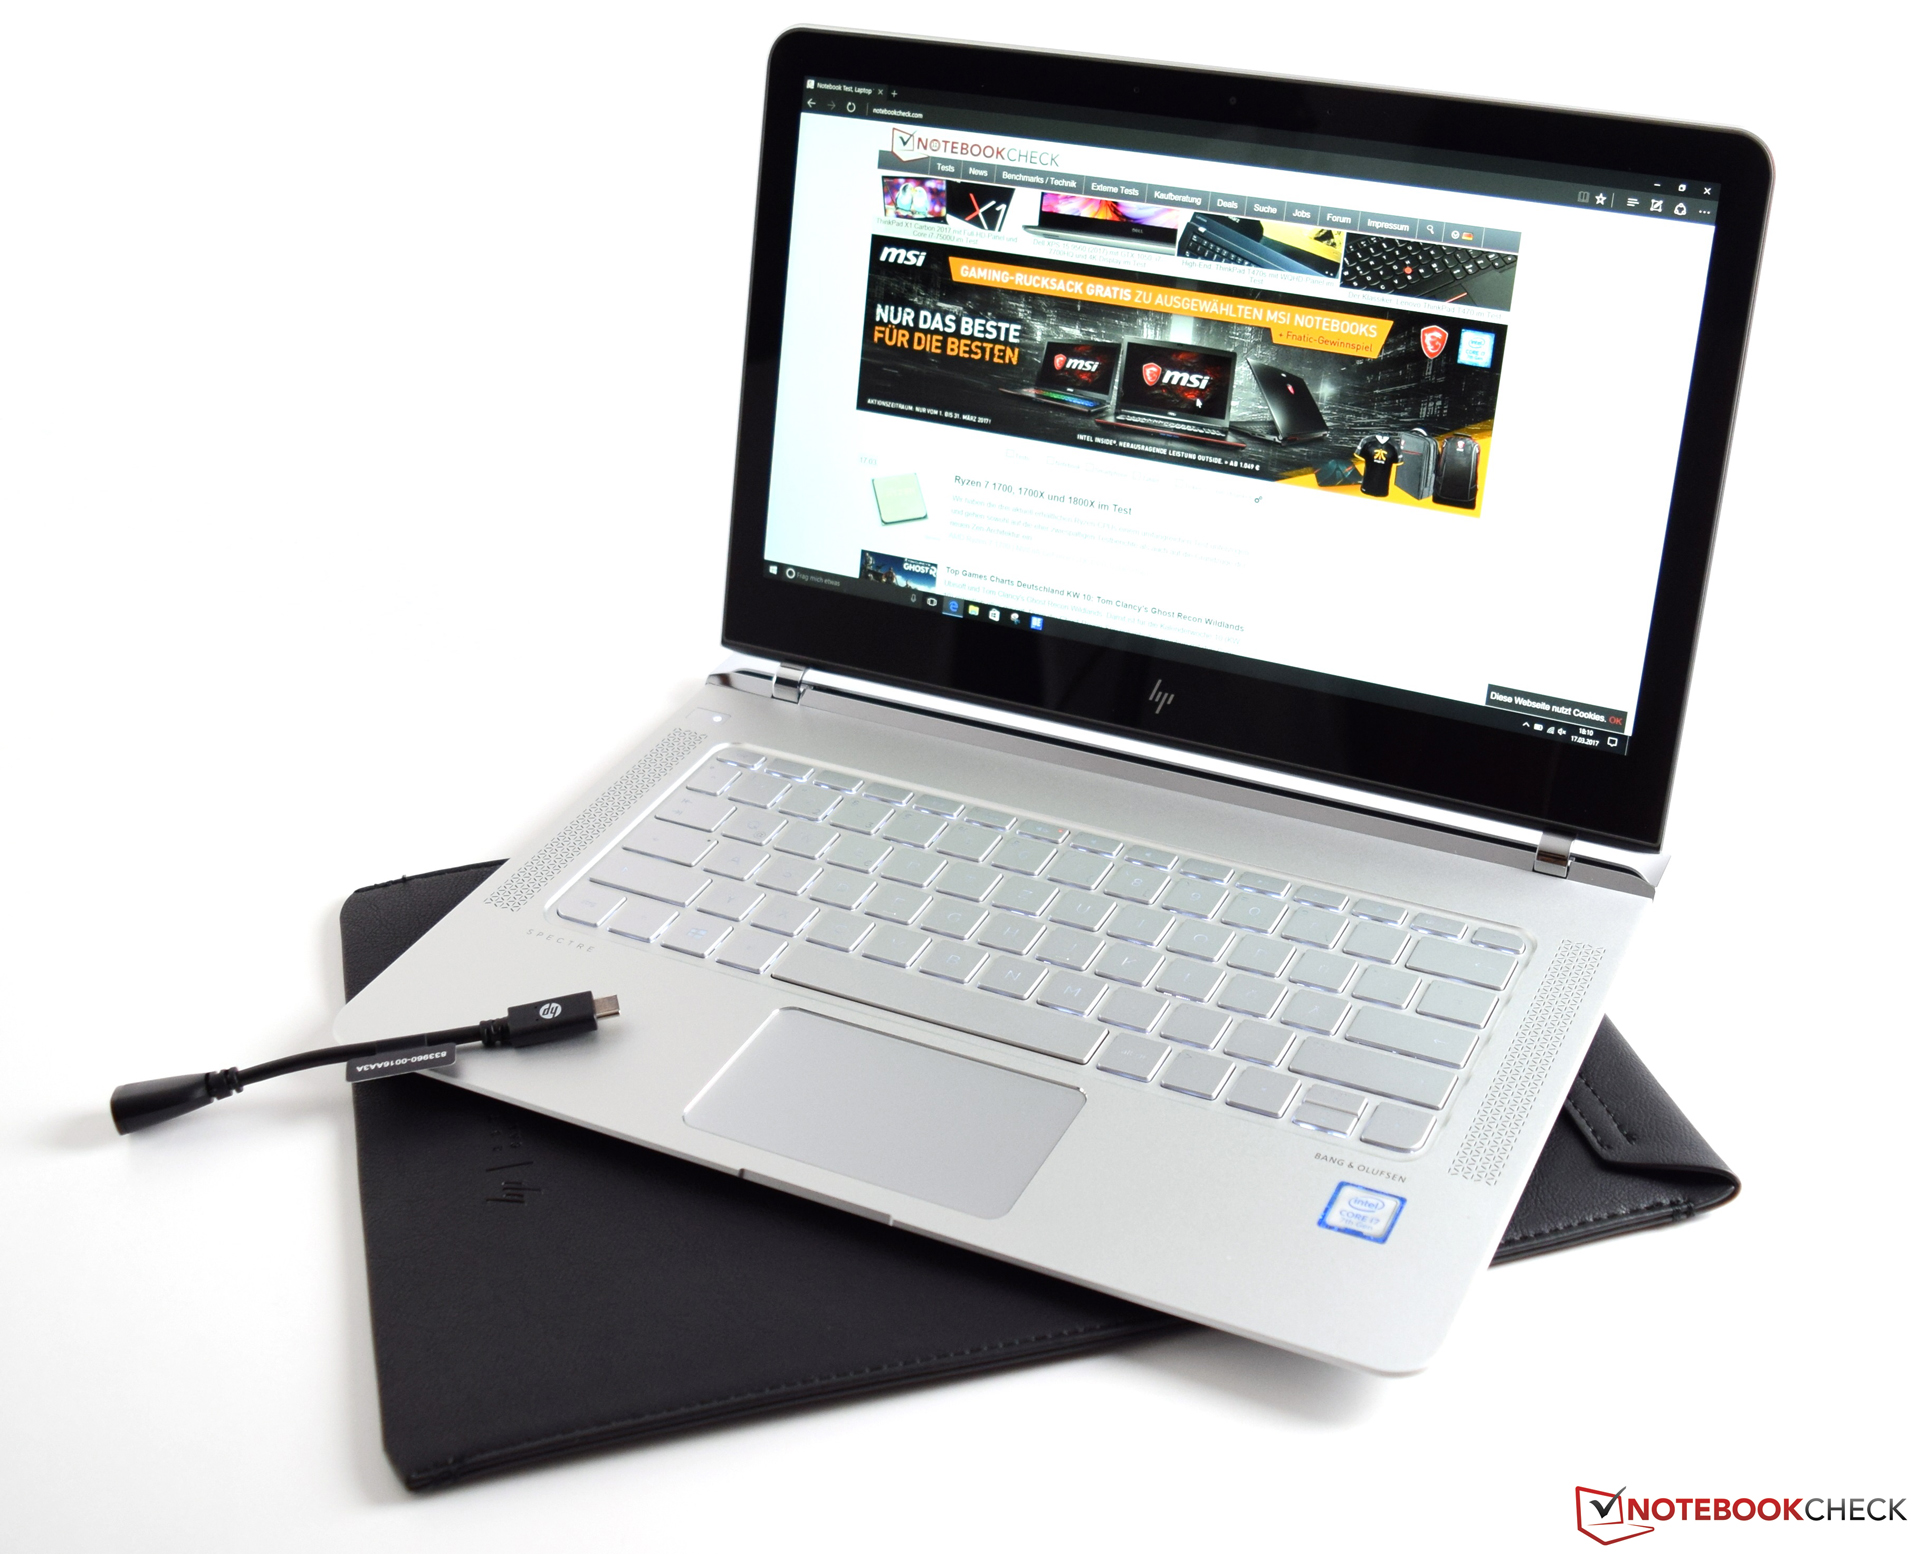
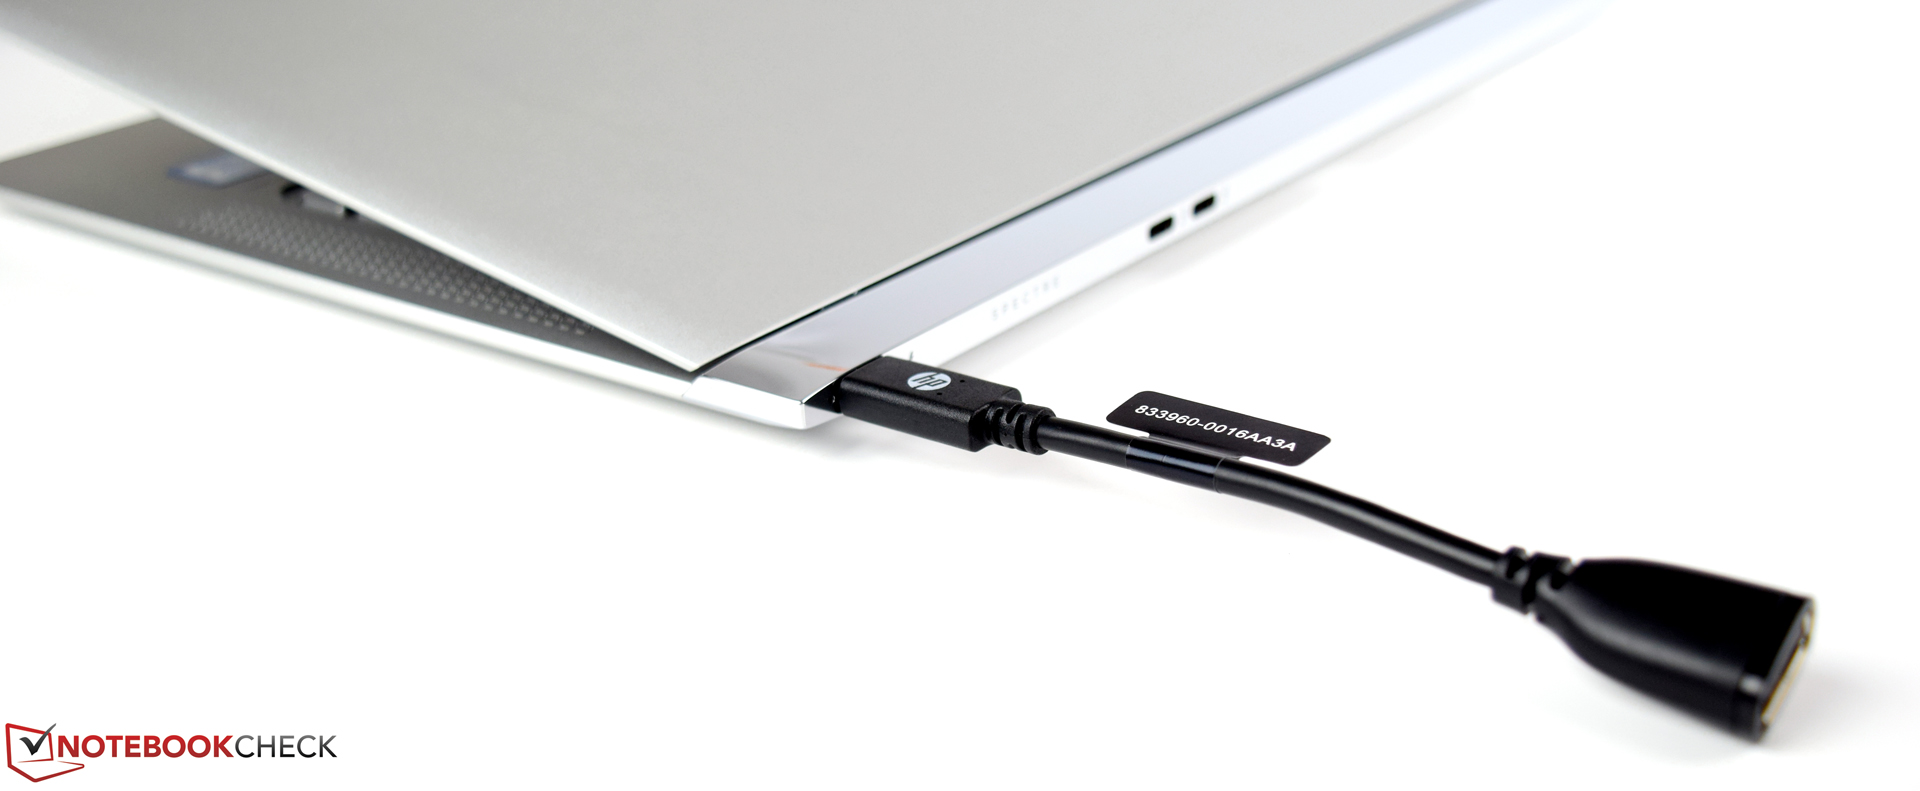
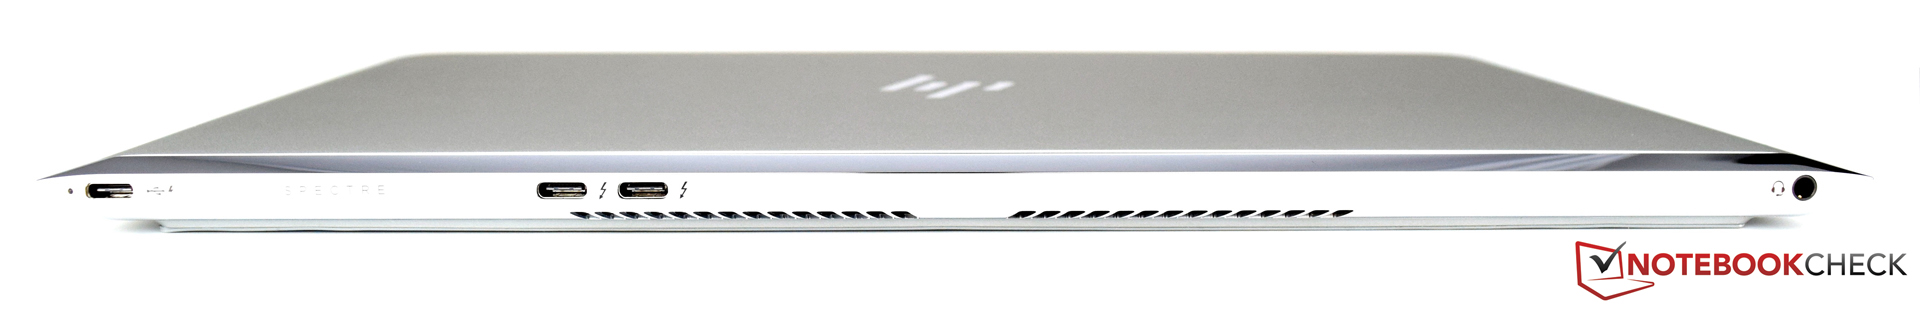
不过它也并不是尽善尽美,惠普Spectre 13的一些方面也还有改进的空间。较少的屏幕选项让人感到遗憾,如果它能够搭配一块QHD+屏幕将会更加吸引人。另外,超薄设计所带来的接口数量限制也不是个好消息。尽管它的三个USB-C接口中的两个都支持Thunderbolt 3,但是需要使用转接器仍然显得十分繁琐。不过,用户需要从长远角度在选购前考虑好这是否可以接受。同时,它1599欧元(约11688人民币)的价位也绝不算便宜。但是,用户可以得到一款来自惠普的抢眼高端设备。
注:本文是基于完整评测的缩减版本,阅读完整的英文评测,请点击这里。
HP Spectre 13-v131ng
- 03/26/2017 v6 (old)
Sebastian Bade