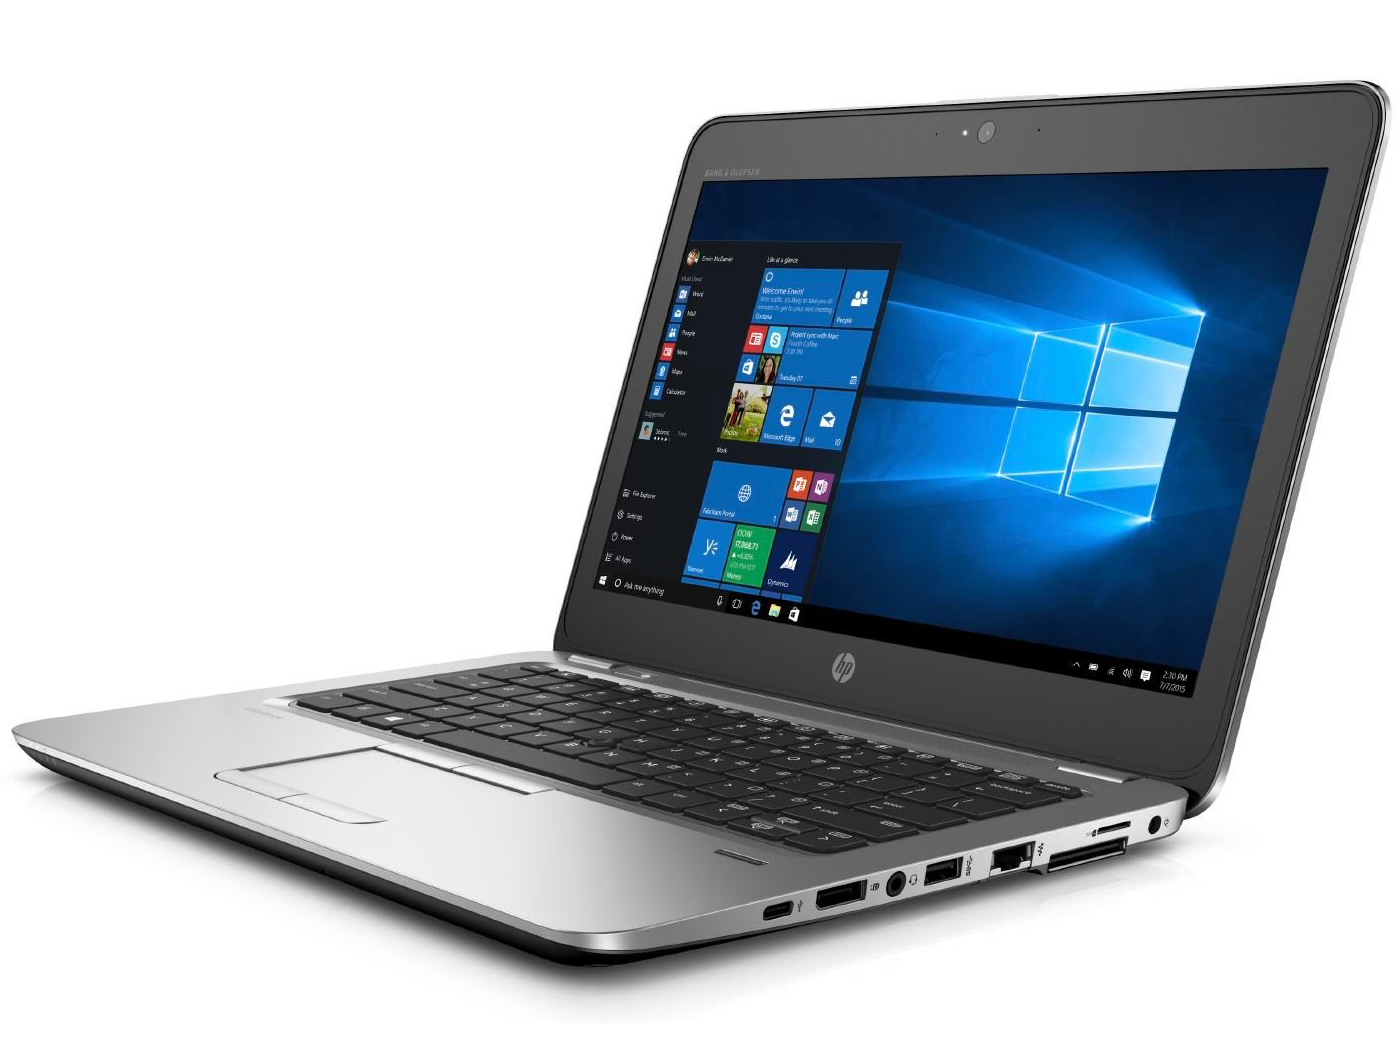
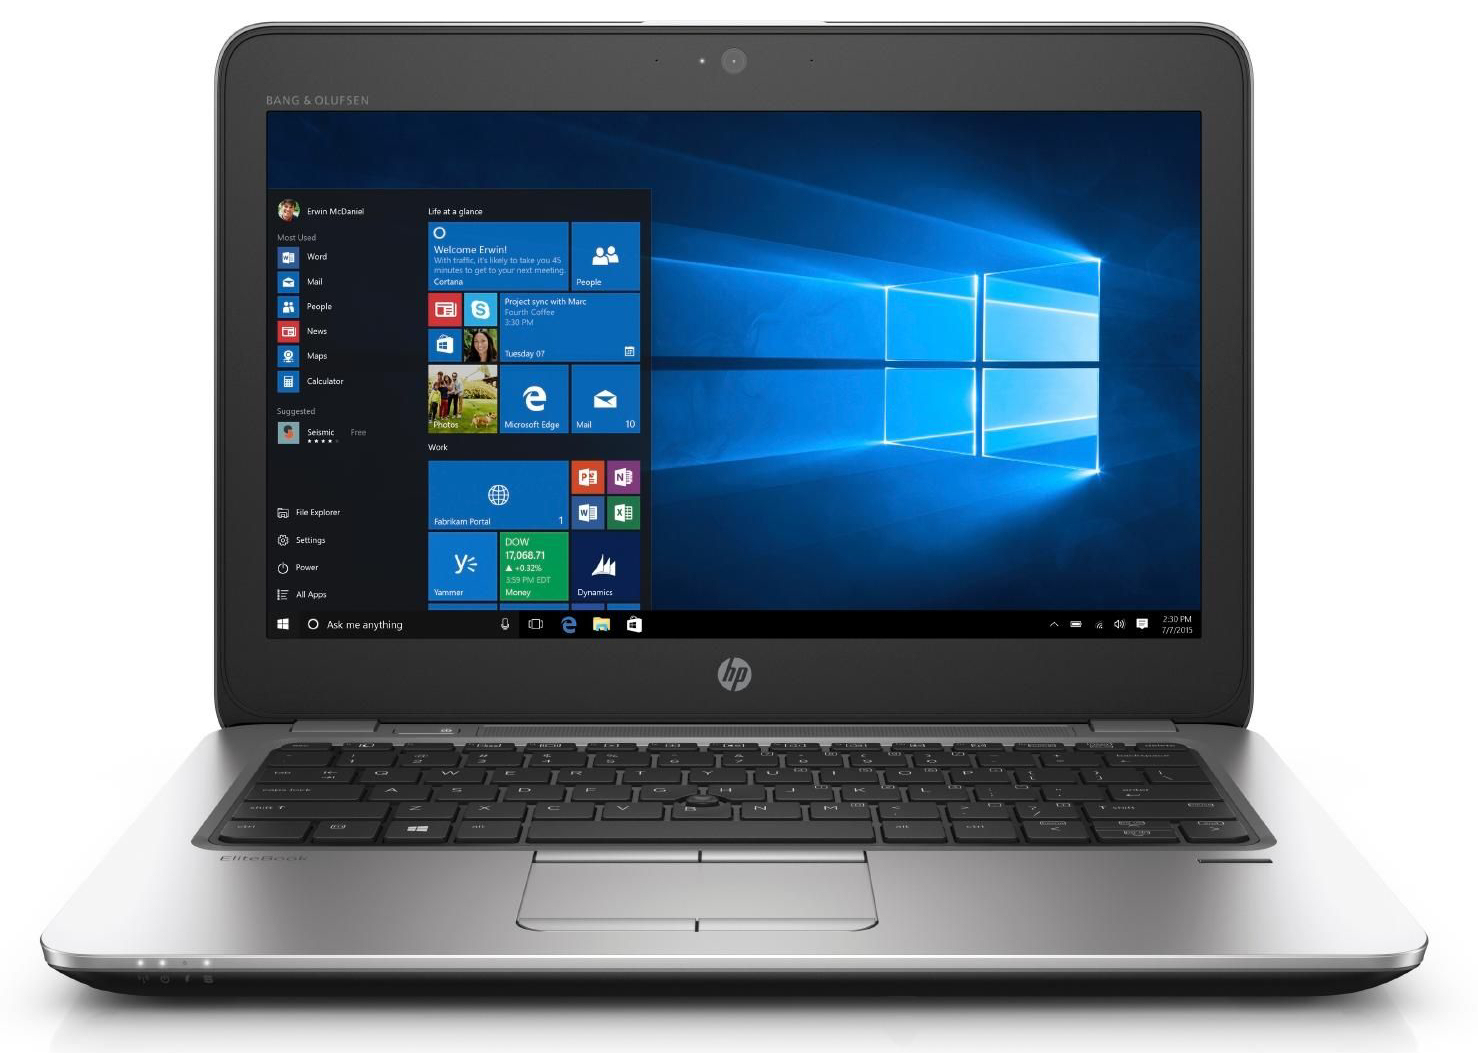
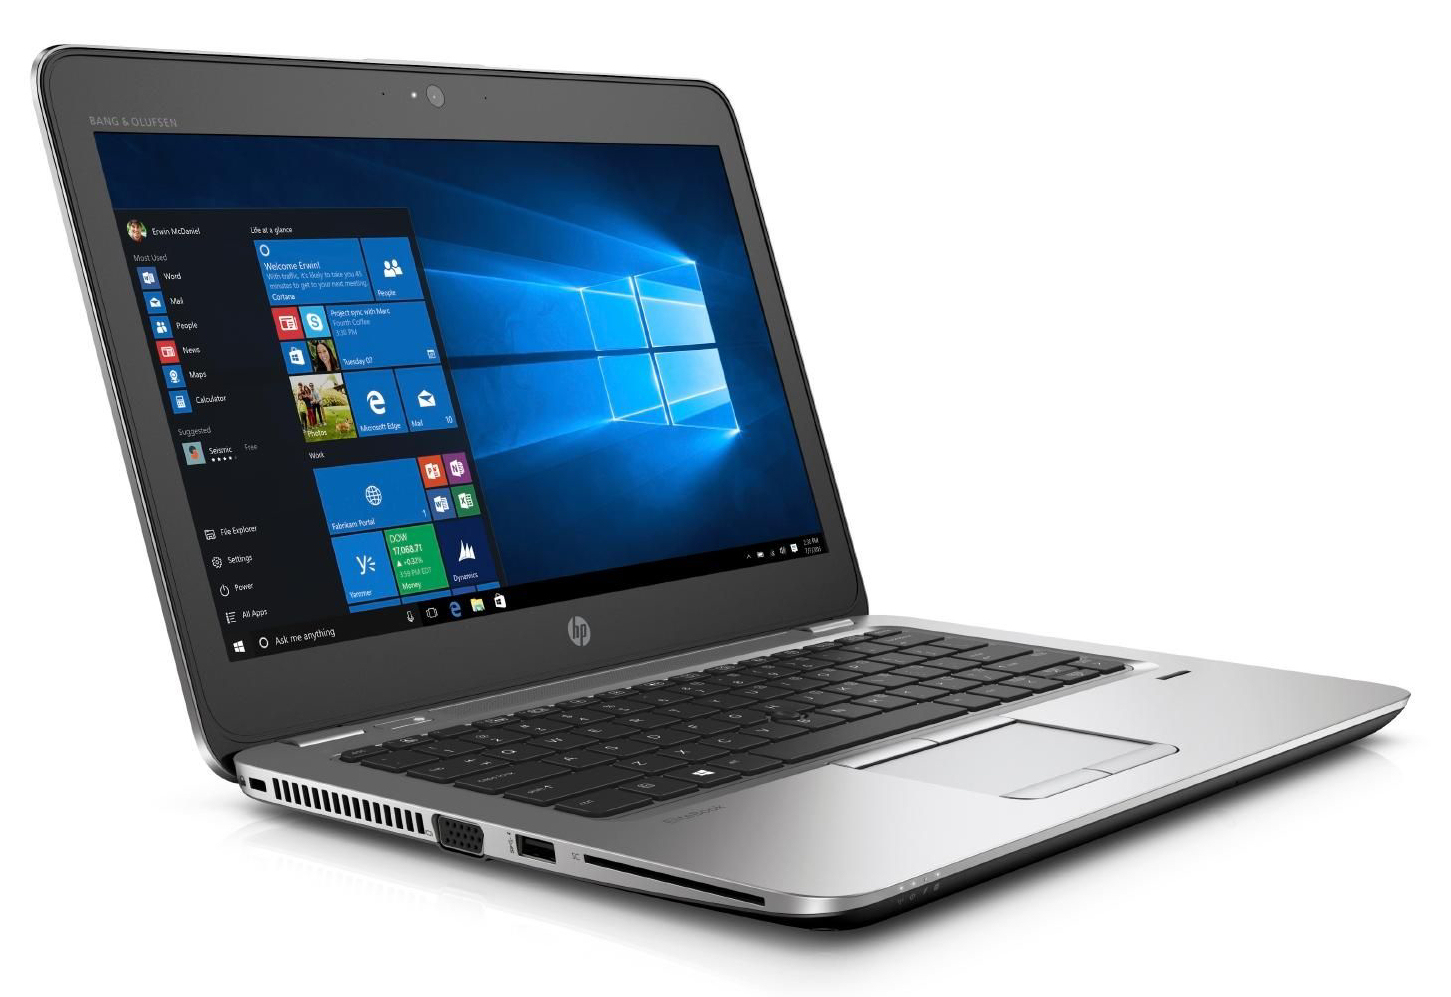
惠普 EliteBook 820 G4 (7500U, 全高清)笔记本简短评测
| SD Card Reader | |
| average JPG Copy Test (av. of 3 runs) | |
| Dell Latitude 12 E7270 | |
| HP EliteBook 820 G4 Z2V72ET | |
| HP EliteBook 820 G3 | |
| Toshiba Portege Z30-C-138 | |
| Lenovo ThinkPad X260-20F6007RGE | |
| HP EliteBook 725 G3-P4T48EA | |
| maximum AS SSD Seq Read Test (1GB) | |
| Dell Latitude 12 E7270 | |
| HP EliteBook 820 G3 | |
| HP EliteBook 820 G4 Z2V72ET | |
| Toshiba Portege Z30-C-138 | |
| Lenovo ThinkPad X260-20F6007RGE | |
| HP EliteBook 725 G3-P4T48EA | |
| Networking | |
| iperf3 transmit AX12 | |
| HP EliteBook 820 G4 Z2V72ET (jseb) | |
| iperf3 receive AX12 | |
| HP EliteBook 820 G4 Z2V72ET (jseb) | |
| iperf Client (transmit) TCP 1 m | |
| Apple MacBook 12 (Early 2016) 1.1 GHz | |
| iperf Server (receive) TCP 1 m | |
| Apple MacBook 12 (Early 2016) 1.1 GHz | |
| |||||||||||||||||||||||||
Brightness Distribution: 81 %
Center on Battery: 328 cd/m²
Contrast: 1124:1 (Black: 0.29 cd/m²)
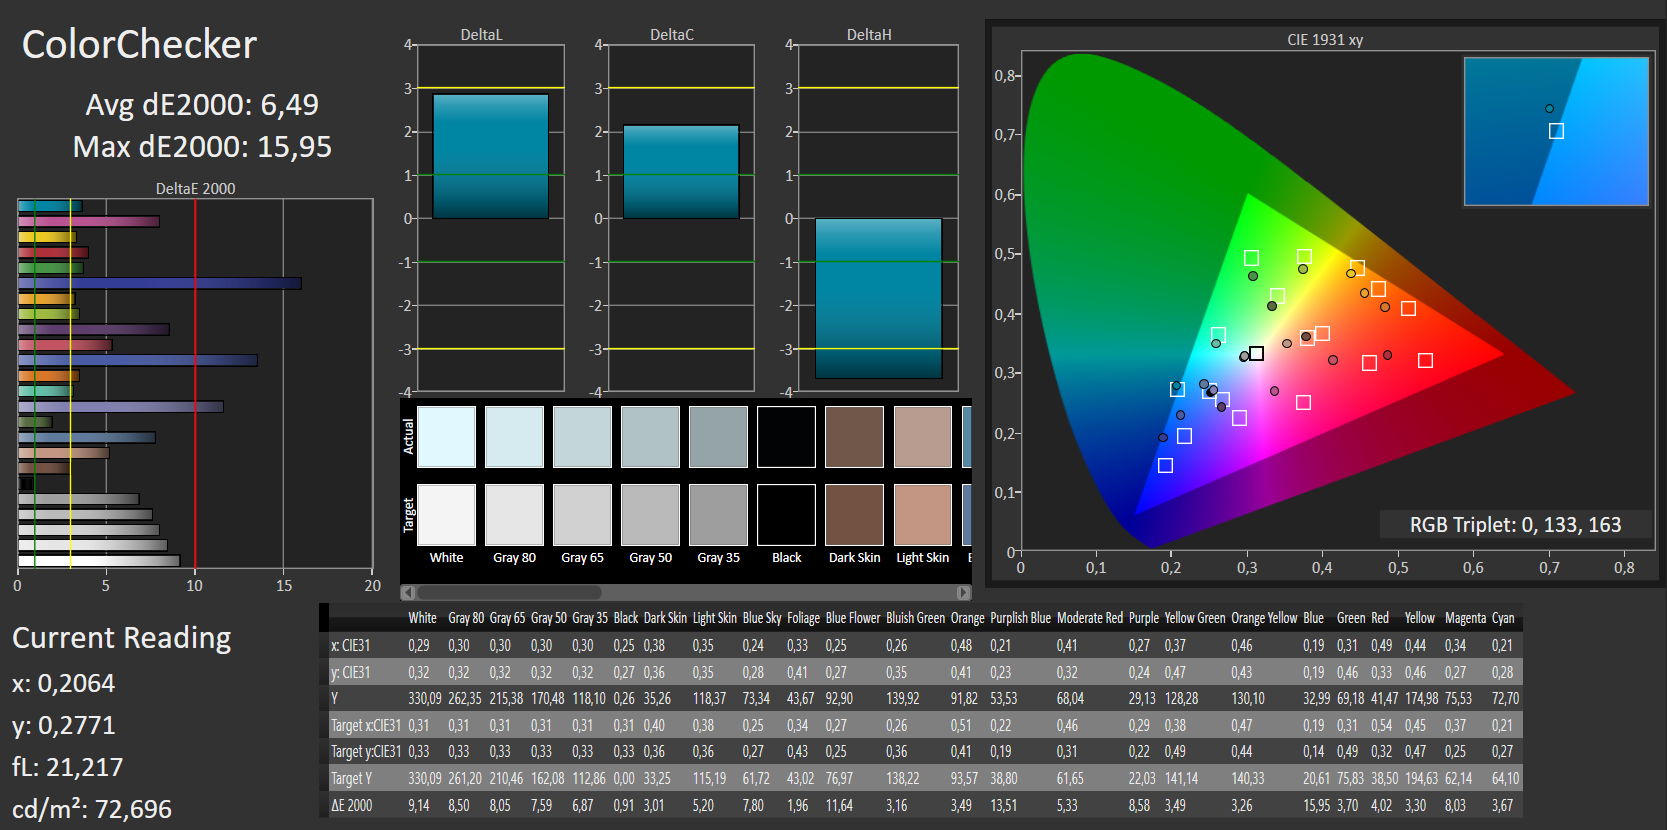
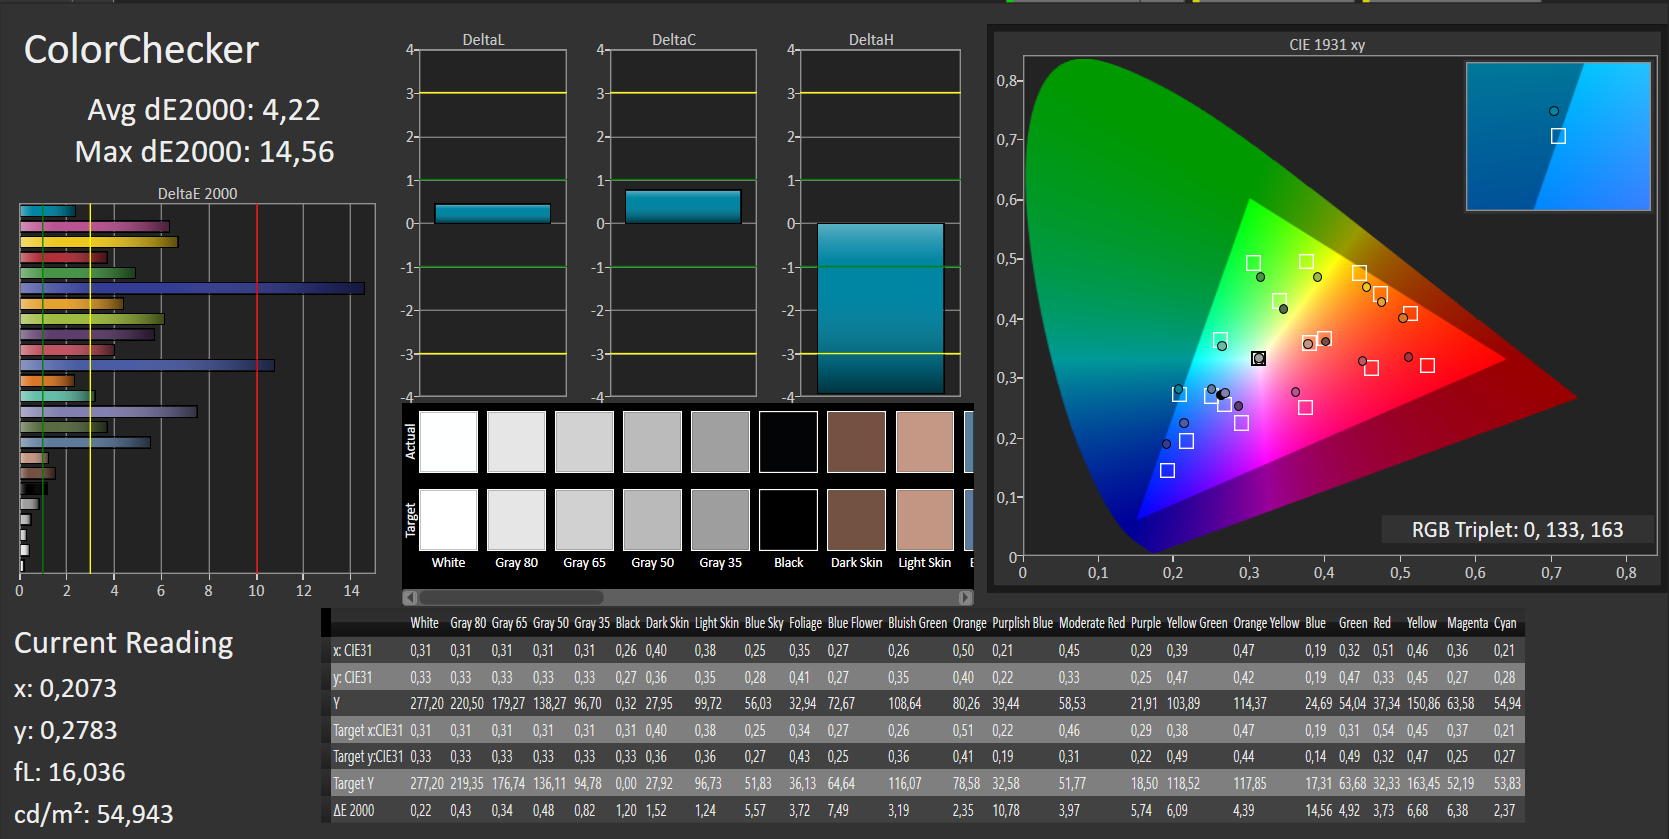
ΔE ColorChecker Calman: 6.49 | ∀{0.5-29.43 Ø4.71}
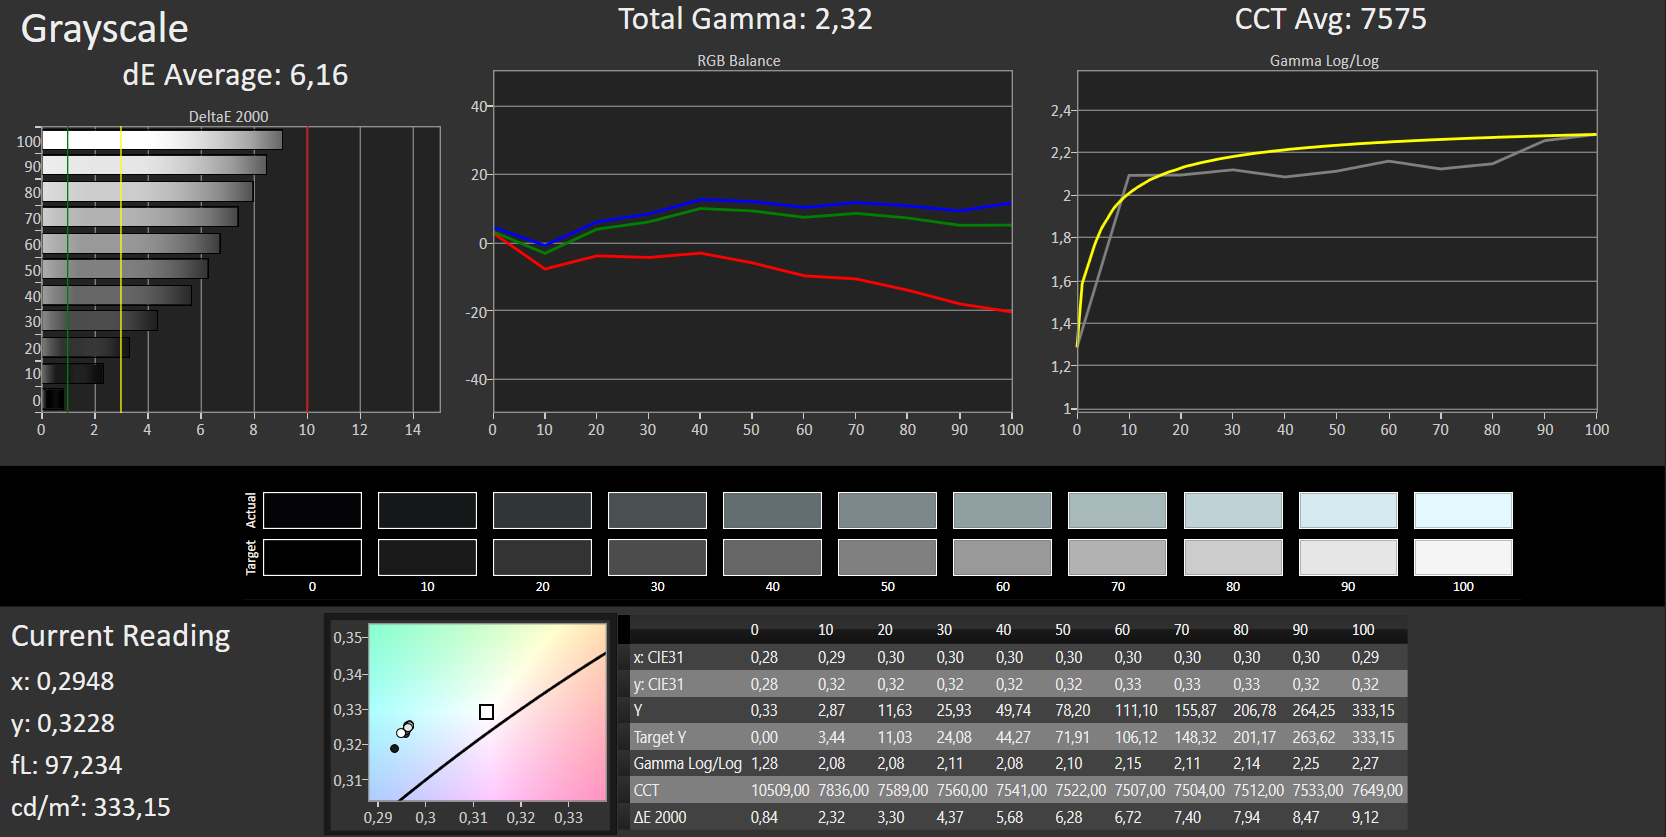
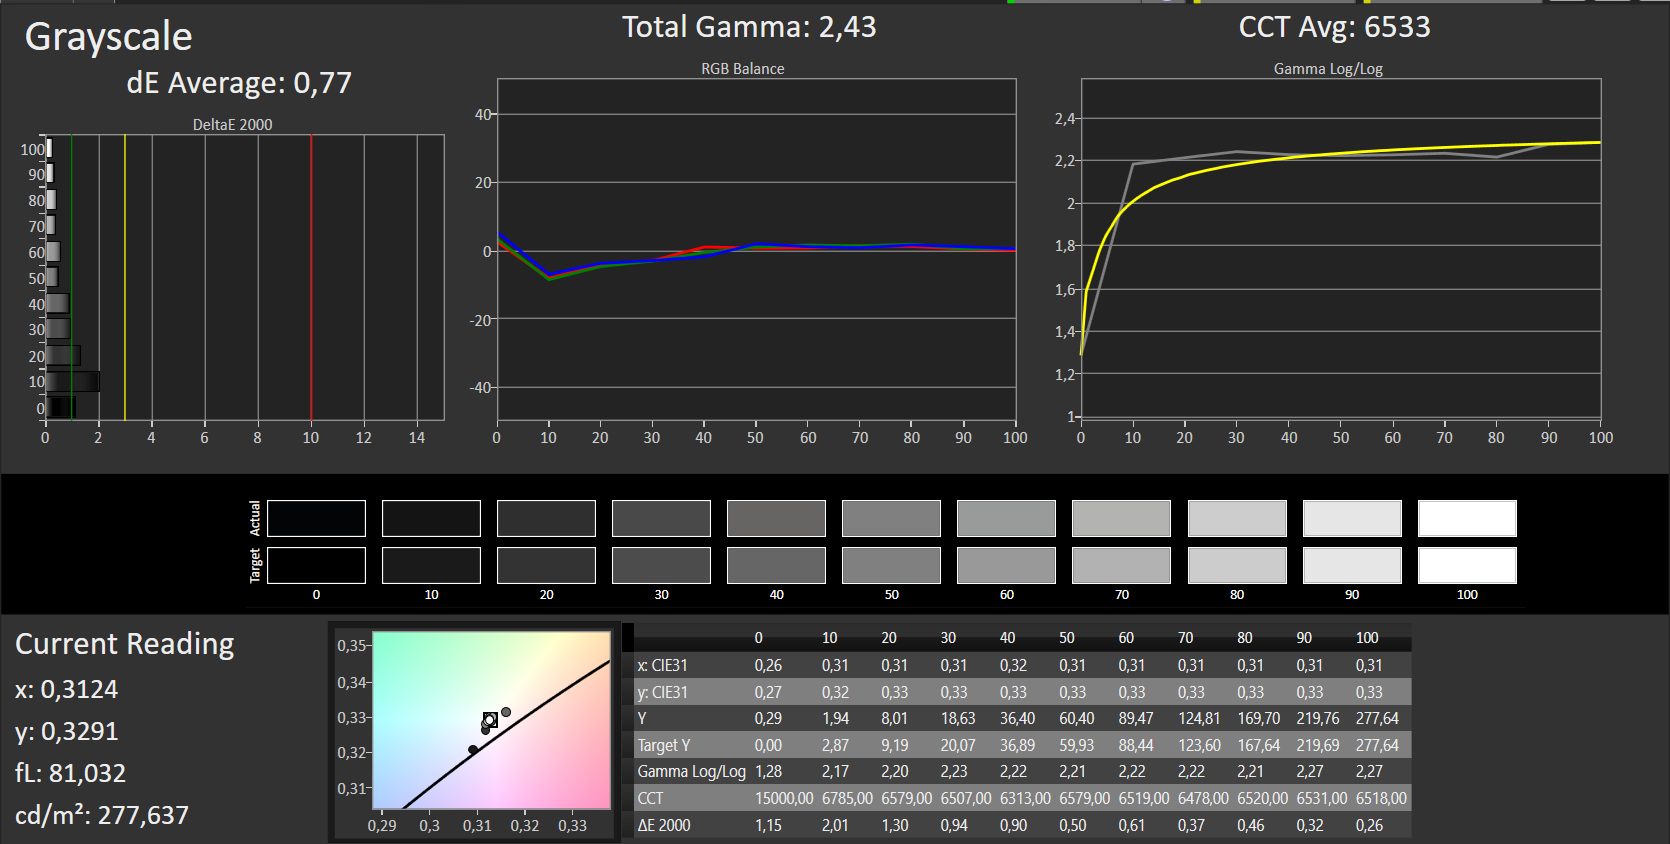
ΔE Greyscale Calman: 6.16 | ∀{0.09-98 Ø4.96}
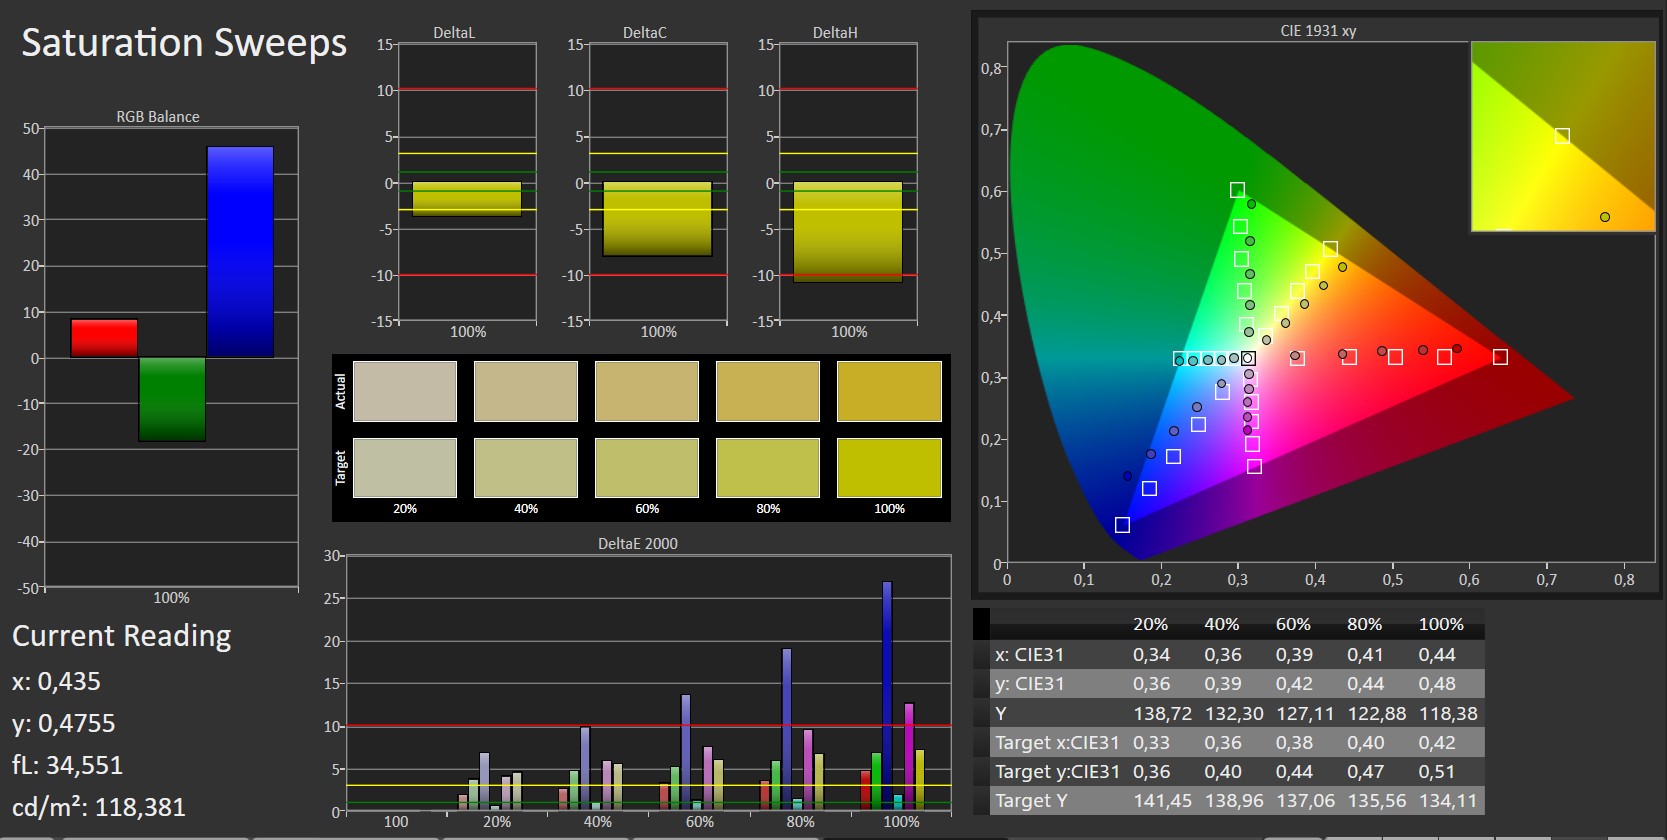
65% sRGB (Argyll 1.6.3 3D)
42% AdobeRGB 1998 (Argyll 1.6.3 3D)
46.04% AdobeRGB 1998 (Argyll 3D)
65.5% sRGB (Argyll 3D)
44.45% Display P3 (Argyll 3D)
Gamma: 2.32
CCT: 7575 K
| HP EliteBook 820 G4 Z2V72ET IPS, 1920x1080, 12.5" | HP EliteBook 820 G3 TN LED, 1366x768, 12.5" | HP EliteBook 725 G3-P4T48EA TN LED, 1366x768, 12.5" | Lenovo ThinkPad X260-20F6007RGE IPS, 1920x1080, 12.5" | Toshiba Portege Z30-C-138 IPS, 1920x1080, 13.3" | Dell Latitude 12 E7270 IPS LED, 1920x1080, 12.5" | Apple MacBook 12 (Early 2016) 1.1 GHz IPS, 2304x1440, 12" | |
|---|---|---|---|---|---|---|---|
| Display | -12% | 7% | 1% | 52% | -11% | 48% | |
| Display P3 Coverage (%) | 44.45 | 38.9 -12% | 47.15 6% | 44.71 1% | 67.9 53% | 39.7 -11% | 66.8 50% |
| sRGB Coverage (%) | 65.5 | 58.5 -11% | 71 8% | 66.1 1% | 98 50% | 59.2 -10% | 95.4 46% |
| AdobeRGB 1998 Coverage (%) | 46.04 | 40.2 -13% | 48.71 6% | 46.23 0% | 69.8 52% | 41.07 -11% | 68 48% |
| Response Times | -39% | -18% | 1% | -14% | -11% | -18% | |
| Response Time Grey 50% / Grey 80% * (ms) | 35 ? | 58 ? -66% | 50 ? -43% | 32.8 ? 6% | 42 ? -20% | 38.4 ? -10% | 41.2 ? -18% |
| Response Time Black / White * (ms) | 26 ? | 29.2 ? -12% | 24 ? 8% | 27.2 ? -5% | 28 ? -8% | 28.8 ? -11% | 30.4 ? -17% |
| PWM Frequency (Hz) | 217 ? | ||||||
| Screen | -33% | -24% | 4% | 13% | -12% | 26% | |
| Brightness middle (cd/m²) | 326 | 244 -25% | 241 -26% | 337 3% | 300 -8% | 353 8% | 387 19% |
| Brightness (cd/m²) | 304 | 240 -21% | 240 -21% | 322 6% | 280 -8% | 334 10% | 358 18% |
| Brightness Distribution (%) | 81 | 84 4% | 83 2% | 91 12% | 87 7% | 91 12% | 88 9% |
| Black Level * (cd/m²) | 0.29 | 0.6 -107% | 0.54 -86% | 0.32 -10% | 0.31 -7% | 0.47 -62% | 0.47 -62% |
| Contrast (:1) | 1124 | 407 -64% | 446 -60% | 1053 -6% | 968 -14% | 751 -33% | 823 -27% |
| Colorchecker dE 2000 * | 6.49 | 9 -39% | 8.04 -24% | 5.71 12% | 4.9 24% | 7.79 -20% | 1.6 75% |
| Colorchecker dE 2000 max. * | 15.95 | 15.73 1% | 13.9 13% | 15.39 4% | 8.91 44% | 15.19 5% | 4 75% |
| Greyscale dE 2000 * | 6.16 | 9.48 -54% | 9.52 -55% | 5.15 16% | 6.69 -9% | 7.38 -20% | 1 84% |
| Gamma | 2.32 95% | 2.44 90% | 2.42 91% | 2.38 92% | 2.33 94% | 2.43 91% | 2.26 97% |
| CCT | 7575 86% | 11116 58% | 11362 57% | 6881 94% | 6487 100% | 6158 106% | 6680 97% |
| Color Space (Percent of AdobeRGB 1998) (%) | 42 | 37.18 -11% | 45.03 7% | 42.38 1% | 63 50% | 37.72 -10% | 61.6 47% |
| Color Space (Percent of sRGB) (%) | 65 | 58.63 -10% | 71.12 9% | 65.62 1% | 98 51% | 58.87 -9% | 82.2 26% |
| Total Average (Program / Settings) | -28% /
-29% | -12% /
-17% | 2% /
3% | 17% /
17% | -11% /
-11% | 19% /
25% |
* ... smaller is better
Screen Flickering / PWM (Pulse-Width Modulation)
| Screen flickering / PWM not detected | ||
In comparison: 52 % of all tested devices do not use PWM to dim the display. If PWM was detected, an average of 7754 (minimum: 5 - maximum: 343500) Hz was measured. | ||
Display Response Times
| ↔ Response Time Black to White | ||
|---|---|---|
| 26 ms ... rise ↗ and fall ↘ combined | ↗ 7 ms rise | 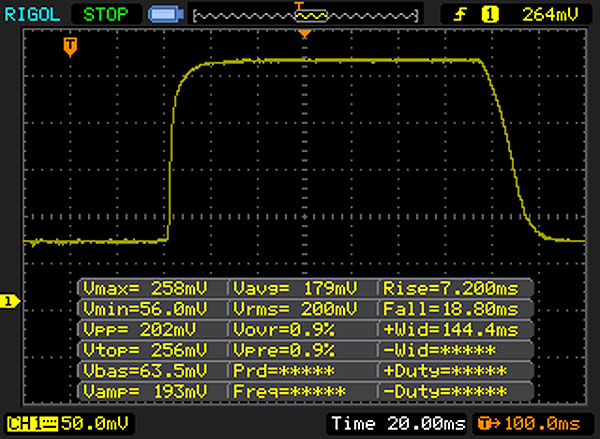 |
| ↘ 19 ms fall | ||
| The screen shows relatively slow response rates in our tests and may be too slow for gamers. In comparison, all tested devices range from 0.1 (minimum) to 240 (maximum) ms. » 63 % of all devices are better. This means that the measured response time is worse than the average of all tested devices (19.8 ms). | ||
| ↔ Response Time 50% Grey to 80% Grey | ||
| 35 ms ... rise ↗ and fall ↘ combined | ↗ 16 ms rise | 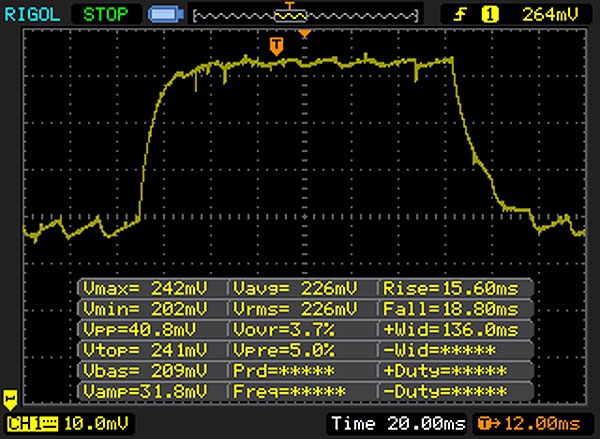 |
| ↘ 19 ms fall | ||
| The screen shows slow response rates in our tests and will be unsatisfactory for gamers. In comparison, all tested devices range from 0.165 (minimum) to 636 (maximum) ms. » 49 % of all devices are better. This means that the measured response time is worse than the average of all tested devices (31 ms). | ||
| Geekbench 3 | |
| 32 Bit Single-Core Score | |
| HP EliteBook 820 G4 Z2V72ET | |
| Lenovo ThinkPad X260-20F6007RGE | |
| HP EliteBook 725 G3-P4T48EA | |
| 32 Bit Multi-Core Score | |
| HP EliteBook 820 G4 Z2V72ET | |
| Lenovo ThinkPad X260-20F6007RGE | |
| HP EliteBook 725 G3-P4T48EA | |
| Geekbench 4.0 | |
| 64 Bit Single-Core Score | |
| HP EliteBook 820 G4 Z2V72ET | |
| 64 Bit Multi-Core Score | |
| HP EliteBook 820 G4 Z2V72ET | |
| PCMark 7 Score | 5376 points | |
| PCMark 8 Home Score Accelerated v2 | 3660 points | |
| PCMark 8 Creative Score Accelerated v2 | 4631 points | |
| PCMark 8 Work Score Accelerated v2 | 4824 points | |
Help | ||

| HP EliteBook 820 G4 Z2V72ET Samsung PM951 NVMe MZVLV512 | HP EliteBook 820 G3 Samsung SM951 MZVPV256HDGL m.2 PCI-e | Lenovo ThinkPad X260-20F6007RGE Liteonit LCH-512V2S | Toshiba Portege Z30-C-138 Toshiba HG6 THNSNJ512G8NY | Dell Latitude 12 E7270 Liteon L8H-256V2G | Apple MacBook 12 (Early 2016) 1.1 GHz Apple SSD AP0256 | |
|---|---|---|---|---|---|---|
| CrystalDiskMark 3.0 | 23% | -44% | -48% | -50% | -29% | |
| Read Seq (MB/s) | 1315 | 1255 -5% | 499.6 -62% | 518 -61% | 498.4 -62% | 754 -43% |
| Write Seq (MB/s) | 594 | 1240 109% | 403 -32% | 423.3 -29% | 286.7 -52% | 638 7% |
| Read 512 (MB/s) | 661 | 1131 71% | 322.9 -51% | 414.8 -37% | 616 -7% | |
| Write 512 (MB/s) | 594 | 811 37% | 372.4 -37% | 379.9 -36% | 678 14% | |
| Read 4k (MB/s) | 42.87 | 51 19% | 27.22 -37% | 21.17 -51% | 24.89 -42% | 14.6 -66% |
| Write 4k (MB/s) | 151.6 | 134.1 -12% | 83.6 -45% | 86.3 -43% | 88 -42% | 20.5 -86% |
| Read 4k QD32 (MB/s) | 568 | 549 -3% | 316.5 -44% | 227.3 -60% | 280.5 -51% | 464 -18% |
| Write 4k QD32 (MB/s) | 491.7 | 343.9 -30% | 273.1 -44% | 174.7 -64% | 241.9 -51% | 315 -36% |
| 3DMark 06 Standard Score | 7375 points | |
| 3DMark 11 Performance | 1645 points | |
| 3DMark Ice Storm Standard Score | 56060 points | |
| 3DMark Cloud Gate Standard Score | 6084 points | |
| 3DMark Fire Strike Score | 822 points | |
| 3DMark Fire Strike Extreme Score | 370 points | |
Help | ||
| low | med. | high | ultra | |
|---|---|---|---|---|
| Tomb Raider (2013) | 70.3 | 36.2 | 21.3 | 10.4 |
| BioShock Infinite (2013) | 41.9 | 25.9 | 21.3 | 6.9 |
| Battlefield 4 (2013) | 33 | 26.9 | 17.4 | 6.1 |
Noise level
| Idle |
| 30.7 / 30.7 / 30.7 dB(A) |
| Load |
| 35.3 / 33.7 dB(A) |
 | ||
30 dB silent 40 dB(A) audible 50 dB(A) loud |
||
min: | ||
| HP EliteBook 820 G4 Z2V72ET i7-7500U, HD Graphics 620 | HP EliteBook 820 G3 6300U, HD Graphics 520 | HP EliteBook 725 G3-P4T48EA Pro A10-8700B, Radeon R6 (Carrizo) | Lenovo ThinkPad X260-20F6007RGE 6500U, HD Graphics 520 | Toshiba Portege Z30-C-138 6500U, HD Graphics 520 | Dell Latitude 12 E7270 6300U, HD Graphics 520 | |
|---|---|---|---|---|---|---|
| Noise | 2% | -2% | 2% | -10% | 4% | |
| off / environment * (dB) | 30.7 | 29.2 5% | 28.9 6% | 29 6% | 31.2 -2% | 28.9 6% |
| Idle Minimum * (dB) | 30.7 | 29.2 5% | 30.5 1% | 29 6% | 31.2 -2% | 28.9 6% |
| Idle Average * (dB) | 30.7 | 29.2 5% | 30.5 1% | 29 6% | 31.2 -2% | 28.9 6% |
| Idle Maximum * (dB) | 30.7 | 29.2 5% | 30.5 1% | 29 6% | 31.2 -2% | 28.9 6% |
| Load Average * (dB) | 35.3 | 35.6 -1% | 38.2 -8% | 35.1 1% | 43.3 -23% | 31.3 11% |
| Load Maximum * (dB) | 33.7 | 37 -10% | 38.4 -14% | 37.8 -12% | 43.3 -28% | 37.6 -12% |
* ... smaller is better
(+) The maximum temperature on the upper side is 37 °C / 99 F, compared to the average of 35.9 °C / 97 F, ranging from 21.4 to 59 °C for the class Subnotebook.
(+) The bottom heats up to a maximum of 38.9 °C / 102 F, compared to the average of 39.2 °C / 103 F
(+) In idle usage, the average temperature for the upper side is 25.7 °C / 78 F, compared to the device average of 30.8 °C / 87 F.
(+) The palmrests and touchpad are cooler than skin temperature with a maximum of 27.8 °C / 82 F and are therefore cool to the touch.
(±) The average temperature of the palmrest area of similar devices was 28.2 °C / 82.8 F (+0.4 °C / 0.8 F).
| HP EliteBook 820 G4 Z2V72ET i7-7500U, HD Graphics 620 | HP EliteBook 820 G3 6300U, HD Graphics 520 | HP EliteBook 725 G3-P4T48EA Pro A10-8700B, Radeon R6 (Carrizo) | Lenovo ThinkPad X260-20F6007RGE 6500U, HD Graphics 520 | Toshiba Portege Z30-C-138 6500U, HD Graphics 520 | Dell Latitude 12 E7270 6300U, HD Graphics 520 | Apple MacBook 12 (Early 2016) 1.1 GHz 6Y30, HD Graphics 515 | |
|---|---|---|---|---|---|---|---|
| Heat | -9% | -29% | -27% | 3% | -27% | -15% | |
| Maximum Upper Side * (°C) | 37 | 39.6 -7% | 42.8 -16% | 47.5 -28% | 40.6 -10% | 44.3 -20% | 39 -5% |
| Maximum Bottom * (°C) | 38.9 | 40.1 -3% | 54.3 -40% | 43.6 -12% | 37 5% | 52.6 -35% | 44 -13% |
| Idle Upper Side * (°C) | 26.3 | 29.4 -12% | 33.2 -26% | 34.9 -33% | 24.5 7% | 32.3 -23% | 32 -22% |
| Idle Bottom * (°C) | 27 | 30.6 -13% | 36.5 -35% | 35.9 -33% | 24.9 8% | 35.1 -30% | 32 -19% |
* ... smaller is better
HP EliteBook 820 G4 Z2V72ET audio analysis
(-) | not very loud speakers (66 dB)
Bass 100 - 315 Hz
(±) | reduced bass - on average 14.6% lower than median
(±) | linearity of bass is average (7.6% delta to prev. frequency)
Mids 400 - 2000 Hz
(+) | balanced mids - only 1.1% away from median
(+) | mids are linear (4.7% delta to prev. frequency)
Highs 2 - 16 kHz
(±) | higher highs - on average 5.8% higher than median
(+) | highs are linear (5% delta to prev. frequency)
Overall 100 - 16.000 Hz
(±) | linearity of overall sound is average (17.6% difference to median)
Compared to same class
» 49% of all tested devices in this class were better, 7% similar, 45% worse
» The best had a delta of 5%, average was 18%, worst was 53%
Compared to all devices tested
» 35% of all tested devices were better, 8% similar, 57% worse
» The best had a delta of 4%, average was 23%, worst was 134%
Apple MacBook 12 (Early 2016) 1.1 GHz audio analysis
(+) | speakers can play relatively loud (83.6 dB)
Bass 100 - 315 Hz
(±) | reduced bass - on average 11.3% lower than median
(±) | linearity of bass is average (14.2% delta to prev. frequency)
Mids 400 - 2000 Hz
(+) | balanced mids - only 2.4% away from median
(+) | mids are linear (5.5% delta to prev. frequency)
Highs 2 - 16 kHz
(+) | balanced highs - only 2% away from median
(+) | highs are linear (4.5% delta to prev. frequency)
Overall 100 - 16.000 Hz
(+) | overall sound is linear (10.2% difference to median)
Compared to same class
» 7% of all tested devices in this class were better, 2% similar, 90% worse
» The best had a delta of 5%, average was 18%, worst was 53%
Compared to all devices tested
» 5% of all tested devices were better, 1% similar, 94% worse
» The best had a delta of 4%, average was 23%, worst was 134%
| Off / Standby | |
| Idle | |
| Load |
|
Key:
min: | |
| HP EliteBook 820 G4 Z2V72ET i7-7500U, HD Graphics 620 | HP EliteBook 820 G3 6300U, HD Graphics 520 | HP EliteBook 725 G3-P4T48EA Pro A10-8700B, Radeon R6 (Carrizo) | Lenovo ThinkPad X260-20F6007RGE 6500U, HD Graphics 520 | Toshiba Portege Z30-C-138 6500U, HD Graphics 520 | Dell Latitude 12 E7270 6300U, HD Graphics 520 | Apple MacBook 12 (Early 2016) 1.1 GHz 6Y30, HD Graphics 515 | |
|---|---|---|---|---|---|---|---|
| Power Consumption | -14% | -70% | -19% | -37% | -18% | 17% | |
| Idle Minimum * (Watt) | 2.7 | 3.5 -30% | 5.4 -100% | 3.5 -30% | 3.2 -19% | 3.8 -41% | 2.7 -0% |
| Idle Average * (Watt) | 4.8 | 5.4 -13% | 7.5 -56% | 5.5 -15% | 7.8 -63% | 6.7 -40% | 2.7 44% |
| Idle Maximum * (Watt) | 6.6 | 6.2 6% | 13 -97% | 6.7 -2% | 8.7 -32% | 7.2 -9% | 7.2 -9% |
| Load Average * (Watt) | 28.5 | 27.3 4% | 41.2 -45% | 28.9 -1% | 42.2 -48% | 27.2 5% | 22 23% |
| Load Maximum * (Watt) | 29 | 39.5 -36% | 44.7 -54% | 42.1 -45% | 35.7 -23% | 30.2 -4% | 20.5 29% |
* ... smaller is better
| HP EliteBook 820 G4 Z2V72ET i7-7500U, HD Graphics 620, 49 Wh | HP EliteBook 820 G3 6300U, HD Graphics 520, 44 Wh | HP EliteBook 725 G3-P4T48EA Pro A10-8700B, Radeon R6 (Carrizo), 44 Wh | Lenovo ThinkPad X260-20F6007RGE 6500U, HD Graphics 520, 46 Wh | Toshiba Portege Z30-C-138 6500U, HD Graphics 520, 52 Wh | Dell Latitude 12 E7270 6300U, HD Graphics 520, 55 Wh | Apple MacBook 12 (Early 2016) 1.1 GHz 6Y30, HD Graphics 515, 41.4 Wh | |
|---|---|---|---|---|---|---|---|
| Battery runtime | -27% | -55% | -27% | -38% | -19% | 0% | |
| Reader / Idle (h) | 22.4 | 13.8 -38% | 9.2 -59% | 15.9 -29% | 17.5 -22% | ||
| H.264 (h) | 8.9 | 8.3 -7% | 4.3 -52% | 7.8 -12% | 8.5 -4% | ||
| WiFi v1.3 (h) | 9.4 | 6.2 -34% | 4.7 -50% | 8.4 -11% | 5.8 -38% | 8.5 -10% | 8.4 -11% |
| Load (h) | 3.4 | 2.4 -29% | 1.4 -59% | 1.5 -56% | 2.6 -24% | 3.9 15% |
Pros
Cons
惠普 EliteBook 820 G4主要是更新了Kaby Lake,它也许能让拥有老型号的用户产生兴趣。然而,这并不是因为Kaby Lake与Skylake相比之下的性能那点增益。
显著延长电池续航时间,使计算机(更)具有吸引力。
无论负载如何,计算机保持低温,大多数时间工作运行安静。只要风扇静止或以非常低的速度工作,设备安静。否则,您可能会听到安静的哨声。这种情况不应该发生在这个价位的电脑上; 并且,我们已经在前代的测评中批评了这一点。
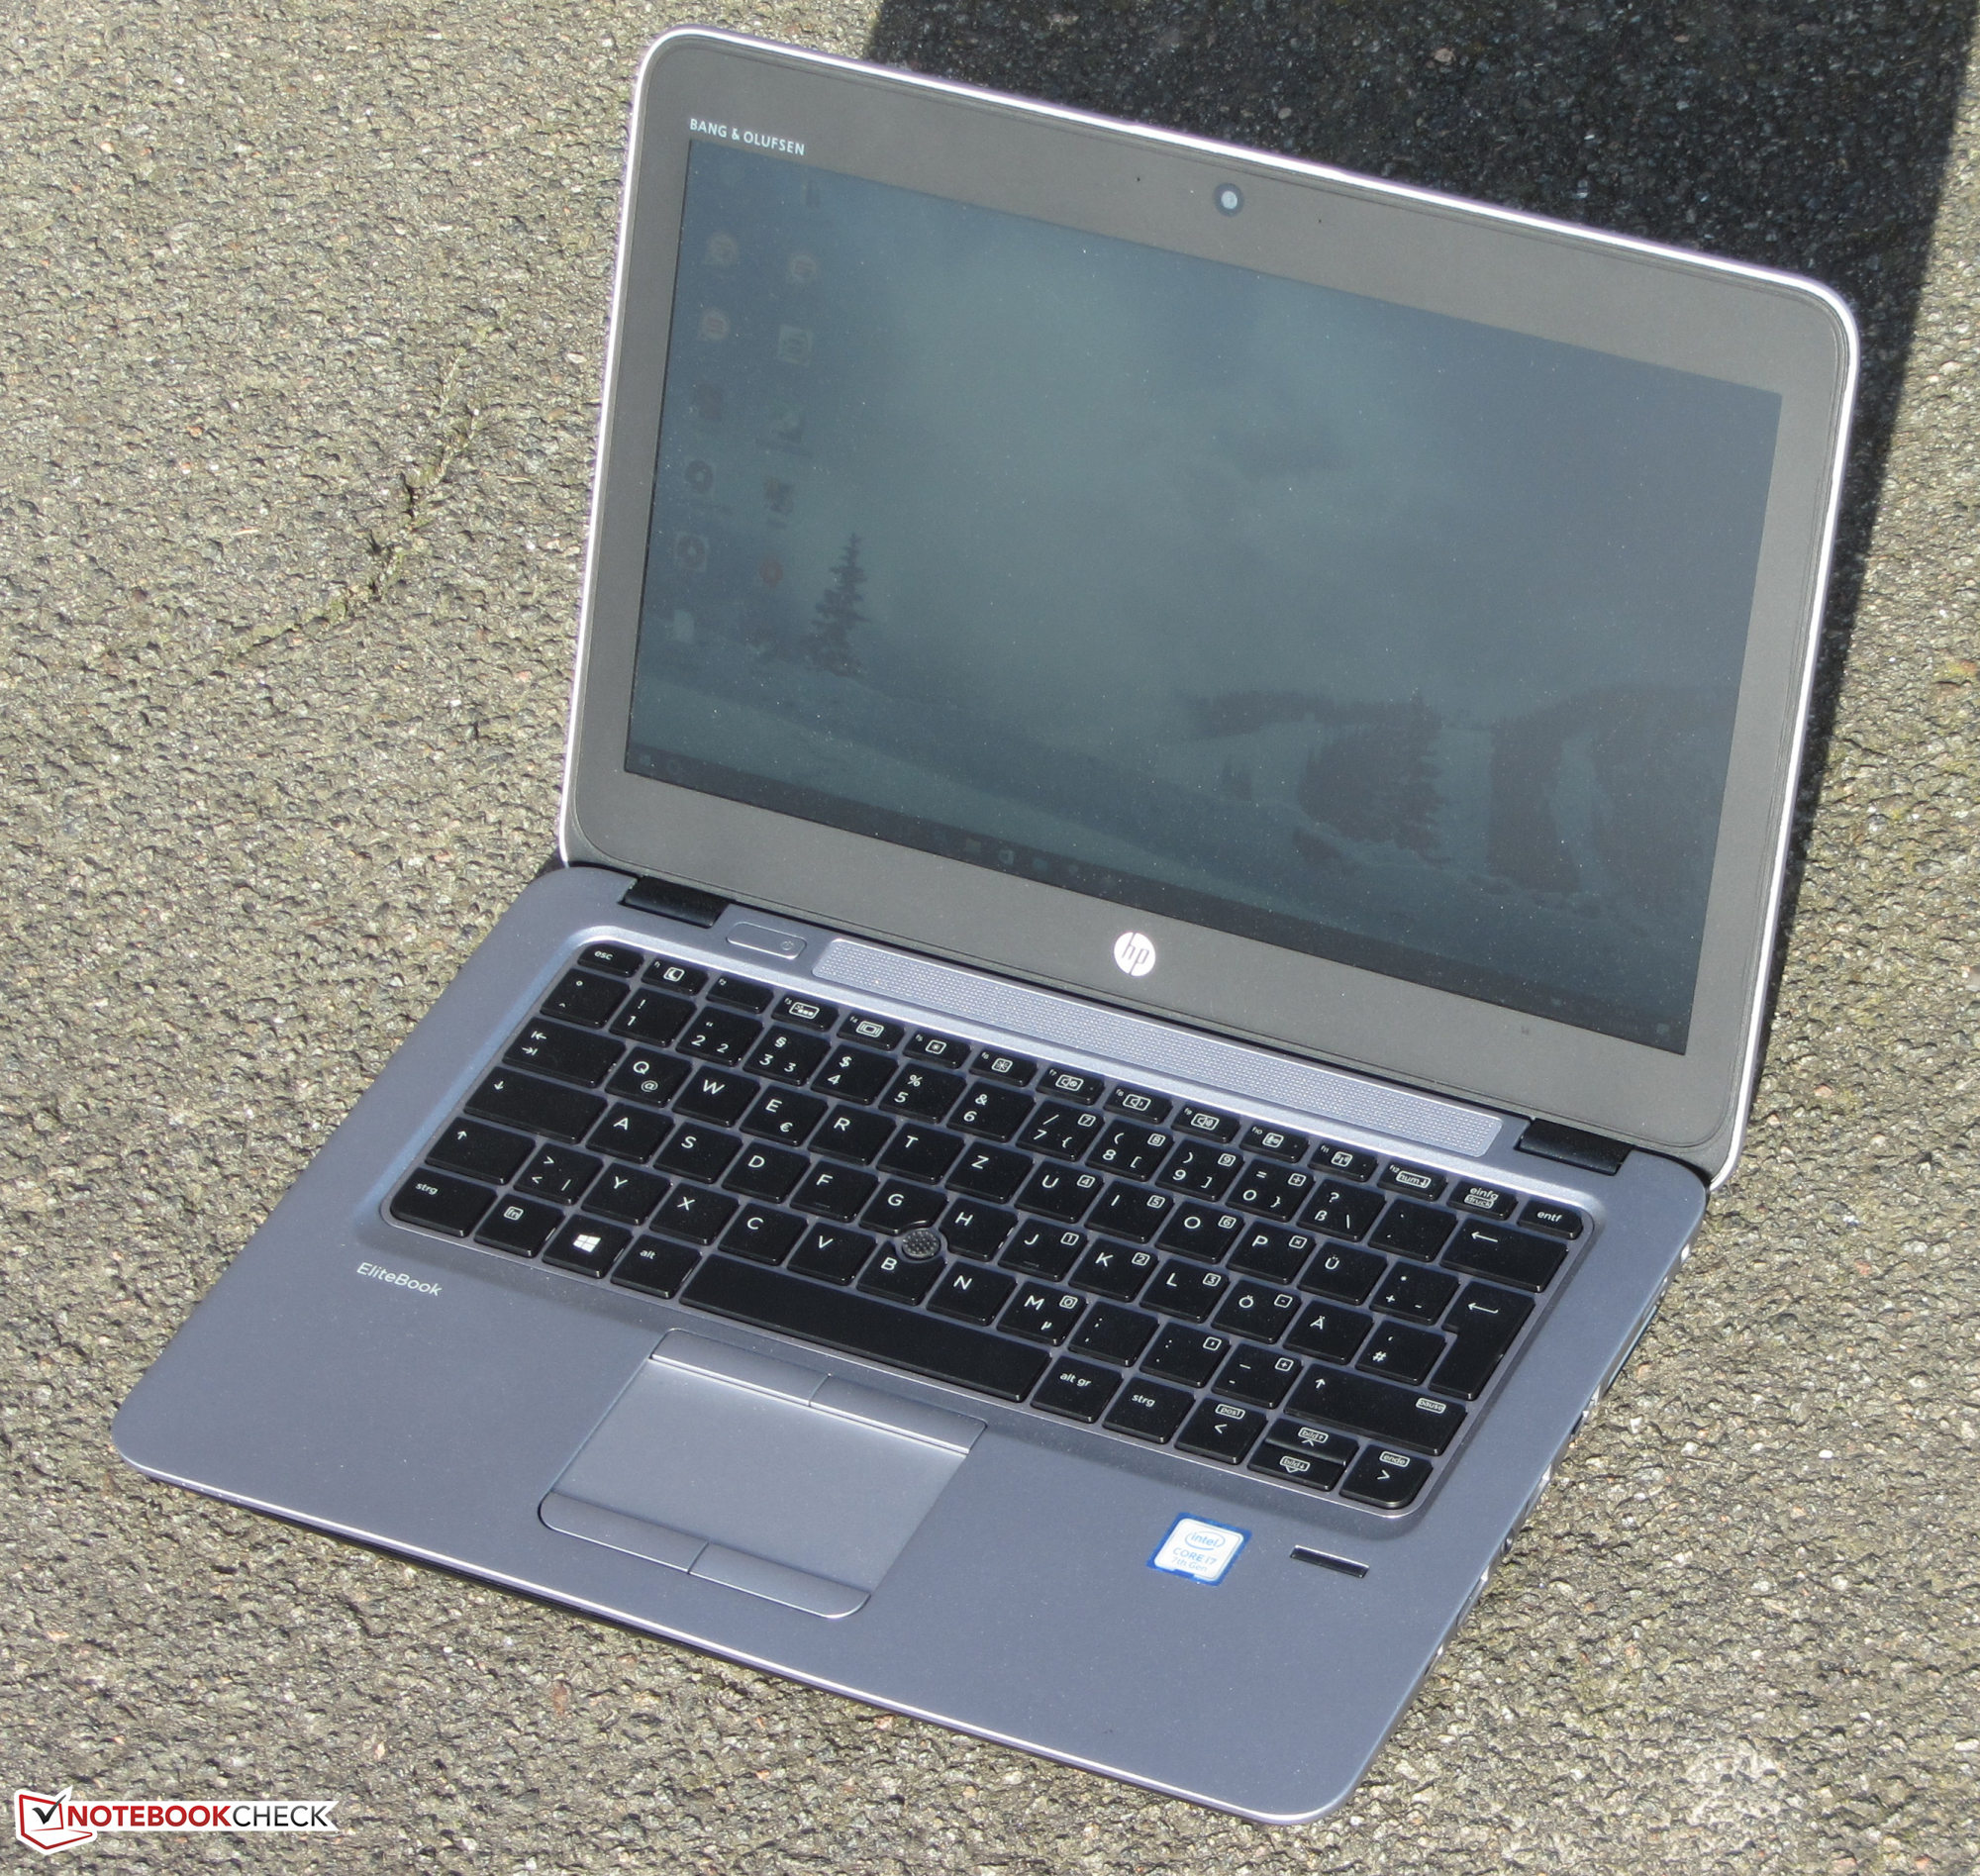
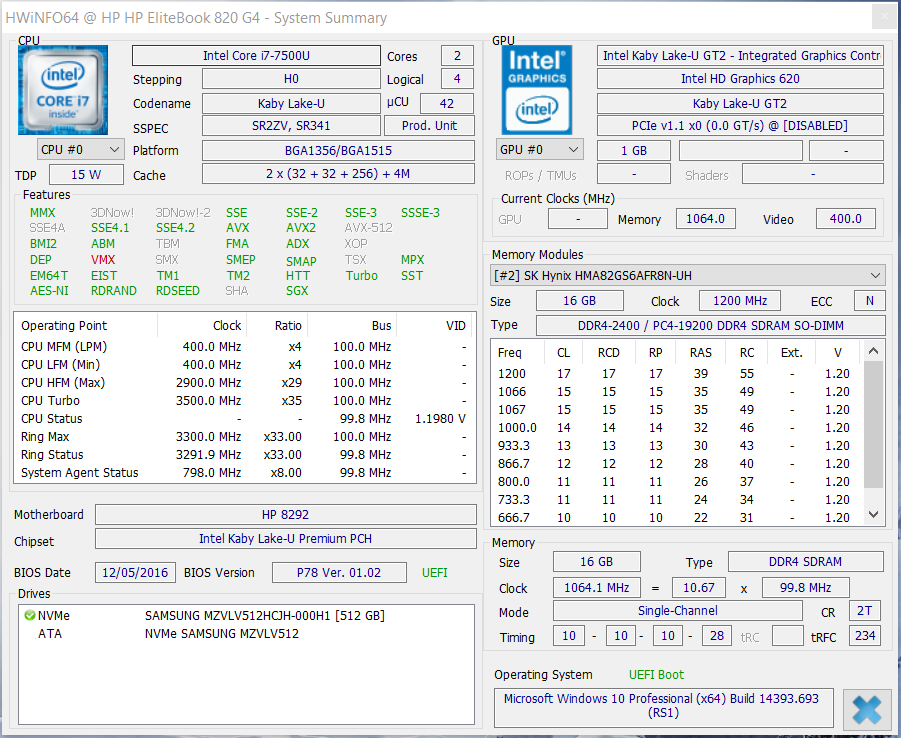
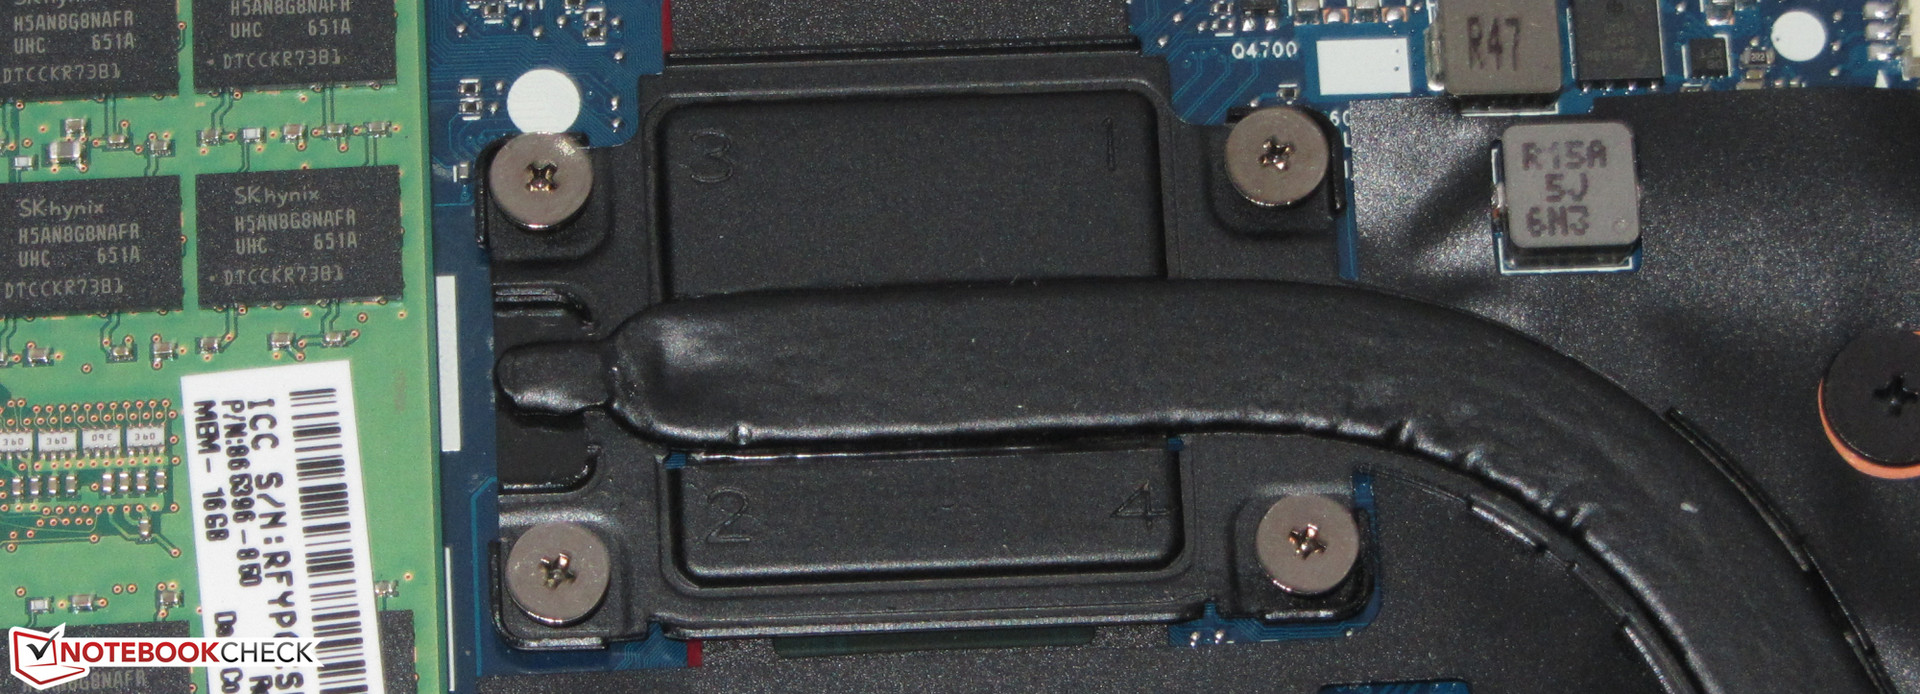
快速NVMe-固态硬盘确保系统响应速度。固态硬盘可更换。这需要拆开笔记本电脑的D面——不太费劲。外壳和键盘保持不变:惠普提供我们所习惯的质量保证。
我们很少赞赏惠普的商务笔记本的显示屏。然而,这一次有所不同:惠普提供了一个明亮、对比度丰富、视角稳定的IPS面板屏幕。开箱即用时,色彩表现也很优秀。
注:本文是基于完整评测的缩减版本,阅读完整的英文评测,请点击这里。
HP EliteBook 820 G4 Z2V72ET
- 02/24/2017 v6 (old)
Sascha Mölck