联想 ThinkPad Yoga 370 (7200U, 全高清) 变形本简短评测

| SD Card Reader | |
| average JPG Copy Test (av. of 3 runs) | |
| Lenovo ThinkPad Yoga 370-20JJS00100 | |
| Dell XPS 13-9365 2-in-1 | |
| Lenovo ThinkPad X1 Carbon 2017-20HQS03P00 | |
| maximum AS SSD Seq Read Test (1GB) | |
| Dell XPS 13-9365 2-in-1 | |
| Lenovo ThinkPad Yoga 370-20JJS00100 | |
| Lenovo ThinkPad X1 Carbon 2017-20HQS03P00 | |
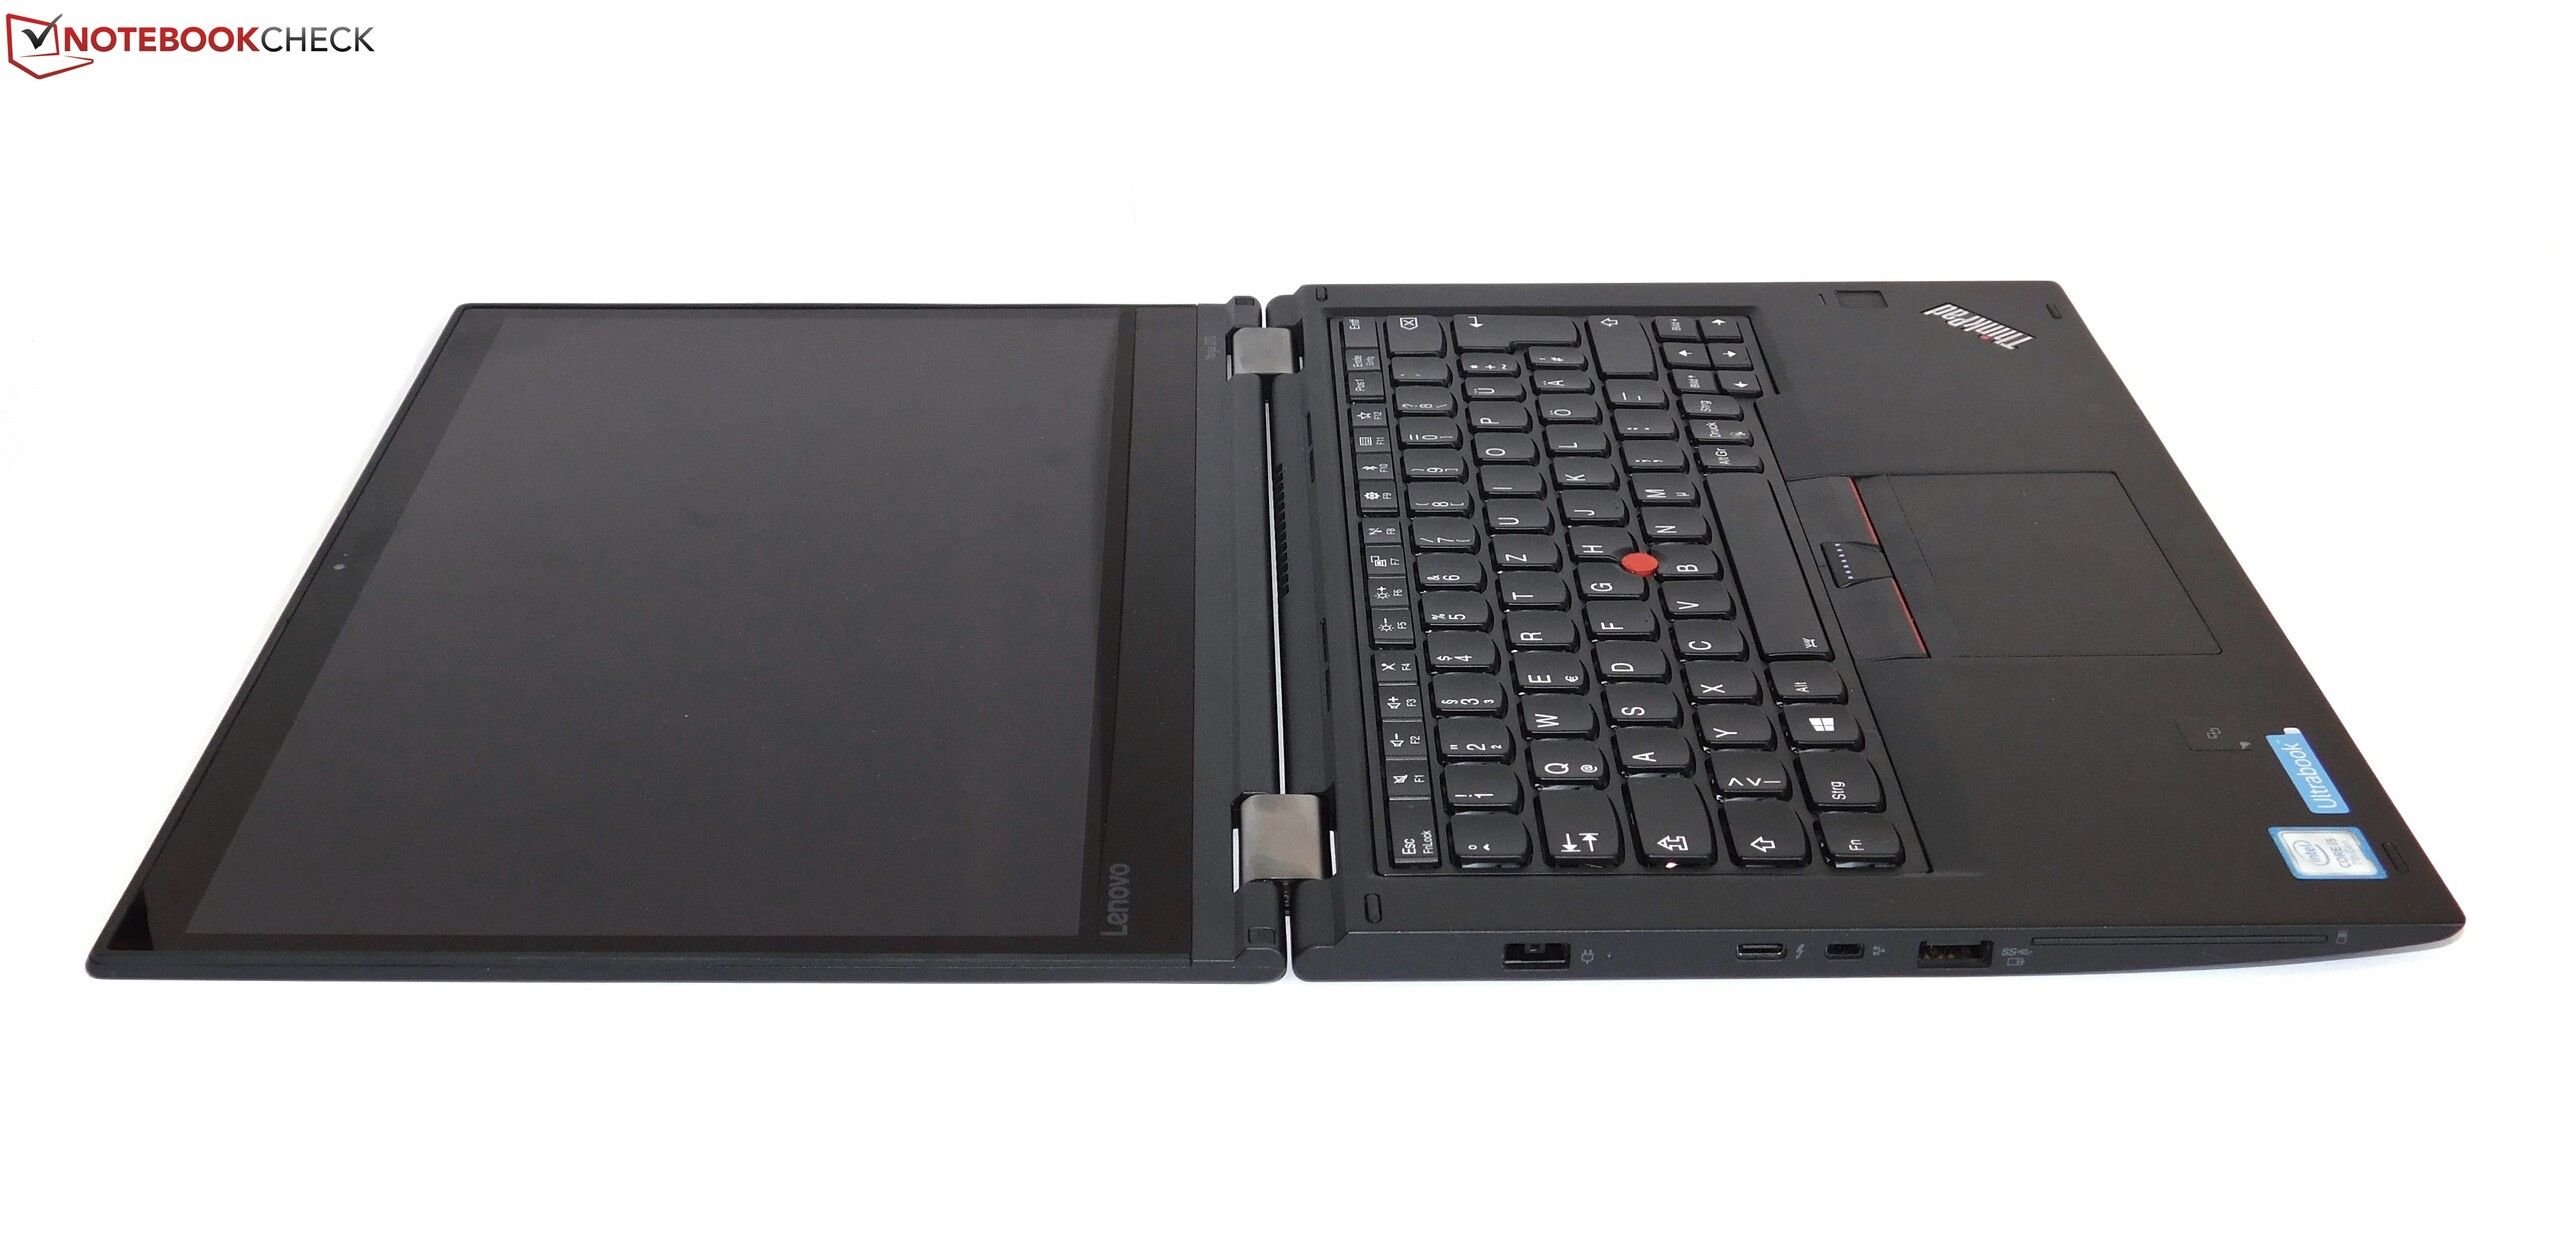
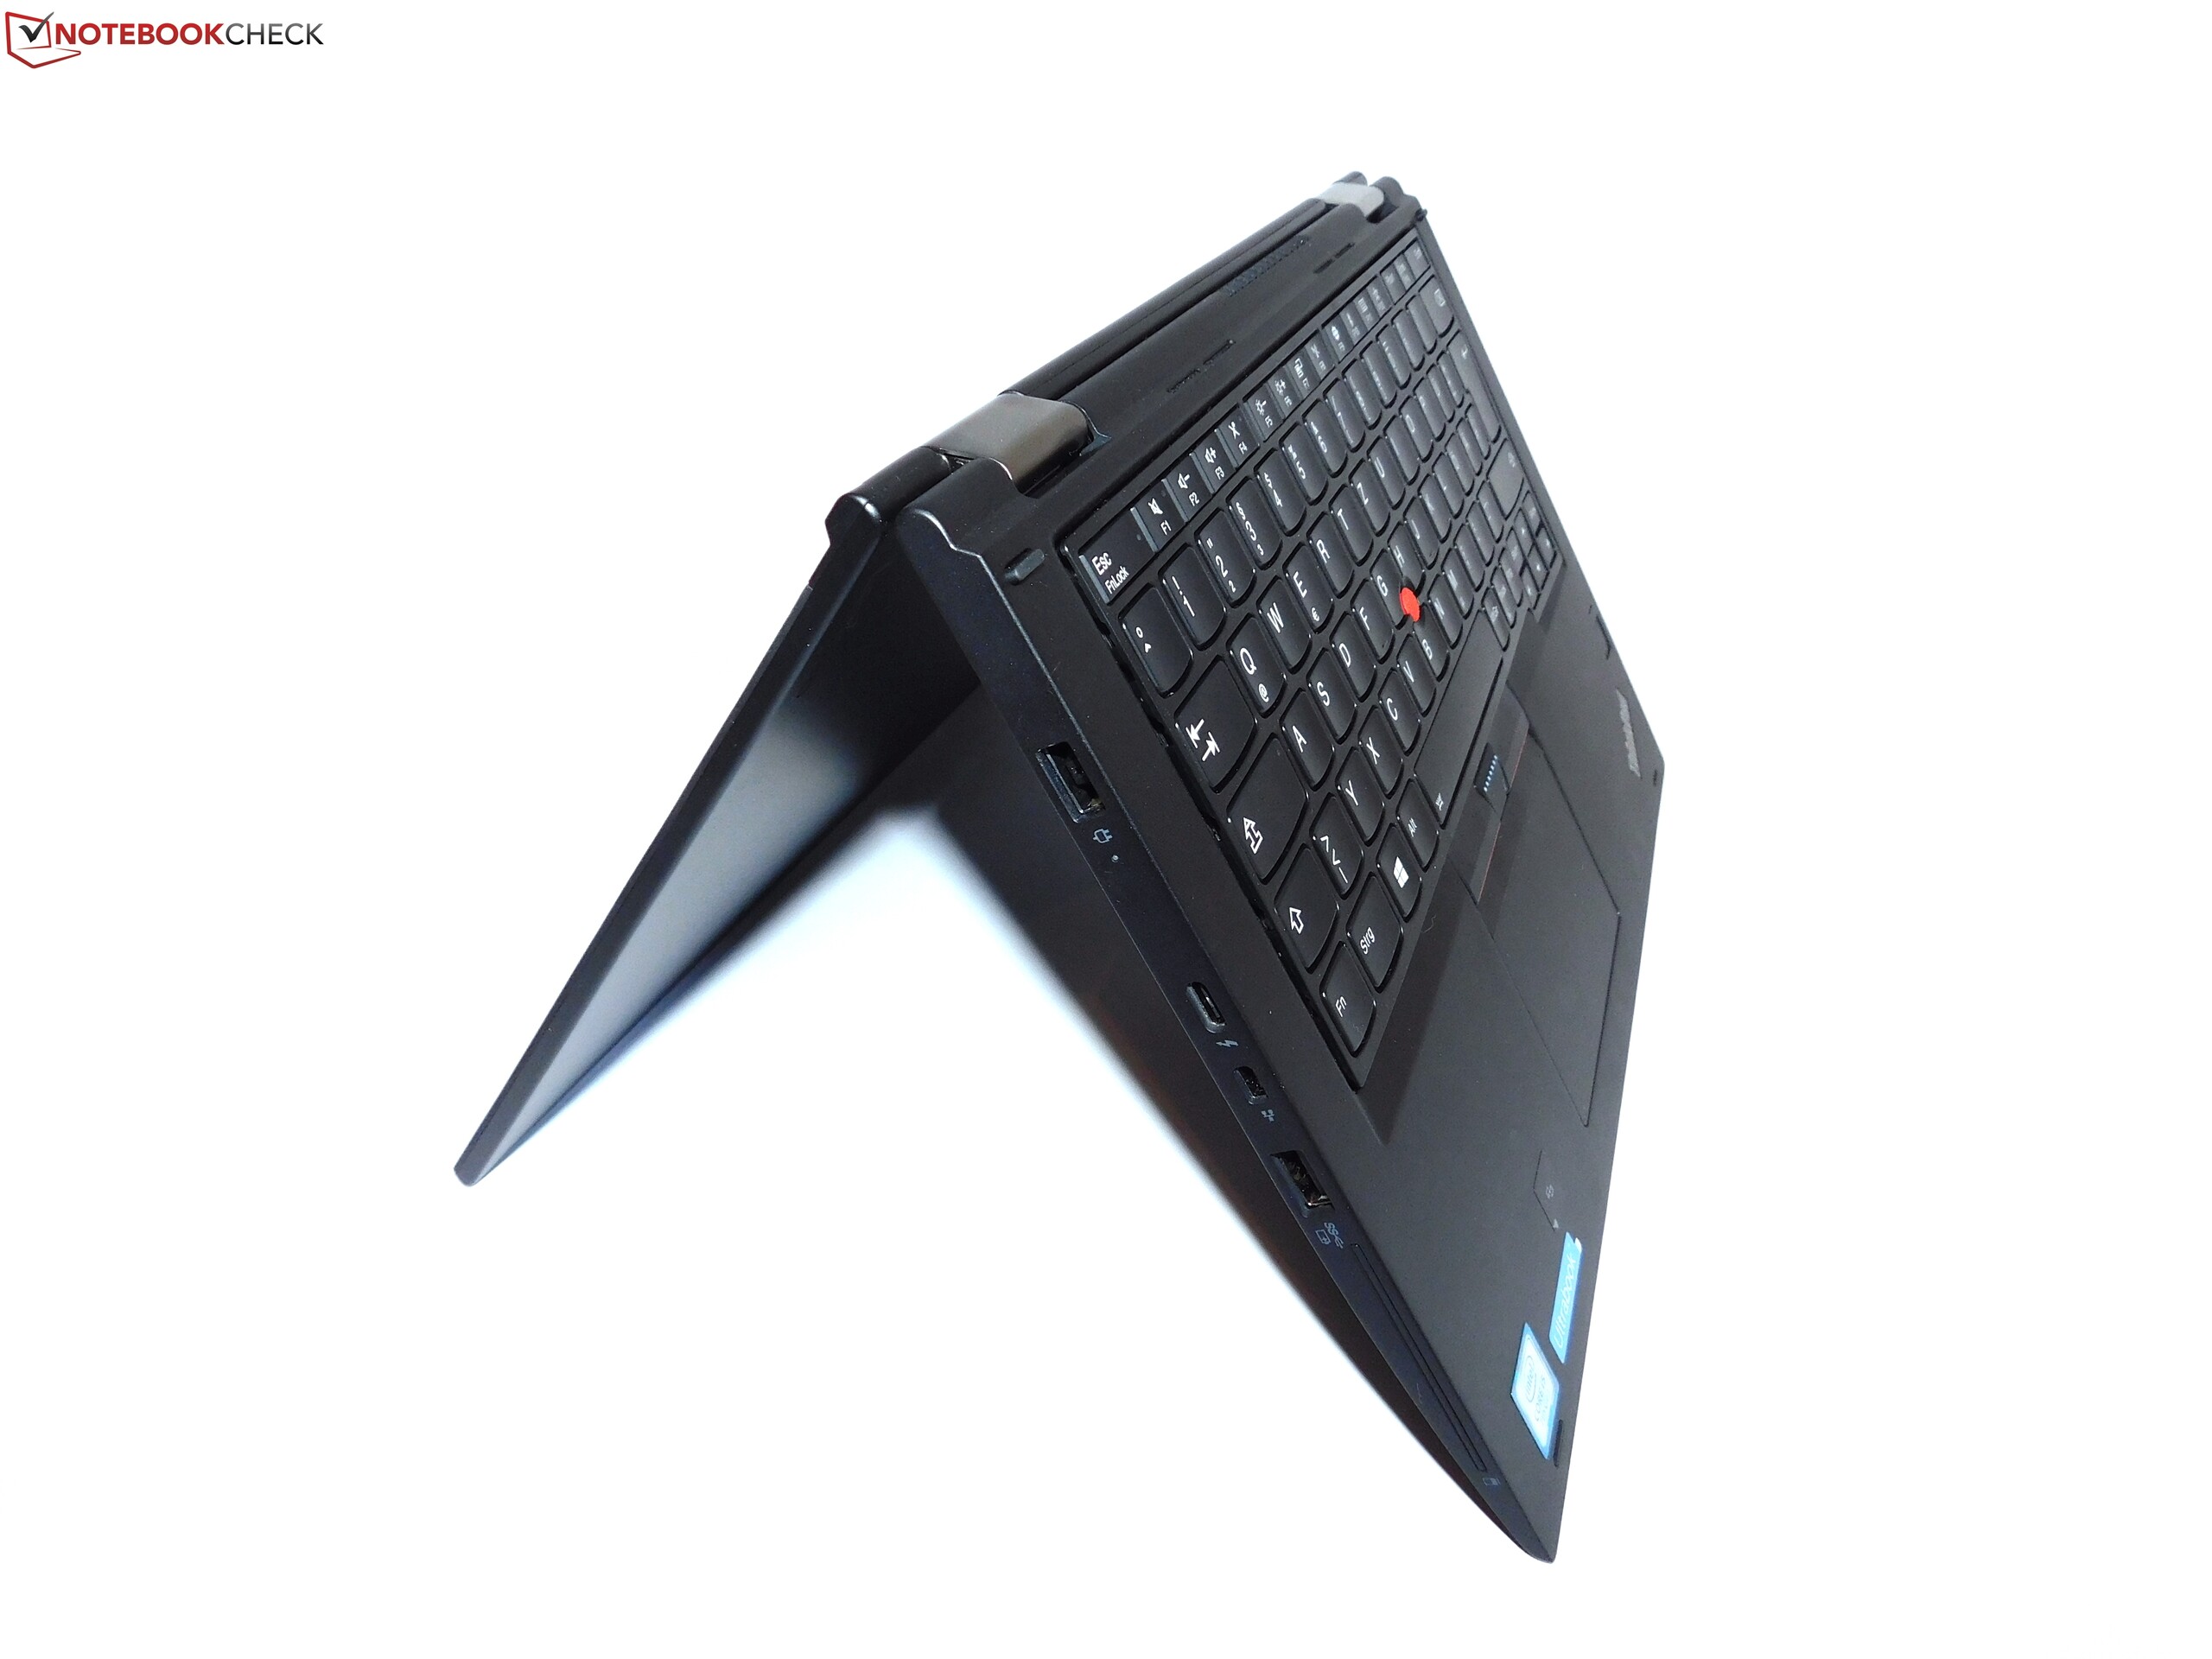
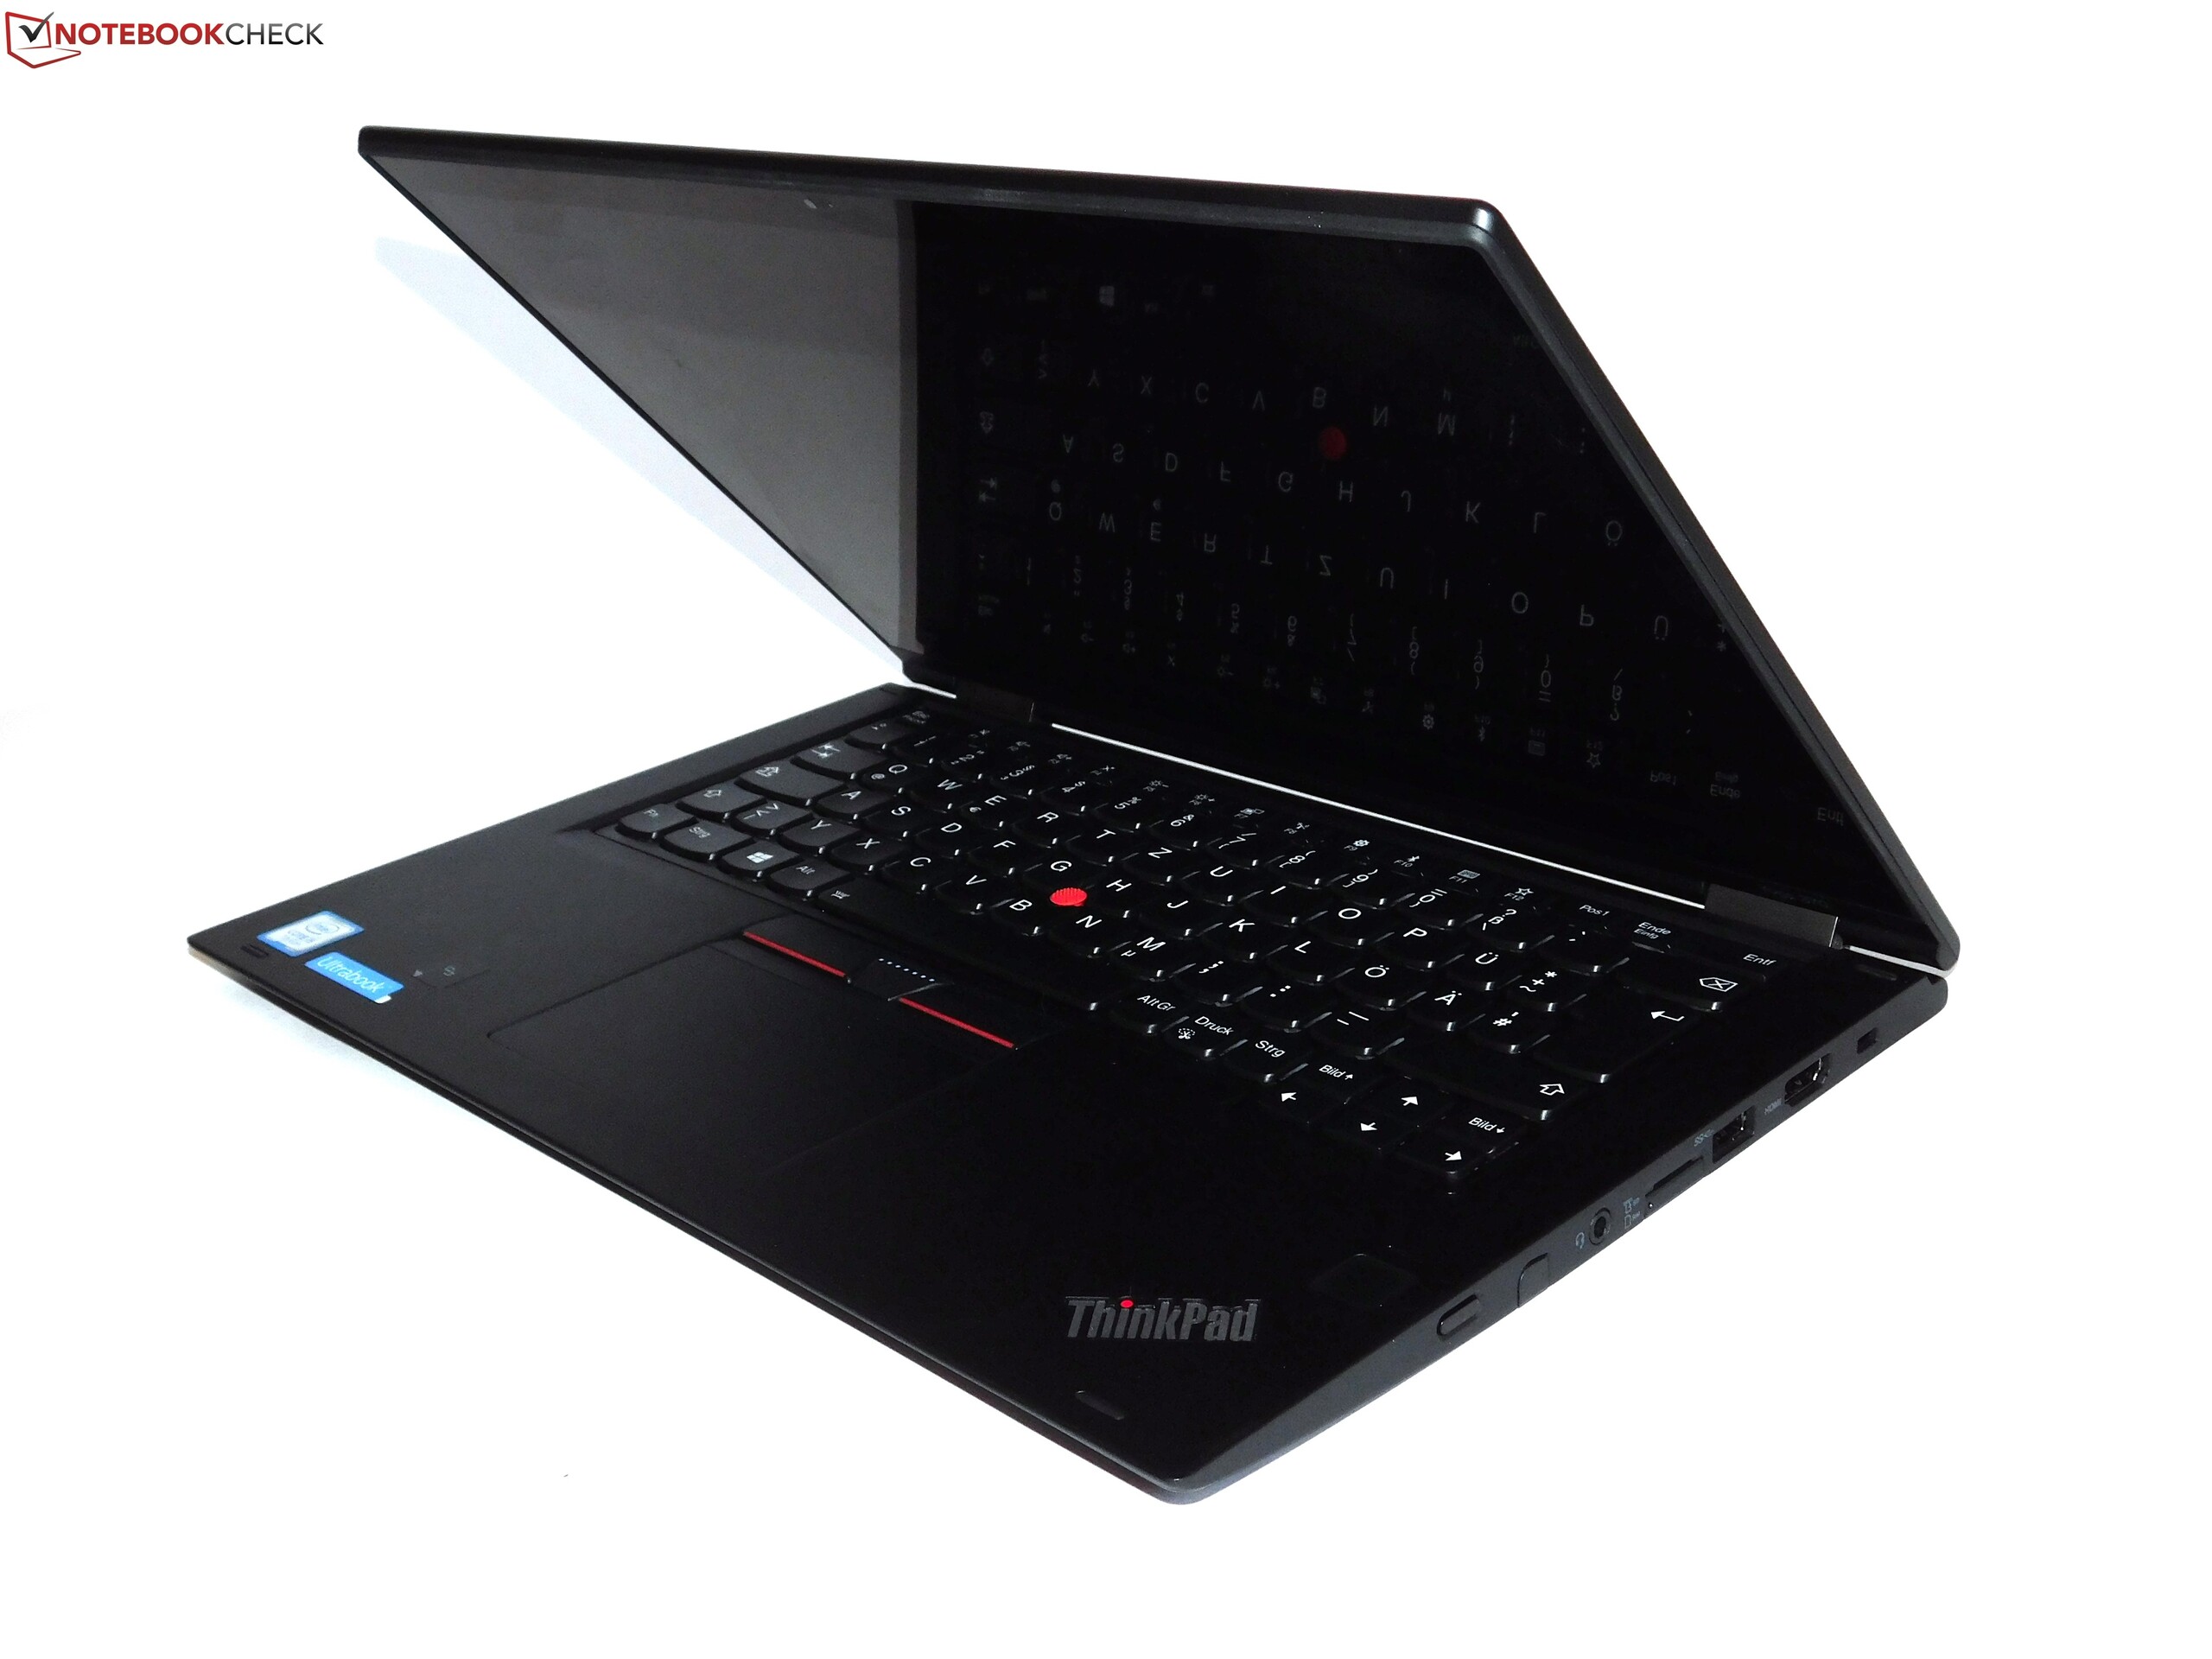
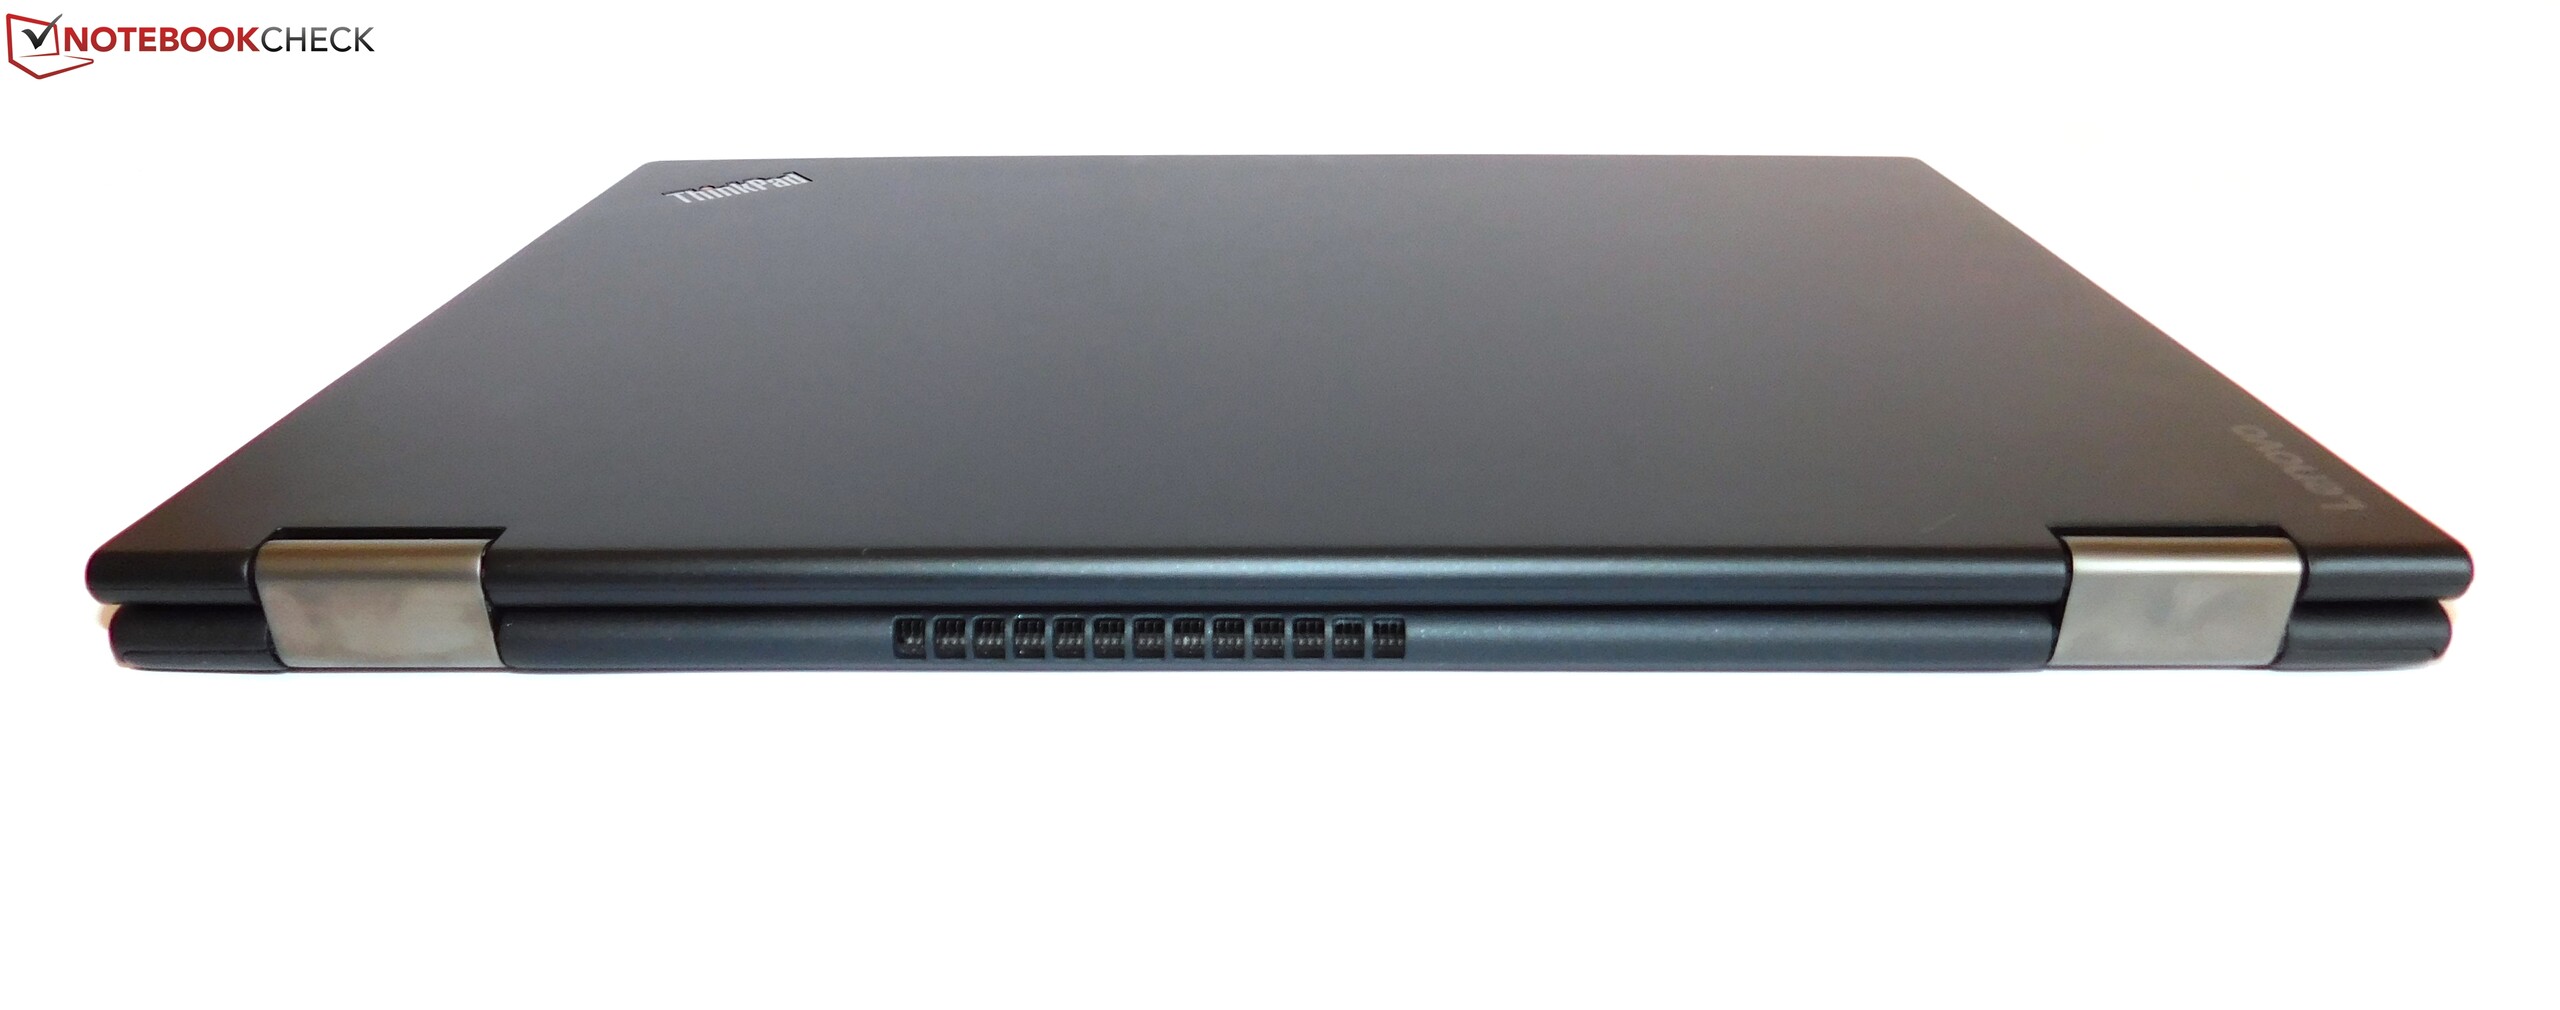
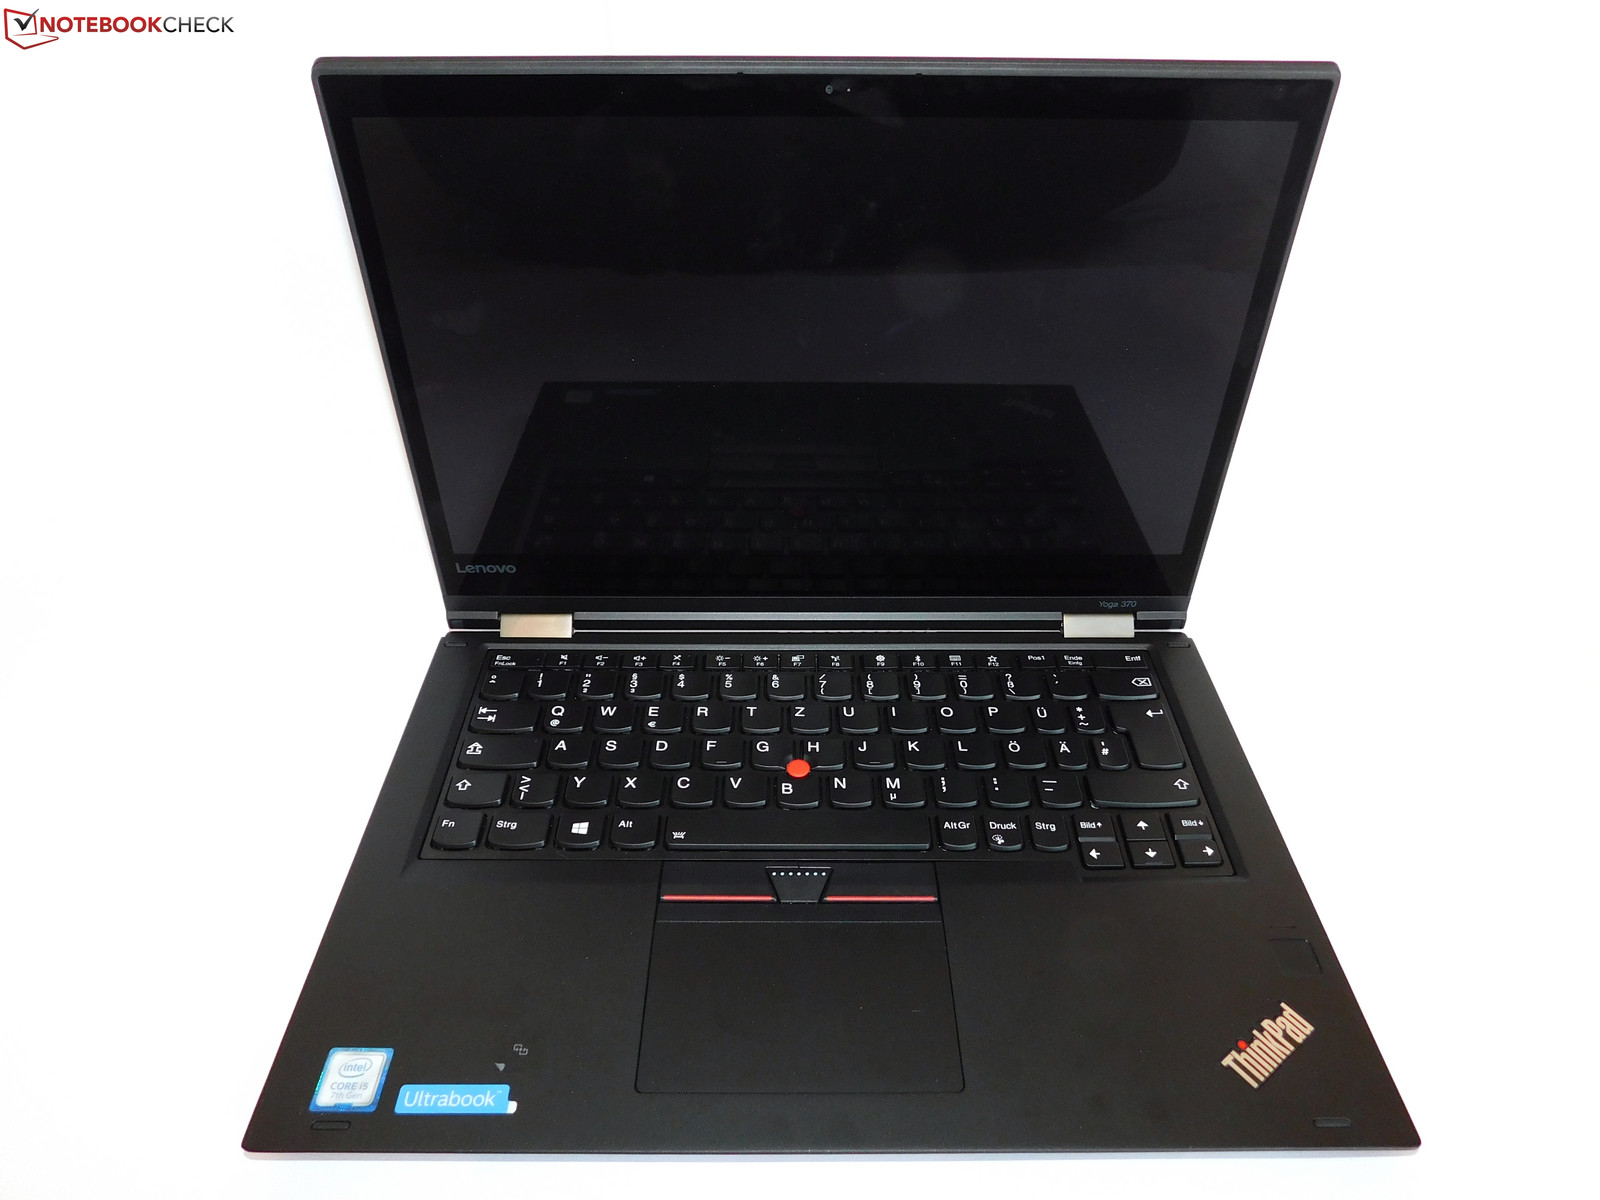
Input Devices
Display
Screen Flickering / PWM (Pulse-Width Modulation)
| Screen flickering / PWM detected | 217.4 Hz | ≤ 50 % brightness setting | 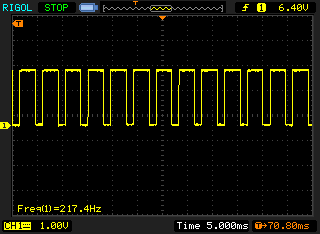 |
The display backlight flickers at 217.4 Hz (worst case, e.g., utilizing PWM) Flickering detected at a brightness setting of 50 % and below. There should be no flickering or PWM above this brightness setting. The frequency of 217.4 Hz is relatively low, so sensitive users will likely notice flickering and experience eyestrain at the stated brightness setting and below. In comparison: 52 % of all tested devices do not use PWM to dim the display. If PWM was detected, an average of 7748 (minimum: 5 - maximum: 343500) Hz was measured. | |||
| |||||||||||||||||||||||||
Brightness Distribution: 87 %
Center on Battery: 373 cd/m²
Contrast: 1133:1 (Black: 0.33 cd/m²)
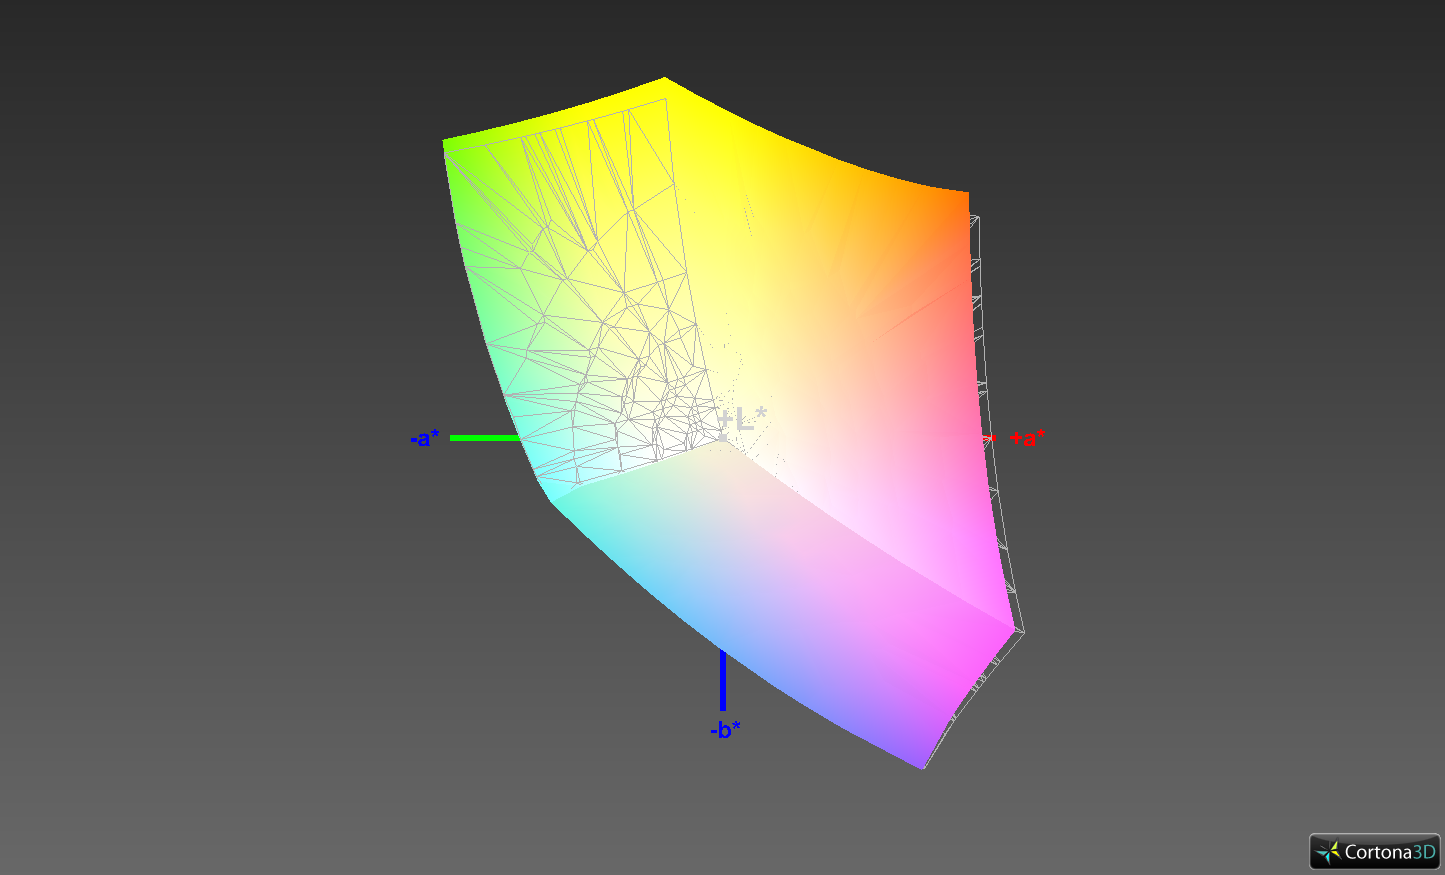
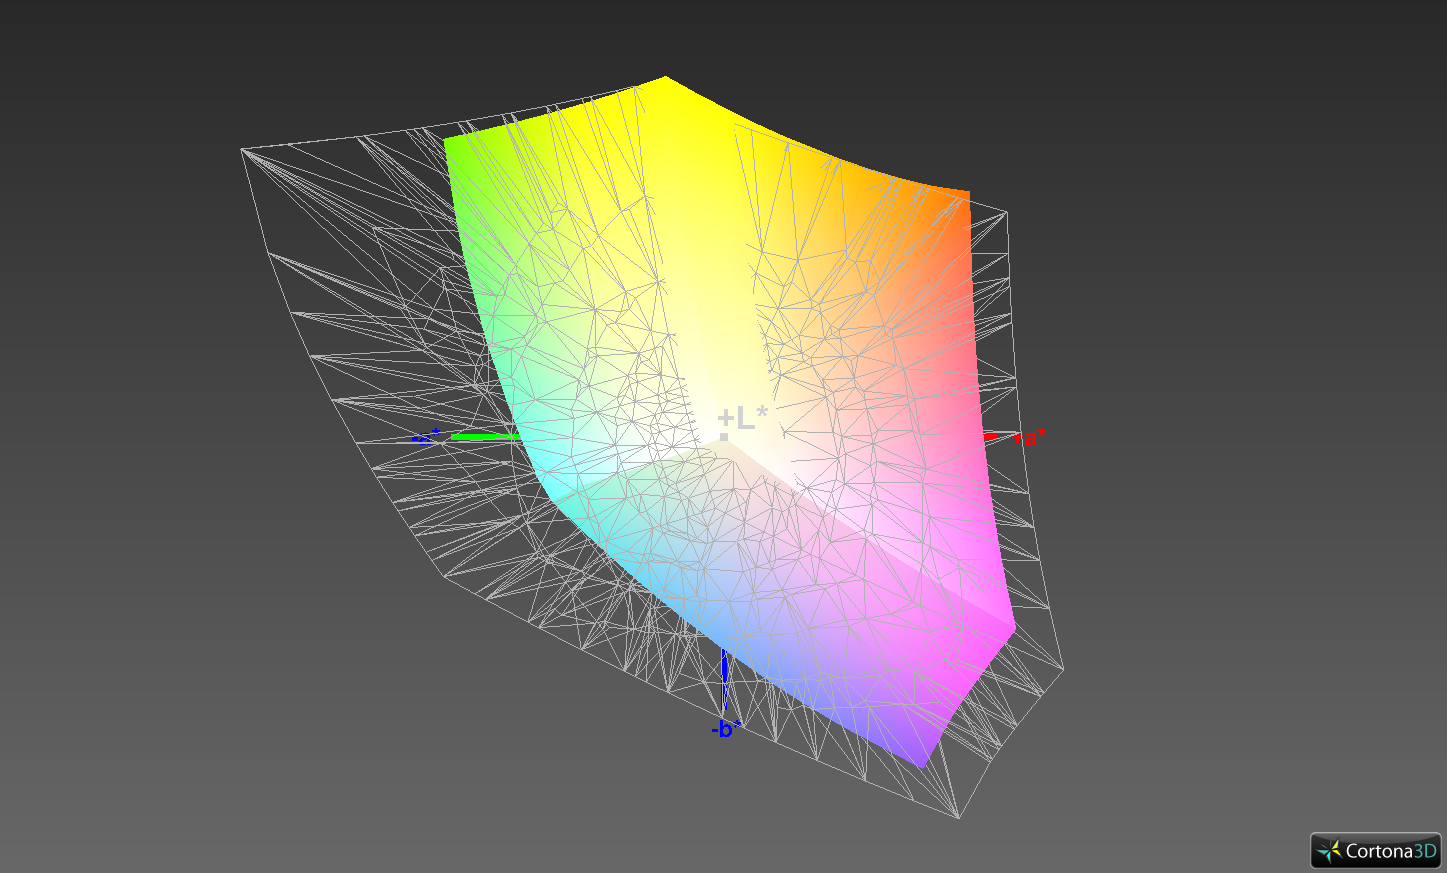
ΔE ColorChecker Calman: 4.7 | ∀{0.5-29.43 Ø4.71}
ΔE Greyscale Calman: 6.5 | ∀{0.09-98 Ø4.96}
97.2% sRGB (Argyll 1.6.3 3D)
63.1% AdobeRGB 1998 (Argyll 1.6.3 3D)
69.9% AdobeRGB 1998 (Argyll 3D)
97.3% sRGB (Argyll 3D)
67.9% Display P3 (Argyll 3D)
Gamma: 2.19
CCT: 7086 K
| Lenovo ThinkPad Yoga 370-20JJS00100 Sharp LQ133M1JX15, , 1920x1080, 13.3" | Lenovo ThinkPad Yoga 260 20FD001XGE LEN40E6 N125HCE-GN1, , 1920x1080, 12.5" | Lenovo Thinkpad X1 Yoga 20FQ-000QUS VVX14T058J10, , 2560x1440, 14" | Lenovo ThinkPad X1 Carbon 2017-20HQS03P00 B140HAN03_1, , 1920x1080, 14" | HP EliteBook x360 1030 G2 CMN1374, , 1920x1080, 13.3" | Dell XPS 13-9365 2-in-1 1920x1080, 13.3" | |
|---|---|---|---|---|---|---|
| Display | -36% | 0% | -11% | -7% | -29% | |
| Display P3 Coverage (%) | 67.9 | 42.98 -37% | 68.1 0% | 61.4 -10% | 65.5 -4% | 47.32 -30% |
| sRGB Coverage (%) | 97.3 | 62.8 -35% | 97.2 0% | 85.9 -12% | 88.8 -9% | 71.1 -27% |
| AdobeRGB 1998 Coverage (%) | 69.9 | 44.55 -36% | 70.2 0% | 62.4 -11% | 64.9 -7% | 48.83 -30% |
| Response Times | -22% | 9% | 3% | -7% | -7% | |
| Response Time Grey 50% / Grey 80% * (ms) | 42 ? | 64 ? -52% | 38 ? 10% | 41.6 ? 1% | 55.2 ? -31% | 48 ? -14% |
| Response Time Black / White * (ms) | 32.8 ? | 30 ? 9% | 30.4 ? 7% | 31.6 ? 4% | 27.2 ? 17% | 32.8 ? -0% |
| PWM Frequency (Hz) | 217.4 ? | 219 ? | 1042 ? | |||
| Screen | -29% | -13% | -3% | -7% | -9% | |
| Brightness middle (cd/m²) | 374 | 371 -1% | 284.7 -24% | 311 -17% | 262 -30% | 322.6 -14% |
| Brightness (cd/m²) | 356 | 335 -6% | 272 -24% | 288 -19% | 256 -28% | 306 -14% |
| Brightness Distribution (%) | 87 | 84 -3% | 89 2% | 85 -2% | 83 -5% | 91 5% |
| Black Level * (cd/m²) | 0.33 | 0.29 12% | 0.383 -16% | 0.24 27% | 0.25 24% | 0.19 42% |
| Contrast (:1) | 1133 | 1279 13% | 743 -34% | 1296 14% | 1048 -8% | 1698 50% |
| Colorchecker dE 2000 * | 4.7 | 8.51 -81% | 5.24 -11% | 5.5 -17% | 5.13 -9% | 7.7 -64% |
| Colorchecker dE 2000 max. * | 9.5 | 20.43 -115% | 11.22 -18% | 9 5% | 9.46 -0% | 11.1 -17% |
| Greyscale dE 2000 * | 6.5 | 9.23 -42% | 7.32 -13% | 6.2 5% | 6.23 4% | 7.9 -22% |
| Gamma | 2.19 100% | 2.24 98% | 2.22 99% | 2.02 109% | 2.45 90% | 2.88 76% |
| CCT | 7086 92% | 6759 96% | 6277 104% | 5950 109% | 6413 101% | 7044 92% |
| Color Space (Percent of AdobeRGB 1998) (%) | 63.1 | 41 -35% | 70.17 11% | 55.96 -11% | 57.84 -8% | 44.1 -30% |
| Color Space (Percent of sRGB) (%) | 97.2 | 62 -36% | 94.68 -3% | 85.77 -12% | 88.57 -9% | 69.9 -28% |
| Total Average (Program / Settings) | -29% /
-30% | -1% /
-8% | -4% /
-4% | -7% /
-7% | -15% /
-13% |
* ... smaller is better
Display Response Times
| ↔ Response Time Black to White | ||
|---|---|---|
| 32.8 ms ... rise ↗ and fall ↘ combined | ↗ 19.2 ms rise | 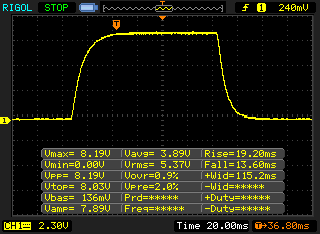 |
| ↘ 13.6 ms fall | ||
| The screen shows slow response rates in our tests and will be unsatisfactory for gamers. In comparison, all tested devices range from 0.1 (minimum) to 240 (maximum) ms. » 88 % of all devices are better. This means that the measured response time is worse than the average of all tested devices (19.8 ms). | ||
| ↔ Response Time 50% Grey to 80% Grey | ||
| 42 ms ... rise ↗ and fall ↘ combined | ↗ 21.2 ms rise | 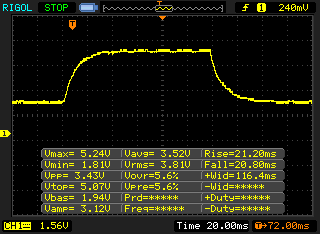 |
| ↘ 20.8 ms fall | ||
| The screen shows slow response rates in our tests and will be unsatisfactory for gamers. In comparison, all tested devices range from 0.165 (minimum) to 636 (maximum) ms. » 67 % of all devices are better. This means that the measured response time is worse than the average of all tested devices (30.9 ms). | ||
Performance
| PCMark 8 Home Score Accelerated v2 | 3539 points | |
| PCMark 8 Creative Score Accelerated v2 | 4504 points | |
| PCMark 8 Work Score Accelerated v2 | 4314 points | |
Help | ||
| Lenovo ThinkPad Yoga 370-20JJS00100 Toshiba NVMe THNSF5512GPUK | Lenovo ThinkPad Yoga 260 20FD001XGE Samsung SSD PM871 MZNLN256HCHP | Lenovo Thinkpad X1 Yoga 20FQ-000QUS Samsung SSD PM871 MZNLN512HCJH | Lenovo ThinkPad X1 Carbon 2017-20HQS03P00 Samsung PM961 NVMe MZVLW512HMJP | HP EliteBook x360 1030 G2 Sandisk SD8TN8U-256G-1006 | Dell XPS 13-9365 2-in-1 Toshiba NVMe THNSN5256GPUK | |
|---|---|---|---|---|---|---|
| CrystalDiskMark 3.0 | -35% | -30% | 74% | -35% | 3% | |
| Read Seq (MB/s) | 1070 | 468.9 -56% | 512 -52% | 1827 71% | 467.1 -56% | 1206 13% |
| Write Seq (MB/s) | 484.5 | 297.3 -39% | 443.8 -8% | 1383 185% | 443.6 -8% | 629 30% |
| Read 512 (MB/s) | 680 | 397.9 -41% | 363.1 -47% | 814 20% | 312.3 -54% | 966 42% |
| Write 512 (MB/s) | 483.1 | 297.1 -39% | 377.8 -22% | 1098 127% | 372.5 -23% | 410.7 -15% |
| Read 4k (MB/s) | 30.55 | 33.11 8% | 33.99 11% | 61 100% | 29.43 -4% | 32.93 8% |
| Write 4k (MB/s) | 127.3 | 85.1 -33% | 81.9 -36% | 172.2 35% | 56.5 -56% | 121.2 -5% |
| Read 4k QD32 (MB/s) | 460.8 | 398.3 -14% | 327.4 -29% | 601 30% | 311.3 -32% | 411 -11% |
| Write 4k QD32 (MB/s) | 414.5 | 136.6 -67% | 189.2 -54% | 495.6 20% | 225.2 -46% | 250.2 -40% |

| 3DMark 11 Performance | 1439 points | |
| 3DMark Ice Storm Standard Score | 51316 points | |
| 3DMark Cloud Gate Standard Score | 5704 points | |
| 3DMark Fire Strike Score | 773 points | |
Help | ||
| low | med. | high | ultra | |
|---|---|---|---|---|
| BioShock Infinite (2013) | 37.6 | 23.96 | ||
| Company of Heroes 2 (2013) | 18.6 | |||
| The Witcher 3 (2015) | 12.6 | |||
| Rise of the Tomb Raider (2016) | 16.4 | |||
| Civilization 6 (2016) | 24.8 | 9.6 |
Emissions
Noise level
| Idle |
| 28.6 / 28.6 / 31.2 dB(A) |
| Load |
| 33.7 / 36.7 dB(A) |
 | ||
30 dB silent 40 dB(A) audible 50 dB(A) loud |
||
min: | ||
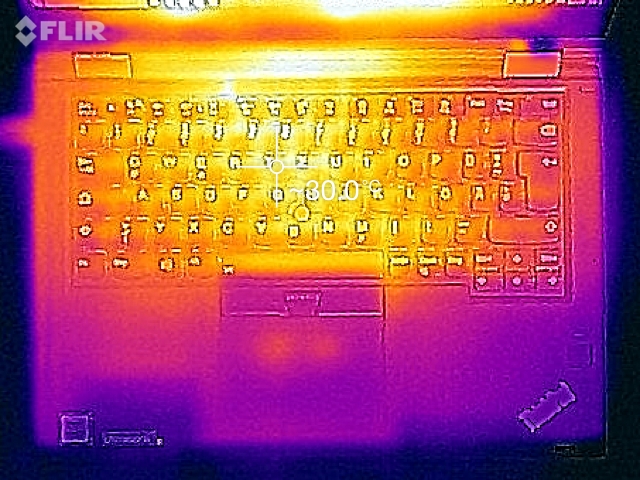
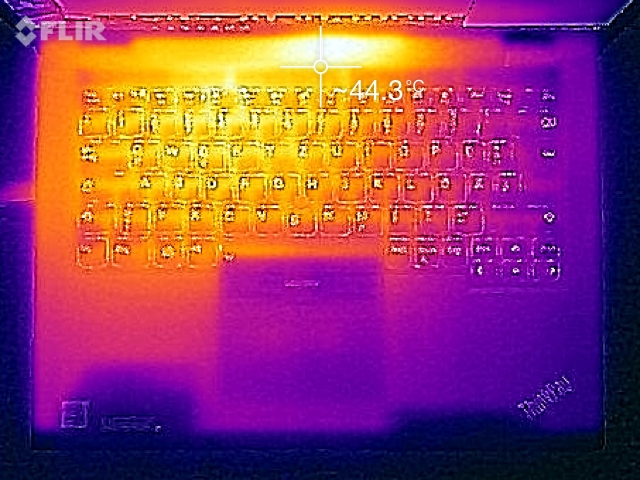
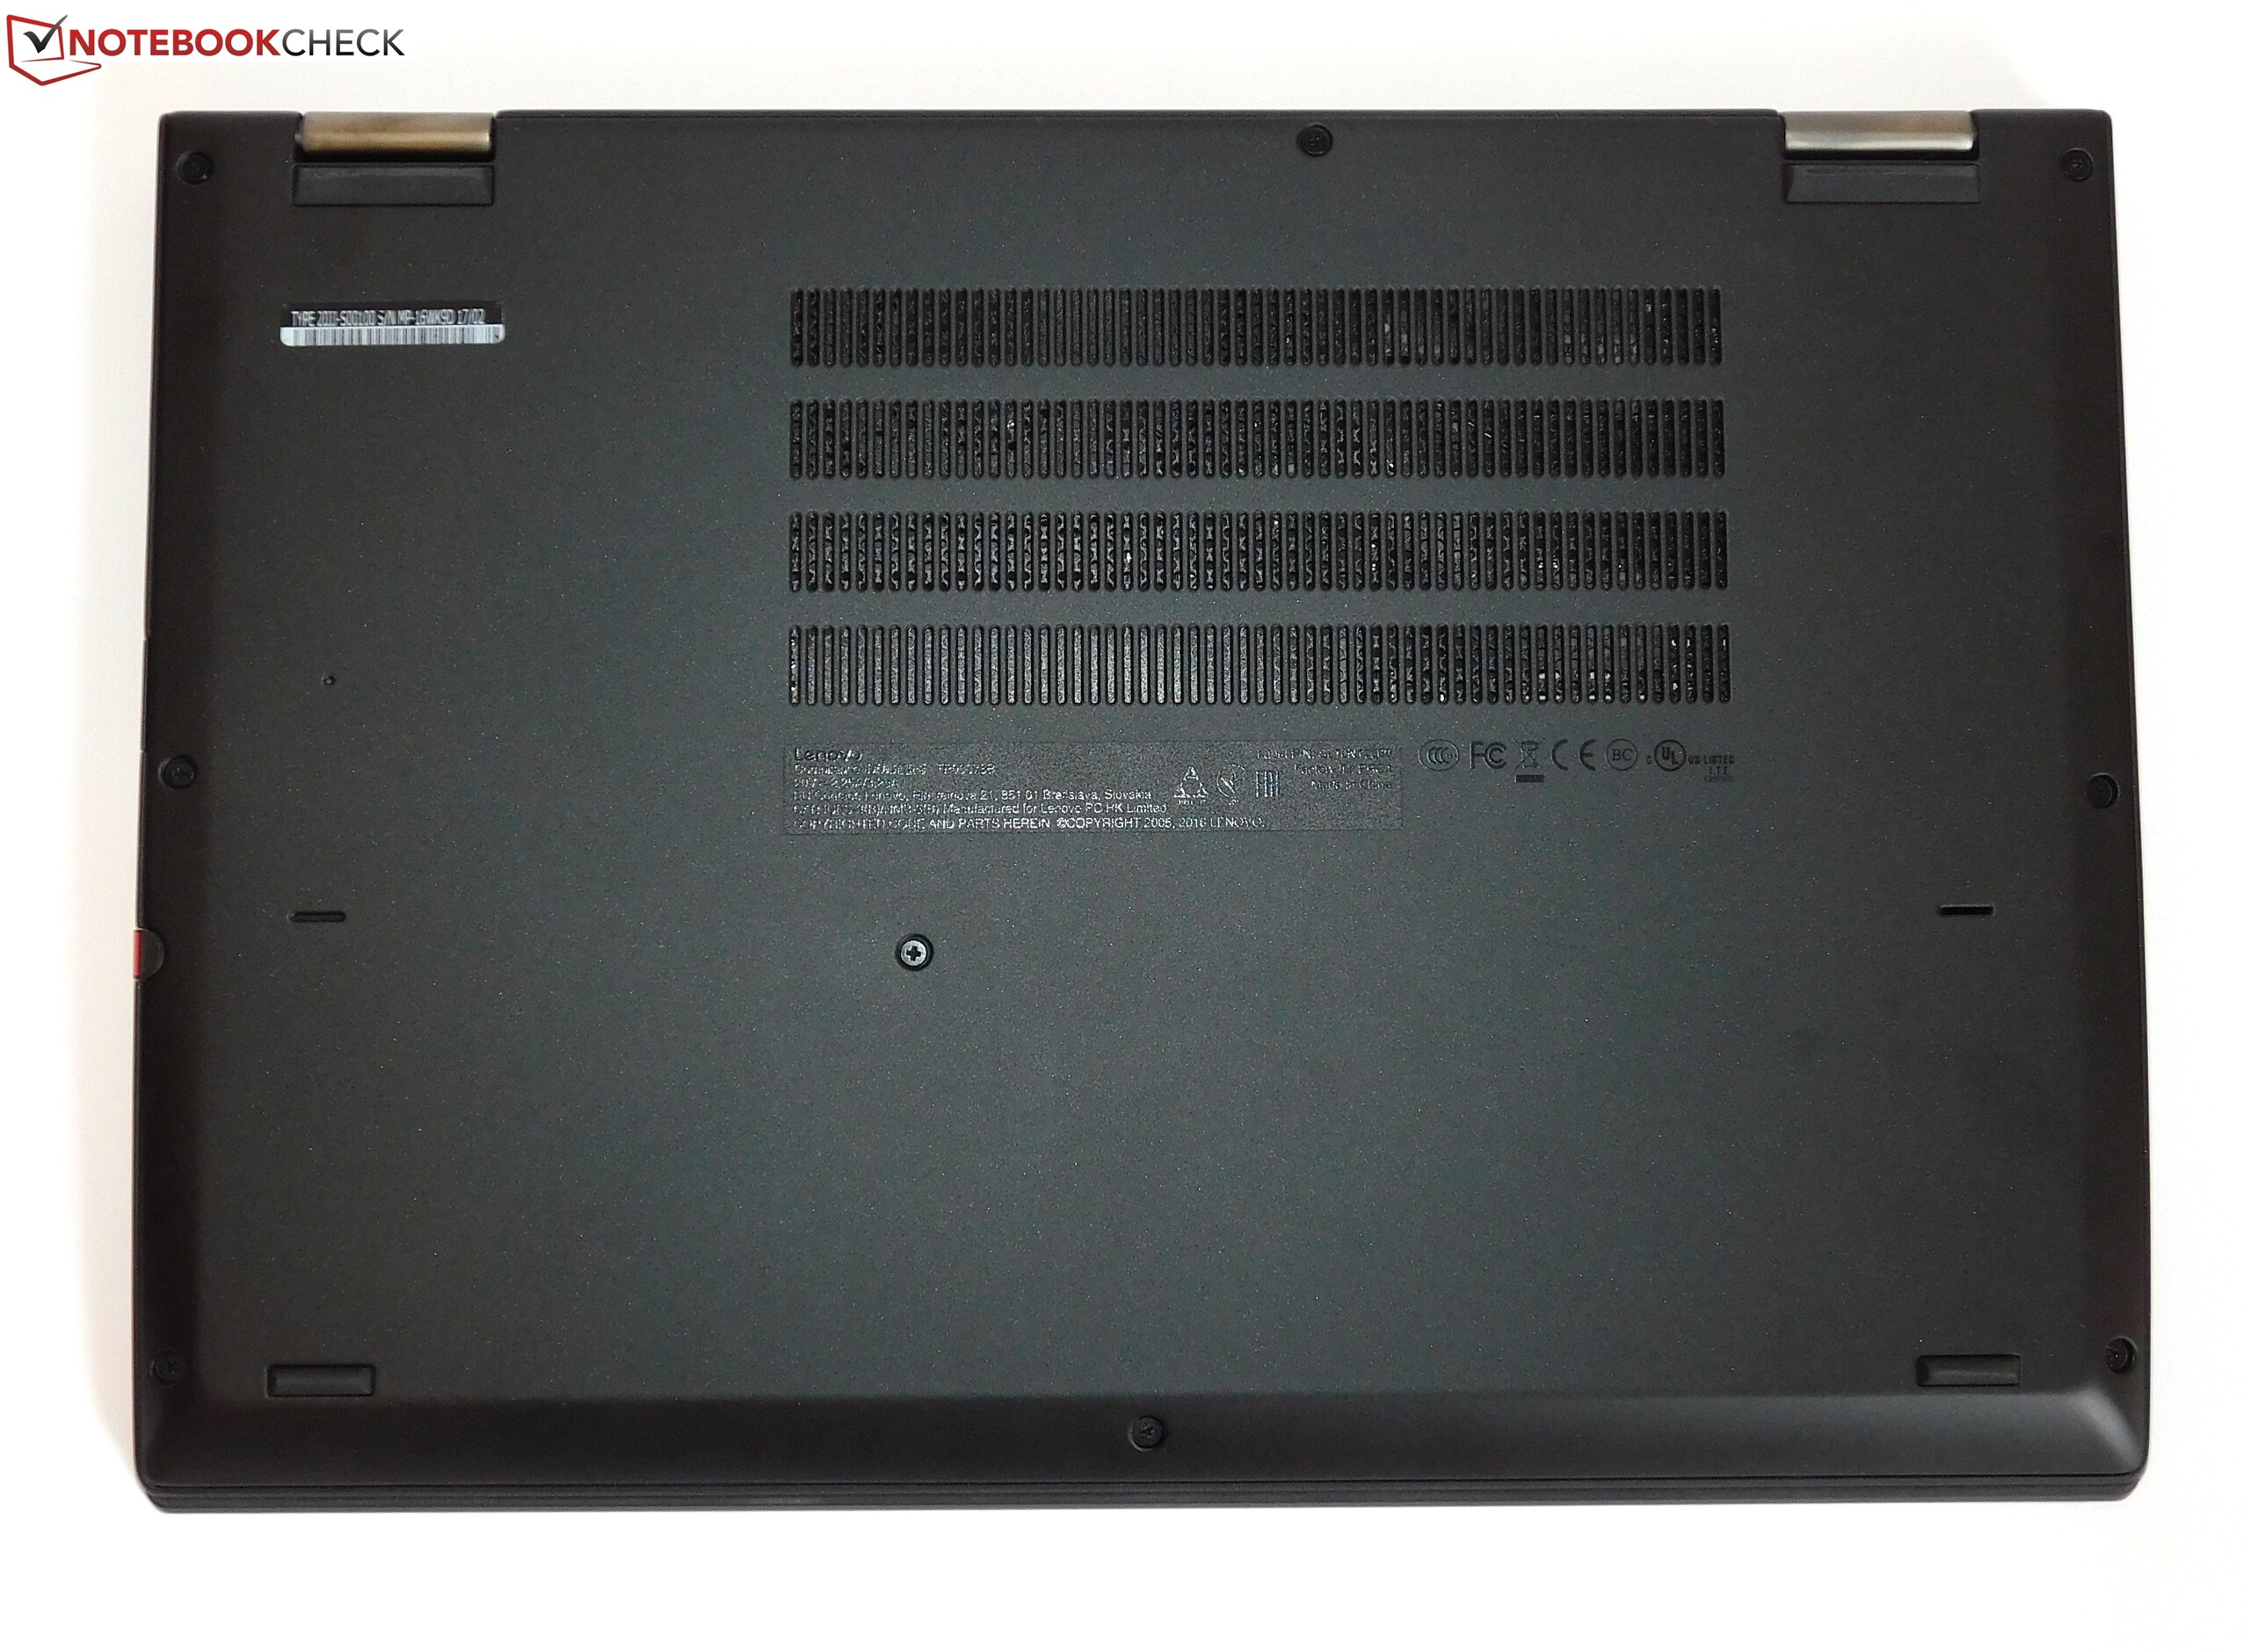
(±) The maximum temperature on the upper side is 42 °C / 108 F, compared to the average of 35.4 °C / 96 F, ranging from 19.6 to 60 °C for the class Convertible.
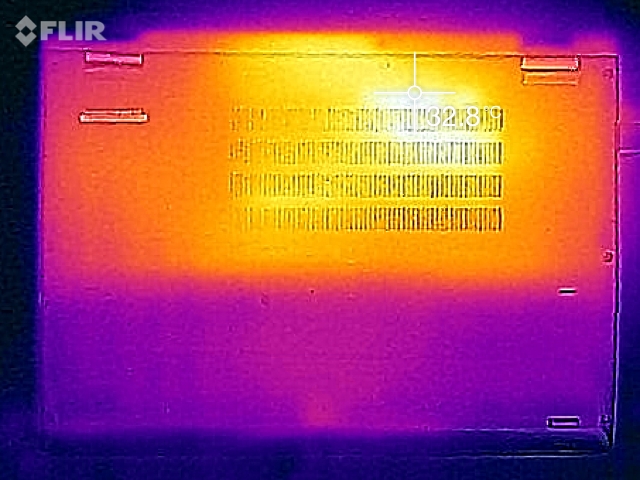
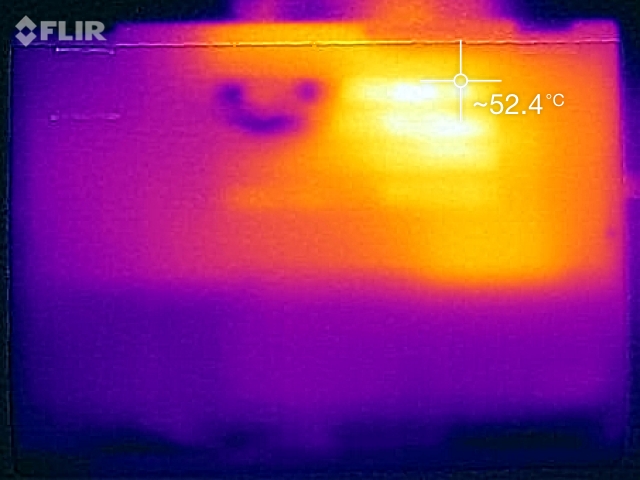
(-) The bottom heats up to a maximum of 48 °C / 118 F, compared to the average of 36.9 °C / 98 F
(+) In idle usage, the average temperature for the upper side is 26.5 °C / 80 F, compared to the device average of 30.3 °C / 87 F.
(+) The palmrests and touchpad are cooler than skin temperature with a maximum of 31.1 °C / 88 F and are therefore cool to the touch.
(-) The average temperature of the palmrest area of similar devices was 28 °C / 82.4 F (-3.1 °C / -5.6 F).
Lenovo ThinkPad Yoga 370-20JJS00100 audio analysis
(±) | speaker loudness is average but good (79.4 dB)
Bass 100 - 315 Hz
(-) | nearly no bass - on average 23.5% lower than median
(+) | bass is linear (6.5% delta to prev. frequency)
Mids 400 - 2000 Hz
(+) | balanced mids - only 4.4% away from median
(+) | mids are linear (6.8% delta to prev. frequency)
Highs 2 - 16 kHz
(+) | balanced highs - only 4.6% away from median
(+) | highs are linear (6.9% delta to prev. frequency)
Overall 100 - 16.000 Hz
(±) | linearity of overall sound is average (24.2% difference to median)
Compared to same class
» 74% of all tested devices in this class were better, 5% similar, 21% worse
» The best had a delta of 6%, average was 20%, worst was 57%
Compared to all devices tested
» 73% of all tested devices were better, 6% similar, 21% worse
» The best had a delta of 4%, average was 23%, worst was 134%
HP EliteBook x360 1030 G2 audio analysis
(+) | speakers can play relatively loud (86.3 dB)
Analysis not possible as minimum curve is missing or too high
Frequency comparison (checkboxes selectable/deselectable)
Energy Management
| Off / Standby | |
| Idle | |
| Load |
|
Key:
min: | |
| Lenovo ThinkPad Yoga 370-20JJS00100 i5-7200U, HD Graphics 620, Toshiba NVMe THNSF5512GPUK, IPS LED, 1920x1080, 13.3" | Lenovo ThinkPad Yoga 260 20FD001XGE 6500U, HD Graphics 520, Samsung SSD PM871 MZNLN256HCHP, IPS, 1920x1080, 12.5" | Lenovo Thinkpad X1 Yoga 20FQ-000QUS 6500U, HD Graphics 520, Samsung SSD PM871 MZNLN512HCJH, IPS, 2560x1440, 14" | Lenovo ThinkPad X1 Carbon 2017-20HQS03P00 i7-7500U, HD Graphics 620, Samsung PM961 NVMe MZVLW512HMJP, IPS, 1920x1080, 14" | HP EliteBook x360 1030 G2 i5-7300U, HD Graphics 620, Sandisk SD8TN8U-256G-1006, IPS, 1920x1080, 13.3" | Dell XPS 13-9365 2-in-1 i7-7Y75, HD Graphics 615, Toshiba NVMe THNSN5256GPUK, IPS, 1920x1080, 13.3" | |
|---|---|---|---|---|---|---|
| Power Consumption | 12% | -43% | -18% | 6% | 29% | |
| Idle Minimum * (Watt) | 3.6 | 3.6 -0% | 6.82 -89% | 3.84 -7% | 3.2 11% | 3.1 14% |
| Idle Average * (Watt) | 7.2 | 6.3 12% | 8.21 -14% | 6.3 12% | 5.5 24% | 4.3 40% |
| Idle Maximum * (Watt) | 8.4 | 7.6 10% | 17.55 -109% | 8.6 -2% | 6.5 23% | 4.9 42% |
| Load Average * (Watt) | 29.9 | 27.2 9% | 28.81 4% | 41.9 -40% | 29.7 1% | 24.3 19% |
| Load Maximum * (Watt) | 32.2 | 22.8 29% | 34.07 -6% | 48.7 -51% | 41.3 -28% | 22.8 29% |
* ... smaller is better
| Lenovo ThinkPad Yoga 370-20JJS00100 i5-7200U, HD Graphics 620, 51 Wh | Lenovo ThinkPad Yoga 260 20FD001XGE 6500U, HD Graphics 520, 44 Wh | Lenovo Thinkpad X1 Yoga 20FQ-000QUS 6500U, HD Graphics 520, 52 Wh | Lenovo ThinkPad X1 Carbon 2017-20HQS03P00 i7-7500U, HD Graphics 620, 57 Wh | HP EliteBook x360 1030 G2 i5-7300U, HD Graphics 620, 57 Wh | Dell XPS 13-9365 2-in-1 i7-7Y75, HD Graphics 615, 46 Wh | |
|---|---|---|---|---|---|---|
| Battery runtime | -25% | -18% | 5% | 40% | 21% | |
| Reader / Idle (h) | 19.4 | 15.7 -19% | 15.4 -21% | 20.9 8% | 23.1 19% | 16.2 -16% |
| H.264 (h) | 9.6 | 11.9 24% | 11 15% | |||
| WiFi v1.3 (h) | 8.1 | 5.8 -28% | 5.9 -27% | 8.3 2% | 10.5 30% | 11.4 41% |
| Load (h) | 2.1 | 1.5 -29% | 2 -5% | 1.8 -14% | 4.1 95% | 2.9 38% |
Verdict
Pros
Cons
联想使我们的今年的选择更容易,不必纠结于12.5和14英寸的型号,我们得到的是一个13.3英寸的ThinkPad Yoga。我们支持这一设配置——而不是提供两个令人失望的型号大小,联想发现了显示尺寸和移动性之间的平衡点。Yoga 370在很多方面都做的不错。键盘和其他输入设备,包括触控笔,都非常好。除了不符合总体质量的显示盖之外,它的外壳是良好的,坚固的,而且易于拆卸。接口的机具可用性,即使我们会更喜欢一个全尺寸的SD卡读卡器,对比Yoga 260电池续航大大增强。最后,该机显示器是这个笔记本电脑最强的卖点之一 ,也是对 Yoga 260 and Yoga 460的增强。
可惜的是,它在较低的亮度水平下存在屏幕闪烁,这对一些用户来说是极具破坏性的。冷却系统保留了最大的改进空间:温度和体积都没有完善,但远远不及X270。该机也无法利用其全面的性能潜力,毕竟内存容量(只有8 GB,以及WWAN无线通讯)带有严重局限性。然而,所有这些问题都被价格和保修时间——与硬件本身无关的两个方面,所掩盖。
好样的。联想Yoga 370 在很多方面都赢得了我们的肯定,并且获取了所有Yoga系列电脑中的最高分(价格高昂联想Yoga X1除外)。
总的来说,Yoga 370 是一个很好的变形本,它专注于生产力,值得推荐。与它最为相似的是惠普EliteBook x360,同样具备它的优点,以及名义上更长的续航时间,同样也更昂贵而且屏幕偏暗。戴尔XPS 13 2-in-1 的受众是那些对笔记本性能要求不高的用户,他们更在乎无风扇的设计而不是更多的商务性能。在内部竞争方面,ThinkPad X1 Yoga,这台我们刚刚评测的2017机器,会是那些手头更宽裕的用户的另一个选择。它的OLED显示屏非常出众,也很昂贵。X1 Carbon,价格比X1 Yoga稍微便宜一些,可以作为那些不需要变形功能而是更好显示器的用户的备选方案。
请注意:由于其分类为“变形本”,ThinkPad Yoga 370的评分仅在“非常优秀”的水平之下。如果它被归类为办公笔记本,那么它将获得“非常优秀”的水平,89%。
注:本文是基于完整评测的缩减版本,阅读完整的英文评测,请点击这里。
Lenovo ThinkPad Yoga 370-20JJS00100
- 04/06/2017 v6 (old)
Benjamin Herzig
Price comparison
