Teclast TBOLT F15 Pro在审查。适合基本任务的低价15英寸笔记本电脑
Possible competitors in comparison
Rating | Date | Model | Weight | Height | Size | Resolution | Price |
|---|---|---|---|---|---|---|---|
| 77 % v7 (old) | 09 / 2021 | Teclast TBOLT F15 Pro i3-1005G1, UHD Graphics G1 (Ice Lake 32 EU) | 1.9 kg | 20.5 mm | 15.60" | 1920x1080 | |
| 85.2 % v7 (old) | 03 / 2020 | Huawei MateBook D 15-53010TUY R5 3500U, Vega 8 | 1.5 kg | 16.9 mm | 15.60" | 1920x1080 | |
| 76.5 % v7 (old) | Lenovo V15-ADA 82C7009SGE Athlon 3150U, Vega 3 | 1.9 kg | 20 mm | 15.60" | 1920x1080 | ||
| 78.2 % v7 (old) | Dell Inspiron 15 5000 5502 i3-1115G4, UHD Graphics Xe G4 48EUs | 1.6 kg | 17.9 mm | 15.60" | 1920x1080 |
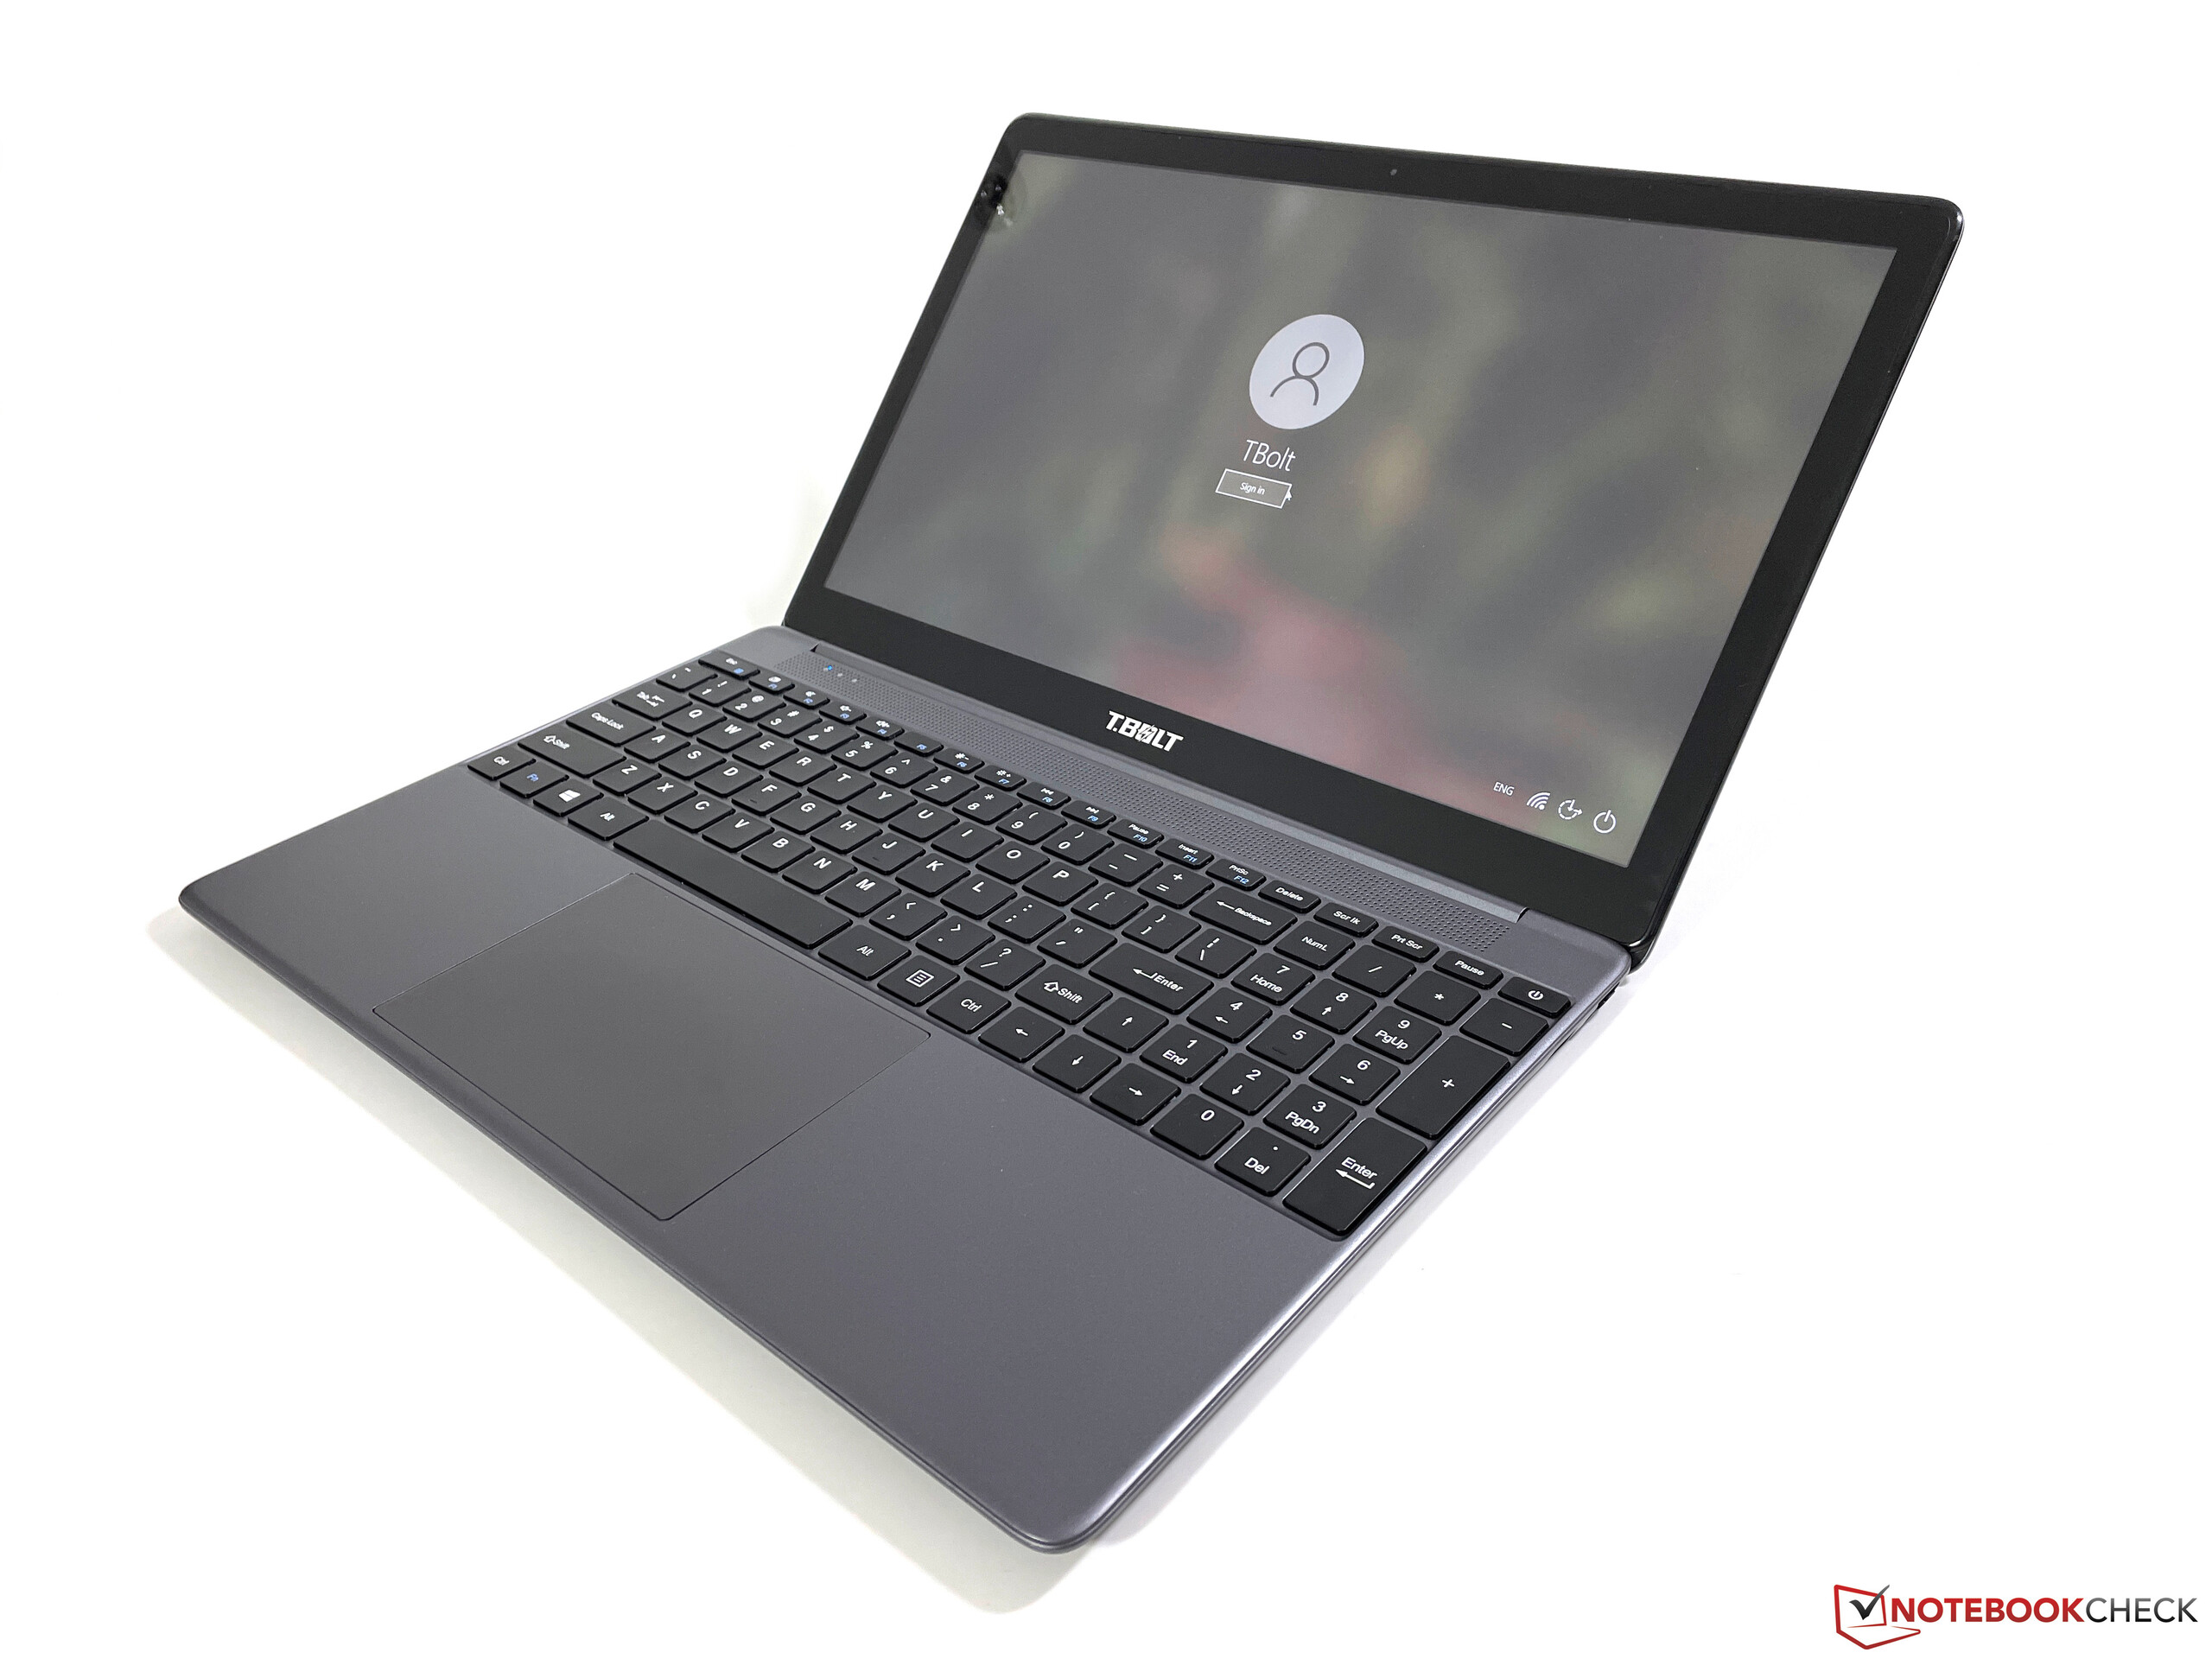
外壳、设备和输入装置
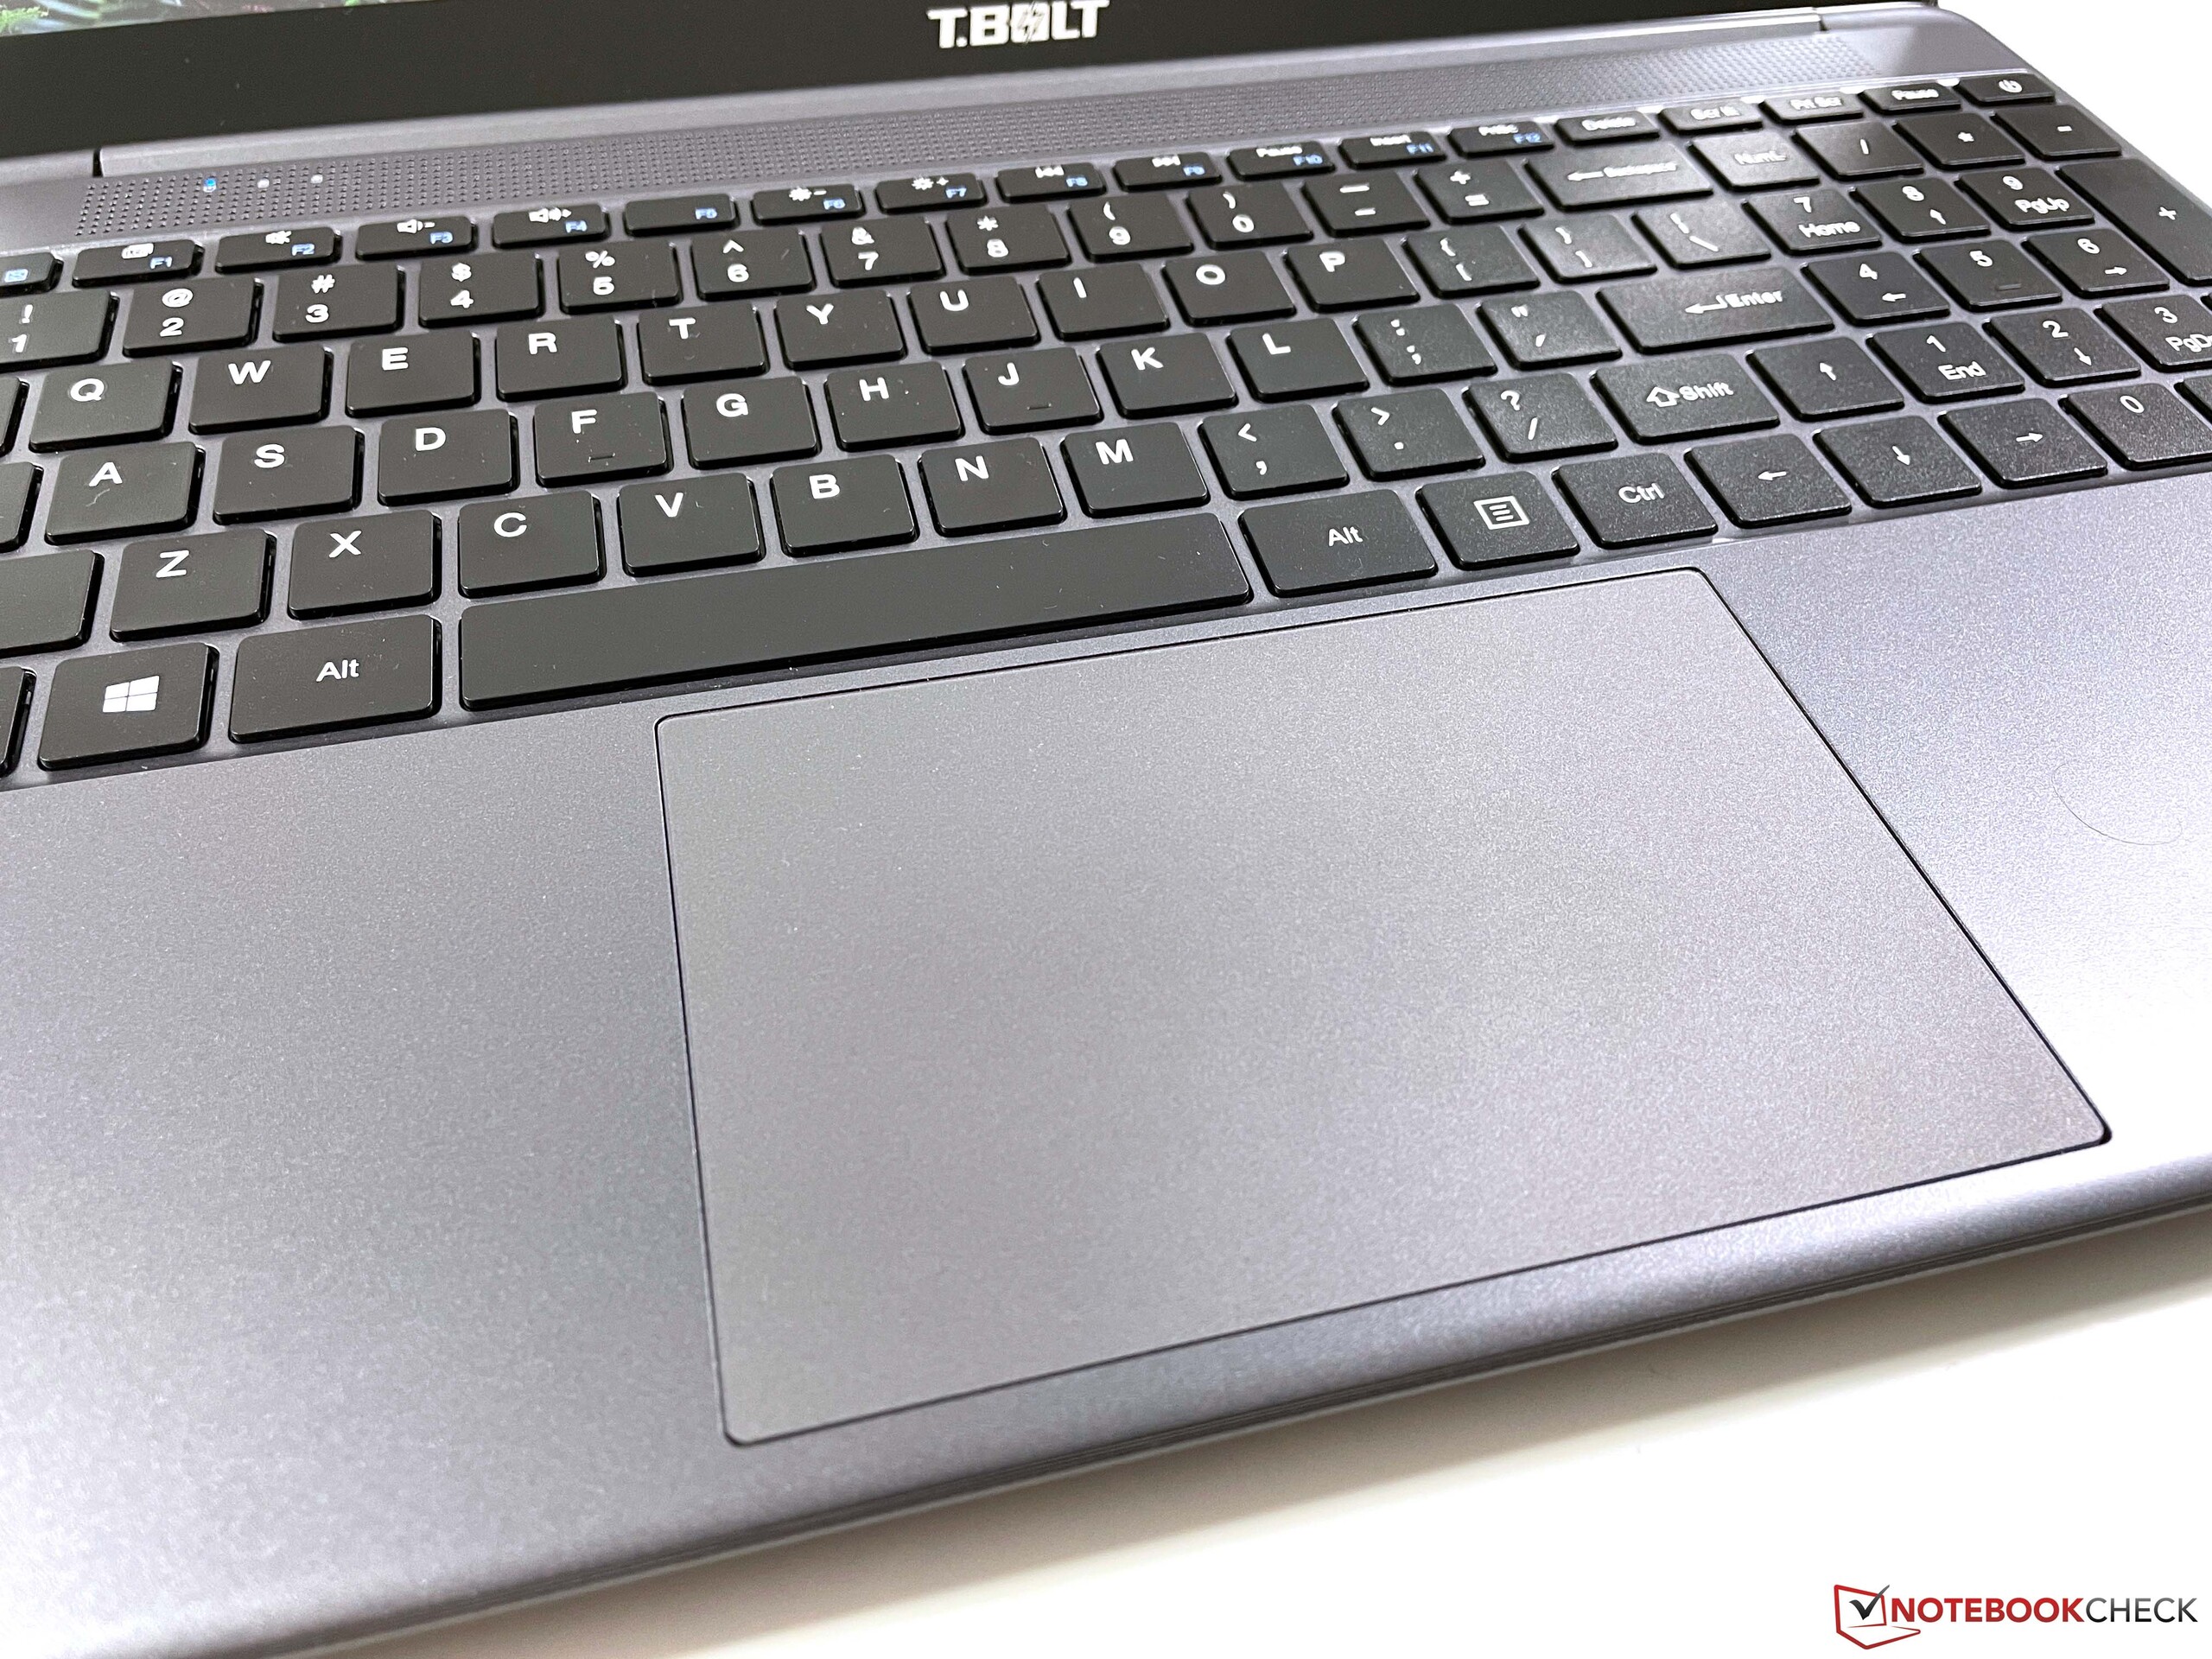
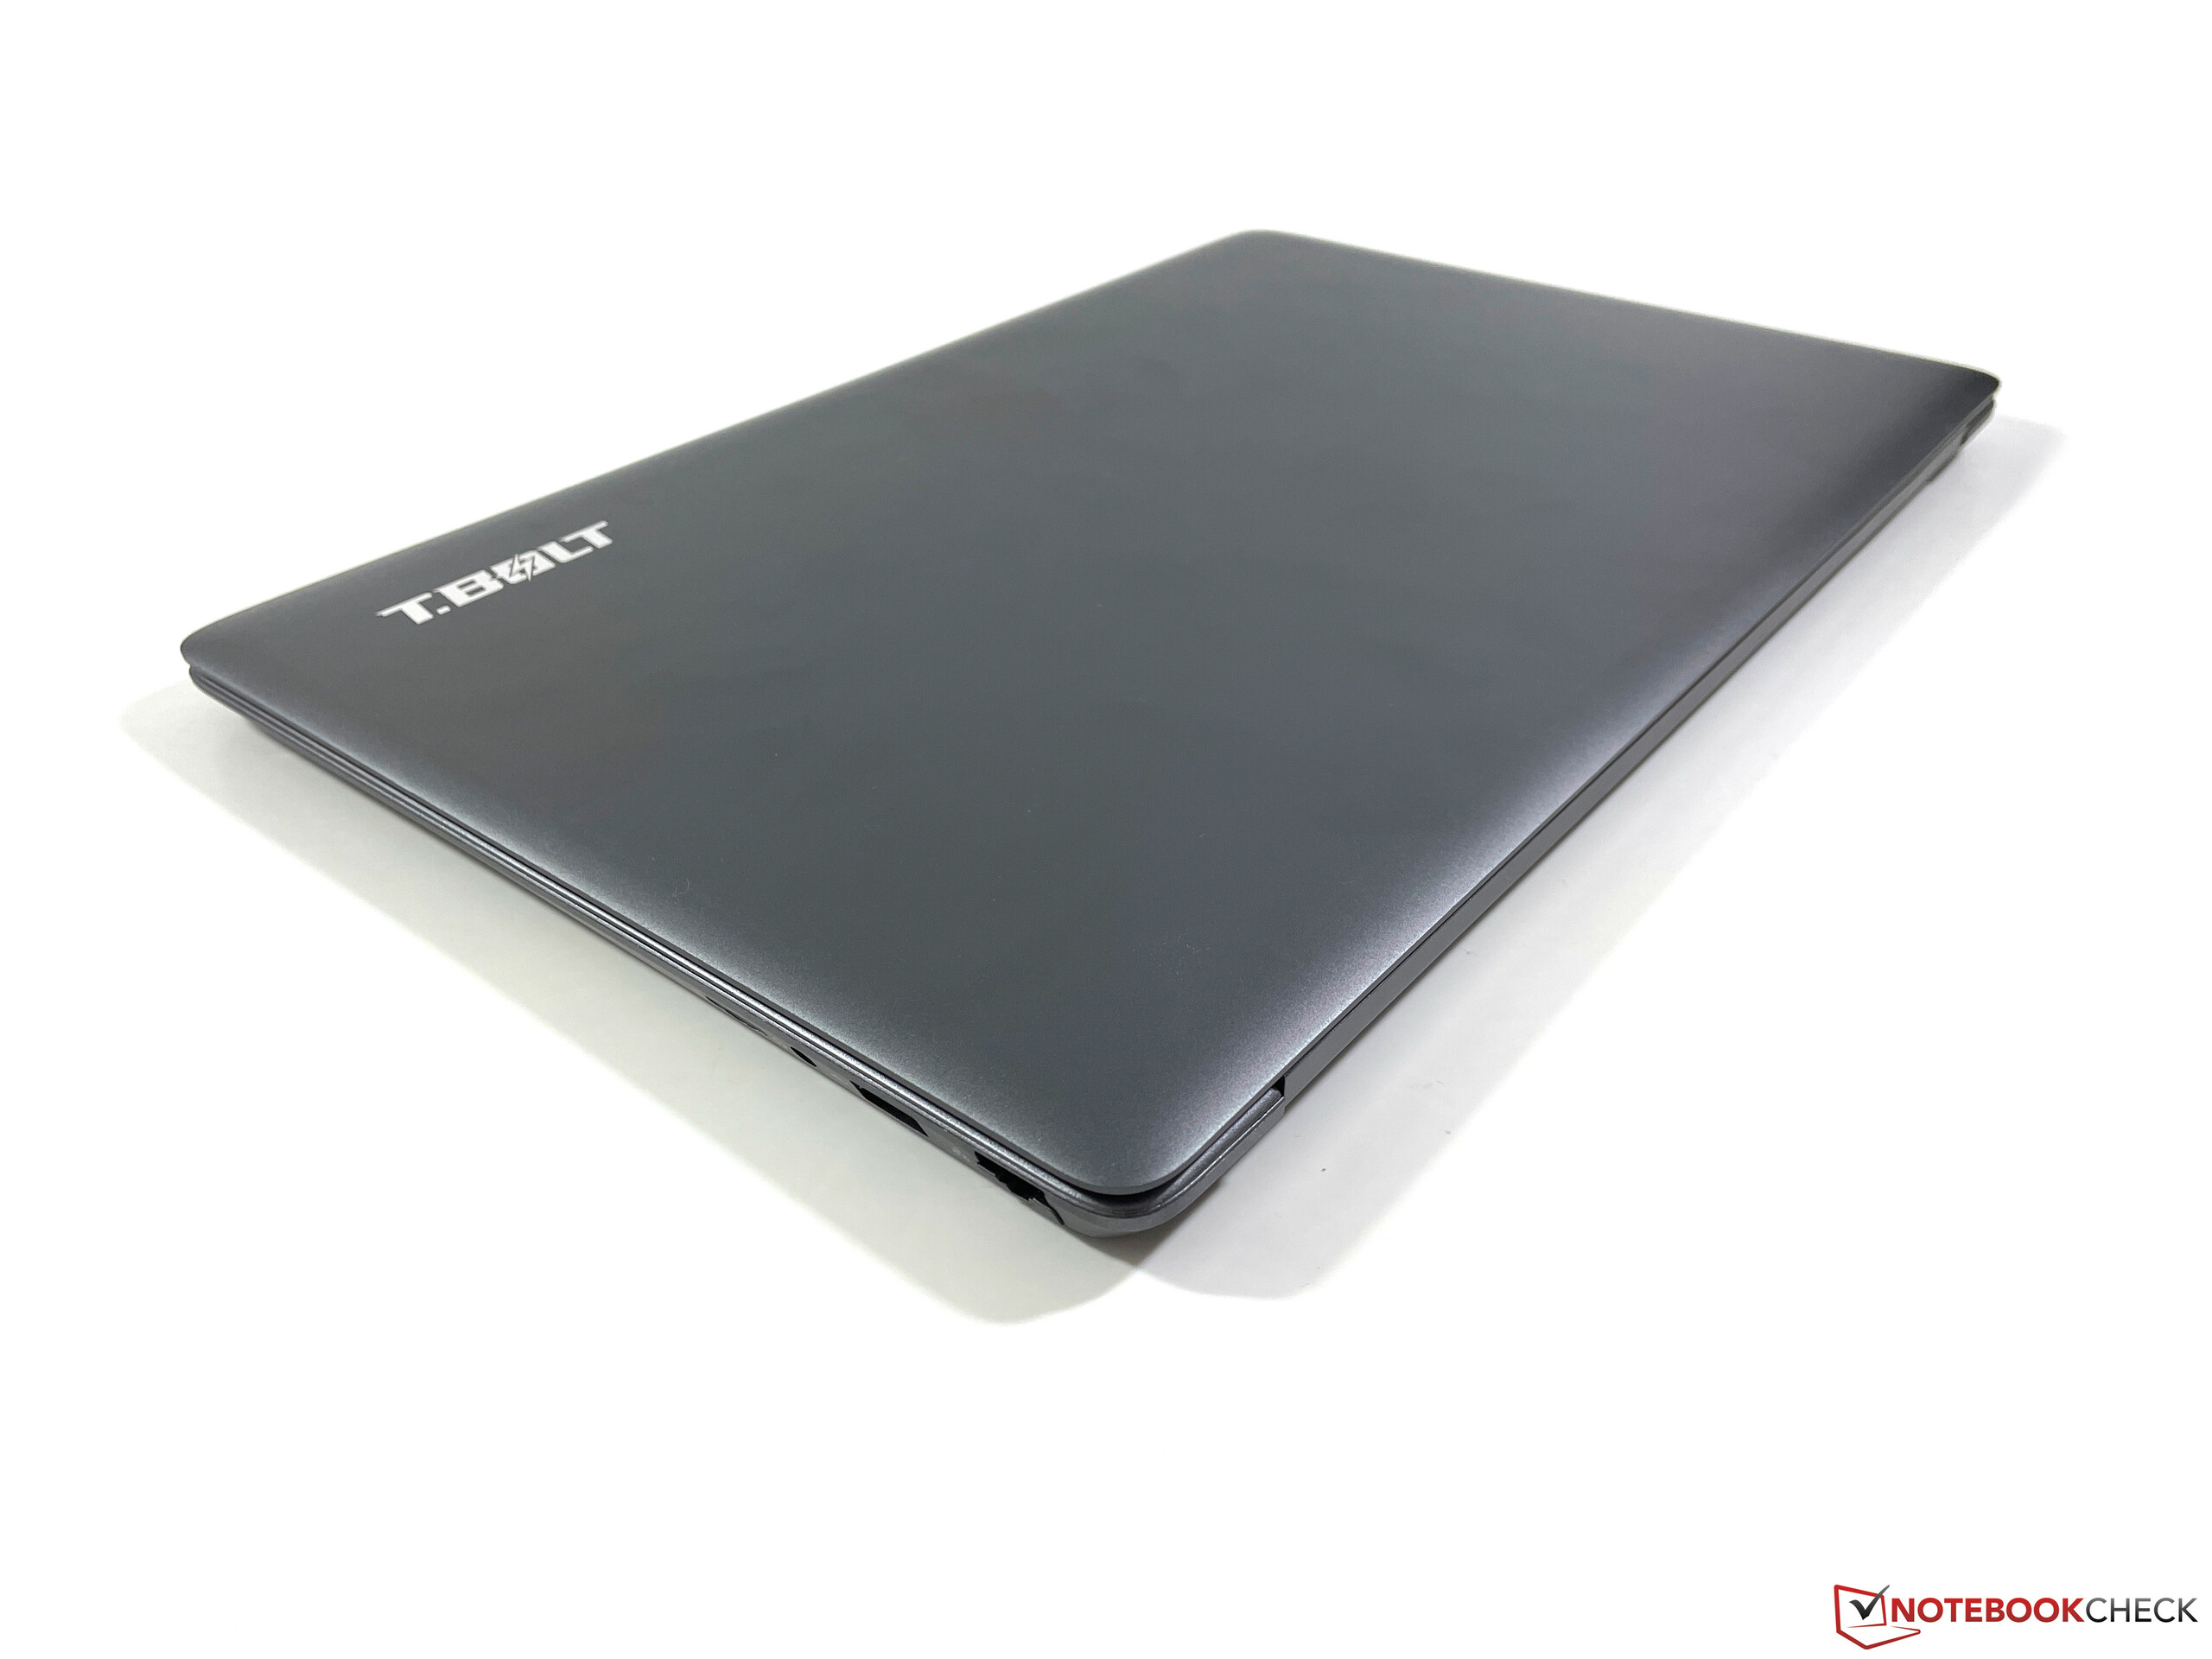
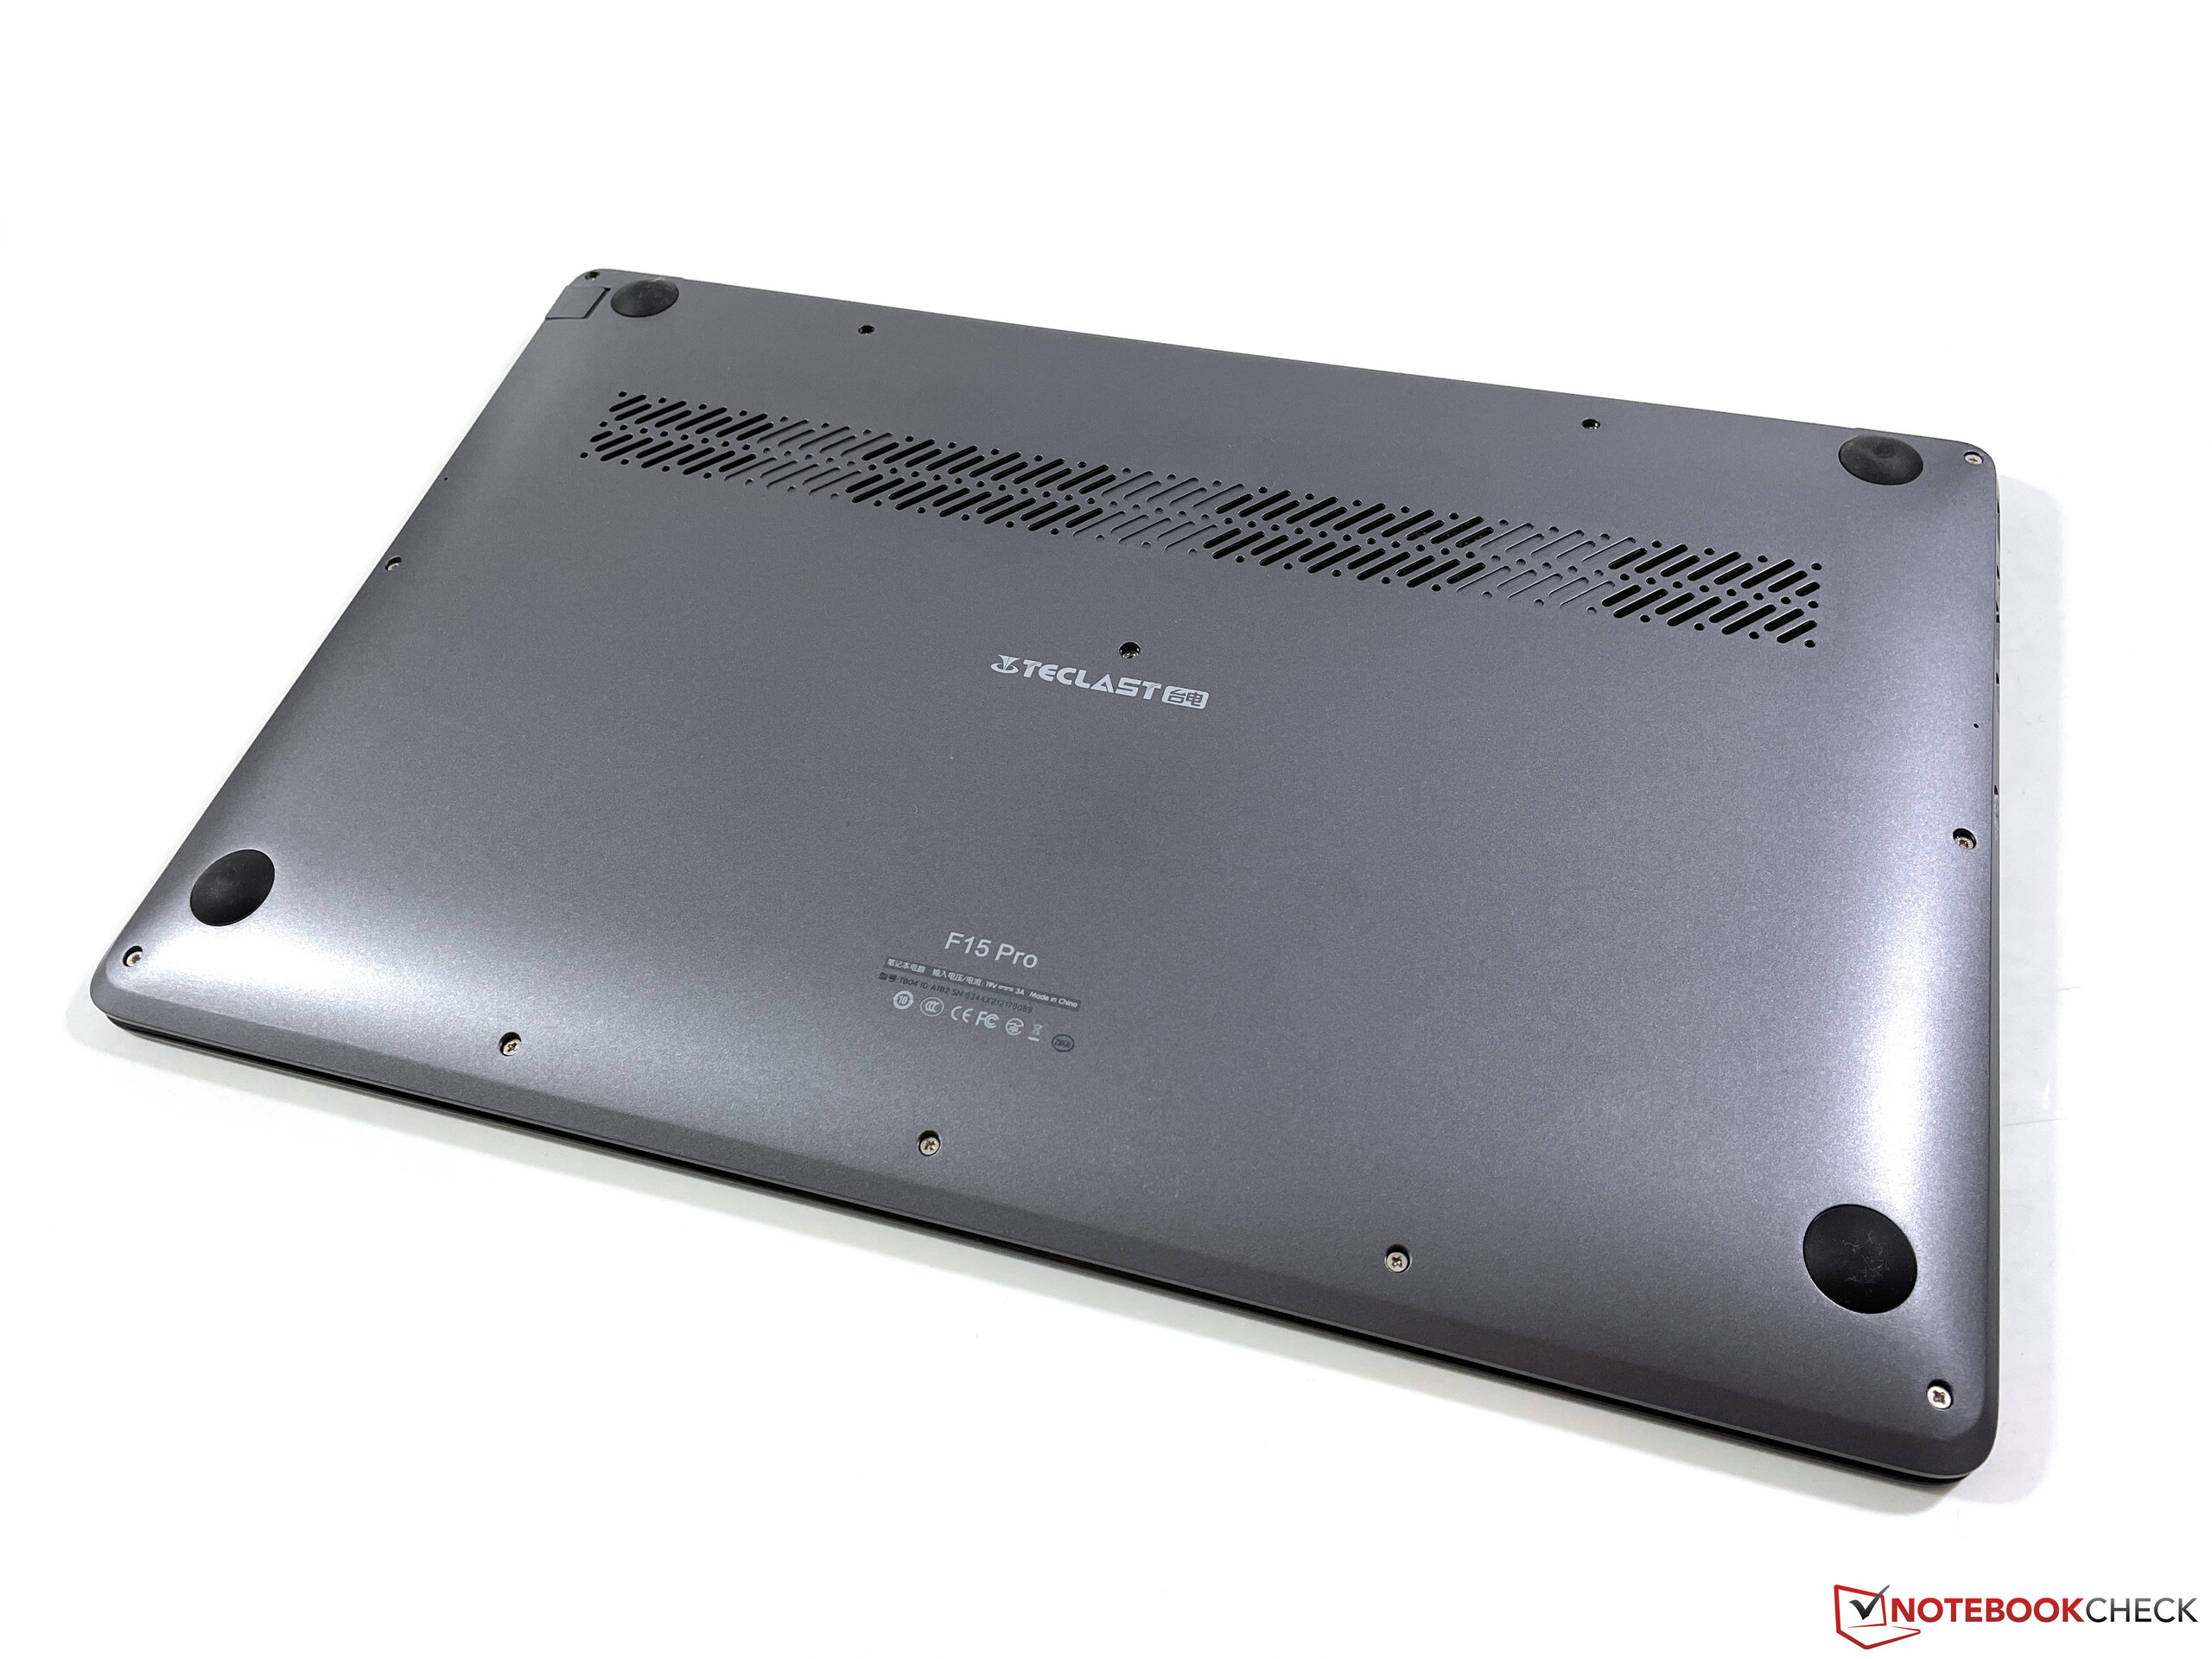
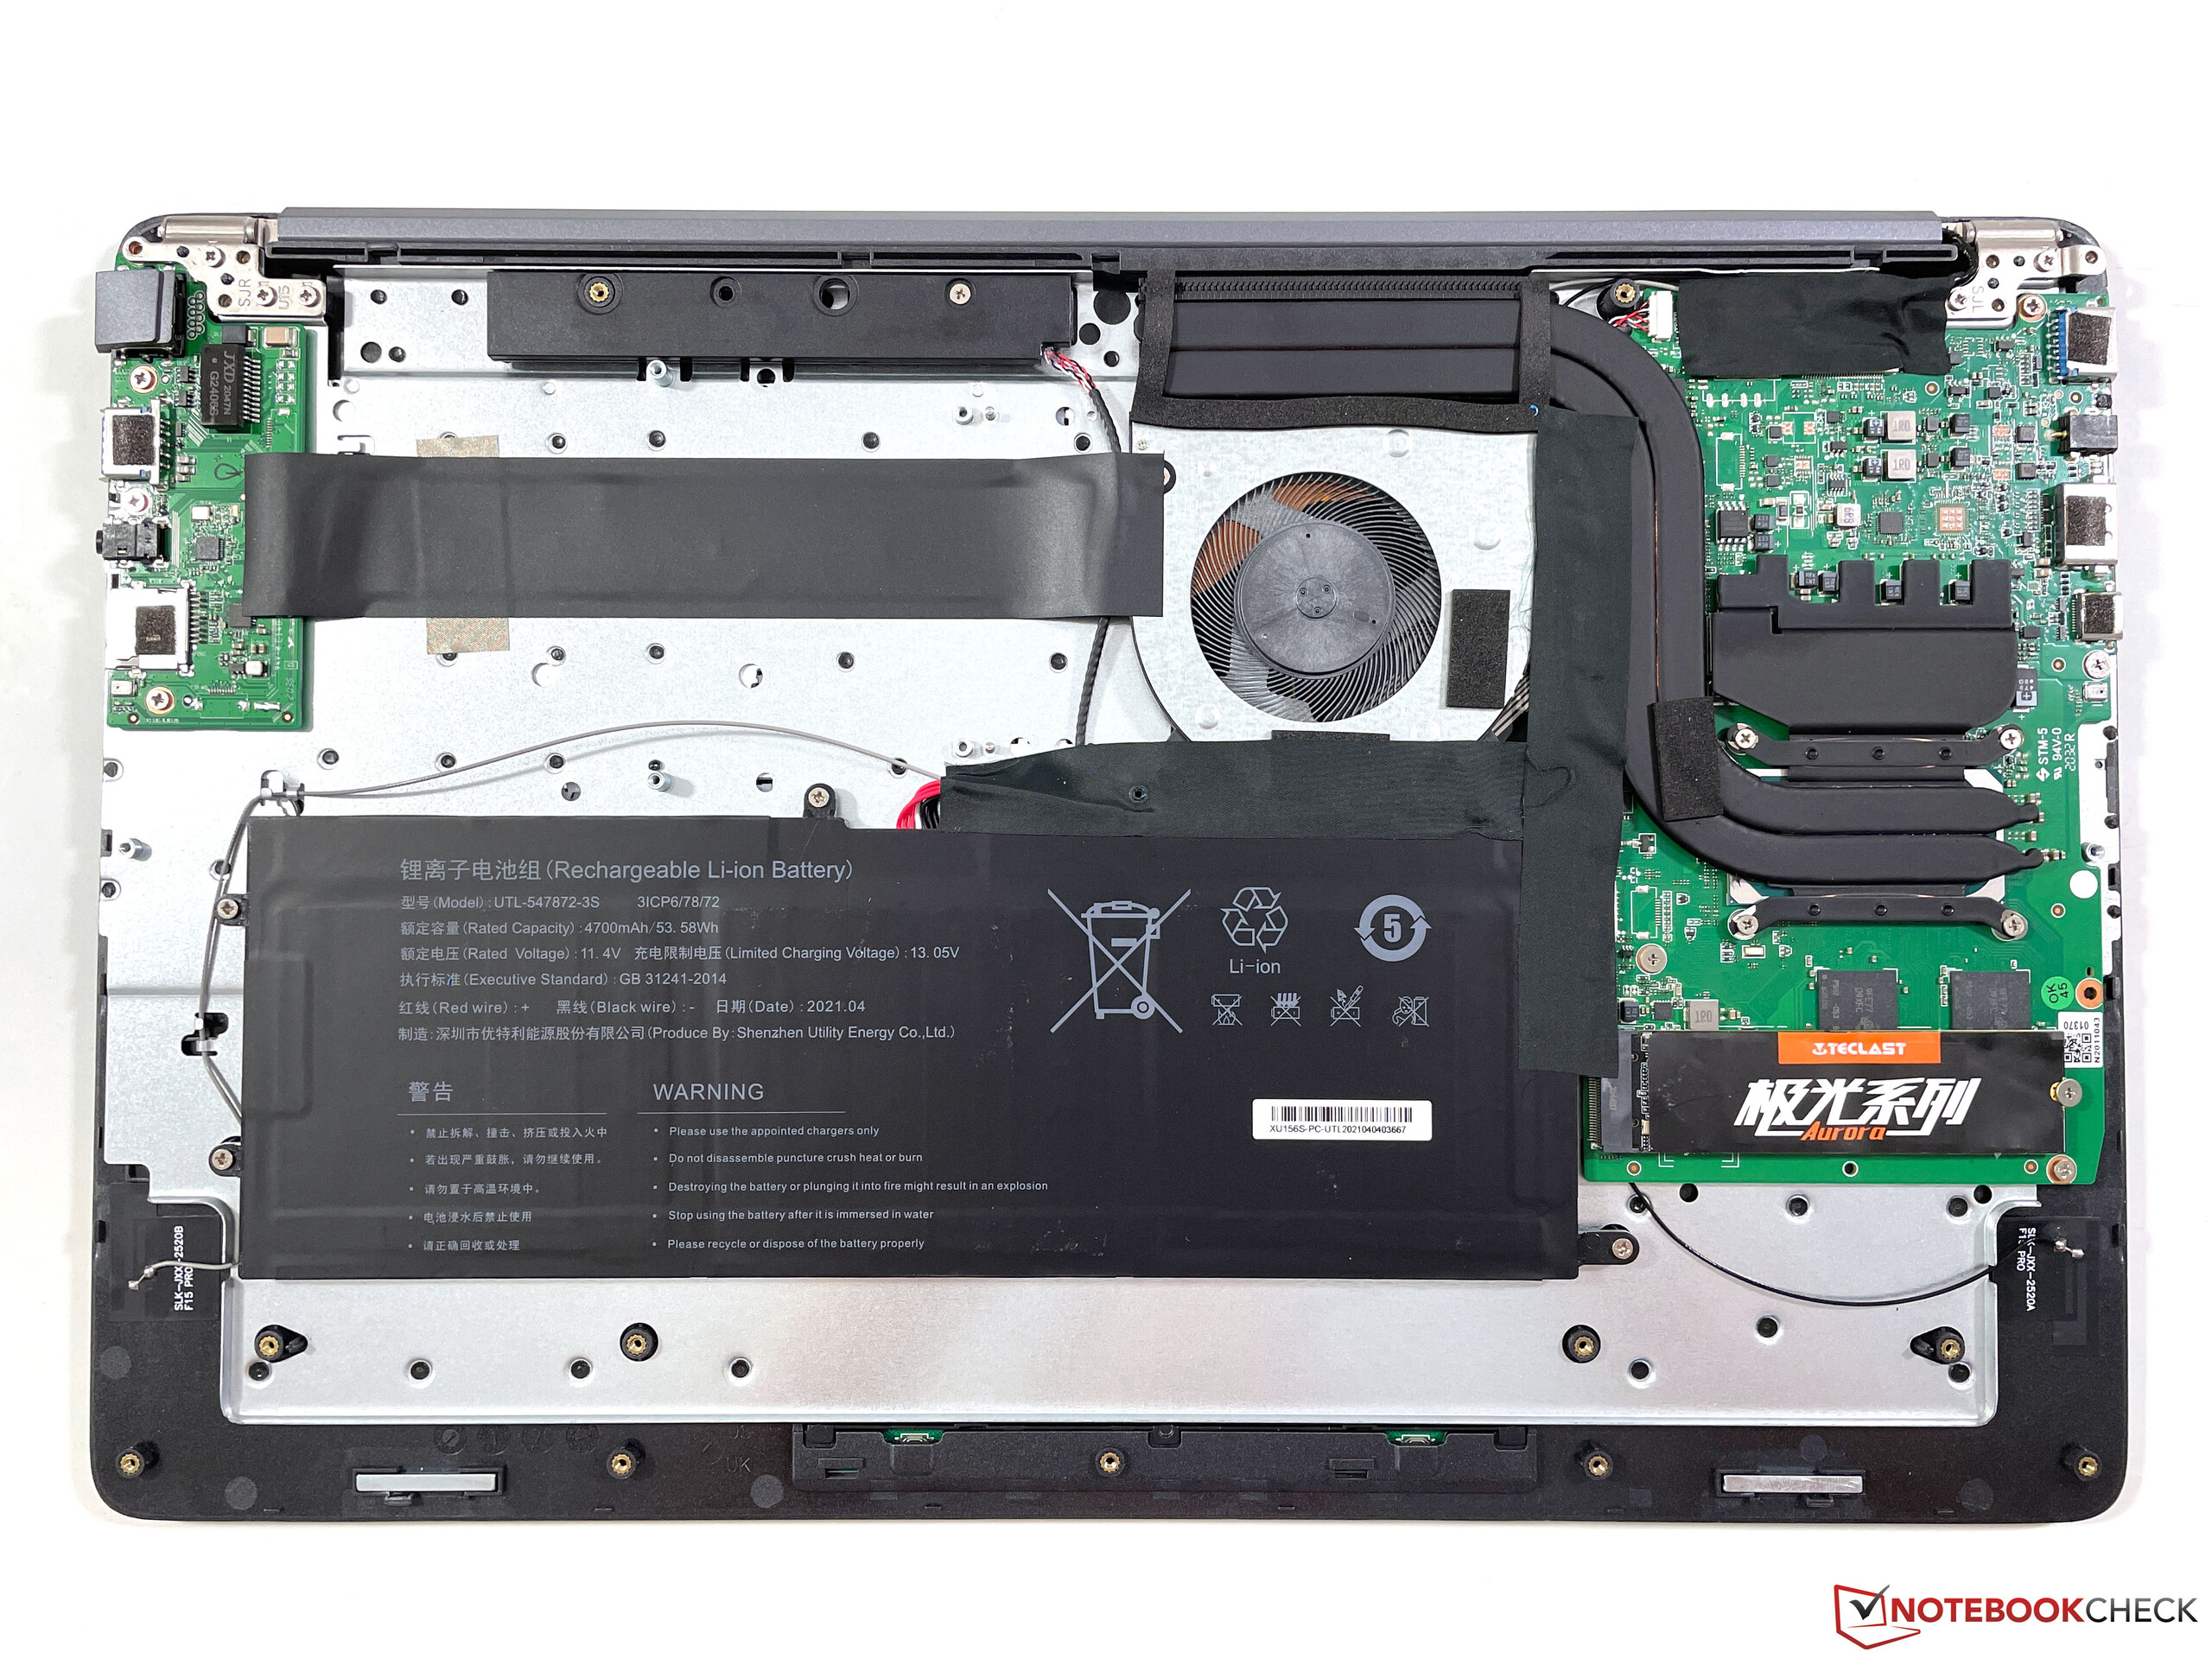
Teclast使用铝(盖子)和塑料的混合材料制作深灰色的外壳。稳定性尚可,整体制造质量符合这一价格范围的预期,但其他制造商也在这一价格范围内提供更高质量的外壳(如Chuwi、华为)。然而,铰链调整得不好,因为它明显摇晃。黑色的键盘没有照明,击键的声音相当大。我们喜欢这个大的ClickPad,操作起来没有问题。
你得到一个USB-C接口,但它不能用于充电(也没有DisplayPort)。否则,有两个USB端口(3.2 Gen.1)和一个成熟的HDMI输出。microSD读卡器非常慢,RealTek WLAN模块(802.11ac 1x1 & BT 5.0)也是如此。
黑色的键盘提供了足够的行程,但由于敲击声很大,看起来不是特别高质量。没有背光,但专用数字键盘很实用。大型ClickPad工作良好,但响亮的点击声在这里也很烦人。
| SD Card Reader | |
| average JPG Copy Test (av. of 3 runs) | |
| Average of class Office (19.8 - 198.5, n=22, last 2 years) | |
| Lenovo V15-ADA 82C7009SGE (Toshiba Exceria Pro SDXC 64 GB UHS-II) | |
| Teclast TBOLT F15 Pro (AV Pro v60) | |
| Dell Inspiron 15 5000 5502 (Toshiba Exceria Pro M501 microSDXC 32GB) | |
| maximum AS SSD Seq Read Test (1GB) | |
| Average of class Office (27.4 - 249, n=21, last 2 years) | |
| Lenovo V15-ADA 82C7009SGE (Toshiba Exceria Pro SDXC 64 GB UHS-II) | |
| Teclast TBOLT F15 Pro (AV Pro v60) | |
| Dell Inspiron 15 5000 5502 (Toshiba Exceria Pro M501 microSDXC 32GB) | |
| Networking | |
| iperf3 transmit AX12 | |
| Dell Inspiron 15 5000 5502 | |
| Huawei MateBook D 15-53010TUY | |
| Lenovo V15-ADA 82C7009SGE | |
| Average Realtek 8821CE Wireless LAN 802.11ac PCI-E NIC (54.8 - 339, n=21) | |
| Teclast TBOLT F15 Pro | |
| iperf3 receive AX12 | |
| Dell Inspiron 15 5000 5502 | |
| Huawei MateBook D 15-53010TUY | |
| Lenovo V15-ADA 82C7009SGE | |
| Average Realtek 8821CE Wireless LAN 802.11ac PCI-E NIC (86 - 348, n=21) | |
| Teclast TBOLT F15 Pro | |

, i3-1005G1, Teclast BD256GB")
, i3-1005G1, Teclast BD256GB")
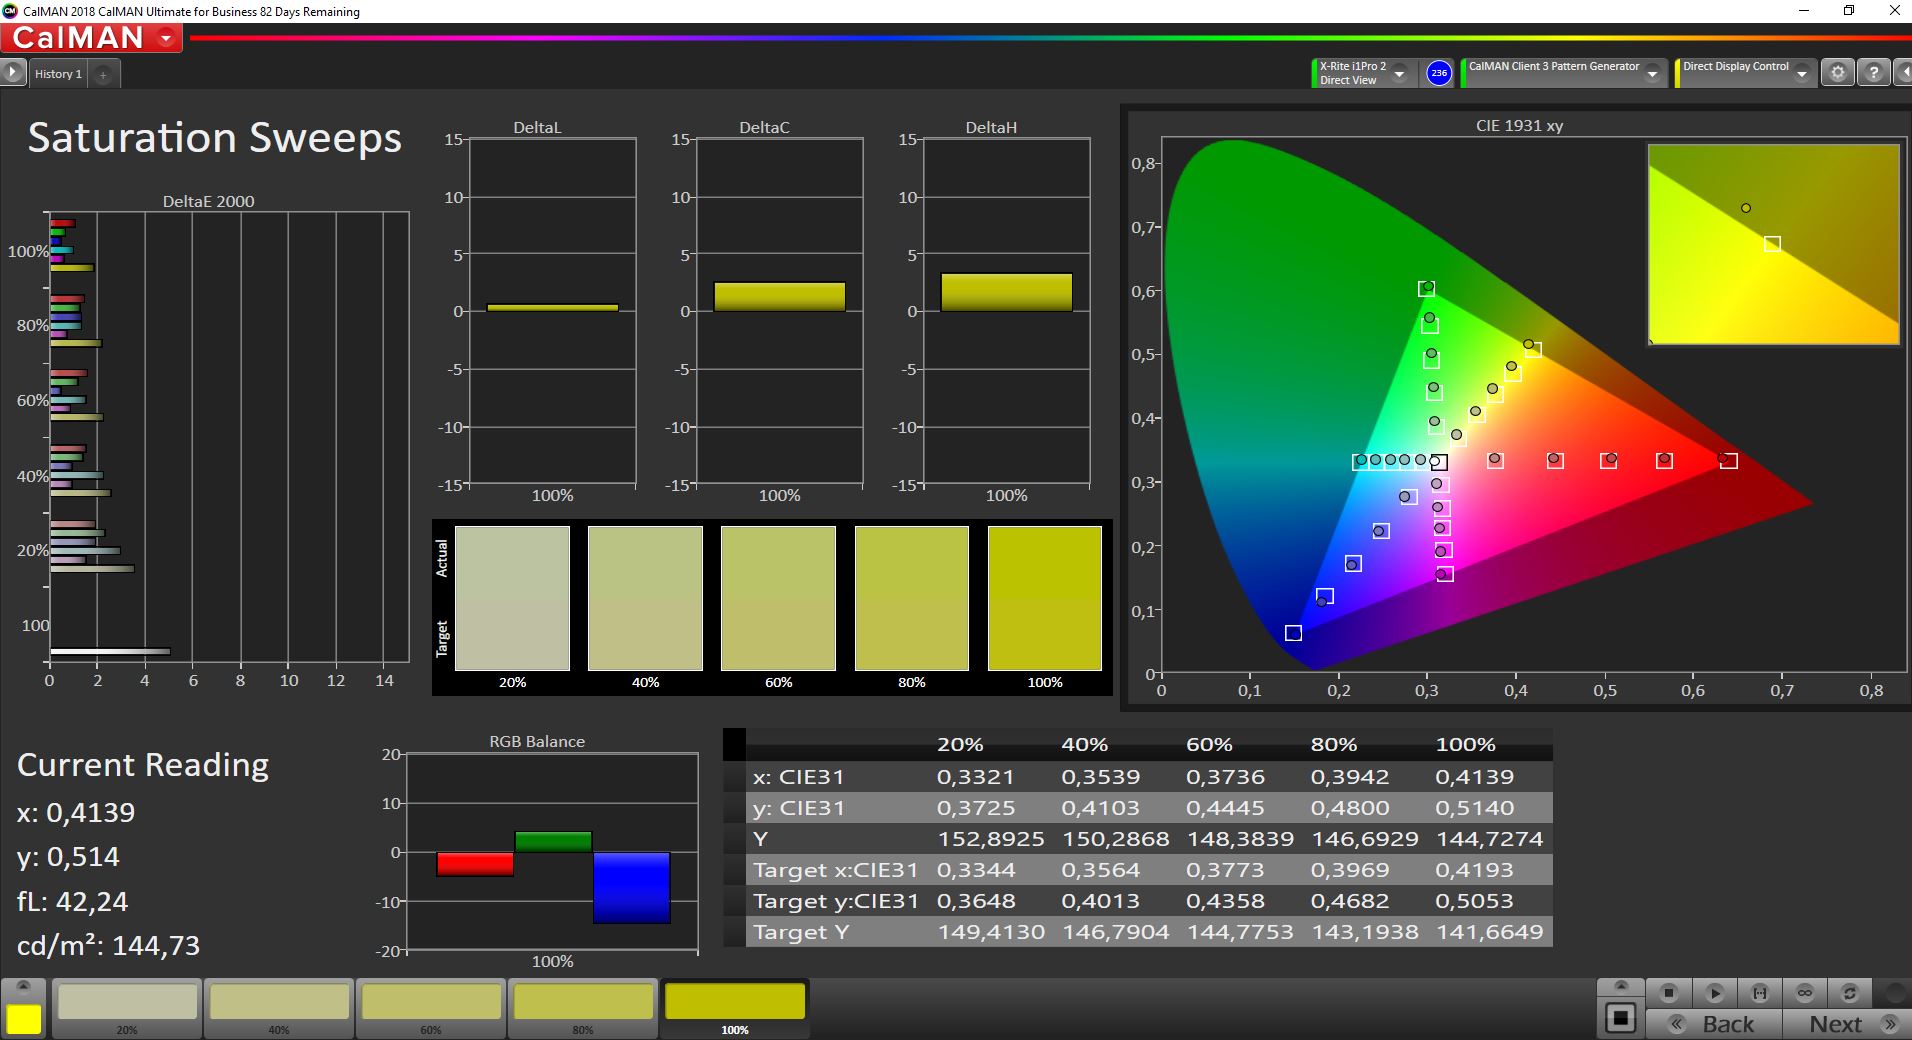
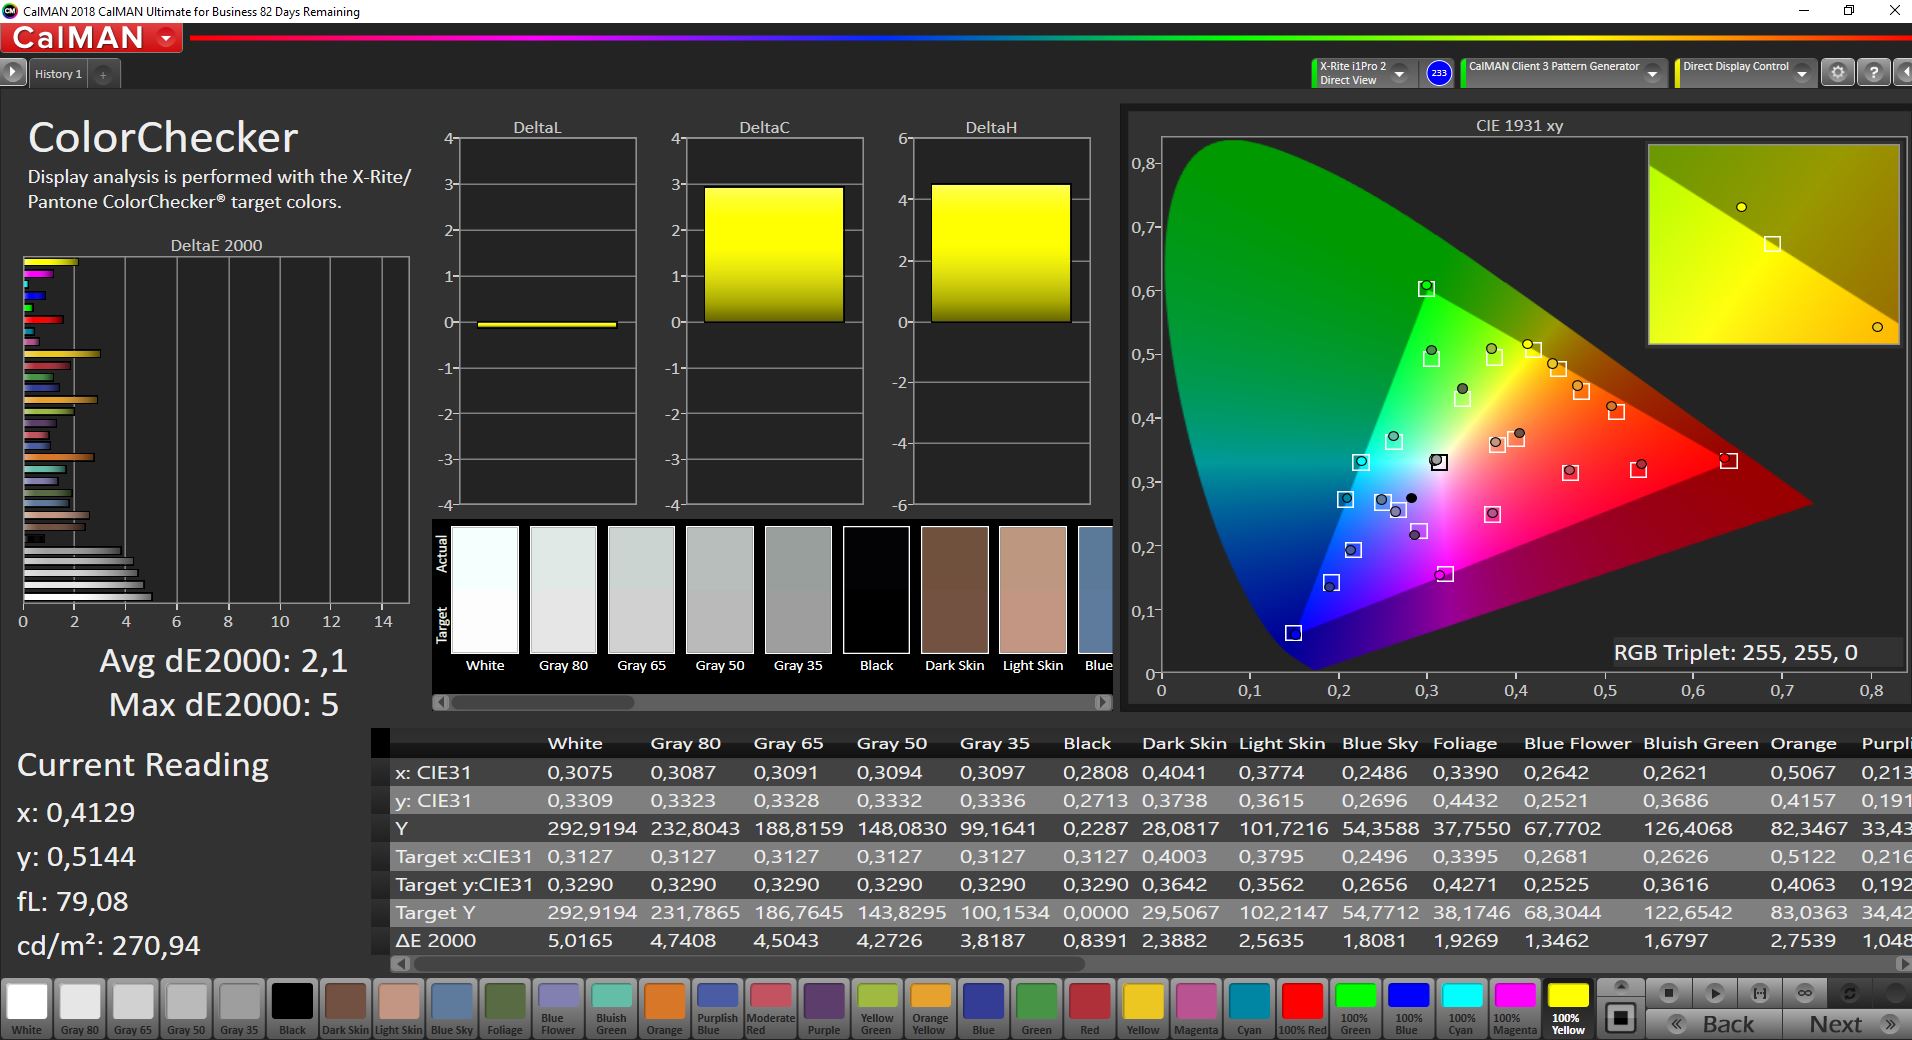
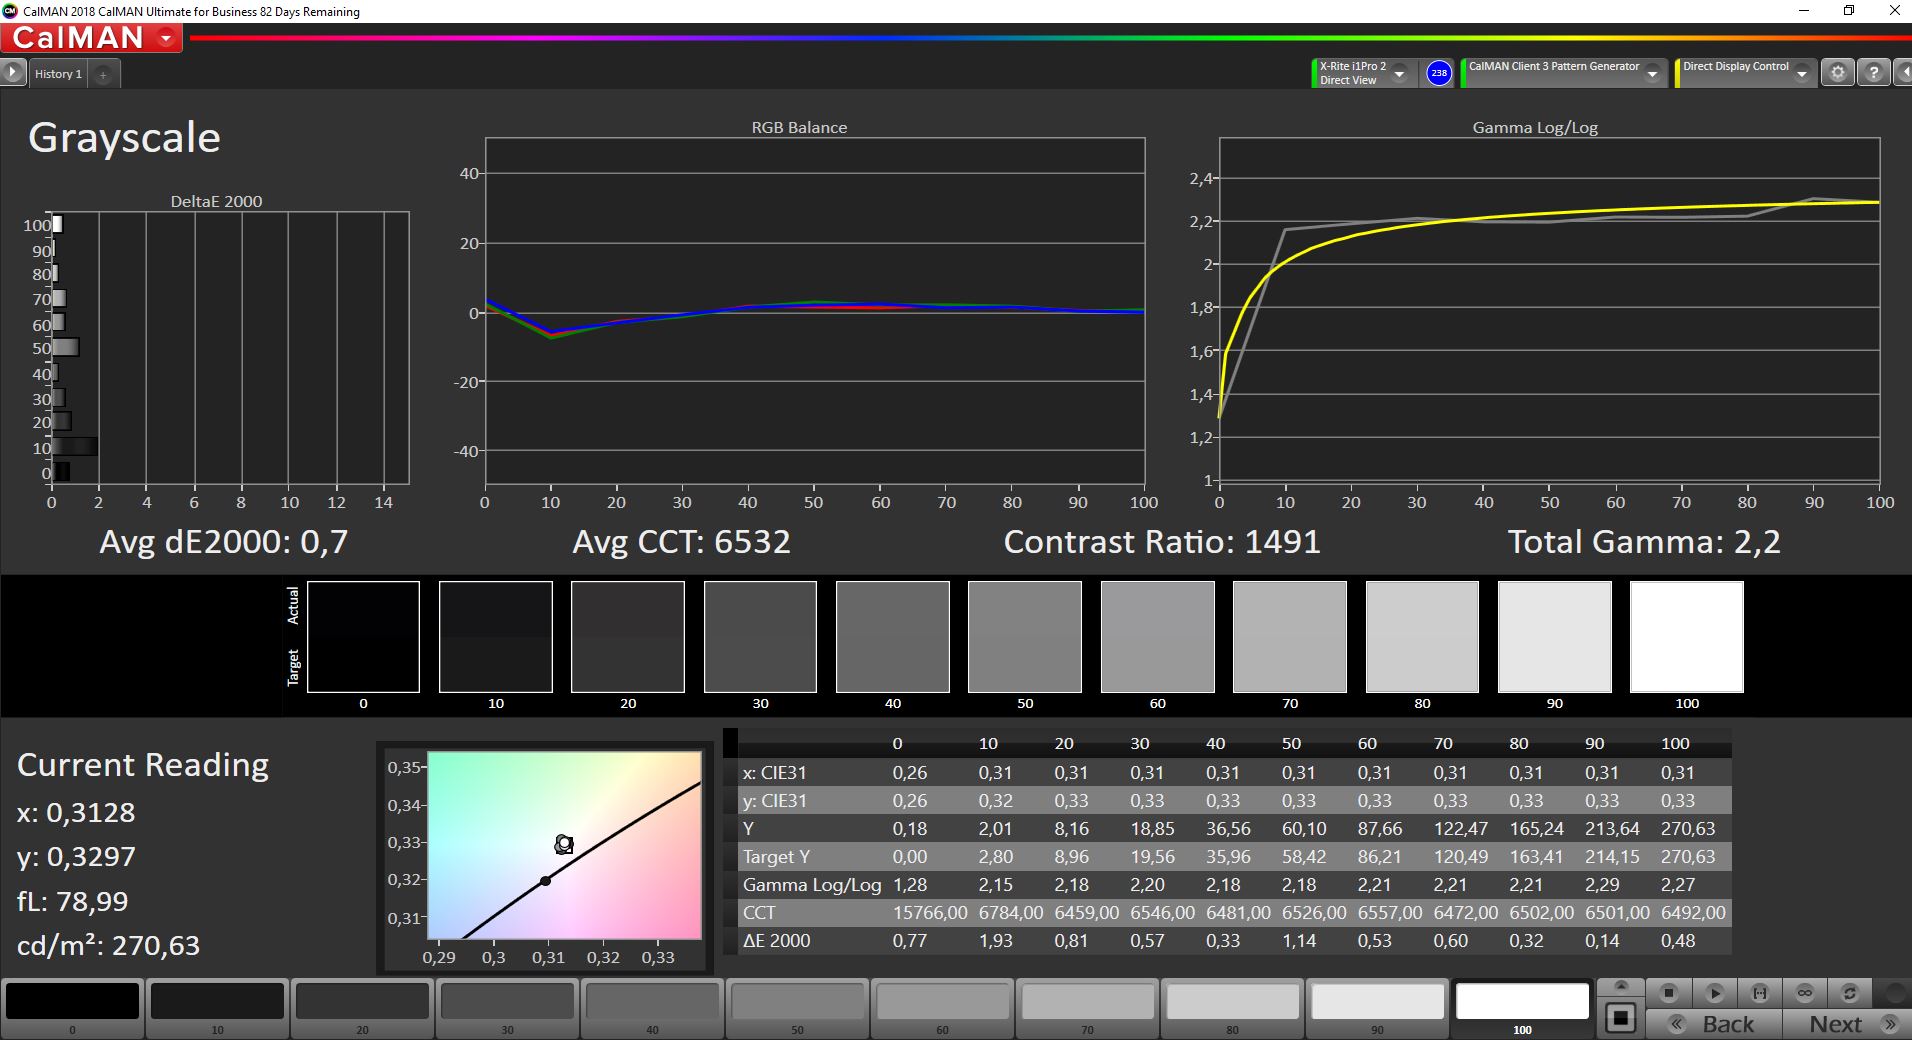
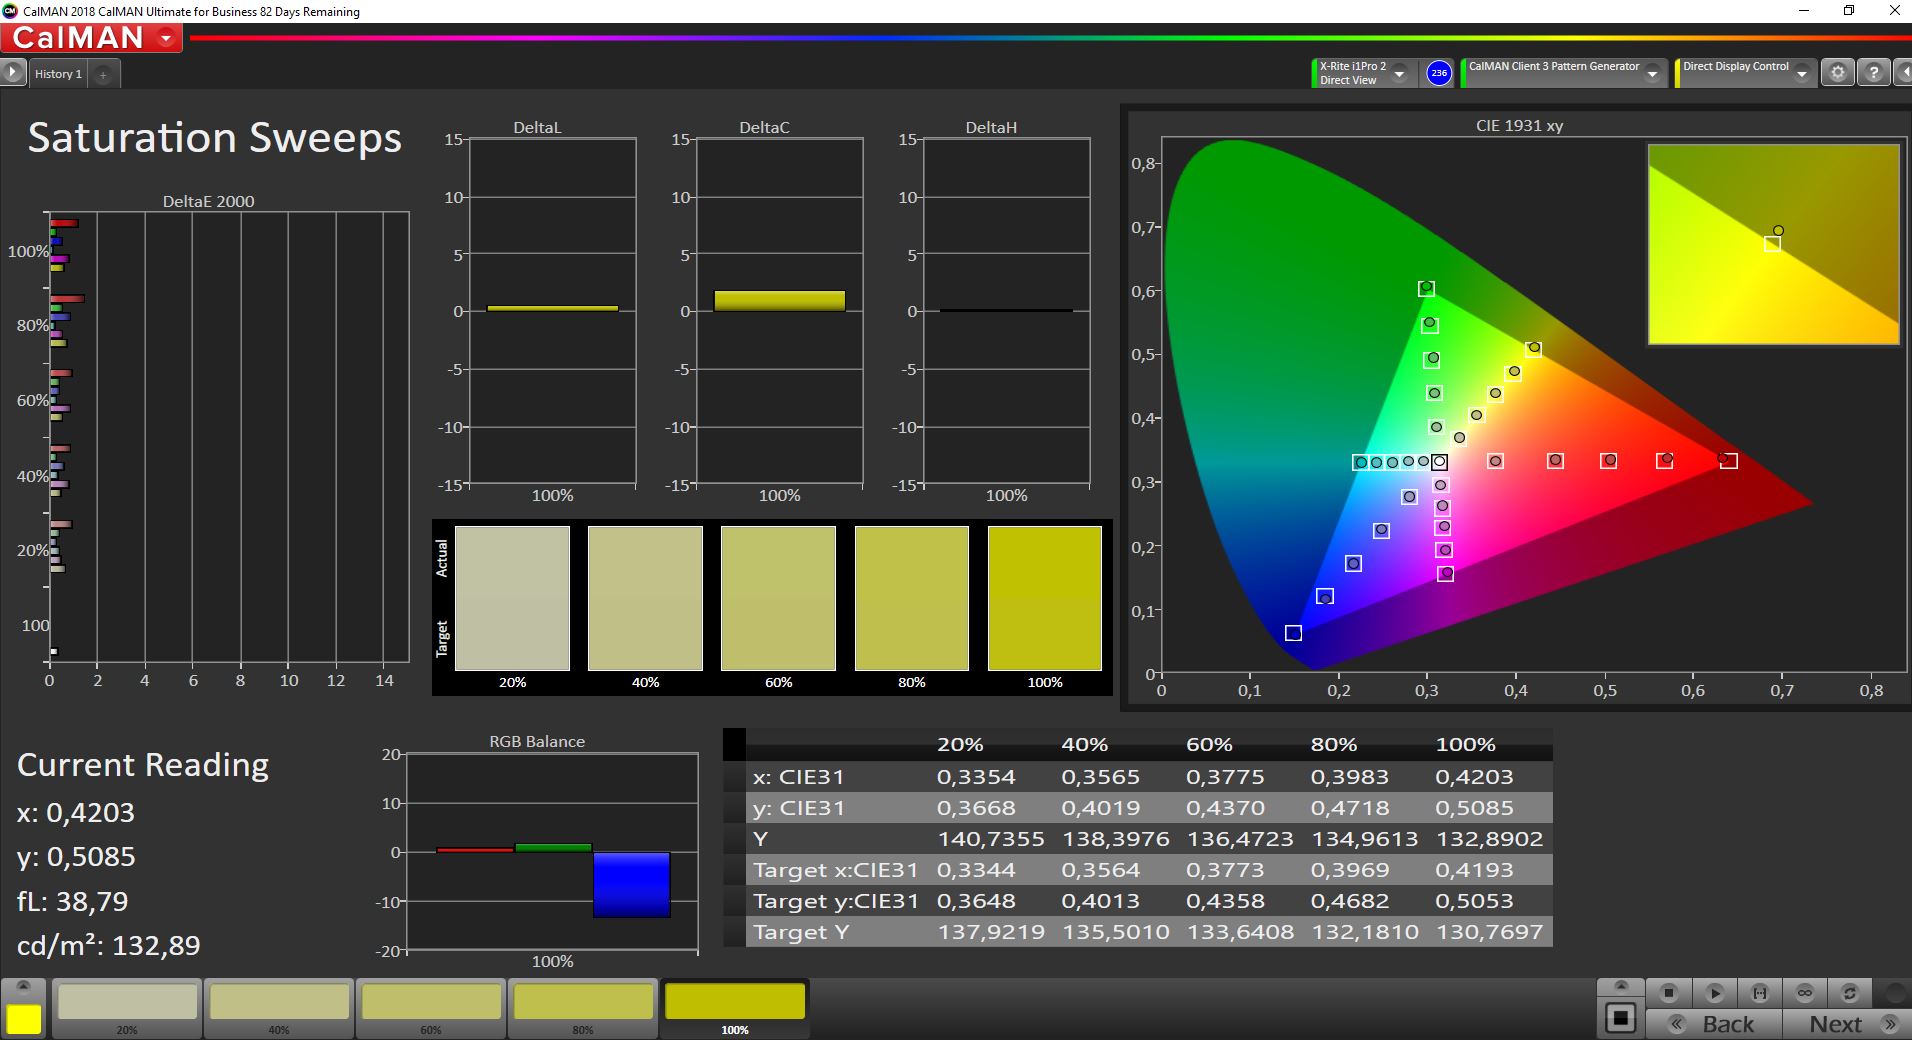
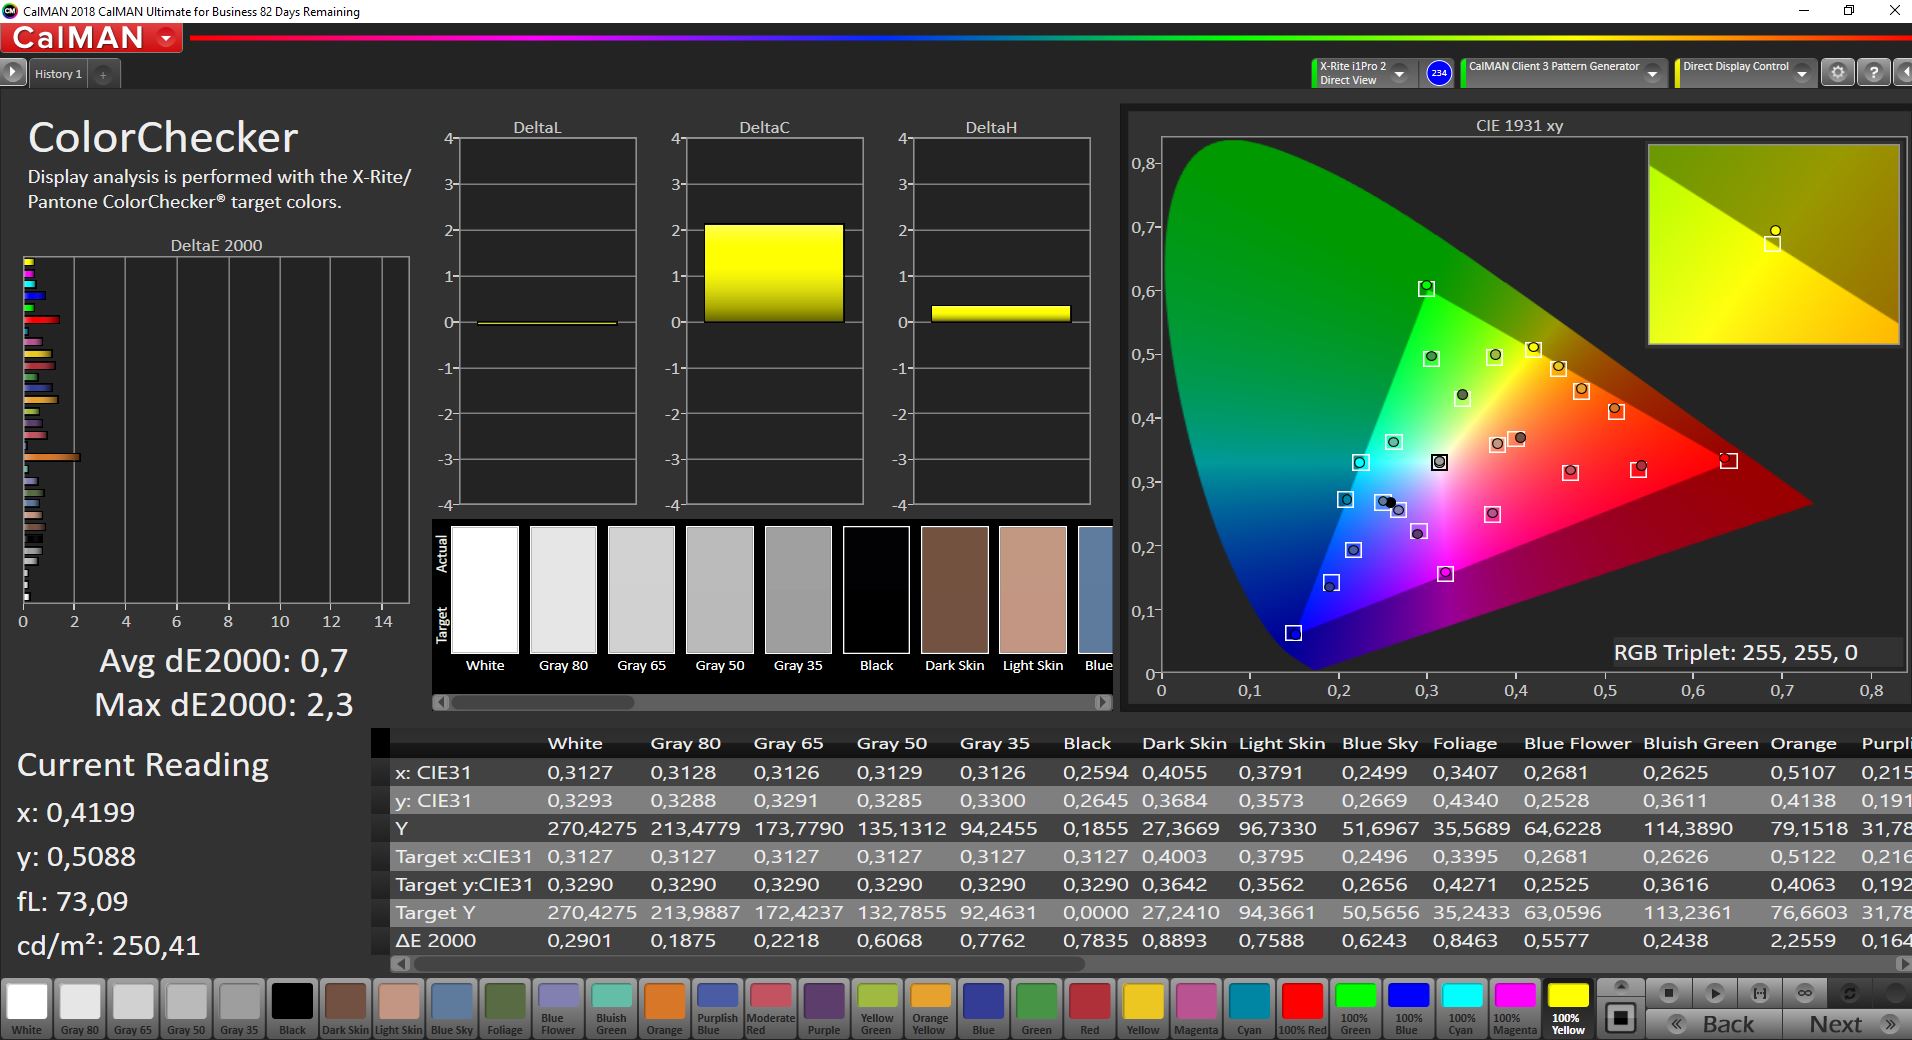
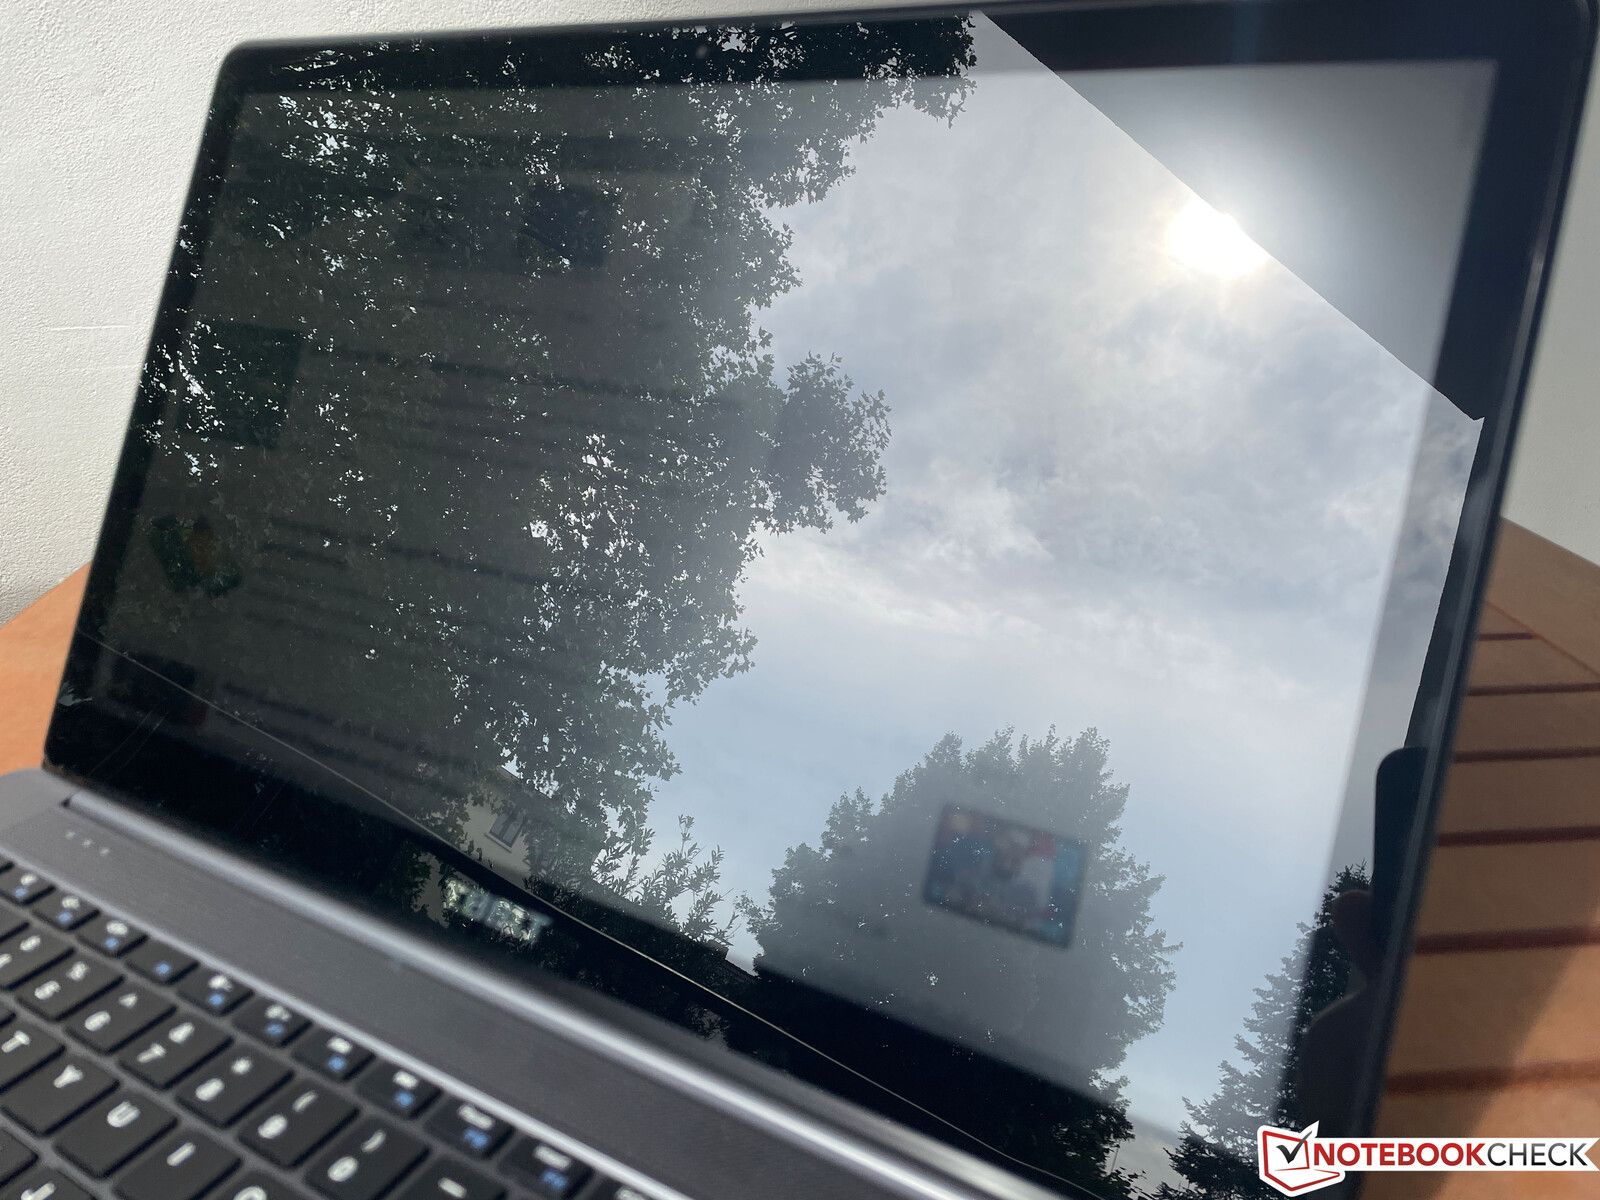
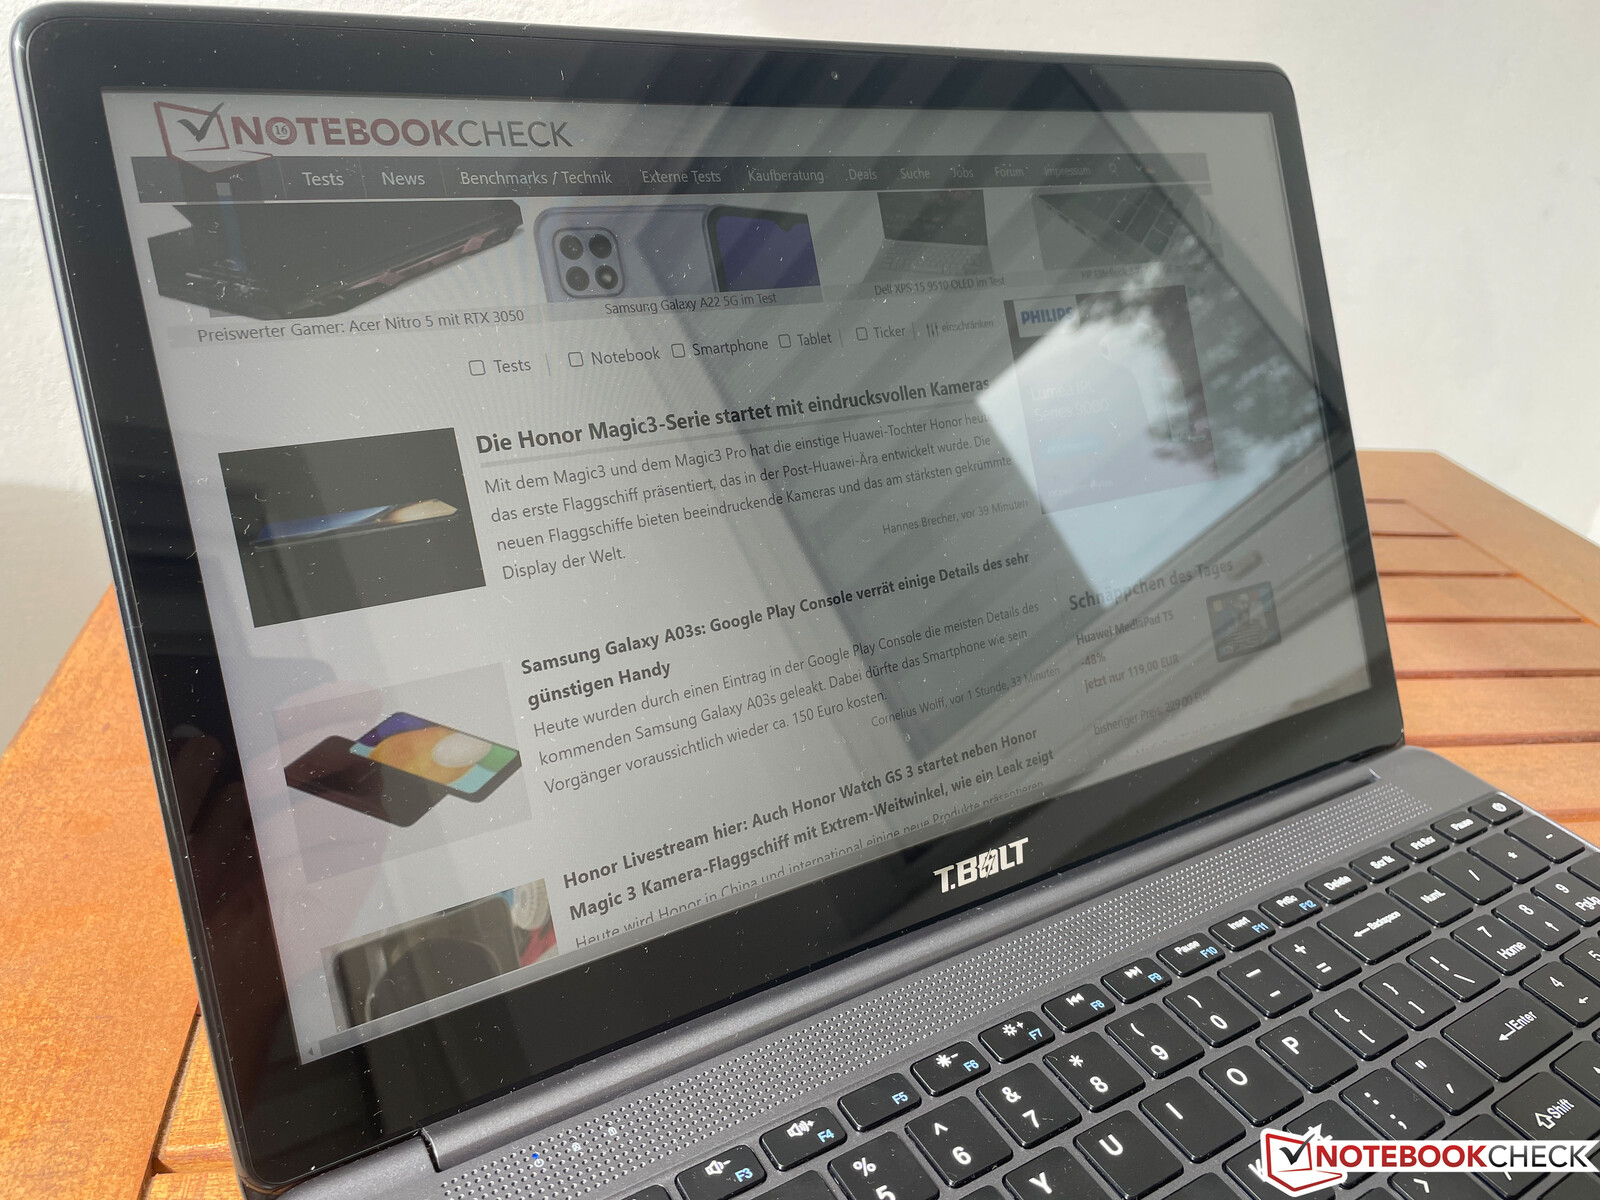
显示屏 - 1080p IPS面板

15.6英寸的IPS显示屏提供全高清分辨率,并有一个光泽的表面。这在户外是有问题的,但至少面板的主观画面印象是好的,颜色也看起来很生动。
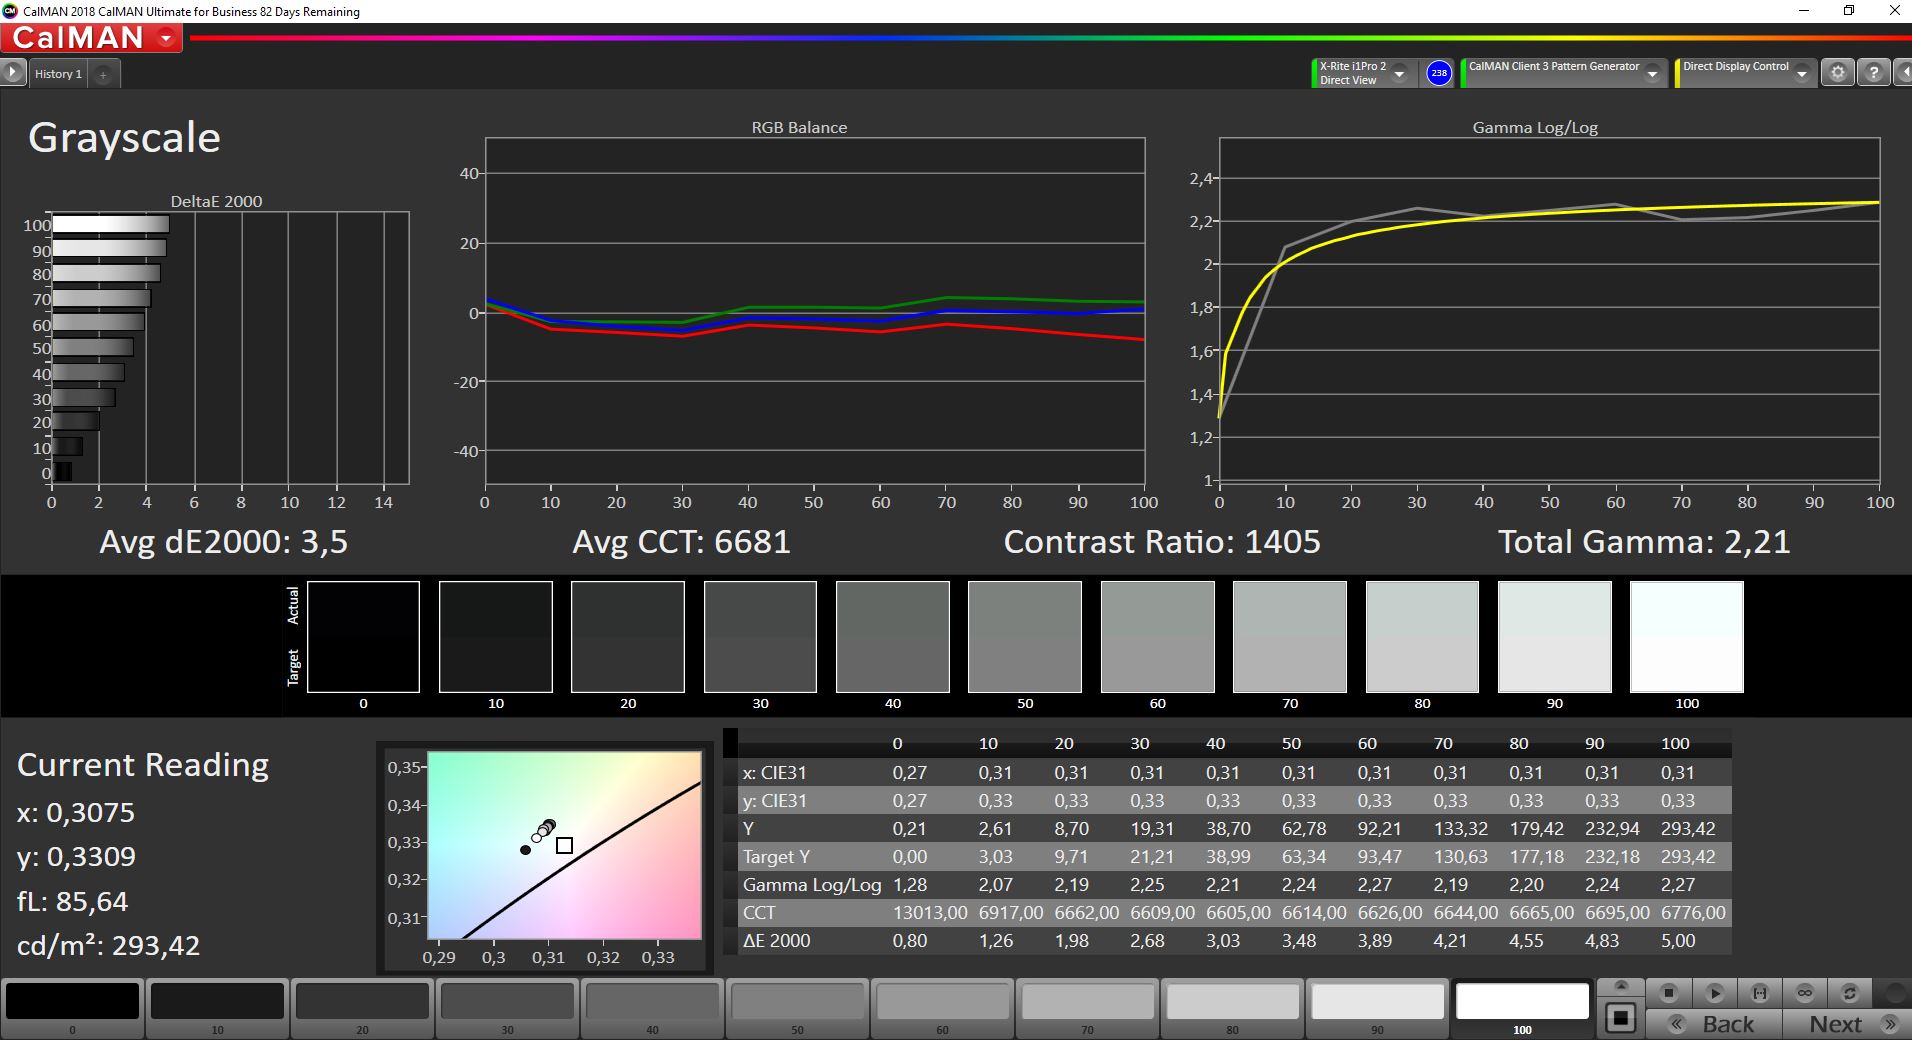
平均亮度约为260cd/m²,对比度甚至达到了非常好的1400:1。然而,最低亮度有点问题,为77cd/m²,这在非常黑暗的环境中太高了。我们无法检测到PWM闪烁,光晕也不是一个问题。
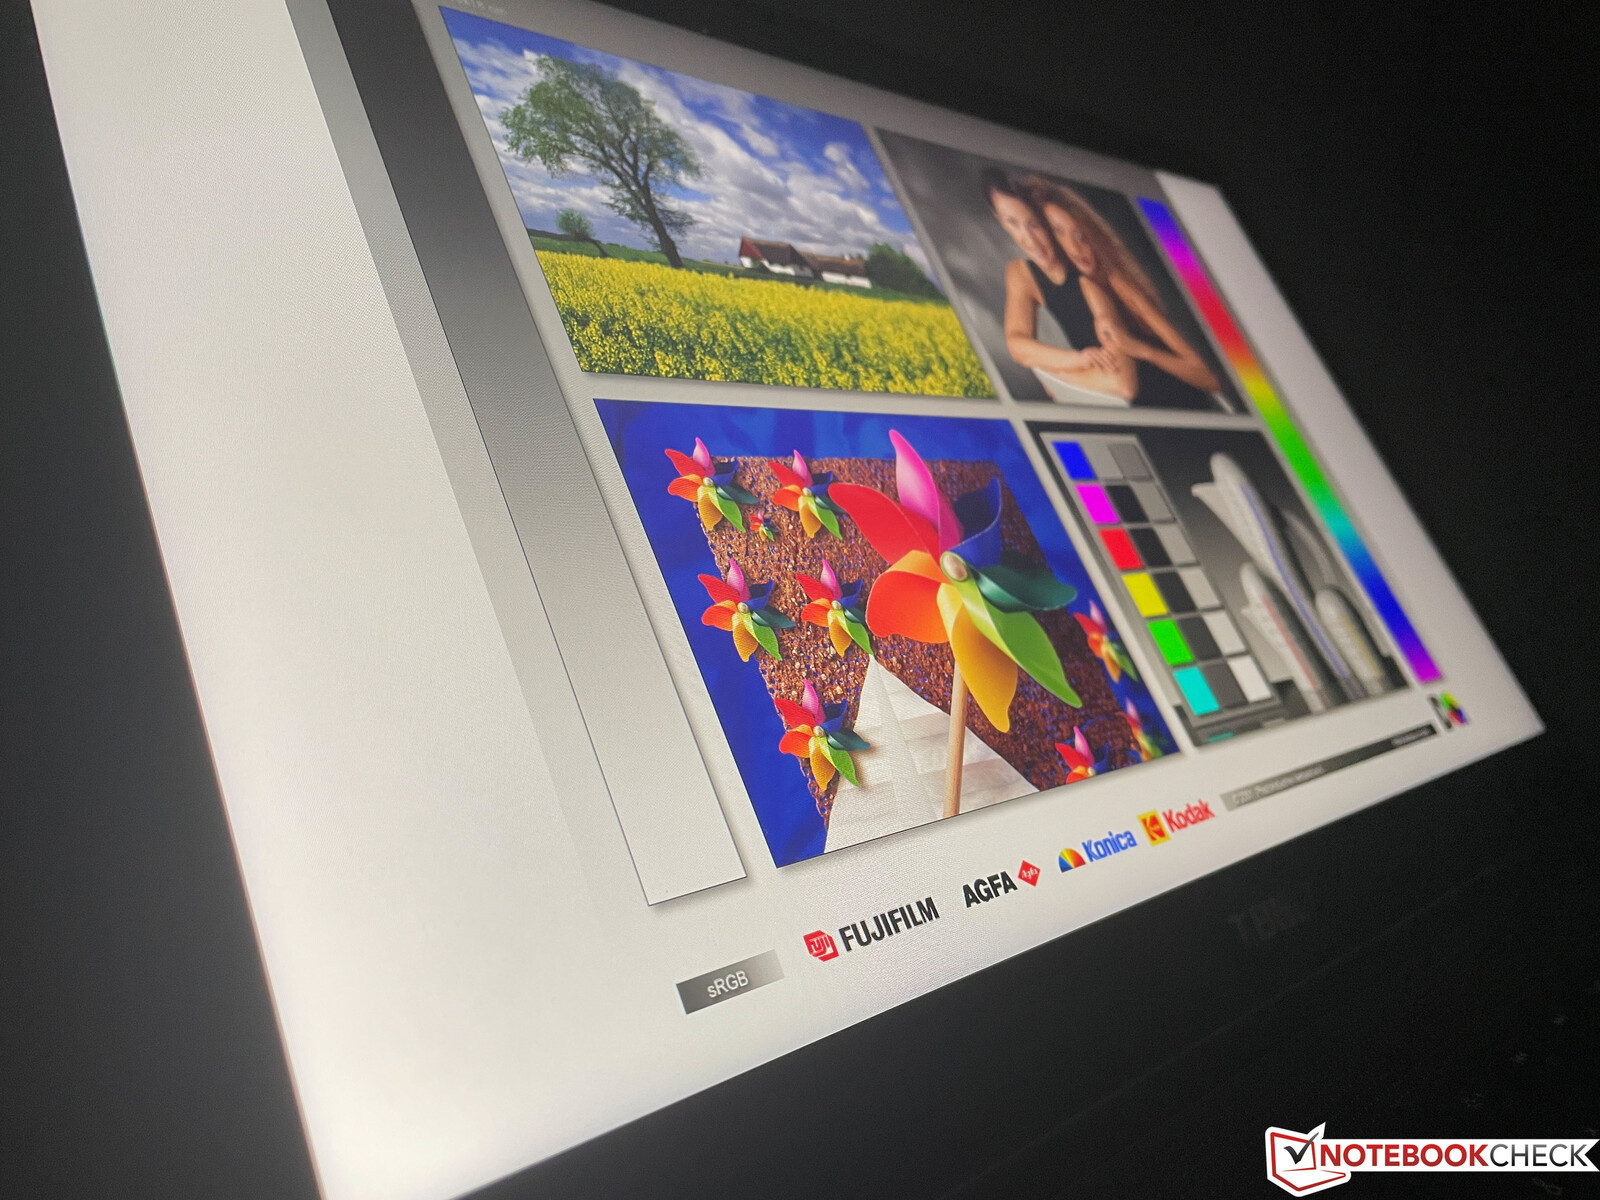
由于几乎完整的sRGB,该面板在出厂前已经被很好地校准,甚至编辑图片/视频也是合理的。IPS显示屏的可视角度稳定性很好。
| |||||||||||||||||||||||||
Brightness Distribution: 84 %
Center on Battery: 294 cd/m²
Contrast: 1395:1 (Black: 0.21 cd/m²)
ΔE ColorChecker Calman: 2.1 | ∀{0.5-29.43 Ø4.72}
calibrated: 0.7
ΔE Greyscale Calman: 3.5 | ∀{0.09-98 Ø4.97}
67.8% AdobeRGB 1998 (Argyll 3D)
98.1% sRGB (Argyll 3D)
65.6% Display P3 (Argyll 3D)
Gamma: 2.21
CCT: 6681 K
| Teclast TBOLT F15 Pro N156HCA-EN1, IPS, 1920x1080, 15.6" | Huawei MateBook D 15-53010TUY AU Optronics AUO28ED, IPS, 1920x1080, 15.6" | Lenovo V15-ADA 82C7009SGE Chi Mei CMN15F5, TN, 1920x1080, 15.6" | Dell Inspiron 15 5000 5502 BOE NV15N3D, IPS, 1920x1080, 15.6" | |
|---|---|---|---|---|
| Display | -38% | -43% | -40% | |
| Display P3 Coverage (%) | 65.6 | 40.49 -38% | 37.13 -43% | 39.42 -40% |
| sRGB Coverage (%) | 98.1 | 60.9 -38% | 55.8 -43% | 58.7 -40% |
| AdobeRGB 1998 Coverage (%) | 67.8 | 41.84 -38% | 38.36 -43% | 40.73 -40% |
| Response Times | -13% | 41% | -26% | |
| Response Time Grey 50% / Grey 80% * (ms) | 39.6 ? | 43.6 ? -10% | 26 ? 34% | 45.6 ? -15% |
| Response Time Black / White * (ms) | 26.8 ? | 31.2 ? -16% | 14 ? 48% | 36.4 ? -36% |
| PWM Frequency (Hz) | 1020 ? | |||
| Screen | -98% | -105% | -128% | |
| Brightness middle (cd/m²) | 293 | 271 -8% | 232 -21% | 233.1 -20% |
| Brightness (cd/m²) | 266 | 256 -4% | 211 -21% | 226 -15% |
| Brightness Distribution (%) | 84 | 90 7% | 82 -2% | 90 7% |
| Black Level * (cd/m²) | 0.21 | 0.15 29% | 0.41 -95% | 0.21 -0% |
| Contrast (:1) | 1395 | 1807 30% | 566 -59% | 1110 -20% |
| Colorchecker dE 2000 * | 2.1 | 4.7 -124% | 6.83 -225% | 5.69 -171% |
| Colorchecker dE 2000 max. * | 5 | 20.4 -308% | 18.77 -275% | 20.62 -312% |
| Colorchecker dE 2000 calibrated * | 0.7 | 4.6 -557% | 5.12 -631% | |
| Greyscale dE 2000 * | 3.5 | 1.6 54% | 8.52 -143% | 3.3 6% |
| Gamma | 2.21 100% | 2.17 101% | 2.45 90% | 2.35 94% |
| CCT | 6681 97% | 6649 98% | 9753 67% | 6749 96% |
| Color Space (Percent of AdobeRGB 1998) (%) | 38.5 | 35 | 37.1 | |
| Color Space (Percent of sRGB) (%) | 60.6 | 56 | 58 | |
| Total Average (Program / Settings) | -50% /
-73% | -36% /
-68% | -65% /
-95% |
* ... smaller is better
Display Response Times
| ↔ Response Time Black to White | ||
|---|---|---|
| 26.8 ms ... rise ↗ and fall ↘ combined | ↗ 16 ms rise | 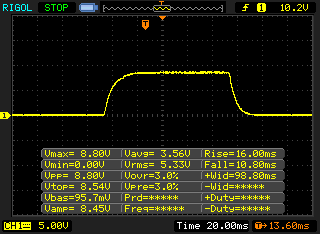 |
| ↘ 10.8 ms fall | ||
| The screen shows relatively slow response rates in our tests and may be too slow for gamers. In comparison, all tested devices range from 0.1 (minimum) to 240 (maximum) ms. » 67 % of all devices are better. This means that the measured response time is worse than the average of all tested devices (19.9 ms). | ||
| ↔ Response Time 50% Grey to 80% Grey | ||
| 39.6 ms ... rise ↗ and fall ↘ combined | ↗ 20.4 ms rise | 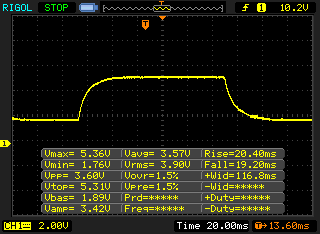 |
| ↘ 19.2 ms fall | ||
| The screen shows slow response rates in our tests and will be unsatisfactory for gamers. In comparison, all tested devices range from 0.165 (minimum) to 636 (maximum) ms. » 60 % of all devices are better. This means that the measured response time is worse than the average of all tested devices (31.1 ms). | ||
Screen Flickering / PWM (Pulse-Width Modulation)
| Screen flickering / PWM not detected | 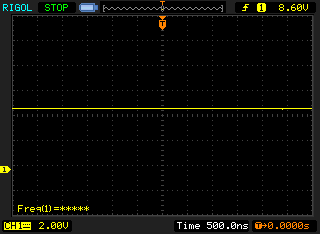 | ||
In comparison: 52 % of all tested devices do not use PWM to dim the display. If PWM was detected, an average of 7784 (minimum: 5 - maximum: 343500) Hz was measured. | |||
截图CalMAN测量
性能、排放和电池寿命
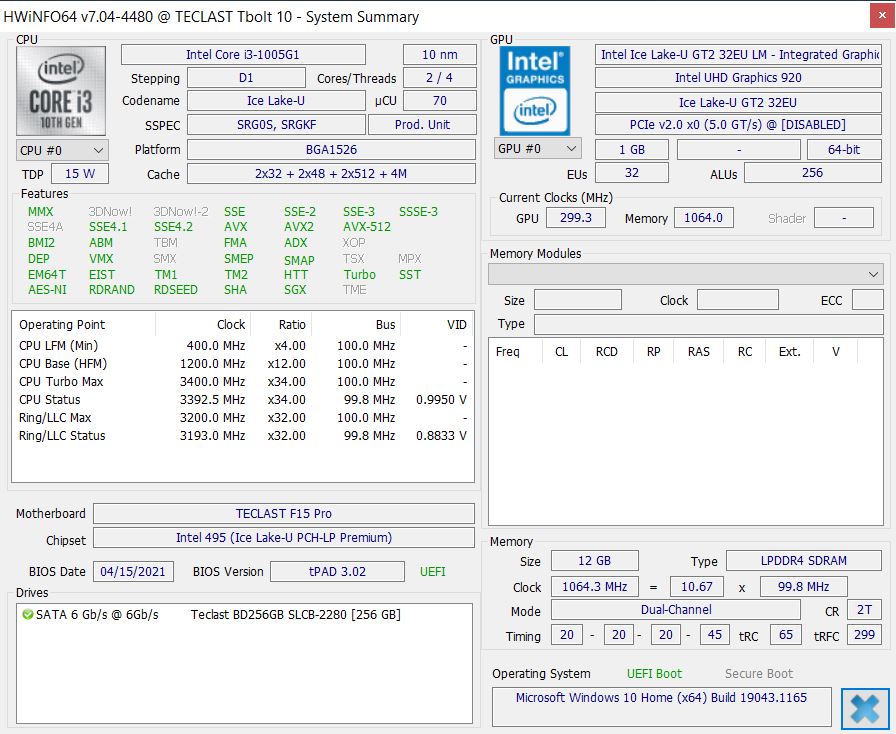
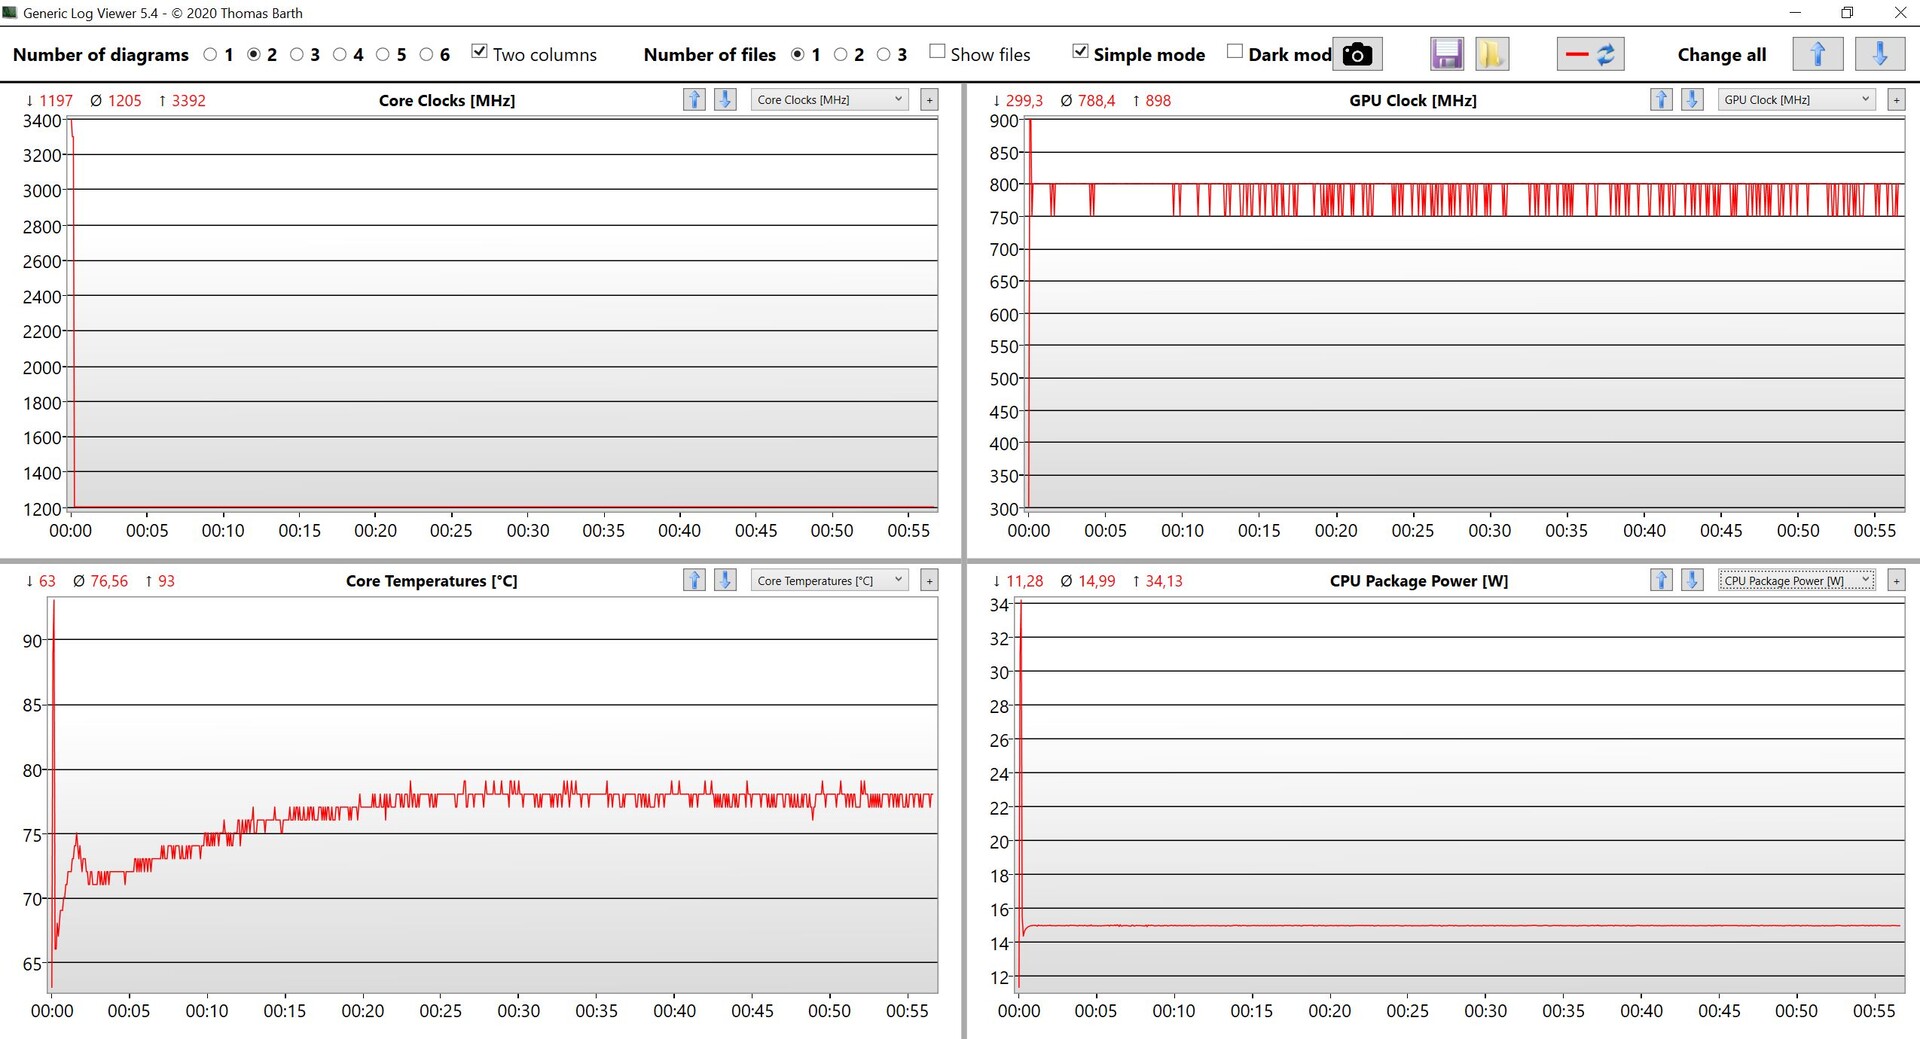
笔记本电脑 英特尔酷睿i3-1005G1仍然来自Ice Lake ,提供2个核心(4个线程),最大时钟为3.4GHz。TDP非常短暂地达到34瓦,然后立即下降到15瓦。因此,对于2021年来说,性能是非常弱的。由于采用了M.2固态硬盘(SATA-III),主观操作也很流畅。F15 Pro几乎不适合游戏,但来自英特尔的集成GPU可以轻松应对视频播放(甚至4K)等日常事务。然而,扬声器低于平均水平,我们建议使用外部扬声器或耳机。
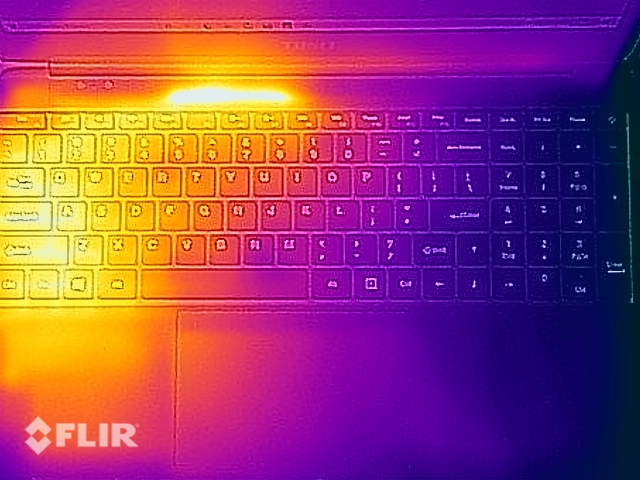
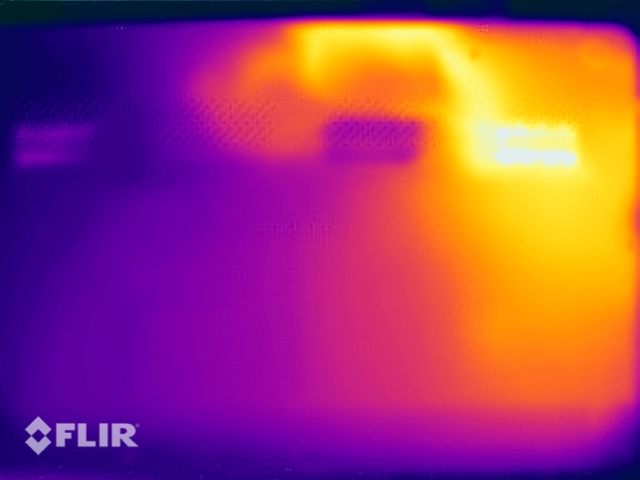
有一个风扇,但即使在负载情况下,你也很难听到它。反过来,负载下的表面温度相当高,但在日常使用中没有问题。
闲置消耗有点高,你也不应该在电池寿命方面期望太多;我们在亮度为150cd/m²的WLAN测试中只运行了不到6小时。
Cinebench R15 Multi Endurance test
Cinebench R20: CPU (Multi Core) | CPU (Single Core)
Cinebench R15: CPU Multi 64Bit | CPU Single 64Bit
Blender: v2.79 BMW27 CPU
7-Zip 18.03: 7z b 4 | 7z b 4 -mmt1
Geekbench 5.5: Multi-Core | Single-Core
HWBOT x265 Benchmark v2.2: 4k Preset
LibreOffice : 20 Documents To PDF
R Benchmark 2.5: Overall mean
| Cinebench R23 / Multi Core | |
| Average of class Office (1673 - 22808, n=74, last 2 years) | |
| Average Intel Core i3-1005G1 (2135 - 2636, n=4) | |
| Teclast TBOLT F15 Pro | |
| Cinebench R23 / Single Core | |
| Average of class Office (708 - 2130, n=74, last 2 years) | |
| Average Intel Core i3-1005G1 (1046 - 1061, n=4) | |
| Teclast TBOLT F15 Pro | |
| Cinebench R20 / CPU (Multi Core) | |
| Average of class Office (648 - 8840, n=73, last 2 years) | |
| Huawei MateBook D 15-53010TUY | |
| Dell Inspiron 15 5000 5502 | |
| Average Intel Core i3-1005G1 (820 - 1015, n=7) | |
| Teclast TBOLT F15 Pro | |
| Lenovo V15-ADA 82C7009SGE | |
| Cinebench R20 / CPU (Single Core) | |
| Average of class Office (345 - 816, n=73, last 2 years) | |
| Dell Inspiron 15 5000 5502 | |
| Teclast TBOLT F15 Pro | |
| Average Intel Core i3-1005G1 (338 - 407, n=7) | |
| Huawei MateBook D 15-53010TUY | |
| Lenovo V15-ADA 82C7009SGE | |
| Cinebench R15 / CPU Multi 64Bit | |
| Average of class Office (250 - 3380, n=75, last 2 years) | |
| Huawei MateBook D 15-53010TUY | |
| Average Intel Core i3-1005G1 (346 - 407, n=7) | |
| Dell Inspiron 15 5000 5502 | |
| Lenovo V15-ADA 82C7009SGE | |
| Teclast TBOLT F15 Pro | |
| Cinebench R15 / CPU Single 64Bit | |
| Average of class Office (99.5 - 312, n=75, last 2 years) | |
| Dell Inspiron 15 5000 5502 | |
| Teclast TBOLT F15 Pro | |
| Average Intel Core i3-1005G1 (99.5 - 160, n=7) | |
| Huawei MateBook D 15-53010TUY | |
| Lenovo V15-ADA 82C7009SGE | |
| Blender / v2.79 BMW27 CPU | |
| Teclast TBOLT F15 Pro | |
| Lenovo V15-ADA 82C7009SGE | |
| Average Intel Core i3-1005G1 (1123 - 1388, n=7) | |
| Dell Inspiron 15 5000 5502 | |
| Huawei MateBook D 15-53010TUY | |
| Average of class Office (158 - 1940, n=74, last 2 years) | |
| 7-Zip 18.03 / 7z b 4 | |
| Average of class Office (7098 - 76886, n=75, last 2 years) | |
| Huawei MateBook D 15-53010TUY | |
| Dell Inspiron 15 5000 5502 | |
| Average Intel Core i3-1005G1 (9731 - 11135, n=8) | |
| Teclast TBOLT F15 Pro | |
| Lenovo V15-ADA 82C7009SGE | |
| 7-Zip 18.03 / 7z b 4 -mmt1 | |
| Average of class Office (3387 - 6469, n=75, last 2 years) | |
| Dell Inspiron 15 5000 5502 | |
| Average Intel Core i3-1005G1 (3789 - 4057, n=8) | |
| Teclast TBOLT F15 Pro | |
| Huawei MateBook D 15-53010TUY | |
| Lenovo V15-ADA 82C7009SGE | |
| Geekbench 5.5 / Multi-Core | |
| Average of class Office (1483 - 16999, n=71, last 2 years) | |
| Huawei MateBook D 15-53010TUY | |
| Teclast TBOLT F15 Pro | |
| Dell Inspiron 15 5000 5502 | |
| Average Intel Core i3-1005G1 (2153 - 2595, n=6) | |
| Lenovo V15-ADA 82C7009SGE | |
| Geekbench 5.5 / Single-Core | |
| Average of class Office (811 - 2128, n=71, last 2 years) | |
| Dell Inspiron 15 5000 5502 | |
| Teclast TBOLT F15 Pro | |
| Average Intel Core i3-1005G1 (1118 - 1194, n=6) | |
| Huawei MateBook D 15-53010TUY | |
| Lenovo V15-ADA 82C7009SGE | |
| HWBOT x265 Benchmark v2.2 / 4k Preset | |
| Average of class Office (2.21 - 26, n=74, last 2 years) | |
| Huawei MateBook D 15-53010TUY | |
| Dell Inspiron 15 5000 5502 | |
| Average Intel Core i3-1005G1 (2.42 - 3.59, n=7) | |
| Teclast TBOLT F15 Pro | |
| Lenovo V15-ADA 82C7009SGE | |
| LibreOffice / 20 Documents To PDF | |
| Lenovo V15-ADA 82C7009SGE | |
| Teclast TBOLT F15 Pro | |
| Average Intel Core i3-1005G1 (55.8 - 81.7, n=6) | |
| Dell Inspiron 15 5000 5502 | |
| Average of class Office (39.9 - 102.3, n=74, last 2 years) | |
| R Benchmark 2.5 / Overall mean | |
| Lenovo V15-ADA 82C7009SGE | |
| Teclast TBOLT F15 Pro | |
| Average Intel Core i3-1005G1 (0.746 - 0.763, n=6) | |
| Huawei MateBook D 15-53010TUY | |
| Dell Inspiron 15 5000 5502 | |
| Average of class Office (0.4098 - 0.888, n=74, last 2 years) | |
* ... smaller is better
| PCMark 10 / Score | |
| Average of class Office (2601 - 9298, n=64, last 2 years) | |
| Dell Inspiron 15 5000 5502 | |
| Huawei MateBook D 15-53010TUY | |
| Teclast TBOLT F15 Pro | |
| Average Intel Core i3-1005G1, Intel UHD Graphics G1 (Ice Lake 32 EU) (3386 - 3562, n=6) | |
| Lenovo V15-ADA 82C7009SGE | |
| DPC Latencies / LatencyMon - interrupt to process latency (max), Web, Youtube, Prime95 | |
| Lenovo V15-ADA 82C7009SGE | |
| Dell Inspiron 15 5000 5502 | |
| Teclast TBOLT F15 Pro | |
* ... smaller is better
| Teclast TBOLT F15 Pro Teclast BD256GB | Huawei MateBook D 15-53010TUY Samsung SSD PM981 MZVLB256HAHQ | Lenovo V15-ADA 82C7009SGE WDC PC SN530 SDBPMPZ-265G | Dell Inspiron 15 5000 5502 Toshiba BG4 KBG40ZNS128G | Average Teclast BD256GB | Average of class Office | |
|---|---|---|---|---|---|---|
| CrystalDiskMark 5.2 / 6 | 182% | 98% | 38% | 0% | 381% | |
| Write 4K (MB/s) | 109.4 | 134.8 23% | 124.8 14% | 138.5 27% | 109.4 ? 0% | 151.4 ? 38% |
| Read 4K (MB/s) | 38.89 | 41.68 7% | 43.56 12% | 41.98 8% | 38.9 ? 0% | 72.8 ? 87% |
| Write Seq (MB/s) | 405.2 | 1651 307% | 977 141% | 213.5 -47% | 405 ? 0% | 2558 ? 531% |
| Read Seq (MB/s) | 529 | 2300 335% | 1685 219% | 1289 144% | 529 ? 0% | 3237 ? 512% |
| Write 4K Q32T1 (MB/s) | 284.2 | 260 -9% | 185.9 -35% | 157.8 -44% | 284 ? 0% | 424 ? 49% |
| Read 4K Q32T1 (MB/s) | 337.8 | 335.1 -1% | 272.7 -19% | 448.9 33% | 338 ? 0% | 509 ? 51% |
| Write Seq Q32T1 (MB/s) | 436.5 | 1641 276% | 971 122% | 210.5 -52% | 437 ? 0% | 3999 ? 816% |
| Read Seq Q32T1 (MB/s) | 560 | 3452 516% | 2424 333% | 1853 231% | 560 ? 0% | 5962 ? 965% |
| 3DMark - 1920x1080 Fire Strike Graphics | |
| Average of class Office (736 - 21871, n=73, last 2 years) | |
| Huawei MateBook D 15-53010TUY | |
| Dell Inspiron 15 5000 5502 | |
| Teclast TBOLT F15 Pro | |
| Average Intel UHD Graphics G1 (Ice Lake 32 EU) (960 - 1755, n=15) | |
| Lenovo V15-ADA 82C7009SGE | |
| low | med. | high | ultra | |
|---|---|---|---|---|
| The Witcher 3 (2015) | 30.2 | 19.6 | 10.3 | |
| Dota 2 Reborn (2015) | 76.7 | 31.9 | 20.9 | 19.4 |
| Final Fantasy XV Benchmark (2018) | 15.4 | 7.68 | 7.68 | |
| X-Plane 11.11 (2018) | 28.1 | 13.7 | 12.9 |
噪声排放
Noise level
| Idle |
| 24.2 / 24.2 / 24.2 dB(A) |
| Load |
| 24.2 / 25.3 dB(A) |
 | ||
30 dB silent 40 dB(A) audible 50 dB(A) loud |
||
min: | ||
温度
(±) The maximum temperature on the upper side is 43.1 °C / 110 F, compared to the average of 34.3 °C / 94 F, ranging from 21.2 to 62.5 °C for the class Office.
(-) The bottom heats up to a maximum of 51.8 °C / 125 F, compared to the average of 36.8 °C / 98 F
(+) In idle usage, the average temperature for the upper side is 26.5 °C / 80 F, compared to the device average of 29.5 °C / 85 F.
(±) The palmrests and touchpad can get very hot to the touch with a maximum of 37.1 °C / 98.8 F.
(-) The average temperature of the palmrest area of similar devices was 27.5 °C / 81.5 F (-9.6 °C / -17.3 F).
演讲者
Teclast TBOLT F15 Pro audio analysis
(±) | speaker loudness is average but good (81.8 dB)
Bass 100 - 315 Hz
(-) | nearly no bass - on average 22.3% lower than median
(+) | bass is linear (5.8% delta to prev. frequency)
Mids 400 - 2000 Hz
(±) | higher mids - on average 7.4% higher than median
(±) | linearity of mids is average (8.9% delta to prev. frequency)
Highs 2 - 16 kHz
(±) | higher highs - on average 6.5% higher than median
(±) | linearity of highs is average (7.2% delta to prev. frequency)
Overall 100 - 16.000 Hz
(±) | linearity of overall sound is average (24.5% difference to median)
Compared to same class
» 71% of all tested devices in this class were better, 8% similar, 21% worse
» The best had a delta of 7%, average was 21%, worst was 53%
Compared to all devices tested
» 74% of all tested devices were better, 6% similar, 20% worse
» The best had a delta of 4%, average was 24%, worst was 134%
Huawei MateBook D 15-53010TUY audio analysis
(-) | not very loud speakers (70.2 dB)
Bass 100 - 315 Hz
(±) | reduced bass - on average 13.5% lower than median
(±) | linearity of bass is average (13.5% delta to prev. frequency)
Mids 400 - 2000 Hz
(+) | balanced mids - only 4% away from median
(+) | mids are linear (4.5% delta to prev. frequency)
Highs 2 - 16 kHz
(+) | balanced highs - only 3.7% away from median
(±) | linearity of highs is average (7.2% delta to prev. frequency)
Overall 100 - 16.000 Hz
(±) | linearity of overall sound is average (22.1% difference to median)
Compared to same class
» 75% of all tested devices in this class were better, 6% similar, 19% worse
» The best had a delta of 5%, average was 18%, worst was 53%
Compared to all devices tested
» 64% of all tested devices were better, 6% similar, 30% worse
» The best had a delta of 4%, average was 24%, worst was 134%
能源消耗
| Off / Standby | |
| Idle | |
| Load |
|
Key:
min: | |
Energy consumption Witcher 3 / Stress test
电池寿命
| Battery Runtime - WiFi Websurfing | |
| Average of class Office (3.83 - 31.5, n=75, last 2 years) | |
| Dell Inspiron 15 5000 5502 | |
| Huawei MateBook D 15-53010TUY | |
| Teclast TBOLT F15 Pro | |
| Lenovo V15-ADA 82C7009SGE | |
Pros
Cons
结论 - 只有IPS显示屏令人信服
当然,你必须问自己,你能从一台不到500欧元(约588美元)的新笔记本电脑中期待什么。Teclast F15 Pro在测试中没有表现出任何巨大的弱点,尤其是色彩强烈的IPS显示屏可以得分,它甚至可以提供完整的sRGB覆盖。在这个价格范围内,这绝不是一个理所当然的事情。
然而,我们在其他方面的表现则处于较低的边缘。除了缓慢的双核处理器,在端口和通信模块方面也没有亮点。
Teclast F15 Pro满足了基本要求,并提供了一个体面的IPS显示屏,但总的来说,即使在这个价格范围内,在竞争中也有更好的整体包装。
当你看一下竞争对手时,问题就来了。例如,有 华为MateBook D 15它以较低的价格(目前约为450欧元/~529美元)提供了更好的整体包装,这取决于配置。
价格和可用性
Teclast F15 Pro在Aliexpress出售,价格约为490欧元(约576美元)。.
Teclast TBOLT F15 Pro
- 09/14/2021 v7 (old)
Andreas Osthoff
Price comparison

