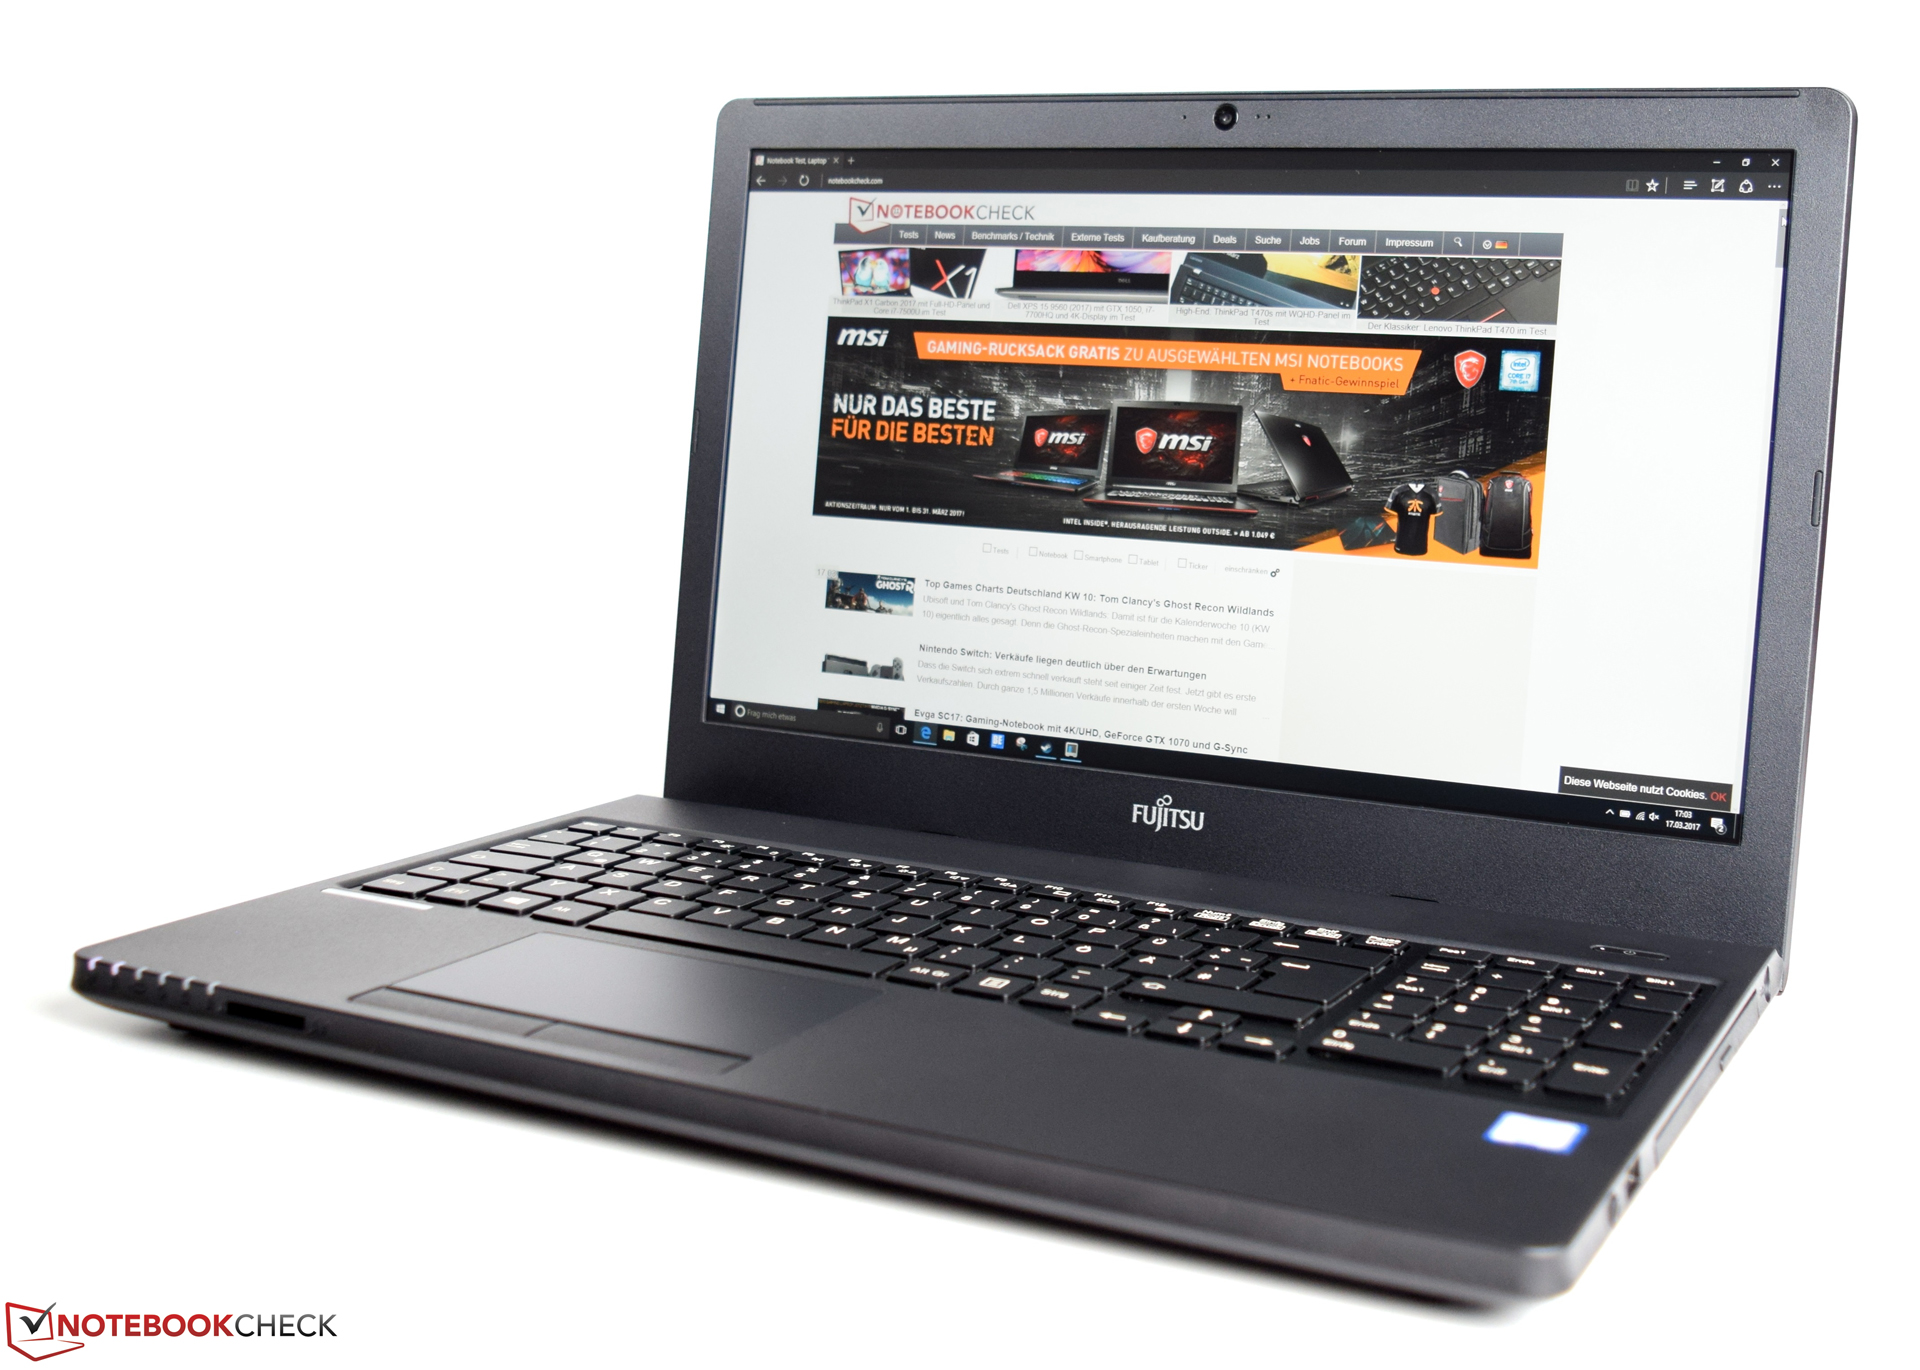
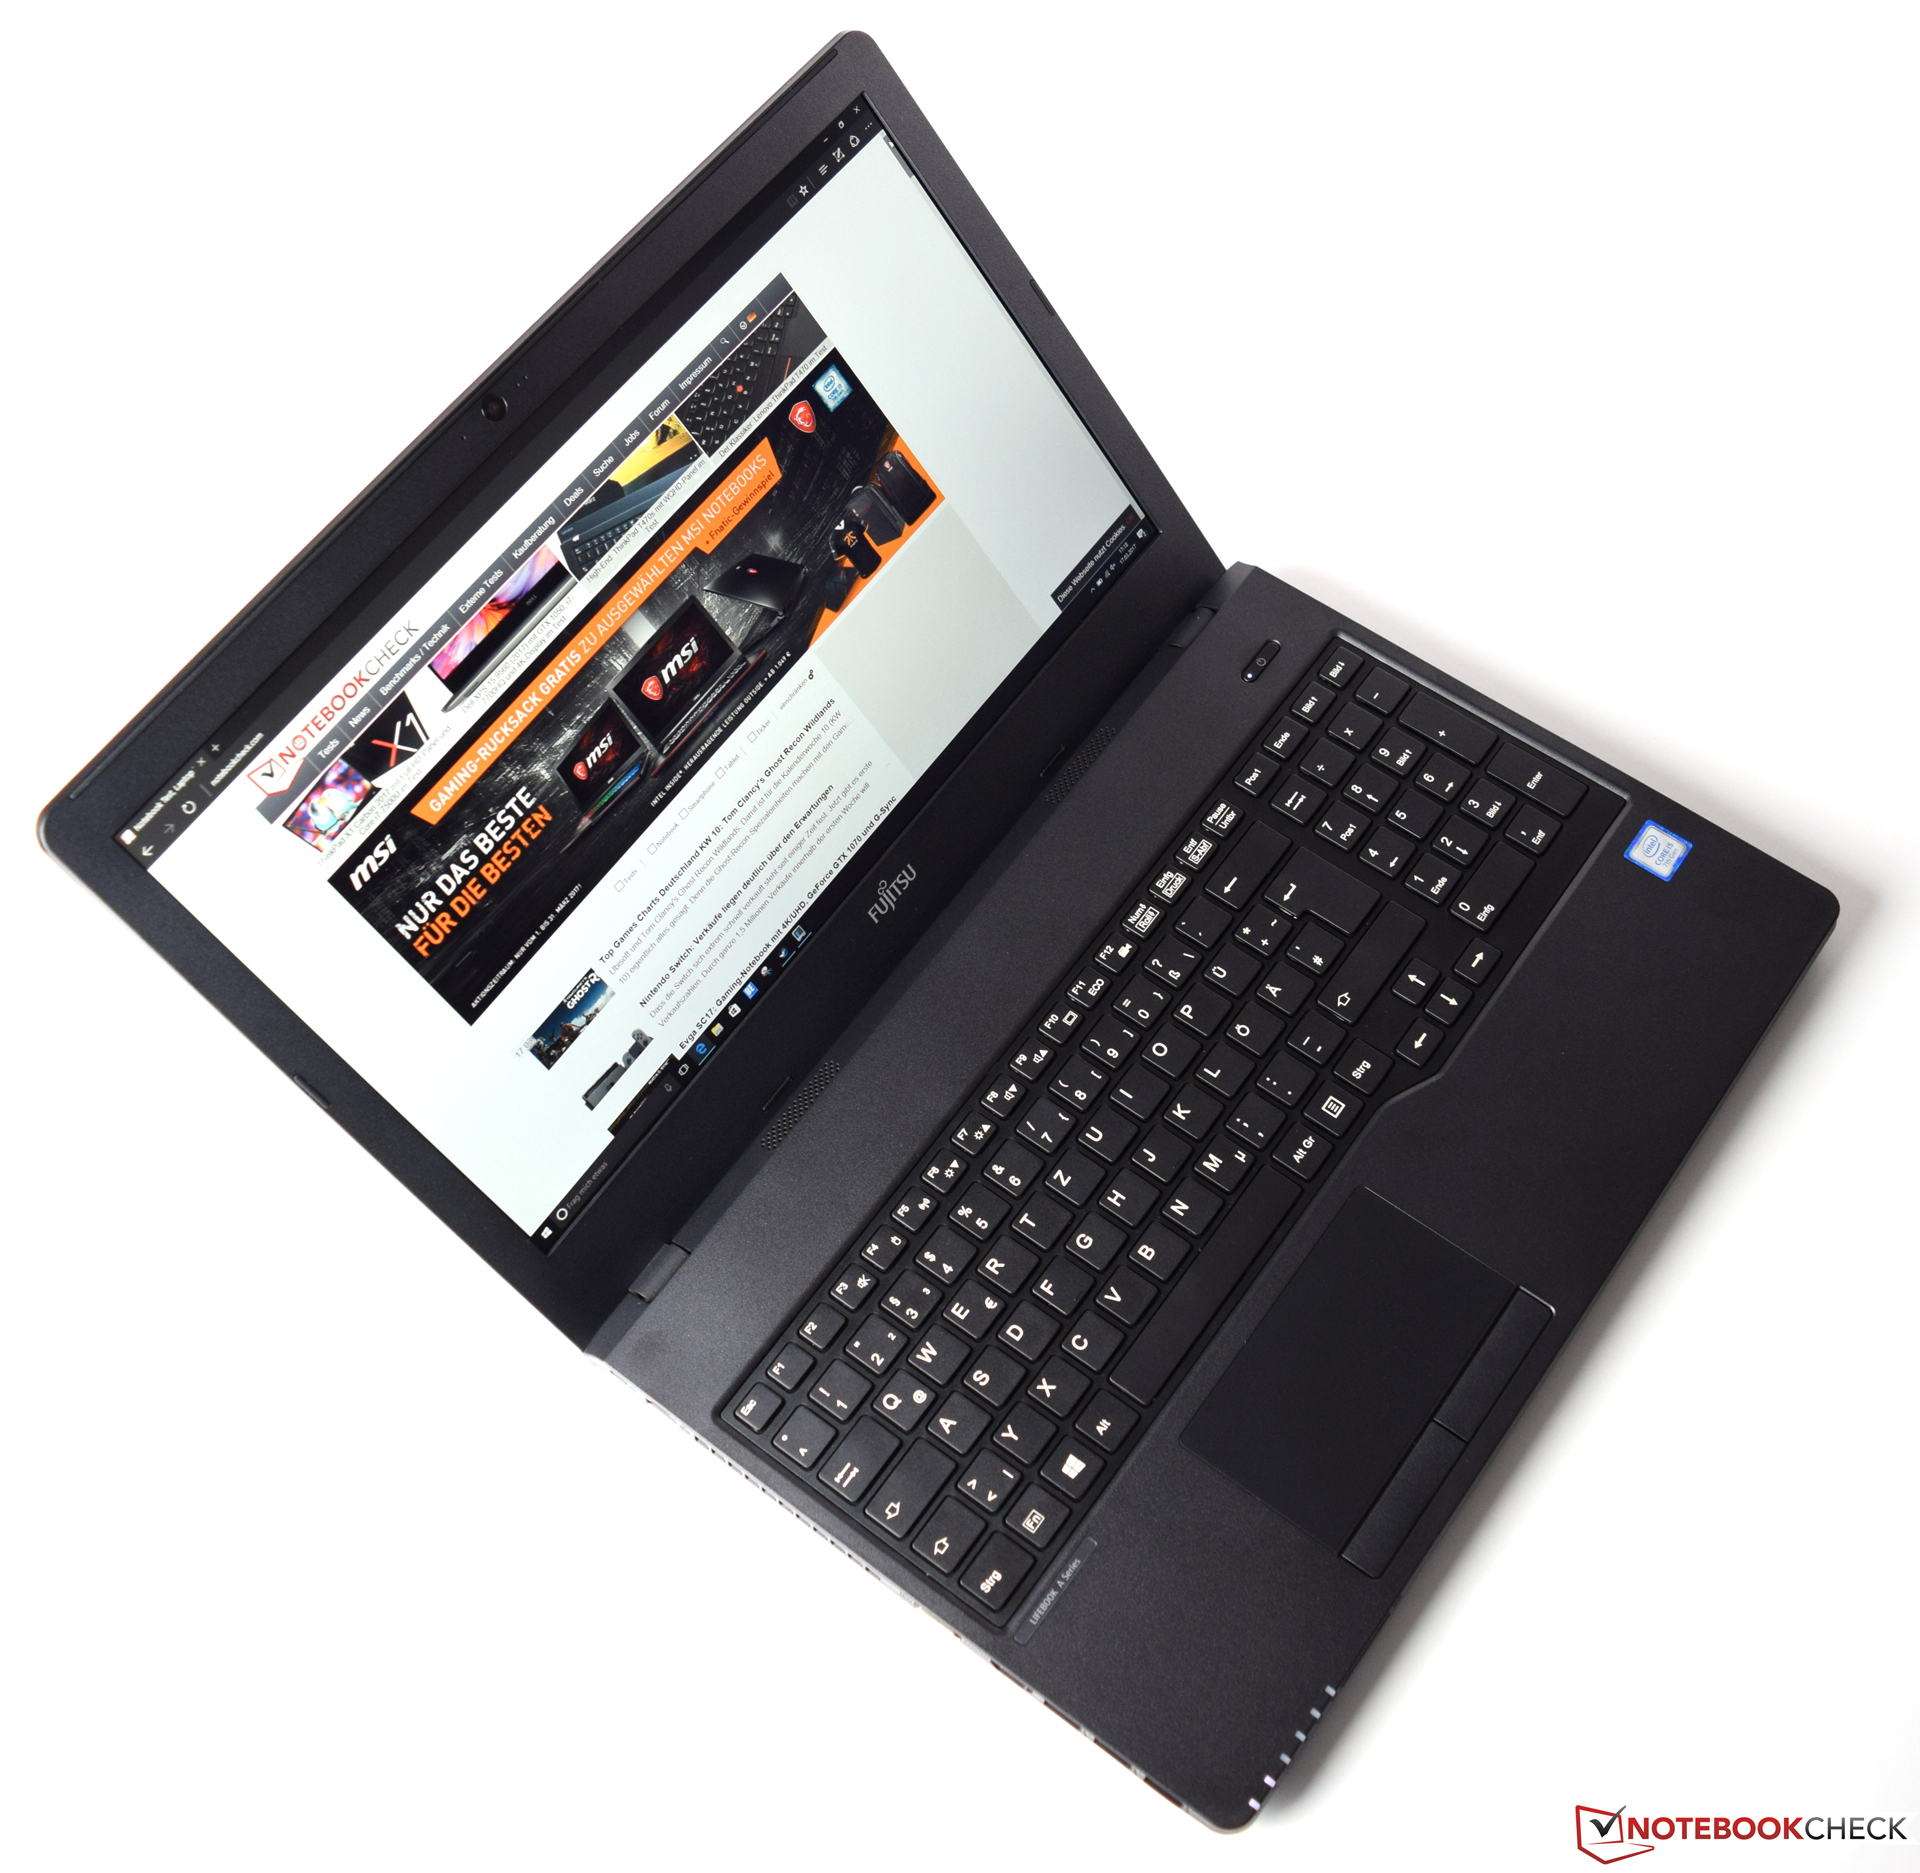
富士通 LifeBook A557 (酷睿 i5, 全高清) 笔记本电脑简短评测
| SD Card Reader | |
| average JPG Copy Test (av. of 3 runs) | |
| Fujitsu Lifebook A557 | |
| HP ProBook 450 G4 Y8B60EA | |
| Lenovo ThinkPad E560-20EWS00000 | |
| HP ProBook 655 G2 T9X09ET | |
| Acer TravelMate P257-M-56AX | |
| Dell Latitude 15-3570 | |
| maximum AS SSD Seq Read Test (1GB) | |
| Fujitsu Lifebook A557 | |
| HP ProBook 450 G4 Y8B60EA | |
| Lenovo ThinkPad E560-20EWS00000 | |
| Acer TravelMate P257-M-56AX | |
| Dell Latitude 15-3570 | |
| Networking | |
| iperf3 transmit AX12 | |
| Dell XPS 13 9360 QHD+ i5 | |
| Asus Zenbook Flip UX360UAK-BB351T | |
| Fujitsu Lifebook A557 | |
| iperf3 receive AX12 | |
| Dell XPS 13 9360 QHD+ i5 | |
| Fujitsu Lifebook A557 | |
| Asus Zenbook Flip UX360UAK-BB351T | |
| |||||||||||||||||||||||||
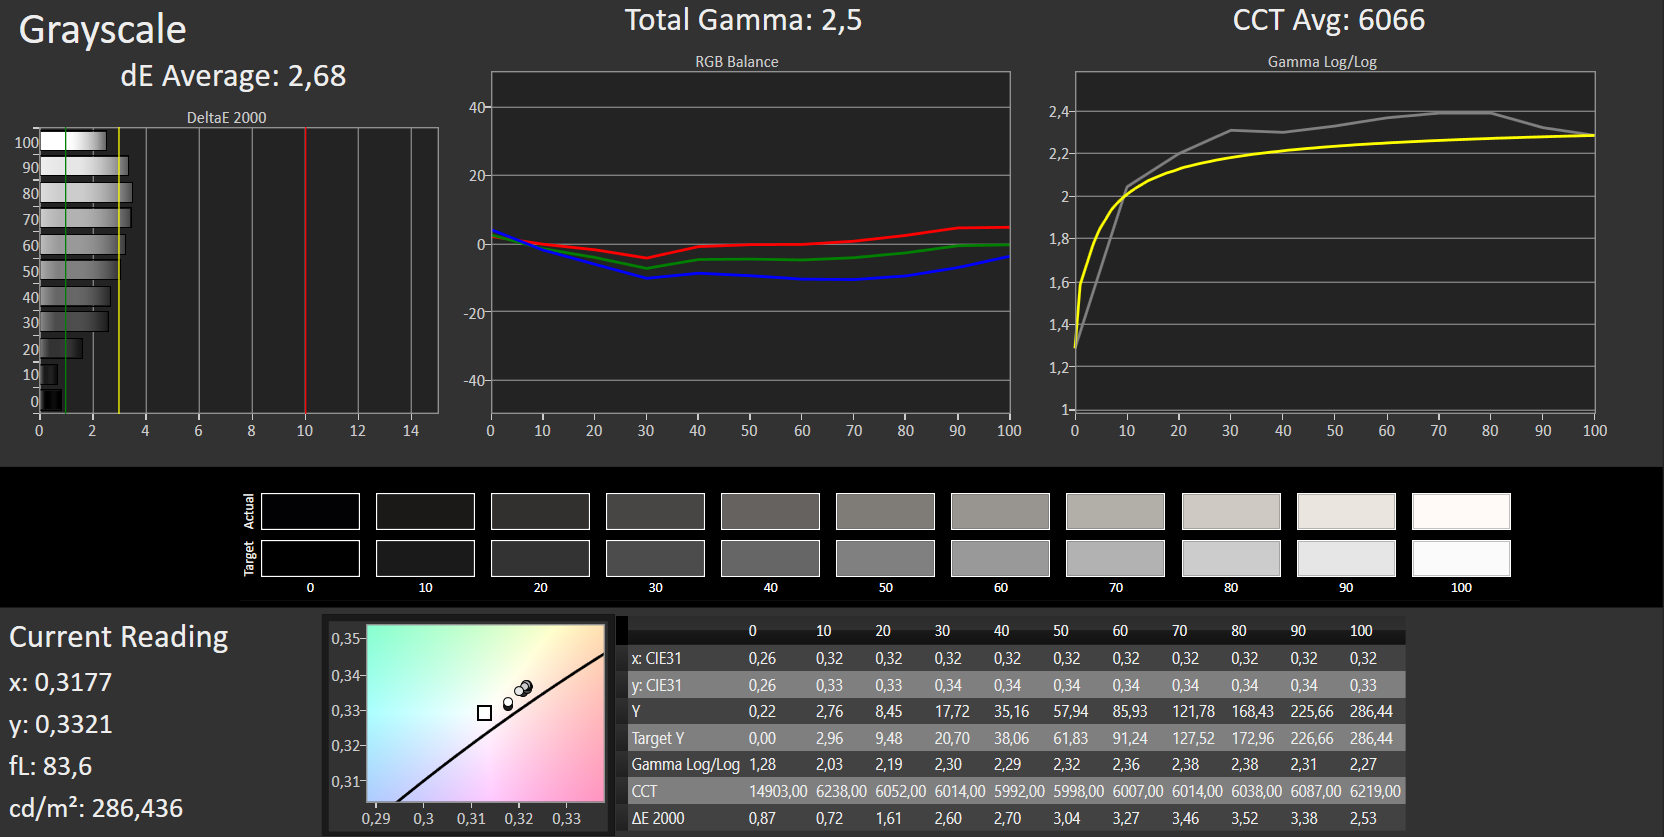
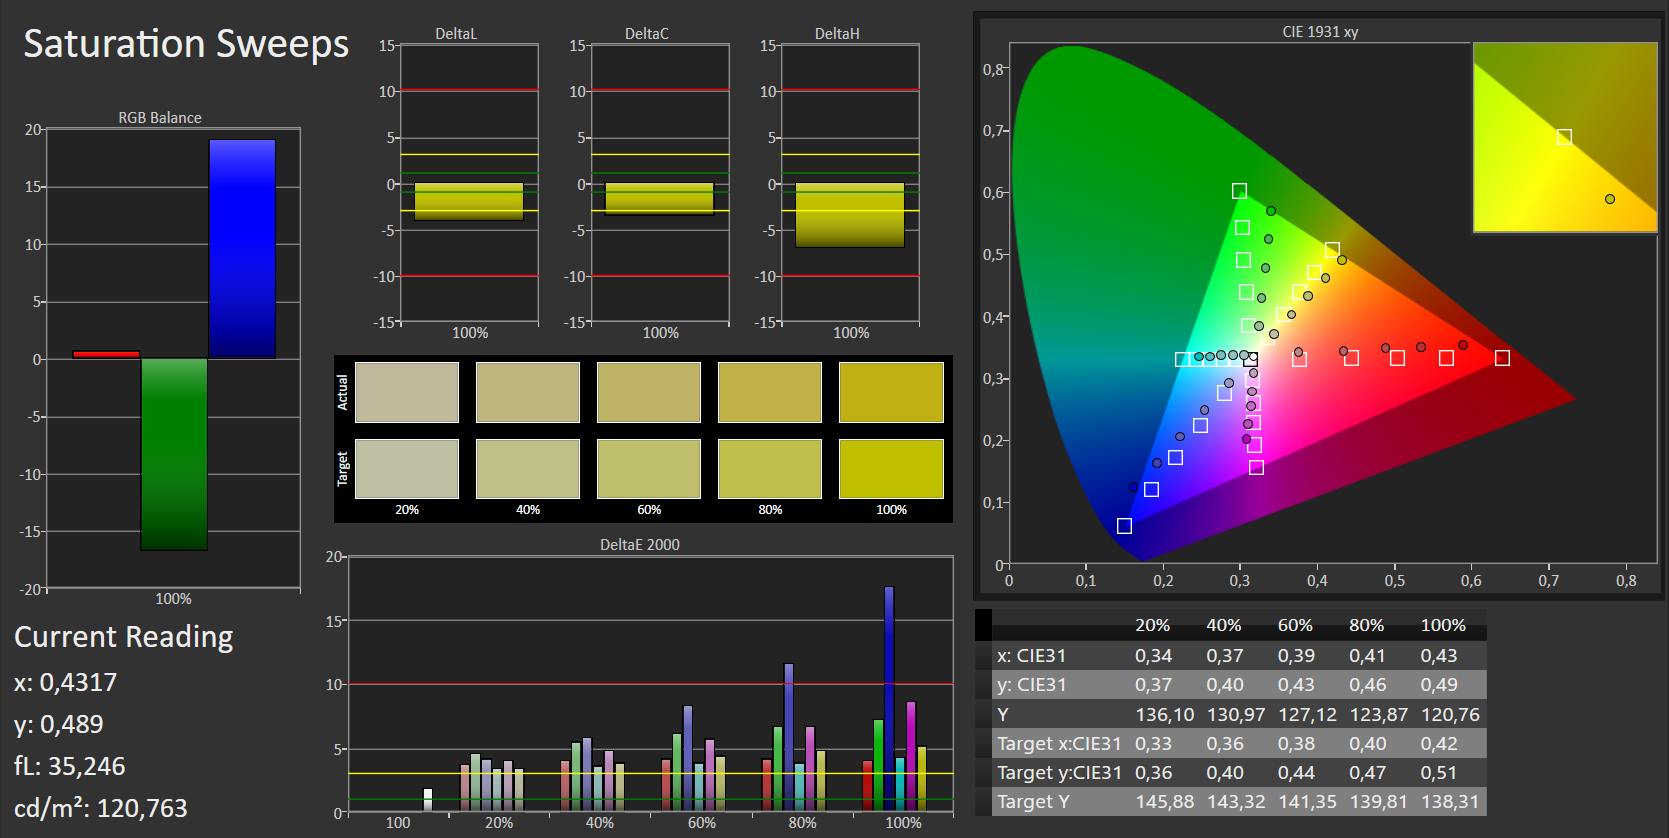
Brightness Distribution: 83 %
Center on Battery: 287 cd/m²
Contrast: 1305:1 (Black: 0.22 cd/m²)
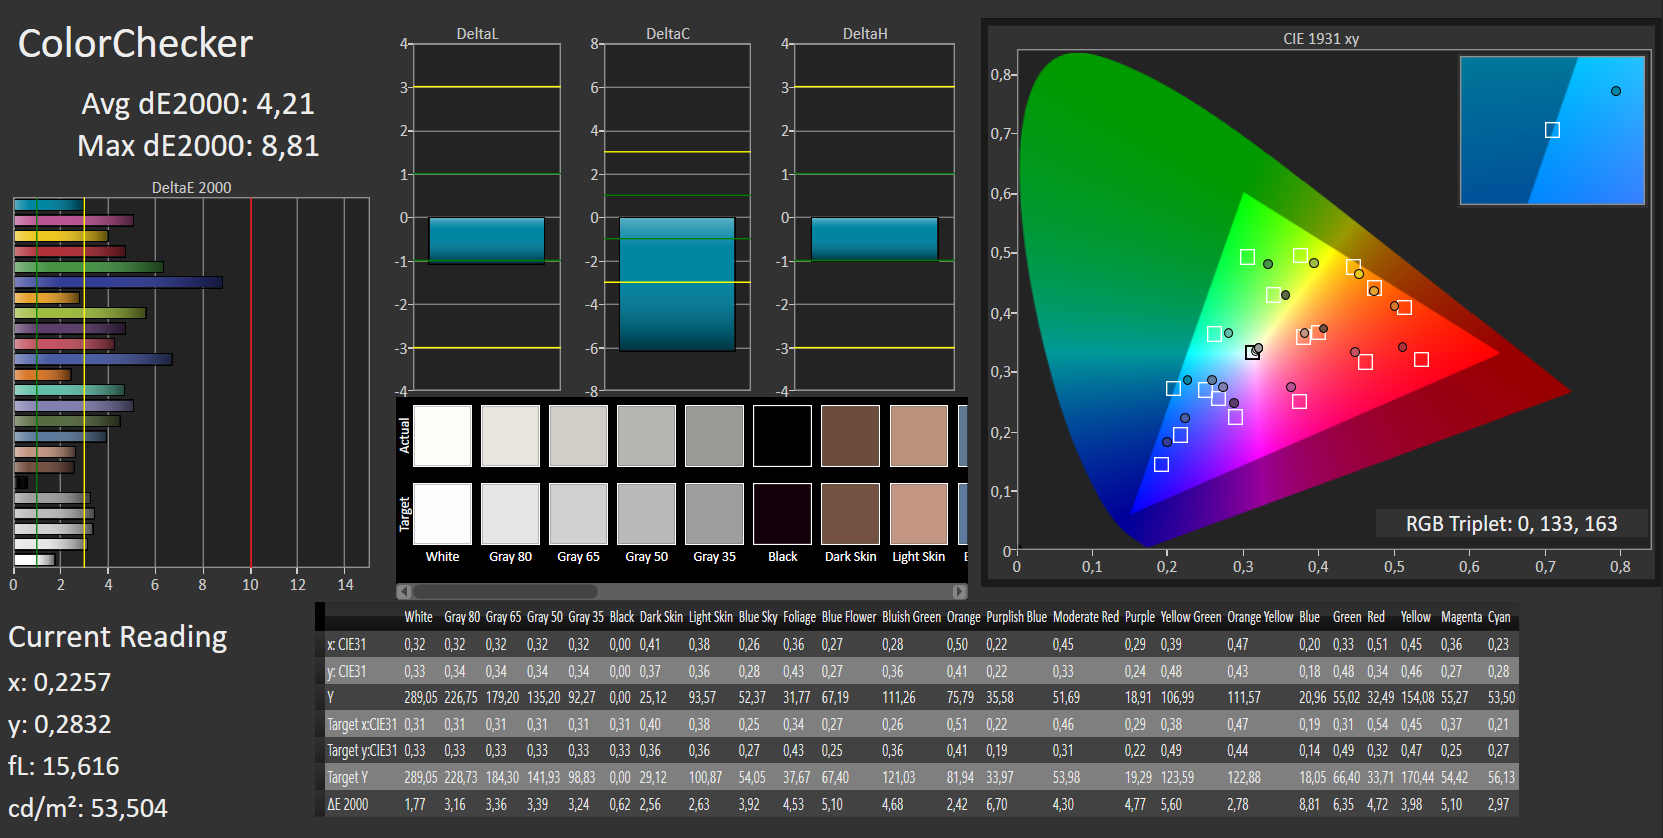
ΔE ColorChecker Calman: 4.21 | ∀{0.5-29.43 Ø4.71}
ΔE Greyscale Calman: 2.68 | ∀{0.09-98 Ø4.96}
63% sRGB (Argyll 1.6.3 3D)
40% AdobeRGB 1998 (Argyll 1.6.3 3D)
43.24% AdobeRGB 1998 (Argyll 3D)
62.9% sRGB (Argyll 3D)
41.85% Display P3 (Argyll 3D)
Gamma: 2.5
CCT: 6066 K
| Fujitsu Lifebook A557 BOE NV156FHM-N42, , 1920x1080, 15.6" | HP ProBook 450 G4 Y8B60EA Chi Mei CMN15C4, , 1920x1080, 15.6" | HP ProBook 655 G2 T9X09ET BOE, , 1366x768, 15.6" | Dell Latitude 15-3570 LG Philips LGD04AF / 156WHU, , 1366x768, 15.6" | Lenovo ThinkPad E560-20EWS00000 Lenovo LP156WF6-SPK2, , 1920x1080, 15.6" | Acer TravelMate P257-M-56AX AU Optronics AUO38ED, , 1920x1080, 15.6" | |
|---|---|---|---|---|---|---|
| Display | -5% | 6% | -3% | -8% | -10% | |
| Display P3 Coverage (%) | 41.85 | 39.89 -5% | 44.49 6% | 40.61 -3% | 38.5 -8% | 37.78 -10% |
| sRGB Coverage (%) | 62.9 | 59.5 -5% | 66.9 6% | 61.1 -3% | 57.5 -9% | 56.8 -10% |
| AdobeRGB 1998 Coverage (%) | 43.24 | 41.24 -5% | 45.97 6% | 41.96 -3% | 39.8 -8% | 39.04 -10% |
| Response Times | 11% | 19% | 14% | 33% | ||
| Response Time Grey 50% / Grey 80% * (ms) | 55 ? | 51 ? 7% | 44 ? 20% | 37 ? 33% | 38.4 ? 30% | |
| Response Time Black / White * (ms) | 35 ? | 30 ? 14% | 29 ? 17% | 37 ? -6% | 22.4 ? 36% | |
| PWM Frequency (Hz) | 200 ? | 50 ? | 200 ? | |||
| Screen | -80% | -74% | -103% | -32% | -72% | |
| Brightness middle (cd/m²) | 287 | 214 -25% | 248 -14% | 202 -30% | 257 -10% | 205 -29% |
| Brightness (cd/m²) | 260 | 201 -23% | 230 -12% | 211 -19% | 234 -10% | 210 -19% |
| Brightness Distribution (%) | 83 | 77 -7% | 88 6% | 88 6% | 83 0% | 71 -14% |
| Black Level * (cd/m²) | 0.22 | 0.43 -95% | 0.56 -155% | 0.62 -182% | 0.27 -23% | 0.4 -82% |
| Contrast (:1) | 1305 | 498 -62% | 443 -66% | 326 -75% | 952 -27% | 513 -61% |
| Colorchecker dE 2000 * | 4.21 | 10.68 -154% | 8.7 -107% | 12.35 -193% | 7.16 -70% | 9.76 -132% |
| Colorchecker dE 2000 max. * | 8.81 | 18.07 -105% | 14.96 -70% | 19.9 -126% | ||
| Greyscale dE 2000 * | 2.68 | 11.32 -322% | 11.48 -328% | 13.46 -402% | 6.28 -134% | 10.47 -291% |
| Gamma | 2.5 88% | 2.26 97% | 2.38 92% | 2.44 90% | 2.44 90% | 2.56 86% |
| CCT | 6066 107% | 12204 53% | 11179 58% | 15217 43% | 6806 96% | 12103 54% |
| Color Space (Percent of AdobeRGB 1998) (%) | 40 | 38 -5% | 42 5% | 39 -2% | 36.6 -8% | 36 -10% |
| Color Space (Percent of sRGB) (%) | 63 | 59 -6% | 67 6% | 61 -3% | 57.3 -9% | 57 -10% |
| Total Average (Program / Settings) | -25% /
-53% | -16% /
-45% | -31% /
-67% | -2% /
-18% | -41% /
-57% |
* ... smaller is better
Display Response Times
| ↔ Response Time Black to White | ||
|---|---|---|
| 35 ms ... rise ↗ and fall ↘ combined | ↗ 19 ms rise | 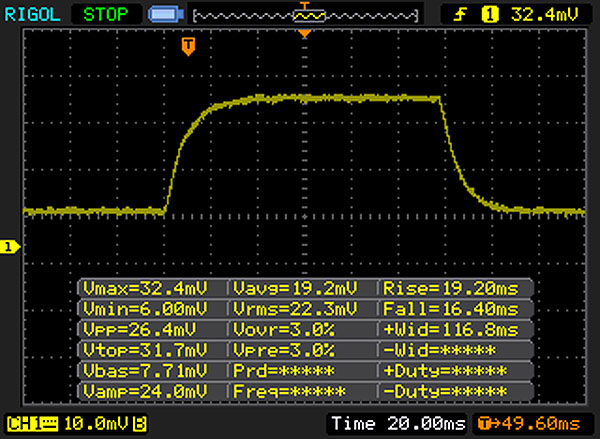 |
| ↘ 16 ms fall | ||
| The screen shows slow response rates in our tests and will be unsatisfactory for gamers. In comparison, all tested devices range from 0.1 (minimum) to 240 (maximum) ms. » 92 % of all devices are better. This means that the measured response time is worse than the average of all tested devices (19.8 ms). | ||
| ↔ Response Time 50% Grey to 80% Grey | ||
| 55 ms ... rise ↗ and fall ↘ combined | ↗ 24 ms rise | 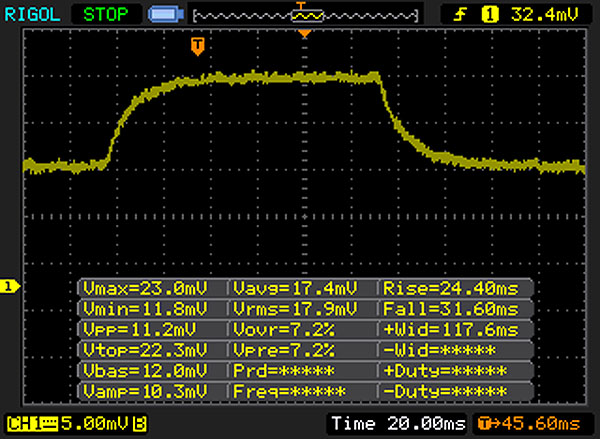 |
| ↘ 31 ms fall | ||
| The screen shows slow response rates in our tests and will be unsatisfactory for gamers. In comparison, all tested devices range from 0.165 (minimum) to 636 (maximum) ms. » 92 % of all devices are better. This means that the measured response time is worse than the average of all tested devices (31 ms). | ||
Screen Flickering / PWM (Pulse-Width Modulation)
| Screen flickering / PWM detected | 200 Hz | ≤ 90 % brightness setting | 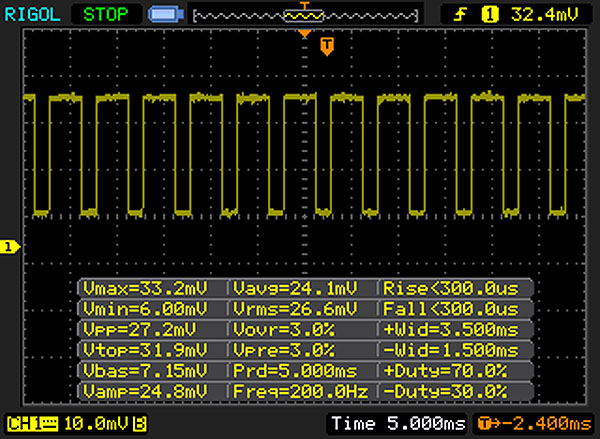 |
The display backlight flickers at 200 Hz (worst case, e.g., utilizing PWM) Flickering detected at a brightness setting of 90 % and below. There should be no flickering or PWM above this brightness setting. The frequency of 200 Hz is relatively low, so sensitive users will likely notice flickering and experience eyestrain at the stated brightness setting and below. In comparison: 52 % of all tested devices do not use PWM to dim the display. If PWM was detected, an average of 7757 (minimum: 5 - maximum: 343500) Hz was measured. | |||
| Cinebench R10 | |
| Rendering Single CPUs 64Bit | |
| Fujitsu Lifebook A557 | |
| Lenovo ThinkPad E560-20EWS00000 | |
| Rendering Multiple CPUs 64Bit | |
| Fujitsu Lifebook A557 | |
| Lenovo ThinkPad E560-20EWS00000 | |
| JetStream 1.1 - 1.1 Total | |
| HP ProBook 450 G4 Y8B60EA | |
| Fujitsu Lifebook A557 | |
| Lenovo ThinkPad E560-20EWS00000 | |
| HP ProBook 655 G2 T9X09ET | |
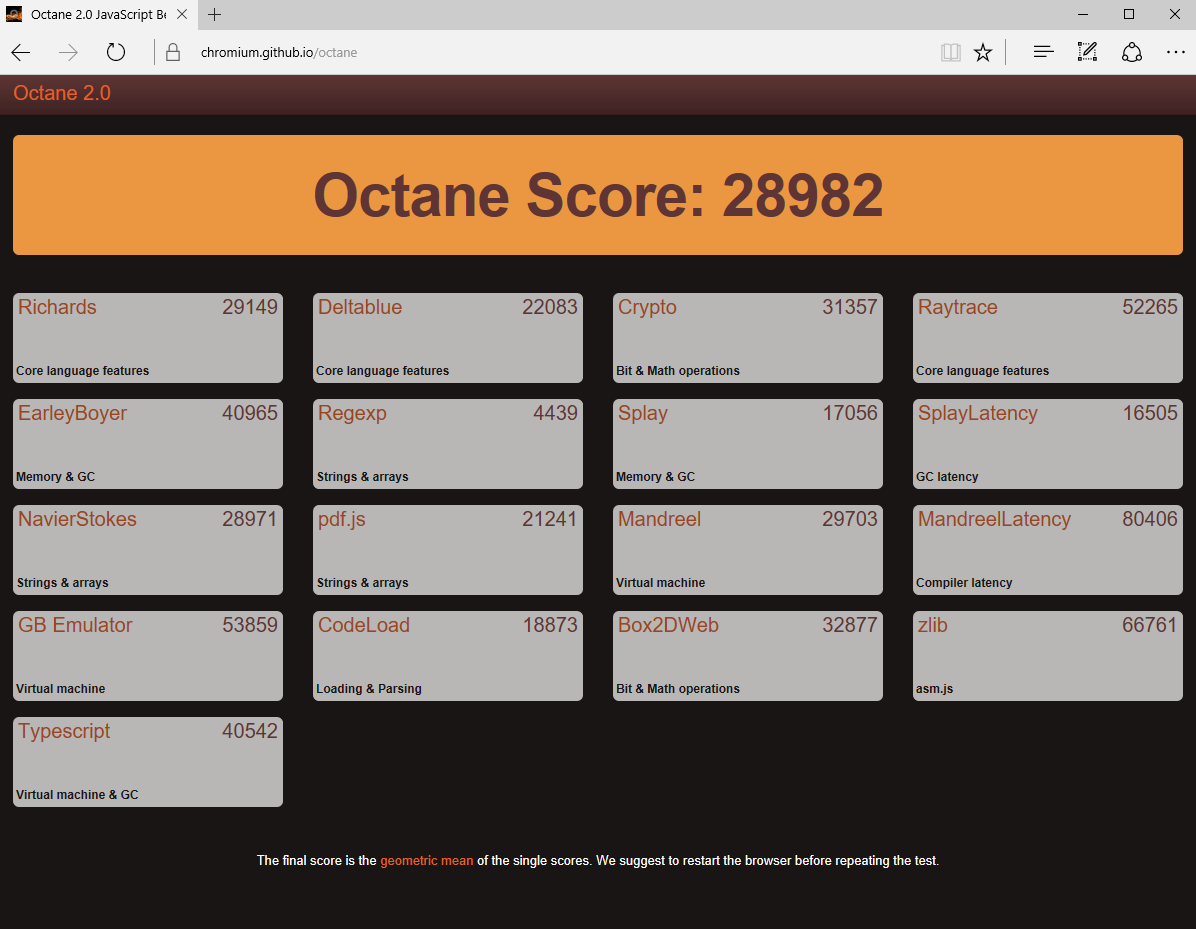
| Octane V2 - Total Score | |
| HP ProBook 450 G4 Y8B60EA | |
| Lenovo ThinkPad E560-20EWS00000 | |
| Fujitsu Lifebook A557 | |
| Acer TravelMate P257-M-56AX | |
| HP ProBook 655 G2 T9X09ET | |
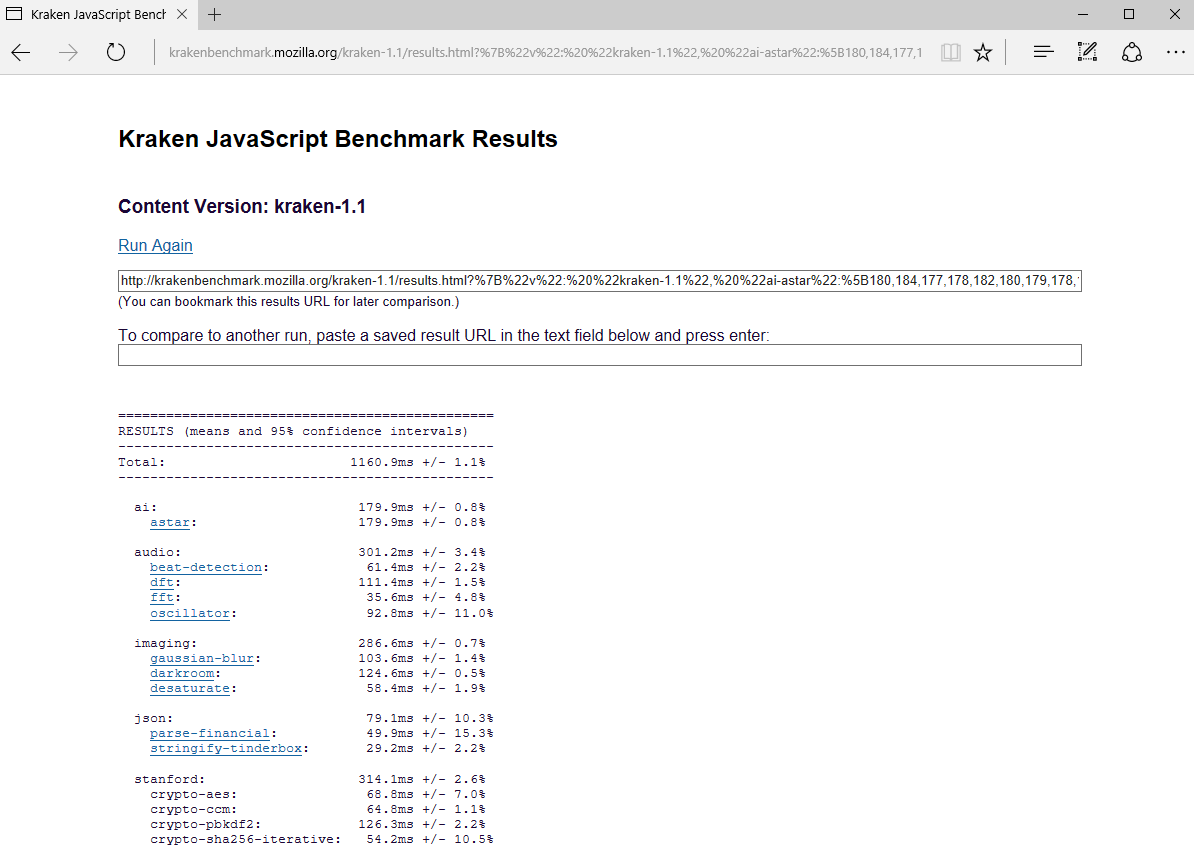
| Mozilla Kraken 1.1 - Total | |
| HP ProBook 655 G2 T9X09ET | |
| Acer TravelMate P257-M-56AX | |
| Fujitsu Lifebook A557 | |
| Lenovo ThinkPad E560-20EWS00000 | |
| HP ProBook 450 G4 Y8B60EA | |
* ... smaller is better
| PCMark Vantage Result | 15019 points | |
| PCMark 7 Score | 5115 points | |
| PCMark 8 Home Score Accelerated v2 | 3556 points | |
| PCMark 8 Creative Score Accelerated v2 | 4375 points | |
| PCMark 8 Work Score Accelerated v2 | 4713 points | |
Help | ||
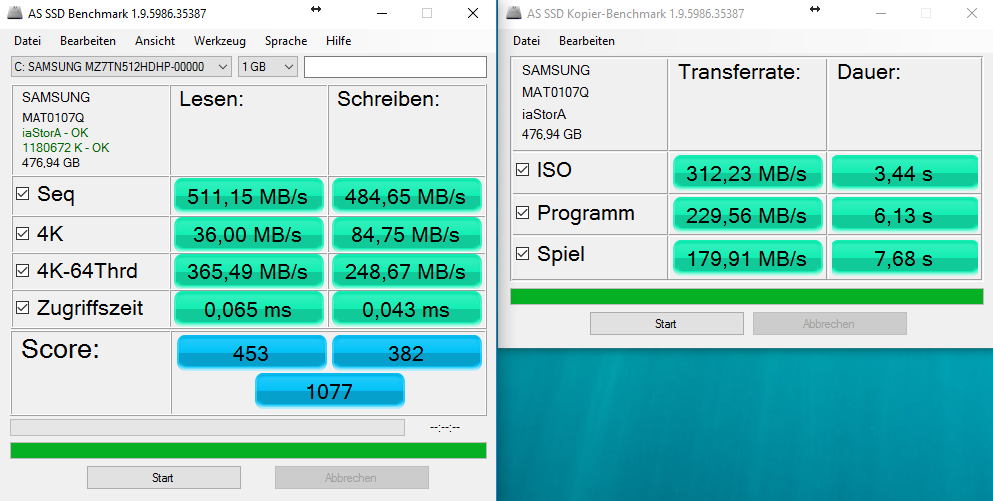
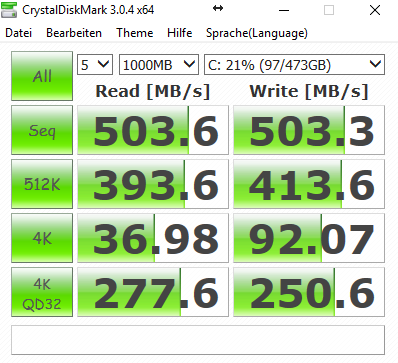
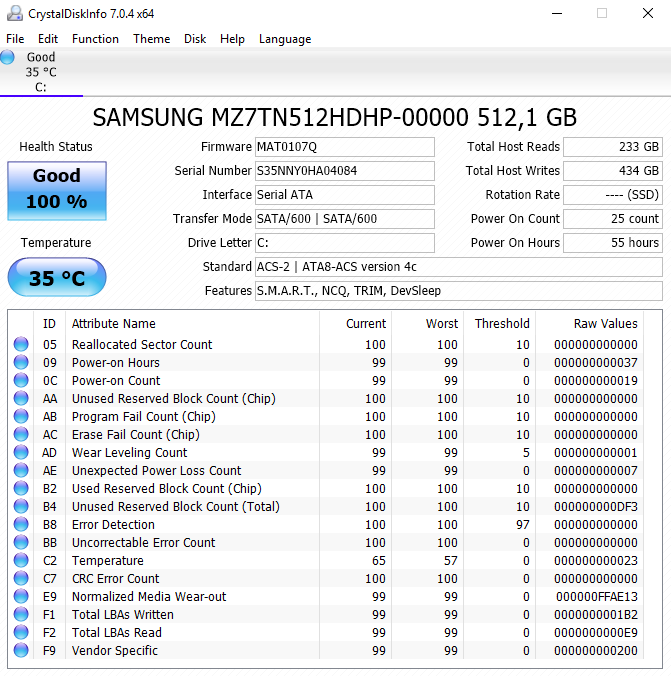
| Fujitsu Lifebook A557 Samsung MZ7TN512HDHP-00000 | HP ProBook 655 G2 T9X09ET Seagate ST500LM021-1KJ15 | Dell Latitude 15-3570 Samsung CM871 MZNLF128HCHP | Lenovo ThinkPad E560-20EWS00000 Samsung CM871 MZ7LF192HCGS | Acer TravelMate P257-M-56AX Kingston RBU-SC150S37256GD | |
|---|---|---|---|---|---|
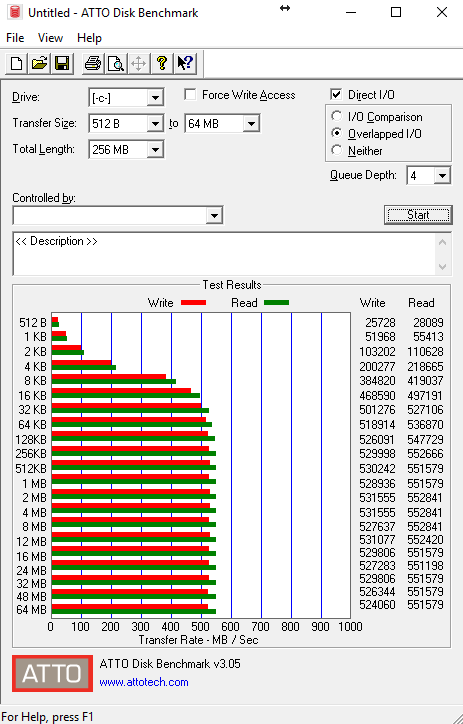
| CrystalDiskMark 3.0 | -91% | -57% | -53% | -20% | |
| Read Seq (MB/s) | 504 | 122.1 -76% | 453.2 -10% | 462 -8% | 507 1% |
| Write Seq (MB/s) | 503 | 110.7 -78% | 137.7 -73% | 174.5 -65% | 337.5 -33% |
| Read 512 (MB/s) | 393.6 | 33.53 -91% | 308.5 -22% | 306.8 -22% | 325 -17% |
| Write 512 (MB/s) | 413.6 | 51.3 -88% | 134.1 -68% | 168.6 -59% | 346.8 -16% |
| Read 4k (MB/s) | 36.98 | 0.357 -99% | 19.06 -48% | 16.14 -56% | 29.37 -21% |
| Write 4k (MB/s) | 92.1 | 0.641 -99% | 21.31 -77% | 36.24 -61% | 93.9 2% |
| Read 4k QD32 (MB/s) | 277.6 | 0.778 -100% | 93.5 -66% | 95.7 -66% | 103.8 -63% |
| Write 4k QD32 (MB/s) | 250.6 | 0.672 -100% | 23.3 -91% | 36.23 -86% | 217.7 -13% |

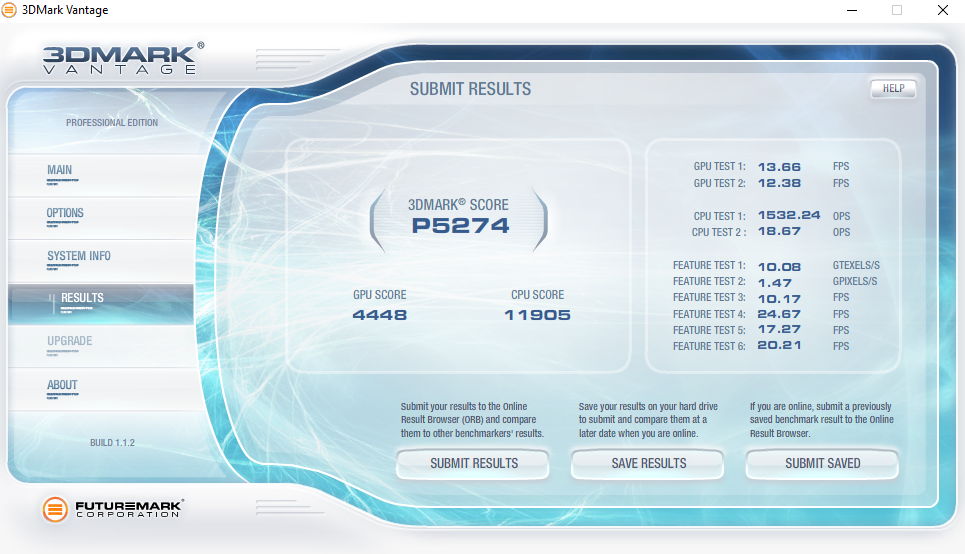
| 3DMark | |
| 1280x720 Cloud Gate Standard Graphics | |
| Lenovo ThinkPad E560-20EWS00000 | |
| HP ProBook 450 G4 Y8B60EA | |
| Fujitsu Lifebook A557 | |
| Acer TravelMate P257-M-56AX | |
| Dell Latitude 15-3570 | |
| 1920x1080 Fire Strike Graphics | |
| Lenovo ThinkPad E560-20EWS00000 | |
| HP ProBook 450 G4 Y8B60EA | |
| Fujitsu Lifebook A557 | |
| 3DMark 11 - 1280x720 Performance GPU | |
| Lenovo ThinkPad E560-20EWS00000 | |
| HP ProBook 450 G4 Y8B60EA | |
| Fujitsu Lifebook A557 | |
| HP ProBook 655 G2 T9X09ET | |
| Dell Latitude 15-3570 | |
| Acer TravelMate P257-M-56AX | |
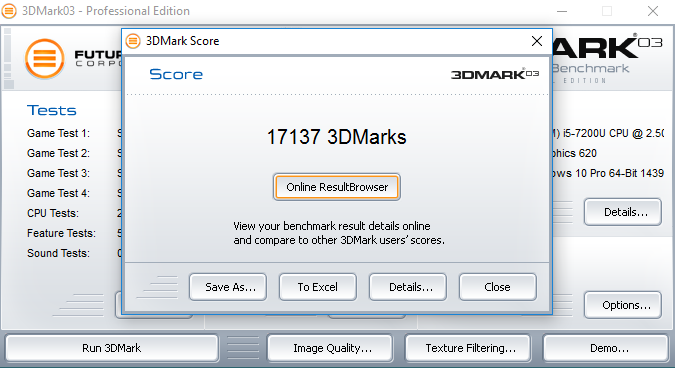
| 3DMark 03 Standard | 17137 points | |
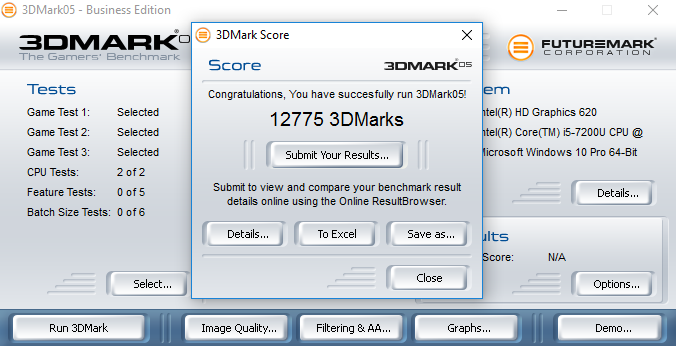
| 3DMark 05 Standard | 12775 points | |
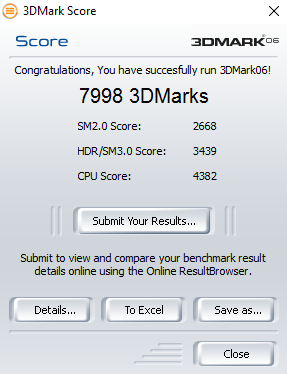
| 3DMark 06 Standard Score | 7998 points | |
| 3DMark Vantage P Result | 5274 points | |
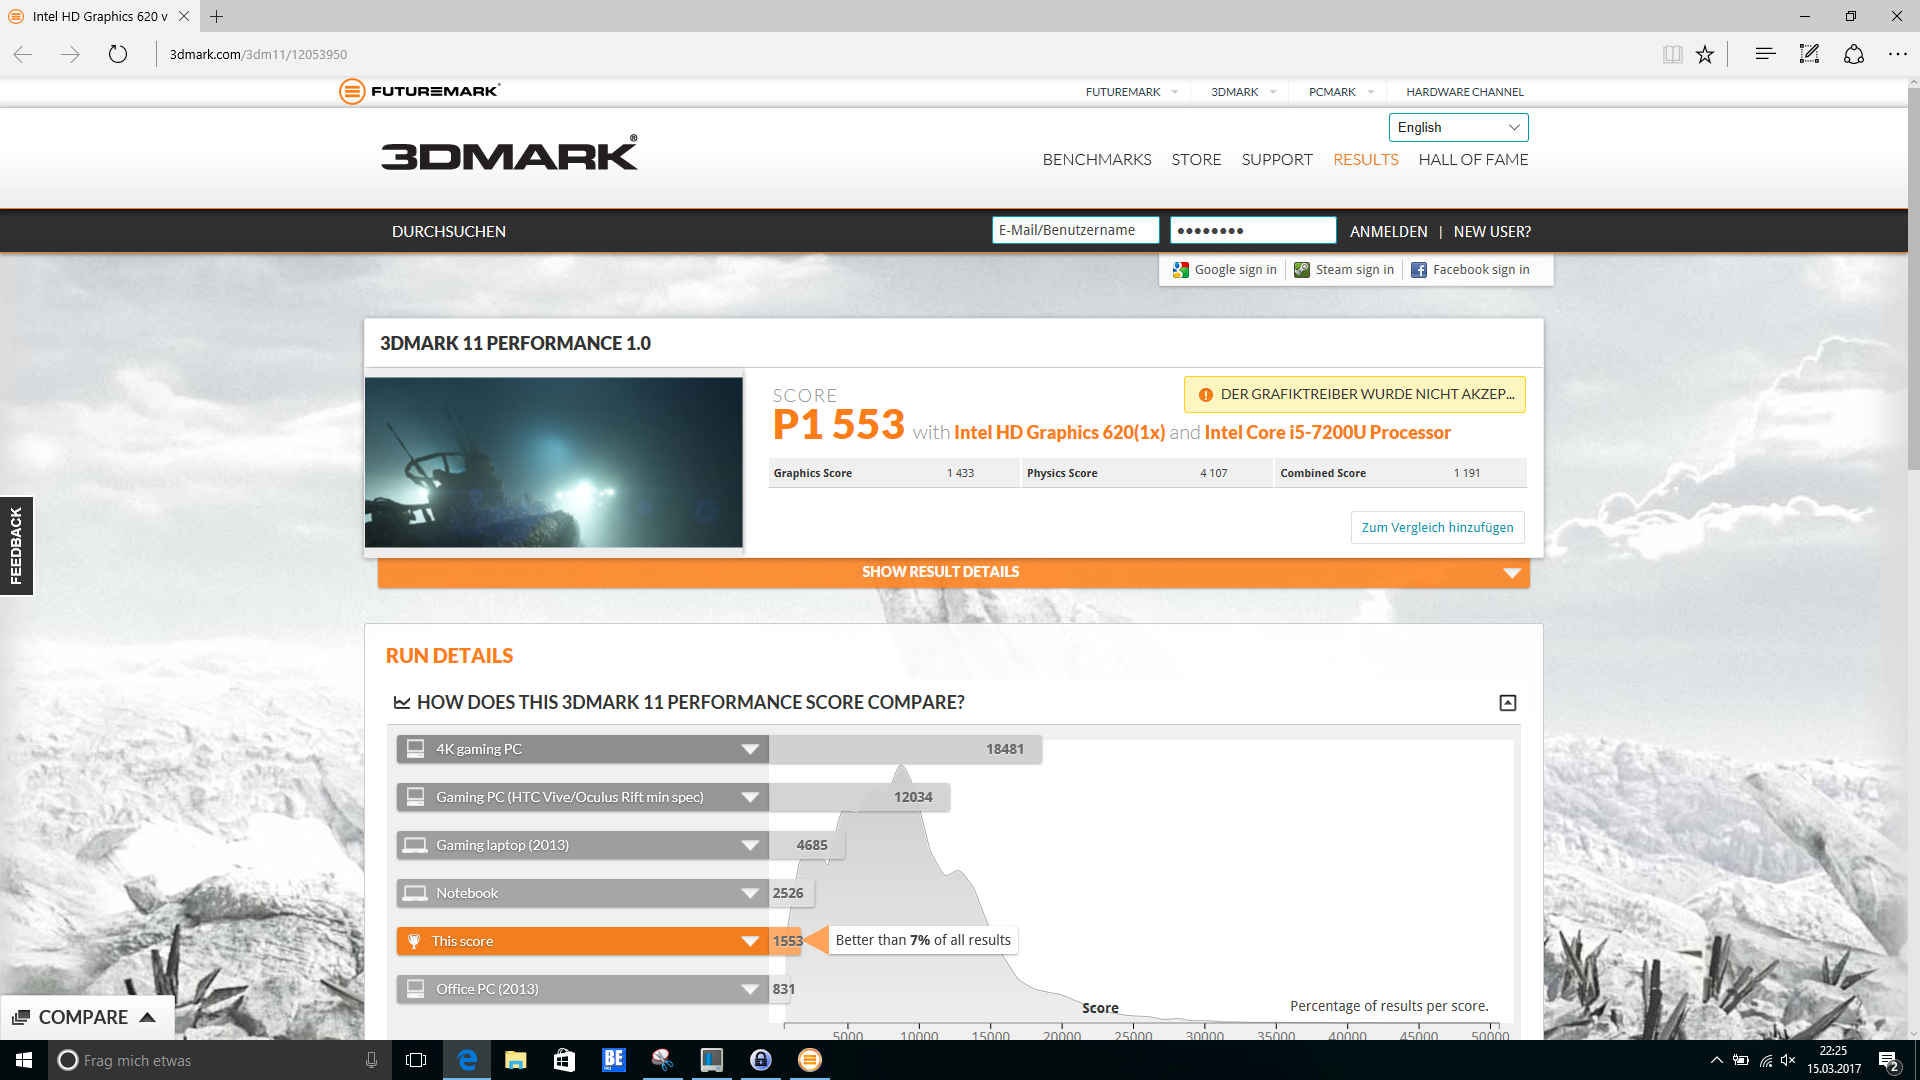
| 3DMark 11 Performance | 1553 points | |
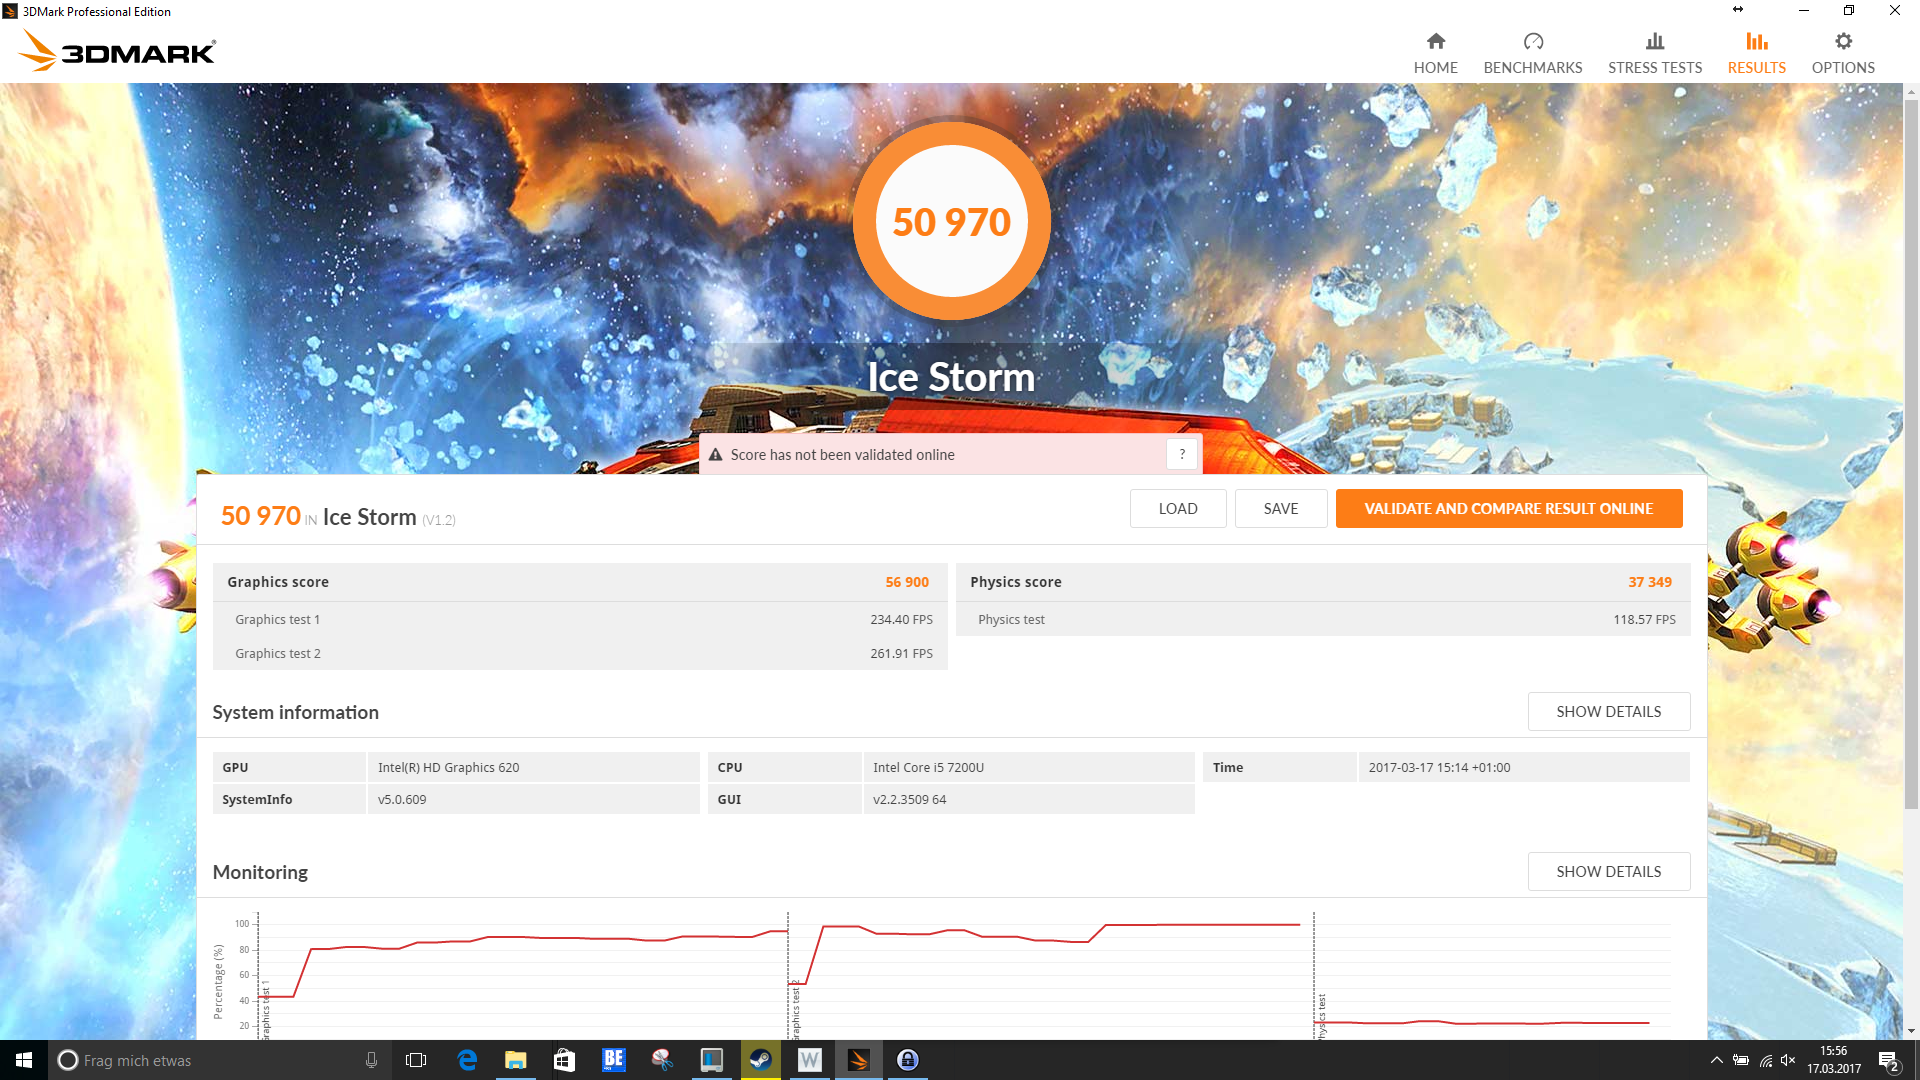
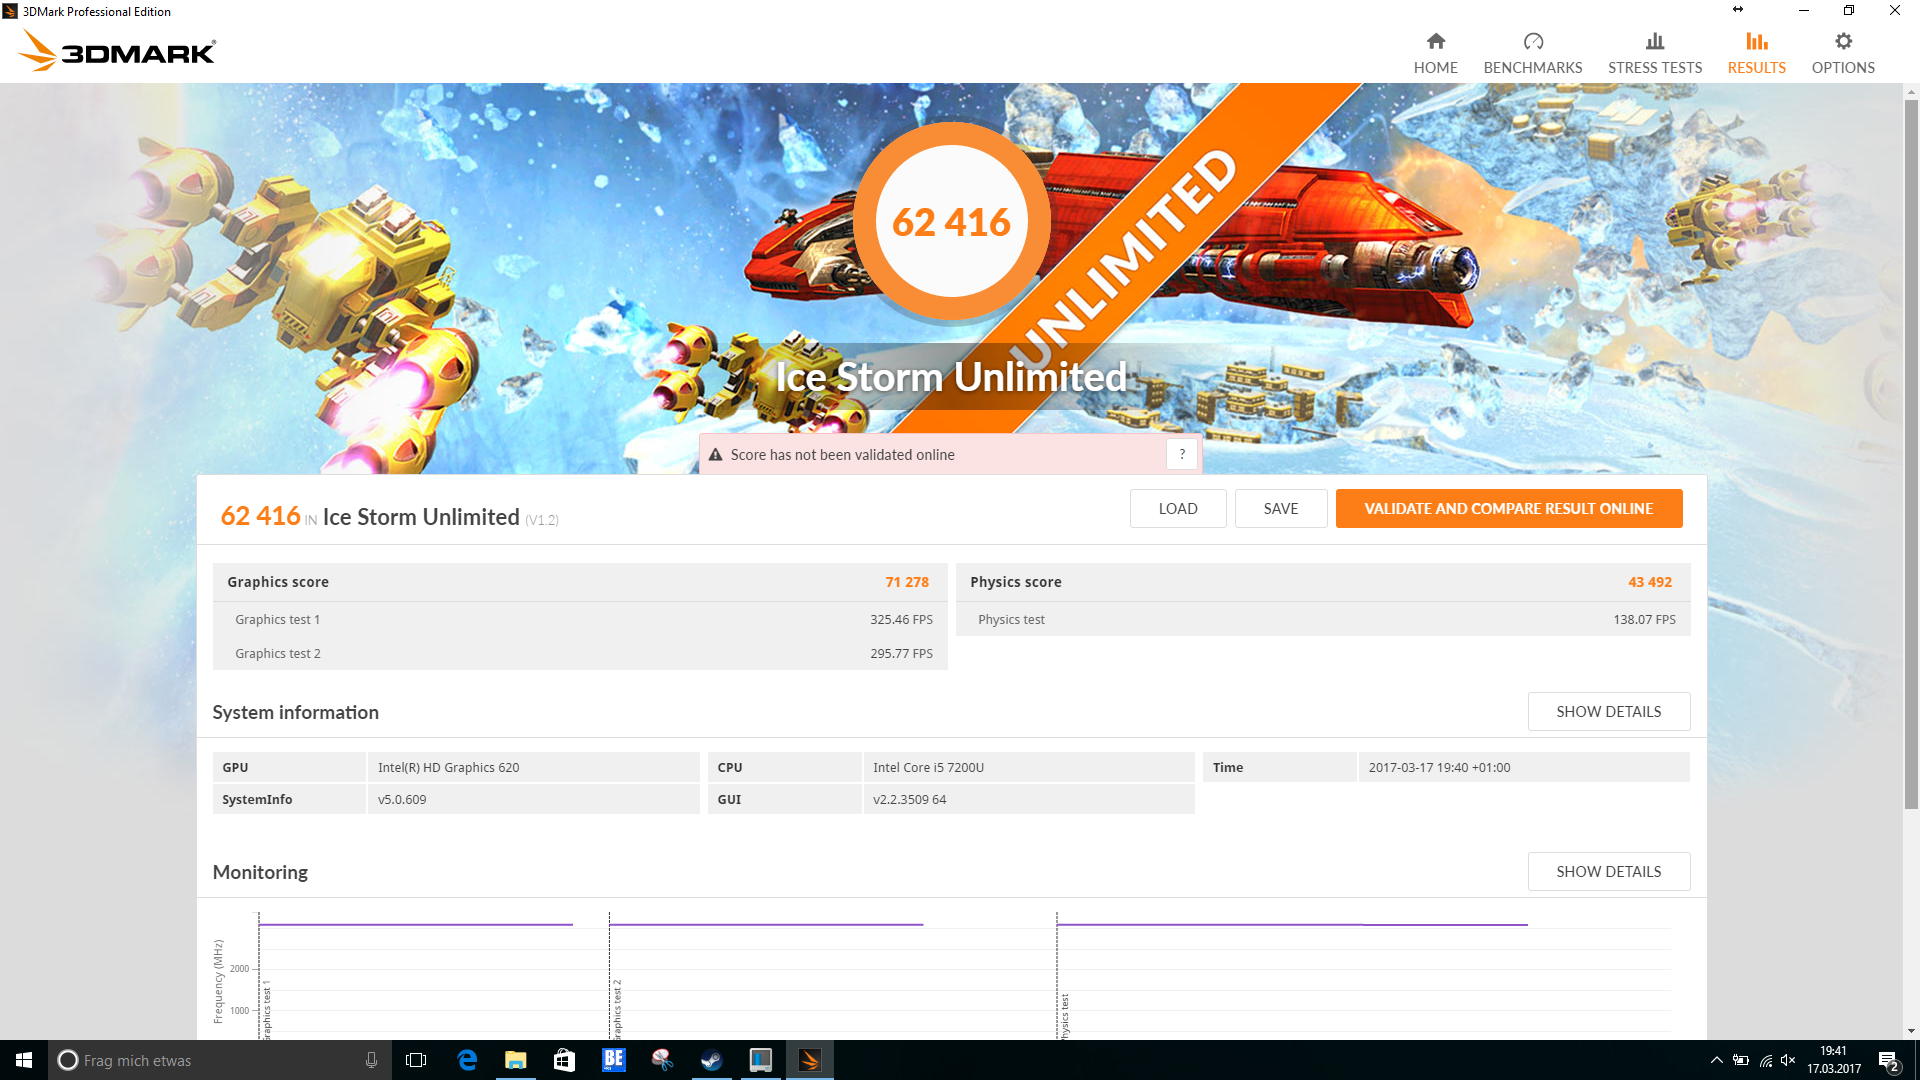
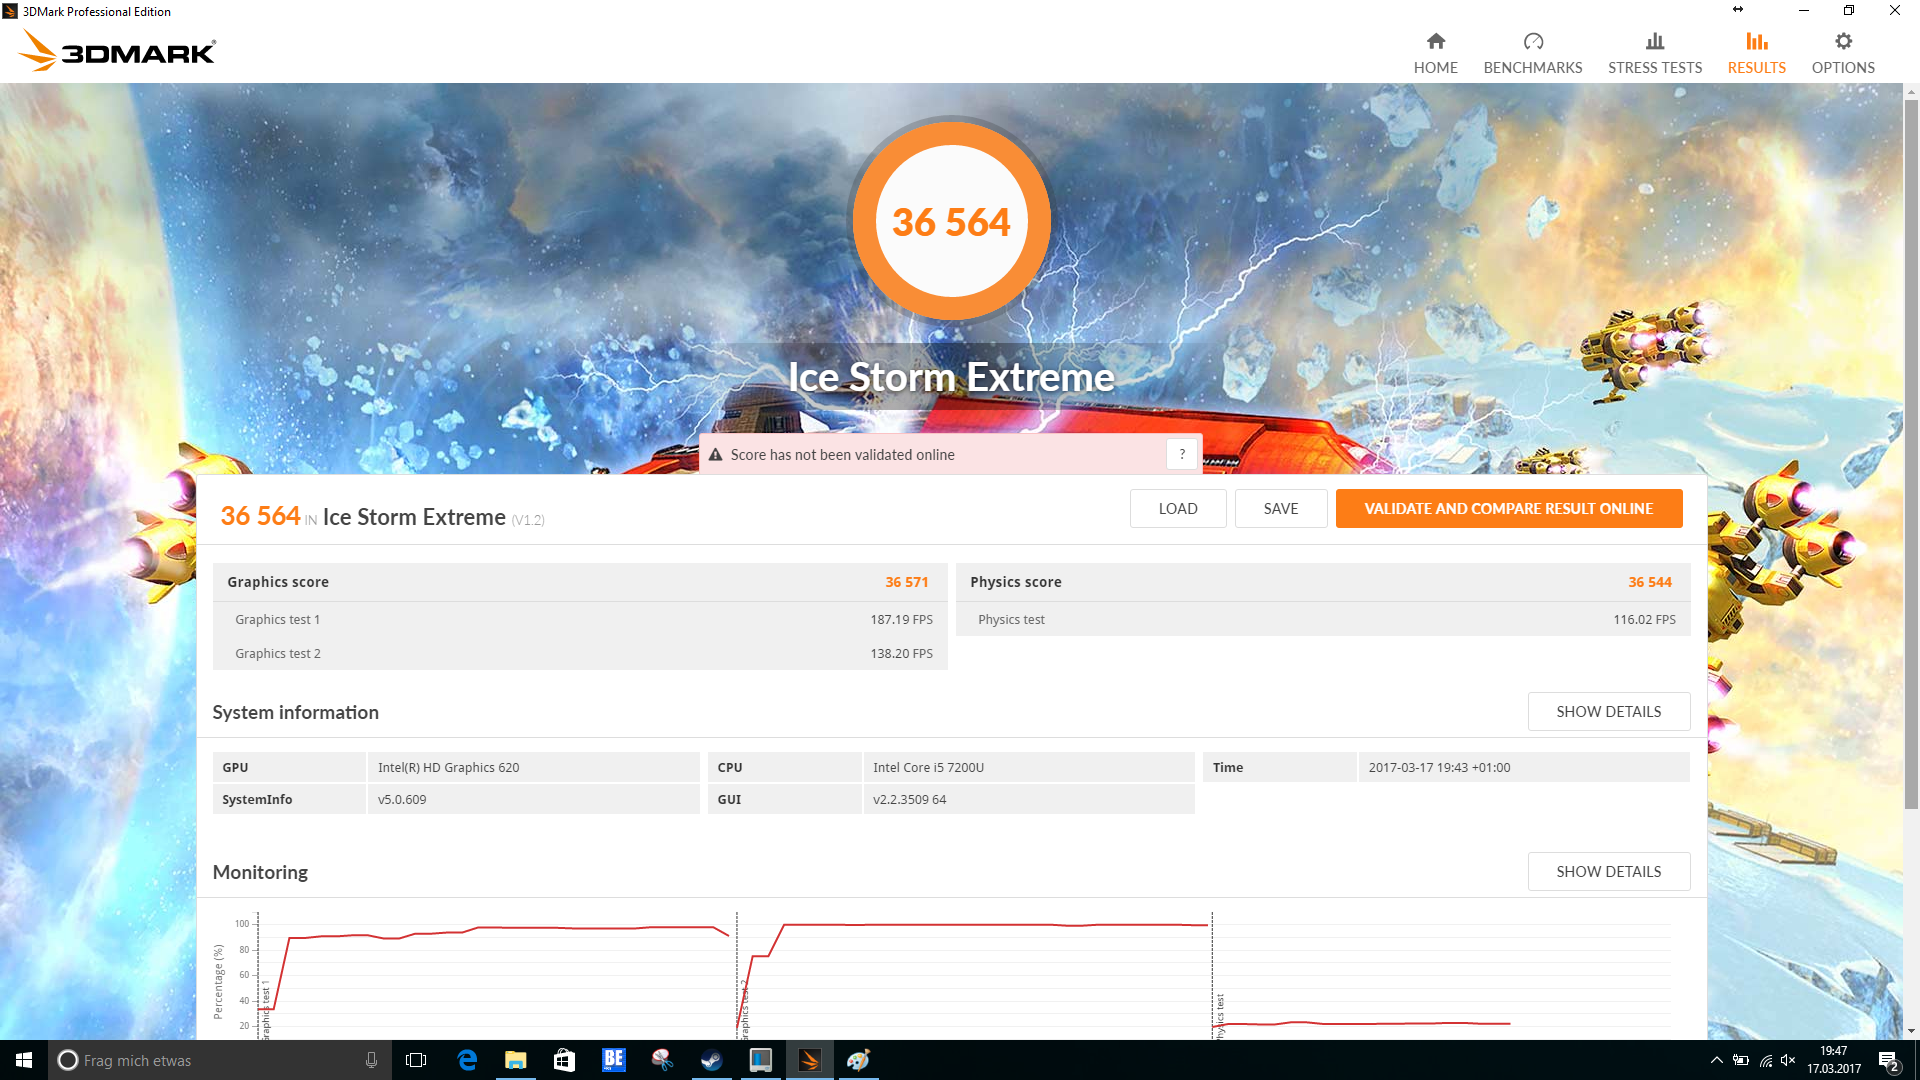
| 3DMark Ice Storm Standard Score | 50970 points | |
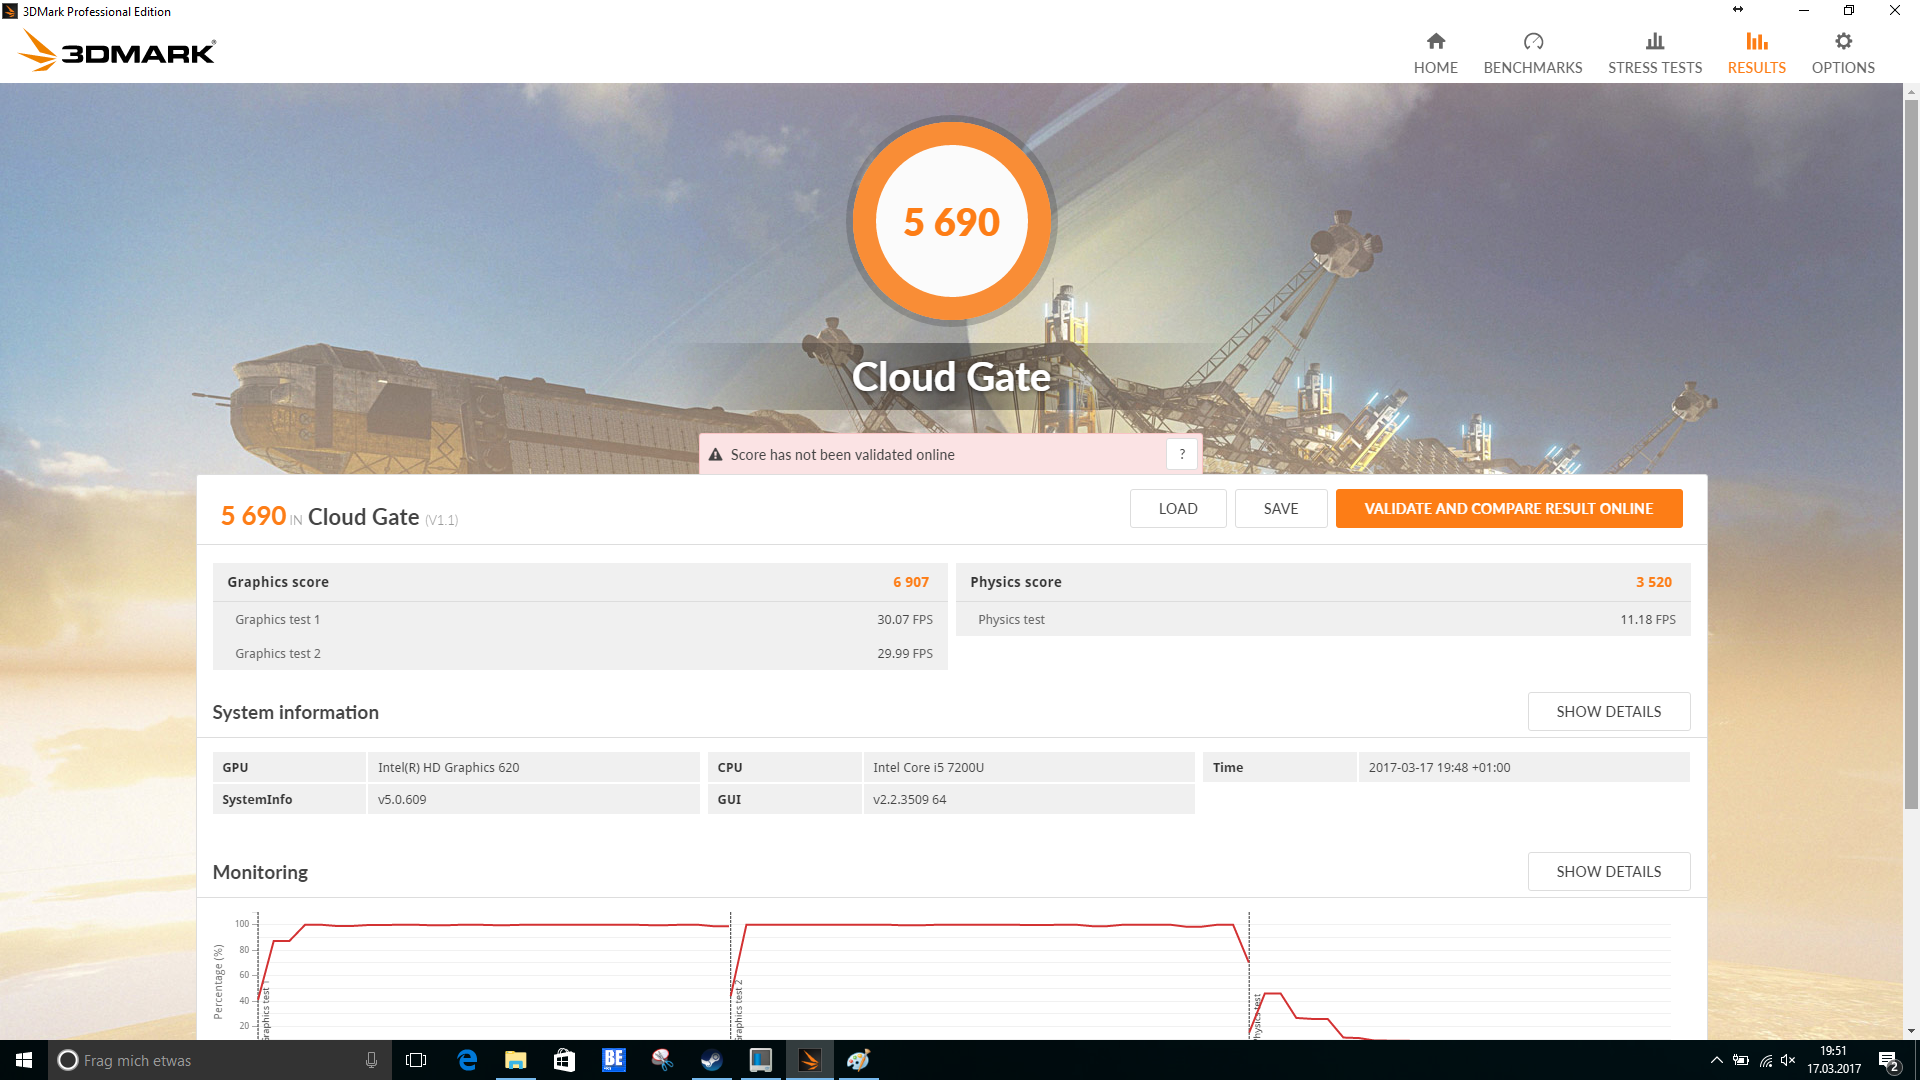
| 3DMark Cloud Gate Standard Score | 5690 points | |
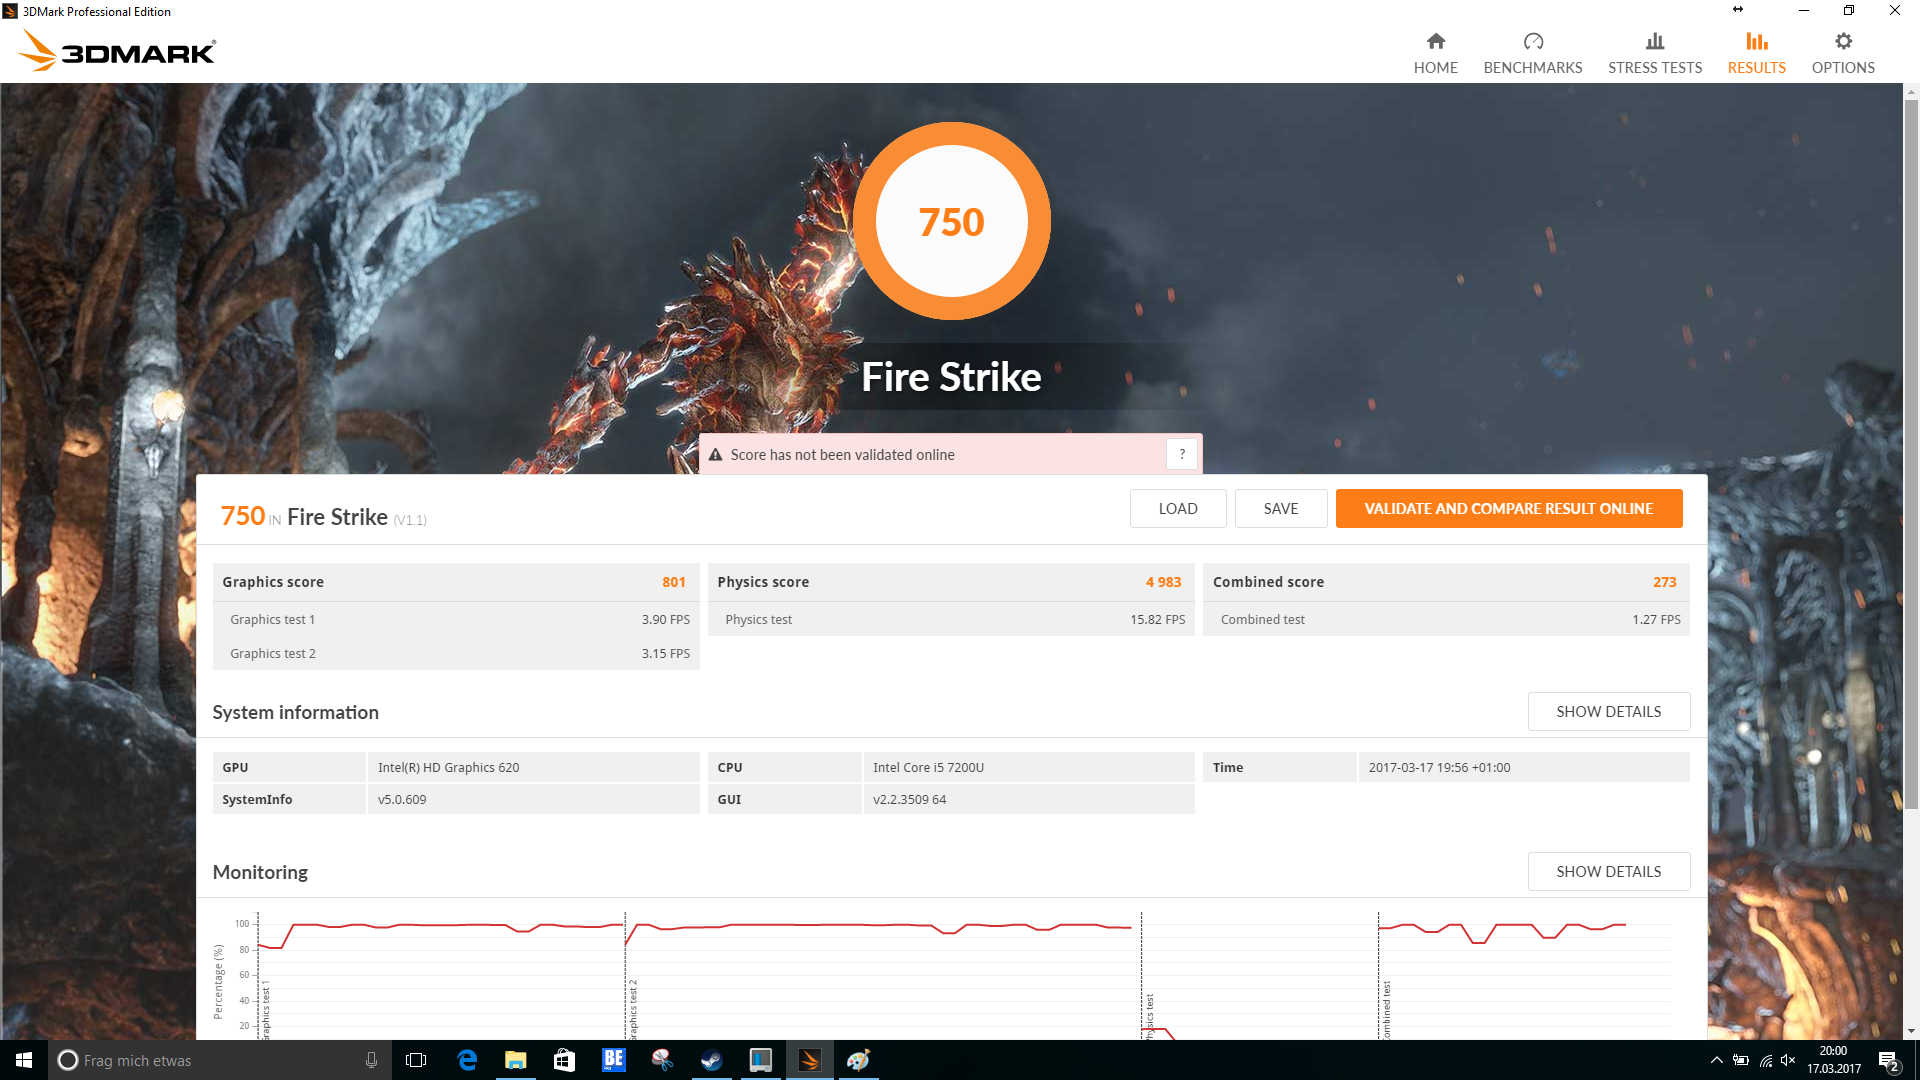
| 3DMark Fire Strike Score | 750 points | |
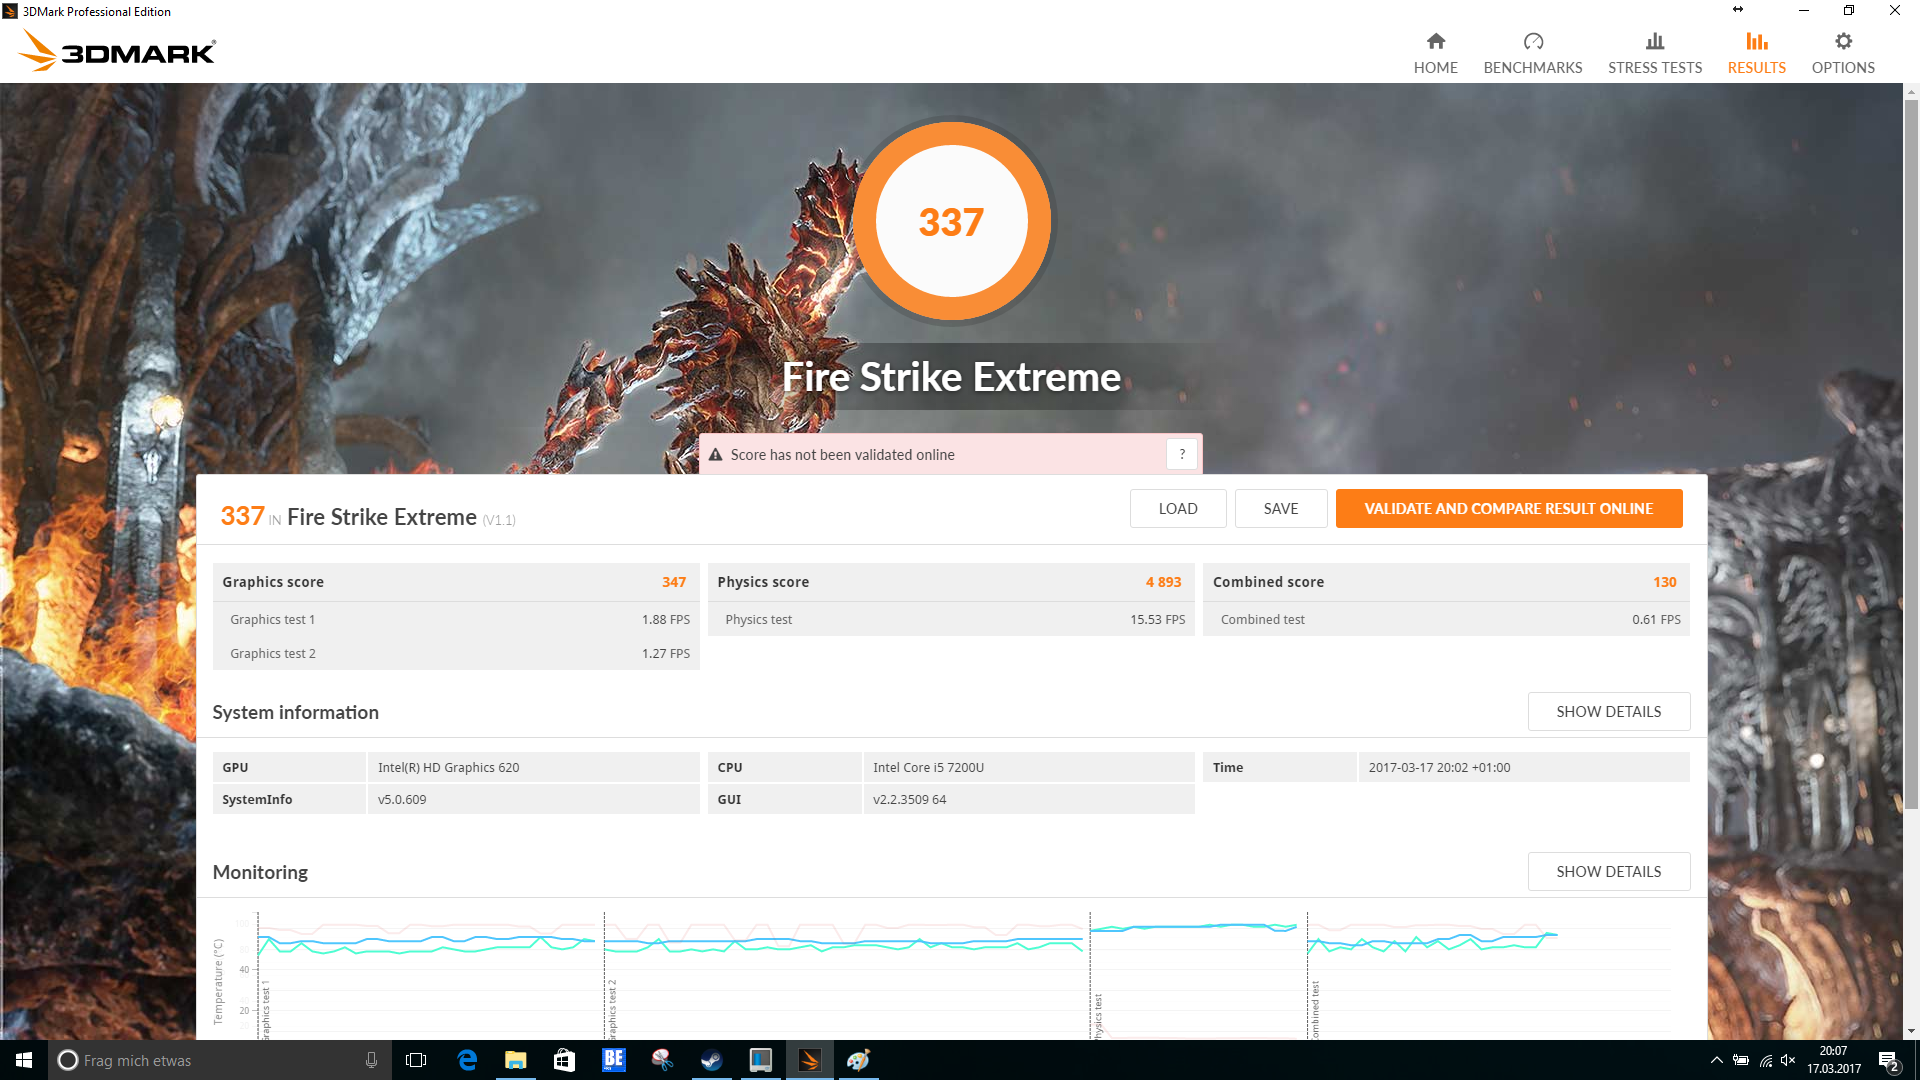
| 3DMark Fire Strike Extreme Score | 337 points | |
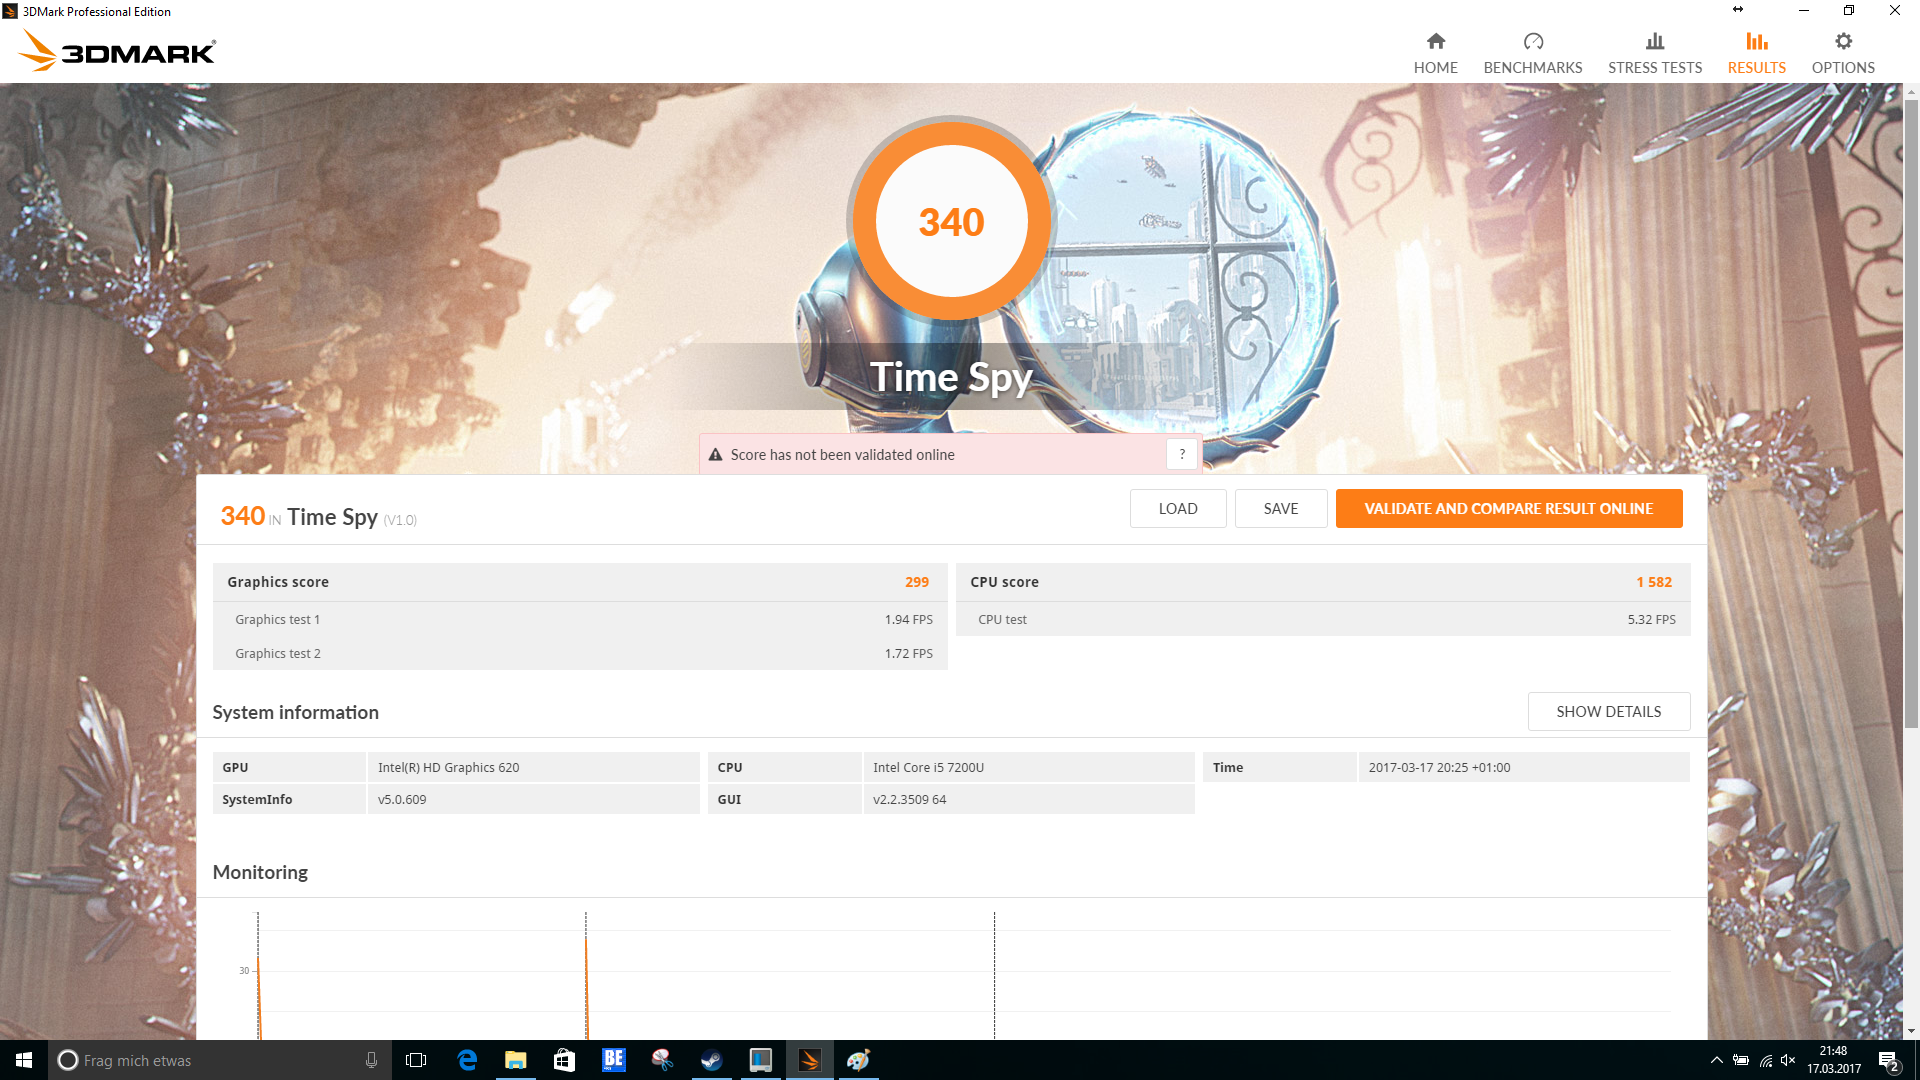
| 3DMark Time Spy Score | 340 points | |
Help | ||
| low | med. | high | ultra | |
|---|---|---|---|---|
| BioShock Infinite (2013) | 43.2 | 25.2 | 20.3 | 6.3 |
| Battlefield 4 (2013) | 33.4 | 26.2 | 17.5 | 6.2 |
| The Witcher 3 (2015) | 12.8 | 10.1 | 4.8 | |
| Rise of the Tomb Raider (2016) | 15.4 | 9.5 | 5.8 |
Noise level
| Idle |
| 30.3 / 30.3 / 32.3 dB(A) |
| HDD |
| 31.3 dB(A) |
| DVD |
| 54.9 / dB(A) |
| Load |
| 38.5 / 39.7 dB(A) |
 | ||
30 dB silent 40 dB(A) audible 50 dB(A) loud |
||
min: | ||
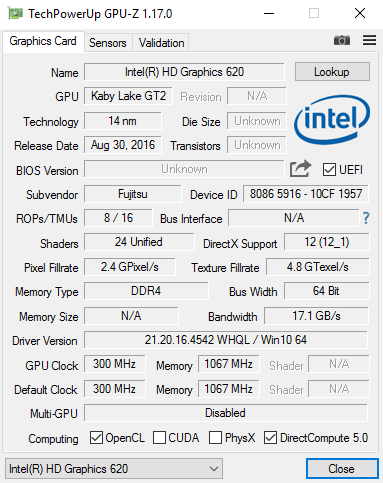
| Fujitsu Lifebook A557 i5-7200U, HD Graphics 620 | HP ProBook 450 G4 Y8B60EA i7-7500U, GeForce 930MX | HP ProBook 655 G2 T9X09ET Pro A8-8600B, Radeon R6 (Carrizo) | Dell Latitude 15-3570 6200U, HD Graphics 520 | Lenovo ThinkPad E560-20EWS00000 6500U, Radeon R7 M370 | Acer TravelMate P257-M-56AX 5200U, HD Graphics 5500 | |
|---|---|---|---|---|---|---|
| Noise | -4% | 3% | 4% | 8% | 1% | |
| off / environment * (dB) | 30.3 | 31.6 -4% | 31.5 -4% | 31 -2% | ||
| Idle Minimum * (dB) | 30.3 | 32.6 -8% | 31.6 -4% | 31 -2% | 29.2 4% | 31.8 -5% |
| Idle Average * (dB) | 30.3 | 32.6 -8% | 31.6 -4% | 31 -2% | 29.2 4% | 31.8 -5% |
| Idle Maximum * (dB) | 32.3 | 33 -2% | 31.6 2% | 31 4% | 29.2 10% | 31.8 2% |
| Load Average * (dB) | 38.5 | 38.9 -1% | 33.5 13% | 34.2 11% | 33.6 13% | 35 9% |
| Load Maximum * (dB) | 39.7 | 38.9 2% | 33.5 16% | 34.3 14% | 35.5 11% | 37.6 5% |
* ... smaller is better
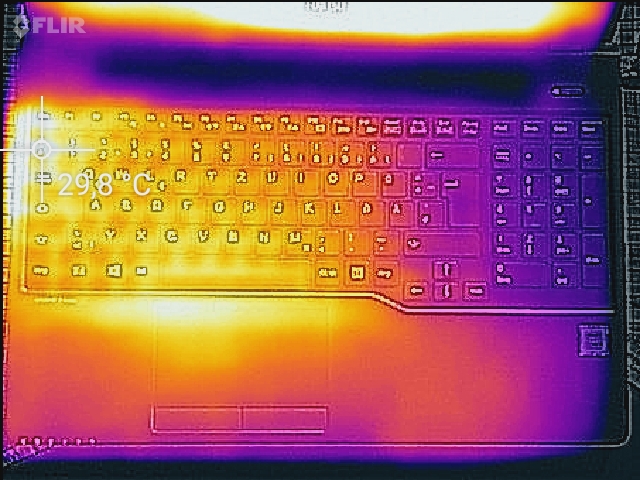
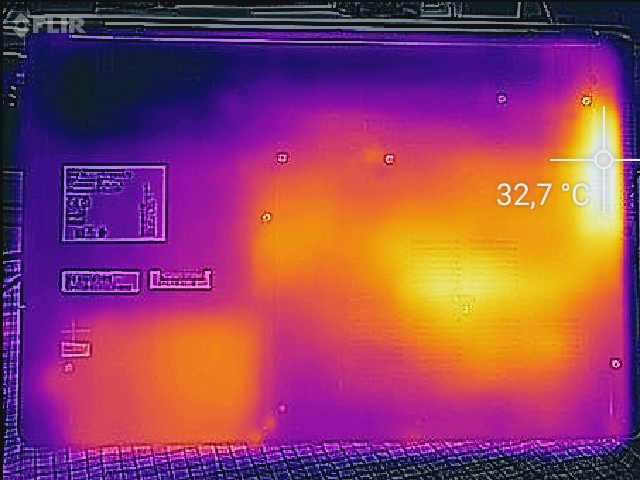
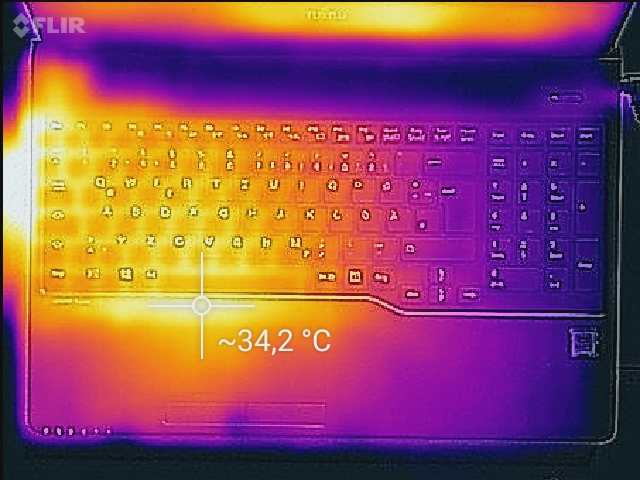
(+) The maximum temperature on the upper side is 33.3 °C / 92 F, compared to the average of 34.3 °C / 94 F, ranging from 21.2 to 62.5 °C for the class Office.
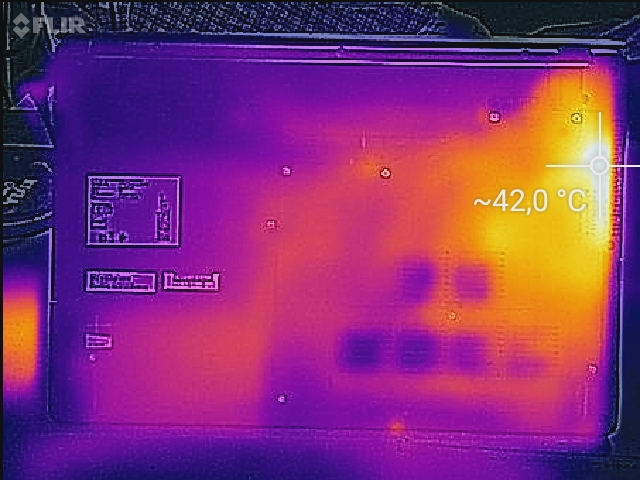
(+) The bottom heats up to a maximum of 35.3 °C / 96 F, compared to the average of 36.8 °C / 98 F
(+) In idle usage, the average temperature for the upper side is 24.1 °C / 75 F, compared to the device average of 29.5 °C / 85 F.
(+) The palmrests and touchpad are cooler than skin temperature with a maximum of 29 °C / 84.2 F and are therefore cool to the touch.
(±) The average temperature of the palmrest area of similar devices was 27.5 °C / 81.5 F (-1.5 °C / -2.7 F).
| Fujitsu Lifebook A557 i5-7200U, HD Graphics 620 | HP ProBook 450 G4 Y8B60EA i7-7500U, GeForce 930MX | HP ProBook 655 G2 T9X09ET Pro A8-8600B, Radeon R6 (Carrizo) | Dell Latitude 15-3570 6200U, HD Graphics 520 | Lenovo ThinkPad E560-20EWS00000 6500U, Radeon R7 M370 | Acer TravelMate P257-M-56AX 5200U, HD Graphics 5500 | |
|---|---|---|---|---|---|---|
| Heat | -19% | -17% | -21% | -13% | -8% | |
| Maximum Upper Side * (°C) | 33.3 | 44.3 -33% | 35.8 -8% | 36.1 -8% | 45 -35% | 34.3 -3% |
| Maximum Bottom * (°C) | 35.3 | 46.3 -31% | 37.6 -7% | 47 -33% | 39.8 -13% | 42.1 -19% |
| Idle Upper Side * (°C) | 27 | 27.8 -3% | 33.4 -24% | 31.7 -17% | 26.1 3% | 26.7 1% |
| Idle Bottom * (°C) | 26 | 27.7 -7% | 33.2 -28% | 32.9 -27% | 27.7 -7% | 29.2 -12% |
* ... smaller is better
Fujitsu Lifebook A557 audio analysis
(-) | not very loud speakers (67 dB)
Bass 100 - 315 Hz
(-) | nearly no bass - on average 26.8% lower than median
(+) | bass is linear (6.2% delta to prev. frequency)
Mids 400 - 2000 Hz
(±) | higher mids - on average 6.8% higher than median
(-) | mids are not linear (15% delta to prev. frequency)
Highs 2 - 16 kHz
(+) | balanced highs - only 3.5% away from median
(±) | linearity of highs is average (8.7% delta to prev. frequency)
Overall 100 - 16.000 Hz
(-) | overall sound is not linear (33.6% difference to median)
Compared to same class
» 96% of all tested devices in this class were better, 2% similar, 3% worse
» The best had a delta of 7%, average was 21%, worst was 53%
Compared to all devices tested
» 92% of all tested devices were better, 1% similar, 6% worse
» The best had a delta of 4%, average was 23%, worst was 134%
Apple MacBook 12 (Early 2016) 1.1 GHz audio analysis
(+) | speakers can play relatively loud (83.6 dB)
Bass 100 - 315 Hz
(±) | reduced bass - on average 11.3% lower than median
(±) | linearity of bass is average (14.2% delta to prev. frequency)
Mids 400 - 2000 Hz
(+) | balanced mids - only 2.4% away from median
(+) | mids are linear (5.5% delta to prev. frequency)
Highs 2 - 16 kHz
(+) | balanced highs - only 2% away from median
(+) | highs are linear (4.5% delta to prev. frequency)
Overall 100 - 16.000 Hz
(+) | overall sound is linear (10.2% difference to median)
Compared to same class
» 7% of all tested devices in this class were better, 2% similar, 90% worse
» The best had a delta of 5%, average was 18%, worst was 53%
Compared to all devices tested
» 5% of all tested devices were better, 1% similar, 94% worse
» The best had a delta of 4%, average was 23%, worst was 134%
| Off / Standby | |
| Idle | |
| Load |
|
Key:
min: | |
| Fujitsu Lifebook A557 i5-7200U, HD Graphics 620 | HP ProBook 450 G4 Y8B60EA i7-7500U, GeForce 930MX | HP ProBook 655 G2 T9X09ET Pro A8-8600B, Radeon R6 (Carrizo) | Dell Latitude 15-3570 6200U, HD Graphics 520 | Lenovo ThinkPad E560-20EWS00000 6500U, Radeon R7 M370 | Acer TravelMate P257-M-56AX 5200U, HD Graphics 5500 | |
|---|---|---|---|---|---|---|
| Power Consumption | -34% | -29% | -14% | -53% | -1% | |
| Idle Minimum * (Watt) | 2.9 | 3.8 -31% | 5.8 -100% | 4.9 -69% | 4.2 -45% | 3.2 -10% |
| Idle Average * (Watt) | 6.4 | 6.6 -3% | 7.5 -17% | 7.2 -13% | 7.5 -17% | 5.5 14% |
| Idle Maximum * (Watt) | 6.9 | 11.3 -64% | 8.6 -25% | 7.5 -9% | 8.2 -19% | 6.4 7% |
| Load Average * (Watt) | 31.8 | 38 -19% | 31 3% | 25.4 20% | 49.6 -56% | 31.8 -0% |
| Load Maximum * (Watt) | 29 | 45 -55% | 30.5 -5% | 28 3% | 65.8 -127% | 33 -14% |
* ... smaller is better
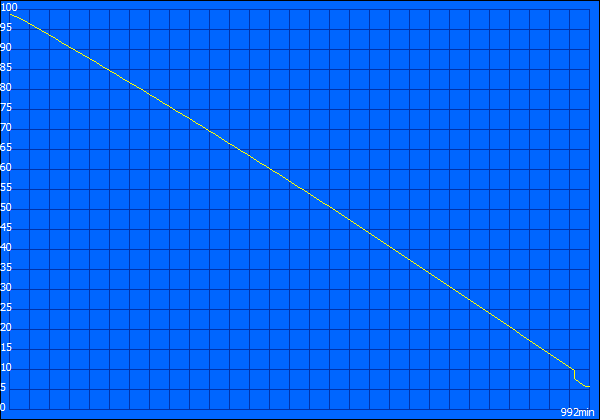
| Fujitsu Lifebook A557 i5-7200U, HD Graphics 620, 49 Wh | HP ProBook 450 G4 Y8B60EA i7-7500U, GeForce 930MX, 45 Wh | HP ProBook 655 G2 T9X09ET Pro A8-8600B, Radeon R6 (Carrizo), 48 Wh | Dell Latitude 15-3570 6200U, HD Graphics 520, 65 Wh | Lenovo ThinkPad E560-20EWS00000 6500U, Radeon R7 M370, 48 Wh | Acer TravelMate P257-M-56AX 5200U, HD Graphics 5500, 37 Wh | |
|---|---|---|---|---|---|---|
| Battery runtime | -5% | -58% | 14% | -17% | -31% | |
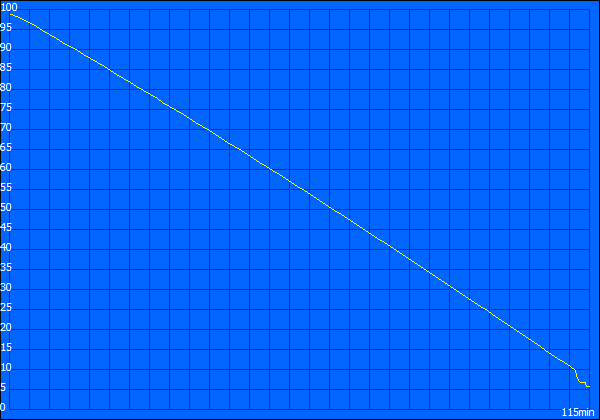
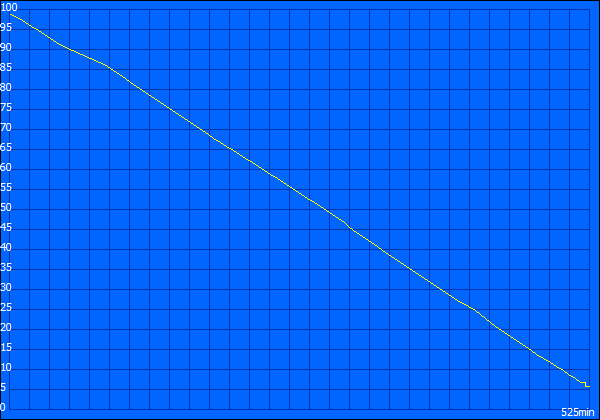
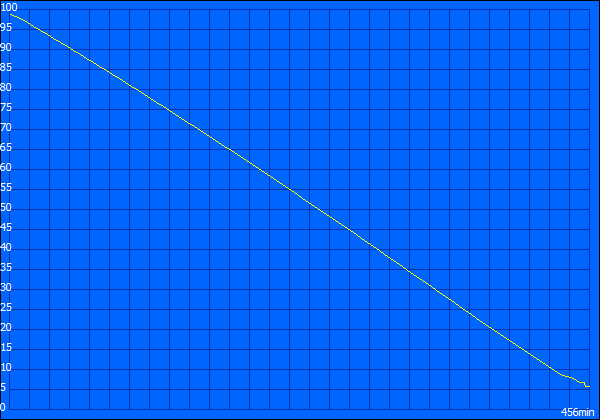
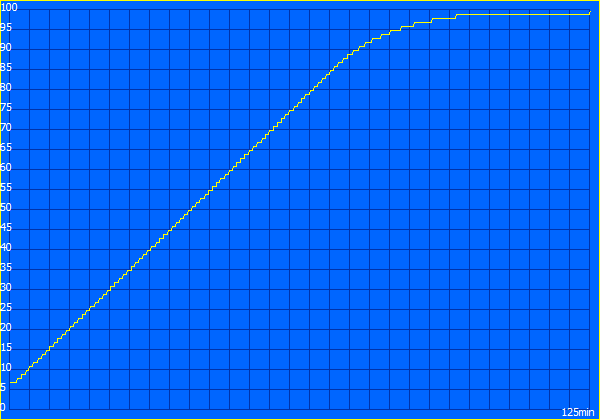
| Reader / Idle (h) | 16.5 | 12.4 -25% | 17.1 4% | 14.7 -11% | 11.7 -29% | |
| H.264 (h) | 7.6 | 6.9 -9% | ||||
| WiFi v1.3 (h) | 8.8 | 8.6 -2% | 3.7 -58% | 9 2% | 5.7 -35% | 5.4 -39% |
| Load (h) | 1.9 | 2.1 11% | 2.6 37% | 1.7 -11% | 1.4 -26% |
Pros
Cons

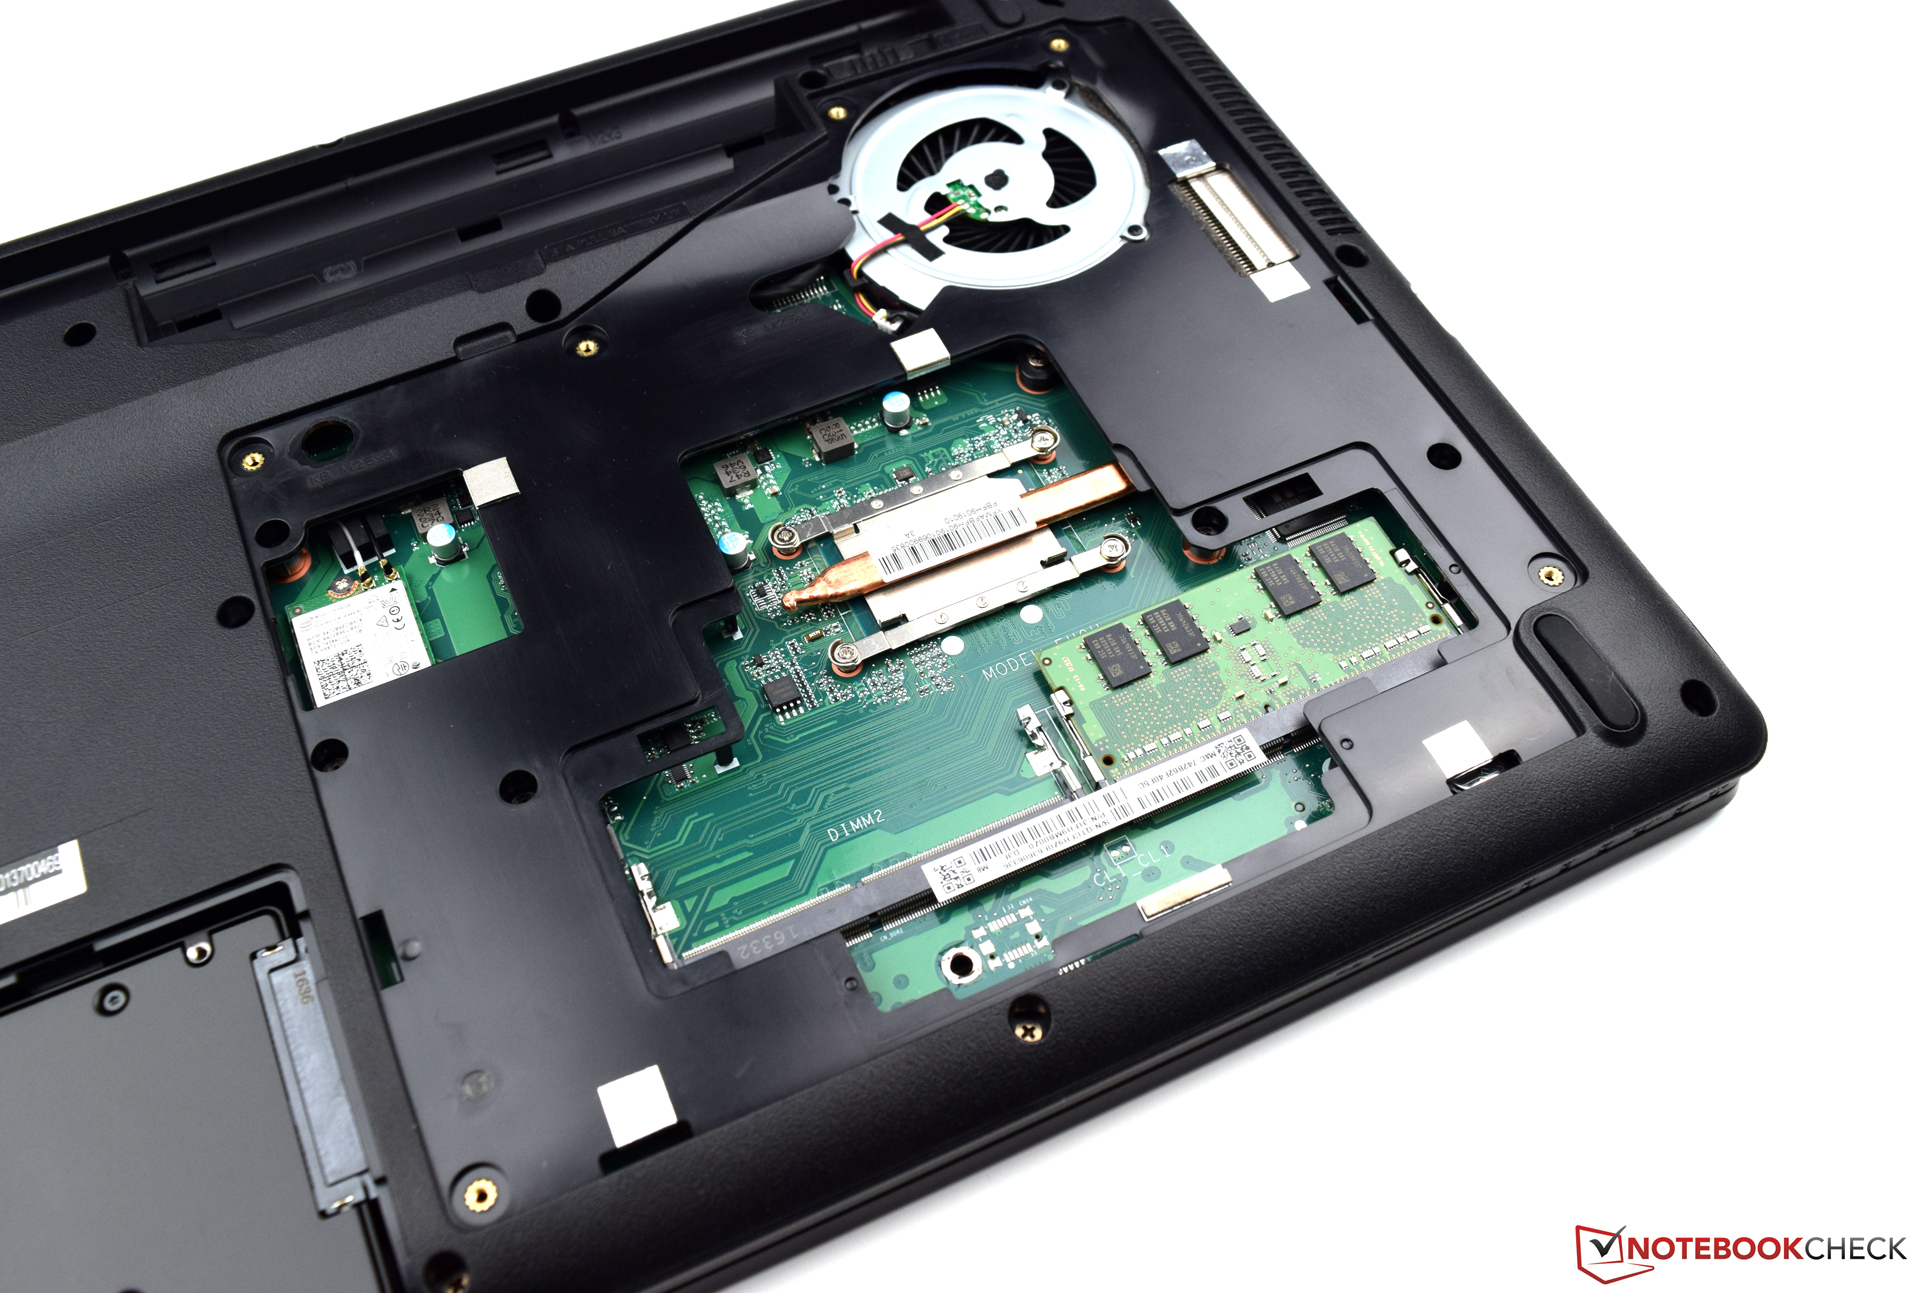
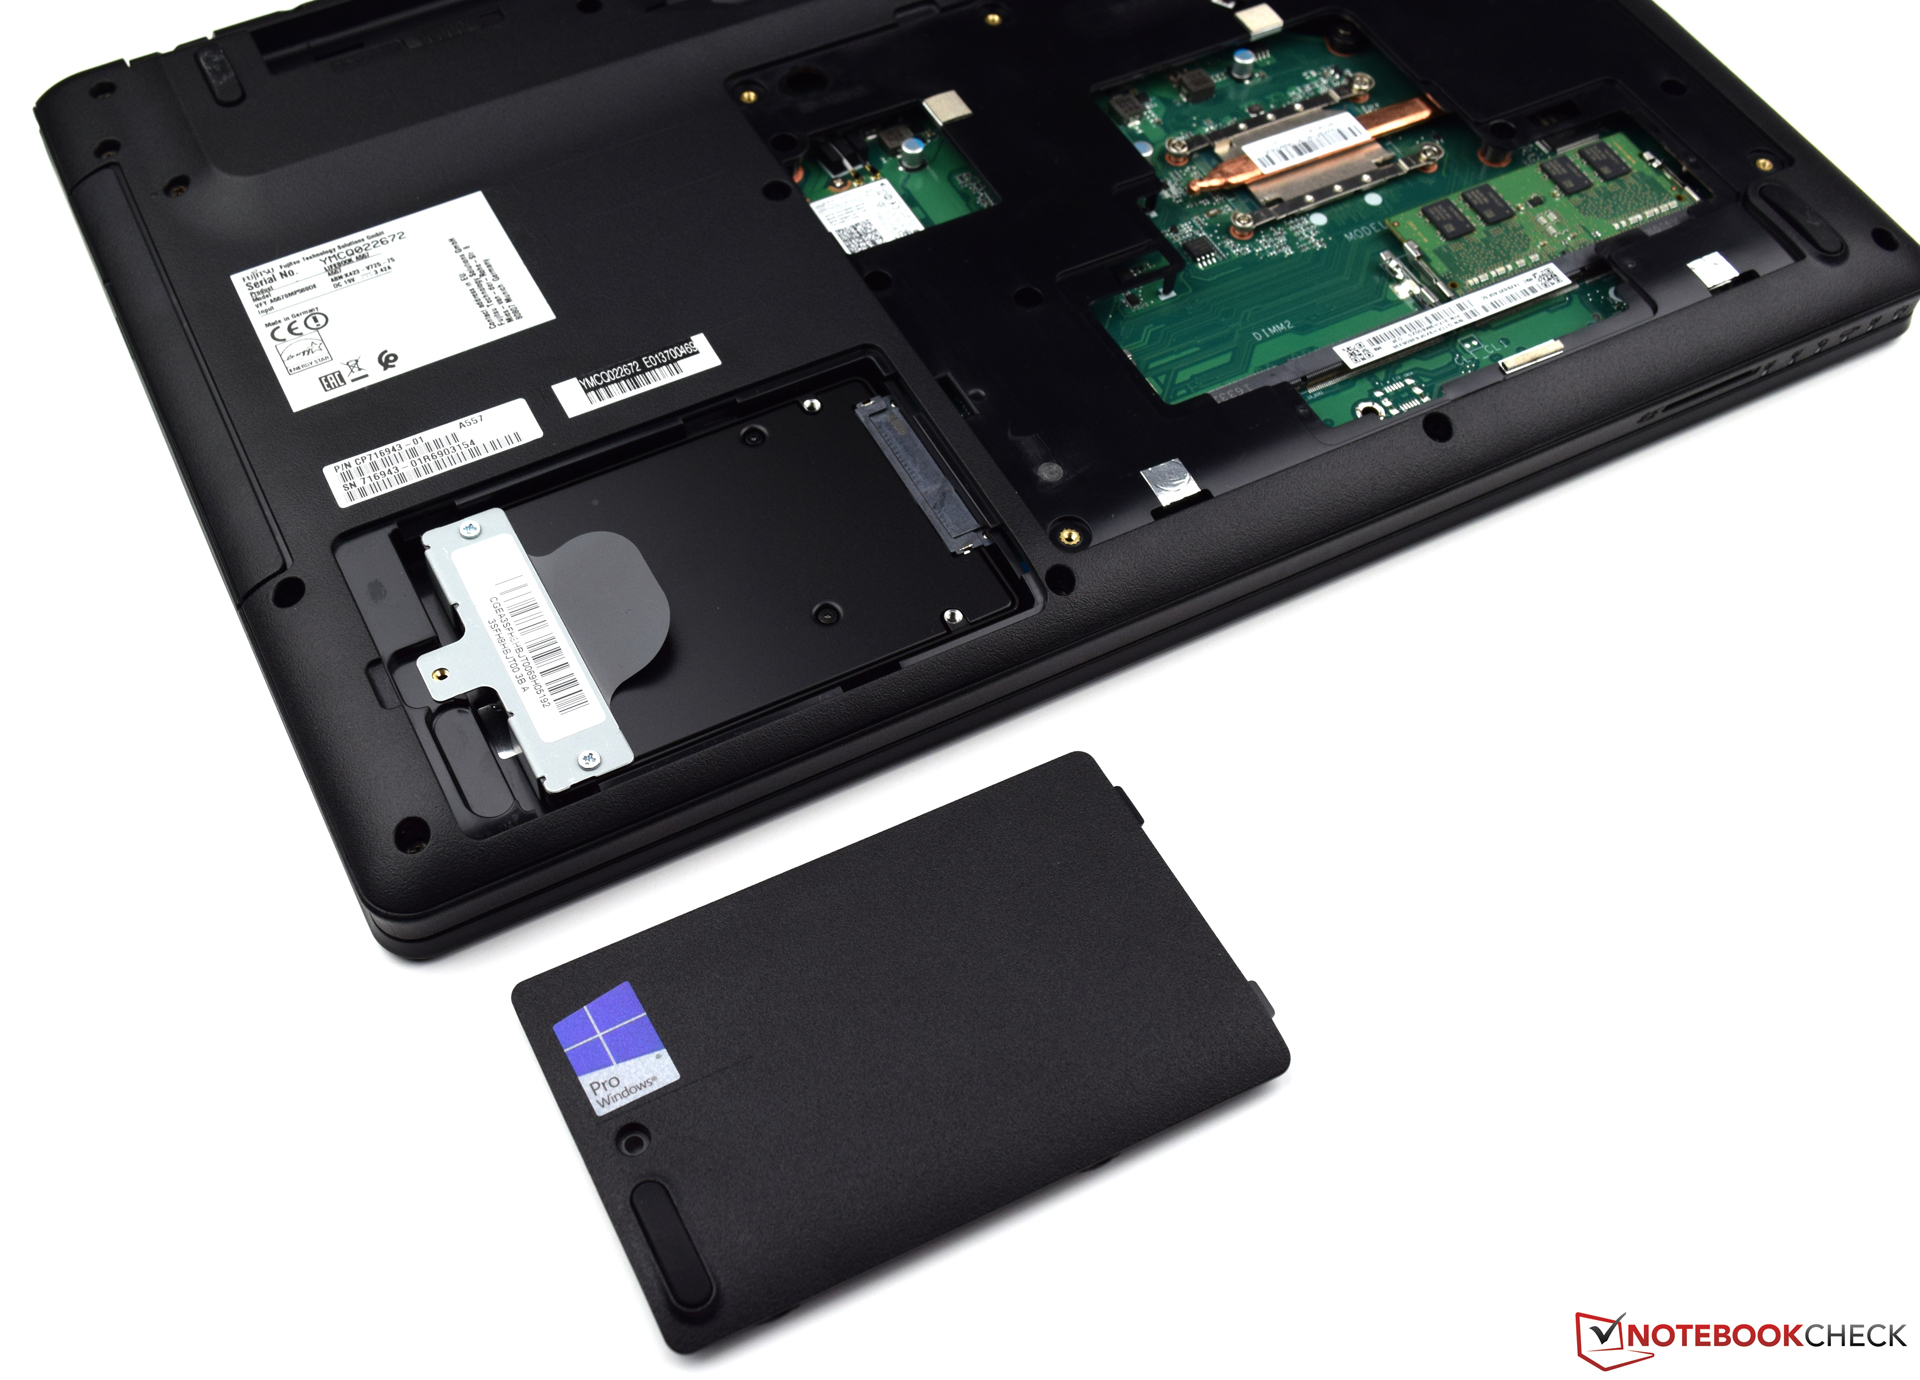
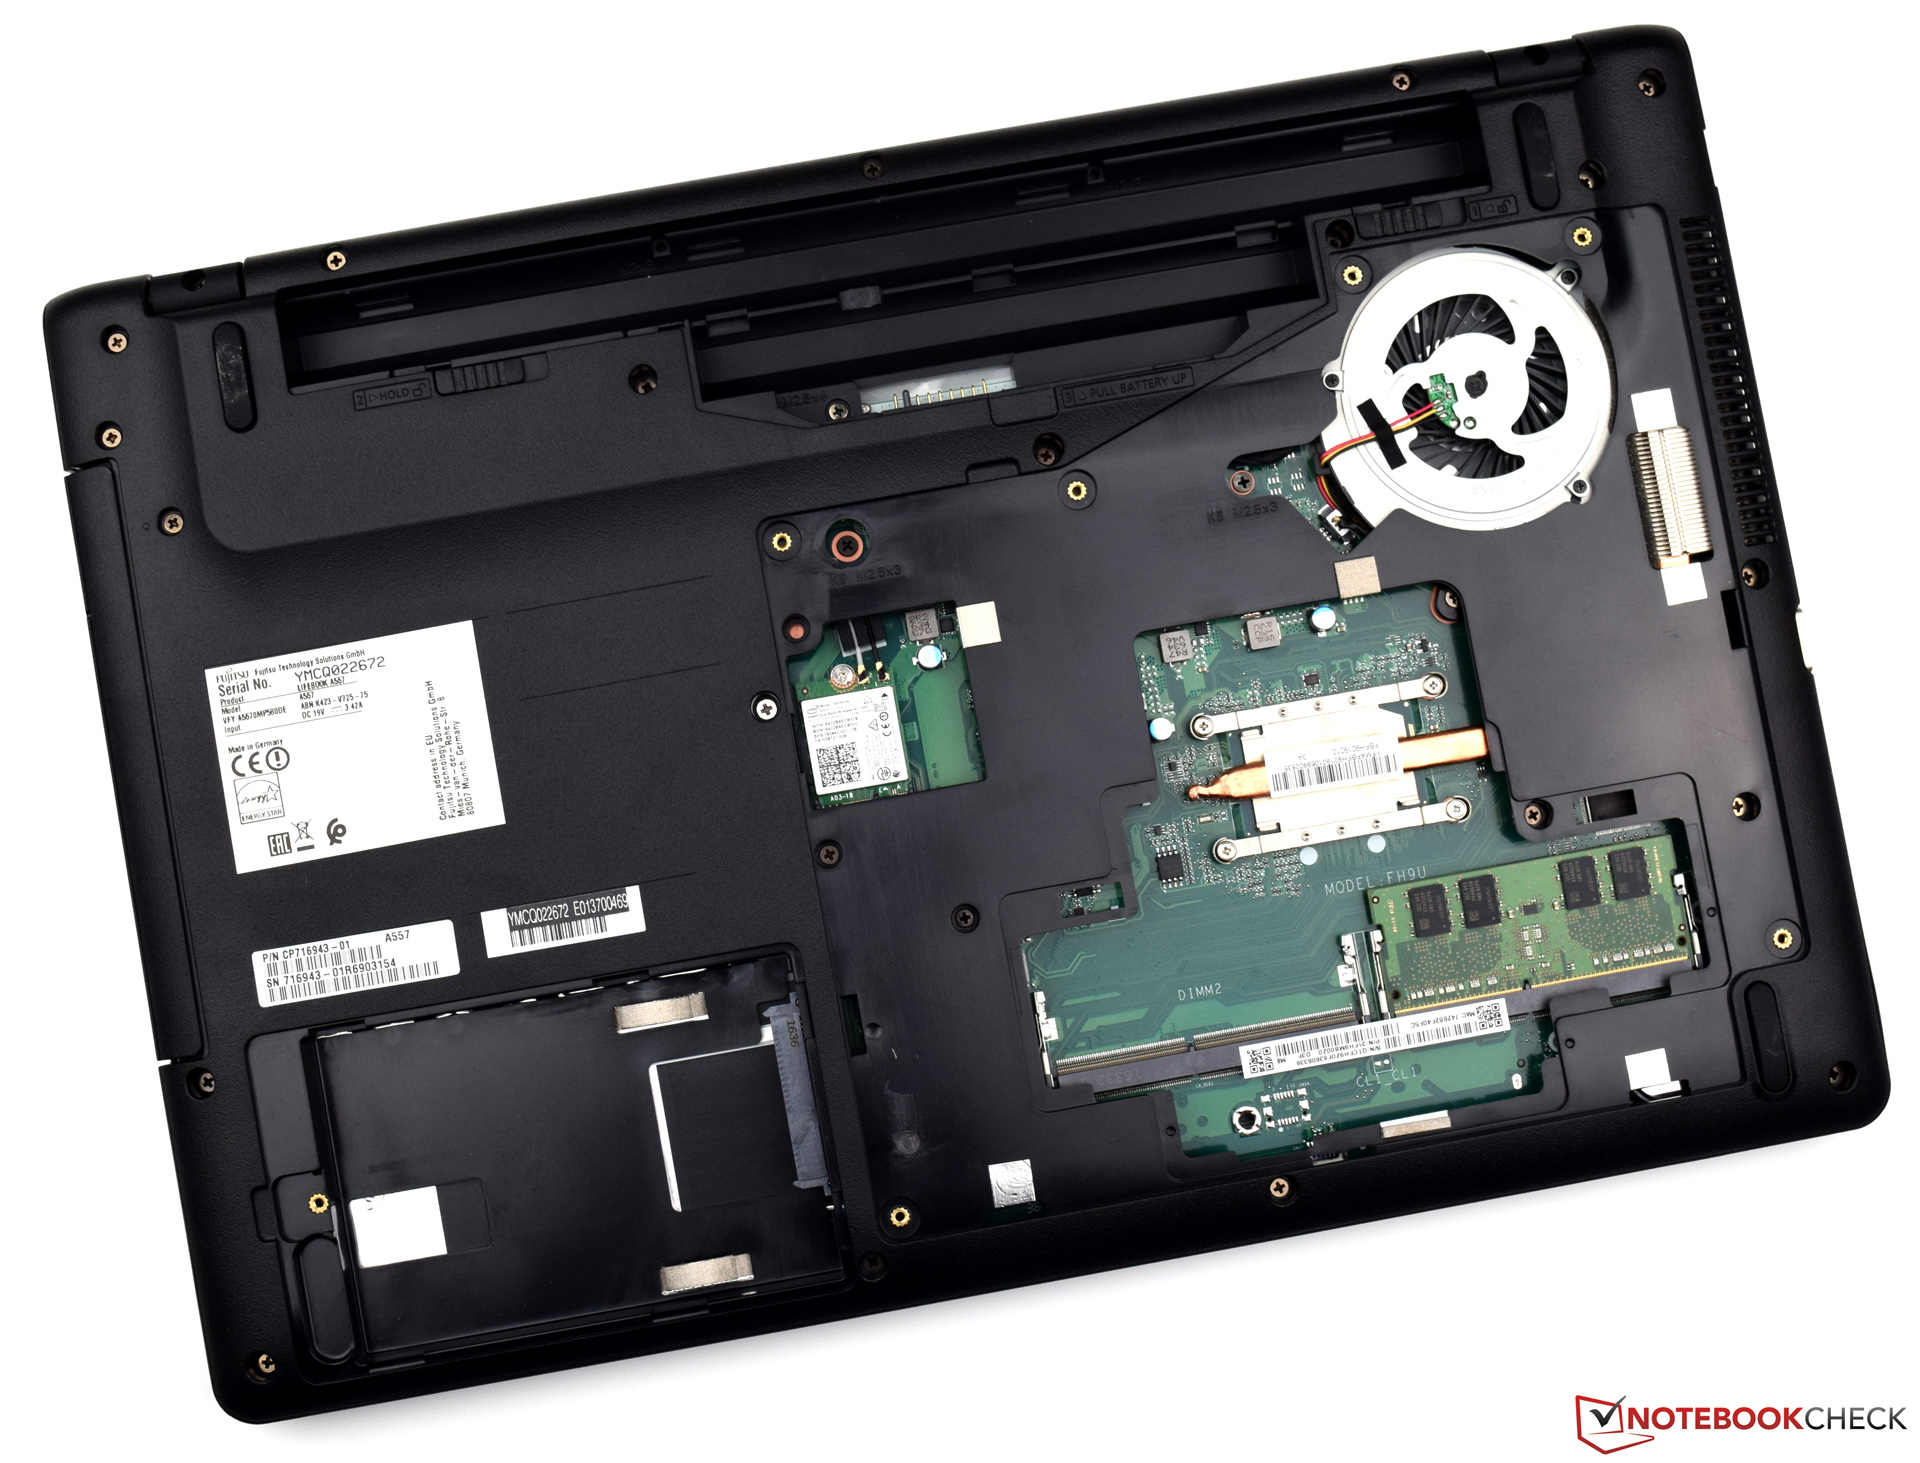
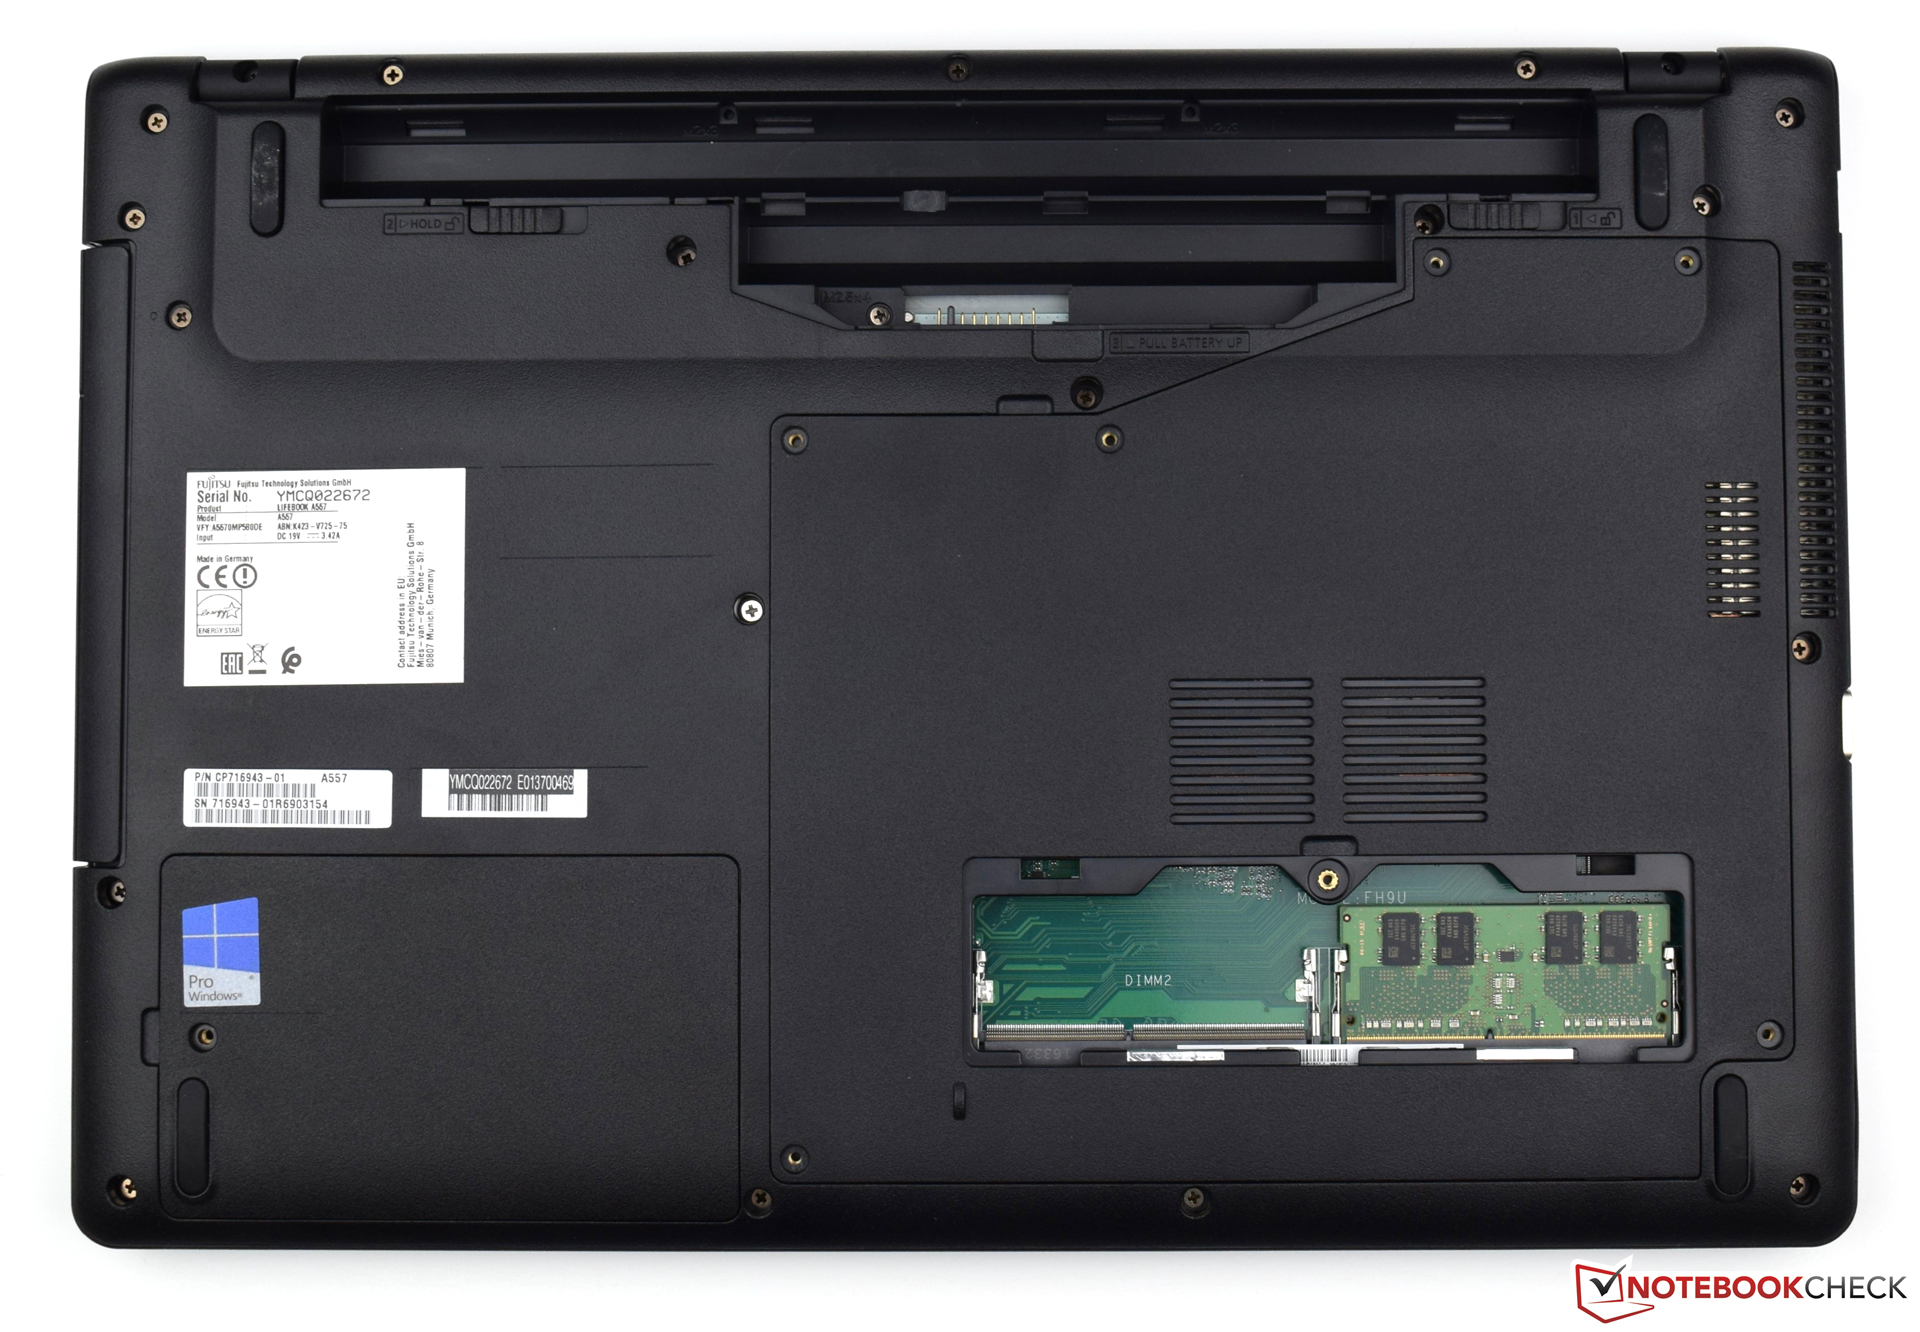
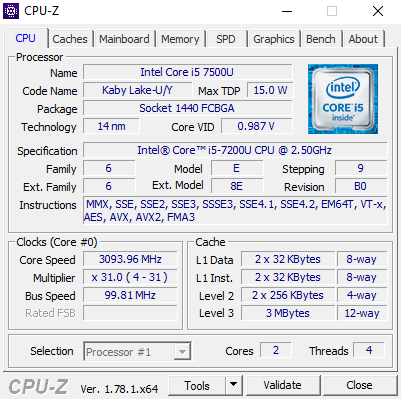
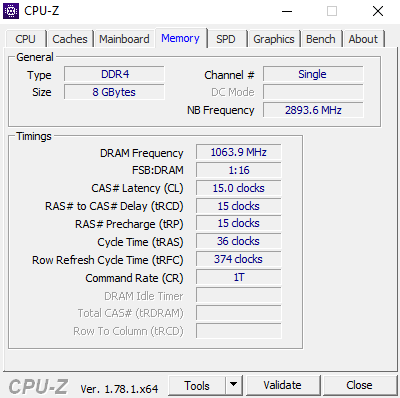
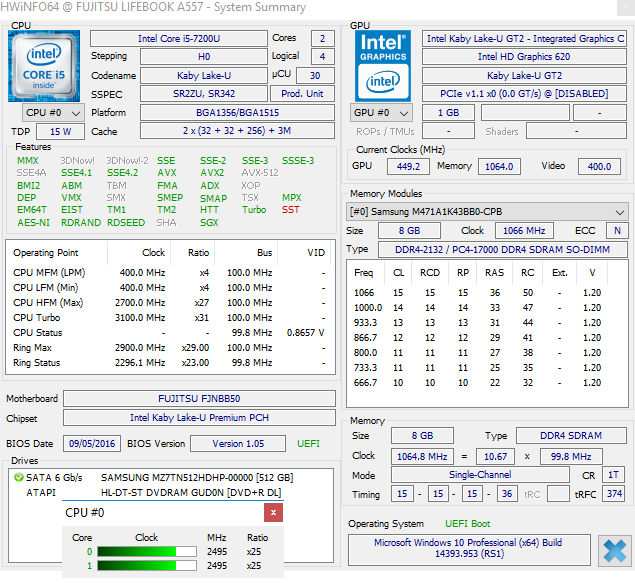
作为较低价的富士通LifeBook A557在市场上非常有吸引力。这款15.6英寸笔记本电脑主要以稳健的系统性能为基础,这将巩固其作为办公系统的部署。到目前为止,英特尔酷睿i5-7200U已经成为一个通用的处理器,能够承担更复杂的任务。拥有8 GB的运行内存,系统配件精良。如果这还不够,那么可以毫无困难地进行升级,因为富士通LifeBook A557的易于维护。512 GB固态硬盘提供了大量的存储空间,并为系统顺畅运行提供了保障。
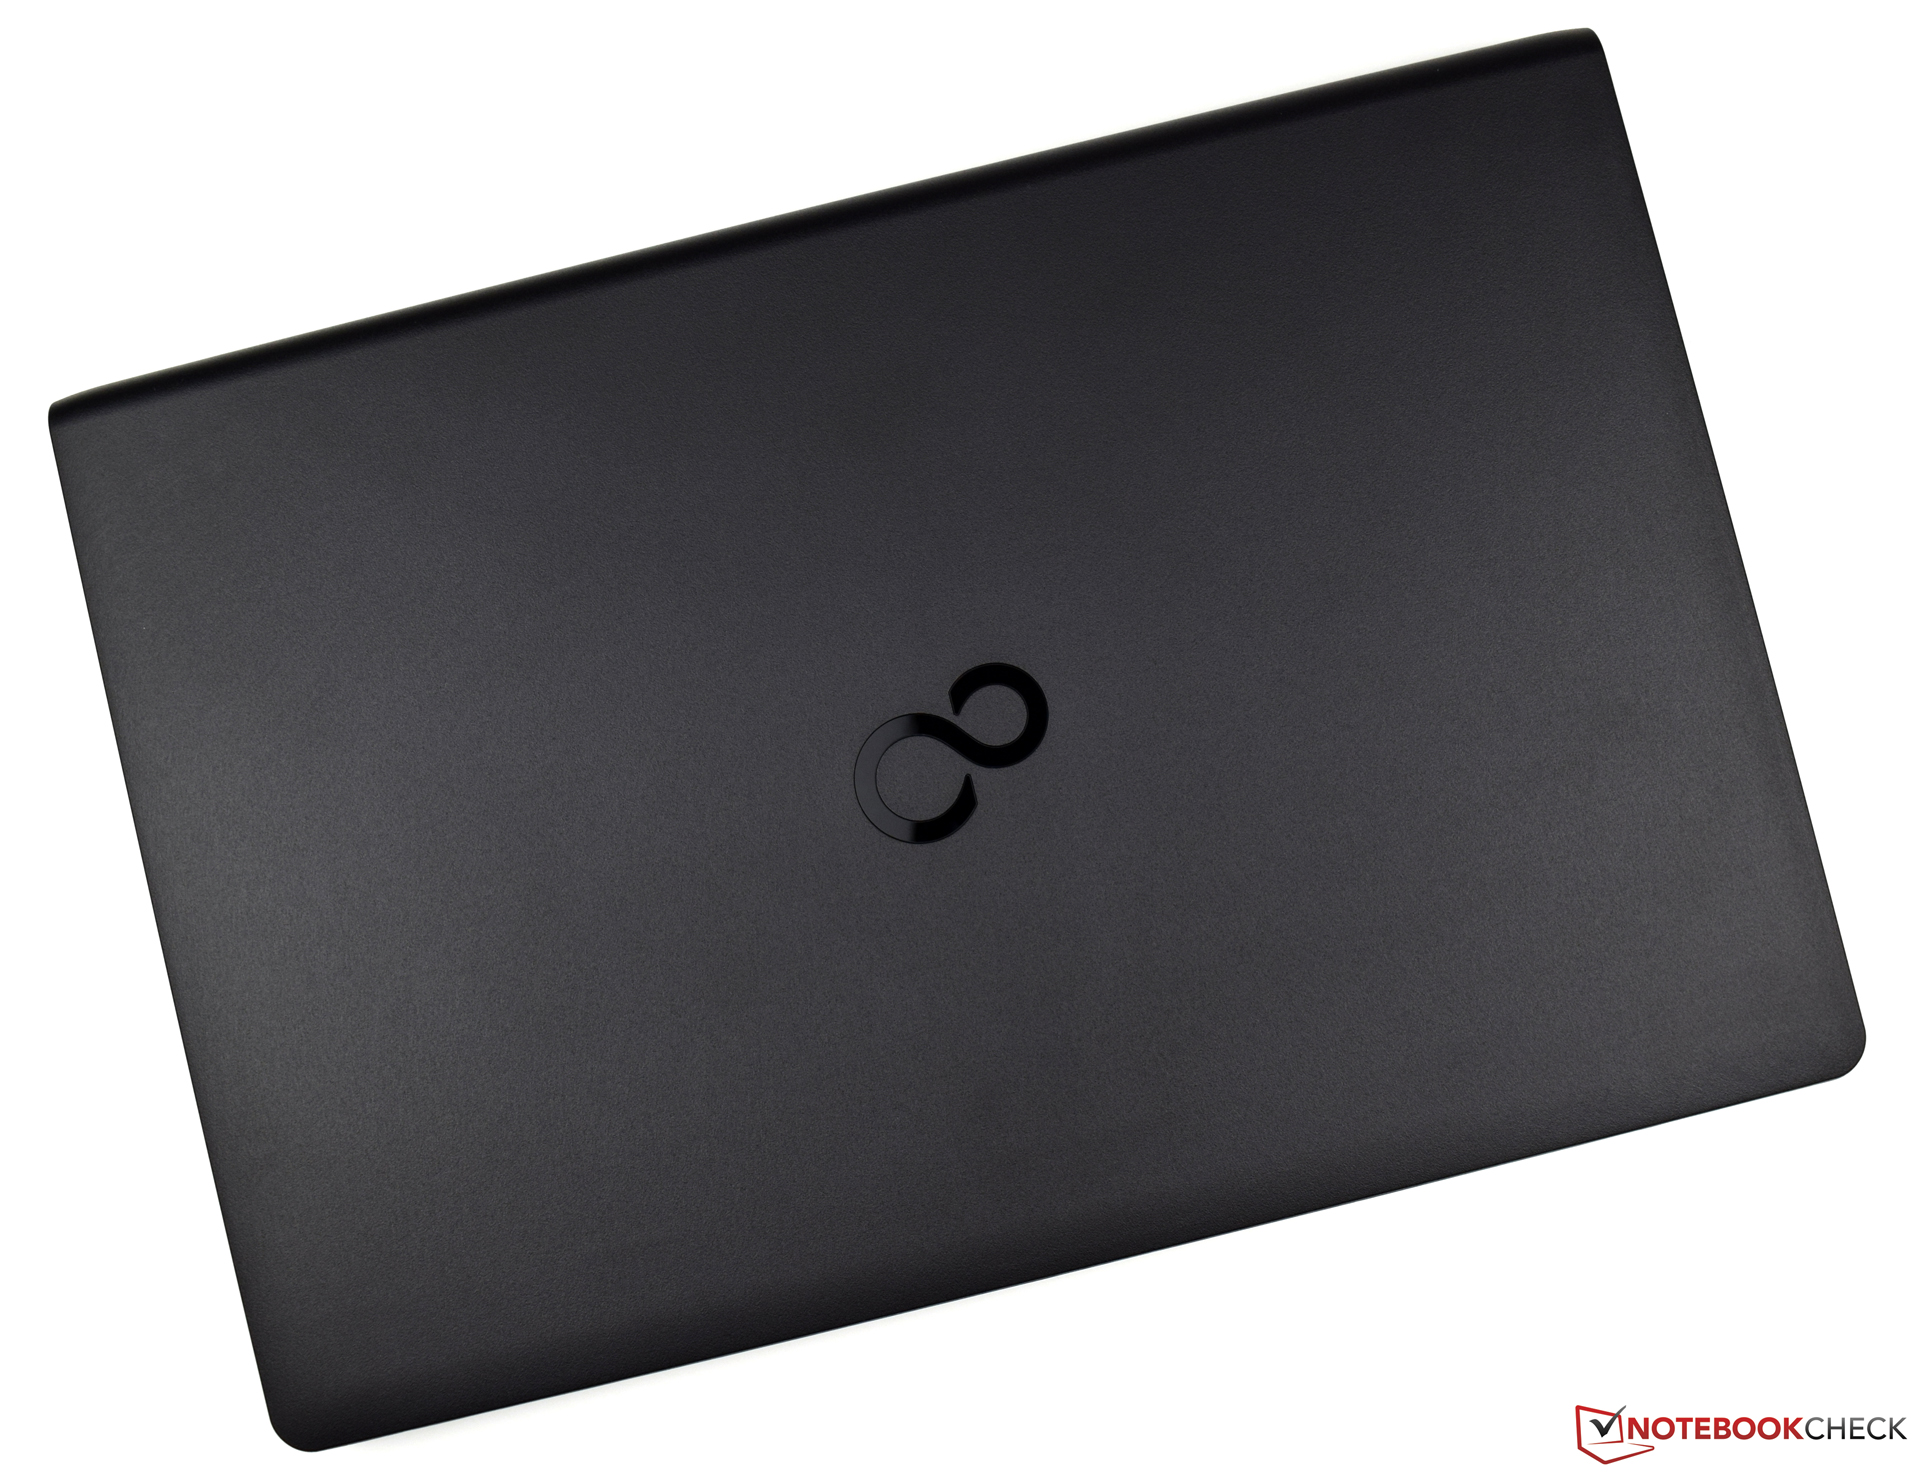
富士通LifeBook A557在低预算情况下提供了不俗的表现。那些对外观设计不看重的人会喜欢富士通LifeBook A557。
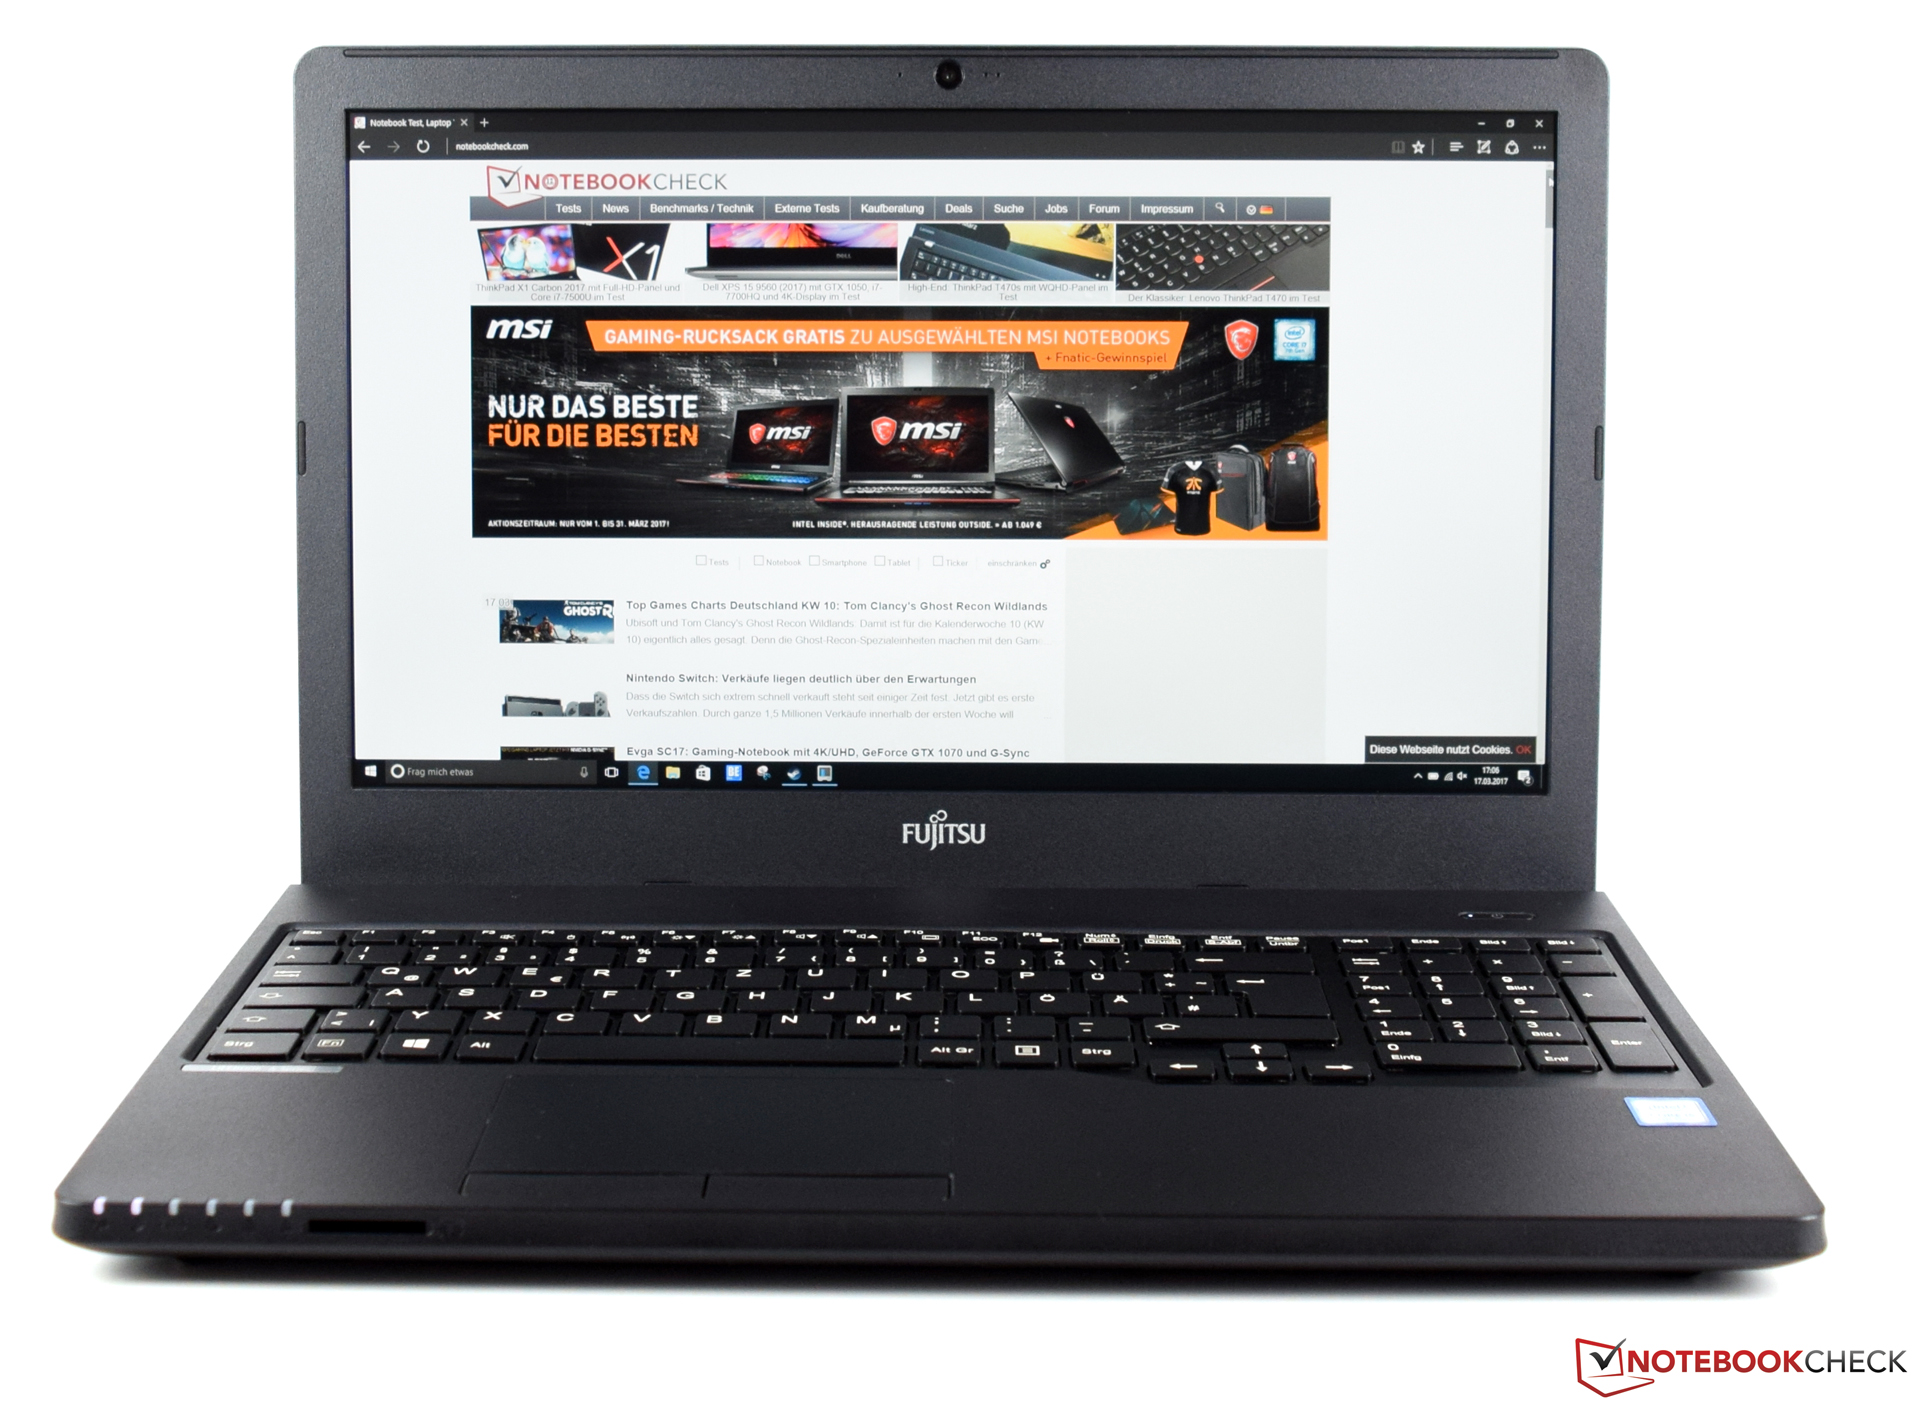
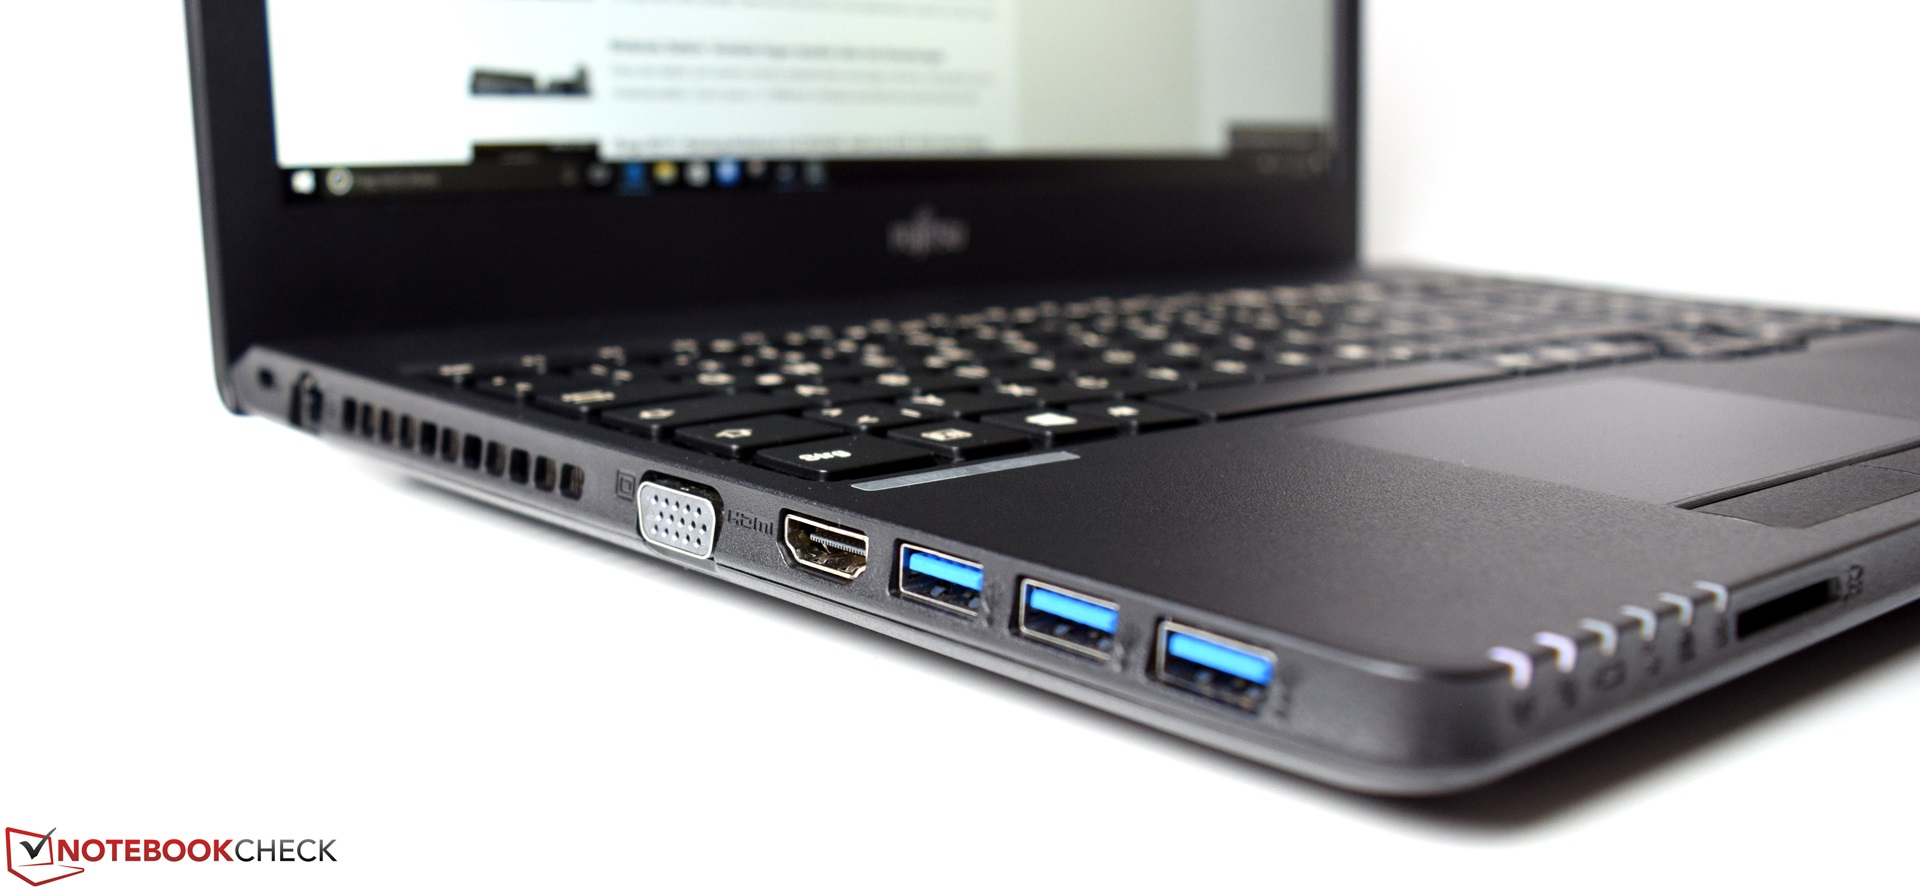
富士通LifeBook A557找不到多少缺点。在视觉上,我们的测试机相当不给力,未来制造商可以它改善噪声污染。同时,我们也希望有一个可选的背光键盘。当然,该机价格为649欧元(约682美元),我们应该接受这个让步。此外,显示器仅提供有限的颜色空间覆盖,尽管其可视角度是令人信服的。富士通LifeBook A557的低功耗也给人留下了积极的印象,从而保证了电池的使用时间。
注:本文是基于完整评测的缩减版本,阅读完整的英文评测,请点击这里。
Fujitsu Lifebook A557
- 03/29/2017 v6 (old)
Sebastian Bade