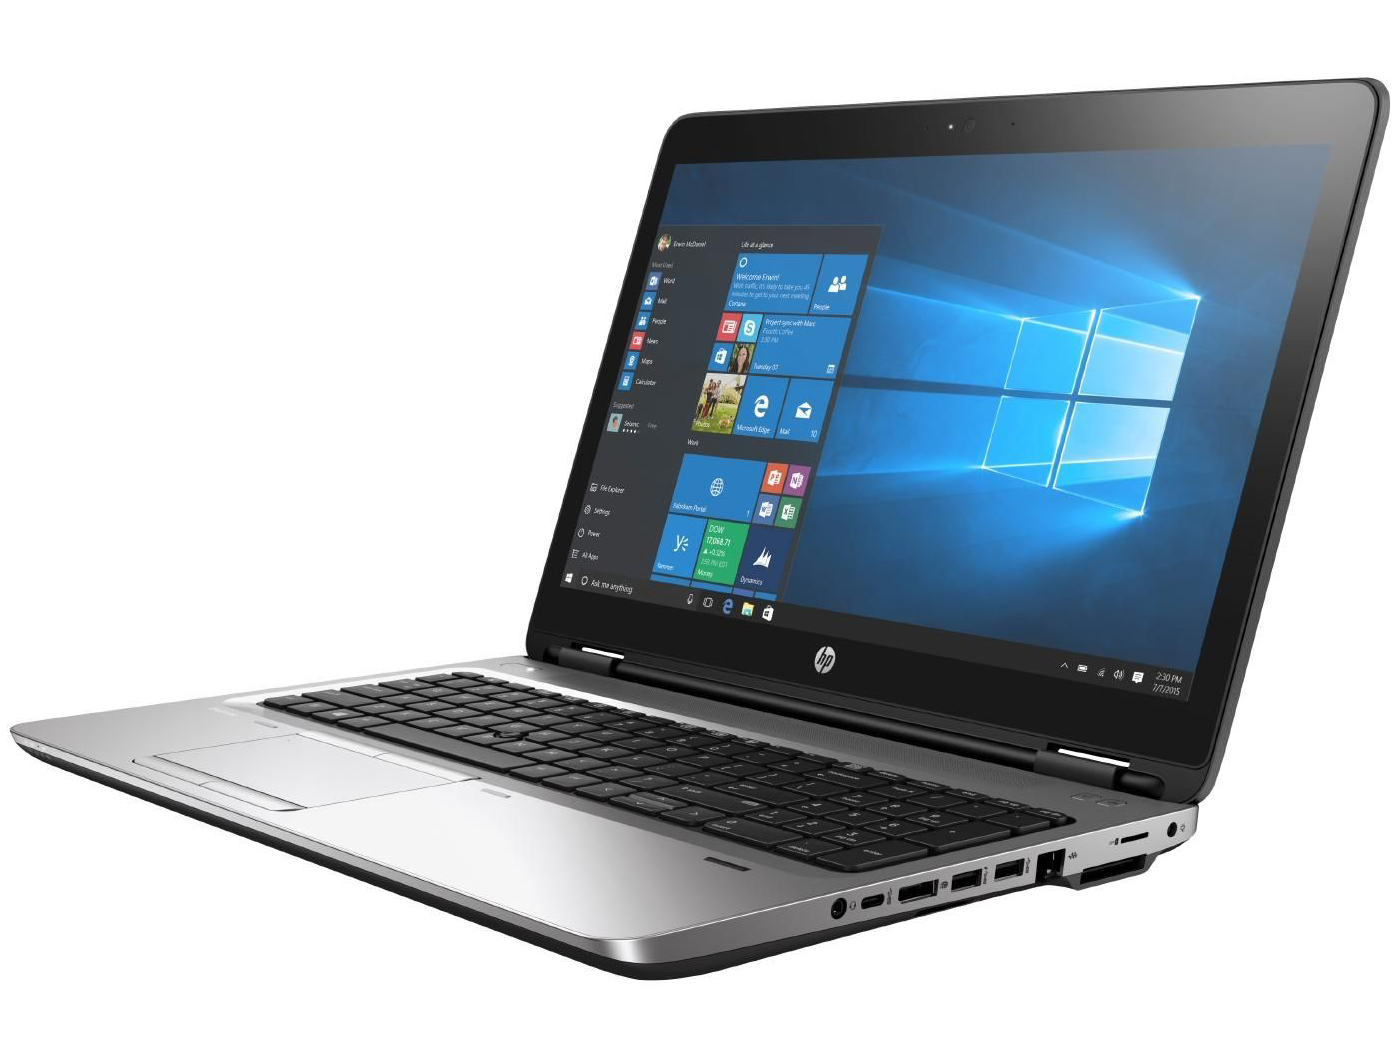
惠普 ProBook 650 G3 Z2W44ET 笔记本电脑简短评测
| SD Card Reader | |
| average JPG Copy Test (av. of 3 runs) | |
| Dell Latitude 15 E5570 | |
| Lenovo ThinkPad L560-20F10026GE | |
| Acer TravelMate P658-M-537B | |
| HP Probook 650 G3 Z2W44ET | |
| HP ProBook 650 G2 V1A44ET | |
| HP ProBook 655 G2 T9X09ET | |
| maximum AS SSD Seq Read Test (1GB) | |
| HP Probook 650 G3 Z2W44ET | |
| Lenovo ThinkPad L560-20F10026GE | |
| Networking | |
| iperf3 transmit AX12 | |
| Apple MacBook Pro 15 2016 (2.6 GHz, 450) (Klaus I211) | |
| HP Probook 650 G3 Z2W44ET (jseb) | |
| iperf3 receive AX12 | |
| Apple MacBook Pro 15 2016 (2.6 GHz, 450) (Klaus I211) | |
| HP Probook 650 G3 Z2W44ET (jseb) | |
| iperf Client (transmit) TCP 1 m | |
| HP ProBook 650 G2 V1A44ET (jseb) | |
| Dell Latitude 15 E5570 | |
| HP ProBook 655 G2 T9X09ET (jseb) | |
| iperf Server (receive) TCP 1 m | |
| HP ProBook 650 G2 V1A44ET (jseb) | |
| HP ProBook 655 G2 T9X09ET (jseb) | |
| Dell Latitude 15 E5570 | |
| |||||||||||||||||||||||||
Brightness Distribution: 95 %
Center on Battery: 355 cd/m²
Contrast: 540:1 (Black: 0.65 cd/m²)
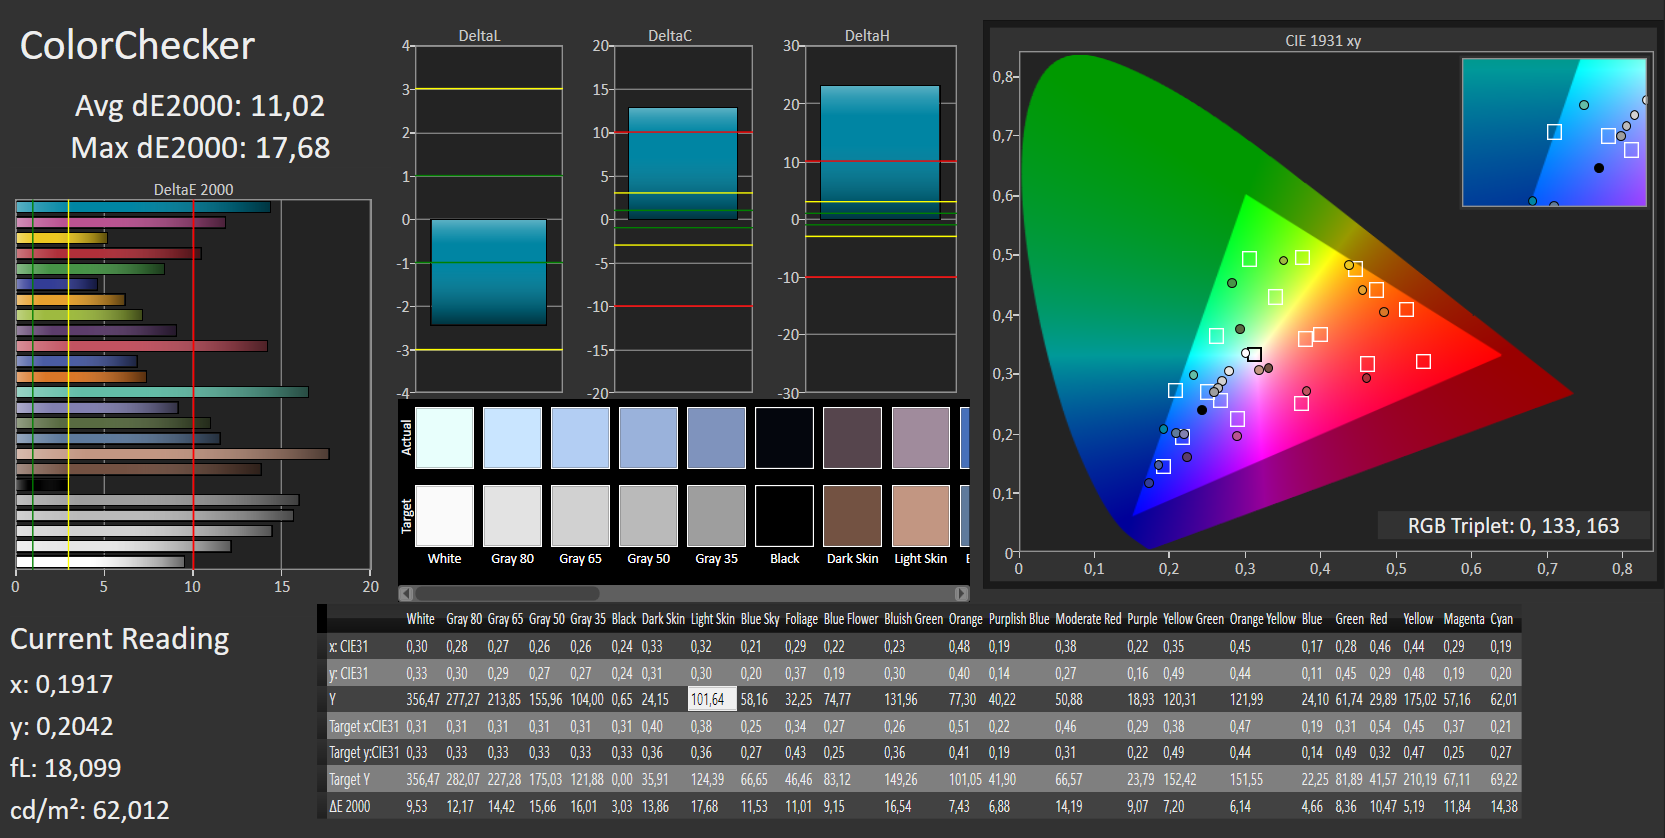
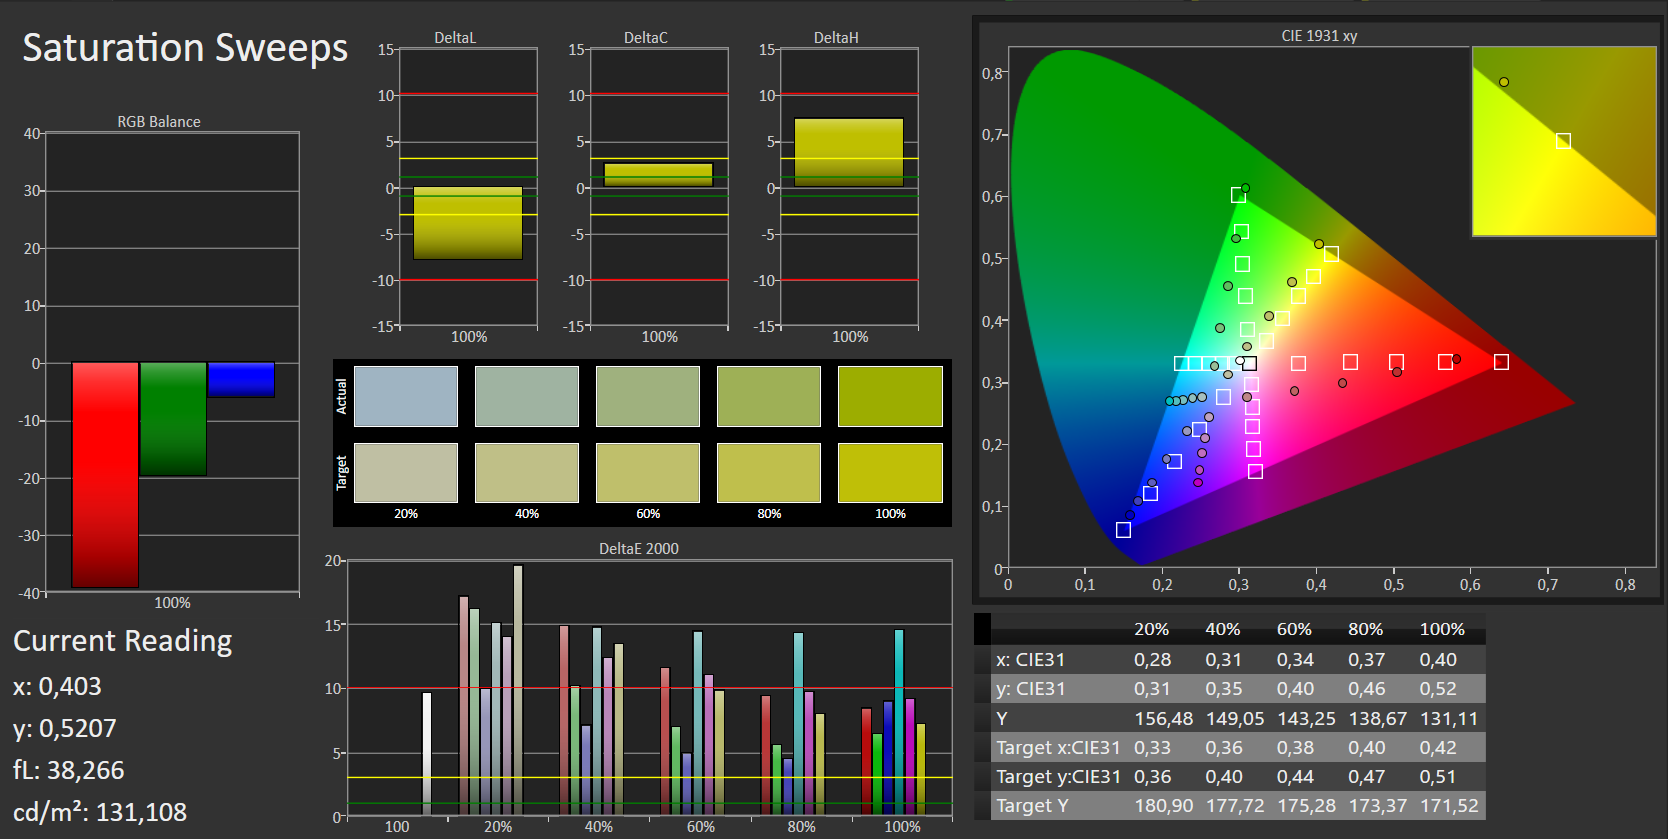
ΔE ColorChecker Calman: 11.02 | ∀{0.5-29.43 Ø4.71}
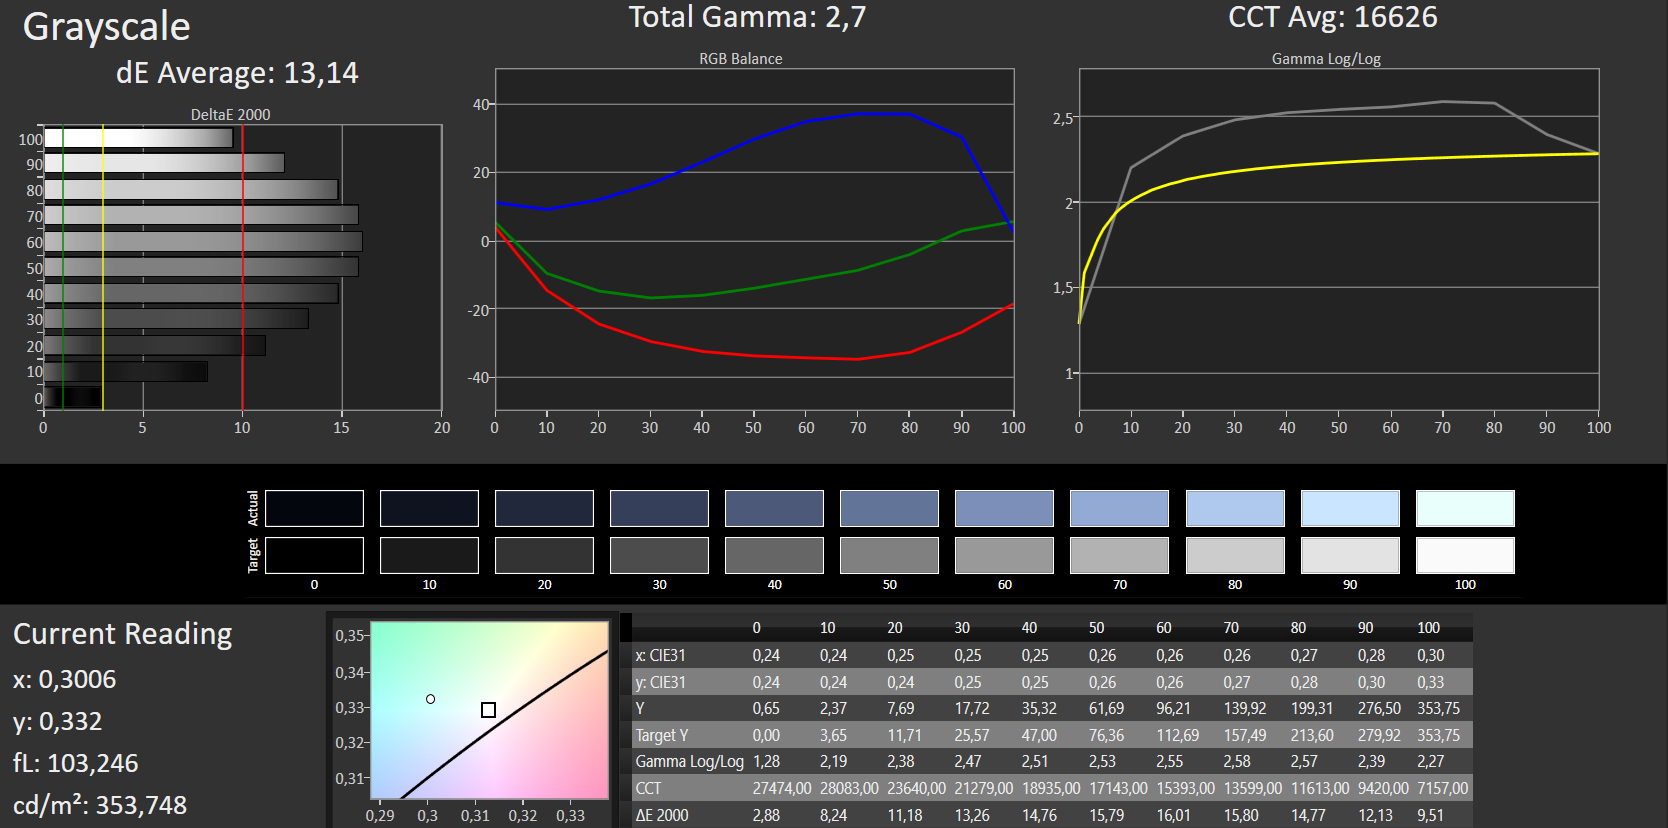
ΔE Greyscale Calman: 13.14 | ∀{0.09-98 Ø4.96}
81% sRGB (Argyll 1.6.3 3D)
52% AdobeRGB 1998 (Argyll 1.6.3 3D)
57% AdobeRGB 1998 (Argyll 3D)
81.1% sRGB (Argyll 3D)
55.2% Display P3 (Argyll 3D)
Gamma: 2.7
CCT: 16626 K
| HP Probook 650 G3 Z2W44ET TN LED, 1920x1080, 15.6" | HP ProBook 650 G2 V1A44ET TN LED, 1920x1080, 15.6" | HP ProBook 655 G2 T9X09ET TN LED, 1366x768, 15.6" | Acer TravelMate P658-M-537B IPS, 1920x1080, 15.6" | Dell Latitude 15 E5570 TN LED, 1366x768, 15.6" | Lenovo ThinkPad L560-20F10026GE AH-IPS, 1920x1080, 15.6" | Apple MacBook Pro 15 2016 (2.6 GHz, 450) IPS, 2880x1800, 15.4" | |
|---|---|---|---|---|---|---|---|
| Display | -5% | -19% | 12% | -26% | -29% | ||
| Display P3 Coverage (%) | 55.2 | 52.1 -6% | 44.49 -19% | 66.6 21% | 40.48 -27% | 39 -29% | |
| sRGB Coverage (%) | 81.1 | 78.3 -3% | 66.9 -18% | 85.7 6% | 60.9 -25% | 58.3 -28% | |
| AdobeRGB 1998 Coverage (%) | 57 | 53.7 -6% | 45.97 -19% | 62.8 10% | 41.82 -27% | 40.33 -29% | |
| Response Times | -4% | -12% | 4% | -12% | -4% | -20% | |
| Response Time Grey 50% / Grey 80% * (ms) | 38 ? | 41 ? -8% | 44 ? -16% | 38 ? -0% | 47 ? -24% | 39.2 ? -3% | 47.3 ? -24% |
| Response Time Black / White * (ms) | 27 ? | 27 ? -0% | 29 ? -7% | 25 ? 7% | 27 ? -0% | 28 ? -4% | 31.2 ? -16% |
| PWM Frequency (Hz) | 200 ? | 200 ? | 200 ? | 117000 ? | |||
| Screen | -6% | -6% | 15% | -10% | 7% | 69% | |
| Brightness middle (cd/m²) | 351 | 313 -11% | 248 -29% | 308 -12% | 228 -35% | 262 -25% | 483 38% |
| Brightness (cd/m²) | 345 | 296 -14% | 230 -33% | 319 -8% | 236 -32% | 250 -28% | 465 35% |
| Brightness Distribution (%) | 95 | 90 -5% | 88 -7% | 71 -25% | 90 -5% | 92 -3% | 92 -3% |
| Black Level * (cd/m²) | 0.65 | 0.59 9% | 0.56 14% | 0.61 6% | 0.56 14% | 0.29 55% | 0.33 49% |
| Contrast (:1) | 540 | 531 -2% | 443 -18% | 505 -6% | 407 -25% | 903 67% | 1464 171% |
| Colorchecker dE 2000 * | 11.02 | 11.89 -8% | 8.7 21% | 4.51 59% | 10.02 9% | 8.49 23% | 1.4 87% |
| Colorchecker dE 2000 max. * | 17.68 | 20.81 -18% | 14.96 15% | 10.19 42% | 15.93 10% | 17.99 -2% | 3 83% |
| Greyscale dE 2000 * | 13.14 | 12.95 1% | 11.48 13% | 2.91 78% | 10.66 19% | 8.11 38% | 1.5 89% |
| Gamma | 2.7 81% | 2.4 92% | 2.38 92% | 2.4 92% | 2.48 89% | 2.37 93% | 2.34 94% |
| CCT | 16626 39% | 15063 43% | 11179 58% | 6740 96% | 11800 55% | 6300 103% | 6650 98% |
| Color Space (Percent of AdobeRGB 1998) (%) | 52 | 50 -4% | 42 -19% | 56 8% | 39 -25% | 37.07 -29% | |
| Color Space (Percent of sRGB) (%) | 81 | 78 -4% | 67 -17% | 86 6% | 61 -25% | 57.94 -28% | |
| Total Average (Program / Settings) | -5% /
-5% | -12% /
-9% | 10% /
13% | -16% /
-13% | -9% /
-2% | 25% /
51% |
* ... smaller is better
Screen Flickering / PWM (Pulse-Width Modulation)
| Screen flickering / PWM detected | 200 Hz | ≤ 50 % brightness setting | 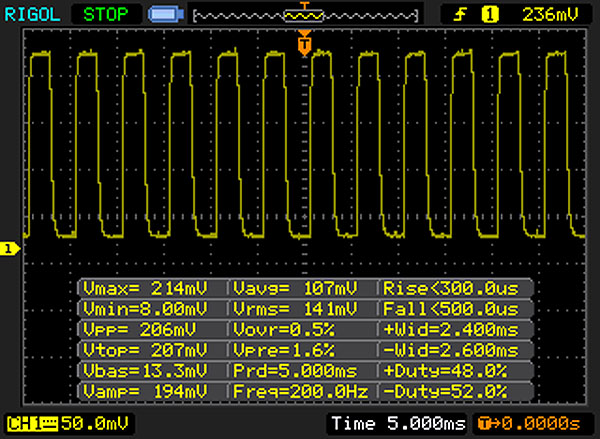 |
The display backlight flickers at 200 Hz (worst case, e.g., utilizing PWM) Flickering detected at a brightness setting of 50 % and below. There should be no flickering or PWM above this brightness setting. The frequency of 200 Hz is relatively low, so sensitive users will likely notice flickering and experience eyestrain at the stated brightness setting and below. In comparison: 52 % of all tested devices do not use PWM to dim the display. If PWM was detected, an average of 7757 (minimum: 5 - maximum: 343500) Hz was measured. | |||
Display Response Times
| ↔ Response Time Black to White | ||
|---|---|---|
| 27 ms ... rise ↗ and fall ↘ combined | ↗ 9 ms rise | 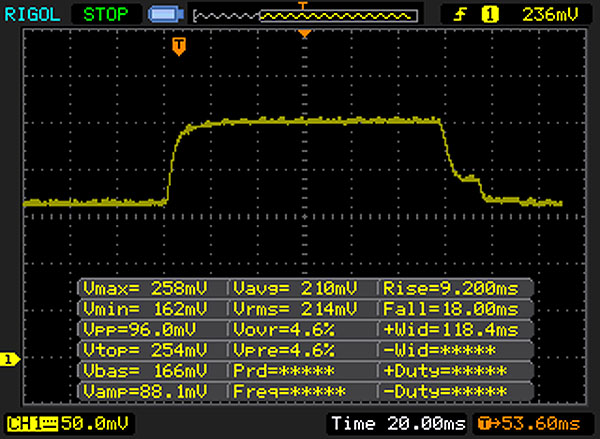 |
| ↘ 18 ms fall | ||
| The screen shows relatively slow response rates in our tests and may be too slow for gamers. In comparison, all tested devices range from 0.1 (minimum) to 240 (maximum) ms. » 67 % of all devices are better. This means that the measured response time is worse than the average of all tested devices (19.8 ms). | ||
| ↔ Response Time 50% Grey to 80% Grey | ||
| 38 ms ... rise ↗ and fall ↘ combined | ↗ 16 ms rise | 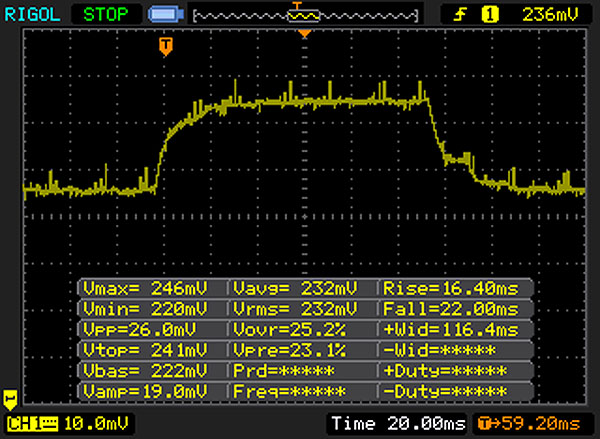 |
| ↘ 22 ms fall | ||
| The screen shows slow response rates in our tests and will be unsatisfactory for gamers. In comparison, all tested devices range from 0.165 (minimum) to 636 (maximum) ms. » 55 % of all devices are better. This means that the measured response time is worse than the average of all tested devices (31 ms). | ||
| Cinebench R15 | |
| CPU Single 64Bit | |
| Apple MacBook Pro 15 2016 (2.6 GHz, 450) | |
| Dell Latitude 15 E5570 | |
| HP Probook 650 G3 Z2W44ET | |
| Lenovo ThinkPad L560-20F10026GE | |
| HP ProBook 650 G2 V1A44ET | |
| Acer TravelMate P658-M-537B | |
| HP ProBook 655 G2 T9X09ET | |
| CPU Multi 64Bit | |
| Apple MacBook Pro 15 2016 (2.6 GHz, 450) | |
| HP Probook 650 G3 Z2W44ET | |
| Dell Latitude 15 E5570 | |
| HP ProBook 650 G2 V1A44ET | |
| Lenovo ThinkPad L560-20F10026GE | |
| Acer TravelMate P658-M-537B | |
| HP ProBook 655 G2 T9X09ET | |
| Cinebench R10 | |
| Rendering Multiple CPUs 32Bit | |
| HP Probook 650 G3 Z2W44ET | |
| Dell Latitude 15 E5570 | |
| Lenovo ThinkPad L560-20F10026GE | |
| HP ProBook 650 G2 V1A44ET | |
| HP ProBook 655 G2 T9X09ET | |
| Rendering Single 32Bit | |
| HP Probook 650 G3 Z2W44ET | |
| Dell Latitude 15 E5570 | |
| Lenovo ThinkPad L560-20F10026GE | |
| HP ProBook 650 G2 V1A44ET | |
| HP ProBook 655 G2 T9X09ET | |
| Geekbench 3 | |
| 32 Bit Single-Core Score | |
| Dell Latitude 15 E5570 | |
| HP Probook 650 G3 Z2W44ET | |
| HP ProBook 650 G2 V1A44ET | |
| HP ProBook 655 G2 T9X09ET | |
| 32 Bit Multi-Core Score | |
| HP Probook 650 G3 Z2W44ET | |
| Dell Latitude 15 E5570 | |
| HP ProBook 650 G2 V1A44ET | |
| HP ProBook 655 G2 T9X09ET | |
| Geekbench 4.0 | |
| 64 Bit Single-Core Score | |
| Apple MacBook Pro 15 2016 (2.6 GHz, 450) | |
| HP Probook 650 G3 Z2W44ET | |
| HP ProBook 655 G2 T9X09ET | |
| 64 Bit Multi-Core Score | |
| Apple MacBook Pro 15 2016 (2.6 GHz, 450) | |
| HP Probook 650 G3 Z2W44ET | |
| HP ProBook 655 G2 T9X09ET | |
| JetStream 1.1 - 1.1 Total | |
| Apple MacBook Pro 15 2016 (2.6 GHz, 450) | |
| HP Probook 650 G3 Z2W44ET | |
| Dell Latitude 15 E5570 | |
| HP ProBook 650 G2 V1A44ET | |
| Lenovo ThinkPad L560-20F10026GE | |
| HP ProBook 655 G2 T9X09ET | |
| PCMark 7 Score | 3124 points | |
| PCMark 8 Home Score Accelerated v2 | 3149 points | |
| PCMark 8 Creative Score Accelerated v2 | 3741 points | |
| PCMark 8 Work Score Accelerated v2 | 4118 points | |
Help | ||
| PCMark 8 | |
| Home Score Accelerated v2 | |
| Apple MacBook Pro 15 2016 (2.6 GHz, 450) | |
| Acer TravelMate P658-M-537B | |
| Dell Latitude 15 E5570 | |
| HP ProBook 650 G2 V1A44ET | |
| HP Probook 650 G3 Z2W44ET | |
| Lenovo ThinkPad L560-20F10026GE | |
| HP ProBook 655 G2 T9X09ET | |
| Work Score Accelerated v2 | |
| Acer TravelMate P658-M-537B | |
| Apple MacBook Pro 15 2016 (2.6 GHz, 450) | |
| Dell Latitude 15 E5570 | |
| HP Probook 650 G3 Z2W44ET | |
| Lenovo ThinkPad L560-20F10026GE | |
| HP ProBook 655 G2 T9X09ET | |

| HP Probook 650 G3 Z2W44ET Hitachi Travelstar Z7K500 HTS725050A7E630 | HP ProBook 655 G2 T9X09ET Seagate ST500LM021-1KJ15 | Acer TravelMate P658-M-537B Kingston RBU-SNS8152S3256GG2 | Dell Latitude 15 E5570 Samsung SSD PM871 MZ7LN128HCHP | Lenovo ThinkPad L560-20F10026GE WDC Slim WD10SPCX-21KHST0 | |
|---|---|---|---|---|---|
| CrystalDiskMark 3.0 | 12% | 8793% | 10223% | 42% | |
| Read Seq (MB/s) | 109.4 | 122.1 12% | 479.1 338% | 474.7 334% | 113.6 4% |
| Write Seq (MB/s) | 99.9 | 110.7 11% | 333.1 233% | 155 55% | 111.7 12% |
| Read 512 (MB/s) | 16.34 | 33.53 105% | 418 2458% | 393.6 2309% | 39.65 143% |
| Write 512 (MB/s) | 43.45 | 51.3 18% | 320.5 638% | 119.7 175% | 55.3 27% |
| Read 4k (MB/s) | 0.337 | 0.357 6% | 25.66 7514% | 34 9989% | 0.488 45% |
| Write 4k (MB/s) | 0.866 | 0.641 -26% | 64.7 7371% | 96.6 11055% | 1.022 18% |
| Read 4k QD32 (MB/s) | 0.826 | 0.778 -6% | 226.2 27285% | 383.3 46304% | 1.367 65% |
| Write 4k QD32 (MB/s) | 0.859 | 0.672 -22% | 211.4 24510% | 100.2 11565% | 1.036 21% |
| 3DMark 06 Standard Score | 6656 points | |
| 3DMark 11 Performance | 1359 points | |
| 3DMark Ice Storm Standard Score | 46690 points | |
| 3DMark Cloud Gate Standard Score | 5064 points | |
| 3DMark Fire Strike Score | 600 points | |
Help | ||
| 3DMark 11 - 1280x720 Performance GPU | |
| Apple MacBook Pro 15 2016 (2.6 GHz, 450) | |
| HP ProBook 655 G2 T9X09ET | |
| Acer TravelMate P658-M-537B | |
| HP Probook 650 G3 Z2W44ET | |
| Dell Latitude 15 E5570 | |
| Lenovo ThinkPad L560-20F10026GE | |
| HP ProBook 650 G2 V1A44ET | |
| 3DMark | |
| 1280x720 Cloud Gate Standard Graphics | |
| Apple MacBook Pro 15 2016 (2.6 GHz, 450) | |
| Acer TravelMate P658-M-537B | |
| Dell Latitude 15 E5570 | |
| Lenovo ThinkPad L560-20F10026GE | |
| HP Probook 650 G3 Z2W44ET | |
| 1920x1080 Fire Strike Graphics | |
| Apple MacBook Pro 15 2016 (2.6 GHz, 450) | |
| Dell Latitude 15 E5570 | |
| Lenovo ThinkPad L560-20F10026GE | |
| HP Probook 650 G3 Z2W44ET | |
| low | med. | high | ultra | |
|---|---|---|---|---|
| Tomb Raider (2013) | 52.1 | 26.2 | 14.4 | 9.6 |
| BioShock Infinite (2013) | 32.9 | 20.1 | 16.1 | 6.9 |
| Battlefield 4 (2013) | 24.4 | 19.3 | 12.2 | 6.1 |
Noise level
| Idle |
| 31.5 / 31.5 / 31.5 dB(A) |
| HDD |
| 32 dB(A) |
| DVD |
| 36.7 / dB(A) |
| Load |
| 34.6 / 33.3 dB(A) |
 | ||
30 dB silent 40 dB(A) audible 50 dB(A) loud |
||
min: | ||
| HP Probook 650 G3 Z2W44ET i5-7200U, HD Graphics 620 | HP ProBook 650 G2 V1A44ET 6200U, HD Graphics 520 | HP ProBook 655 G2 T9X09ET Pro A8-8600B, Radeon R6 (Carrizo) | Acer TravelMate P658-M-537B 6200U, HD Graphics 520 | Dell Latitude 15 E5570 6300U, HD Graphics 520 | Lenovo ThinkPad L560-20F10026GE 6200U, HD Graphics 520 | Apple MacBook Pro 15 2016 (2.6 GHz, 450) 6700HQ, Radeon Pro 450 | |
|---|---|---|---|---|---|---|---|
| Noise | -0% | -0% | -9% | -4% | 3% | -5% | |
| off / environment * (dB) | 30.7 | 30.5 1% | 31.5 -3% | 31.2 -2% | 31.2 -2% | 29.4 4% | 30.4 1% |
| Idle Minimum * (dB) | 31.5 | 30.5 3% | 31.6 -0% | 32.5 -3% | 31.2 1% | 30.1 4% | 30.6 3% |
| Idle Average * (dB) | 31.5 | 31.6 -0% | 31.6 -0% | 32.5 -3% | 33.2 -5% | 30.1 4% | 30.6 3% |
| Idle Maximum * (dB) | 31.5 | 31.9 -1% | 31.6 -0% | 35 -11% | 34.3 -9% | 30.1 4% | 30.6 3% |
| Load Average * (dB) | 34.6 | 34.7 -0% | 33.5 3% | 42 -21% | 36.6 -6% | 33.4 3% | 34.7 -0% |
| Load Maximum * (dB) | 33.3 | 34.5 -4% | 33.5 -1% | 37.5 -13% | 34.7 -4% | 34.7 -4% | 46.3 -39% |
* ... smaller is better
(+) The maximum temperature on the upper side is 31.9 °C / 89 F, compared to the average of 34.3 °C / 94 F, ranging from 21.2 to 62.5 °C for the class Office.
(+) The bottom heats up to a maximum of 32.1 °C / 90 F, compared to the average of 36.8 °C / 98 F
(+) In idle usage, the average temperature for the upper side is 22.1 °C / 72 F, compared to the device average of 29.5 °C / 85 F.
(+) The palmrests and touchpad are cooler than skin temperature with a maximum of 25.6 °C / 78.1 F and are therefore cool to the touch.
(±) The average temperature of the palmrest area of similar devices was 27.5 °C / 81.5 F (+1.9 °C / 3.4 F).
| HP Probook 650 G3 Z2W44ET i5-7200U, HD Graphics 620 | HP ProBook 650 G2 V1A44ET 6200U, HD Graphics 520 | HP ProBook 655 G2 T9X09ET Pro A8-8600B, Radeon R6 (Carrizo) | Acer TravelMate P658-M-537B 6200U, HD Graphics 520 | Dell Latitude 15 E5570 6300U, HD Graphics 520 | Lenovo ThinkPad L560-20F10026GE 6200U, HD Graphics 520 | Apple MacBook Pro 15 2016 (2.6 GHz, 450) 6700HQ, Radeon Pro 450 | |
|---|---|---|---|---|---|---|---|
| Heat | -26% | -26% | -17% | -36% | -23% | -18% | |
| Maximum Upper Side * (°C) | 31.9 | 39.6 -24% | 35.8 -12% | 35.2 -10% | 37.3 -17% | 37.2 -17% | 43 -35% |
| Maximum Bottom * (°C) | 32.1 | 41.8 -30% | 37.6 -17% | 38 -18% | 41.5 -29% | 36 -12% | 40 -25% |
| Idle Upper Side * (°C) | 23.5 | 31.6 -34% | 33.4 -42% | 29.5 -26% | 34.2 -46% | 30.7 -31% | 26 -11% |
| Idle Bottom * (°C) | 25.3 | 29.7 -17% | 33.2 -31% | 29 -15% | 38.8 -53% | 32.8 -30% | 25 1% |
* ... smaller is better
HP Probook 650 G3 Z2W44ET audio analysis
(-) | not very loud speakers (68 dB)
Bass 100 - 315 Hz
(±) | reduced bass - on average 14.6% lower than median
(±) | linearity of bass is average (7.3% delta to prev. frequency)
Mids 400 - 2000 Hz
(+) | balanced mids - only 3% away from median
(+) | mids are linear (4.5% delta to prev. frequency)
Highs 2 - 16 kHz
(±) | higher highs - on average 8.5% higher than median
(±) | linearity of highs is average (7.6% delta to prev. frequency)
Overall 100 - 16.000 Hz
(±) | linearity of overall sound is average (21% difference to median)
Compared to same class
» 50% of all tested devices in this class were better, 10% similar, 41% worse
» The best had a delta of 7%, average was 21%, worst was 53%
Compared to all devices tested
» 58% of all tested devices were better, 7% similar, 35% worse
» The best had a delta of 4%, average was 23%, worst was 134%
Apple MacBook 12 (Early 2016) 1.1 GHz audio analysis
(+) | speakers can play relatively loud (83.6 dB)
Bass 100 - 315 Hz
(±) | reduced bass - on average 11.3% lower than median
(±) | linearity of bass is average (14.2% delta to prev. frequency)
Mids 400 - 2000 Hz
(+) | balanced mids - only 2.4% away from median
(+) | mids are linear (5.5% delta to prev. frequency)
Highs 2 - 16 kHz
(+) | balanced highs - only 2% away from median
(+) | highs are linear (4.5% delta to prev. frequency)
Overall 100 - 16.000 Hz
(+) | overall sound is linear (10.2% difference to median)
Compared to same class
» 7% of all tested devices in this class were better, 2% similar, 90% worse
» The best had a delta of 5%, average was 18%, worst was 53%
Compared to all devices tested
» 5% of all tested devices were better, 1% similar, 94% worse
» The best had a delta of 4%, average was 23%, worst was 134%
| Off / Standby | |
| Idle | |
| Load |
|
Key:
min: | |
| HP Probook 650 G3 Z2W44ET i5-7200U, HD Graphics 620 | HP ProBook 650 G2 V1A44ET 6200U, HD Graphics 520 | HP ProBook 655 G2 T9X09ET Pro A8-8600B, Radeon R6 (Carrizo) | Acer TravelMate P658-M-537B 6200U, HD Graphics 520 | Dell Latitude 15 E5570 6300U, HD Graphics 520 | Lenovo ThinkPad L560-20F10026GE 6200U, HD Graphics 520 | Apple MacBook Pro 15 2016 (2.6 GHz, 450) 6700HQ, Radeon Pro 450 | |
|---|---|---|---|---|---|---|---|
| Power Consumption | 2% | -16% | -46% | -7% | -13% | -77% | |
| Idle Minimum * (Watt) | 4 | 3.4 15% | 5.8 -45% | 6.6 -65% | 4.5 -13% | 5 -25% | 2.9 27% |
| Idle Average * (Watt) | 6.9 | 7.5 -9% | 7.5 -9% | 10.4 -51% | 7.6 -10% | 7.9 -14% | 9.7 -41% |
| Idle Maximum * (Watt) | 7.6 | 7.6 -0% | 8.6 -13% | 12.7 -67% | 8.7 -14% | 8.6 -13% | 10.1 -33% |
| Load Average * (Watt) | 29 | 28.4 2% | 31 -7% | 36 -24% | 28.5 2% | 27.5 5% | 65 -124% |
| Load Maximum * (Watt) | 28.7 | 28.4 1% | 30.5 -6% | 35 -22% | 29.2 -2% | 33.7 -17% | 89.5 -212% |
* ... smaller is better
| HP Probook 650 G3 Z2W44ET i5-7200U, HD Graphics 620, 48 Wh | HP ProBook 650 G2-T9X61ET 6200U, HD Graphics 520, 48 Wh | HP ProBook 650 G2 V1A44ET 6200U, HD Graphics 520, 48 Wh | HP ProBook 655 G2 T9X09ET Pro A8-8600B, Radeon R6 (Carrizo), 48 Wh | Acer TravelMate P658-M-537B 6200U, HD Graphics 520, 55 Wh | Dell Latitude 15 E5570 6300U, HD Graphics 520, 62 Wh | Lenovo ThinkPad L560-20F10026GE 6200U, HD Graphics 520, 48 Wh | Apple MacBook Pro 15 2016 (2.6 GHz, 450) 6700HQ, Radeon Pro 450, 76 Wh | |
|---|---|---|---|---|---|---|---|---|
| Battery runtime | -9% | -9% | -53% | -4% | 30% | -23% | -5% | |
| Reader / Idle (h) | 12.8 | 11.5 -10% | 14 9% | 20.5 60% | 11.6 -9% | |||
| H.264 (h) | 6.7 | 6.4 -4% | 9.5 42% | 4.6 -31% | 8.6 28% | |||
| WiFi v1.3 (h) | 7.8 | 6.8 -13% | 7.1 -9% | 3.7 -53% | 8.5 9% | 10.5 35% | 6.8 -13% | 10 28% |
| Load (h) | 3 | 2.7 -10% | 2.1 -30% | 2.5 -17% | 1.8 -40% | 0.9 -70% |
Pros
Cons
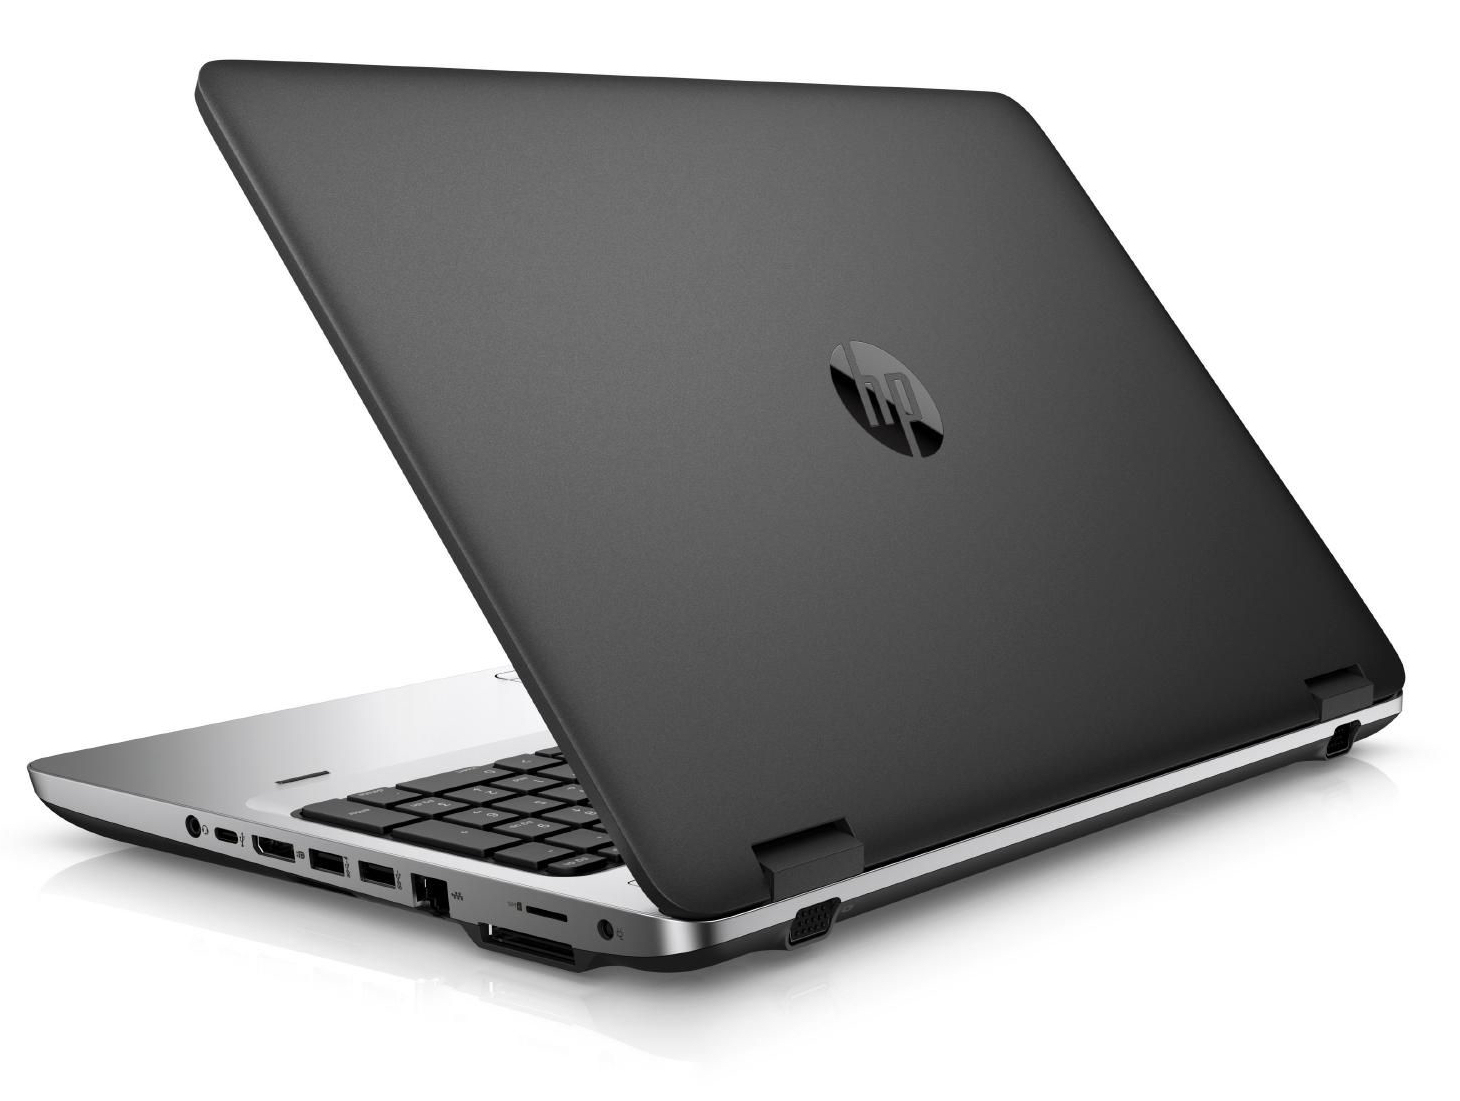
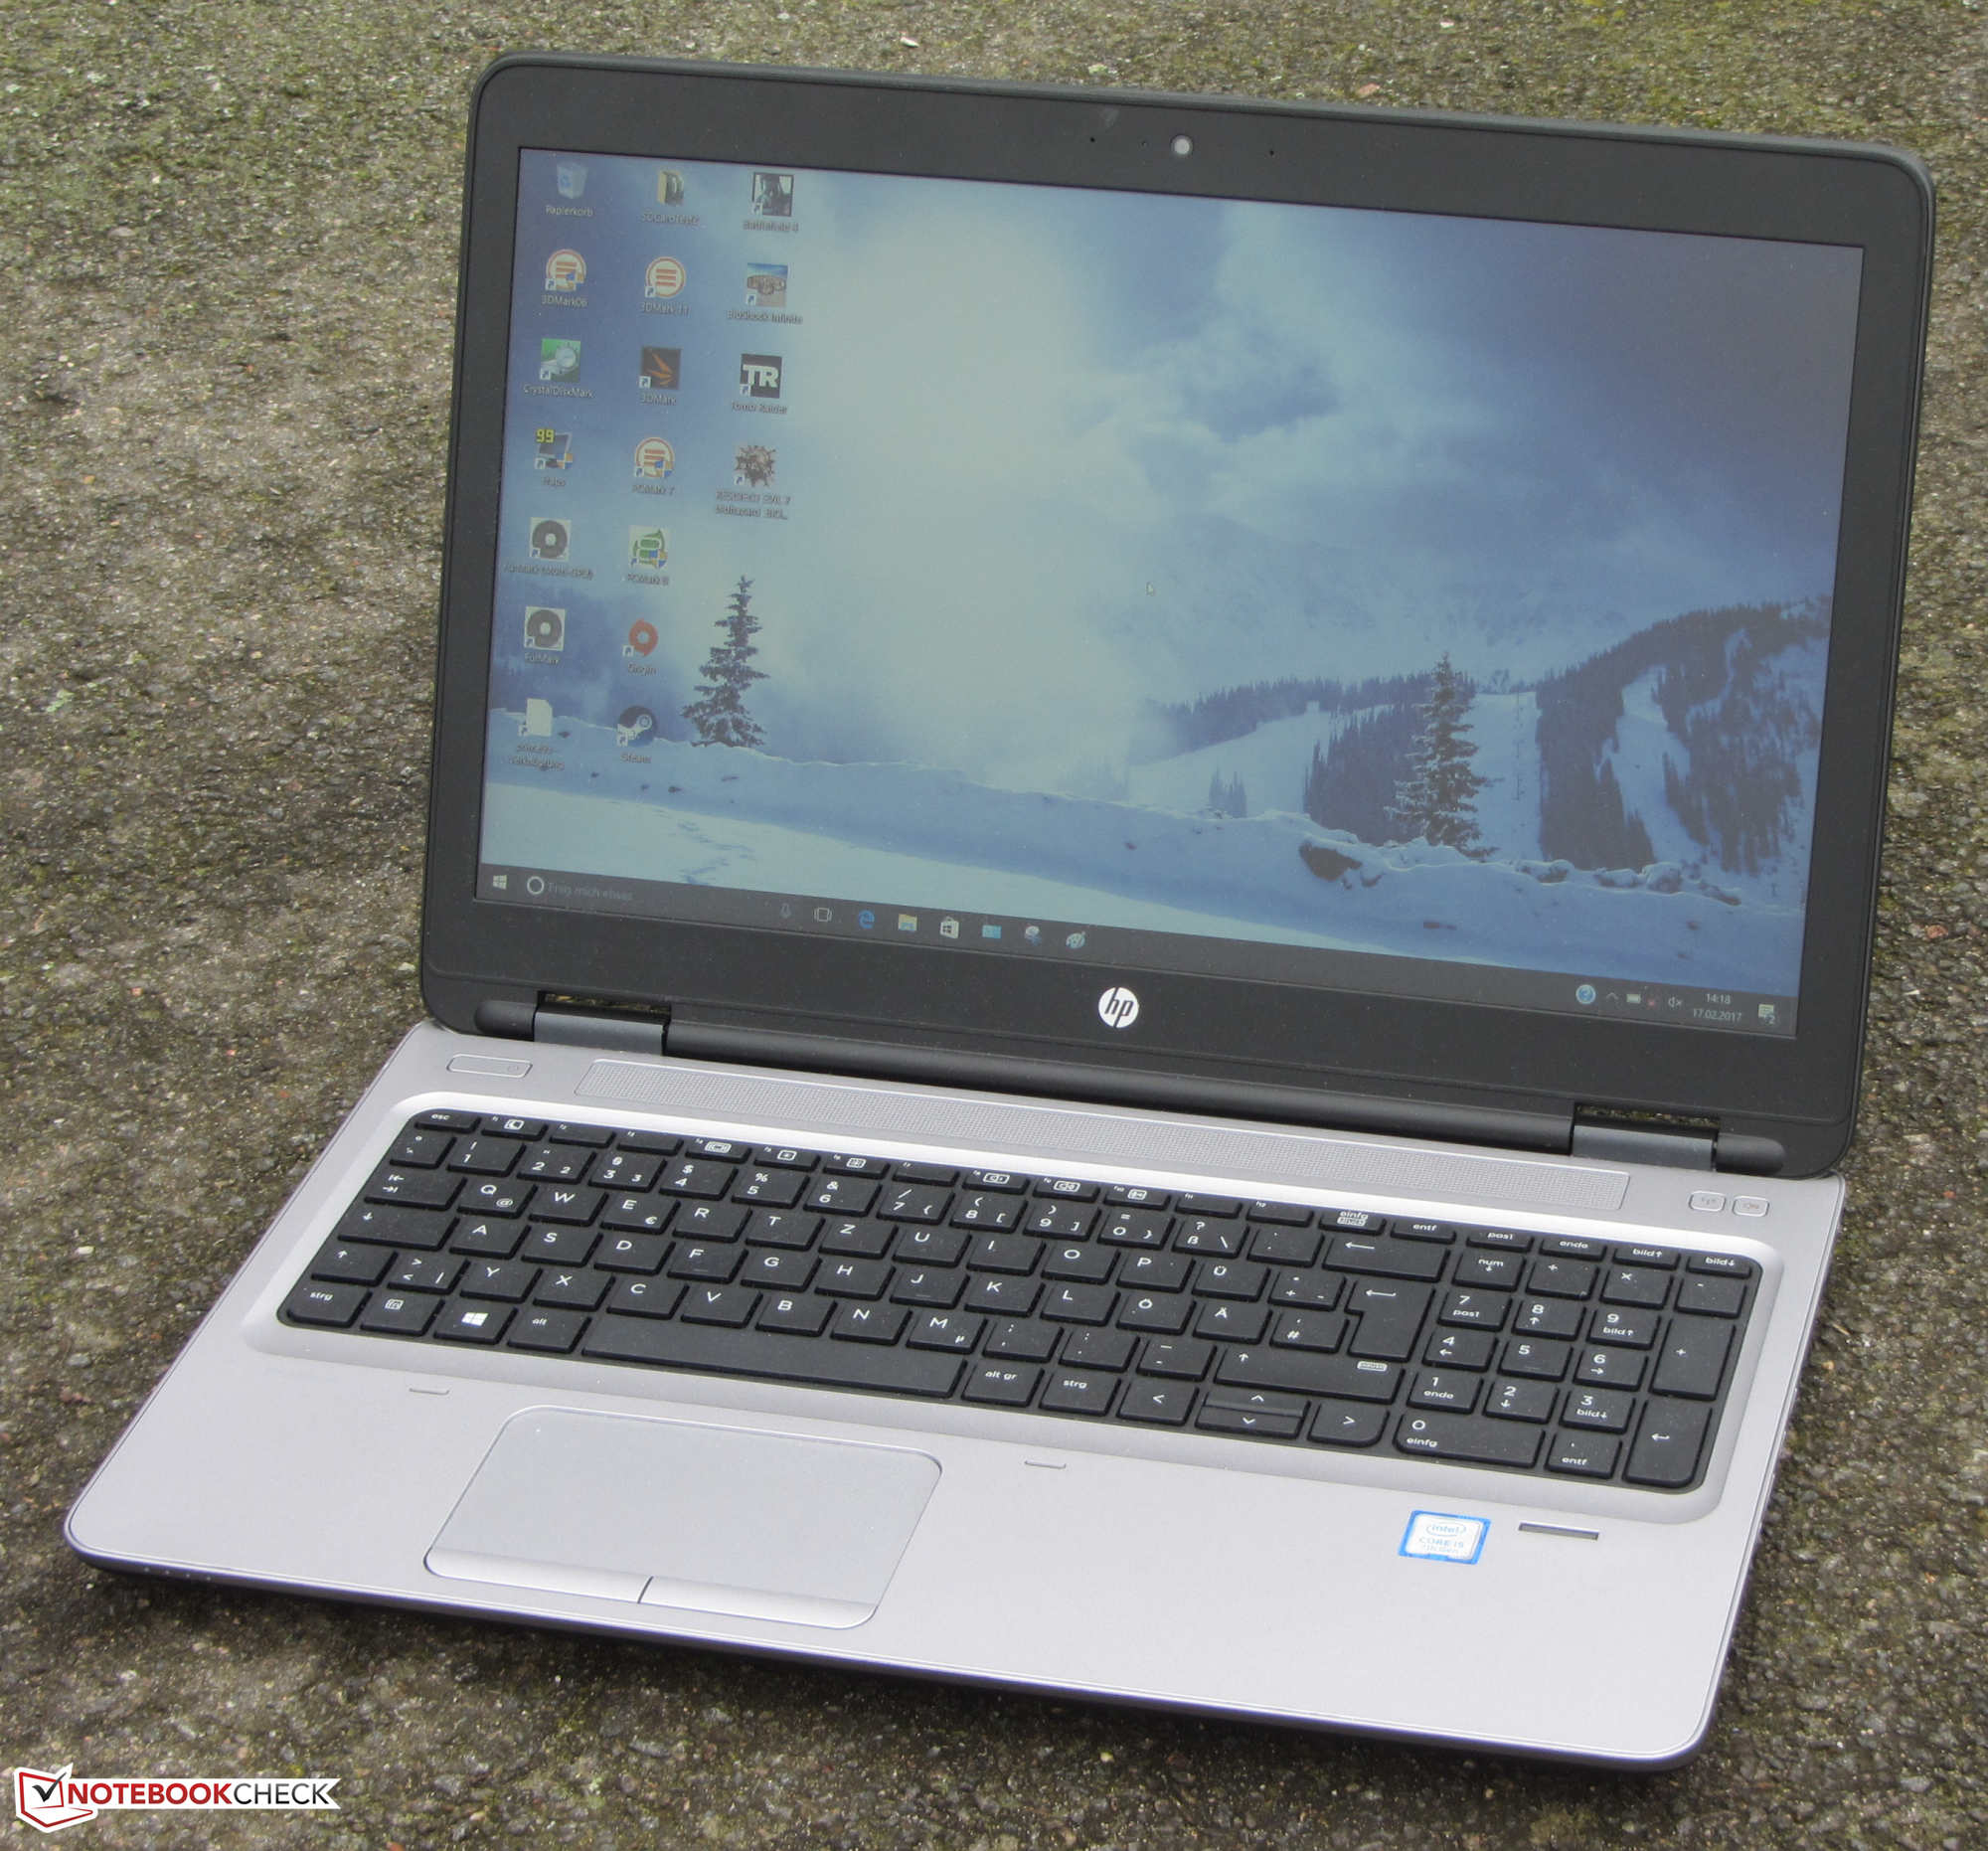
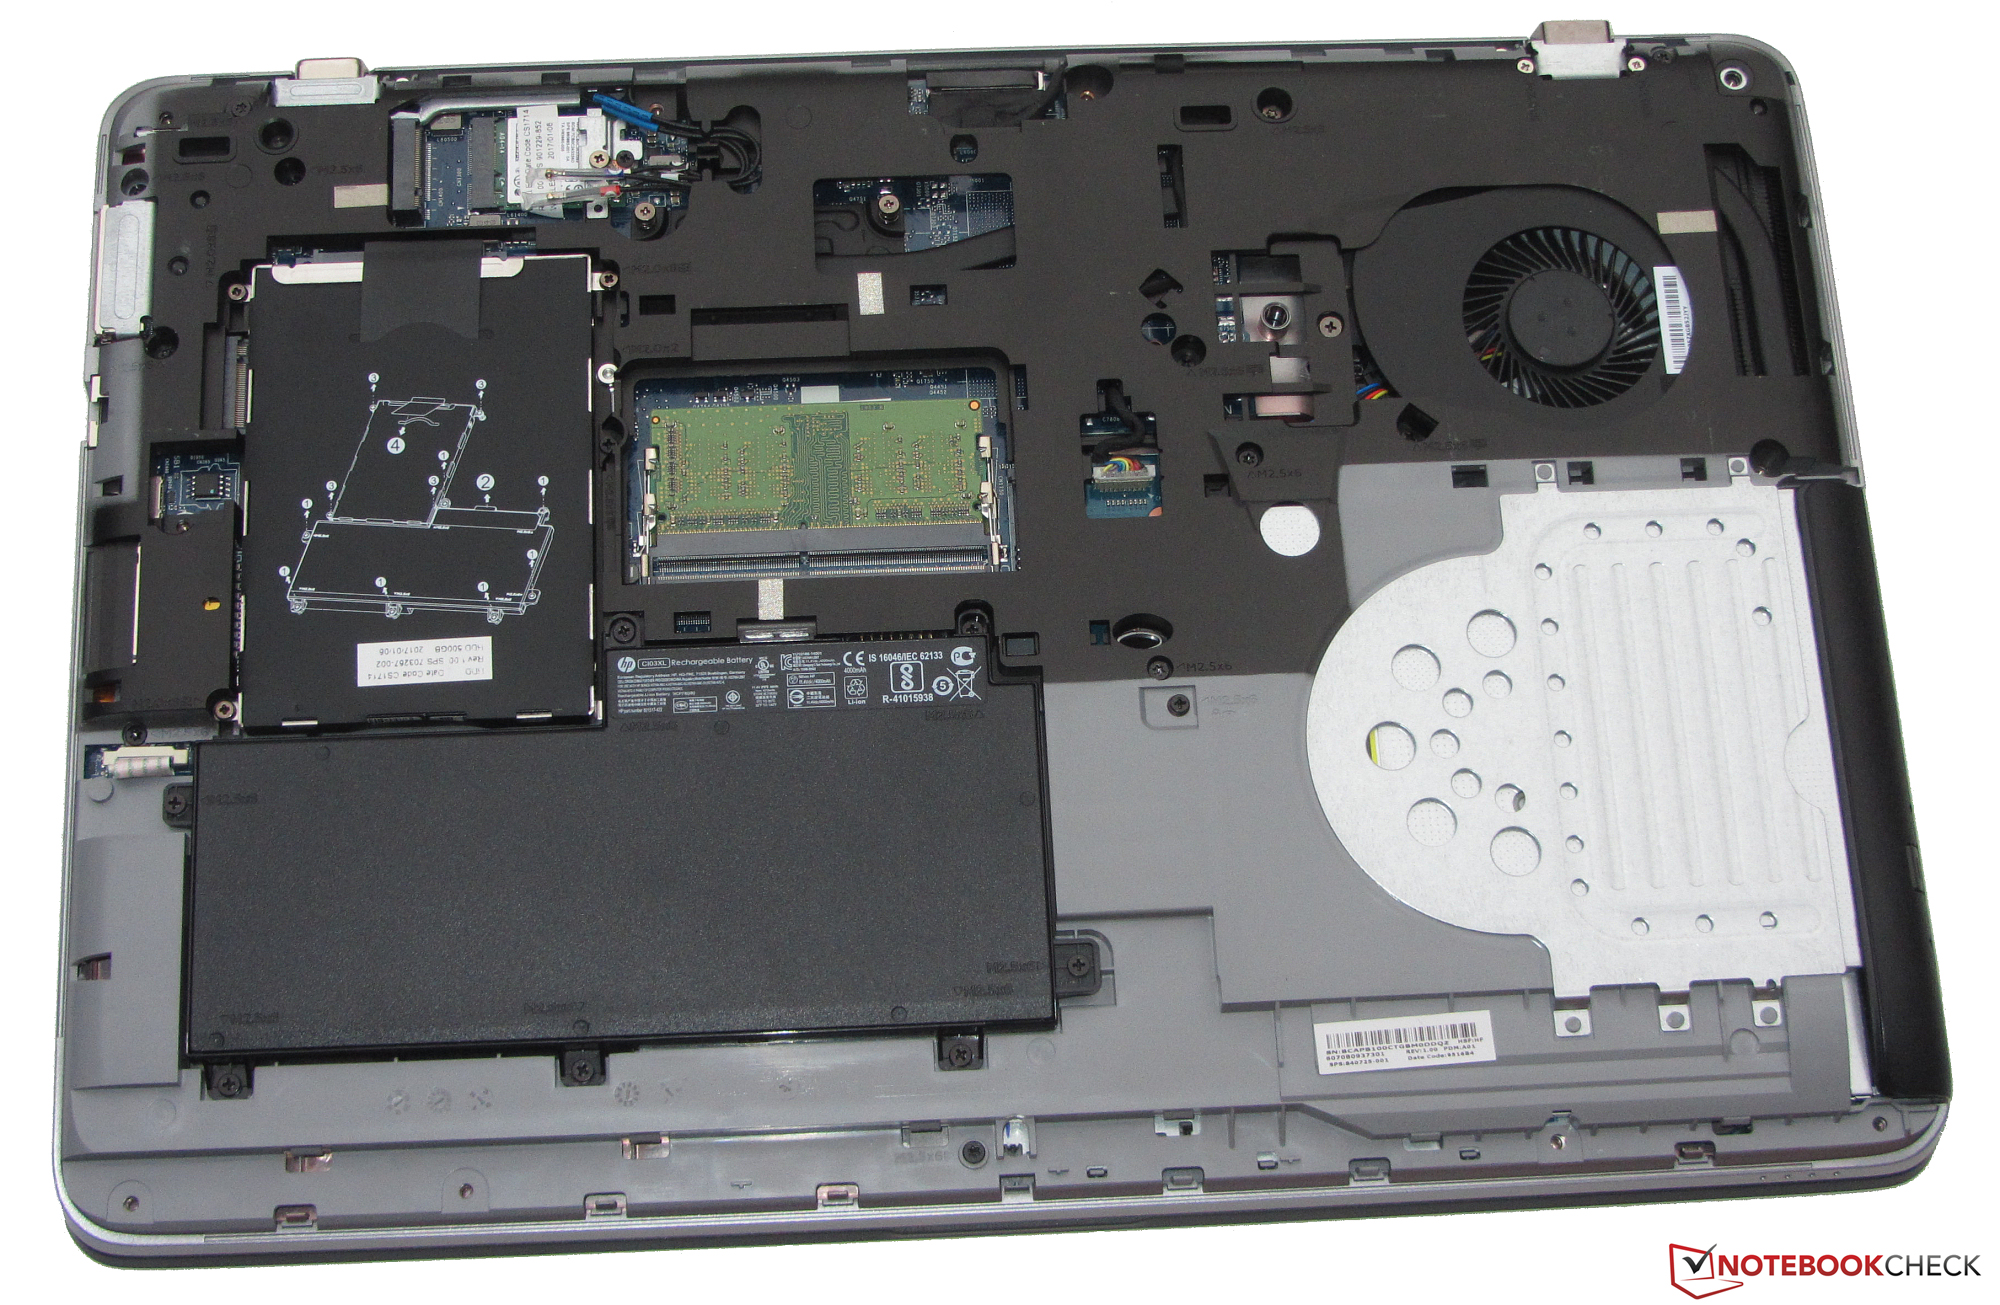
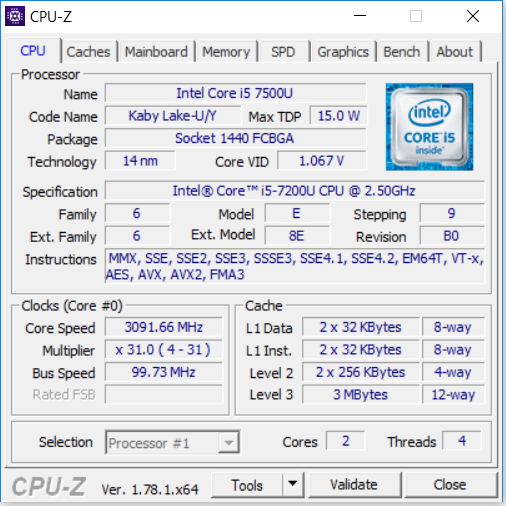
惠普的这台中端商务笔记本电脑由于搭配了最新的Kaby Lake处理器实现了略高的性能表现,不过在日常使用中可能会很难察觉到。它的新处理器也改善了电池续航的表现。这台笔记本电脑在前代机型已经十分优秀的续航成绩上又更进了一步。它在运行中十分安静,也不会变的很热。归功于500GB的硬盘,用户也不用担心存储空间不足的问题。它也可以升级到固态硬盘,这需要用户打开底盖,但幸运的是这个操作并不复杂。
整体上,惠普的ProBook 650 G3是一台十分不错的商务笔记本电脑。不过,这个测试机型在性价比上可能并不是很吸引人。
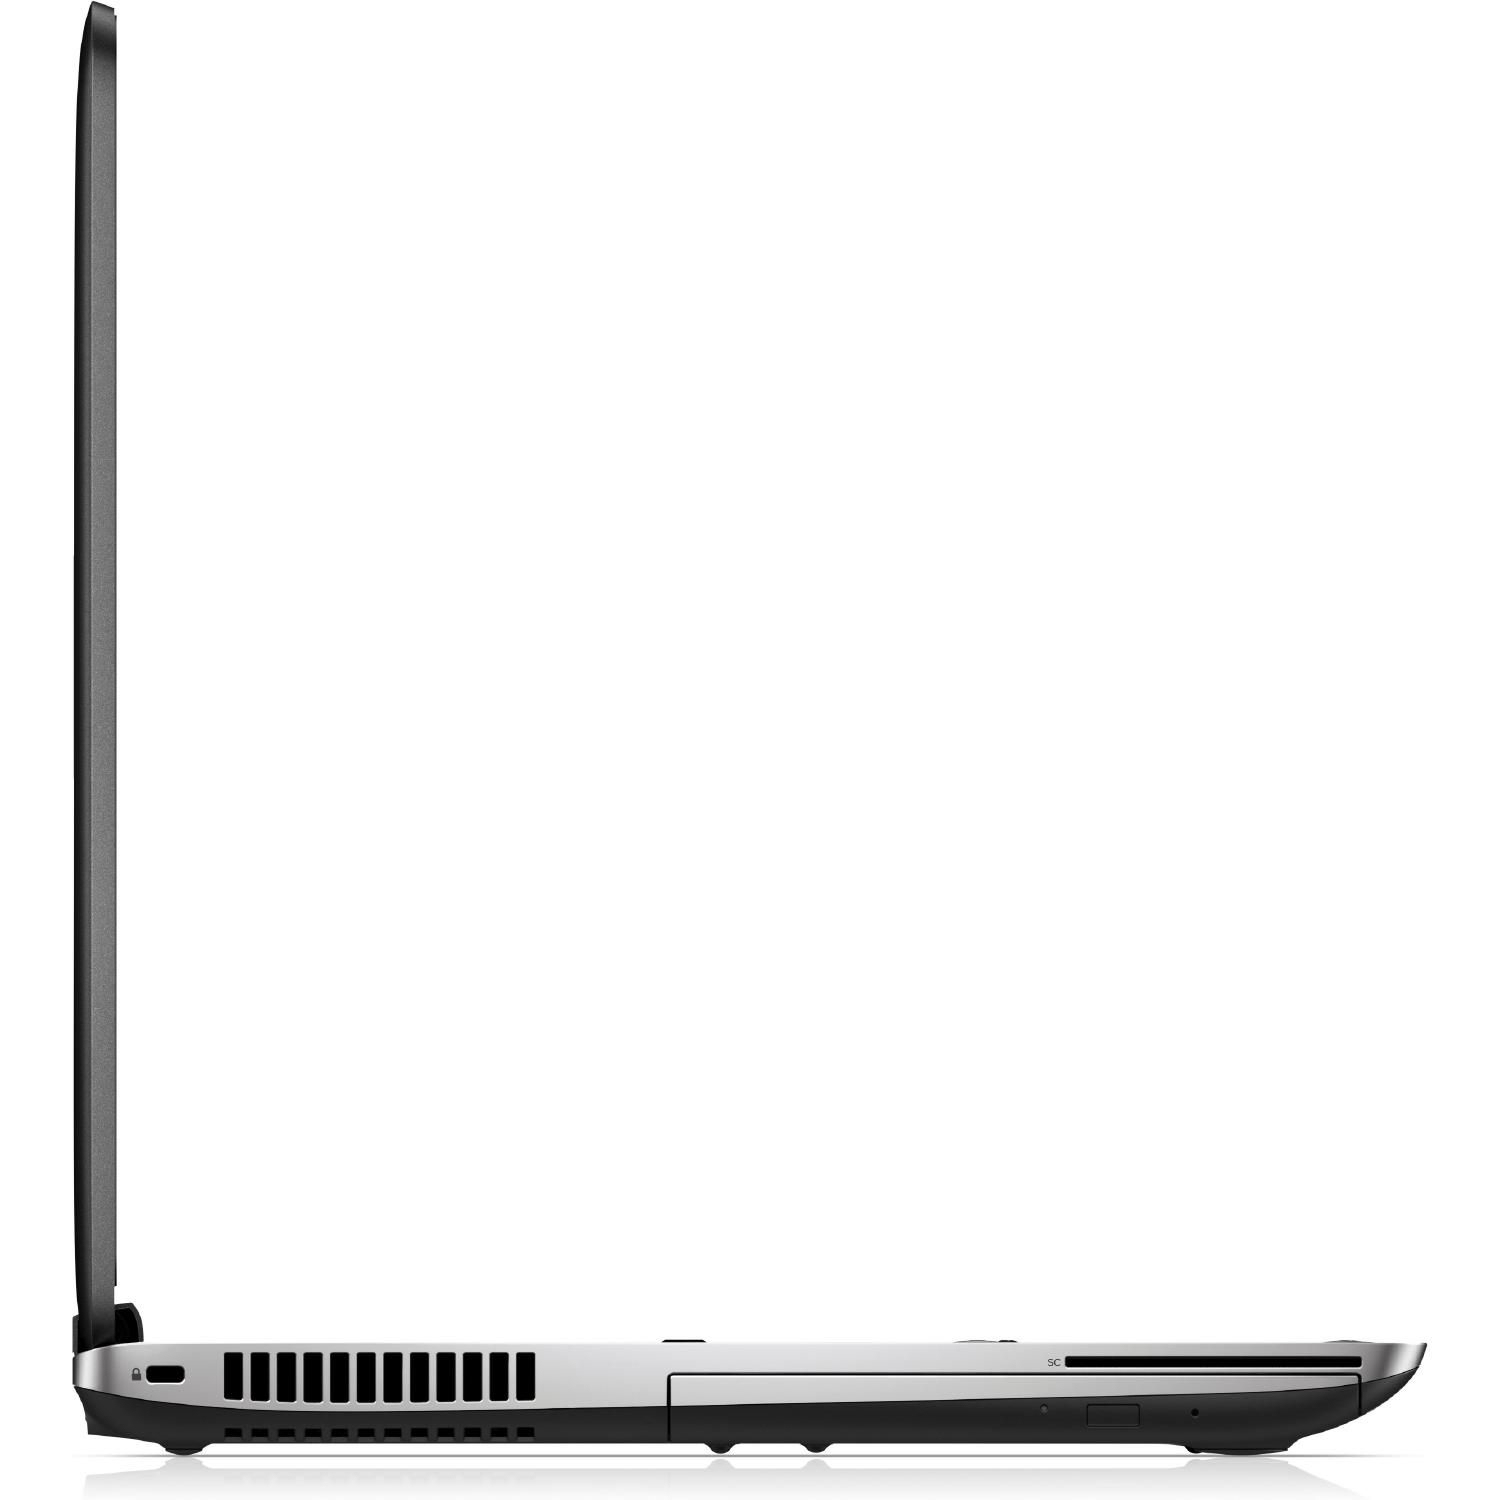
提到固态硬盘,惠普也提供了一款售价1050欧元(约7609人民币)的搭配固态硬盘的机型。这当然是个不小的改进。它搭配的键盘也应该可以满足需要大量打字输入的用户的需要。不过,它并不支持背光。考虑到这台设备的价位,这让人十分遗憾。另外,它的屏幕表现也很难让人满意。生产商为它搭配了一块低对比度的TN屏幕面板,可视角度也十分狭窄。这块屏幕在这个价位上让人完全无法接受,我们期待它至少可以提供一块IPS屏幕。
注:本文是基于完整评测的缩减版本,阅读完整的英文评测,请点击这里。
HP Probook 650 G3 Z2W44ET
- 02/21/2017 v6 (old)
Sascha Mölck