联想 ThinkPad T570 (Core i5, 全高清) 笔记本简短评测
| SD Card Reader | |
| average JPG Copy Test (av. of 3 runs) | |
| Fujitsu LifeBook U757 | |
| Lenovo ThinkPad T570-20H90002GE | |
| HP EliteBook 850 G4-Z2W86ET | |
| Dell XPS 15 2017 9560 (7300HQ, Full-HD) | |
| maximum AS SSD Seq Read Test (1GB) | |
| Dell XPS 15 2017 9560 (7300HQ, Full-HD) | |
| Lenovo ThinkPad T570-20H90002GE | |
| HP EliteBook 850 G4-Z2W86ET | |
| Fujitsu LifeBook U757 | |
| |||||||||||||||||||||||||
Brightness Distribution: 89 %
Center on Battery: 257 cd/m²
Contrast: 1092:1 (Black: 0.24 cd/m²)
ΔE ColorChecker Calman: 4.5 | ∀{0.5-29.43 Ø4.71}
ΔE Greyscale Calman: 3.5 | ∀{0.09-98 Ø4.96}
65.4% sRGB (Argyll 1.6.3 3D)
42.04% AdobeRGB 1998 (Argyll 1.6.3 3D)
45.66% AdobeRGB 1998 (Argyll 3D)
65.6% sRGB (Argyll 3D)
44.08% Display P3 (Argyll 3D)
Gamma: 2.32
CCT: 6524 K
| Lenovo ThinkPad T570-20H90002GE N156HCA-EAA, , 1920x1080, 15.6" | Apple MacBook Pro 15 2016 (2.6 GHz, 450) 2880x1800, 15.4" | Fujitsu LifeBook U757 LP156WF6-SPP1, , 1920x1080, 15.6" | HP EliteBook 850 G4-Z2W86ET AUO35ED, , 1920x1080, 15.6" | Dell XPS 15 2017 9560 (7300HQ, Full-HD) Sharp SHP1453 LQ156M1, , 1920x1080, 15.6" | Lenovo ThinkPad T560-20FH001FGE LTN156HL09901, , 1920x1080, 15.6" | |
|---|---|---|---|---|---|---|
| Display | 38% | 29% | 54% | -7% | ||
| Display P3 Coverage (%) | 44.08 | 65.8 49% | 56.8 29% | 68.9 56% | 40.96 -7% | |
| sRGB Coverage (%) | 65.6 | 84.8 29% | 83.7 28% | 98.9 51% | 61.3 -7% | |
| AdobeRGB 1998 Coverage (%) | 45.66 | 62 36% | 58.7 29% | 70.9 55% | 42.36 -7% | |
| Response Times | -32% | -7% | 7% | -91% | -56% | |
| Response Time Grey 50% / Grey 80% * (ms) | 41.6 ? | 47.3 ? -14% | 36 ? 13% | 47.2 ? -13% | 54 ? -30% | 58 ? -39% |
| Response Time Black / White * (ms) | 20.8 ? | 31.2 ? -50% | 26.4 ? -27% | 15.2 ? 27% | 52.4 ? -152% | 36 ? -73% |
| PWM Frequency (Hz) | 26040 ? | 117000 ? | 199.2 ? | 220 ? | ||
| Screen | 46% | 7% | -68% | 13% | -29% | |
| Brightness middle (cd/m²) | 262 | 483 84% | 313 19% | 338 29% | 400 53% | 243 -7% |
| Brightness (cd/m²) | 245 | 465 90% | 294 20% | 341 39% | 392 60% | 220 -10% |
| Brightness Distribution (%) | 89 | 92 3% | 84 -6% | 90 1% | 89 0% | 84 -6% |
| Black Level * (cd/m²) | 0.24 | 0.33 -38% | 0.27 -13% | 0.81 -238% | 0.26 -8% | 0.27 -13% |
| Contrast (:1) | 1092 | 1464 34% | 1159 6% | 417 -62% | 1538 41% | 900 -18% |
| Colorchecker dE 2000 * | 4.5 | 1.4 69% | 4.5 -0% | 10.9 -142% | 4.9 -9% | 7.49 -66% |
| Colorchecker dE 2000 max. * | 10.5 | 3 71% | 10.5 -0% | 18.7 -78% | 11 -5% | 15.13 -44% |
| Greyscale dE 2000 * | 3.5 | 1.5 57% | 4 -14% | 13.3 -280% | 7.2 -106% | 7.5 -114% |
| Gamma | 2.32 95% | 2.34 94% | 2.24 98% | 2.11 104% | 2.11 104% | 2.35 94% |
| CCT | 6524 100% | 6650 98% | 6387 102% | 16030 41% | 6911 94% | 6115 106% |
| Color Space (Percent of AdobeRGB 1998) (%) | 42.04 | 55.3 32% | 53.8 28% | 64.2 53% | 38.9 -7% | |
| Color Space (Percent of sRGB) (%) | 65.4 | 84.74 30% | 83.4 28% | 98.9 51% | 60.9 -7% | |
| Total Average (Program / Settings) | 7% /
31% | 13% /
12% | -11% /
-38% | -8% /
7% | -31% /
-28% |
* ... smaller is better
Display Response Times
| ↔ Response Time Black to White | ||
|---|---|---|
| 20.8 ms ... rise ↗ and fall ↘ combined | ↗ 6.8 ms rise | 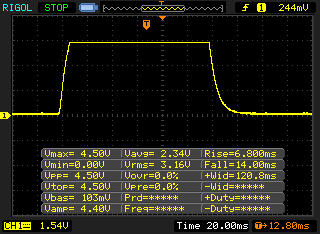 |
| ↘ 14 ms fall | ||
| The screen shows good response rates in our tests, but may be too slow for competitive gamers. In comparison, all tested devices range from 0.1 (minimum) to 240 (maximum) ms. » 46 % of all devices are better. This means that the measured response time is similar to the average of all tested devices (19.8 ms). | ||
| ↔ Response Time 50% Grey to 80% Grey | ||
| 41.6 ms ... rise ↗ and fall ↘ combined | ↗ 22 ms rise | 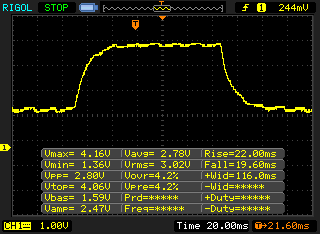 |
| ↘ 19.6 ms fall | ||
| The screen shows slow response rates in our tests and will be unsatisfactory for gamers. In comparison, all tested devices range from 0.165 (minimum) to 636 (maximum) ms. » 67 % of all devices are better. This means that the measured response time is worse than the average of all tested devices (31 ms). | ||
Screen Flickering / PWM (Pulse-Width Modulation)
| Screen flickering / PWM detected | 26040 Hz | ≤ 40 % brightness setting | 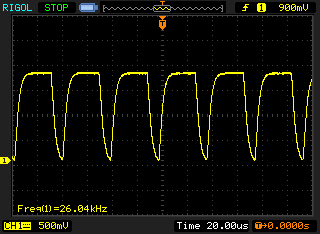 |
The display backlight flickers at 26040 Hz (worst case, e.g., utilizing PWM) Flickering detected at a brightness setting of 40 % and below. There should be no flickering or PWM above this brightness setting. The frequency of 26040 Hz is quite high, so most users sensitive to PWM should not notice any flickering. In comparison: 52 % of all tested devices do not use PWM to dim the display. If PWM was detected, an average of 7757 (minimum: 5 - maximum: 343500) Hz was measured. | |||
| PCMark 8 Home Score Accelerated v2 | 3523 points | |
| PCMark 8 Creative Score Accelerated v2 | 4380 points | |
| PCMark 8 Work Score Accelerated v2 | 4606 points | |
Help | ||
| Lenovo ThinkPad T570-20H90002GE Samsung PM961 MZVLW256HEHP | Apple MacBook Pro 15 2016 (2.6 GHz, 450) Apple SSD SM0256L | Fujitsu LifeBook U757 Samsung CM871a MZNTY256HDHP | HP EliteBook 850 G4-Z2W86ET Samsung PM951 NVMe MZVLV256 | Dell XPS 15 2017 9560 (7300HQ, Full-HD) WDC WD10SPCX-75KHST0 + SanDisk Z400s M.2 2242 32 GB Cache | Lenovo ThinkPad T470s-20HGS00V00 Samsung SSD PM961 1TB M.2 PCIe 3.0 x4 NVMe (MZVLW1T0) | |
|---|---|---|---|---|---|---|
| CrystalDiskMark 3.0 | -17% | -46% | -28% | -92% | 20% | |
| Read Seq (MB/s) | 1318 | 1298 -2% | 509 -61% | 1245 -6% | 123 -91% | 1760 34% |
| Write Seq (MB/s) | 1166 | 1343 15% | 488.4 -58% | 298.6 -74% | 74.2 -94% | 1666 43% |
| Read 512 (MB/s) | 933 | 842 -10% | 414.3 -56% | 673 -28% | 101.7 -89% | 832 -11% |
| Write 512 (MB/s) | 860 | 945 10% | 321.7 -63% | 298.8 -65% | 42.51 -95% | 1064 24% |
| Read 4k (MB/s) | 56.6 | 9.8 -83% | 36.43 -36% | 41.79 -26% | 10.84 -81% | 53.2 -6% |
| Write 4k (MB/s) | 130.6 | 13 -90% | 88.4 -32% | 138.4 6% | 1.021 -99% | 167.4 28% |
| Read 4k QD32 (MB/s) | 510 | 630 24% | 402.8 -21% | 495 -3% | 69.8 -86% | 630 24% |
| Write 4k QD32 (MB/s) | 426.4 | 443 4% | 256.7 -40% | 297.5 -30% | 1.057 -100% | 533 25% |

| 3DMark 11 Performance | 1533 points | |
| 3DMark Ice Storm Standard Score | 51988 points | |
| 3DMark Cloud Gate Standard Score | 5741 points | |
| 3DMark Fire Strike Score | 774 points | |
Help | ||
| low | med. | high | ultra | |
|---|---|---|---|---|
| Tomb Raider (2013) | 66.9 | 33.6 | 19.7 | 9.5 |
| BioShock Infinite (2013) | 41.7 | 24.4 | 20.2 | 6.6 |
| Battlefield 4 (2013) | 30.3 | 25.2 | 15.5 | 4.8 |
| The Witcher 3 (2015) | 13.1 | |||
| Rise of the Tomb Raider (2016) | 10.5 |
Noise level
| Idle |
| 29.3 / 29.3 / 31.2 dB(A) |
| Load |
| 35.1 / 38.7 dB(A) |
 | ||
30 dB silent 40 dB(A) audible 50 dB(A) loud |
||
min: | ||
| Lenovo ThinkPad T570-20H90002GE i5-7200U, HD Graphics 620 | Apple MacBook Pro 15 2016 (2.6 GHz, 450) 6700HQ, Radeon Pro 450 | Fujitsu LifeBook U757 i5-7200U, HD Graphics 620 | HP EliteBook 850 G4-Z2W86ET i5-7200U, HD Graphics 620 | Dell XPS 15 2017 9560 (7300HQ, Full-HD) i5-7300HQ, GeForce GTX 1050 Mobile | Lenovo ThinkPad T560-20FH001FGE 6200U, HD Graphics 520 | |
|---|---|---|---|---|---|---|
| Noise | -5% | 7% | 6% | -14% | 2% | |
| off / environment * (dB) | 29.3 | 30.4 -4% | 28.2 4% | 29 1% | 30.3 -3% | 29 1% |
| Idle Minimum * (dB) | 29.3 | 30.6 -4% | 28.2 4% | 29 1% | 31.6 -8% | 30.8 -5% |
| Idle Average * (dB) | 29.3 | 30.6 -4% | 28.2 4% | 29 1% | 31.6 -8% | 30.8 -5% |
| Idle Maximum * (dB) | 31.2 | 30.6 2% | 28.2 10% | 29 7% | 33.4 -7% | 30.8 1% |
| Load Average * (dB) | 35.1 | 34.7 1% | 33.3 5% | 31 12% | 47.8 -36% | 33.1 6% |
| Load Maximum * (dB) | 38.7 | 46.3 -20% | 34 12% | 33.4 14% | 47.8 -24% | 34.4 11% |
* ... smaller is better
(+) The maximum temperature on the upper side is 39.5 °C / 103 F, compared to the average of 34.3 °C / 94 F, ranging from 21.2 to 62.5 °C for the class Office.
(-) The bottom heats up to a maximum of 48.3 °C / 119 F, compared to the average of 36.8 °C / 98 F
(+) In idle usage, the average temperature for the upper side is 24.1 °C / 75 F, compared to the device average of 29.5 °C / 85 F.
(+) The palmrests and touchpad are reaching skin temperature as a maximum (33.6 °C / 92.5 F) and are therefore not hot.
(-) The average temperature of the palmrest area of similar devices was 27.5 °C / 81.5 F (-6.1 °C / -11 F).
| Lenovo ThinkPad T570-20H90002GE i5-7200U, HD Graphics 620 | Apple MacBook Pro 15 2016 (2.6 GHz, 450) 6700HQ, Radeon Pro 450 | Fujitsu LifeBook U757 i5-7200U, HD Graphics 620 | HP EliteBook 850 G4-Z2W86ET i5-7200U, HD Graphics 620 | Dell XPS 15 2017 9560 (7300HQ, Full-HD) i5-7300HQ, GeForce GTX 1050 Mobile | Lenovo ThinkPad T560-20FH001FGE 6200U, HD Graphics 520 | |
|---|---|---|---|---|---|---|
| Heat | 1% | -2% | 9% | -12% | 1% | |
| Maximum Upper Side * (°C) | 39.5 | 43 -9% | 42 -6% | 37 6% | 47.6 -21% | 33.3 16% |
| Maximum Bottom * (°C) | 48.3 | 40 17% | 38.8 20% | 41.1 15% | 42.1 13% | 40.1 17% |
| Idle Upper Side * (°C) | 24.5 | 26 -6% | 29.2 -19% | 23.2 5% | 29.9 -22% | 27.4 -12% |
| Idle Bottom * (°C) | 25.3 | 25 1% | 26.3 -4% | 23.2 8% | 29.8 -18% | 29.6 -17% |
* ... smaller is better
Lenovo ThinkPad T570-20H90002GE audio analysis
(±) | speaker loudness is average but good (77.1 dB)
Bass 100 - 315 Hz
(±) | reduced bass - on average 12.1% lower than median
(±) | linearity of bass is average (10.7% delta to prev. frequency)
Mids 400 - 2000 Hz
(+) | balanced mids - only 2.9% away from median
(±) | linearity of mids is average (9.6% delta to prev. frequency)
Highs 2 - 16 kHz
(+) | balanced highs - only 3% away from median
(+) | highs are linear (2.9% delta to prev. frequency)
Overall 100 - 16.000 Hz
(+) | overall sound is linear (13.8% difference to median)
Compared to same class
» 9% of all tested devices in this class were better, 4% similar, 87% worse
» The best had a delta of 7%, average was 21%, worst was 53%
Compared to all devices tested
» 15% of all tested devices were better, 4% similar, 81% worse
» The best had a delta of 4%, average was 23%, worst was 134%
HP EliteBook 850 G4-Z2W86ET audio analysis
(±) | speaker loudness is average but good (74.6 dB)
Bass 100 - 315 Hz
(-) | nearly no bass - on average 15.5% lower than median
(±) | linearity of bass is average (11% delta to prev. frequency)
Mids 400 - 2000 Hz
(+) | balanced mids - only 1.7% away from median
(+) | mids are linear (3.8% delta to prev. frequency)
Highs 2 - 16 kHz
(+) | balanced highs - only 3.2% away from median
(±) | linearity of highs is average (7.6% delta to prev. frequency)
Overall 100 - 16.000 Hz
(±) | linearity of overall sound is average (17.7% difference to median)
Compared to same class
» 29% of all tested devices in this class were better, 6% similar, 65% worse
» The best had a delta of 7%, average was 21%, worst was 53%
Compared to all devices tested
» 35% of all tested devices were better, 8% similar, 57% worse
» The best had a delta of 4%, average was 23%, worst was 134%
| Off / Standby | |
| Idle | |
| Load |
|
Key:
min: | |
| Lenovo ThinkPad T570-20H90002GE i5-7200U, HD Graphics 620, 1920x1080 | Apple MacBook Pro 15 2016 (2.6 GHz, 450) 6700HQ, Radeon Pro 450, 2880x1800 | Fujitsu LifeBook U757 i5-7200U, HD Graphics 620, 1920x1080 | HP EliteBook 850 G4-Z2W86ET i5-7200U, HD Graphics 620, 1920x1080 | Dell XPS 15 2017 9560 (7300HQ, Full-HD) i5-7300HQ, GeForce GTX 1050 Mobile, 1920x1080 | Lenovo ThinkPad T560-20FH001FGE 6200U, HD Graphics 520, 1920x1080 | |
|---|---|---|---|---|---|---|
| Power Consumption | -47% | 4% | 12% | -93% | 7% | |
| Idle Minimum * (Watt) | 3.6 | 2.9 19% | 3.96 -10% | 3.58 1% | 6.6 -83% | 4.3 -19% |
| Idle Average * (Watt) | 7.7 | 9.7 -26% | 7.74 -1% | 5.97 22% | 9 -17% | 7.3 5% |
| Idle Maximum * (Watt) | 8.2 | 10.1 -23% | 8.64 -5% | 6.81 17% | 10.7 -30% | 7.8 5% |
| Load Average * (Watt) | 30.8 | 65 -111% | 28.8 6% | 29.4 5% | 77.5 -152% | 26.3 15% |
| Load Maximum * (Watt) | 46.1 | 89.5 -94% | 32 31% | 39.7 14% | 130 -182% | 32 31% |
* ... smaller is better
| Lenovo ThinkPad T570-20H90002GE i5-7200U, HD Graphics 620, 56 Wh | Apple MacBook Pro 15 2016 (2.6 GHz, 450) 6700HQ, Radeon Pro 450, 76 Wh | Fujitsu LifeBook U757 i5-7200U, HD Graphics 620, 50 Wh | HP EliteBook 850 G4-Z2W86ET i5-7200U, HD Graphics 620, 51 Wh | Dell XPS 15 2017 9560 (7300HQ, Full-HD) i5-7300HQ, GeForce GTX 1050 Mobile, 56 Wh | Lenovo ThinkPad T560-20FH001FGE 6200U, HD Graphics 520, 67 Wh | |
|---|---|---|---|---|---|---|
| Battery runtime | -18% | -4% | -1% | -46% | 12% | |
| Reader / Idle (h) | 19.5 | 18 -8% | 9.4 -52% | 18.1 -7% | ||
| H.264 (h) | 9.8 | 8.6 -12% | 10.6 8% | 9.5 -3% | ||
| WiFi v1.3 (h) | 7.6 | 10 32% | 7.3 -4% | 8.8 16% | 5.6 -26% | 11 45% |
| Load (h) | 3.4 | 0.9 -74% | 2.7 -21% | 1.4 -59% | 3.8 12% |
Pros
Cons
今年更新的联想 ThinkPad T570 从很多角度来说都是一台很出色的商务本,但仍存存在一些造成不足的缺陷,希望能够尽快被解决。
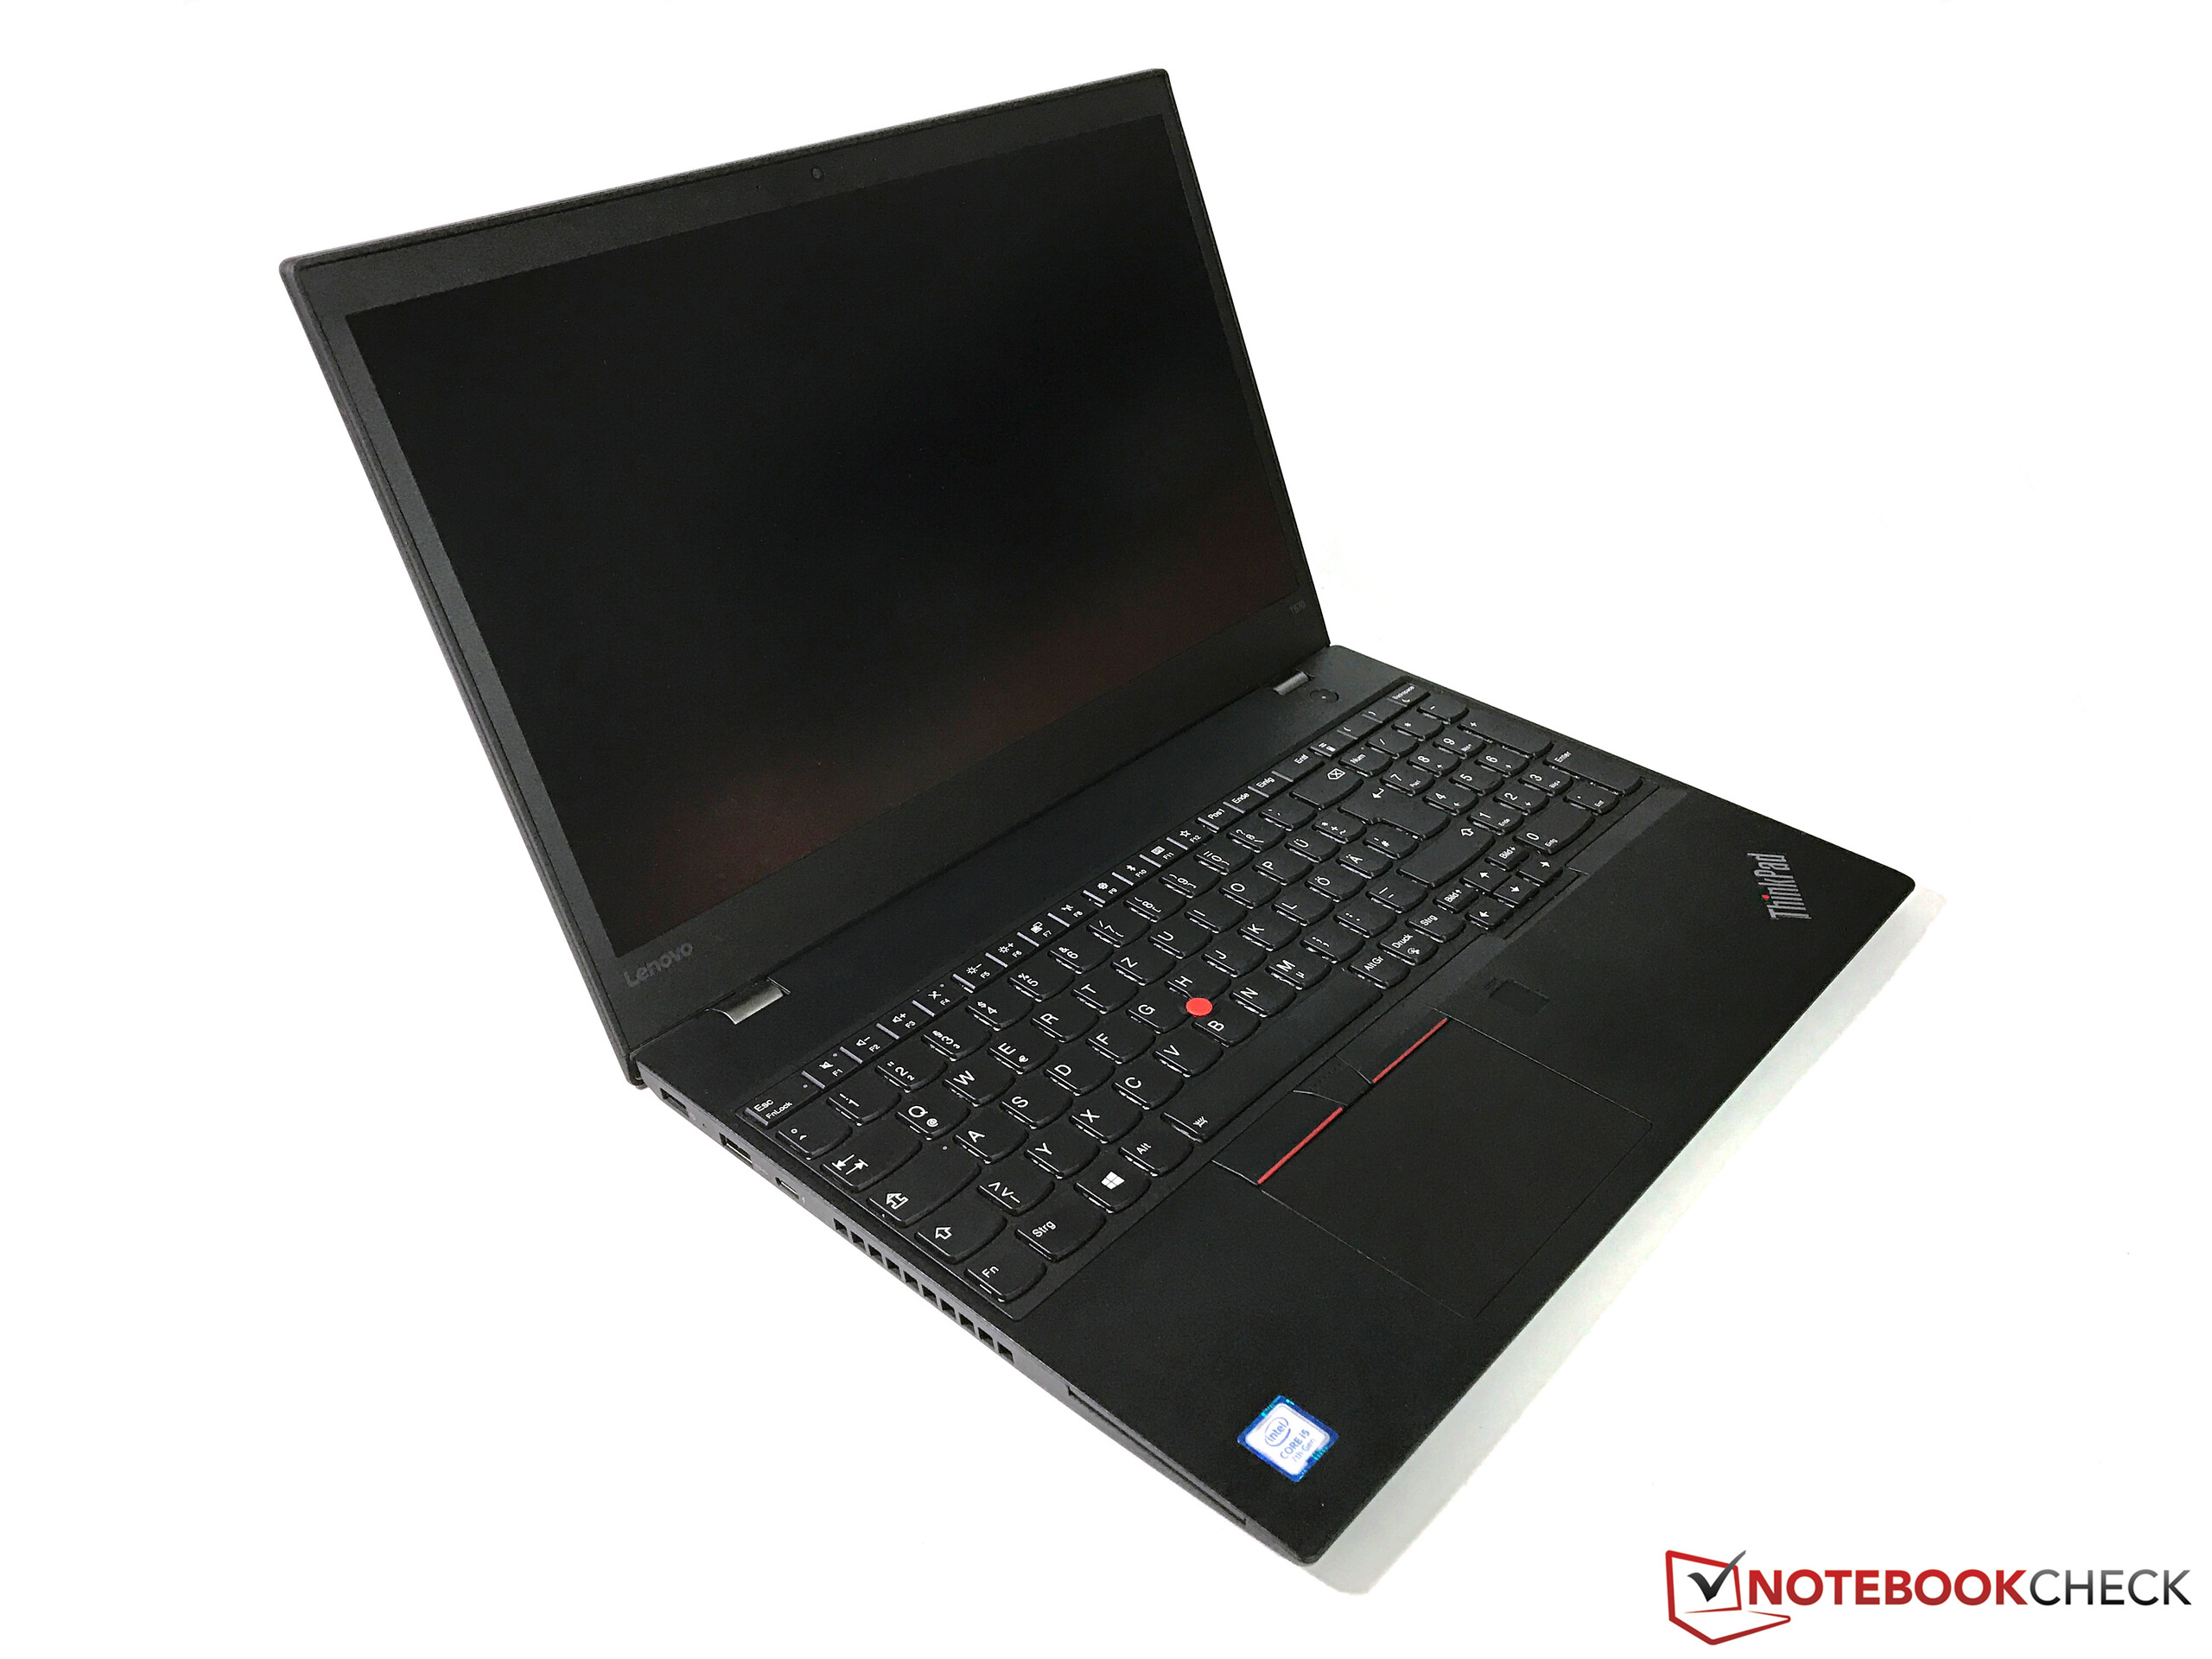
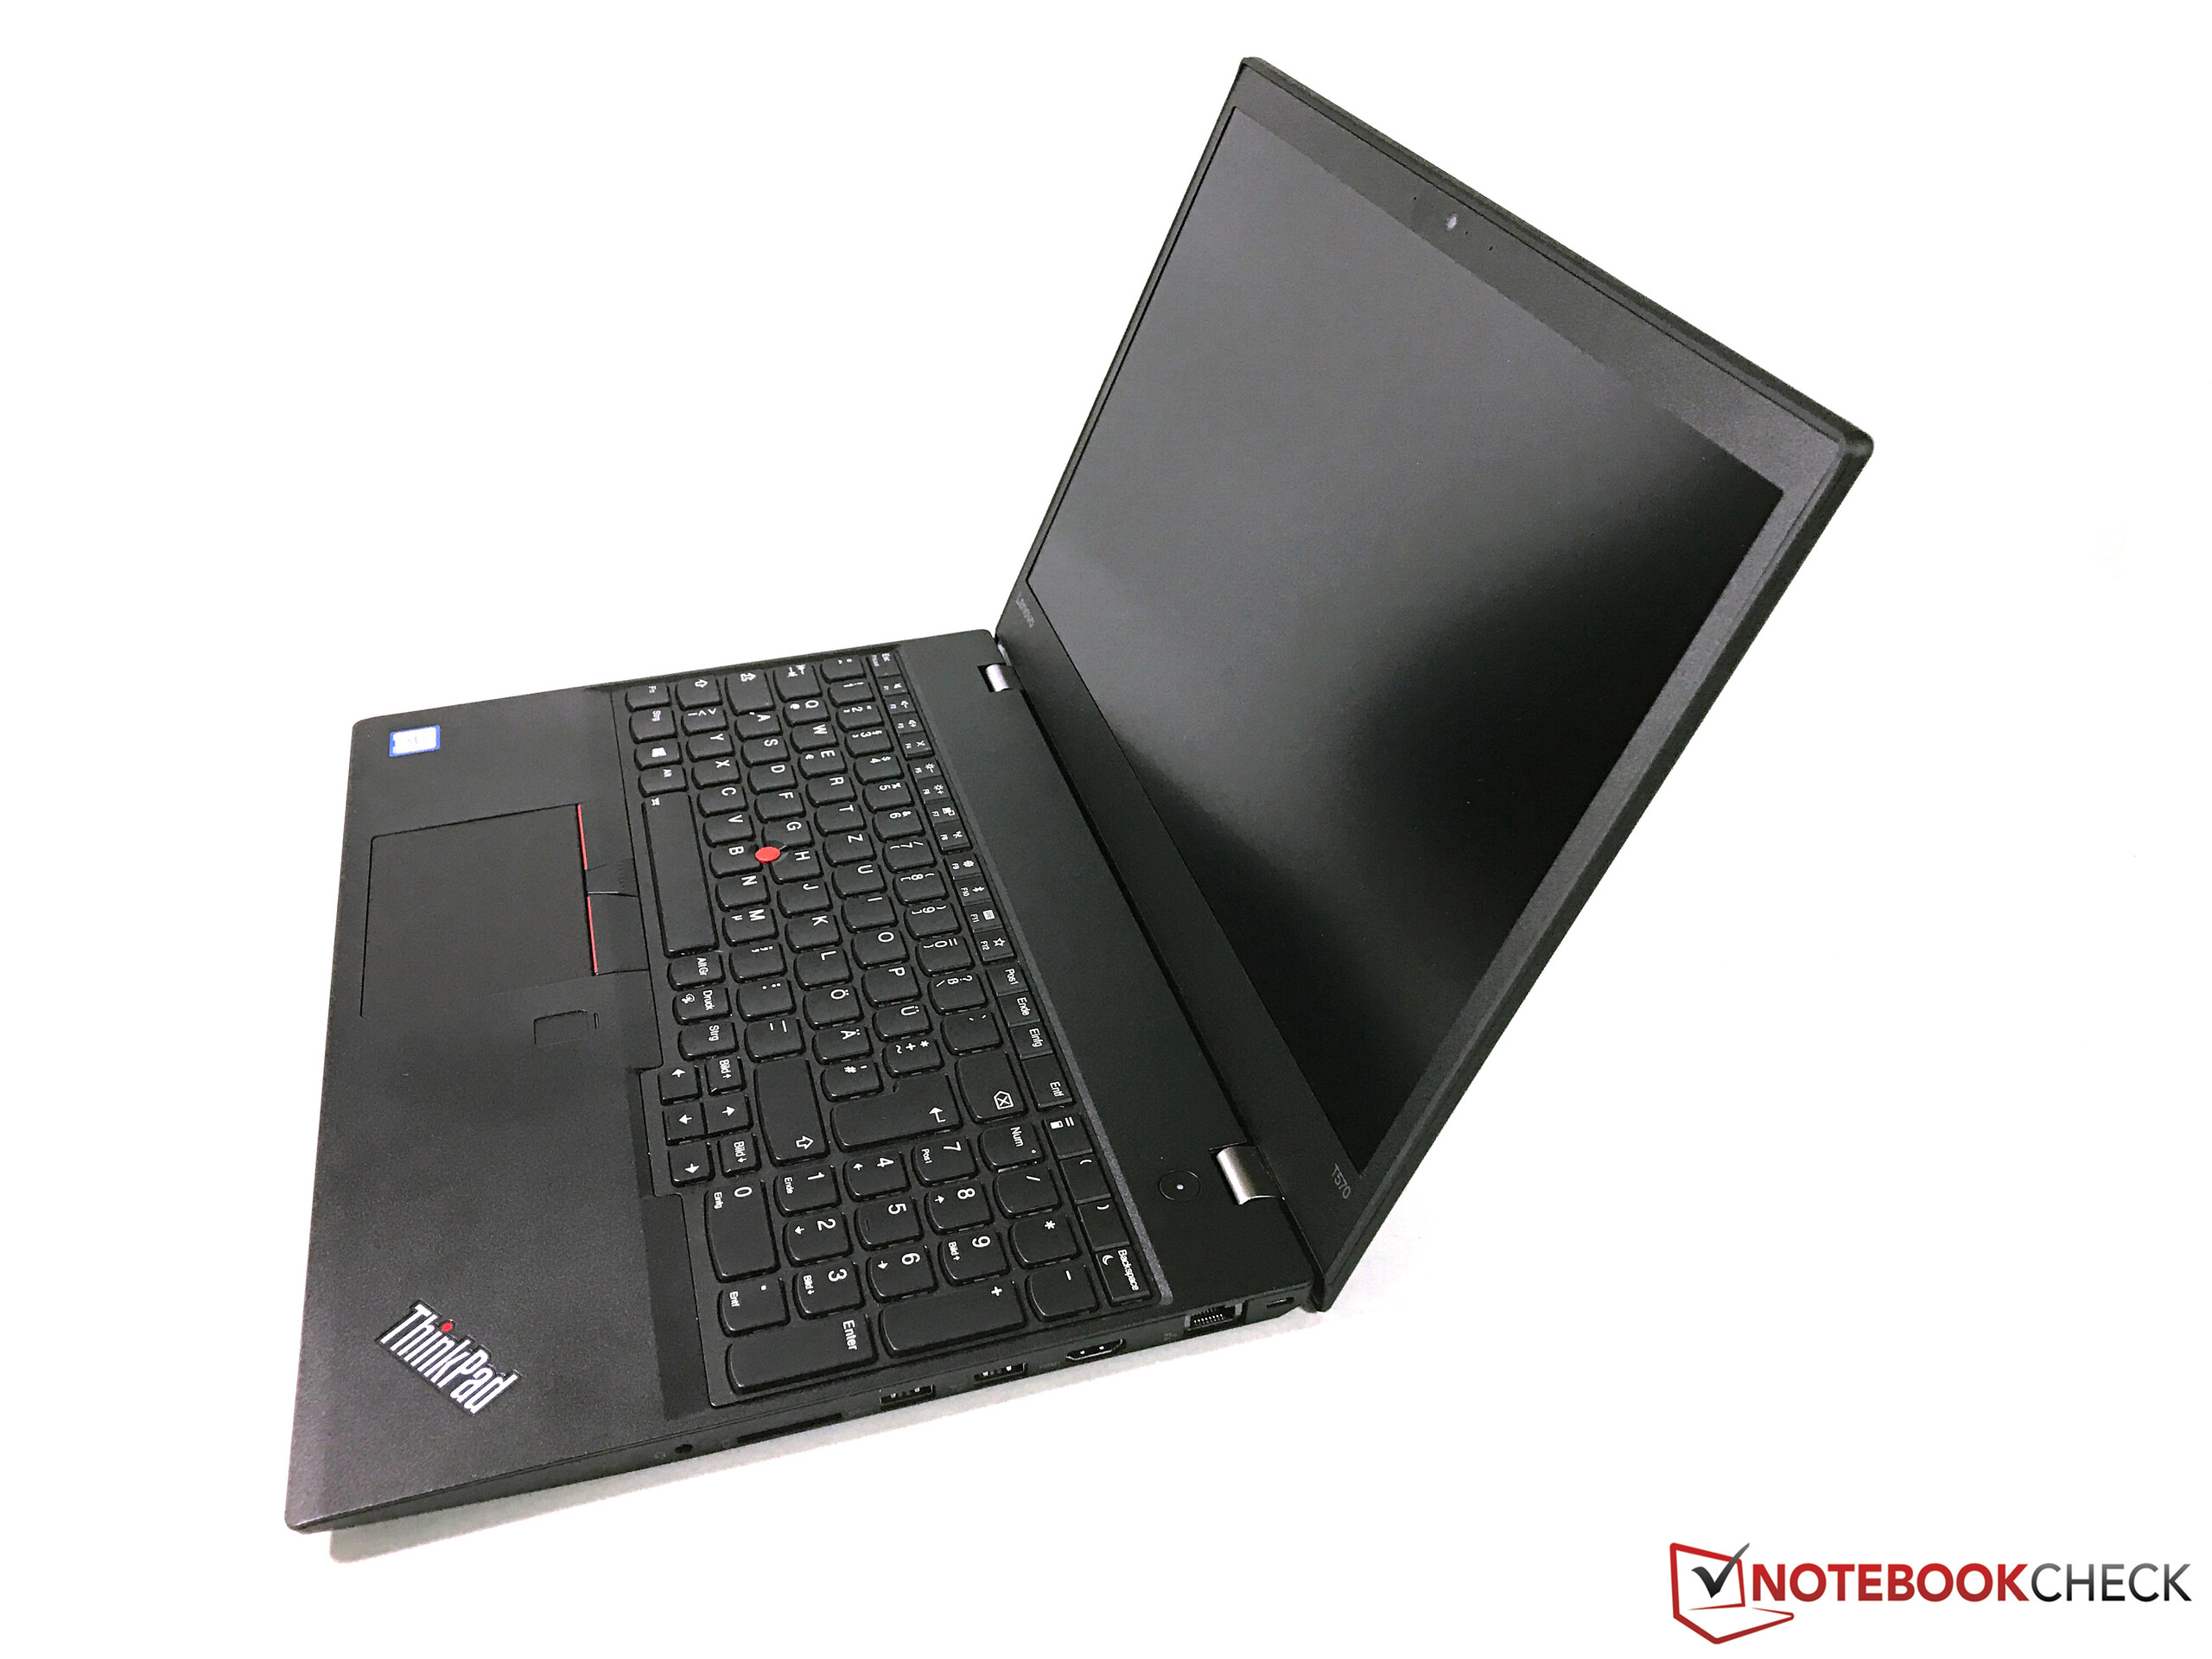
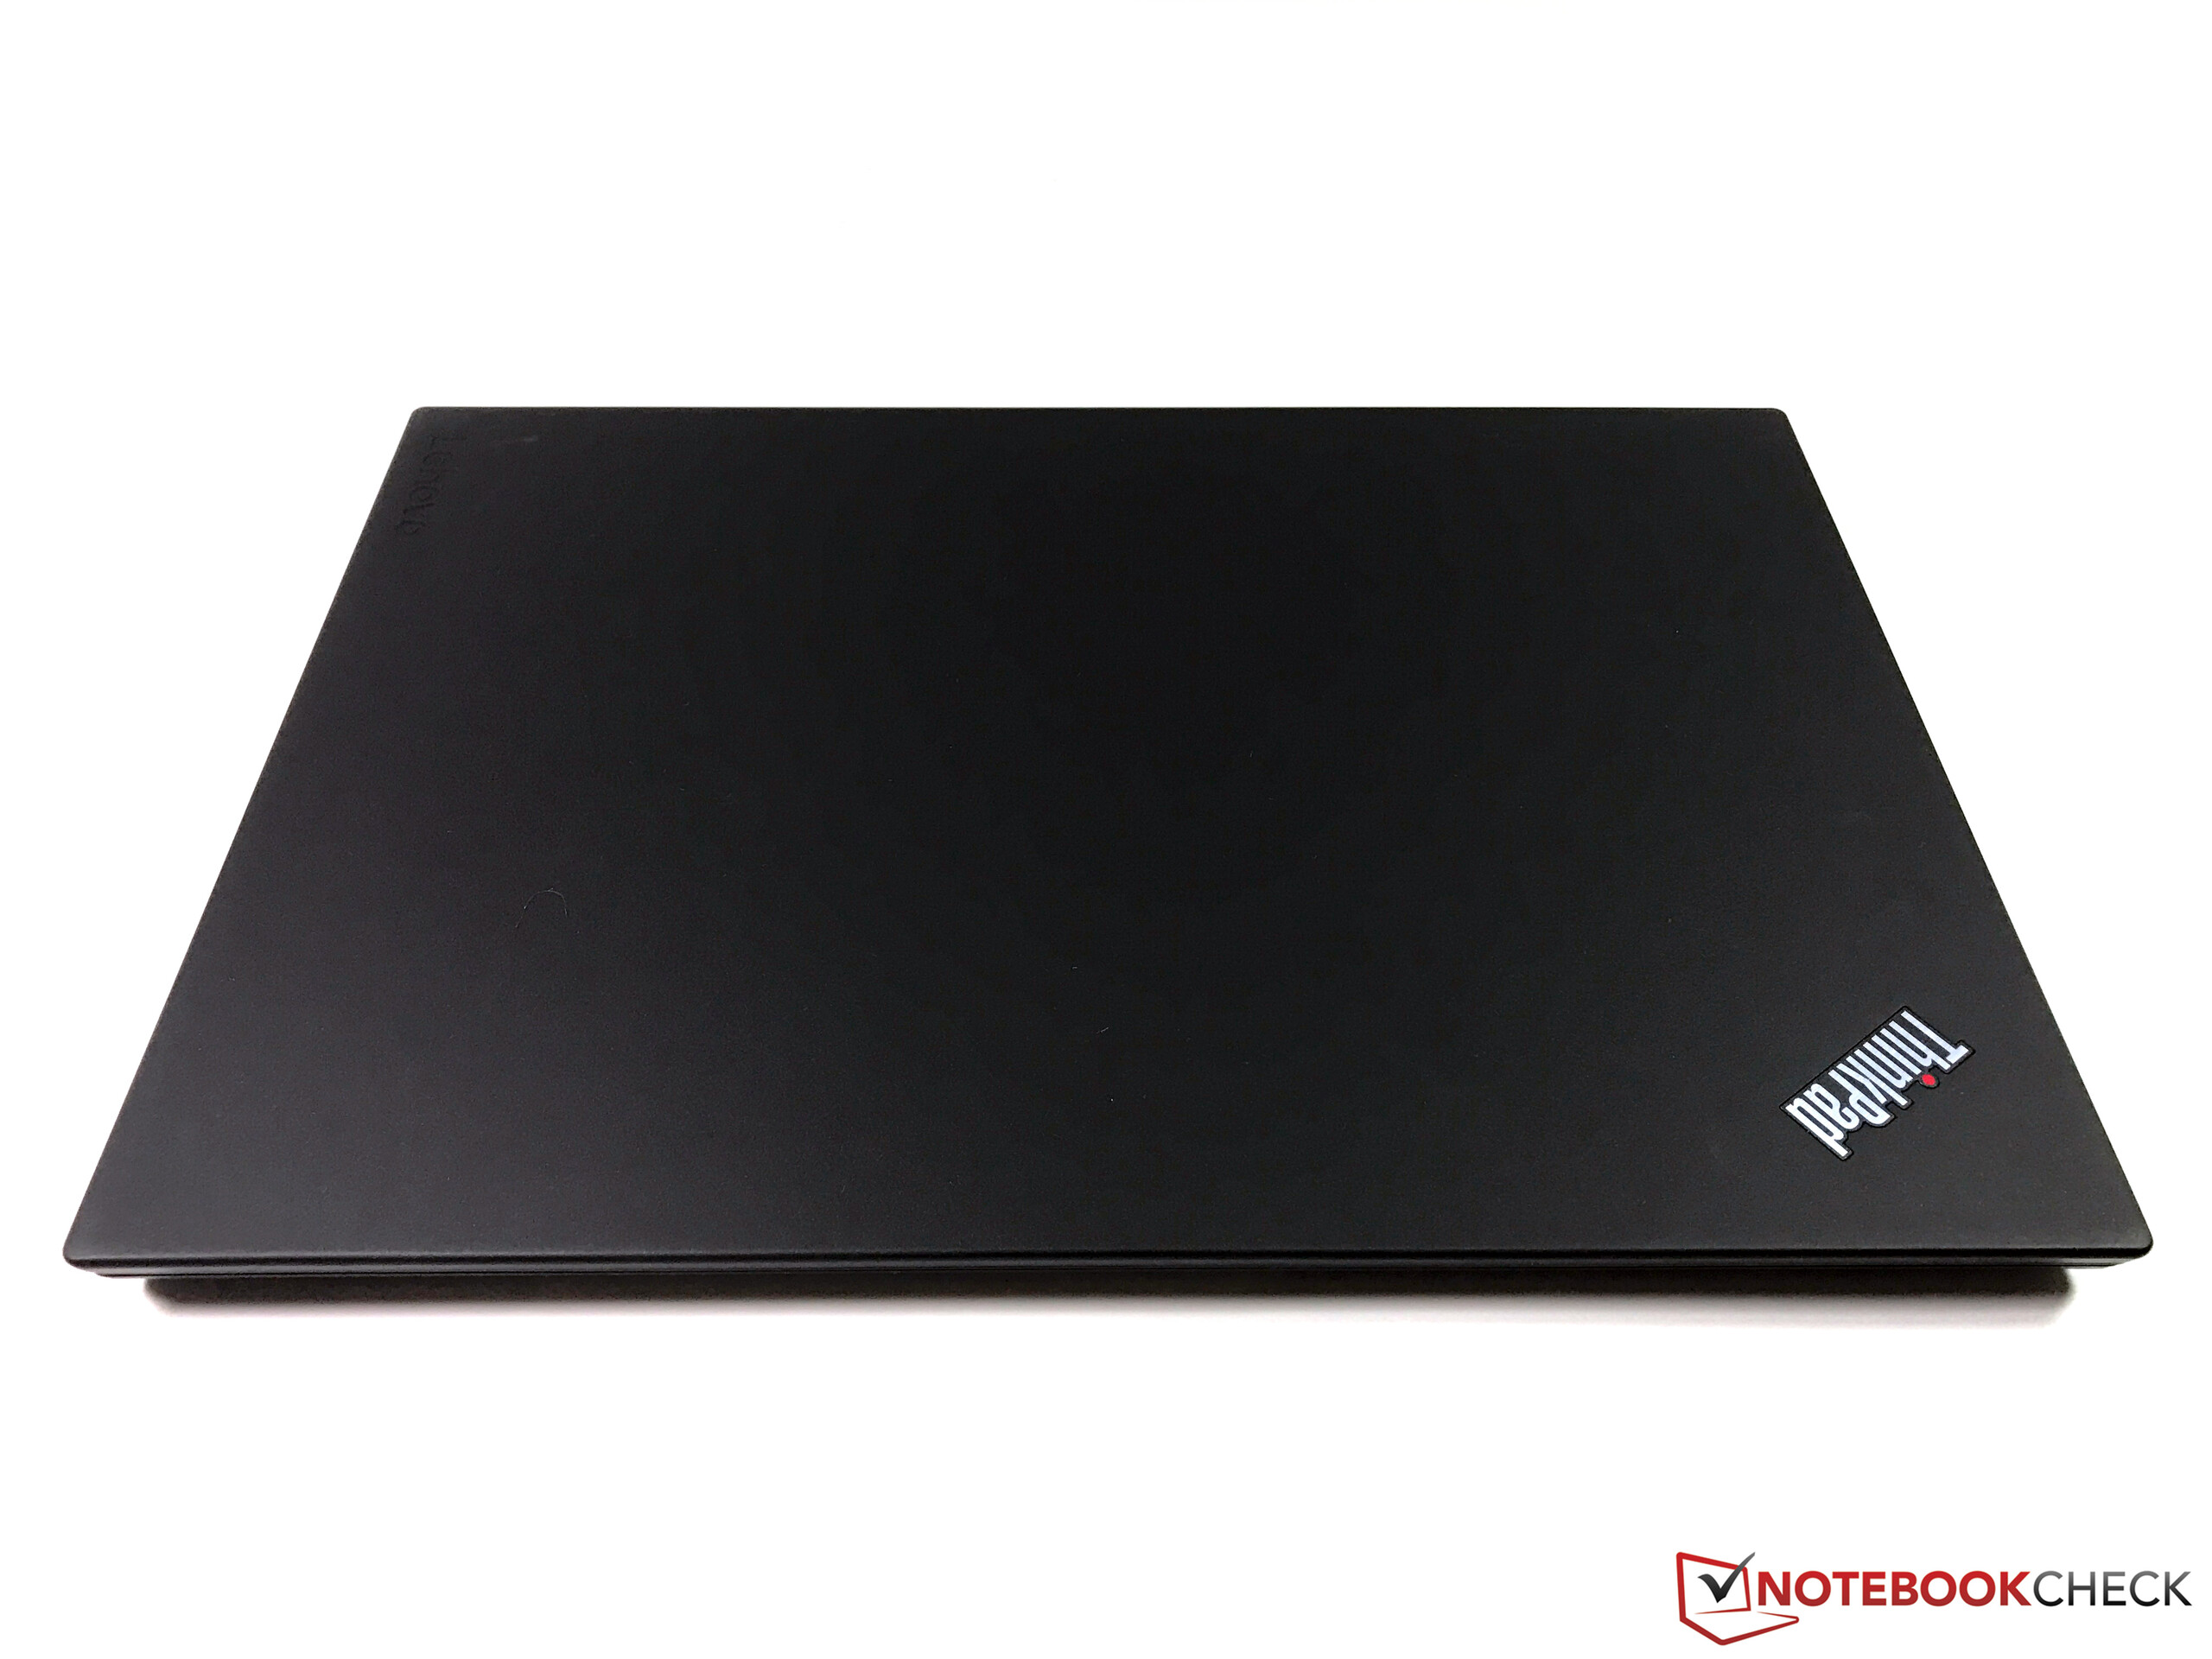
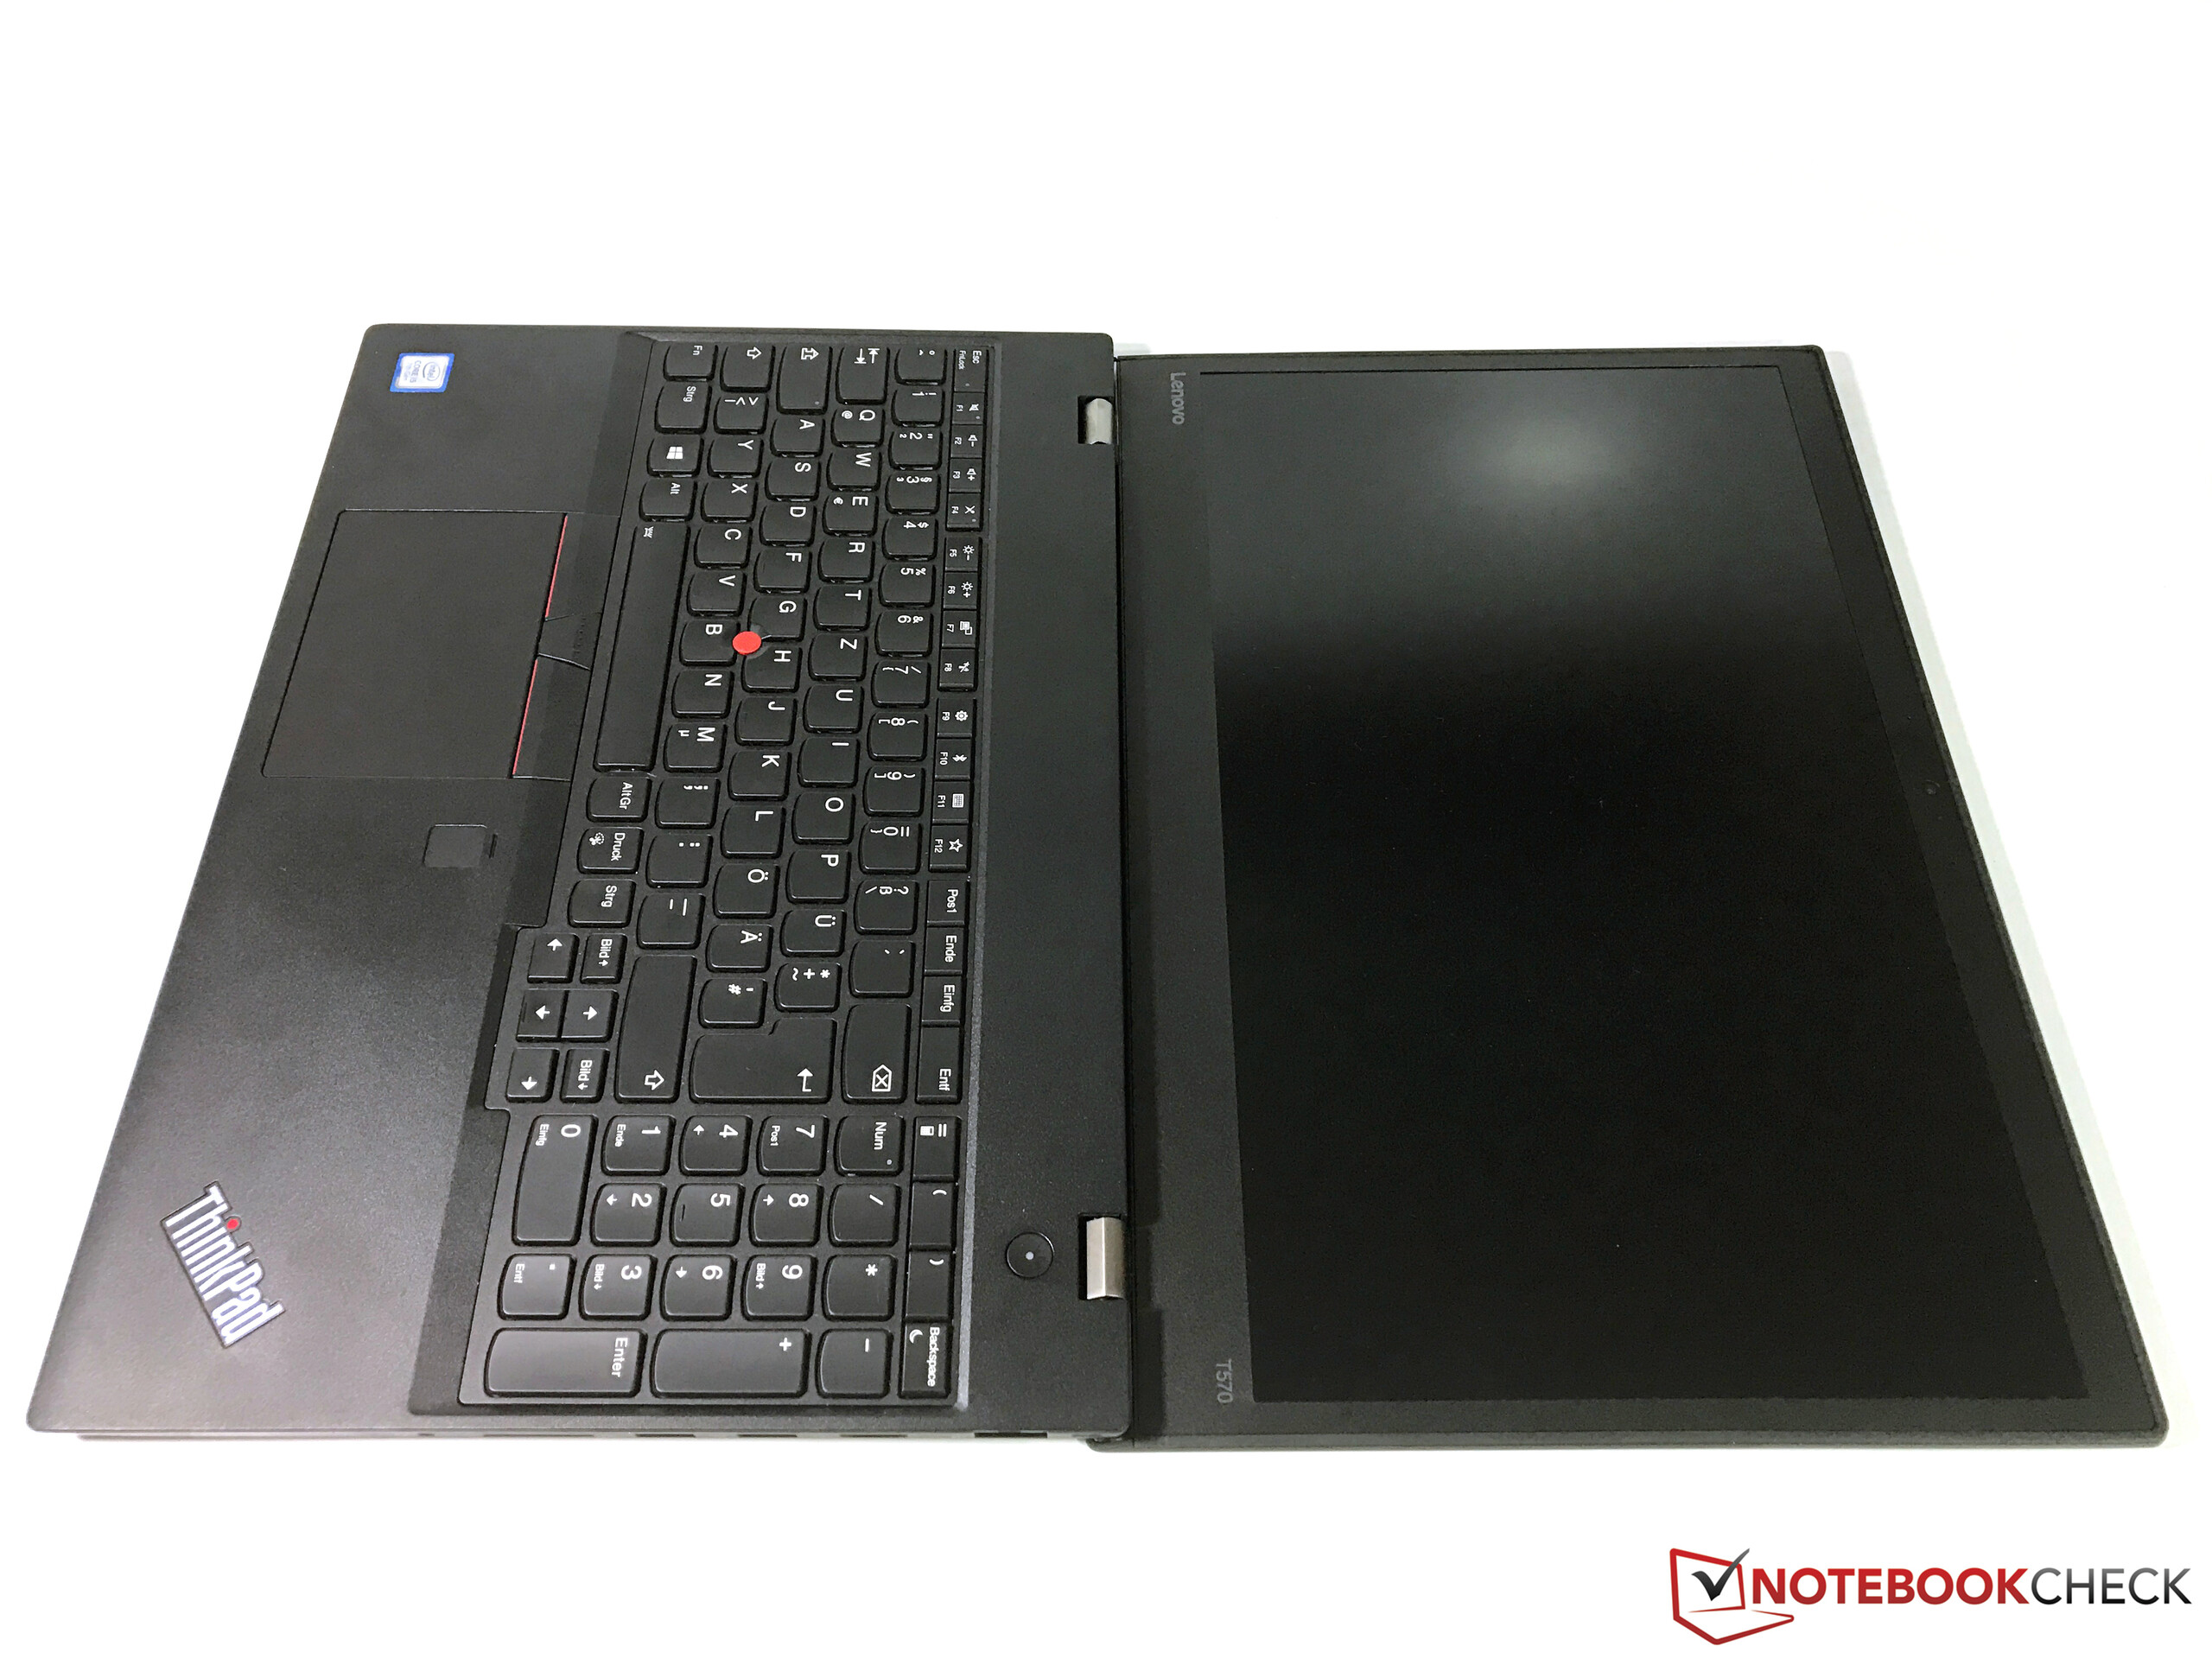
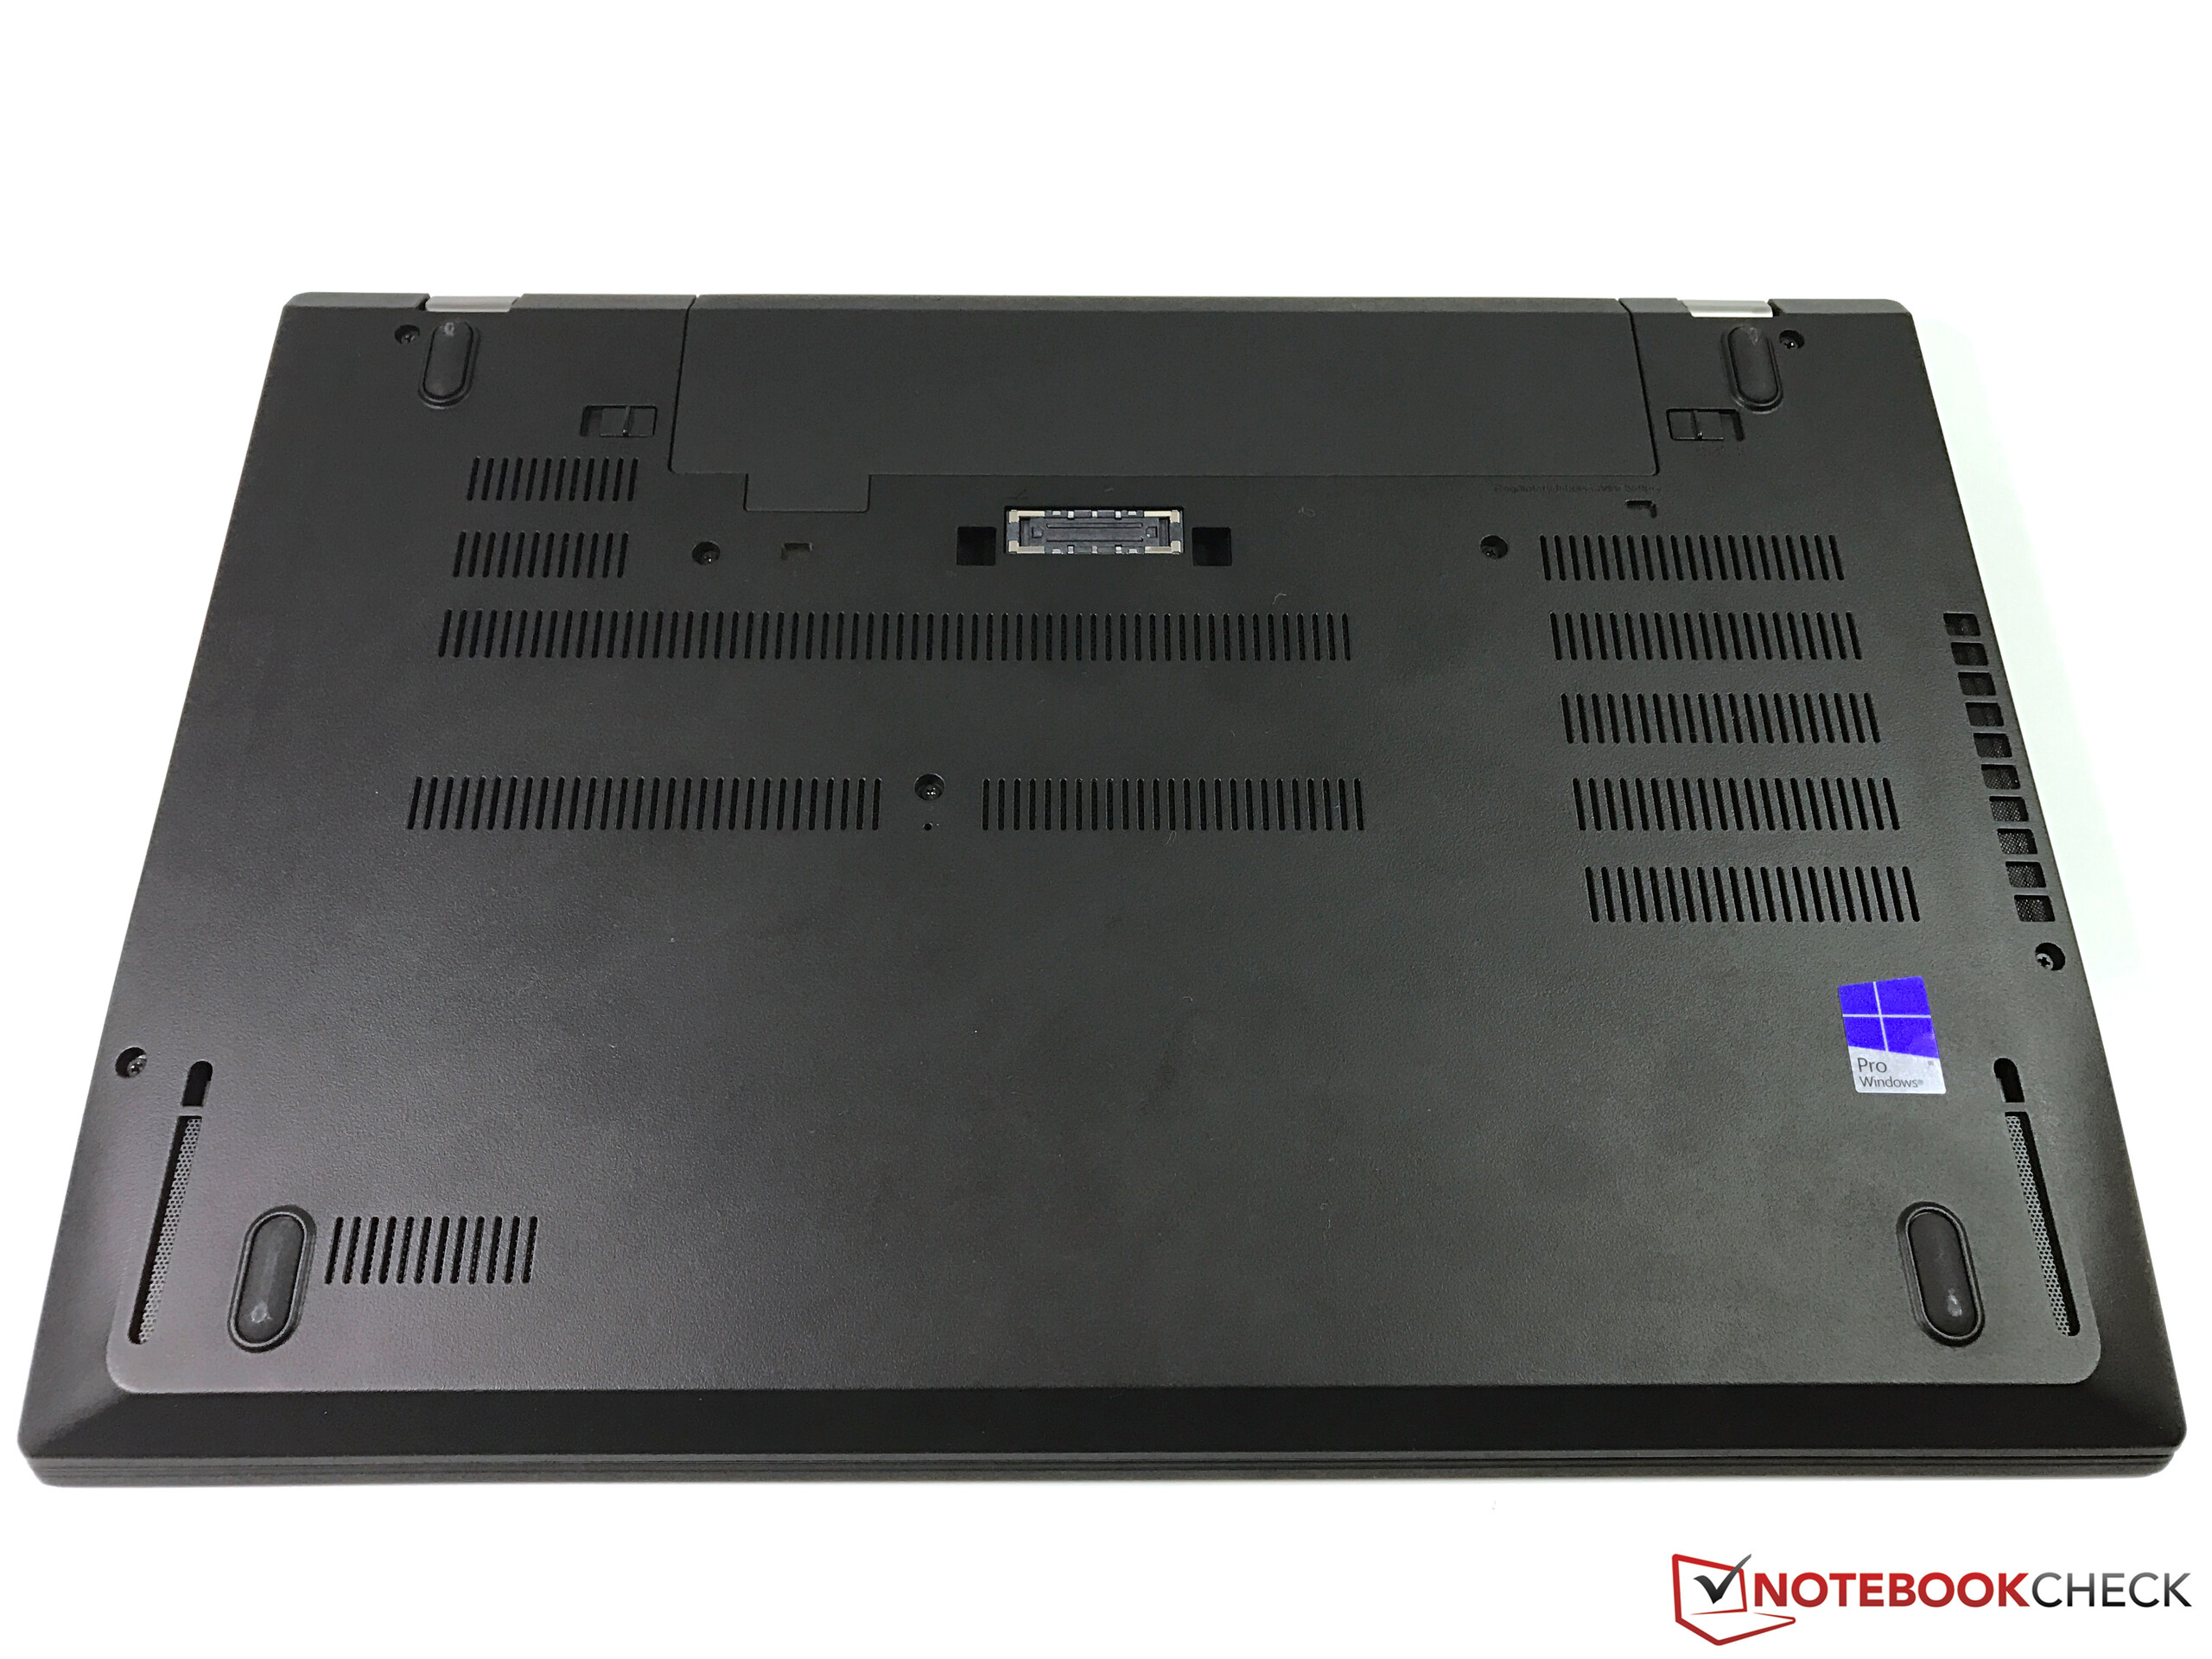
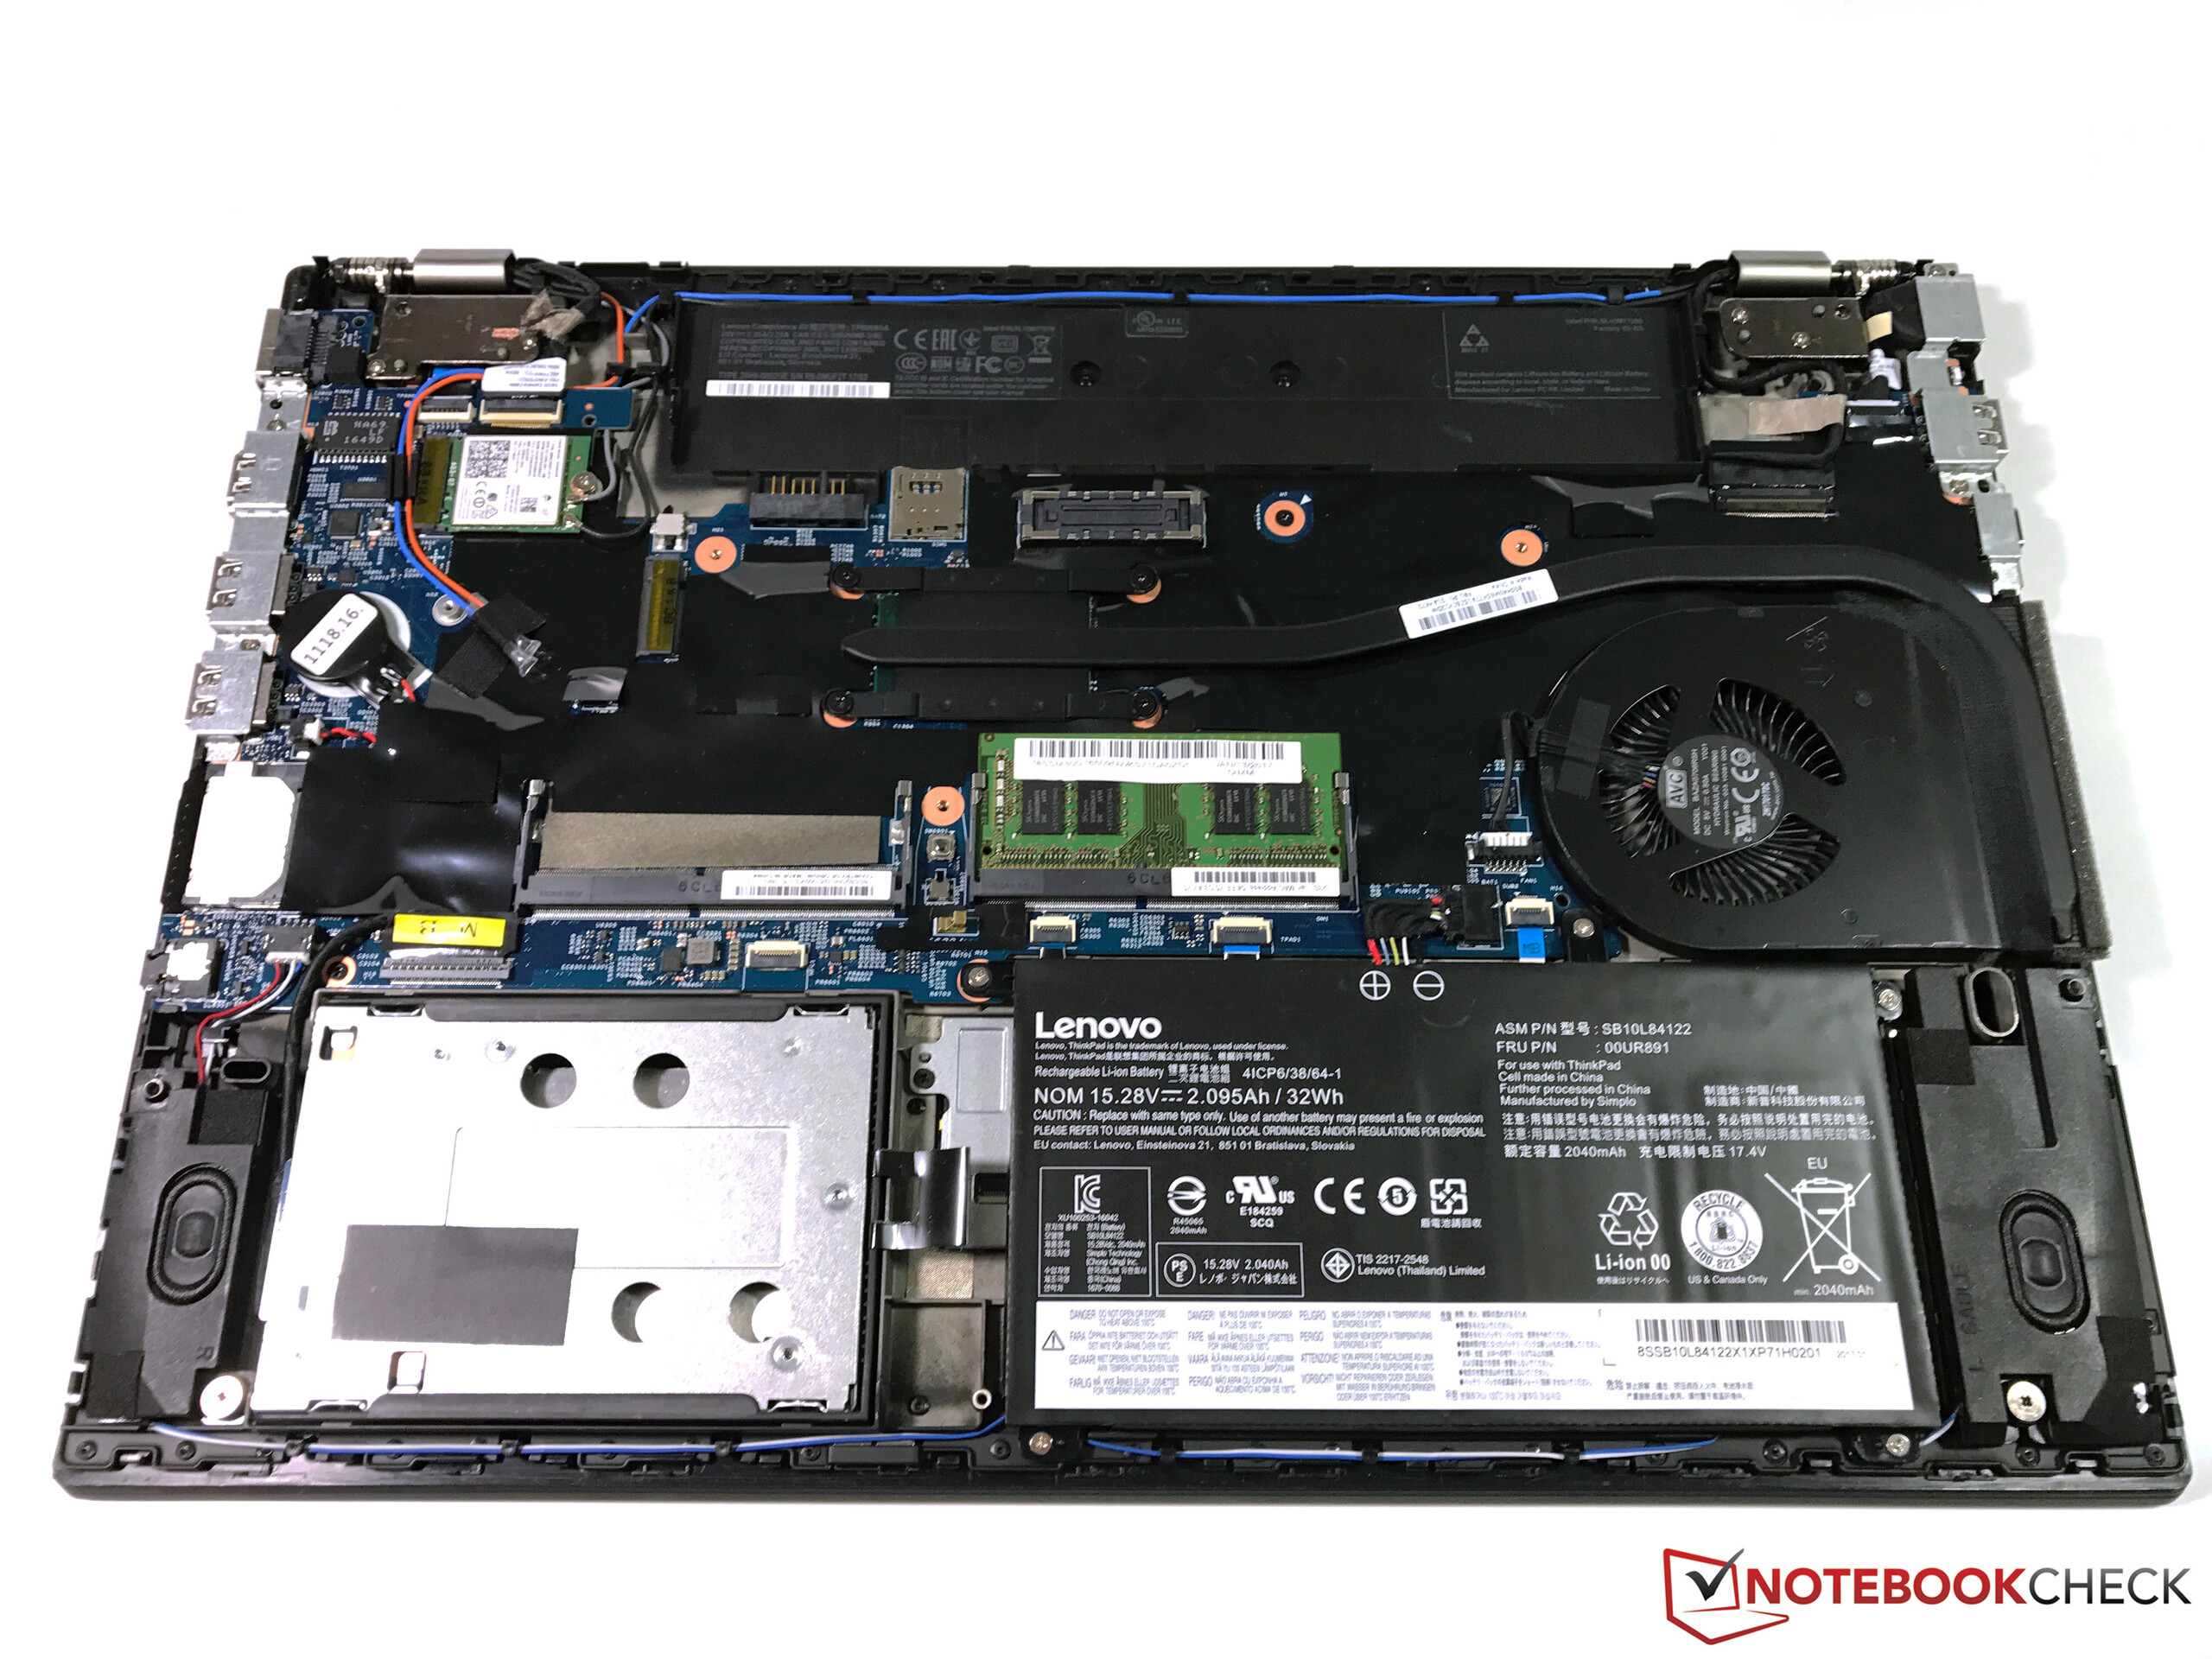
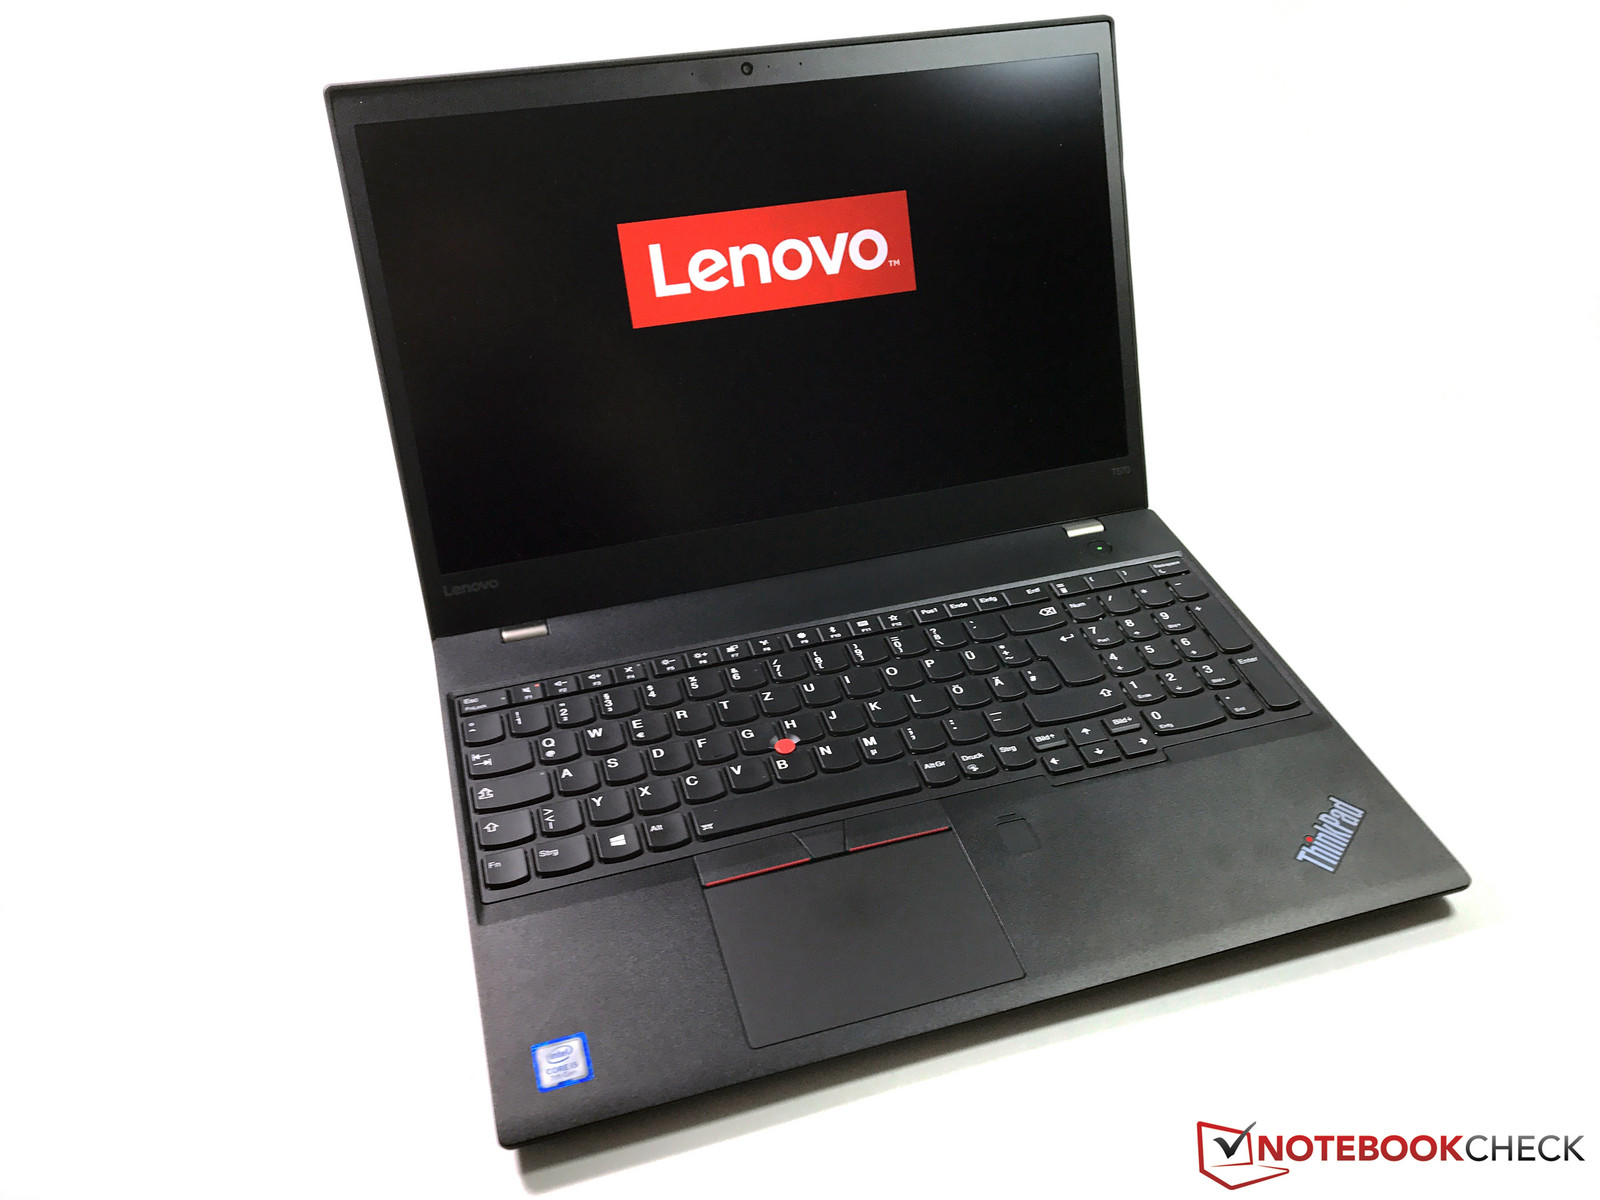
我们真的很喜欢更加紧凑的机身。联想在T系列的最新型号上回到了黑色的外壳设计,并且使其更加小巧。这点在窄边框上十分明显。稳定性和制造质量并没有为紧凑的机身做出任何妥协。但是,试图接触内部组件是很复杂的,这点已经在同系列更小的T470机型上得到体现。
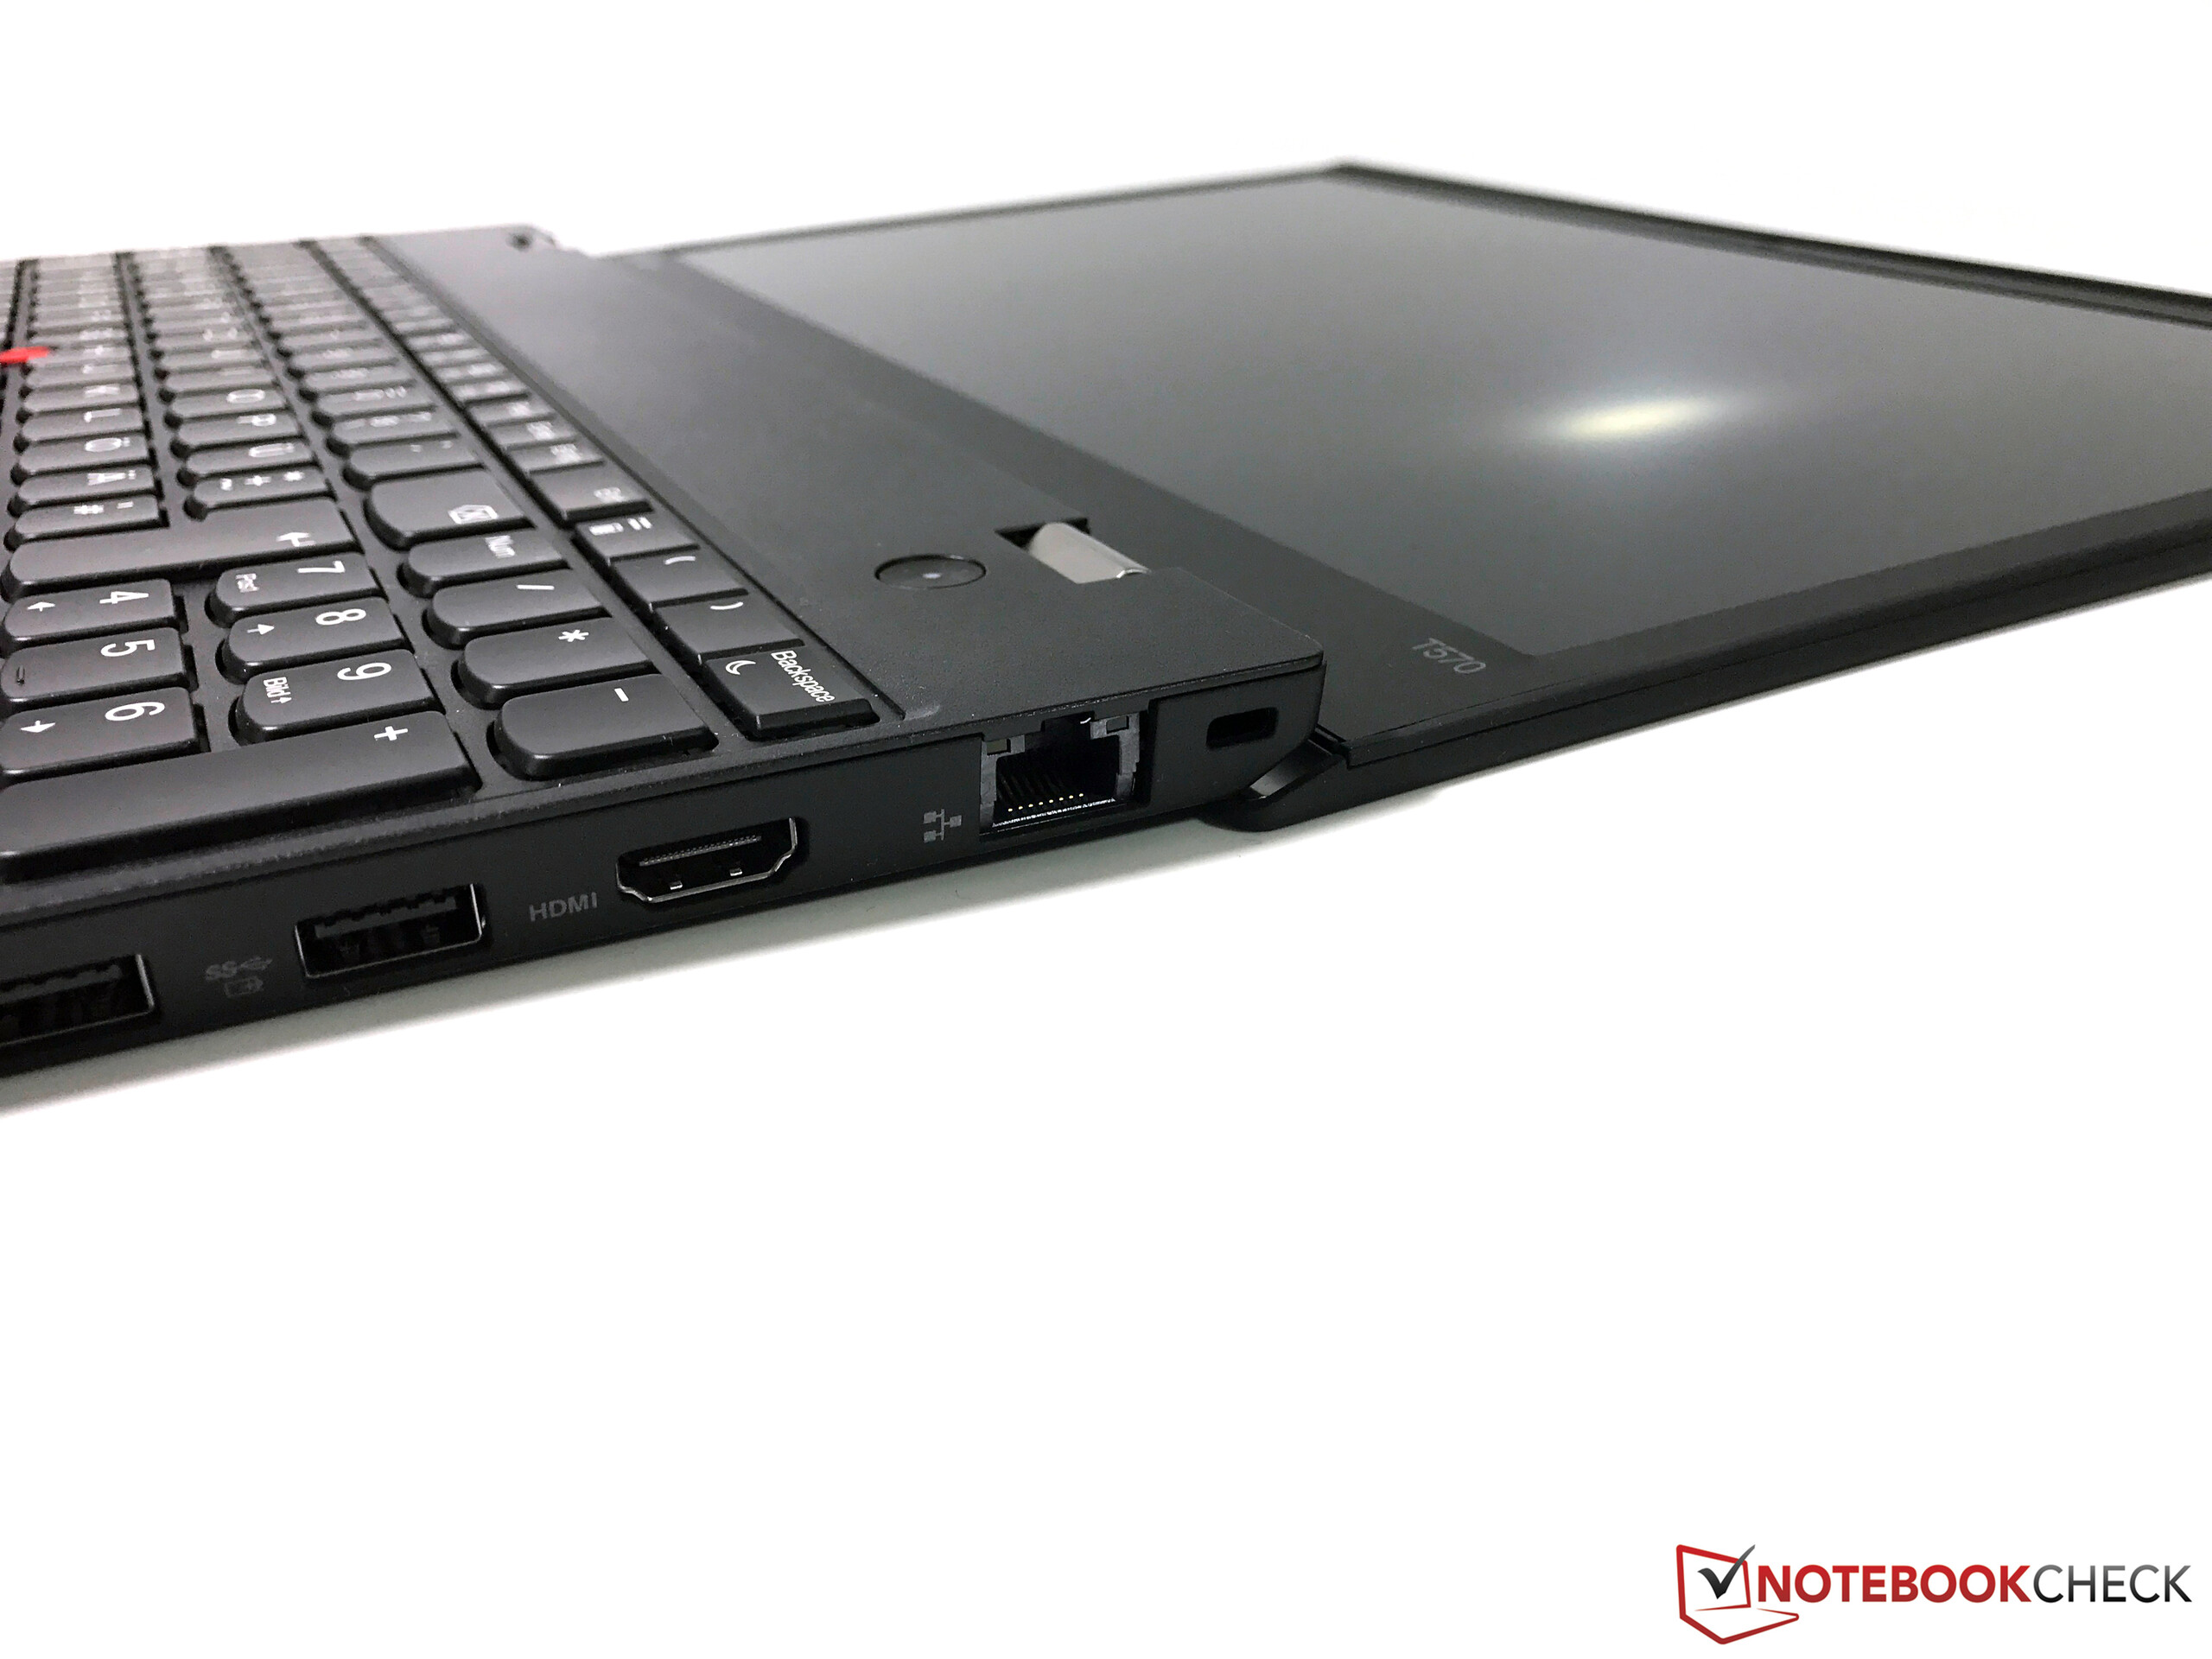
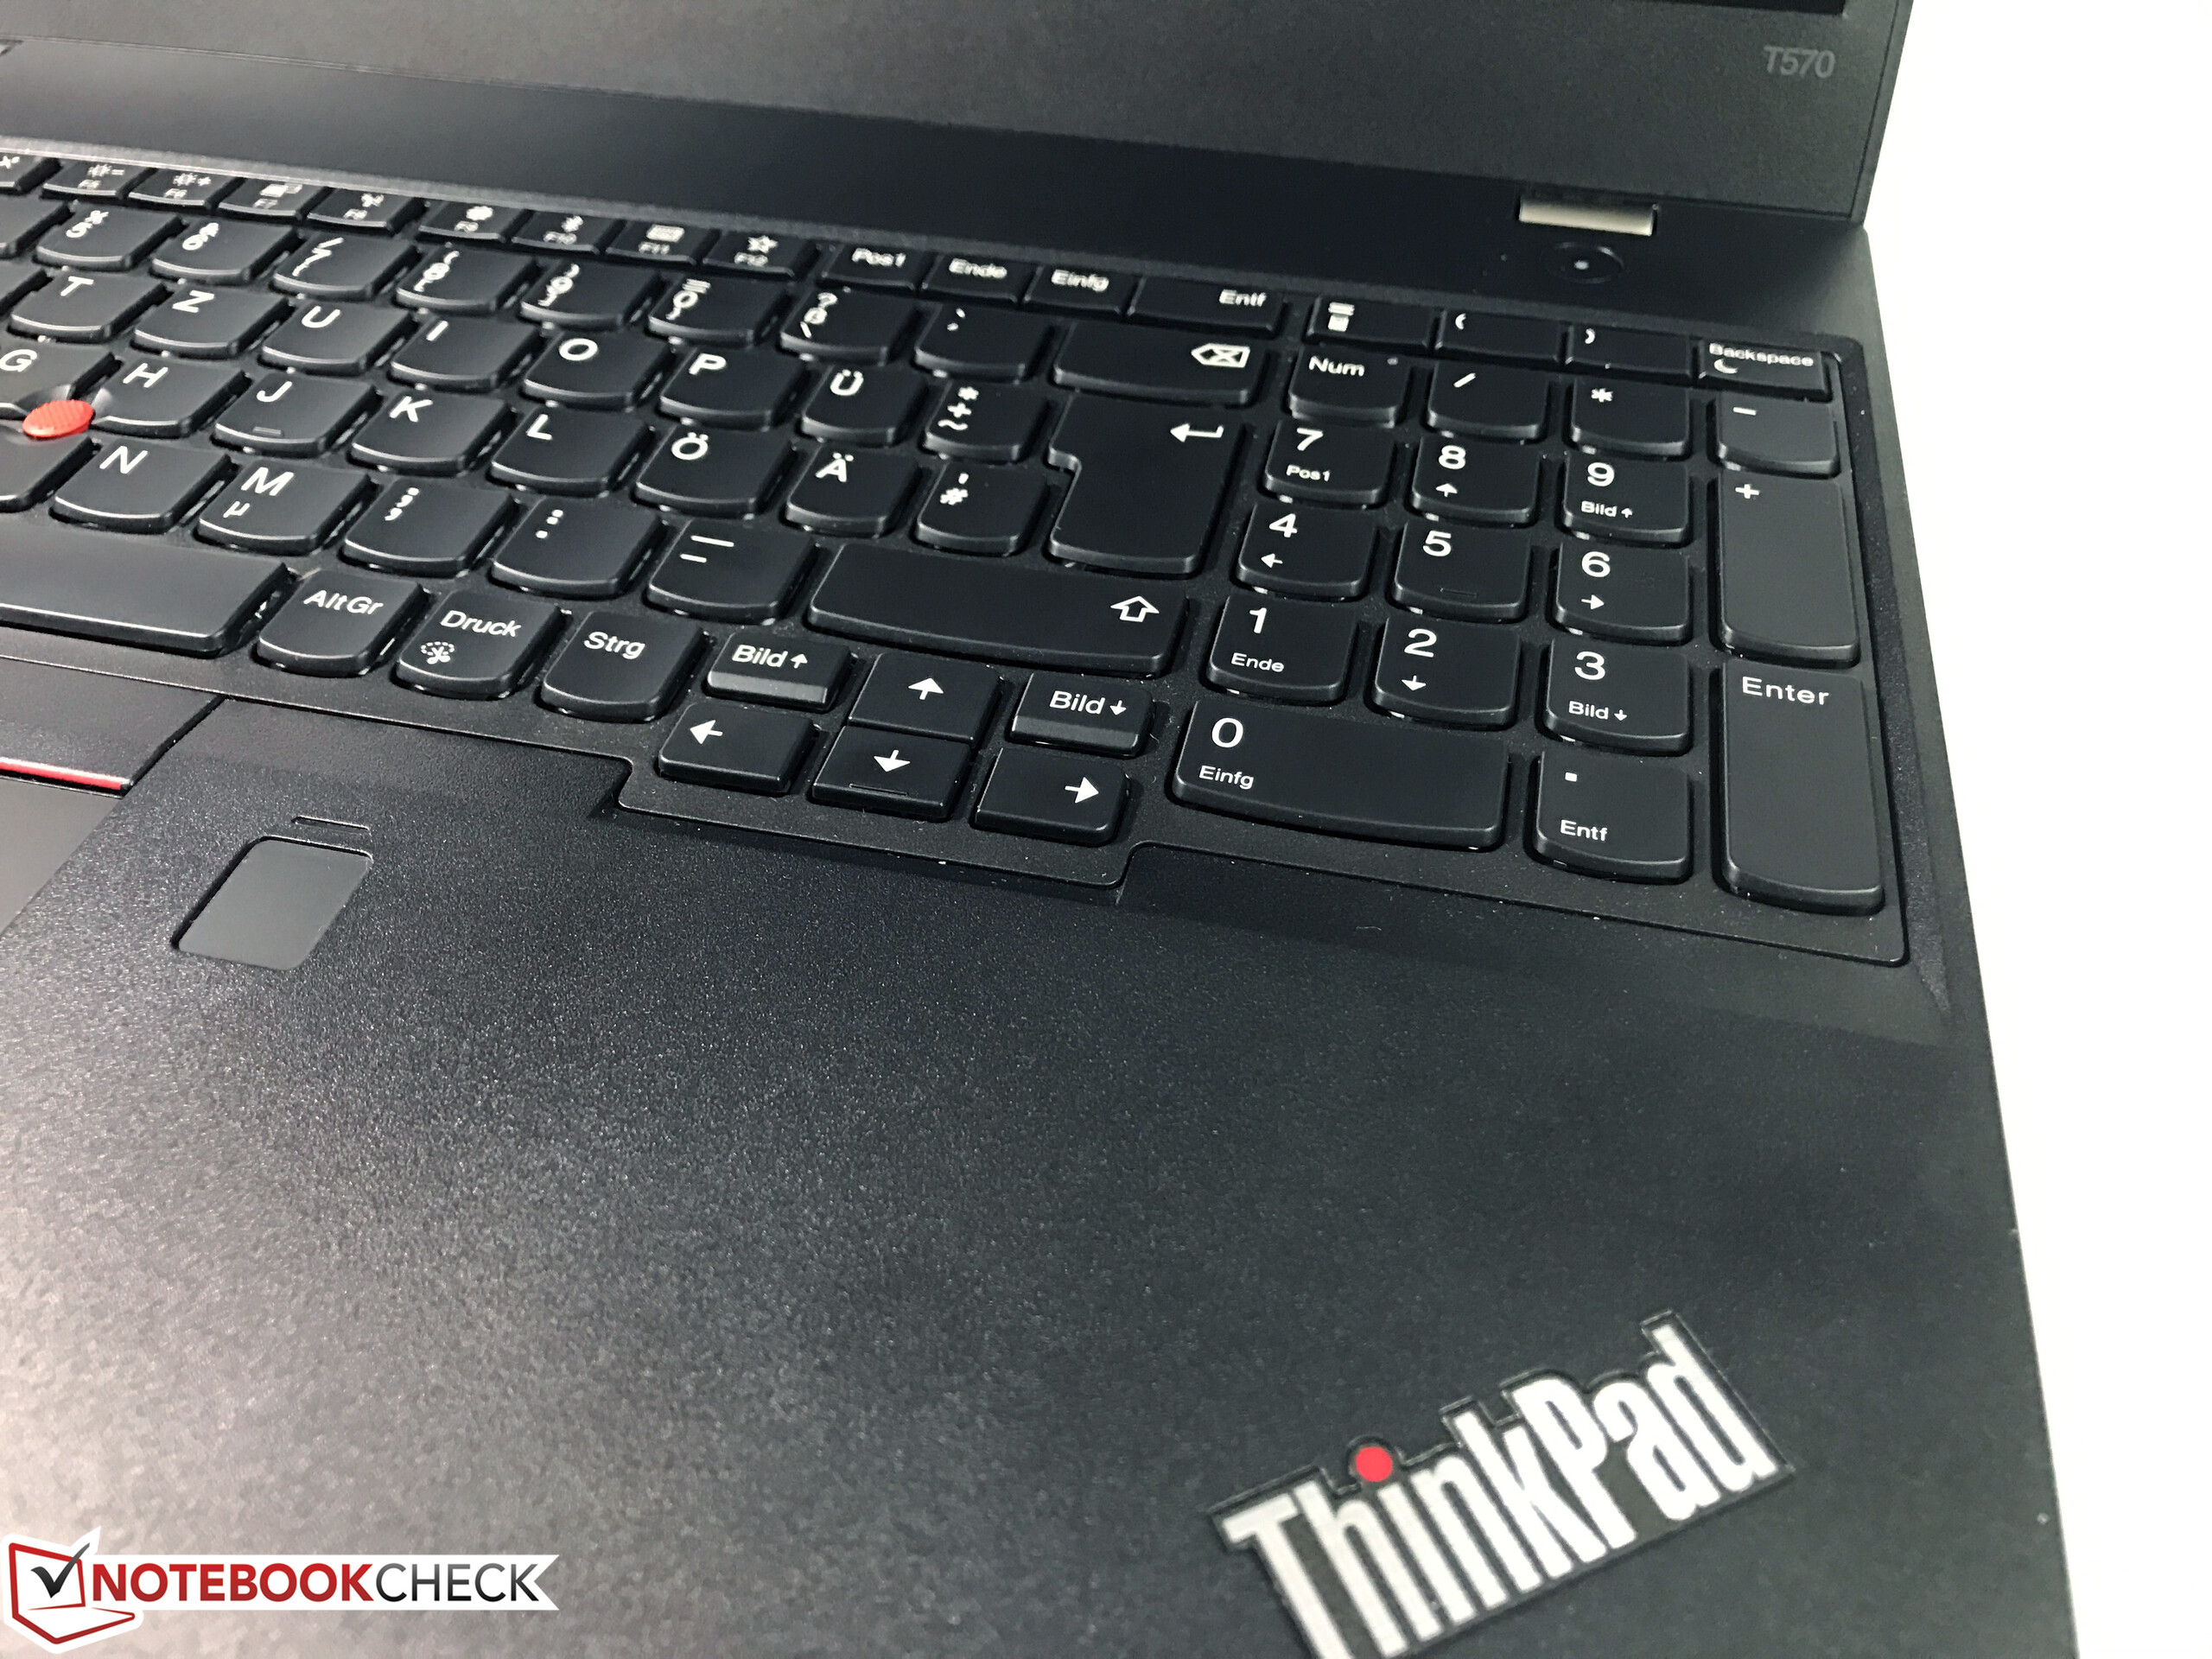
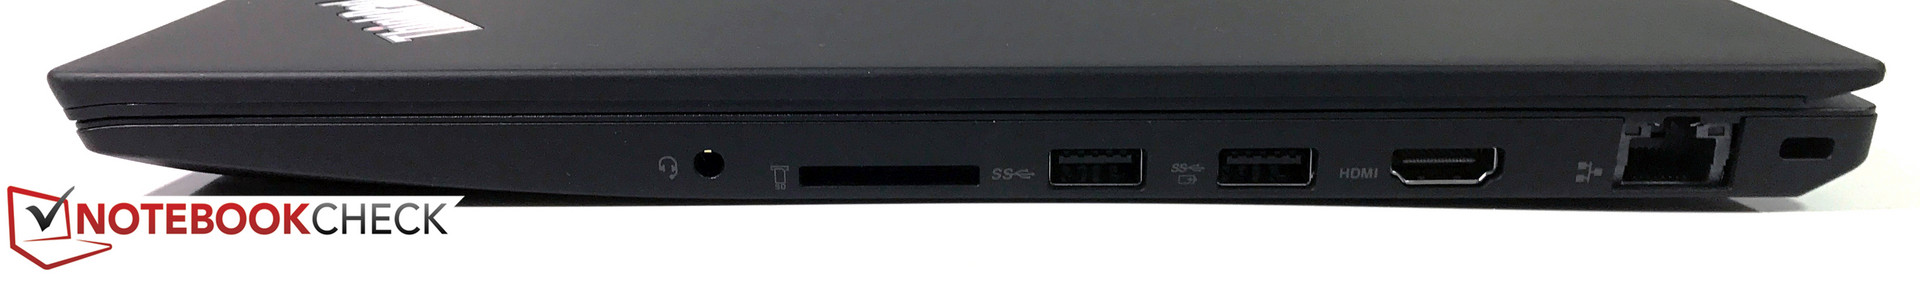
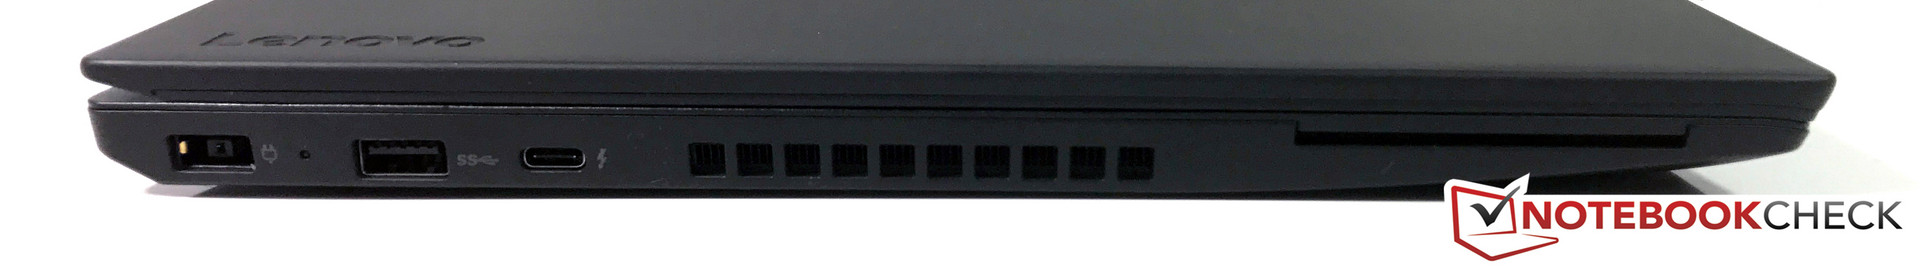
其他优点包括出色的输入设备,尽管由于新的外壳设计有些按键比原来窄,其输入体验依旧没有什么可以批评的地方。触摸板相对于上代也有所改进。联想在其余方面也没有作出任何的妥协,包括安全特性,无线网络性能,接口多样性,以及电池运行时间。
出色外壳,连接性,以及出色的输入设备,不过有中庸的全高清屏幕及偶然的性能下降。联想 ThinkPad T570 只要经过一些改进就能成为一台极为出色的商务本。
有一个不足之处仍未改变,由于联想仍使用了一个很平庸的全高清面板,它基于IPS并且比起它的上一代ThinkPad T560(约250尼特)亮。但它比起它的其他竞争者来说毫无胜算,色域也受到限制。
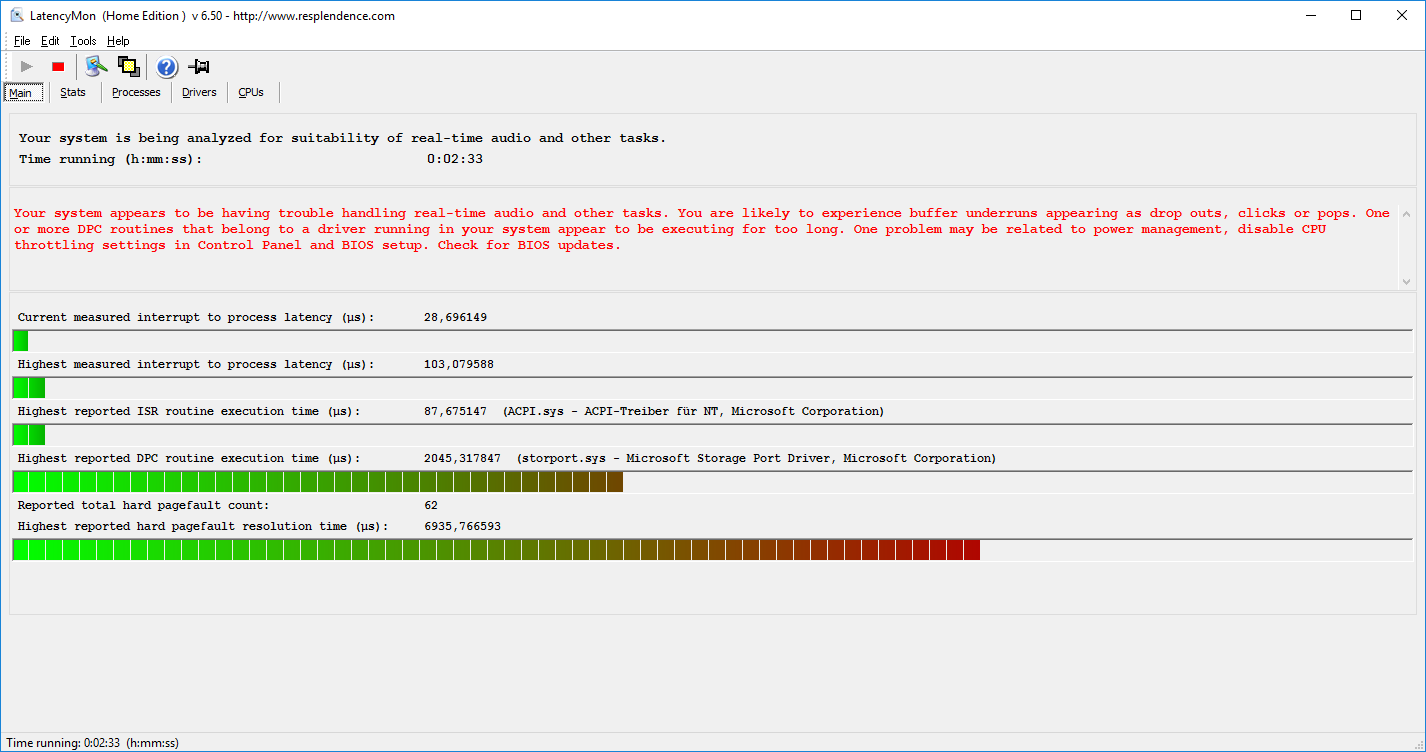
我们对偶尔的性能下降及发热情况感到很惊讶。因为性能问题很少发生,我们认为应该是软件问题。理论上来说,ULV处理器应该是能够发挥所有的性能的,但有时它无法全速运行而且将会在短时间后触及温度保护线。电池供电下显著的性能衰减并没有必要,因为处理器本身甚至连基础频率都无法维持。我们希望这个问题很快能够被解决。就像T470s一样,我们因为上述问题在最终评分当中扣去了3分,因此T570在当前状况下并没能达到“十分出色”的评级。
注:本文是基于完整评测的缩减版本,阅读完整的英文评测,请点击这里。
Lenovo ThinkPad T570-20H90002GE
- 04/15/2017 v6 (old)
Andreas Osthoff
Price comparison
