华硕ZenBook 15 (i7-8565U, GTX1050 Max-Q) 笔记本电脑评测
| SD Card Reader | |
| average JPG Copy Test (av. of 3 runs) | |
| HP EliteBook 1050 G1-4QY20EA (Toshiba Exceria Pro SDXC 64 GB UHS-II) | |
| Average of class Multimedia (23 - 531, n=43, last 2 years) | |
| Lenovo ThinkPad T580-20L9001AUS (Toshiba Exceria Pro SDXC 64 GB UHS-II) | |
| Asus ZenBook 15 UX533FD (Toshiba Exceria Pro SDXC 64 GB UHS-II) | |
| Asus ZenBook Pro 15 UX580GE (Toshiba Exceria Pro M501 UHS-II) | |
| maximum AS SSD Seq Read Test (1GB) | |
| HP EliteBook 1050 G1-4QY20EA (Toshiba Exceria Pro SDXC 64 GB UHS-II) | |
| Average of class Multimedia (27.9 - 1455, n=42, last 2 years) | |
| Lenovo ThinkPad T580-20L9001AUS (Toshiba Exceria Pro SDXC 64 GB UHS-II) | |
| Asus ZenBook 15 UX533FD (Toshiba Exceria Pro SDXC 64 GB UHS-II) | |
| |||||||||||||||||||||||||
Brightness Distribution: 81 %
Center on Battery: 311 cd/m²
Contrast: 1296:1 (Black: 0.24 cd/m²)
ΔE ColorChecker Calman: 5.1 | ∀{0.5-29.43 Ø4.73}
calibrated: 2.48
ΔE Greyscale Calman: 4.93 | ∀{0.09-98 Ø4.97}
88% sRGB (Argyll 1.6.3 3D)
58% AdobeRGB 1998 (Argyll 1.6.3 3D)
64.6% AdobeRGB 1998 (Argyll 3D)
88.4% sRGB (Argyll 3D)
67.2% Display P3 (Argyll 3D)
Gamma: 2.44
CCT: 7641 K
| Asus ZenBook 15 UX533FD BOE07D8, , 1920x1080, 15.6" | Razer Blade 15 Base Model BOE NV156FHM-N61, , 1920x1080, 15.6" | Lenovo ThinkPad T580-20L9001AUS B156HAK02.0, , 1920x1080, 15.6" | HP EliteBook 1050 G1-4QY20EA AUO30EB, , 3840x2160, 15.6" | Asus ZenBook Pro 15 UX580GE AU Optronics B156ZAN03.1, , 3840x2160, 15.6" | |
|---|---|---|---|---|---|
| Display | -2% | -41% | 4% | 31% | |
| Display P3 Coverage (%) | 67.2 | 66.3 -1% | 36.94 -45% | 67.8 1% | 85.9 28% |
| sRGB Coverage (%) | 88.4 | 86.6 -2% | 55.3 -37% | 94.1 6% | 100 13% |
| AdobeRGB 1998 Coverage (%) | 64.6 | 63.3 -2% | 38.16 -41% | 67.9 5% | 99.1 53% |
| Response Times | 9% | 26% | -1% | 20% | |
| Response Time Grey 50% / Grey 80% * (ms) | 45 ? | 39.2 ? 13% | 33.2 ? 26% | 56 ? -24% | 44 ? 2% |
| Response Time Black / White * (ms) | 37 ? | 35.2 ? 5% | 27.6 ? 25% | 29 ? 22% | 22.8 ? 38% |
| PWM Frequency (Hz) | 21190 ? | ||||
| Screen | -2% | -26% | 7% | 3% | |
| Brightness middle (cd/m²) | 311 | 273.6 -12% | 254.5 -18% | 440 41% | 357.6 15% |
| Brightness (cd/m²) | 303 | 262 -14% | 238 -21% | 389 28% | 350 16% |
| Brightness Distribution (%) | 81 | 86 6% | 87 7% | 83 2% | 85 5% |
| Black Level * (cd/m²) | 0.24 | 0.3 -25% | 0.27 -13% | 0.34 -42% | 0.35 -46% |
| Contrast (:1) | 1296 | 912 -30% | 943 -27% | 1294 0% | 1022 -21% |
| Colorchecker dE 2000 * | 5.1 | 3.22 37% | 4.58 10% | 5.04 1% | 4.12 19% |
| Colorchecker dE 2000 max. * | 8.91 | 7.61 15% | 17.99 -102% | 6.99 22% | 9.91 -11% |
| Colorchecker dE 2000 calibrated * | 2.48 | 4.1 -65% | 4.34 -75% | 2.04 18% | 4.23 -71% |
| Greyscale dE 2000 * | 4.93 | 1.4 72% | 3.3 33% | 4.98 -1% | 1.8 63% |
| Gamma | 2.44 90% | 2.24 98% | 2.403 92% | 2.48 89% | 2.17 101% |
| CCT | 7641 85% | 6636 98% | 6355 102% | 7777 84% | 6613 98% |
| Color Space (Percent of AdobeRGB 1998) (%) | 58 | 56.4 -3% | 35 -40% | 61 5% | 87.5 51% |
| Color Space (Percent of sRGB) (%) | 88 | 86.2 -2% | 55 -37% | 94 7% | 100 14% |
| Total Average (Program / Settings) | 2% /
-1% | -14% /
-22% | 3% /
6% | 18% /
11% |
* ... smaller is better
Display Response Times
| ↔ Response Time Black to White | ||
|---|---|---|
| 37 ms ... rise ↗ and fall ↘ combined | ↗ 23 ms rise | 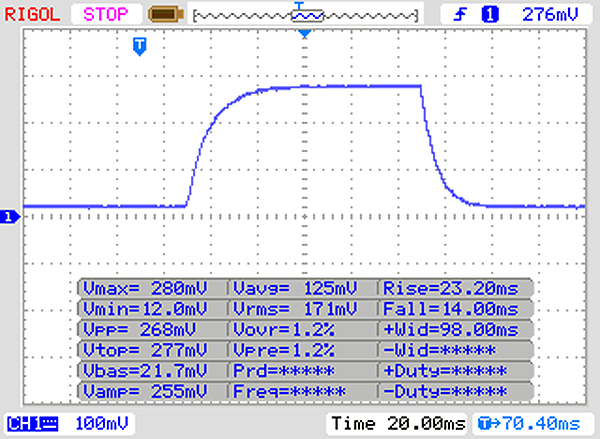 |
| ↘ 14 ms fall | ||
| The screen shows slow response rates in our tests and will be unsatisfactory for gamers. In comparison, all tested devices range from 0.1 (minimum) to 240 (maximum) ms. » 95 % of all devices are better. This means that the measured response time is worse than the average of all tested devices (19.9 ms). | ||
| ↔ Response Time 50% Grey to 80% Grey | ||
| 45 ms ... rise ↗ and fall ↘ combined | ↗ 21 ms rise | 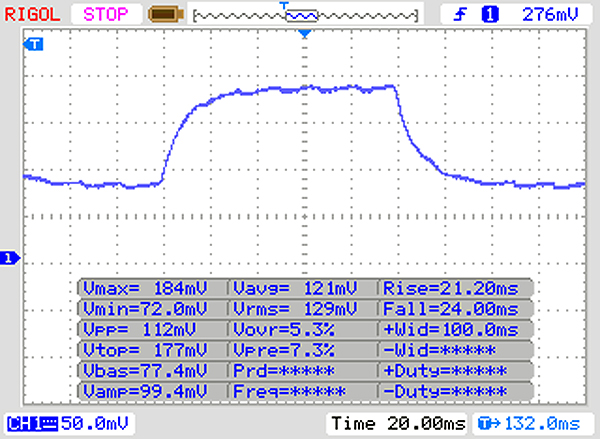 |
| ↘ 24 ms fall | ||
| The screen shows slow response rates in our tests and will be unsatisfactory for gamers. In comparison, all tested devices range from 0.165 (minimum) to 636 (maximum) ms. » 77 % of all devices are better. This means that the measured response time is worse than the average of all tested devices (31.1 ms). | ||
Screen Flickering / PWM (Pulse-Width Modulation)
| Screen flickering / PWM not detected | 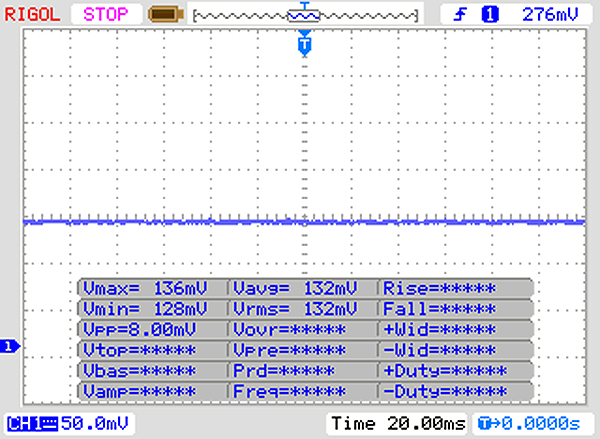 | ||
In comparison: 52 % of all tested devices do not use PWM to dim the display. If PWM was detected, an average of 7784 (minimum: 5 - maximum: 343500) Hz was measured. | |||
| PCMark 8 Home Score Accelerated v2 | 4052 points | |
| PCMark 8 Work Score Accelerated v2 | 5381 points | |
| PCMark 10 Score | 4443 points | |
Help | ||
| Asus ZenBook 15 UX533FD WDC PC SN520 SDAPNUW-512G | Razer Blade 15 Base Model Samsung SSD PM981 MZVLB256HAHQ | Lenovo ThinkPad T580-20L9001AUS Samsung SSD PM981 MZVLB512HAJQ | HP EliteBook 1050 G1-4QY20EA Toshiba XG5-P KXG50PNV2T04 | Asus ZenBook Pro 15 UX580GE Samsung SSD PM961 1TB M.2 PCIe 3.0 x4 NVMe (MZVLW1T0) | Average WDC PC SN520 SDAPNUW-512G | |
|---|---|---|---|---|---|---|
| CrystalDiskMark 5.2 / 6 | 22% | -4% | -1% | 17% | 12% | |
| Write 4K (MB/s) | 126.2 | 112.5 -11% | 122.1 -3% | 94.8 -25% | 125 -1% | 138.5 ? 10% |
| Read 4K (MB/s) | 41.2 | 43.09 5% | 44.61 8% | 26.45 -36% | 44.68 8% | 44.2 ? 7% |
| Write Seq (MB/s) | 1055 | 1450 37% | 826 -22% | 1037 -2% | 1059 0% | 1265 ? 20% |
| Read Seq (MB/s) | 884 | 1392 57% | 811 -8% | 1280 45% | 772 -13% | 1237 ? 40% |
| Write 4K Q32T1 (MB/s) | 445.5 | 356.1 -20% | 293.9 -34% | 277.6 -38% | 507 14% | 404 ? -9% |
| Read 4K Q32T1 (MB/s) | 338.8 | 406.9 20% | 374.8 11% | 333.9 -1% | 614 81% | 421 ? 24% |
| Write Seq Q32T1 (MB/s) | 1453 | 1451 0% | 1714 18% | 1037 -29% | 1763 21% | 1491 ? 3% |
| Read Seq Q32T1 (MB/s) | 1734 | 3272 89% | 1772 2% | 3135 81% | 2171 25% | 1741 ? 0% |
| Write 4K Q8T8 (MB/s) | 1044 | 715 ? | ||||
| Read 4K Q8T8 (MB/s) | 914 | 1027 ? | ||||
| AS SSD | 31% | 46% | 26% | 69% | 29% | |
| Seq Read (MB/s) | 579 | 1803 211% | 1454 151% | 2454 324% | 2099 263% | 1363 ? 135% |
| Seq Write (MB/s) | 411.8 | 1367 232% | 1324 222% | 948 130% | 1729 320% | 1227 ? 198% |
| 4K Read (MB/s) | 41.81 | 40.75 -3% | 50.8 22% | 19.07 -54% | 37.78 -10% | 40.8 ? -2% |
| 4K Write (MB/s) | 131.6 | 93 -29% | 106.2 -19% | 105.4 -20% | 100.9 -23% | 127.3 ? -3% |
| 4K-64 Read (MB/s) | 975 | 749 -23% | 1140 17% | 856 -12% | 1431 47% | 957 ? -2% |
| 4K-64 Write (MB/s) | 1047 | 1270 21% | 1325 27% | 953 -9% | 1273 22% | 1081 ? 3% |
| Access Time Read * (ms) | 0.08 | 0.113 -41% | 0.047 41% | 0.051 36% | 0.04 50% | 0.07744 ? 3% |
| Access Time Write * (ms) | 0.027 | 0.04 -48% | 0.035 -30% | 0.056 -107% | 0.036 -33% | 0.03671 ? -36% |
| Score Read (Points) | 1075 | 970 -10% | 1336 24% | 1120 4% | 1679 56% | 1134 ? 5% |
| Score Write (Points) | 1220 | 1499 23% | 1564 28% | 1153 -5% | 1547 27% | 1331 ? 9% |
| Score Total (Points) | 2845 | 2952 4% | 3587 26% | 2768 -3% | 4065 43% | 3046 ? 7% |
| Copy ISO MB/s (MB/s) | 1892 | 2507 | 1045 | 1169 ? | ||
| Copy Program MB/s (MB/s) | 495.5 | 395.4 | 430.9 | 446 ? | ||
| Copy Game MB/s (MB/s) | 1070 | 1129 | 728 | 874 ? | ||
| Total Average (Program / Settings) | 27% /
27% | 21% /
25% | 13% /
15% | 43% /
47% | 21% /
22% |
* ... smaller is better

| 3DMark 06 Standard Score | 9694 points | |
| 3DMark 11 Performance | 7116 points | |
| 3DMark Cloud Gate Standard Score | 17993 points | |
| 3DMark Fire Strike Score | 5209 points | |
Help | ||
| low | med. | high | ultra | |
|---|---|---|---|---|
| BioShock Infinite (2013) | 266 | 252 | 150 | 59 |
| Thief (2014) | 106 | 76 | 66 | 38 |
| The Witcher 3 (2015) | 64 | 60 | 41 | 30 |
| Rise of the Tomb Raider (2016) | 98 | 62 | 36 | 29 |
Noise level
| Idle |
| 30.5 / 30.5 / 30.5 dB(A) |
| Load |
| 40.8 / 41.8 dB(A) |
 | ||
30 dB silent 40 dB(A) audible 50 dB(A) loud |
||
min: | ||
(-) The maximum temperature on the upper side is 47.2 °C / 117 F, compared to the average of 36.8 °C / 98 F, ranging from 21 to 71 °C for the class Multimedia.
(±) The bottom heats up to a maximum of 43.2 °C / 110 F, compared to the average of 39.1 °C / 102 F
(+) In idle usage, the average temperature for the upper side is 25.5 °C / 78 F, compared to the device average of 31.3 °C / 88 F.
(+) The palmrests and touchpad are cooler than skin temperature with a maximum of 30.6 °C / 87.1 F and are therefore cool to the touch.
(±) The average temperature of the palmrest area of similar devices was 28.7 °C / 83.7 F (-1.9 °C / -3.4 F).
Asus ZenBook 15 UX533FD audio analysis
(±) | speaker loudness is average but good (80.3 dB)
Bass 100 - 315 Hz
(-) | nearly no bass - on average 30.5% lower than median
(±) | linearity of bass is average (13% delta to prev. frequency)
Mids 400 - 2000 Hz
(+) | balanced mids - only 2.3% away from median
(+) | mids are linear (3.2% delta to prev. frequency)
Highs 2 - 16 kHz
(+) | balanced highs - only 4.5% away from median
(±) | linearity of highs is average (7.3% delta to prev. frequency)
Overall 100 - 16.000 Hz
(±) | linearity of overall sound is average (20.6% difference to median)
Compared to same class
» 70% of all tested devices in this class were better, 8% similar, 22% worse
» The best had a delta of 5%, average was 17%, worst was 45%
Compared to all devices tested
» 55% of all tested devices were better, 8% similar, 37% worse
» The best had a delta of 4%, average was 24%, worst was 134%
Apple MacBook 12 (Early 2016) 1.1 GHz audio analysis
(+) | speakers can play relatively loud (83.6 dB)
Bass 100 - 315 Hz
(±) | reduced bass - on average 11.3% lower than median
(±) | linearity of bass is average (14.2% delta to prev. frequency)
Mids 400 - 2000 Hz
(+) | balanced mids - only 2.4% away from median
(+) | mids are linear (5.5% delta to prev. frequency)
Highs 2 - 16 kHz
(+) | balanced highs - only 2% away from median
(+) | highs are linear (4.5% delta to prev. frequency)
Overall 100 - 16.000 Hz
(+) | overall sound is linear (10.2% difference to median)
Compared to same class
» 7% of all tested devices in this class were better, 2% similar, 91% worse
» The best had a delta of 5%, average was 18%, worst was 53%
Compared to all devices tested
» 5% of all tested devices were better, 1% similar, 94% worse
» The best had a delta of 4%, average was 24%, worst was 134%
| Off / Standby | |
| Idle | |
| Load |
|
Key:
min: | |
| Asus ZenBook 15 UX533FD i7-8565U, GeForce GTX 1050 Max-Q, WDC PC SN520 SDAPNUW-512G, IPS, 1920x1080, 15.6" | Razer Blade 15 Base Model i7-8750H, GeForce GTX 1060 Max-Q, Samsung SSD PM981 MZVLB256HAHQ, IPS, 1920x1080, 15.6" | Lenovo ThinkPad T580-20L9001AUS i7-8650U, UHD Graphics 620, Samsung SSD PM981 MZVLB512HAJQ, IPS, 1920x1080, 15.6" | HP EliteBook 1050 G1-4QY20EA i7-8750H, GeForce GTX 1050 Max-Q, Toshiba XG5-P KXG50PNV2T04, IPS LED, 3840x2160, 15.6" | Asus ZenBook Pro 15 UX580GE i9-8950HK, GeForce GTX 1050 Ti Mobile, Samsung SSD PM961 1TB M.2 PCIe 3.0 x4 NVMe (MZVLW1T0), IPS, 3840x2160, 15.6" | Average NVIDIA GeForce GTX 1050 Max-Q | Average of class Multimedia | |
|---|---|---|---|---|---|---|---|
| Power Consumption | -99% | 0% | -45% | -127% | -24% | -34% | |
| Idle Minimum * (Watt) | 2.7 | 10.2 -278% | 4.7 -74% | 6.1 -126% | 11.7 -333% | 4.48 ? -66% | 5.71 ? -111% |
| Idle Average * (Watt) | 8 | 13.2 -65% | 7.9 1% | 10.2 -27% | 18.5 -131% | 9.58 ? -20% | 10.1 ? -26% |
| Idle Maximum * (Watt) | 10.6 | 17.6 -66% | 11.4 -8% | 13.4 -26% | 22.8 -115% | 11.6 ? -9% | 12.4 ? -17% |
| Load Average * (Watt) | 74 | 99.5 -34% | 47.2 36% | 82 -11% | 97.5 -32% | 77.3 ? -4% | 65 ? 12% |
| Load Maximum * (Watt) | 89 | 133.3 -50% | 48.1 46% | 122 -37% | 111.1 -25% | 105.5 ? -19% | 112.2 ? -26% |
| Witcher 3 ultra * (Watt) | 113.6 | 102.9 |
* ... smaller is better
| Asus ZenBook 15 UX533FD i7-8565U, GeForce GTX 1050 Max-Q, 73 Wh | Razer Blade 15 Base Model i7-8750H, GeForce GTX 1060 Max-Q, 65 Wh | Lenovo ThinkPad T580-20L9001AUS i7-8650U, UHD Graphics 620, 56 Wh | HP EliteBook 1050 G1-4QY20EA i7-8750H, GeForce GTX 1050 Max-Q, 96 Wh | Asus ZenBook Pro 15 UX580GE i9-8950HK, GeForce GTX 1050 Ti Mobile, 71 Wh | Average of class Multimedia | |
|---|---|---|---|---|---|---|
| Battery runtime | -47% | -52% | -21% | -43% | -3% | |
| Reader / Idle (h) | 26.5 | 11.5 -57% | 17.1 -35% | 14 -47% | 25.2 ? -5% | |
| WiFi v1.3 (h) | 8.7 | 5.5 -37% | 4.2 -52% | 8.7 0% | 6.3 -28% | 12 ? 38% |
| Load (h) | 2.9 | 1.5 -48% | 2.1 -28% | 1.3 -55% | 1.675 ? -42% |
Pros
Cons
在我们的评测中,华硕ZenBook 15已经证明了自己是一款非常强大,具有高移动性的笔记本电脑,可以运行现代游戏。纤薄的外形,超长的续航时间和低重量使华硕笔记本电脑更适合在旅途中使用。但是,那些想要使用ZenBook 15玩游戏的人必须在大多数时间内插上电源。
华硕ZenBook 15也可以看作是一款小巧的游戏笔记本,它可以运行所有最新游戏。此外,它在续航时间方面也很出色。
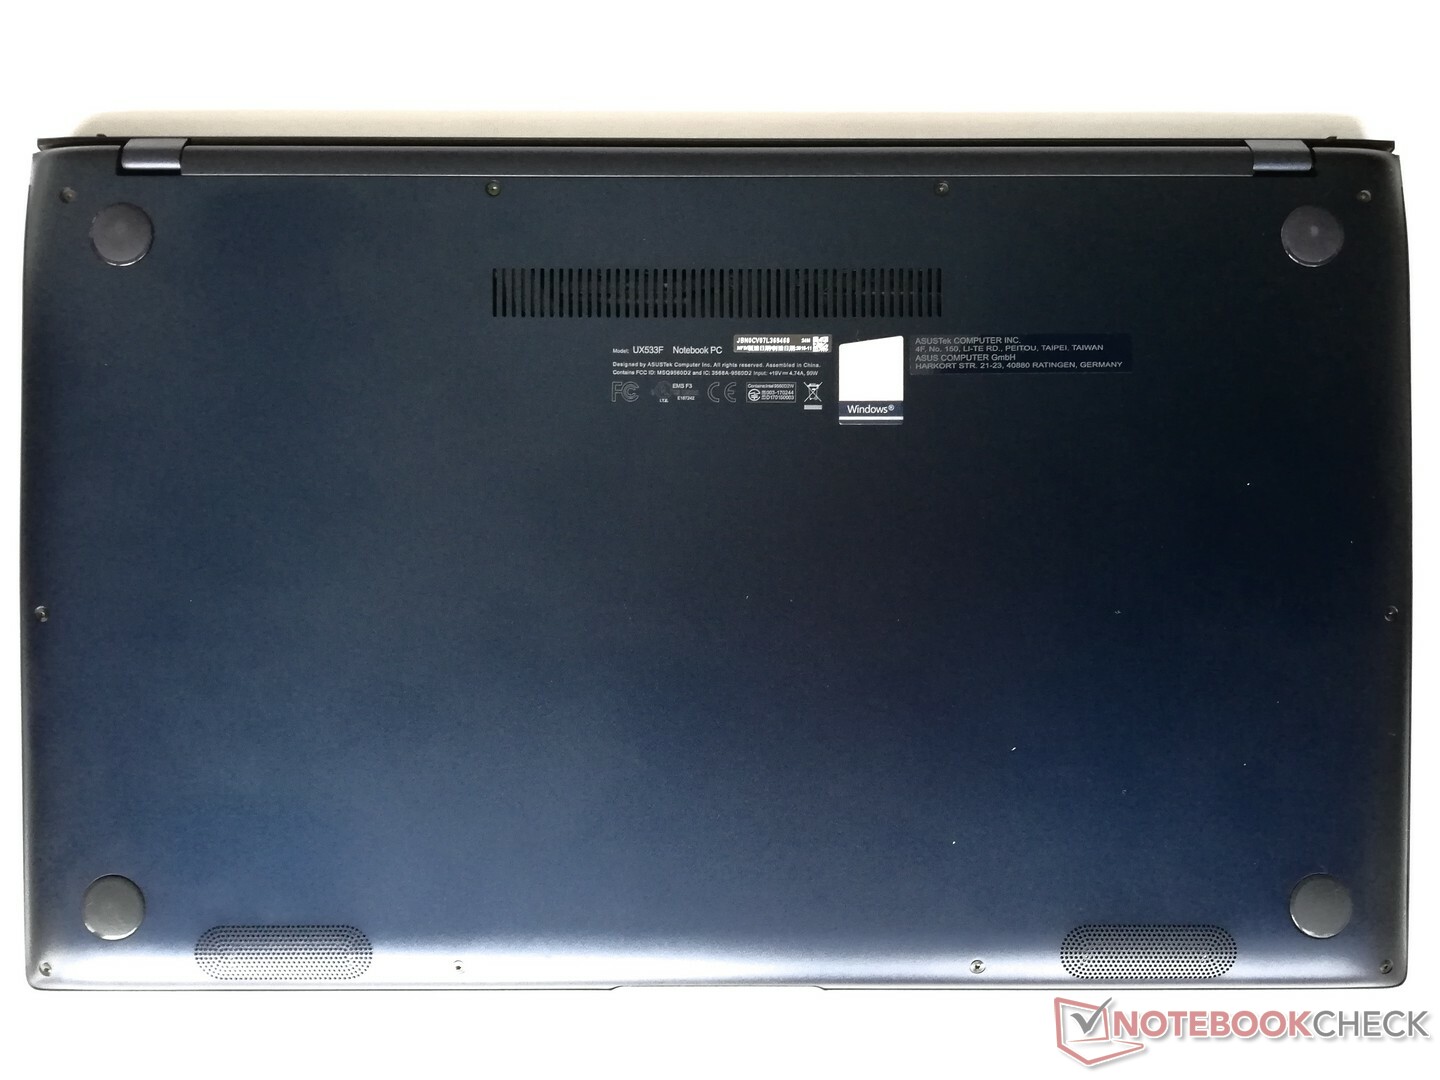
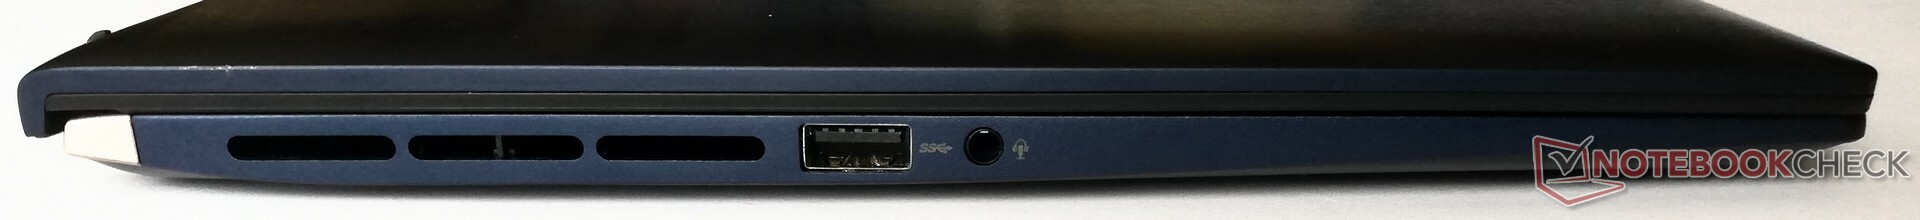
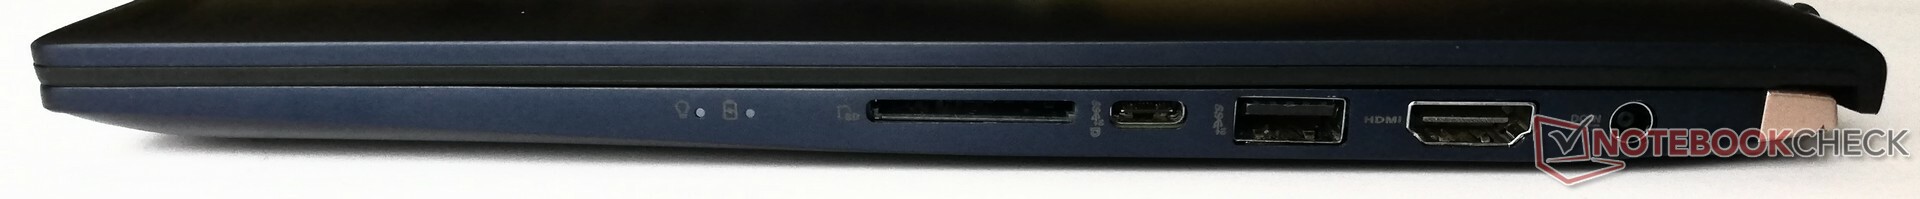
ZenBook 15具有性能非常好的硬件,可以满足大多数用户的需求。USB 3.1 Gen2 Type-C端口可以用来拓展缺少的接口。如果有需要,SSD可以拓展。RAM方面则没有其他升级选项,但鉴于我们的评测设备配备了16 GB的RAM,这点也可以接受。得益于Nvidia的Max-Q技术,温度也得到了很好的控制。
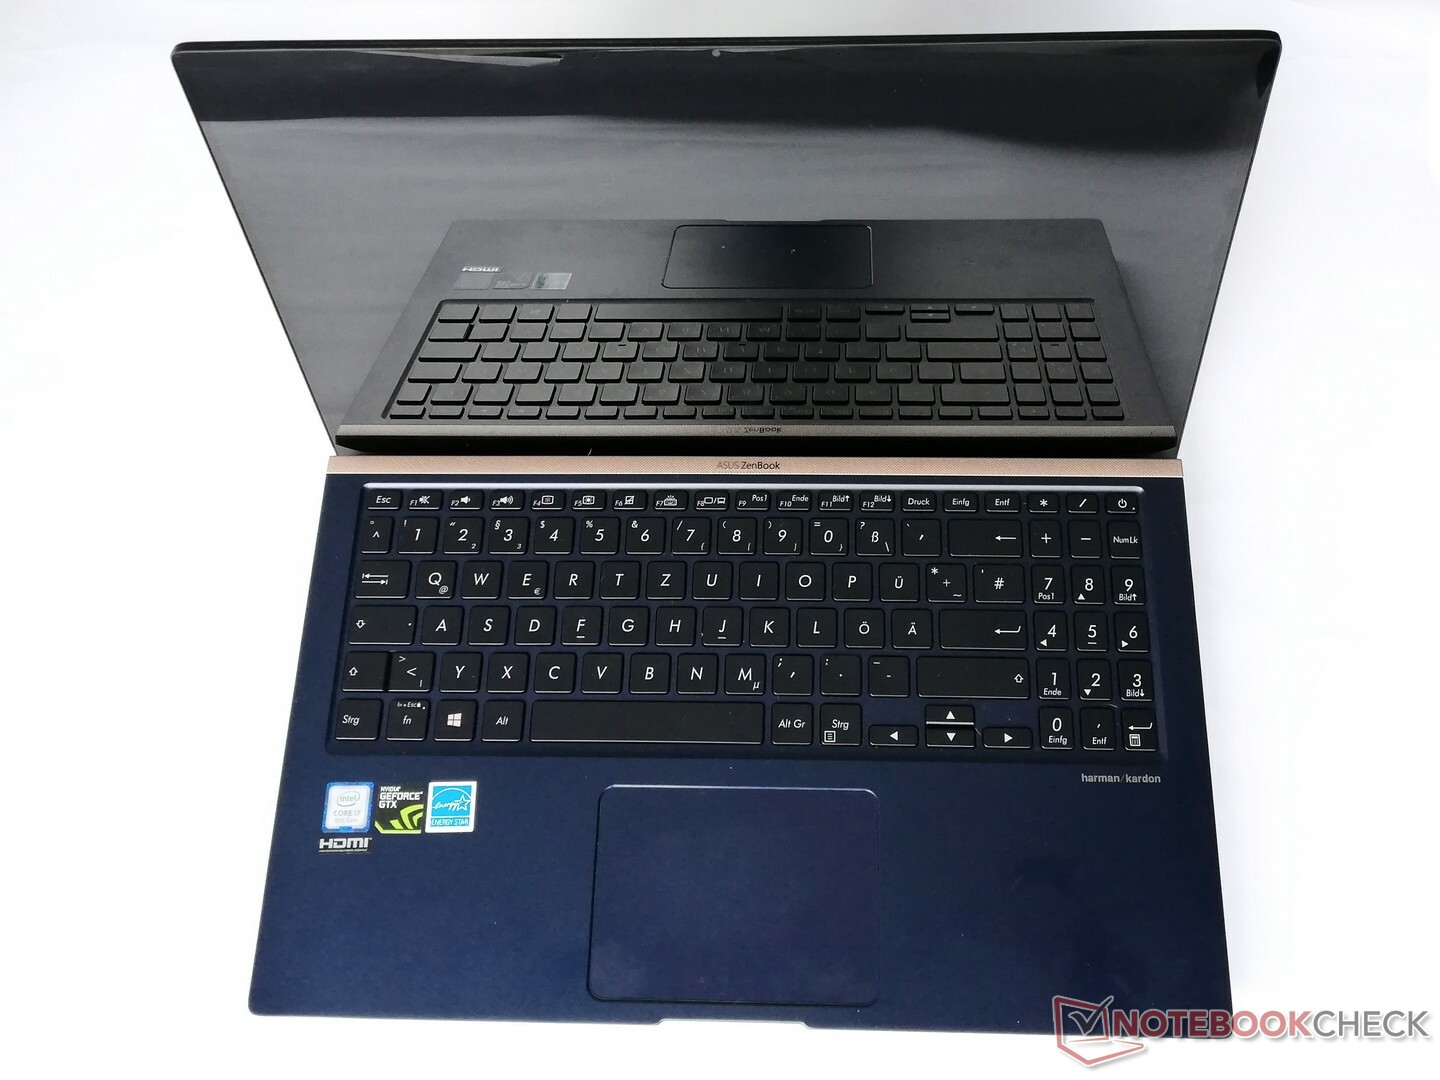
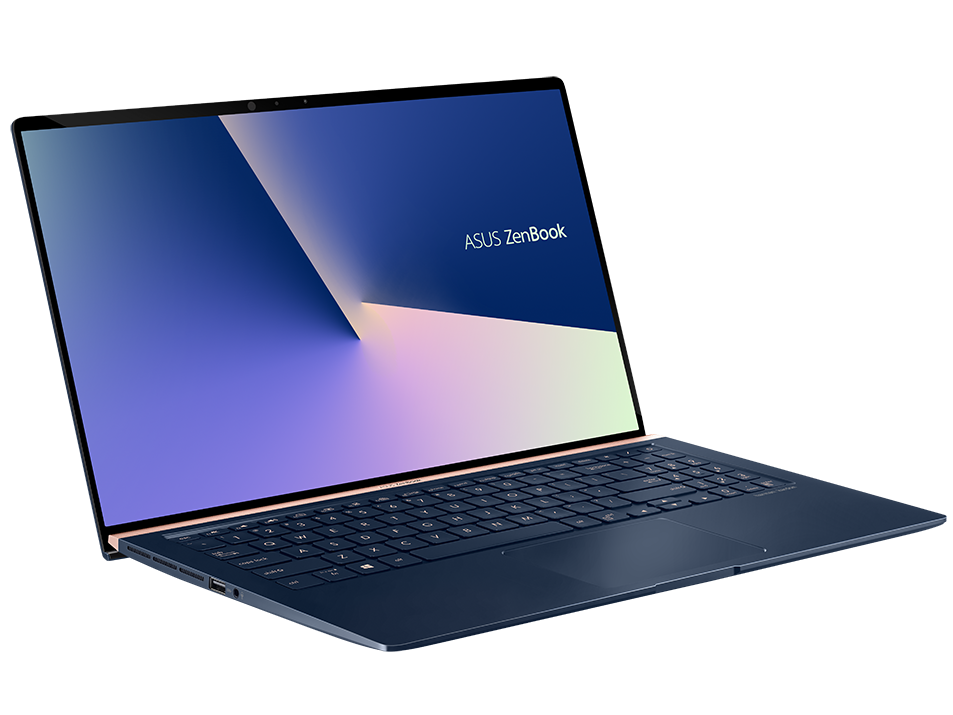
Asus ZenBook 15 UX533FD
- 02/14/2019 v6 (old)
Mike Wobker
Price comparison
