戴尔XPS 15 9570(i9-8950HK, 4K UHD,GTX 1050 Ti Max-Q)笔记本电脑评测
| SD Card Reader | |
| average JPG Copy Test (av. of 3 runs) | |
| Lenovo ThinkPad X1 Extreme-20MF000XGE (Toshiba Exceria Pro SDXC 64 GB UHS-II) | |
| Dell XPS 15 9570 Core i9 UHD (Toshiba Exceria Pro SDXC 64 GB UHS-II) | |
| HP Spectre x360 15-ch011nr (Toshiba Exceria Pro SDXC 64 GB UHS-II) | |
| Dell XPS 15 9575 i7-8705G (Toshiba Exceria Pro M501 UHS-II) | |
| Asus ZenBook Pro 15 UX580GE (Toshiba Exceria Pro M501 UHS-II) | |
| maximum AS SSD Seq Read Test (1GB) | |
| Lenovo ThinkPad X1 Extreme-20MF000XGE (Toshiba Exceria Pro SDXC 64 GB UHS-II) | |
| HP Spectre x360 15-ch011nr (Toshiba Exceria Pro SDXC 64 GB UHS-II) | |
| Dell XPS 15 9570 Core i9 UHD (Toshiba Exceria Pro SDXC 64 GB UHS-II) | |
| Dell XPS 15 9575 i7-8705G (Toshiba Exceria Pro M501 UHS-II) | |
| Networking | |
| iperf3 transmit AX12 | |
| Dell XPS 15 9570 Core i9 UHD | |
| Lenovo ThinkPad X1 Extreme-20MF000XGE | |
| Asus ZenBook Pro 15 UX580GE | |
| Dell XPS 15 9575 i7-8705G | |
| HP Spectre x360 15-ch011nr | |
| iperf3 receive AX12 | |
| Asus ZenBook Pro 15 UX580GE | |
| HP Spectre x360 15-ch011nr | |
| Dell XPS 15 9575 i7-8705G | |
| Dell XPS 15 9570 Core i9 UHD | |
| Lenovo ThinkPad X1 Extreme-20MF000XGE | |
| |||||||||||||||||||||||||
Brightness Distribution: 81 %
Center on Battery: 430.4 cd/m²
Contrast: 1255:1 (Black: 0.36 cd/m²)
ΔE ColorChecker Calman: 5.62 | ∀{0.5-29.43 Ø4.73}
calibrated: 2.69
ΔE Greyscale Calman: 6.9 | ∀{0.09-98 Ø4.97}
98.5% sRGB (Argyll 1.6.3 3D)
71.8% AdobeRGB 1998 (Argyll 1.6.3 3D)
79.7% AdobeRGB 1998 (Argyll 3D)
98.4% sRGB (Argyll 3D)
79.6% Display P3 (Argyll 3D)
Gamma: 2.2
CCT: 6254 K
| Dell XPS 15 9570 Core i9 UHD LQ156D1, IPS, 15.6", 3840x2160 | Asus ZenBook Pro 15 UX580GE AU Optronics B156ZAN03.1, IPS, 15.6", 3840x2160 | Lenovo ThinkPad X1 Extreme-20MF000XGE B156ZAN03.2, IPS, 15.6", 3840x2160 | Dell XPS 15 9575 i7-8705G Sharp SHP148D, IPS, 15.6", 3840x2160 | HP Spectre x360 15-ch011nr BOE0730, IPS, 15.6", 3840x2160 | Razer Blade 15 Base Model BOE NV156FHM-N61, IPS, 15.6", 1920x1080 | |
|---|---|---|---|---|---|---|
| Display | 11% | 12% | -1% | -13% | -17% | |
| Display P3 Coverage (%) | 79.6 | 85.9 8% | 86.3 8% | 78.7 -1% | 68.5 -14% | 66.3 -17% |
| sRGB Coverage (%) | 98.4 | 100 2% | 100 2% | 97.9 -1% | 90.7 -8% | 86.6 -12% |
| AdobeRGB 1998 Coverage (%) | 79.7 | 99.1 24% | 99.4 25% | 79.2 -1% | 66.3 -17% | 63.3 -21% |
| Response Times | 22% | -10% | -1% | 20% | 7% | |
| Response Time Grey 50% / Grey 80% * (ms) | 52.4 ? | 44 ? 16% | 61.6 ? -18% | 48.4 ? 8% | 38 ? 27% | 39.2 ? 25% |
| Response Time Black / White * (ms) | 31.6 ? | 22.8 ? 28% | 32 ? -1% | 34.8 ? -10% | 27.6 ? 13% | 35.2 ? -11% |
| PWM Frequency (Hz) | 1000 ? | 1000 ? | 943 ? | 21190 ? | ||
| Screen | 6% | 20% | 21% | -6% | 2% | |
| Brightness middle (cd/m²) | 451.9 | 357.6 -21% | 396 -12% | 488 8% | 329.3 -27% | 273.6 -39% |
| Brightness (cd/m²) | 414 | 350 -15% | 380 -8% | 440 6% | 316 -24% | 262 -37% |
| Brightness Distribution (%) | 81 | 85 5% | 90 11% | 81 0% | 84 4% | 86 6% |
| Black Level * (cd/m²) | 0.36 | 0.35 3% | 0.28 22% | 0.3 17% | 0.31 14% | 0.3 17% |
| Contrast (:1) | 1255 | 1022 -19% | 1414 13% | 1627 30% | 1062 -15% | 912 -27% |
| Colorchecker dE 2000 * | 5.62 | 4.12 27% | 4 29% | 3.16 44% | 4.78 15% | 3.22 43% |
| Colorchecker dE 2000 max. * | 19.1 | 9.91 48% | 7.6 60% | 8.8 54% | 11.75 38% | 7.61 60% |
| Colorchecker dE 2000 calibrated * | 2.69 | 4.23 -57% | 0.9 67% | 3.51 -30% | 4.1 -52% | |
| Greyscale dE 2000 * | 6.9 | 1.8 74% | 6.1 12% | 3.3 52% | 7.9 -14% | 1.4 80% |
| Gamma | 2.2 100% | 2.17 101% | 2.25 98% | 2.178 101% | 2.24 98% | 2.24 98% |
| CCT | 6254 104% | 6613 98% | 7786 83% | 6811 95% | 8323 78% | 6636 98% |
| Color Space (Percent of AdobeRGB 1998) (%) | 71.8 | 87.5 22% | 88.5 23% | 71.7 0% | 58.8 -18% | 56.4 -21% |
| Color Space (Percent of sRGB) (%) | 98.5 | 100 2% | 100 2% | 97.9 -1% | 90.4 -8% | 86.2 -12% |
| Total Average (Program / Settings) | 13% /
9% | 7% /
15% | 6% /
14% | 0% /
-4% | -3% /
-1% |
* ... smaller is better
Display Response Times
| ↔ Response Time Black to White | ||
|---|---|---|
| 31.6 ms ... rise ↗ and fall ↘ combined | ↗ 18 ms rise | 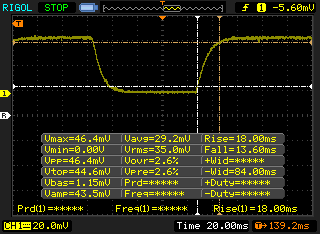 |
| ↘ 13.6 ms fall | ||
| The screen shows slow response rates in our tests and will be unsatisfactory for gamers. In comparison, all tested devices range from 0.1 (minimum) to 240 (maximum) ms. » 85 % of all devices are better. This means that the measured response time is worse than the average of all tested devices (19.9 ms). | ||
| ↔ Response Time 50% Grey to 80% Grey | ||
| 52.4 ms ... rise ↗ and fall ↘ combined | ↗ 27.6 ms rise | 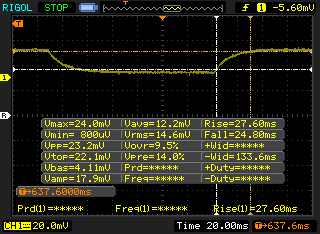 |
| ↘ 24.8 ms fall | ||
| The screen shows slow response rates in our tests and will be unsatisfactory for gamers. In comparison, all tested devices range from 0.165 (minimum) to 636 (maximum) ms. » 89 % of all devices are better. This means that the measured response time is worse than the average of all tested devices (31.1 ms). | ||
Screen Flickering / PWM (Pulse-Width Modulation)
| Screen flickering / PWM detected | 1000 Hz | ≤ 25 % brightness setting | 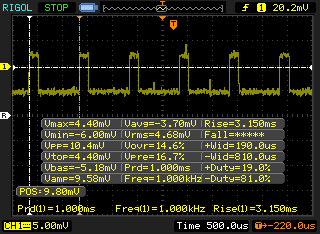 |
The display backlight flickers at 1000 Hz (worst case, e.g., utilizing PWM) Flickering detected at a brightness setting of 25 % and below. There should be no flickering or PWM above this brightness setting. The frequency of 1000 Hz is quite high, so most users sensitive to PWM should not notice any flickering. In comparison: 52 % of all tested devices do not use PWM to dim the display. If PWM was detected, an average of 7798 (minimum: 5 - maximum: 343500) Hz was measured. | |||
| Cinebench R11.5 | |
| CPU Single 64Bit | |
| MSI GT75 8RG-090 Titan | |
| Average Intel Core i9-8950HK (2.1 - 2.34, n=7) | |
| Eurocom Sky X4C | |
| Dell XPS 15 9575 i7-8705G | |
| AMD Radeon RX Vega 64 | |
| Dell XPS 13 9370 i7 UHD | |
| Dell XPS 15 9560 (i7-7700HQ, UHD) | |
| CPU Multi 64Bit | |
| AMD Radeon RX Vega 64 | |
| MSI GT75 8RG-090 Titan | |
| Eurocom Sky X4C | |
| Average Intel Core i9-8950HK (12 - 15.1, n=7) | |
| Dell XPS 15 9560 (i7-7700HQ, UHD) | |
| Dell XPS 15 9575 i7-8705G | |
| Dell XPS 13 9370 i7 UHD | |
| Cinebench R10 | |
| Rendering Multiple CPUs 32Bit | |
| Eurocom Sky X4C | |
| Average Intel Core i9-8950HK (32438 - 39380, n=5) | |
| AMD Radeon RX Vega 64 | |
| Dell XPS 15 9575 i7-8705G | |
| Dell XPS 15 9560 (i7-7700HQ, UHD) | |
| Dell XPS 13 9370 i7 UHD | |
| Rendering Single 32Bit | |
| Average Intel Core i9-8950HK (6978 - 7735, n=5) | |
| Eurocom Sky X4C | |
| Dell XPS 15 9575 i7-8705G | |
| Dell XPS 13 9370 i7 UHD | |
| Dell XPS 15 9560 (i7-7700HQ, UHD) | |
| AMD Radeon RX Vega 64 | |
| wPrime 2.10 - 1024m | |
| Dell XPS 13 9370 i7 UHD | |
| Average Intel Core i9-8950HK (n=1) | |
| Dell XPS 15 9560 (i7-7700HQ, UHD) | |
| Dell XPS 15 9575 i7-8705G | |
| Eurocom Sky X4C | |
| AMD Radeon RX Vega 64 | |
* ... smaller is better
| PCMark 8 Home Score Accelerated v2 | 3840 points | |
| PCMark 8 Work Score Accelerated v2 | 4620 points | |
| PCMark 10 Score | 5059 points | |
Help | ||
| Dell XPS 15 9570 Core i9 UHD Samsung SSD PM981 MZVLB1T0HALR | Asus ZenBook Pro 15 UX580GE Samsung SSD PM961 1TB M.2 PCIe 3.0 x4 NVMe (MZVLW1T0) | Lenovo ThinkPad X1 Extreme-20MF000XGE Samsung SSD PM981 MZVLB1T0HALR | Dell XPS 15 9575 i7-8705G SK hynix PC401 NVMe 500 GB | HP Spectre x360 15-ch011nr SK hynix PC401 NVMe 500 GB | Razer Blade 15 Base Model Samsung SSD PM981 MZVLB256HAHQ | |
|---|---|---|---|---|---|---|
| AS SSD | -1% | 40% | -19% | -22% | -17% | |
| Seq Read (MB/s) | 1320 | 2099 59% | 2703 105% | 2302 74% | 1739 32% | 1803 37% |
| Seq Write (MB/s) | 1500 | 1729 15% | 2336 56% | 752 -50% | 1189 -21% | 1367 -9% |
| 4K Read (MB/s) | 30.73 | 37.78 23% | 56.8 85% | 41.38 35% | 38.76 26% | 40.75 33% |
| 4K Write (MB/s) | 94.4 | 100.9 7% | 130.9 39% | 94.3 0% | 93.2 -1% | 93 -1% |
| 4K-64 Read (MB/s) | 1453 | 1431 -2% | 1805 24% | 649 -55% | 646 -56% | 749 -48% |
| 4K-64 Write (MB/s) | 1815 | 1273 -30% | 1782 -2% | 637 -65% | 545 -70% | 1270 -30% |
| Access Time Read * (ms) | 0.061 | 0.04 34% | 0.034 44% | 0.044 28% | 0.054 11% | 0.113 -85% |
| Access Time Write * (ms) | 0.044 | 0.036 18% | 0.028 36% | 0.051 -16% | 0.051 -16% | 0.04 9% |
| Score Read (Points) | 1616 | 1679 4% | 2132 32% | 921 -43% | 859 -47% | 970 -40% |
| Score Write (Points) | 2059 | 1547 -25% | 2147 4% | 807 -61% | 757 -63% | 1499 -27% |
| Score Total (Points) | 4507 | 4065 -10% | 5355 19% | 2132 -53% | 2037 -55% | 2952 -35% |
| Copy ISO MB/s (MB/s) | 2577 | 1045 -59% | 1523 -41% | 1668 -35% | 1892 -27% | |
| Copy Program MB/s (MB/s) | 515 | 430.9 -16% | 487.9 -5% | 486.8 -5% | 495.5 -4% | |
| Copy Game MB/s (MB/s) | 1120 | 728 -35% | 944 -16% | 1042 -7% | 1070 -4% |
* ... smaller is better

| 3DMark 11 Performance | 9373 points | |
| 3DMark Cloud Gate Standard Score | 24948 points | |
| 3DMark Fire Strike Score | 6688 points | |
Help | ||
| low | med. | high | ultra | |
|---|---|---|---|---|
| BioShock Infinite (2013) | 298.2 | 208.7 | 181.3 | 71.8 |
| The Witcher 3 (2015) | 122 | 73.2 | 42.6 | 23.5 |
| Rise of the Tomb Raider (2016) | 141.1 | 82.9 | 47.7 | 39.5 |
Noise level
| Idle |
| 28.5 / 28.6 / 28.8 dB(A) |
| Load |
| 36.2 / 47.6 dB(A) |
 | ||
30 dB silent 40 dB(A) audible 50 dB(A) loud |
||
min: | ||
| Dell XPS 15 9570 Core i9 UHD GeForce GTX 1050 Ti Max-Q, i9-8950HK, Samsung SSD PM981 MZVLB1T0HALR | Dell XPS 15 9570 i7 UHD GeForce GTX 1050 Ti Max-Q, i7-8750H, Toshiba XG5 KXG50ZNV512G | Razer Blade 15 Base Model GeForce GTX 1060 Max-Q, i7-8750H, Samsung SSD PM981 MZVLB256HAHQ | Dell XPS 15 9575 i7-8705G Vega M GL / 870, i7-8705G, SK hynix PC401 NVMe 500 GB | Asus ZenBook Pro 15 UX580GE GeForce GTX 1050 Ti Mobile, i9-8950HK, Samsung SSD PM961 1TB M.2 PCIe 3.0 x4 NVMe (MZVLW1T0) | |
|---|---|---|---|---|---|
| Noise | 1% | -8% | 4% | -2% | |
| off / environment * (dB) | 28.2 | 29.9 -6% | 27.8 1% | 28.2 -0% | 28 1% |
| Idle Minimum * (dB) | 28.5 | 29.9 -5% | 31 -9% | 28.2 1% | 28.6 -0% |
| Idle Average * (dB) | 28.6 | 29.9 -5% | 31.2 -9% | 28.2 1% | 29.9 -5% |
| Idle Maximum * (dB) | 28.8 | 30.3 -5% | 31.3 -9% | 28.2 2% | 30.5 -6% |
| Load Average * (dB) | 36.2 | 36.5 -1% | 47.2 -30% | 29 20% | 42.5 -17% |
| Witcher 3 ultra * (dB) | 47.6 | 40.4 15% | 51.3 -8% | 44.7 6% | 44.8 6% |
| Load Maximum * (dB) | 47.6 | 40.4 15% | 44.3 7% | 47.4 -0% | 44.8 6% |
* ... smaller is better
(-) The maximum temperature on the upper side is 53.6 °C / 128 F, compared to the average of 36.8 °C / 98 F, ranging from 21 to 71 °C for the class Multimedia.
(-) The bottom heats up to a maximum of 49 °C / 120 F, compared to the average of 39.1 °C / 102 F
(+) In idle usage, the average temperature for the upper side is 27.1 °C / 81 F, compared to the device average of 31.3 °C / 88 F.
(±) Playing The Witcher 3, the average temperature for the upper side is 35.4 °C / 96 F, compared to the device average of 31.3 °C / 88 F.
(+) The palmrests and touchpad are cooler than skin temperature with a maximum of 28.2 °C / 82.8 F and are therefore cool to the touch.
(±) The average temperature of the palmrest area of similar devices was 28.7 °C / 83.7 F (+0.5 °C / 0.9 F).
Dell XPS 15 9570 Core i9 UHD audio analysis
(±) | speaker loudness is average but good (77.9 dB)
Bass 100 - 315 Hz
(-) | nearly no bass - on average 17.9% lower than median
(±) | linearity of bass is average (8.4% delta to prev. frequency)
Mids 400 - 2000 Hz
(±) | higher mids - on average 7.2% higher than median
(±) | linearity of mids is average (12.1% delta to prev. frequency)
Highs 2 - 16 kHz
(+) | balanced highs - only 4.6% away from median
(±) | linearity of highs is average (9.8% delta to prev. frequency)
Overall 100 - 16.000 Hz
(±) | linearity of overall sound is average (20.9% difference to median)
Compared to same class
» 71% of all tested devices in this class were better, 8% similar, 21% worse
» The best had a delta of 5%, average was 17%, worst was 45%
Compared to all devices tested
» 57% of all tested devices were better, 8% similar, 36% worse
» The best had a delta of 4%, average was 24%, worst was 134%
Apple MacBook 12 (Early 2016) 1.1 GHz audio analysis
(+) | speakers can play relatively loud (83.6 dB)
Bass 100 - 315 Hz
(±) | reduced bass - on average 11.3% lower than median
(±) | linearity of bass is average (14.2% delta to prev. frequency)
Mids 400 - 2000 Hz
(+) | balanced mids - only 2.4% away from median
(+) | mids are linear (5.5% delta to prev. frequency)
Highs 2 - 16 kHz
(+) | balanced highs - only 2% away from median
(+) | highs are linear (4.5% delta to prev. frequency)
Overall 100 - 16.000 Hz
(+) | overall sound is linear (10.2% difference to median)
Compared to same class
» 7% of all tested devices in this class were better, 2% similar, 91% worse
» The best had a delta of 5%, average was 18%, worst was 53%
Compared to all devices tested
» 5% of all tested devices were better, 1% similar, 94% worse
» The best had a delta of 4%, average was 24%, worst was 134%
| Off / Standby | |
| Idle | |
| Load |
|
Key:
min: | |
| Dell XPS 15 9570 Core i9 UHD i9-8950HK, GeForce GTX 1050 Ti Max-Q, Samsung SSD PM981 MZVLB1T0HALR, IPS, 3840x2160, 15.6" | Dell XPS 15 9570 i7 UHD i7-8750H, GeForce GTX 1050 Ti Max-Q, Toshiba XG5 KXG50ZNV512G, IPS, 3840x2160, 15.6" | Asus ZenBook Pro 15 UX580GE i9-8950HK, GeForce GTX 1050 Ti Mobile, Samsung SSD PM961 1TB M.2 PCIe 3.0 x4 NVMe (MZVLW1T0), IPS, 3840x2160, 15.6" | Lenovo ThinkPad X1 Extreme-20MF000XGE i7-8750H, GeForce GTX 1050 Ti Max-Q, Samsung SSD PM981 MZVLB1T0HALR, IPS, 3840x2160, 15.6" | Dell XPS 15 9575 i7-8705G i7-8705G, Vega M GL / 870, SK hynix PC401 NVMe 500 GB, IPS, 3840x2160, 15.6" | Razer Blade 15 Base Model i7-8750H, GeForce GTX 1060 Max-Q, Samsung SSD PM981 MZVLB256HAHQ, IPS, 1920x1080, 15.6" | |
|---|---|---|---|---|---|---|
| Power Consumption | -12% | -24% | 0% | 15% | -12% | |
| Idle Minimum * (Watt) | 7.1 | 9.48 -34% | 11.7 -65% | 7.6 -7% | 6.2 13% | 10.2 -44% |
| Idle Average * (Watt) | 13.6 | 16.1 -18% | 18.5 -36% | 14.8 -9% | 12.9 5% | 13.2 3% |
| Idle Maximum * (Watt) | 14.1 | 16.9 -20% | 22.8 -62% | 17.6 -25% | 13.6 4% | 17.6 -25% |
| Load Average * (Watt) | 103.9 | 90.8 13% | 97.5 6% | 86 17% | 76.1 27% | 99.5 4% |
| Witcher 3 ultra * (Watt) | 103 | 102.9 -0% | 85 17% | 84.3 18% | 113.6 -10% | |
| Load Maximum * (Watt) | 130.9 | 134.4 -3% | 111.1 15% | 118.9 9% | 99.4 24% | 133.3 -2% |
* ... smaller is better
| Dell XPS 15 9570 Core i9 UHD i9-8950HK, GeForce GTX 1050 Ti Max-Q, 97 Wh | Dell XPS 15 9570 i7 UHD i7-8750H, GeForce GTX 1050 Ti Max-Q, 97 Wh | Asus ZenBook Pro 15 UX580GE i9-8950HK, GeForce GTX 1050 Ti Mobile, 71 Wh | Lenovo ThinkPad X1 Extreme-20MF000XGE i7-8750H, GeForce GTX 1050 Ti Max-Q, 80 Wh | Dell XPS 15 9575 i7-8705G i7-8705G, Vega M GL / 870, 75 Wh | HP Spectre x360 15-ch011nr i5-8550U, GeForce MX150, 84 Wh | Razer Blade 15 Base Model i7-8750H, GeForce GTX 1060 Max-Q, 65 Wh | |
|---|---|---|---|---|---|---|---|
| Battery runtime | 21% | -1% | 17% | -11% | 51% | -3% | |
| Reader / Idle (h) | 15 | 14 -7% | 11.5 -23% | 11.2 -25% | 15.5 3% | 11.5 -23% | |
| WiFi v1.3 (h) | 8.6 | 9.6 12% | 6.3 -27% | 6.4 -26% | 7 -19% | 10.4 21% | 5.5 -36% |
| Load (h) | 1 | 1.3 30% | 1.3 30% | 2 100% | 1.1 10% | 2.3 130% | 1.5 50% |
| Witcher 3 ultra (h) | 1 | 1.1 |
Pros
Cons
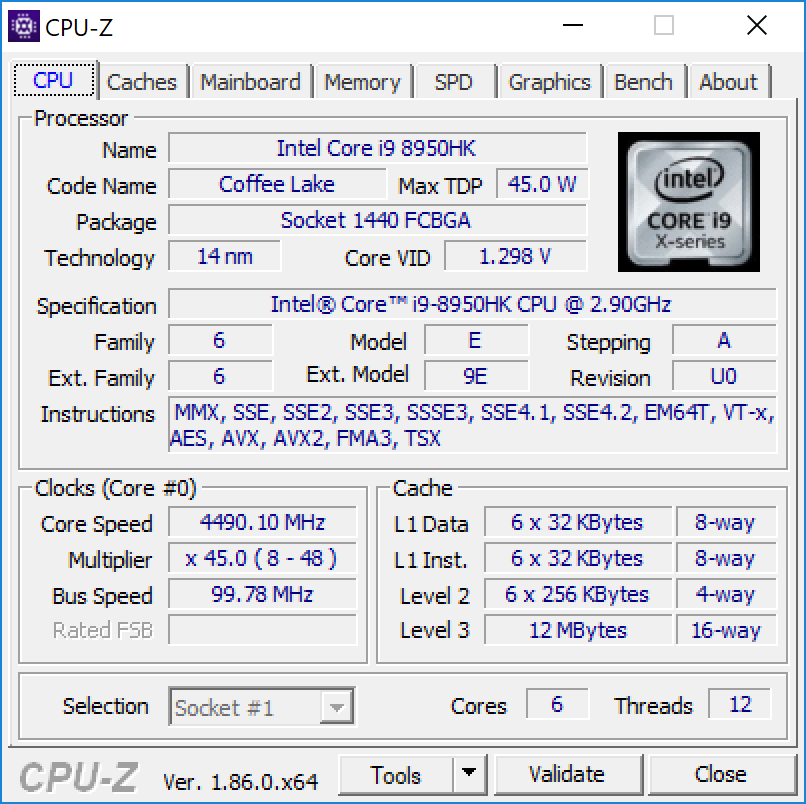
同样的i9-8950HK在厚重的微星GT75中性能强了许多不是没有原因的。为了充分发挥它的性能,散热方案必须够给力,以在合理的温度下维持睿频。
i9版XPS 15似乎又是一个在仅仅适合i7的机身中强塞i9处理器的经典例子。我们在ZenBook UX580和i9 Eurocom Q8上认清了这一点,i9 XPS 15也不例外。理论上来说,i9-8950HK性能比i7-8750H要强25%,但在XPS 15上却只有10%的提升,要知道,i7版XPS 15相较i5版提升了50%。
“我们的建议是选择i7版本,然后花钱升级内存,硬盘和显卡,以得到有效的性能提升。”
Dell XPS 15 9570 Core i9 UHD
- 11/10/2018 v6 (old)
Allen Ngo
Price comparison

