戴尔 Latitude 13 7370 超极本简短评测
Dell Latitude 13 7370 (Latitude Series)
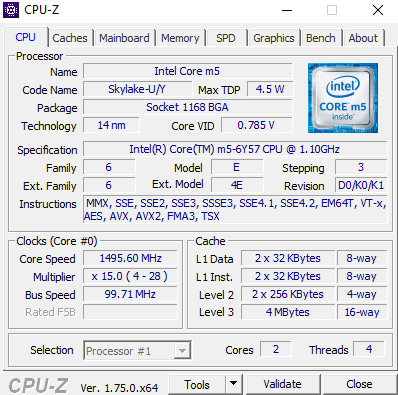
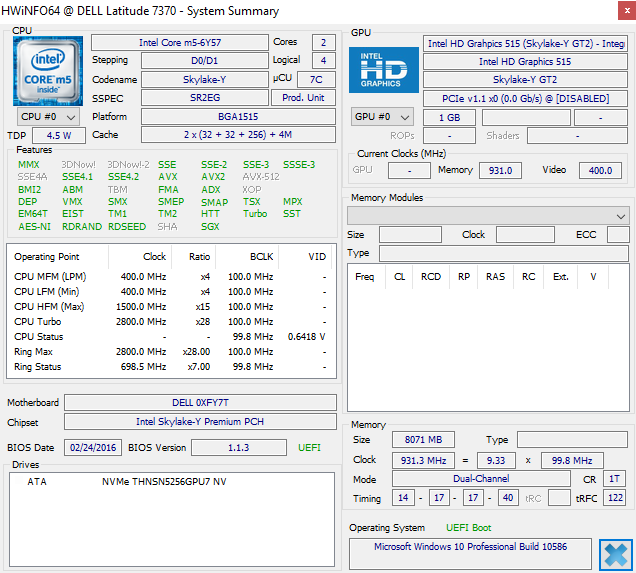
Processor
Intel Core m5-6Y57 2c/4t 2 x 1.1 - 2.8 GHz, Skylake
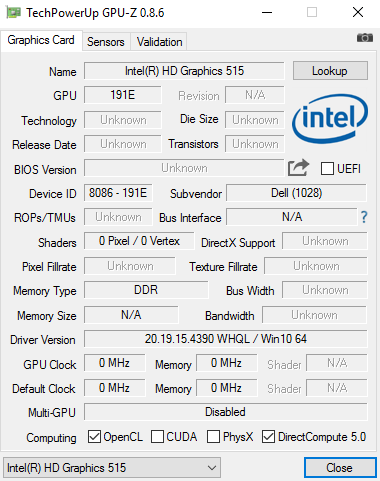
Graphics adapter
Intel HD Graphics 515, Core: 900 MHz, RAM: 933 MHz, 20.19.15.4390
Memory
8 GB
, 双通道 LPDDR3-1866, 板载, 无插槽
Display
13.30 inch 16:9, 1920 x 1080 pixel 166 PPI, Sharp LQ133M1, IPS, glossy: no
Mainboard
Intel Skylake-Y Premium PCH
Storage
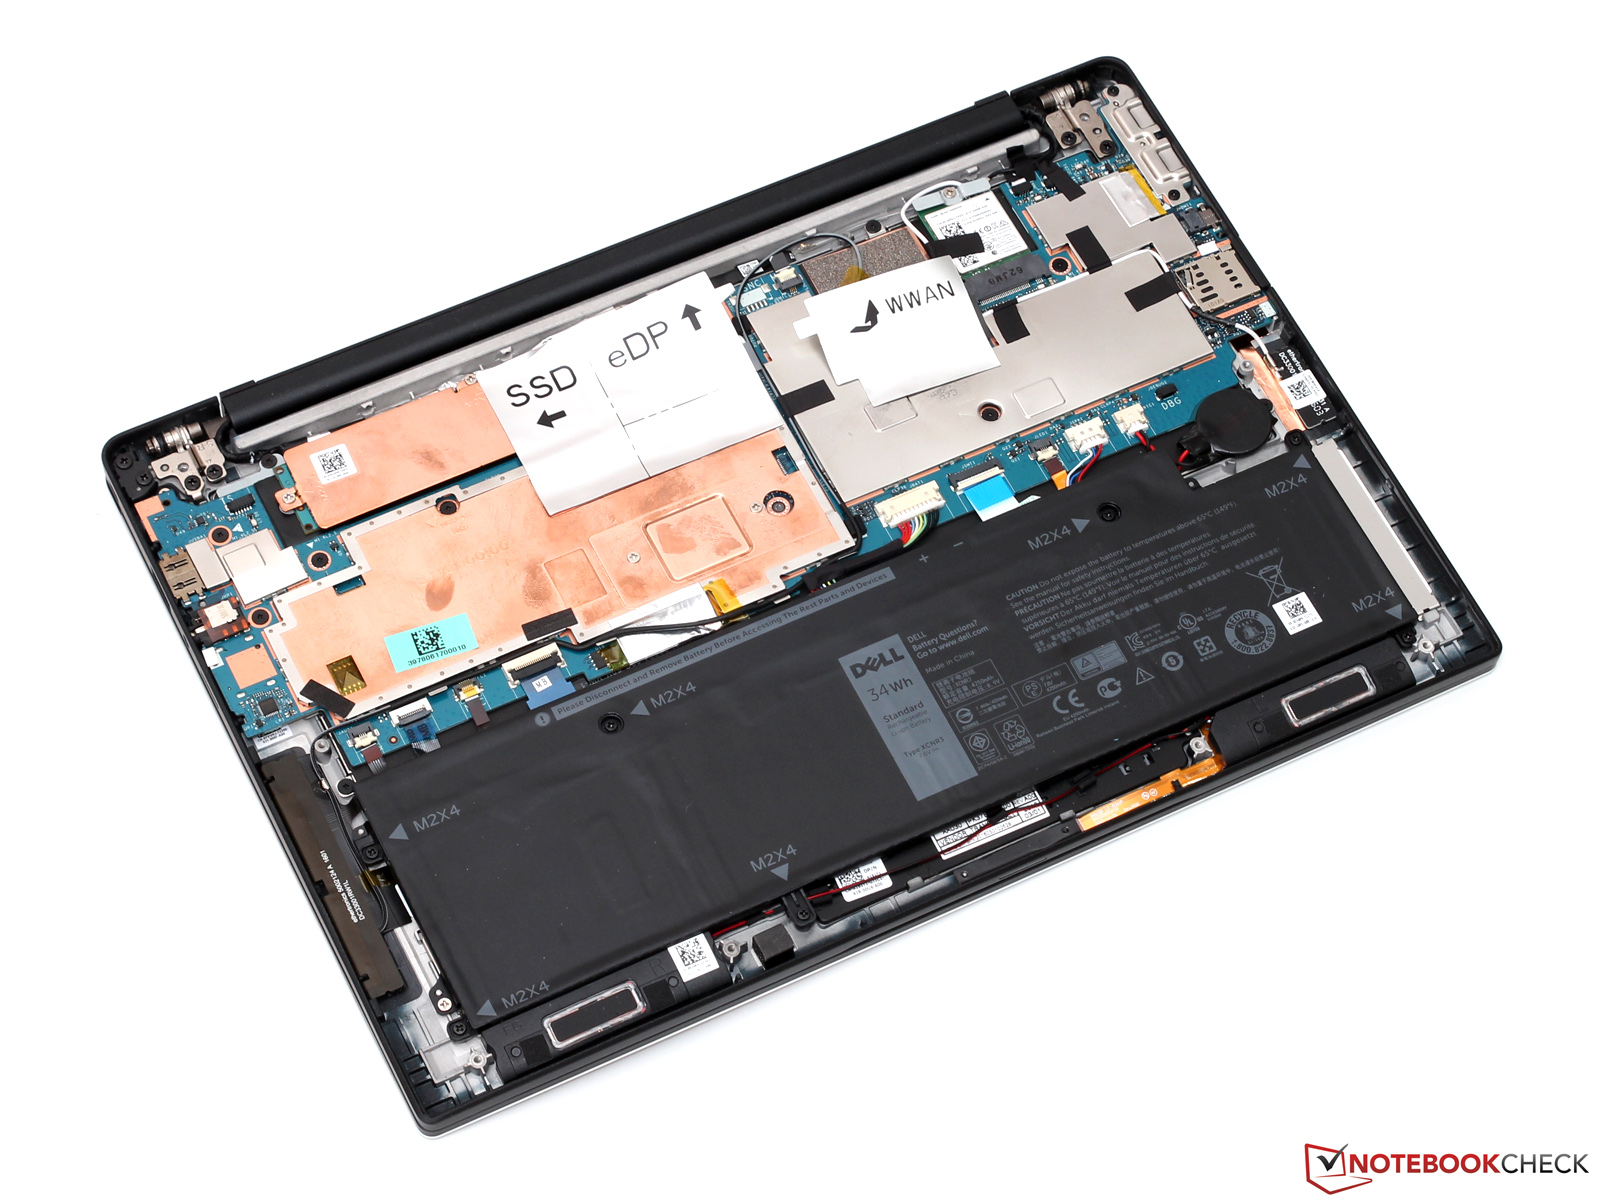
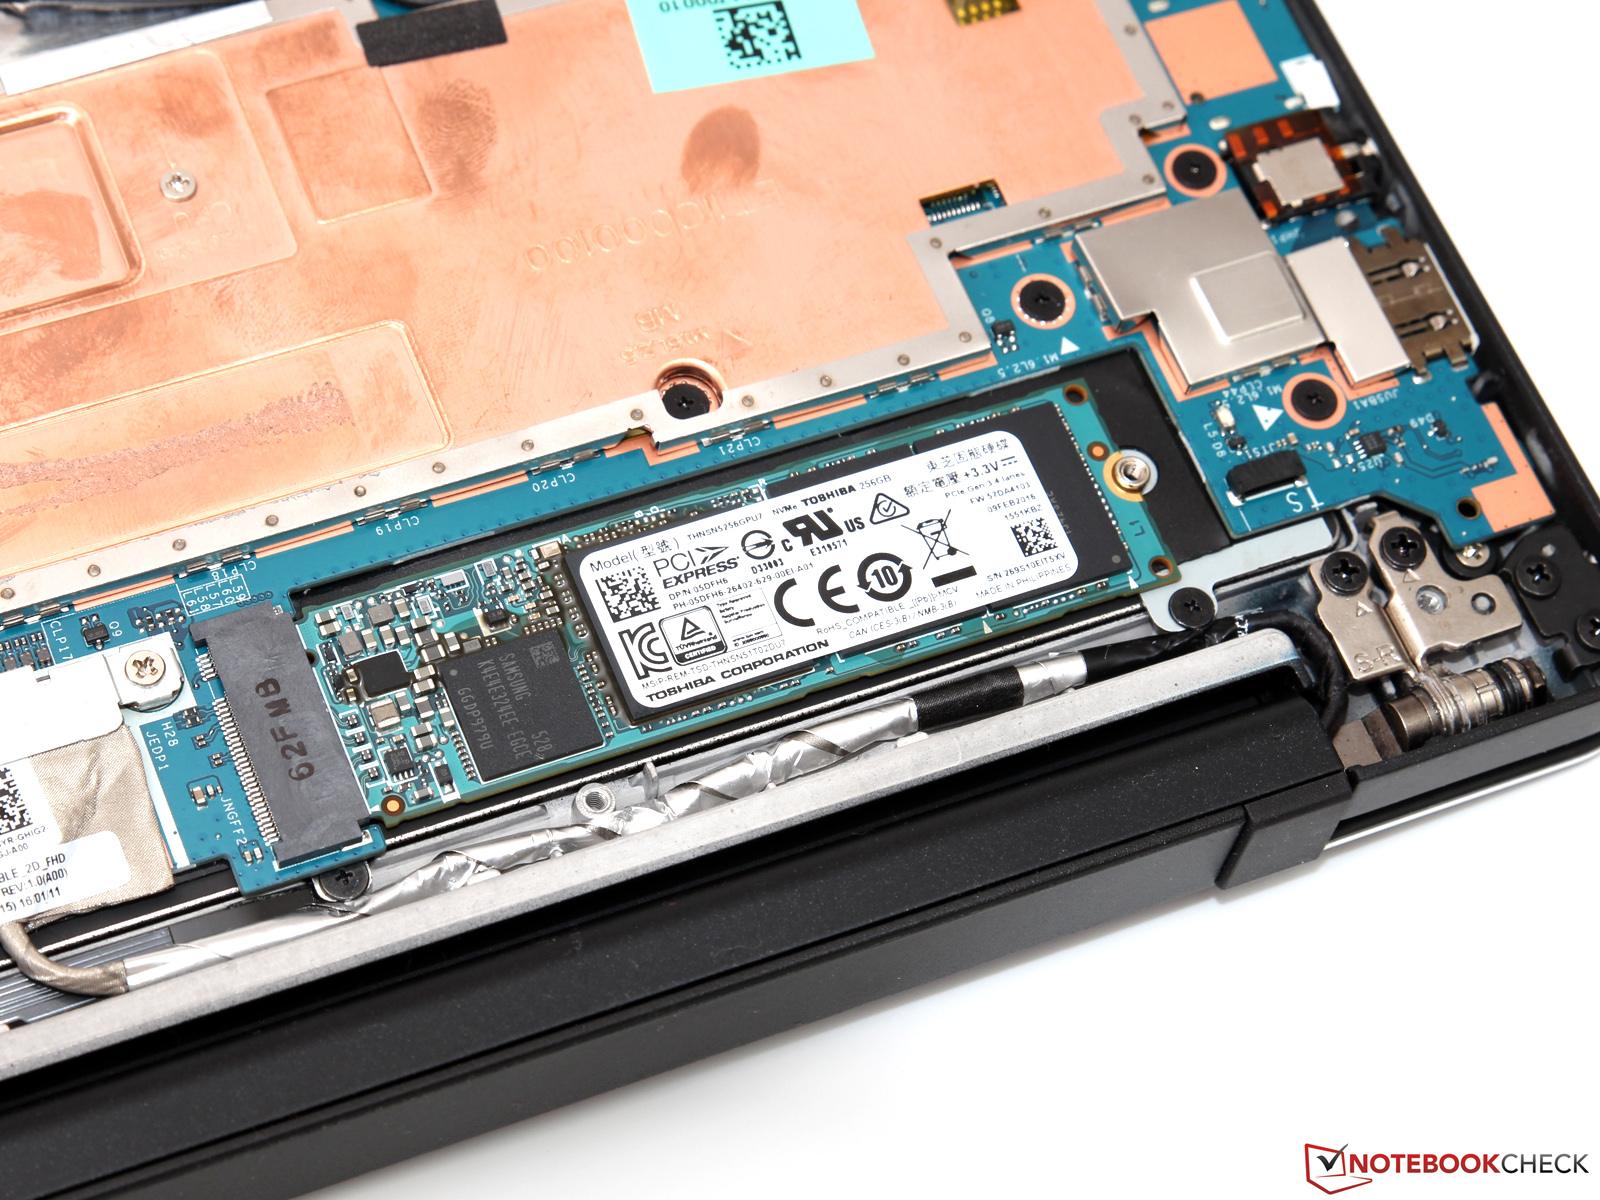
Toshiba NVMe THNSN5256GPU7, 256 GB
Weight
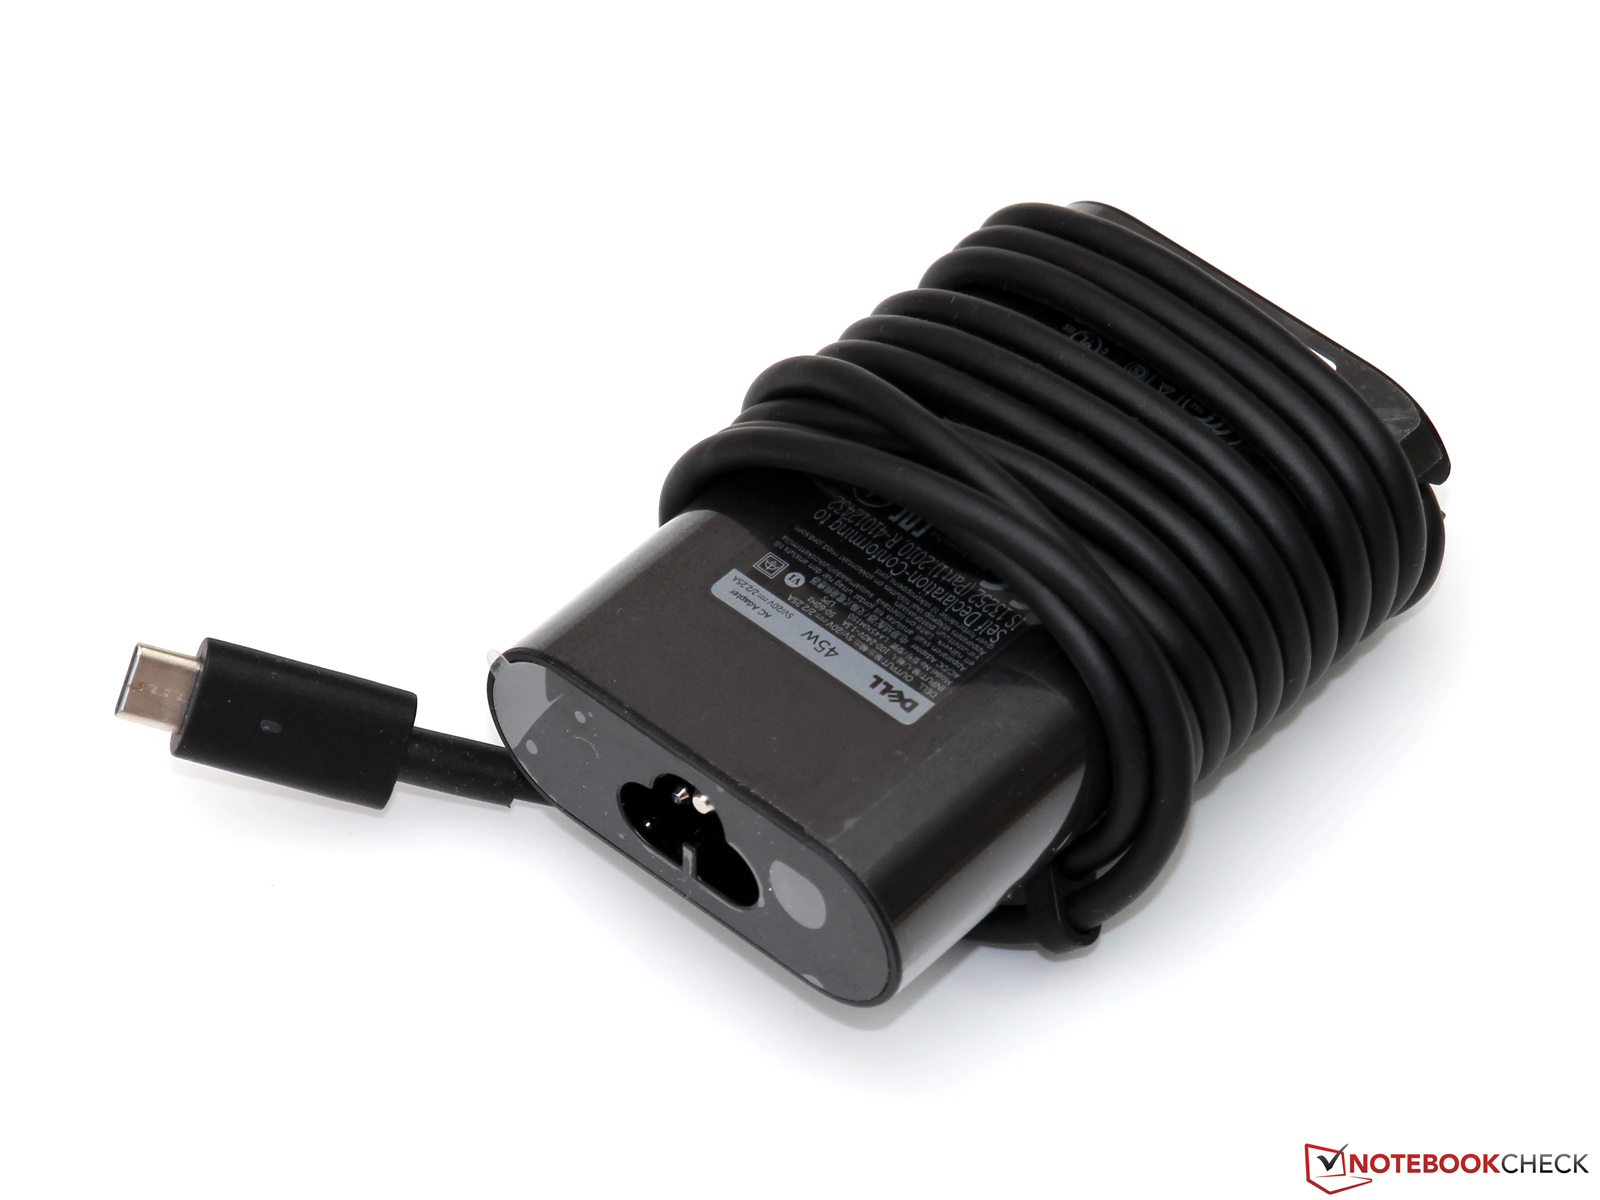
1.247 kg, Power Supply: 271 g
Price
2200 Euro
Note: The manufacturer may use components from different suppliers including display panels, drives or memory sticks with similar specifications.
Screen Flickering / PWM (Pulse-Width Modulation)
ℹ
To dim the screen, some notebooks will simply cycle the backlight on and off in rapid succession - a method called Pulse Width Modulation (PWM) . This cycling frequency should ideally be undetectable to the human eye. If said frequency is too low, users with sensitive eyes may experience strain or headaches or even notice the flickering altogether.| Screen flickering / PWM not detected | ||
In comparison: 52 % of all tested devices do not use PWM to dim the display. If PWM was detected, an average of 7757 (minimum: 5 - maximum: 343500) Hz was measured. | ||
| |||||||||||||||||||||||||
Sharp LQ133M1 tested with X-Rite i1Pro 2
Maximum: 261 cd/m² (Nits) Average: 240.6 cd/m² Minimum: 13 cd/m²Brightness Distribution: 85 %
Center on Battery: 261 cd/m²
Contrast: 1004:1 (Black: 0.26 cd/m²)
ΔE ColorChecker Calman: 4.3 | ∀{0.5-29.43 Ø4.71}
ΔE Greyscale Calman: 5.82 | ∀{0.09-98 Ø4.96}
77.84% sRGB (Argyll 1.6.3 3D)
49.18% AdobeRGB 1998 (Argyll 1.6.3 3D)
53.9% AdobeRGB 1998 (Argyll 3D)
78.3% sRGB (Argyll 3D)
52.2% Display P3 (Argyll 3D)
Gamma: 2.44
CCT: 6771 K
| Dell Latitude 13 7370 1920x1080, IPS | Lenovo ThinkPad X1 Carbon 20FB003RGE 2560x1440, IPS | HP EliteBook Folio 1040 G3 2560x1440, IPS | Toshiba Portege Z30-C-138 1920x1080, IPS | Apple MacBook 12 (Early 2016) 1.1 GHz 2304x1440, IPS | |
|---|---|---|---|---|---|
| Display | 25% | 28% | 28% | 25% | |
| Display P3 Coverage (%) | 52.2 | 66.7 28% | 67.9 30% | 67.9 30% | 66.8 28% |
| sRGB Coverage (%) | 78.3 | 94.7 21% | 96.8 24% | 98 25% | 95.4 22% |
| AdobeRGB 1998 Coverage (%) | 53.9 | 68.4 27% | 70 30% | 69.8 29% | 68 26% |
| Response Times | 21% | 15% | 17% | 14% | |
| Response Time Grey 50% / Grey 80% * (ms) | 50.4 ? | 44 ? 13% | 46.4 ? 8% | 42 ? 17% | 41.2 ? 18% |
| Response Time Black / White * (ms) | 33.6 ? | 24 ? 29% | 26.4 ? 21% | 28 ? 17% | 30.4 ? 10% |
| PWM Frequency (Hz) | 220 ? | 217 ? | |||
| Screen | 15% | 10% | 3% | 23% | |
| Brightness middle (cd/m²) | 261 | 272 4% | 327 25% | 300 15% | 387 48% |
| Brightness (cd/m²) | 241 | 268 11% | 316 31% | 280 16% | 358 49% |
| Brightness Distribution (%) | 85 | 95 12% | 87 2% | 87 2% | 88 4% |
| Black Level * (cd/m²) | 0.26 | 0.32 -23% | 0.35 -35% | 0.31 -19% | 0.47 -81% |
| Contrast (:1) | 1004 | 850 -15% | 934 -7% | 968 -4% | 823 -18% |
| Colorchecker dE 2000 * | 4.3 | 2.61 39% | 4.39 -2% | 4.9 -14% | 1.6 63% |
| Colorchecker dE 2000 max. * | 8.66 | 6.43 26% | 7.27 16% | 8.91 -3% | 4 54% |
| Greyscale dE 2000 * | 5.82 | 3.31 43% | 4.69 19% | 6.69 -15% | 1 83% |
| Gamma | 2.44 90% | 2.35 94% | 2.15 102% | 2.33 94% | 2.26 97% |
| CCT | 6771 96% | 6360 102% | 7101 92% | 6487 100% | 6680 97% |
| Color Space (Percent of AdobeRGB 1998) (%) | 49.18 | 63 28% | 62.52 27% | 63 28% | 61.6 25% |
| Color Space (Percent of sRGB) (%) | 77.84 | 95 22% | 96.71 24% | 98 26% | 82.2 6% |
| Total Average (Program / Settings) | 20% /
18% | 18% /
14% | 16% /
10% | 21% /
22% |
* ... smaller is better
Display Response Times
ℹ
Display response times show how fast the screen is able to change from one color to the next. Slow response times can lead to afterimages and can cause moving objects to appear blurry (ghosting). Gamers of fast-paced 3D titles should pay special attention to fast response times.| ↔ Response Time Black to White | ||
|---|---|---|
| 33.6 ms ... rise ↗ and fall ↘ combined | ↗ 13.2 ms rise | |
| ↘ 20.4 ms fall | ||
| The screen shows slow response rates in our tests and will be unsatisfactory for gamers. In comparison, all tested devices range from 0.1 (minimum) to 240 (maximum) ms. » 90 % of all devices are better. This means that the measured response time is worse than the average of all tested devices (19.8 ms). | ||
| ↔ Response Time 50% Grey to 80% Grey | ||
| 50.4 ms ... rise ↗ and fall ↘ combined | ↗ 20.4 ms rise | |
| ↘ 30 ms fall | ||
| The screen shows slow response rates in our tests and will be unsatisfactory for gamers. In comparison, all tested devices range from 0.165 (minimum) to 636 (maximum) ms. » 87 % of all devices are better. This means that the measured response time is worse than the average of all tested devices (31 ms). | ||
| Dell Latitude 13 7370 Toshiba NVMe THNSN5256GPU7 | Lenovo ThinkPad X1 Carbon 20FB003RGE Samsung SSD PM871 MZNLN256HCHP | HP EliteBook Folio 1040 G3 Samsung SM951 MZVPV256HDGL m.2 PCI-e | Toshiba Portege Z30-C-138 Toshiba HG6 THNSNJ512G8NY | Apple MacBook 12 (Early 2016) 1.1 GHz Apple SSD AP0256 | |
|---|---|---|---|---|---|
| AS SSD | -40% | 75% | -52% | -30% | |
| Seq Read (MB/s) | 1425 | 499.1 -65% | 1839 29% | 494.9 -65% | 1056 -26% |
| Seq Write (MB/s) | 889 | 294 -67% | 1190 34% | 431.9 -51% | 651 -27% |
| 4K Read (MB/s) | 35.72 | 30.43 -15% | 47.72 34% | 16.97 -52% | 16.4 -54% |
| 4K Write (MB/s) | 97.9 | 74.6 -24% | 126.6 29% | 65.6 -33% | 22.1 -77% |
| 4K-64 Read (MB/s) | 450.6 | 370.4 -18% | 1858 312% | 217.9 -52% | 509 13% |
| 4K-64 Write (MB/s) | 347.2 | 253.4 -27% | 344.3 -1% | 147.9 -57% | 283 -18% |
| Copy ISO MB/s (MB/s) | 704 | 236.2 -66% | 1313 87% | 545 -23% |

Toshiba NVMe THNSN5256GPU7
Transfer Rate Minimum:
386.9 MB/s
Transfer Rate Maximum:
879 MB/s
Transfer Rate Average:
754 MB/s
Access Time:
0.1 ms
Burst Rate:
275.2 MB/s
CPU Usage:
4.8 %
| PCMark 7 - Score | |
| Lenovo ThinkPad X1 Carbon 20FB003RGE | |
| Microsoft Surface Pro 4, Core m3 | |
| Dell Latitude 13 7370 | |
| PCMark 7 Score | 4165 points | |
| PCMark 8 Home Score Accelerated v2 | 3048 points | |
| PCMark 8 Creative Score Accelerated v2 | 3528 points | |
| PCMark 8 Work Score Accelerated v2 | 4238 points | |
Help | ||
| 3DMark 06 Standard Score | 6244 points | |
| 3DMark 11 Performance | 1094 points | |
| 3DMark Ice Storm Standard Score | 38931 points | |
| 3DMark Cloud Gate Standard Score | 3481 points | |
| 3DMark Fire Strike Score | 509 points | |
Help | ||
| low | med. | high | ultra | |
|---|---|---|---|---|
| BioShock Infinite (2013) | 38 | 20.3 | 17.6 | 5.3 |
| Metro: Last Light (2013) | 16.4 | 13.5 | 8.7 | |
| Battlefield 4 (2013) | 24.6 | 18.2 | 12.8 |
(±) The average temperature for the upper side under maximal load is 35.7 °C / 96 F, compared to the average of 30.8 °C / 87 F for the devices in the class Subnotebook.
(±) The maximum temperature on the upper side is 43.2 °C / 110 F, compared to the average of 35.9 °C / 97 F, ranging from 21.4 to 59 °C for the class Subnotebook.
(-) The bottom heats up to a maximum of 50.8 °C / 123 F, compared to the average of 39.2 °C / 103 F
(+) In idle usage, the average temperature for the upper side is 28.3 °C / 83 F, compared to the device average of 30.8 °C / 87 F.
(+) The palmrests and touchpad are cooler than skin temperature with a maximum of 29.8 °C / 85.6 F and are therefore cool to the touch.
(±) The average temperature of the palmrest area of similar devices was 28.2 °C / 82.8 F (-1.6 °C / -2.8 F).
Power Consumption
| Off / Standby | |
| Idle | |
| Load |
|
Key:
min: | |
| Dell Latitude 13 7370 34 Wh | Lenovo ThinkPad X1 Carbon 20FB003RGE 52 Wh | HP EliteBook Folio 1040 G3 45.6 Wh | Toshiba Portege Z30-C-138 52 Wh | Apple MacBook 12 (Early 2016) 1.1 GHz 41.4 Wh | |
|---|---|---|---|---|---|
| Battery runtime | 19% | -15% | -5% | 34% | |
| Reader / Idle (h) | 9.8 | 15.7 60% | 8.8 -10% | ||
| H.264 (h) | 6.5 | 8.5 31% | 5.7 -12% | 8.5 31% | |
| WiFi v1.3 (h) | 6.1 | 7.2 18% | 5.2 -15% | 5.8 -5% | 8.4 38% |
| Load (h) | 2.9 | 1.9 -34% | 2.2 -24% | 3.9 34% |
Pros
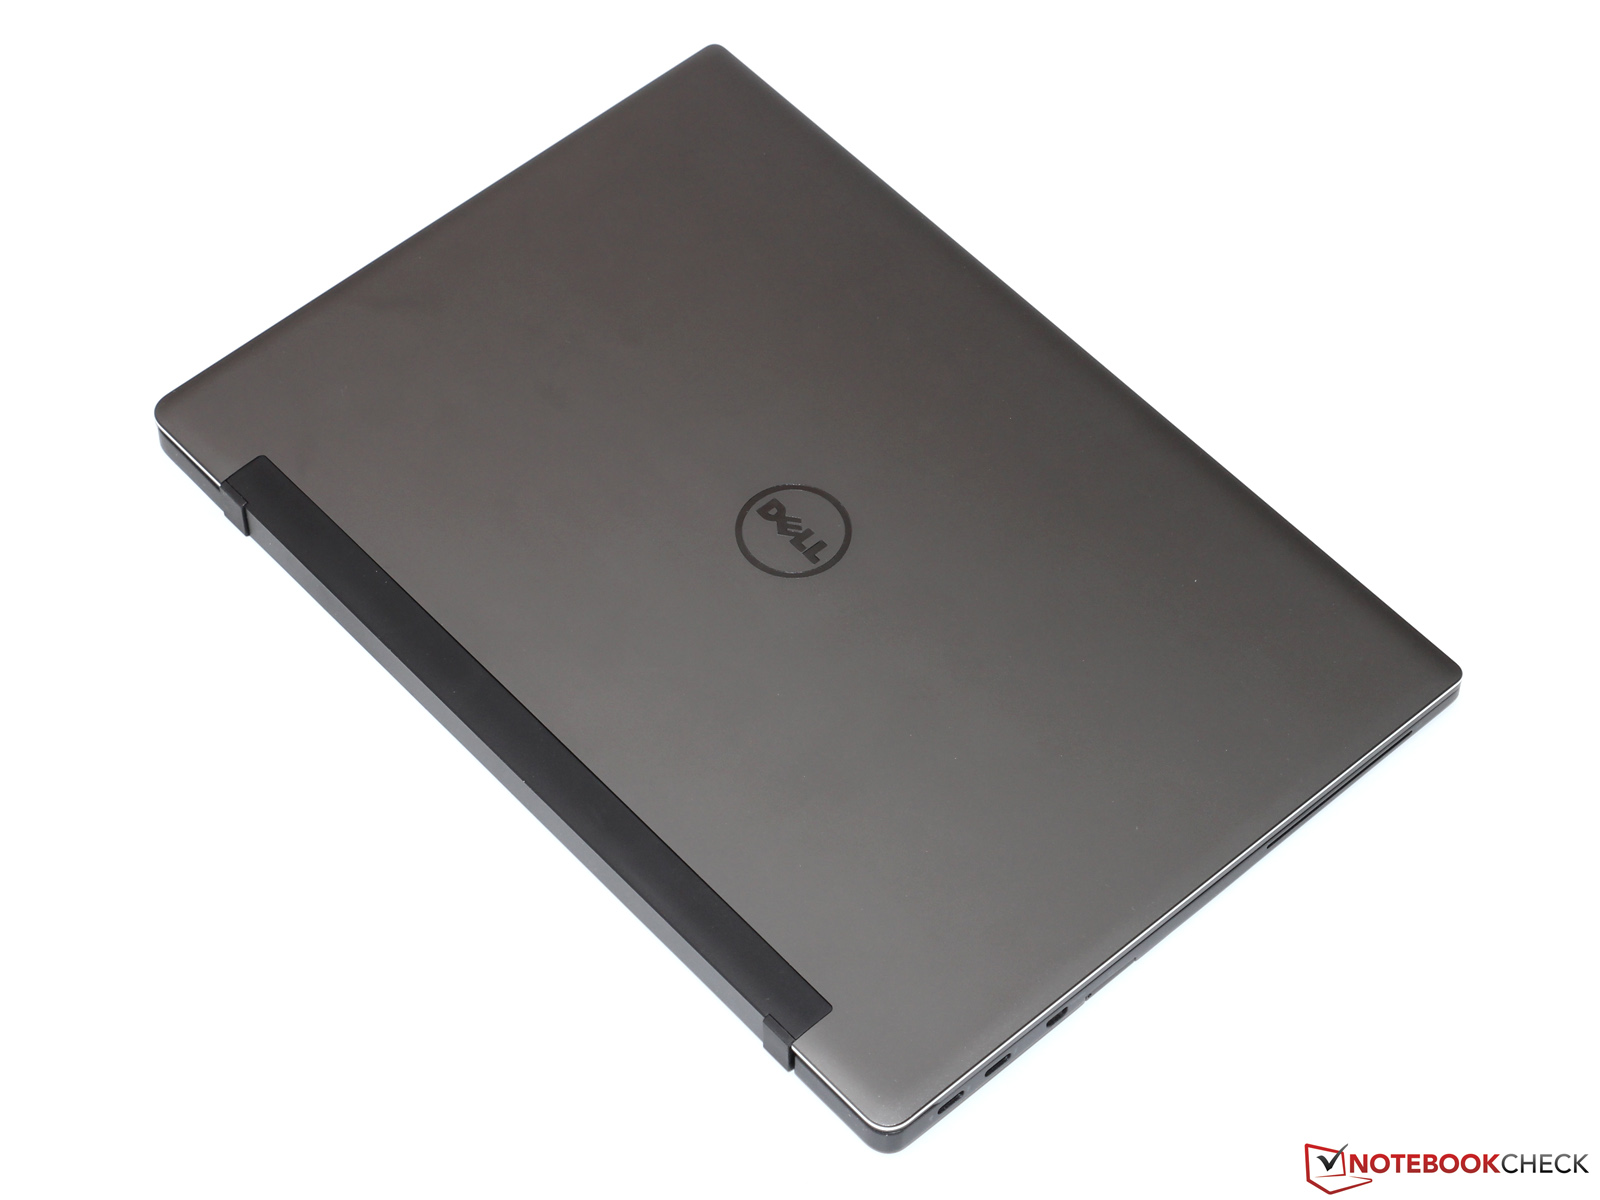
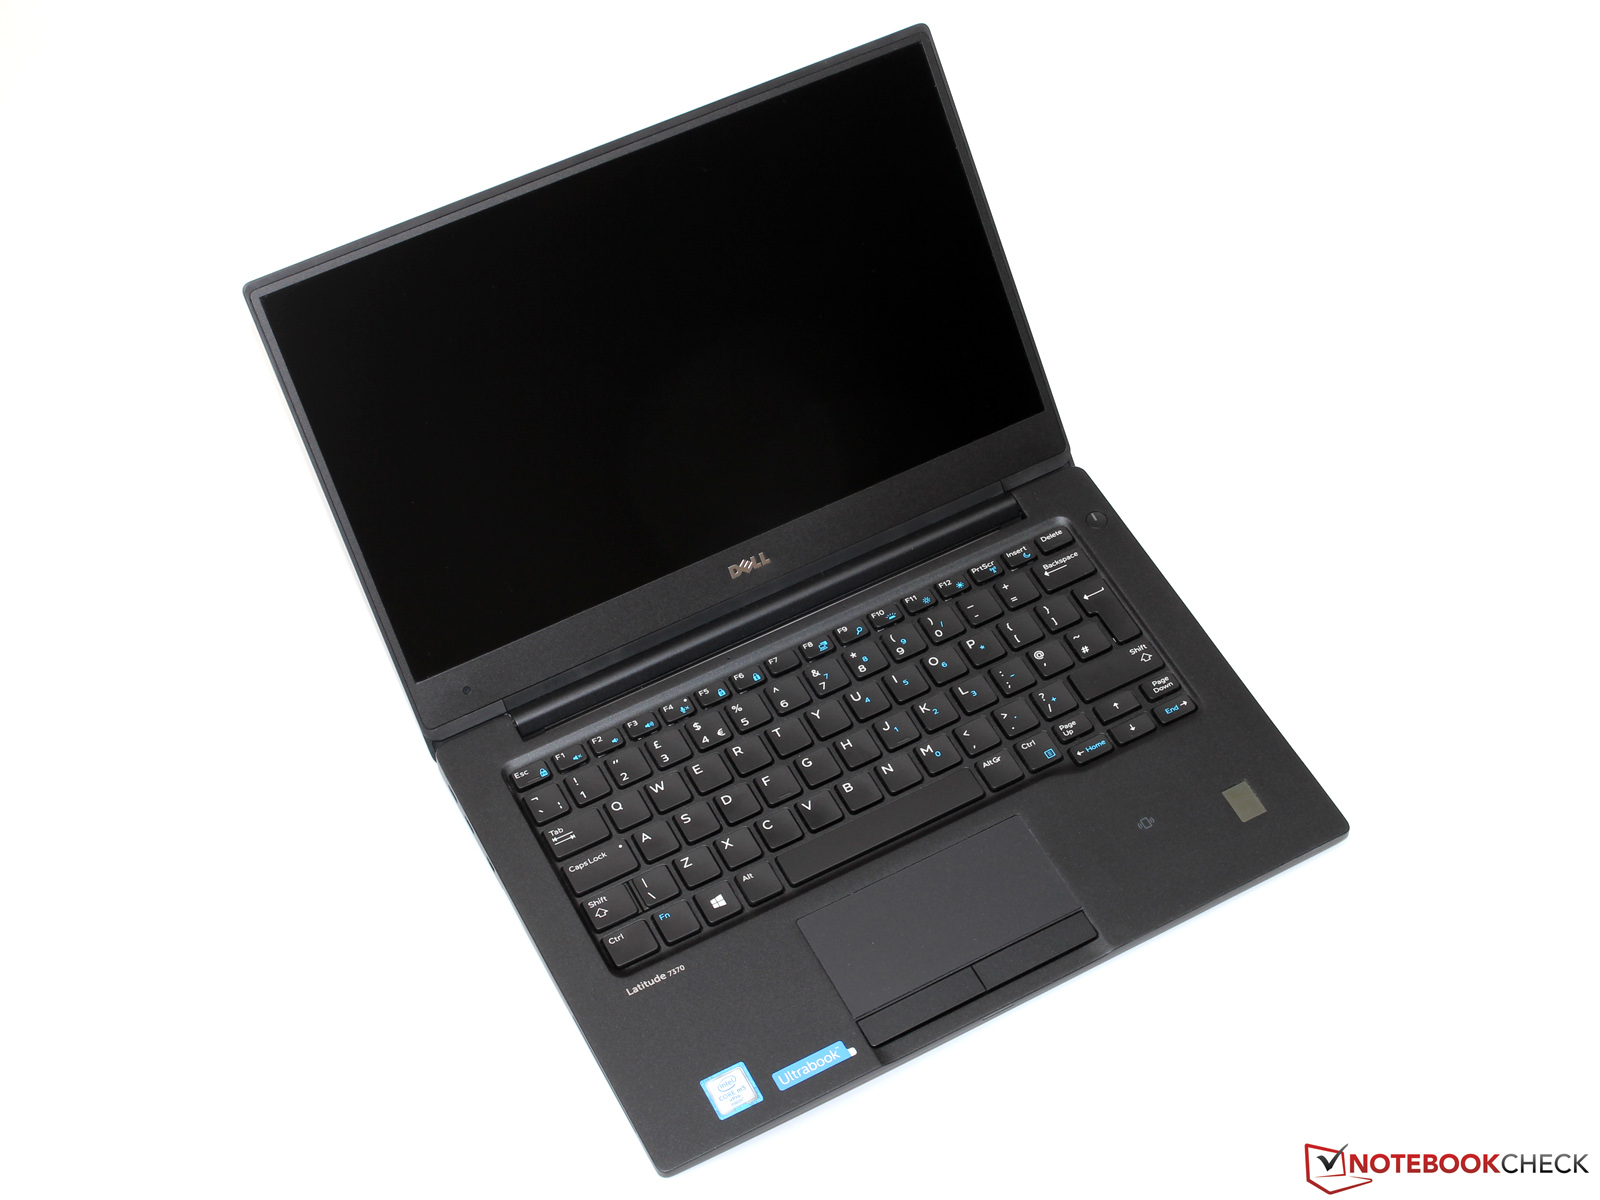
+ 精致坚固的机身
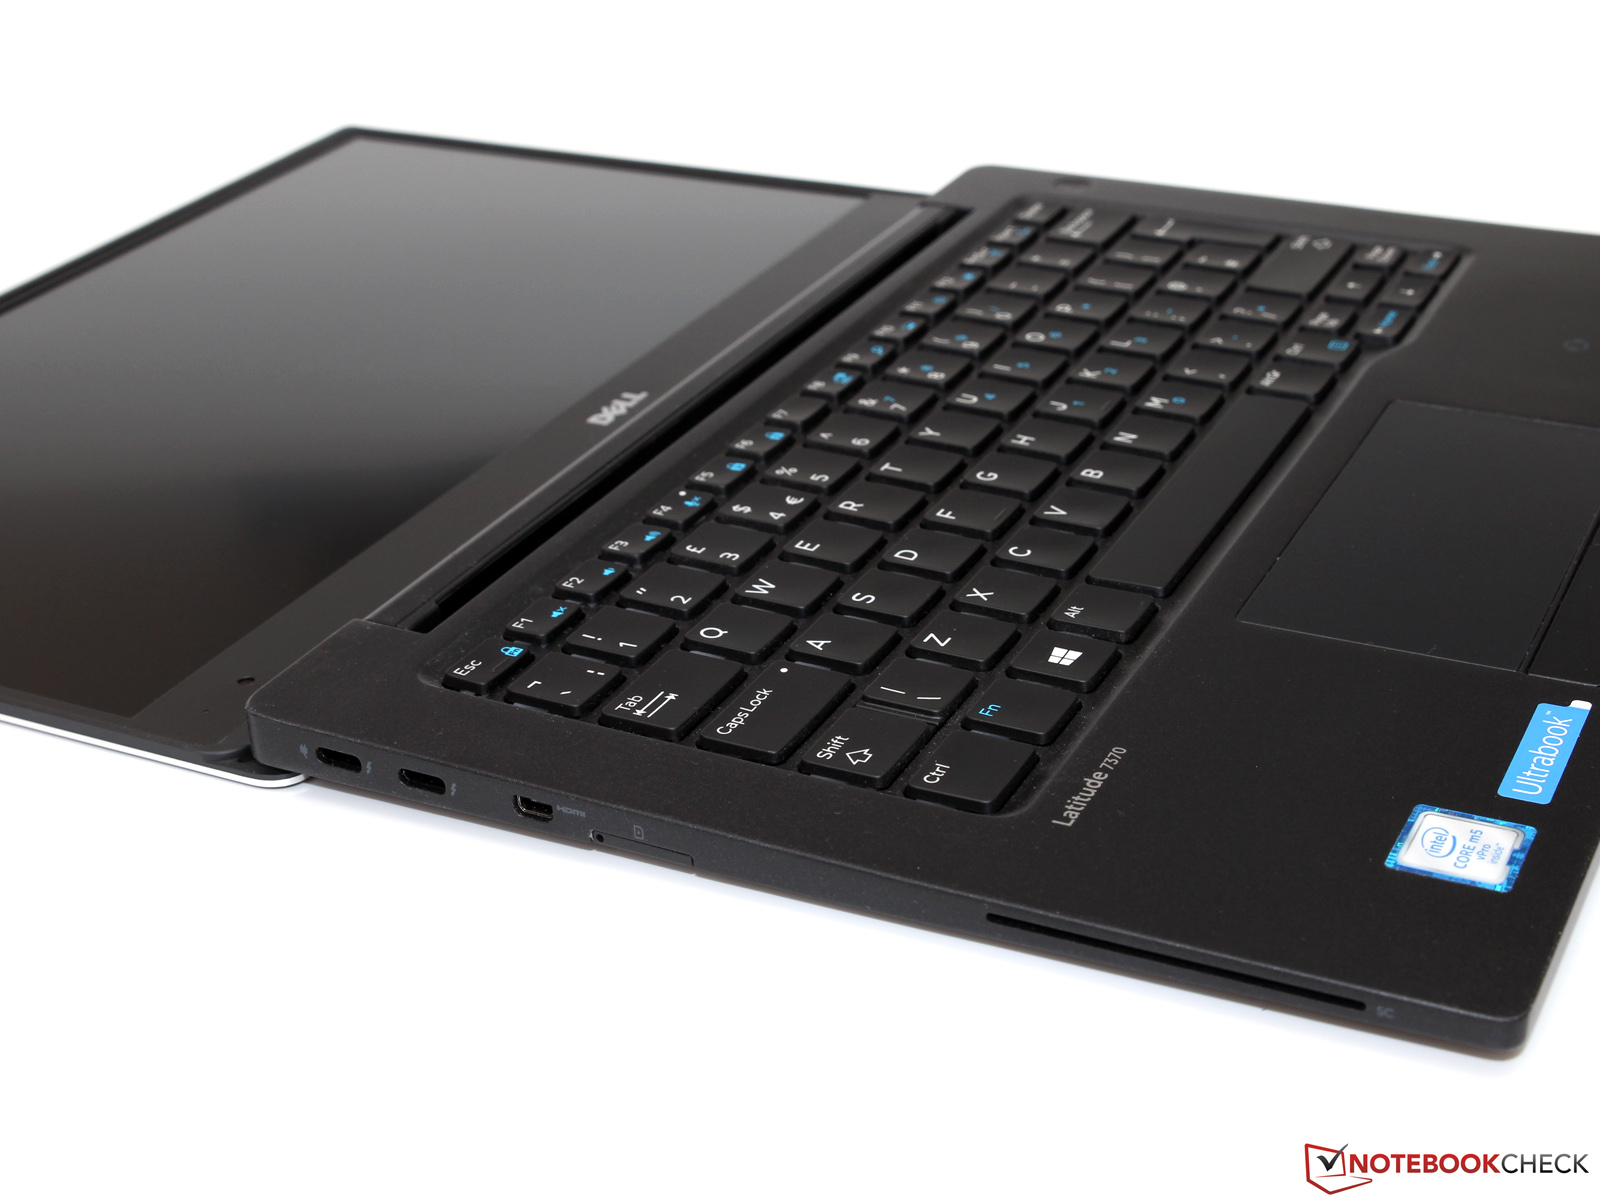
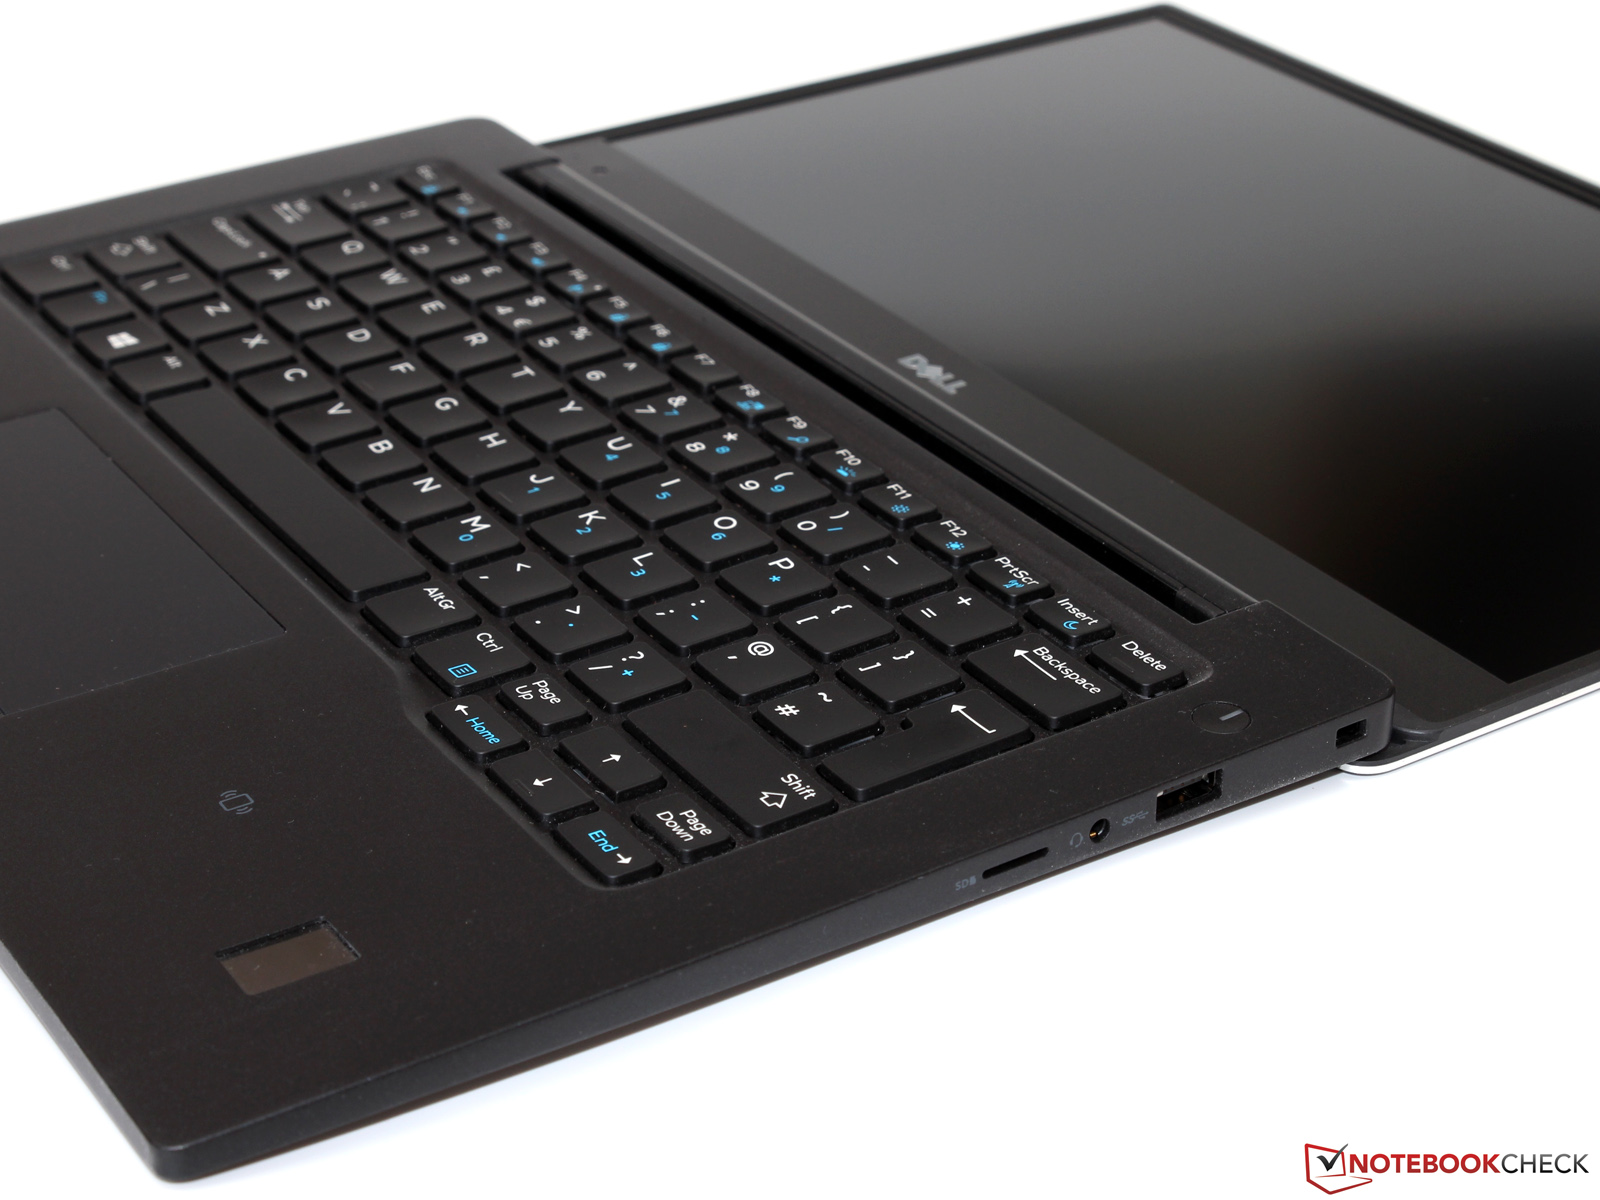
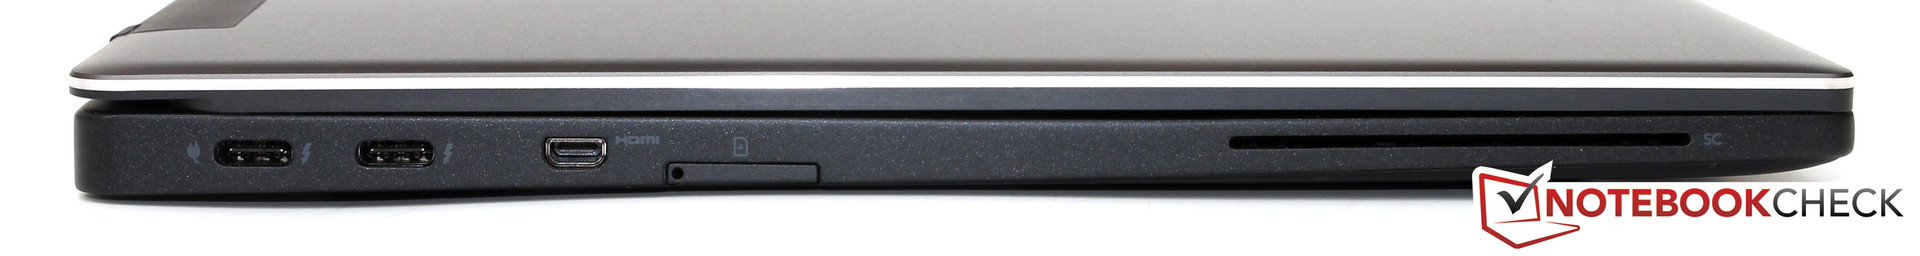
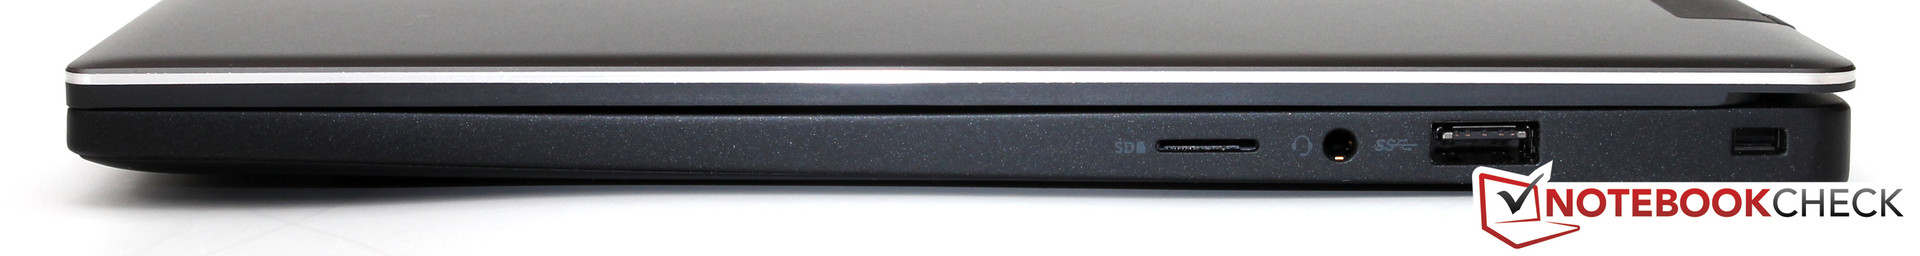
+ 最新接口
+ 高速无线网络
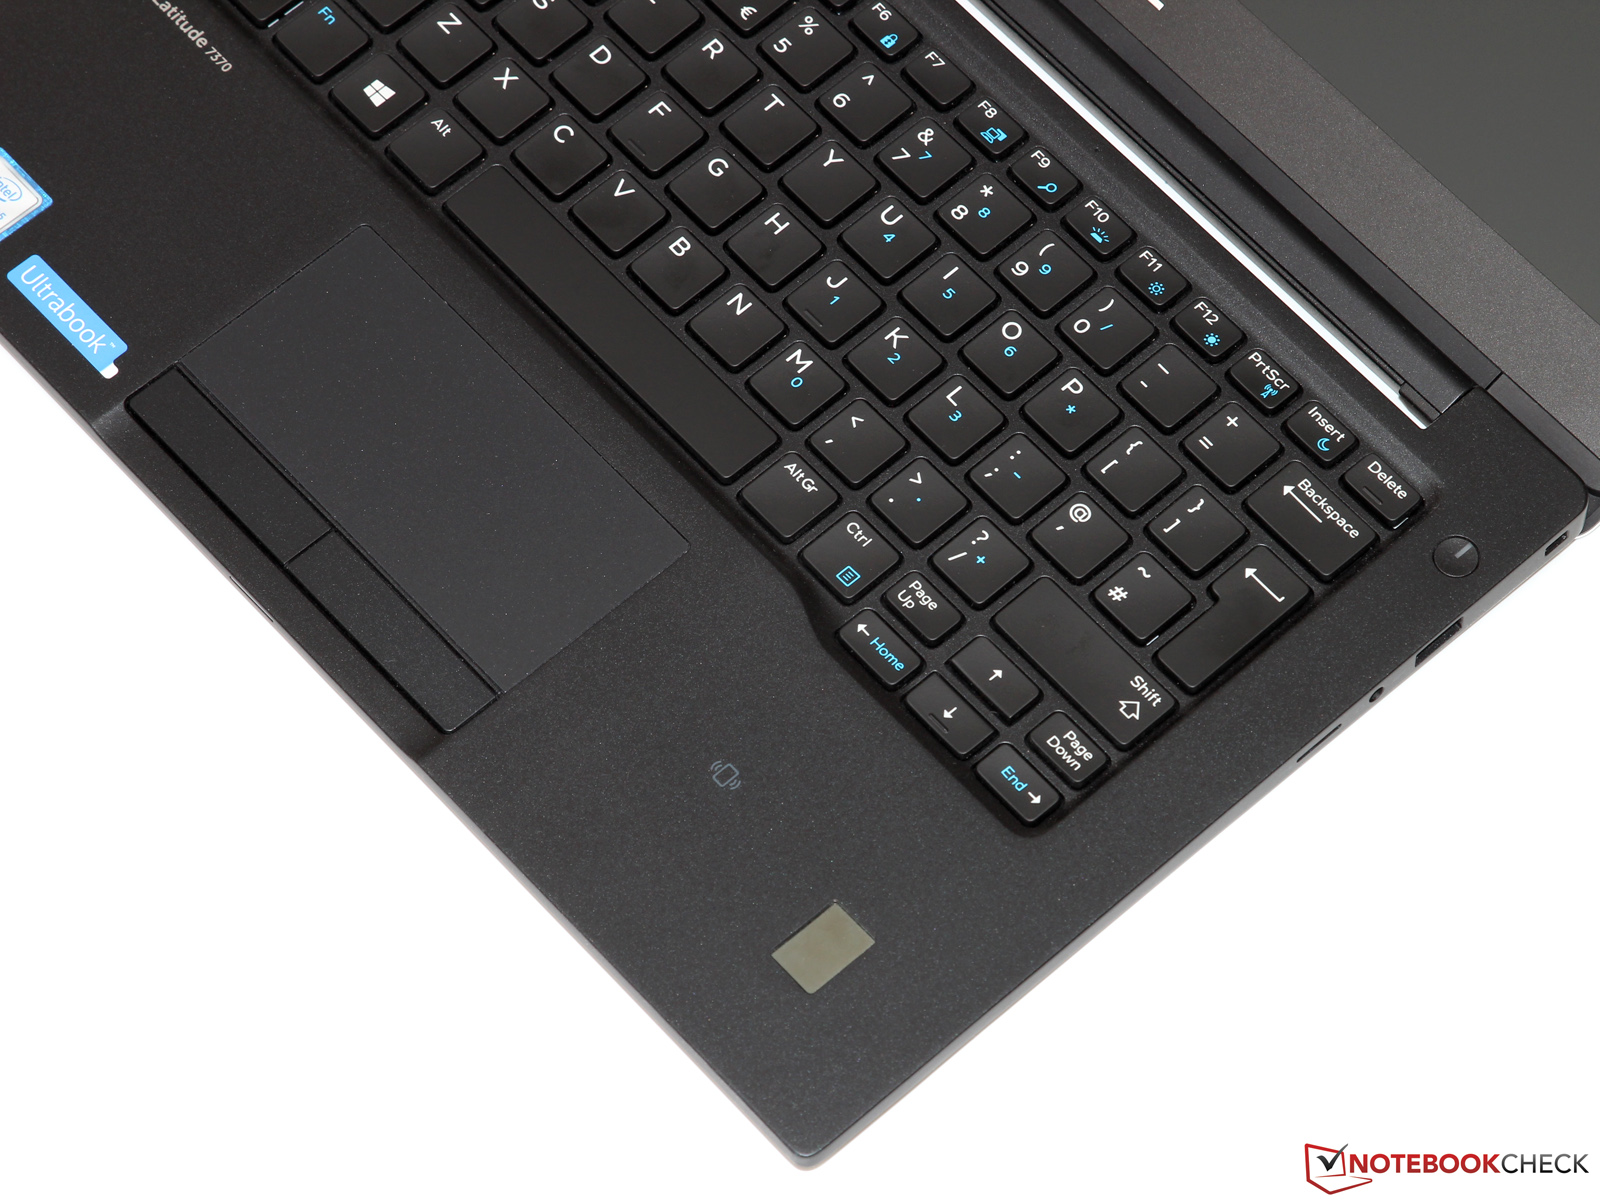
+ 准确的输入设备
+ 优秀的应用程序性能
+ 低发热量
+ 无风扇
+ 三年质保
Cons
- 只提供了一个USB A型接口
- 自动亮度和对比度控制
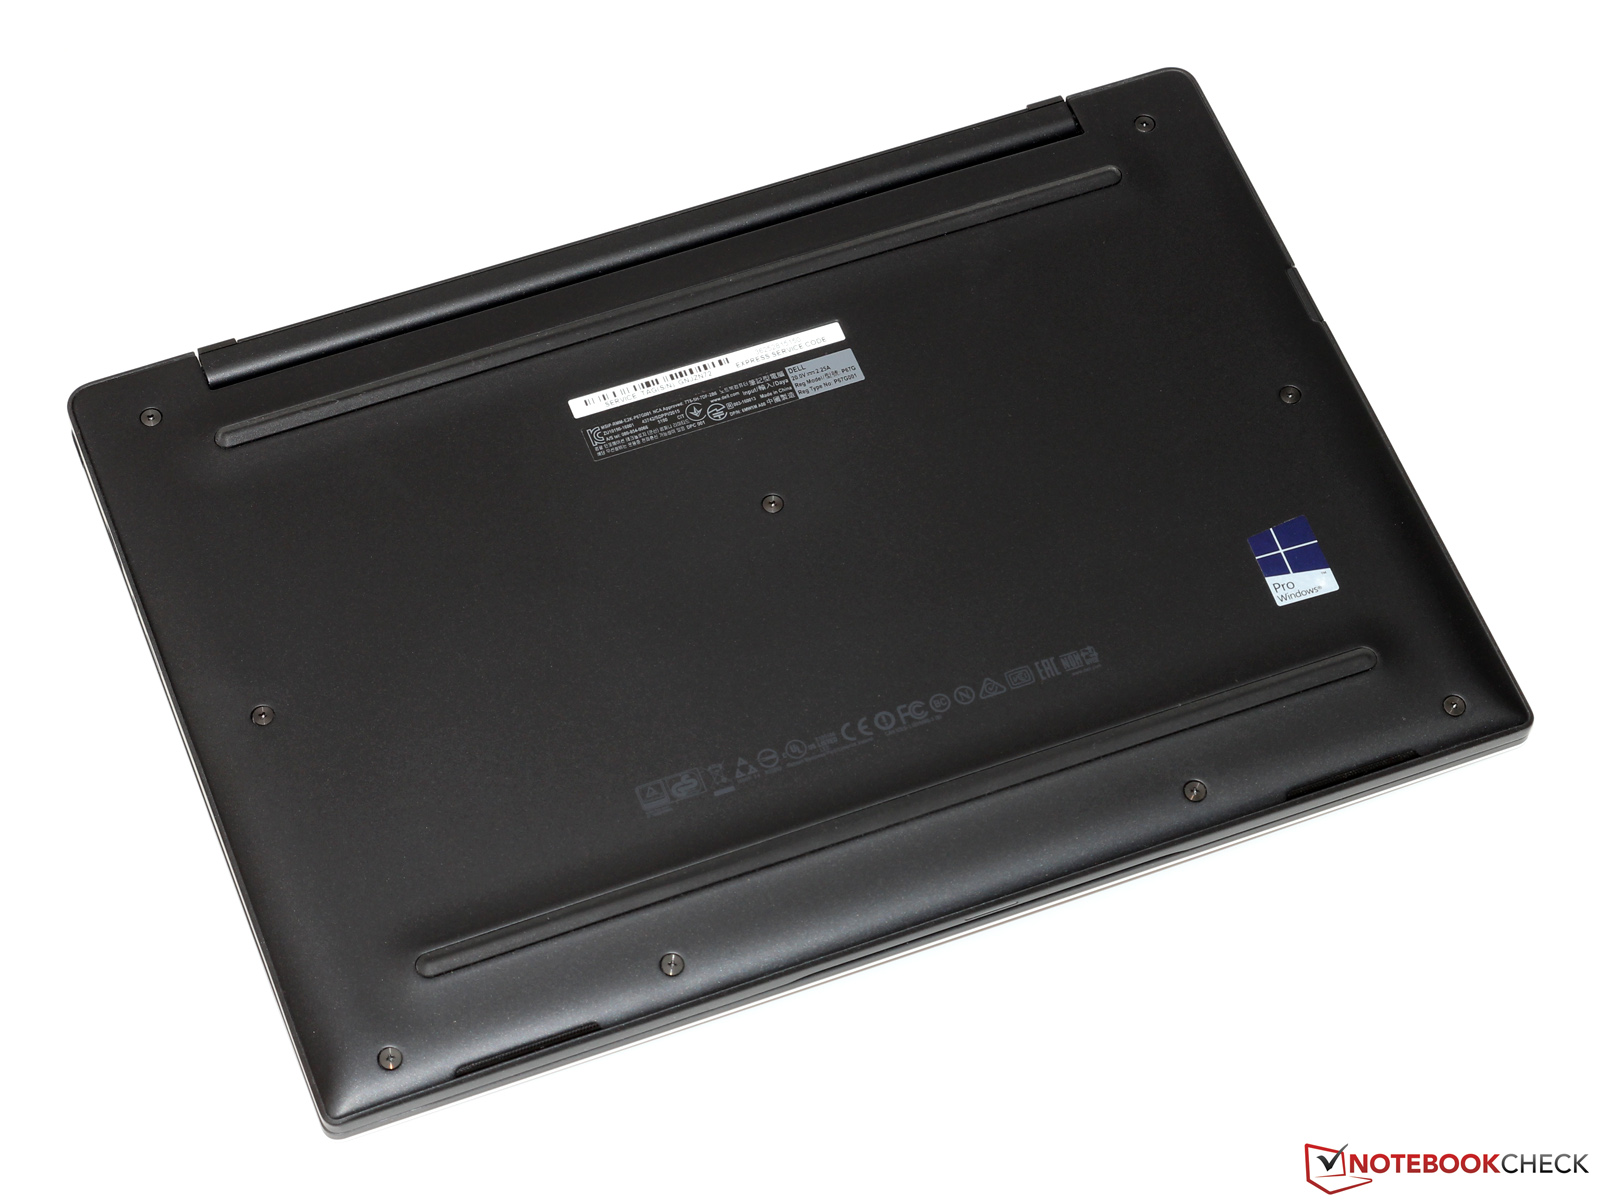
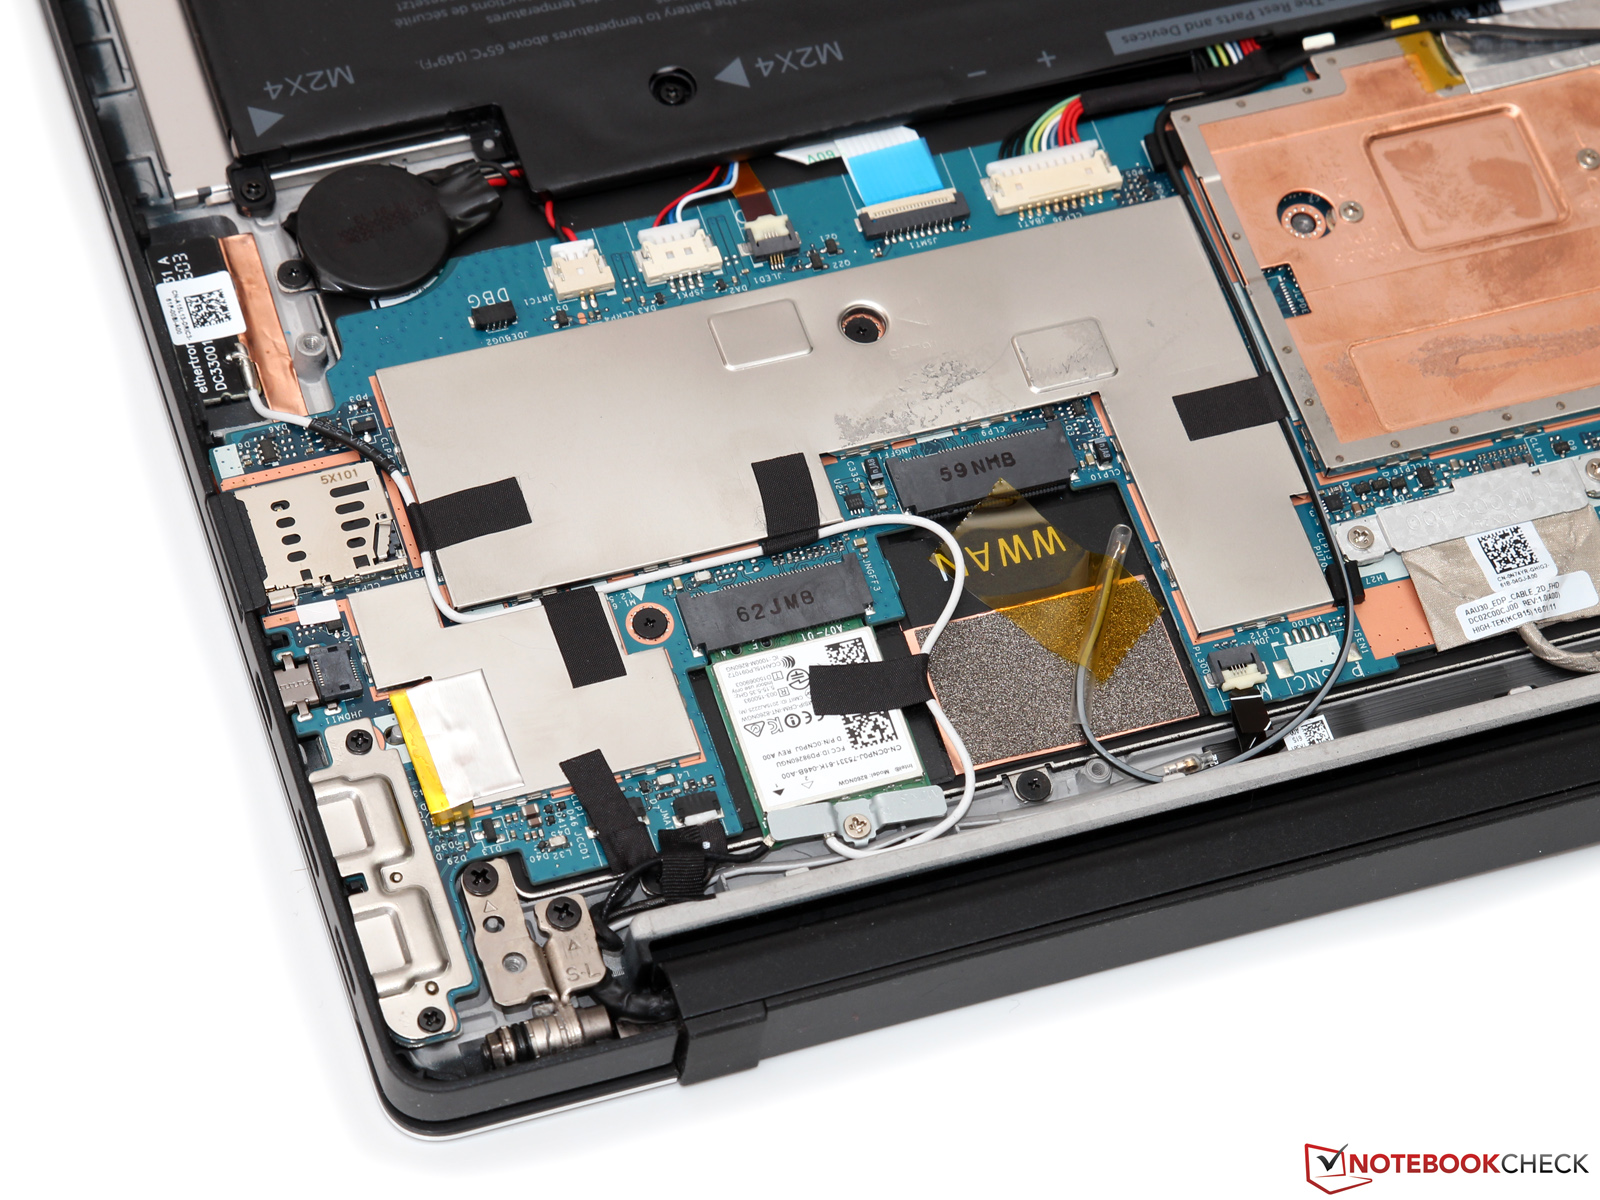
- 有限的可升级空间
- 较高的售价
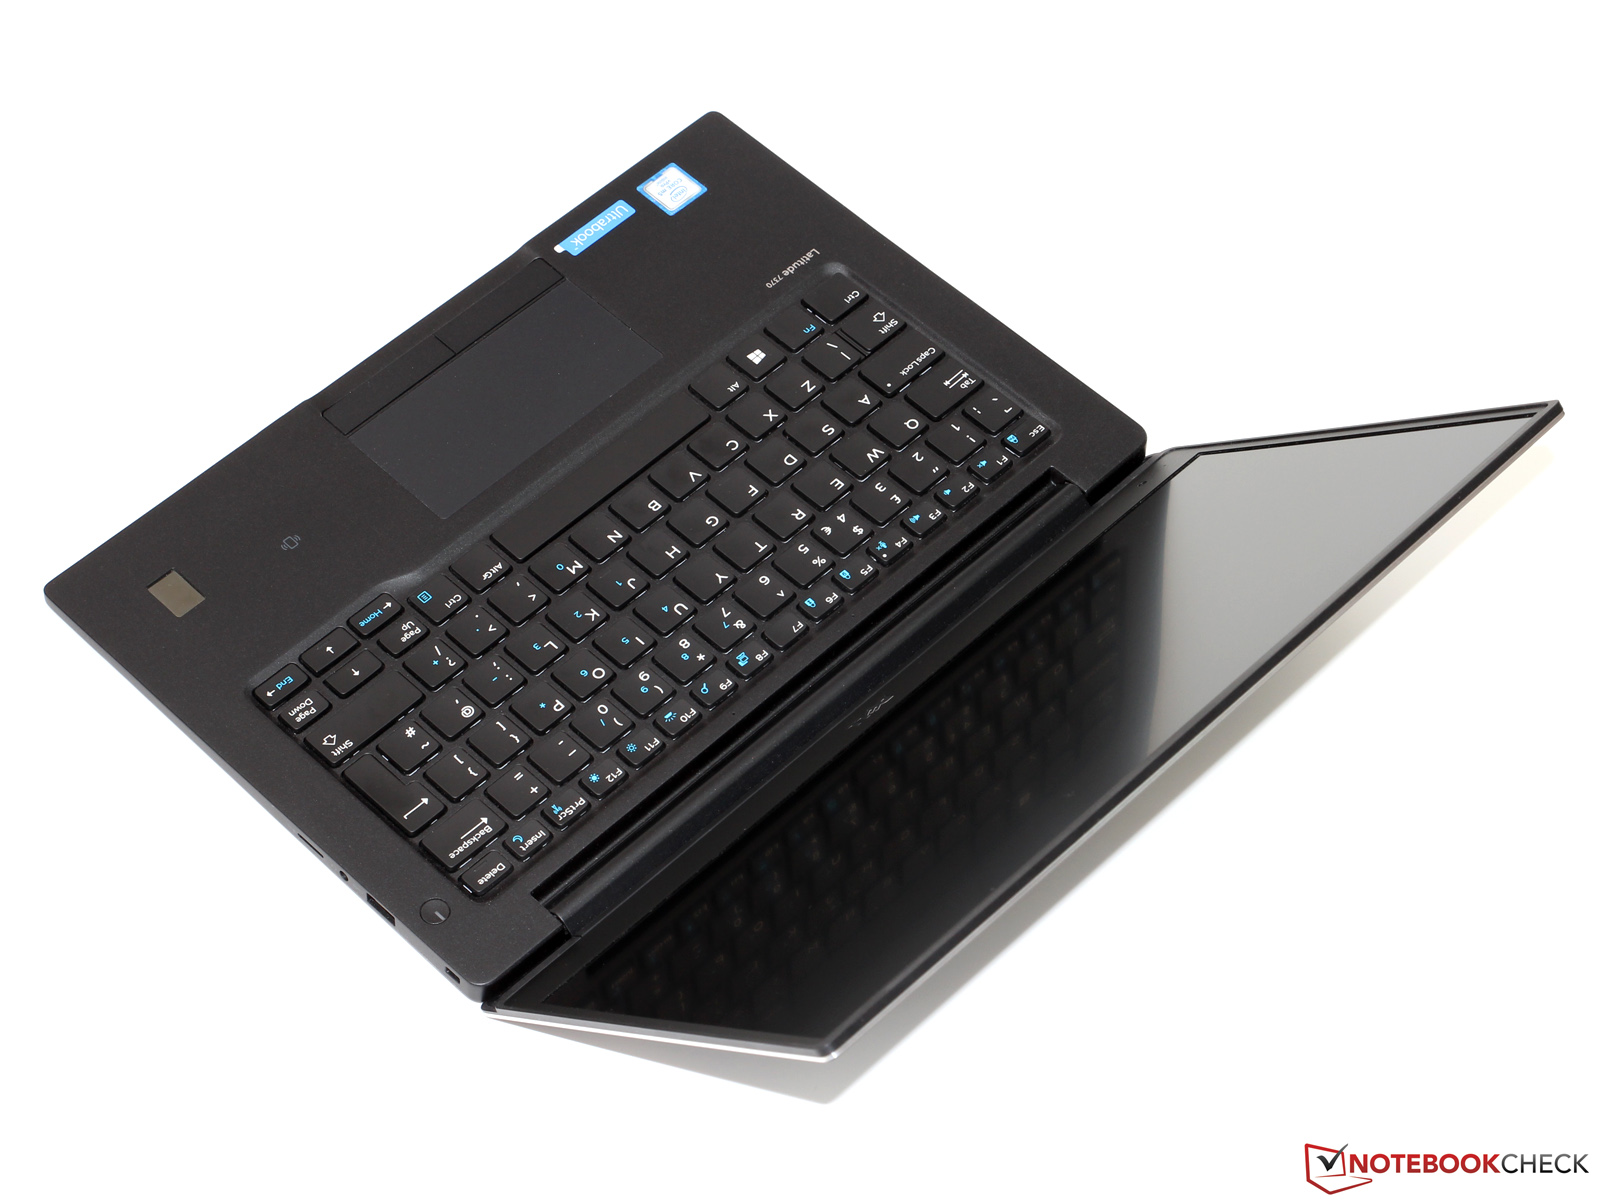
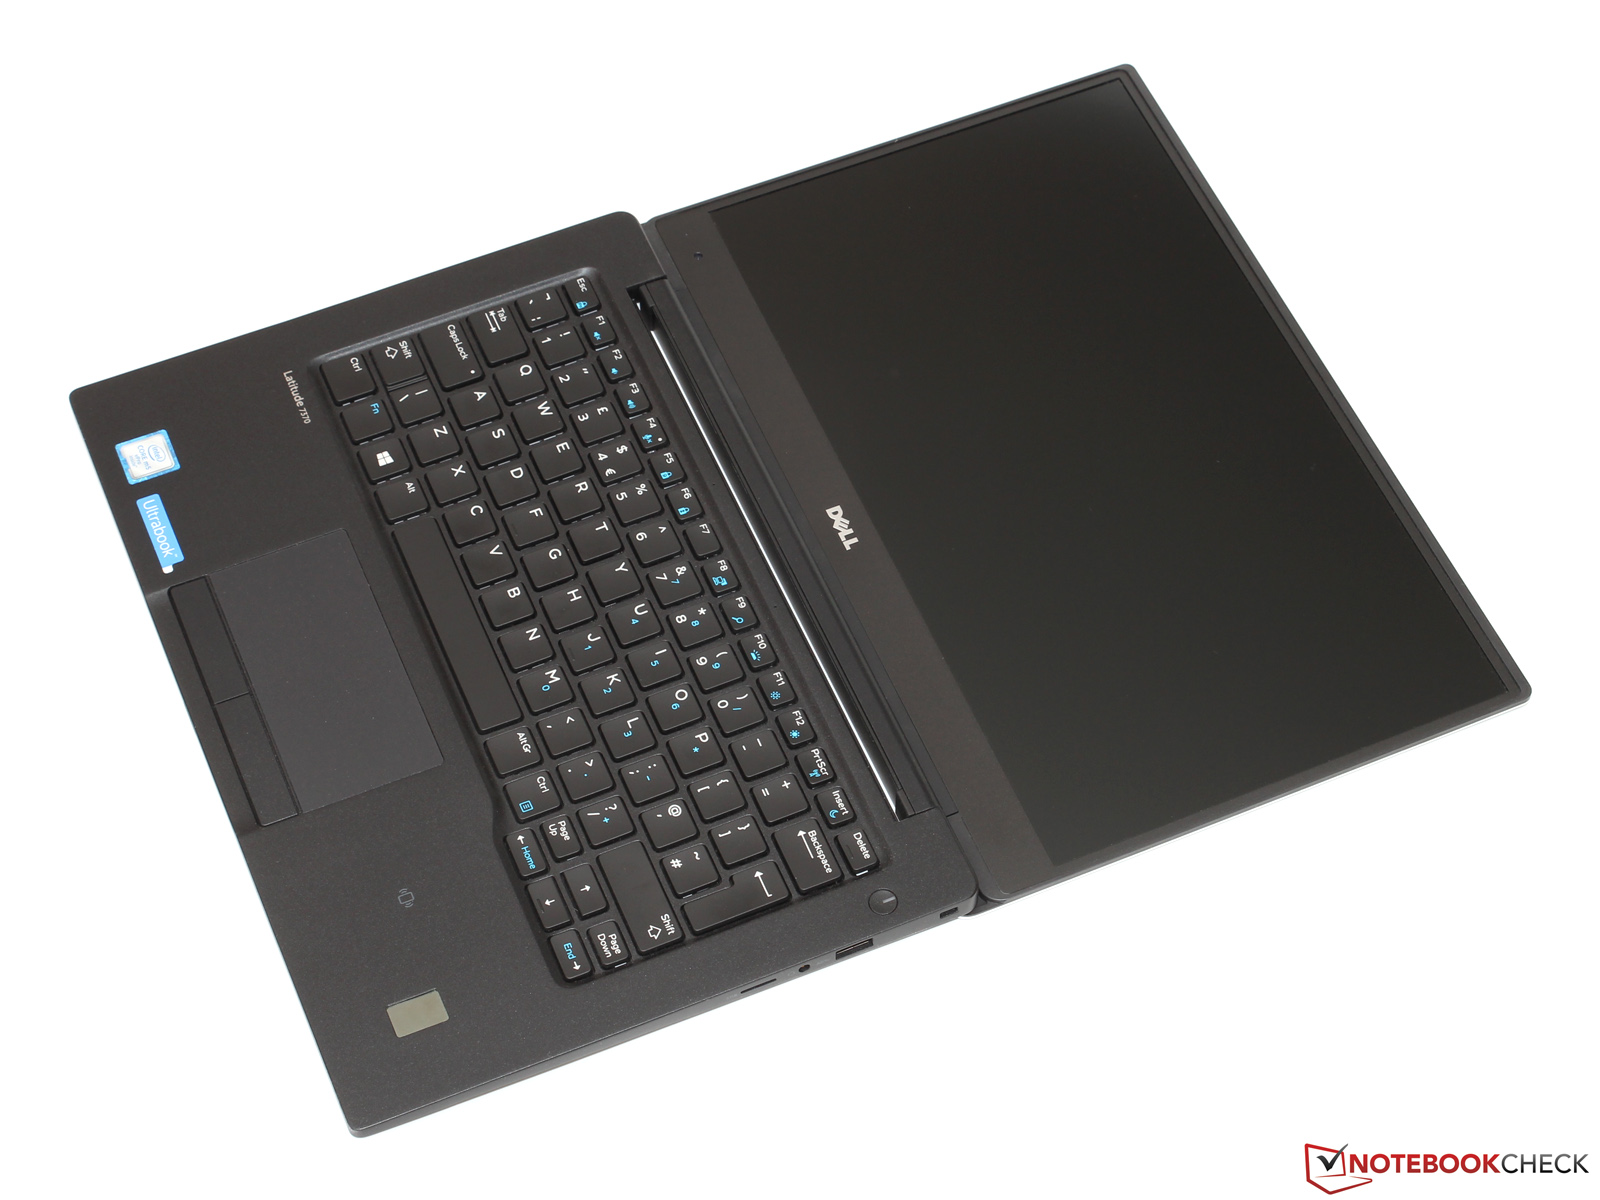
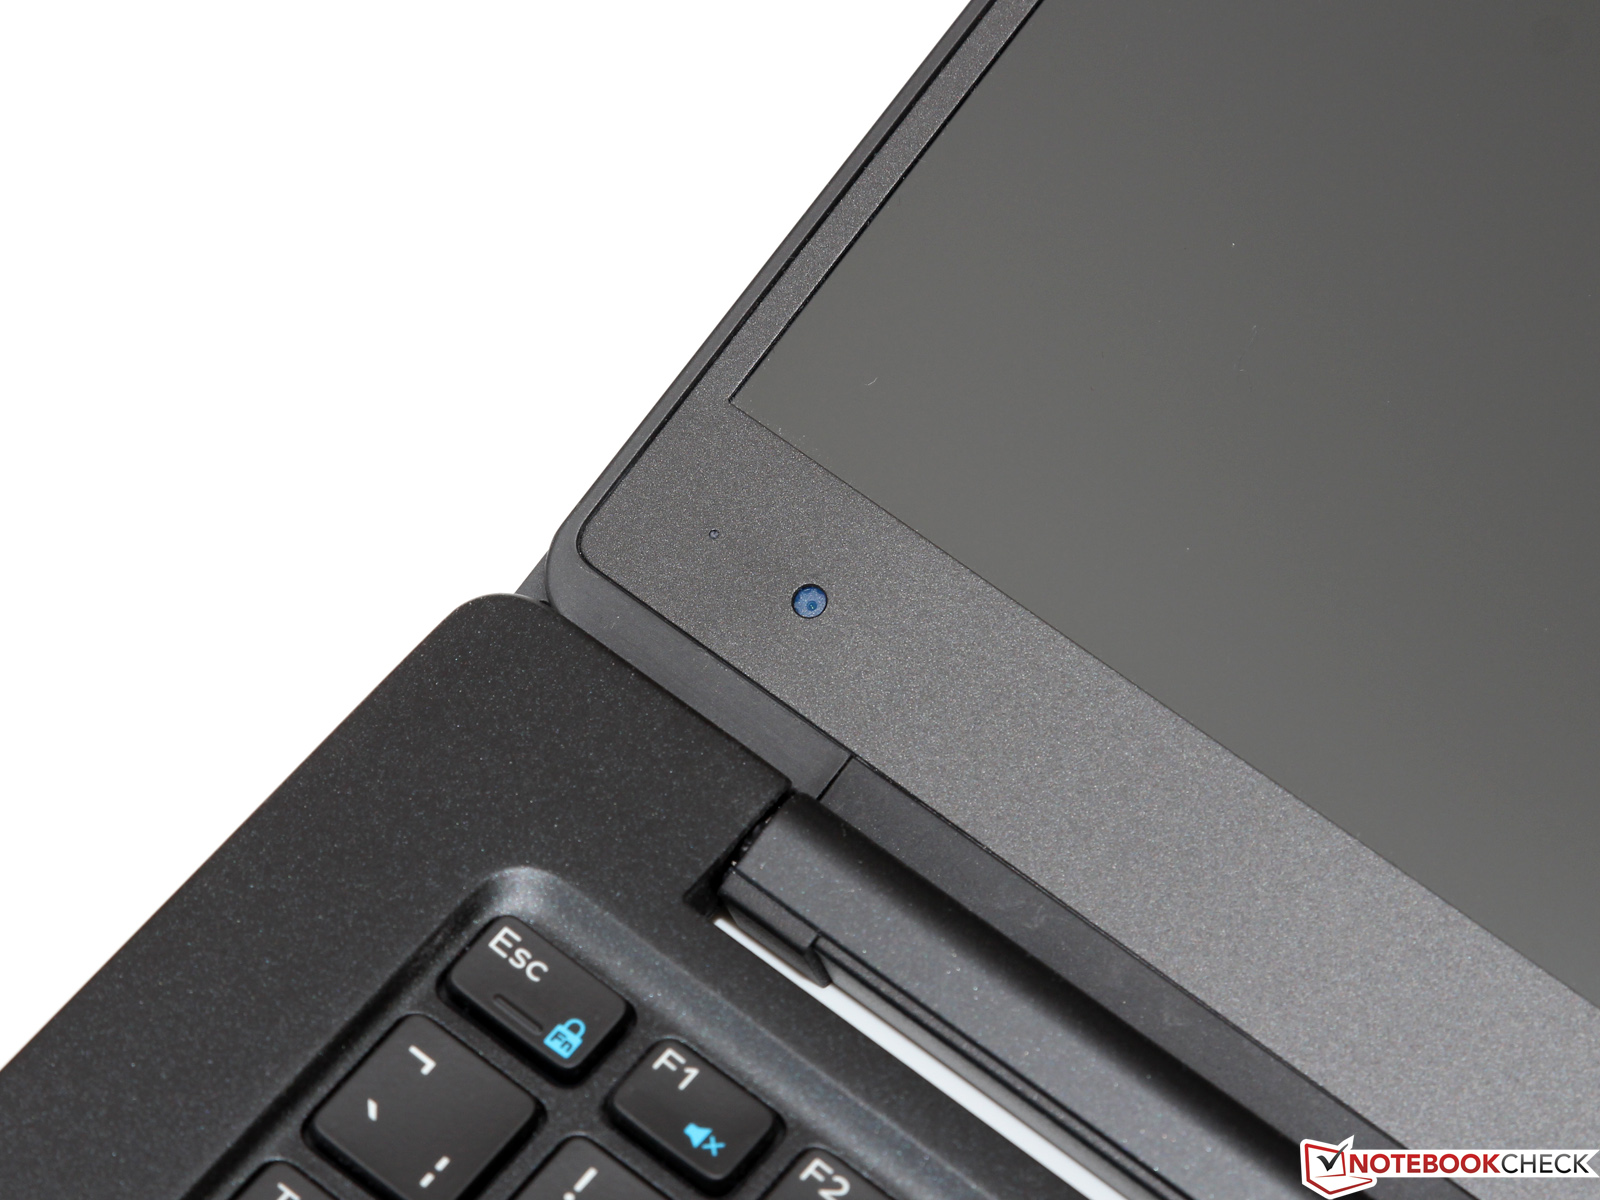
一块几乎无边框的屏幕,被动散热和Thunderbolt 3接口——戴尔Latitude 13 7370必然可以从一成不变的主流商务笔记本中脱颖而出。这台超极本不需要在便携性和品质上惧怕任何惊蛰对手,它的机身工艺无可挑剔,输入设备也十分可靠。酷睿m平台的性能表现也十分优秀:在BIOS更新之后,短时间负载下它的表现几乎可以与主动散热机型相媲美。它的频率和性能只有在持续负载下才会明显下降,不过这在日常办公中应该十分少见。
7370没能得到很好分数的主要原因是屏幕。戴尔为它搭配了一块背光明亮的不错屏幕面板,不过由于自动亮度和对比度控制无法一直处于高亮度下。这让人十分费解,我们希望可以通过更新得到解决。这样的话,只有它的高售价会成为我们难以向用户推荐的原因了:目前价位约2200欧元(约16056人民币),Latitude 13显然不算便宜——甚至(面相消费用户)Apple MacBook 12也还便宜几百欧元。
注:本文是基于完整评测的缩减版本,阅读完整的英文评测,请点击这里。
Dell Latitude 13 7370
- 05/12/2016 v5.1 (old)
Till Schönborn
Subnotebook - Weighted Average
Price comparison
