惠普 ProBook 640 G2 笔记本电脑简短评测
| SD Card Reader | |
| average JPG Copy Test (av. of 3 runs) | |
| Dell Latitude 14 E5470 | |
| HP ProBook 640 G2-T9X60ET | |
| Toshiba Tecra Z40-C-106 | |
| Lenovo ThinkPad L460-20FVS01400 | |
| maximum AS SSD Seq Read Test (1GB) | |
| Dell Latitude 14 E5470 | |
| HP ProBook 640 G2-T9X60ET | |
| Toshiba Tecra Z40-C-106 | |
| Lenovo ThinkPad L460-20FVS01400 | |
| Networking | |
| Wi-Fi Client 1m | |
| Wi-Fi Server 1m |
| |||||||||||||||||||||||||
Brightness Distribution: 93 %
Center on Battery: 321 cd/m²
Contrast: 516:1 (Black: 0.61 cd/m²)
ΔE ColorChecker Calman: 8.8 | ∀{0.5-29.43 Ø4.71}
ΔE Greyscale Calman: 9.44 | ∀{0.09-98 Ø4.96}
74.78% sRGB (Argyll 1.6.3 3D)
47.37% AdobeRGB 1998 (Argyll 1.6.3 3D)
51.2% AdobeRGB 1998 (Argyll 3D)
74.6% sRGB (Argyll 3D)
49.54% Display P3 (Argyll 3D)
Gamma: 2.53
CCT: 11794 K
| HP ProBook 640 G2-T9X60ET Chi Mei CMN14C0, TN-Panel, 1920x1080, 14" | Lenovo ThinkPad L460-20FVS01400 Lenovo N140HCE-EAA, IPS, 1920x1080, 14" | Dell Latitude 14 E5470 LG Philips LGD04B1 140WHU, TN, 1366x768, 14" | Toshiba Tecra Z40-C-106 Toshiba TOS508F, IPS, 1920x1080, 14" | |
|---|---|---|---|---|
| Display | -15% | -19% | 22% | |
| Display P3 Coverage (%) | 49.54 | 42.2 -15% | 40.06 -19% | 64.8 31% |
| sRGB Coverage (%) | 74.6 | 62.3 -16% | 60.3 -19% | 84.4 13% |
| AdobeRGB 1998 Coverage (%) | 51.2 | 43.72 -15% | 41.42 -19% | 61.7 21% |
| Response Times | -13% | -26% | 10% | |
| Response Time Grey 50% / Grey 80% * (ms) | 43.2 ? | 44.4 ? -3% | 56.8 ? -31% | 32.8 ? 24% |
| Response Time Black / White * (ms) | 24 ? | 29.6 ? -23% | 28.8 ? -20% | 25.2 ? -5% |
| PWM Frequency (Hz) | 200 ? | |||
| Screen | 11% | -20% | 18% | |
| Brightness middle (cd/m²) | 315 | 245 -22% | 229 -27% | 269 -15% |
| Brightness (cd/m²) | 304 | 225 -26% | 207 -32% | 257 -15% |
| Brightness Distribution (%) | 93 | 83 -11% | 80 -14% | 86 -8% |
| Black Level * (cd/m²) | 0.61 | 0.24 61% | 0.69 -13% | 0.52 15% |
| Contrast (:1) | 516 | 1021 98% | 332 -36% | 517 0% |
| Colorchecker dE 2000 * | 8.8 | 6.89 22% | 10.16 -15% | 3.45 61% |
| Colorchecker dE 2000 max. * | 15.03 | 17.62 -17% | 17.18 -14% | 9.34 38% |
| Greyscale dE 2000 * | 9.44 | 6.45 32% | 10.87 -15% | 2.28 76% |
| Gamma | 2.53 87% | 2.46 89% | 2.41 91% | 2.38 92% |
| CCT | 11794 55% | 6857 95% | 12881 50% | 6230 104% |
| Color Space (Percent of AdobeRGB 1998) (%) | 47.37 | 40.1 -15% | 38.4 -19% | 55.24 17% |
| Color Space (Percent of sRGB) (%) | 74.78 | 61.8 -17% | 60.4 -19% | 84.32 13% |
| Total Average (Program / Settings) | -6% /
2% | -22% /
-21% | 17% /
18% |
* ... smaller is better
Display Response Times
| ↔ Response Time Black to White | ||
|---|---|---|
| 24 ms ... rise ↗ and fall ↘ combined | ↗ 17.6 ms rise | 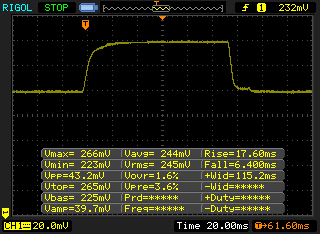 |
| ↘ 6.4 ms fall | ||
| The screen shows good response rates in our tests, but may be too slow for competitive gamers. In comparison, all tested devices range from 0.1 (minimum) to 240 (maximum) ms. » 54 % of all devices are better. This means that the measured response time is worse than the average of all tested devices (19.8 ms). | ||
| ↔ Response Time 50% Grey to 80% Grey | ||
| 43.2 ms ... rise ↗ and fall ↘ combined | ↗ 21.6 ms rise | 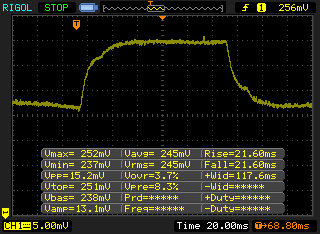 |
| ↘ 21.6 ms fall | ||
| The screen shows slow response rates in our tests and will be unsatisfactory for gamers. In comparison, all tested devices range from 0.165 (minimum) to 636 (maximum) ms. » 72 % of all devices are better. This means that the measured response time is worse than the average of all tested devices (31 ms). | ||
Screen Flickering / PWM (Pulse-Width Modulation)
| Screen flickering / PWM detected | 200 Hz | ≤ 90 % brightness setting | 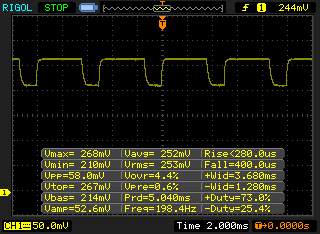 |
The display backlight flickers at 200 Hz (worst case, e.g., utilizing PWM) Flickering detected at a brightness setting of 90 % and below. There should be no flickering or PWM above this brightness setting. The frequency of 200 Hz is relatively low, so sensitive users will likely notice flickering and experience eyestrain at the stated brightness setting and below. In comparison: 52 % of all tested devices do not use PWM to dim the display. If PWM was detected, an average of 7754 (minimum: 5 - maximum: 343500) Hz was measured. | |||
| Cinebench R15 | |
| CPU Single 64Bit | |
| Lenovo ThinkPad T460s-20FA003GGE | |
| Lenovo ThinkPad L460-20FVS01400 | |
| Dell Latitude 14 E5470 | |
| HP ProBook 640 G2-T9X60ET | |
| Lenovo ThinkPad E560 20EV000MGE | |
| Toshiba Tecra Z40-C-106 | |
| CPU Multi 64Bit | |
| Lenovo ThinkPad T460s-20FA003GGE | |
| Dell Latitude 14 E5470 | |
| Lenovo ThinkPad L460-20FVS01400 | |
| HP ProBook 640 G2-T9X60ET | |
| Lenovo ThinkPad E560 20EV000MGE | |
| Toshiba Tecra Z40-C-106 | |
| Cinebench R11.5 | |
| CPU Single 64Bit | |
| Lenovo ThinkPad T460s-20FA003GGE | |
| Dell Latitude 14 E5470 | |
| Lenovo ThinkPad L460-20FVS01400 | |
| HP ProBook 640 G2-T9X60ET | |
| Lenovo ThinkPad E560 20EV000MGE | |
| Toshiba Tecra Z40-C-106 | |
| CPU Multi 64Bit | |
| Lenovo ThinkPad T460s-20FA003GGE | |
| Dell Latitude 14 E5470 | |
| Lenovo ThinkPad L460-20FVS01400 | |
| HP ProBook 640 G2-T9X60ET | |
| Lenovo ThinkPad E560 20EV000MGE | |
| Toshiba Tecra Z40-C-106 | |
| X264 HD Benchmark 4.0 | |
| Pass 1 | |
| Lenovo ThinkPad T460s-20FA003GGE | |
| HP ProBook 640 G2-T9X60ET | |
| Pass 2 | |
| Lenovo ThinkPad T460s-20FA003GGE | |
| HP ProBook 640 G2-T9X60ET | |
| HP ProBook 640 G2-T9X60ET Samsung SSD PM871 MZNLN256HCHP | Lenovo ThinkPad L460-20FVS01400 Toshiba HG6 THNSFJ256GCSU | Dell Latitude 14 E5470 Liteon L8H-256V2G | Toshiba Tecra Z40-C-106 Toshiba HG6 THNSNJ256G8NY | Lenovo ThinkPad T460s-20FA003GGE Samsung SSD SM951a 512GB M.2 PCIe 3.0 x4 NVMe (MZVKV512) | Lenovo ThinkPad T460s-20FAS2G900 Samsung SSD PM961 1TB M.2 PCIe 3.0 x4 NVMe (MZSLW1T0) | |
|---|---|---|---|---|---|---|
| CrystalDiskMark 3.0 | -13% | -5% | -5% | 180% | 134% | |
| Read Seq (MB/s) | 492.8 | 480.9 -2% | 508 3% | 521 6% | 1778 261% | 1676 240% |
| Write Seq (MB/s) | 303.2 | 426.4 41% | 360.6 19% | 444.5 47% | 1530 405% | 1286 324% |
| Read 512 (MB/s) | 417.4 | 361.8 -13% | 374.1 -10% | 420.2 1% | 1339 221% | 546 31% |
| Write 512 (MB/s) | 301.5 | 220.9 -27% | 300.2 0% | 421 40% | 1506 400% | 1031 242% |
| Read 4k (MB/s) | 33.28 | 21.51 -35% | 31.98 -4% | 20.32 -39% | 51.3 54% | 46.31 39% |
| Write 4k (MB/s) | 84.6 | 71.5 -15% | 93.1 10% | 79.6 -6% | 139.3 65% | 150.1 77% |
| Read 4k QD32 (MB/s) | 394.2 | 277.6 -30% | 274.7 -30% | 229 -42% | 561 42% | 586 49% |
| Write 4k QD32 (MB/s) | 295.5 | 230.4 -22% | 205.6 -30% | 153.6 -48% | 277 -6% | 496.3 68% |

| PCMark 8 | |
| Home Score Accelerated v2 | |
| Lenovo ThinkPad T460s-20FA003GGE | |
| Dell Latitude 14 E5470 | |
| HP EliteBook 840 G3 T9X59ET#ABD | |
| HP ProBook 640 G2-T9X60ET | |
| Toshiba Tecra Z40-C-106 | |
| Lenovo ThinkPad L460-20FVS01400 | |
| Work Score Accelerated v2 | |
| Dell Latitude 14 E5470 | |
| Lenovo ThinkPad L460-20FVS01400 | |
| Lenovo ThinkPad T460s-20FA003GGE | |
| Toshiba Tecra Z40-C-106 | |
| HP EliteBook 840 G3 T9X59ET#ABD | |
| HP ProBook 640 G2-T9X60ET | |
| Creative Score Accelerated v2 | |
| Lenovo ThinkPad T460s-20FA003GGE | |
| Dell Latitude 14 E5470 | |
| HP ProBook 640 G2-T9X60ET | |
| Lenovo ThinkPad L460-20FVS01400 | |
| PCMark 7 Score | 4917 points | |
| PCMark 8 Home Score Accelerated v2 | 3224 points | |
| PCMark 8 Creative Score Accelerated v2 | 3891 points | |
| PCMark 8 Work Score Accelerated v2 | 4260 points | |
Help | ||
| 3DMark 11 - 1280x720 Performance GPU | |
| Lenovo ThinkPad L460-20FVS01400 | |
| Lenovo ThinkPad T460s-20FA003GGE | |
| HP ProBook 640 G2-T9X60ET | |
| HP EliteBook 840 G3 T9X59ET#ABD | |
| Dell Latitude 14 E5470 | |
| Toshiba Tecra Z40-C-106 | |
| 3DMark | |
| 1280x720 Cloud Gate Standard Graphics | |
| Lenovo ThinkPad T460s-20FA003GGE | |
| HP ProBook 640 G2-T9X60ET | |
| HP EliteBook 840 G3 T9X59ET#ABD | |
| Dell Latitude 14 E5470 | |
| Lenovo ThinkPad L460-20FVS01400 | |
| 1920x1080 Fire Strike Graphics | |
| Lenovo ThinkPad L460-20FVS01400 | |
| Lenovo ThinkPad T460s-20FA003GGE | |
| HP EliteBook 840 G3 T9X59ET#ABD | |
| Dell Latitude 14 E5470 | |
| HP ProBook 640 G2-T9X60ET | |
| 3DMark 06 Standard Score | 7702 points | |
| 3DMark 11 Performance | 1500 points | |
| 3DMark Ice Storm Standard Score | 45053 points | |
| 3DMark Cloud Gate Standard Score | 5073 points | |
| 3DMark Fire Strike Score | 720 points | |
Help | ||
| low | med. | high | ultra | |
|---|---|---|---|---|
| BioShock Infinite (2013) | 43.7 | 24.5 | 20.2 | 6.1 |
| Metro: Last Light (2013) | 23.5 | 18.2 | 11.5 | |
| Dirt Rally (2015) | 72.1 | 20.1 | 12.5 |
| HP ProBook 640 G2-T9X60ET HD Graphics 520, 6200U, Samsung SSD PM871 MZNLN256HCHP | Lenovo ThinkPad L460-20FVS01400 Radeon R5 M330, 6500U, Toshiba HG6 THNSFJ256GCSU | Dell Latitude 14 E5470 HD Graphics 520, 6300U, Liteon L8H-256V2G | Toshiba Tecra Z40-C-106 HD Graphics 520, 6200U, Toshiba HG6 THNSNJ256G8NY | |
|---|---|---|---|---|
| Noise | -3% | -2% | -3% | |
| off / environment * (dB) | 29 | 29.2 -1% | 29.2 -1% | 29 -0% |
| Idle Minimum * (dB) | 29 | 29.2 -1% | 29.2 -1% | 29.8 -3% |
| Idle Average * (dB) | 29.8 | 29.2 2% | 29.2 2% | 29.8 -0% |
| Idle Maximum * (dB) | 30.2 | 29.2 3% | 29.2 3% | 29.8 1% |
| Load Average * (dB) | 30.2 | 32.5 -8% | 32.1 -6% | 32.6 -8% |
| Load Maximum * (dB) | 33.9 | 37.2 -10% | 36.8 -9% | 37.2 -10% |
* ... smaller is better
Noise level
| Idle |
| 29 / 29.8 / 30.2 dB(A) |
| Load |
| 30.2 / 33.9 dB(A) |
 | ||
30 dB silent 40 dB(A) audible 50 dB(A) loud |
||
min: | ||
(±) The maximum temperature on the upper side is 40.7 °C / 105 F, compared to the average of 34.3 °C / 94 F, ranging from 21.2 to 62.5 °C for the class Office.
(±) The bottom heats up to a maximum of 42.6 °C / 109 F, compared to the average of 36.8 °C / 98 F
(+) In idle usage, the average temperature for the upper side is 28.5 °C / 83 F, compared to the device average of 29.5 °C / 85 F.
(+) The palmrests and touchpad are cooler than skin temperature with a maximum of 30.7 °C / 87.3 F and are therefore cool to the touch.
(-) The average temperature of the palmrest area of similar devices was 27.5 °C / 81.5 F (-3.2 °C / -5.8 F).
| Off / Standby | |
| Idle | |
| Load |
|
Key:
min: | |
| HP ProBook 640 G2-T9X60ET 6200U, HD Graphics 520, Samsung SSD PM871 MZNLN256HCHP, TN-Panel, 1920x1080, 14" | Lenovo ThinkPad L460-20FVS01400 6500U, Radeon R5 M330, Toshiba HG6 THNSFJ256GCSU, IPS, 1920x1080, 14" | Dell Latitude 14 E5470 6300U, HD Graphics 520, Liteon L8H-256V2G, TN, 1366x768, 14" | Toshiba Tecra Z40-C-106 6200U, HD Graphics 520, Toshiba HG6 THNSNJ256G8NY, IPS, 1920x1080, 14" | |
|---|---|---|---|---|
| Power Consumption | -15% | 5% | -13% | |
| Idle Minimum * (Watt) | 3.3 | 3.1 6% | 3.5 -6% | 4.3 -30% |
| Idle Average * (Watt) | 6 | 6.3 -5% | 5.3 12% | 7.6 -27% |
| Idle Maximum * (Watt) | 6.9 | 7.9 -14% | 6 13% | 8.3 -20% |
| Load Average * (Watt) | 27.7 | 29.5 -6% | 26.3 5% | 26.8 3% |
| Load Maximum * (Watt) | 36.6 | 57.3 -57% | 36.6 -0% | 32.6 11% |
* ... smaller is better
| HP ProBook 640 G2-T9X60ET 6200U, HD Graphics 520, 46 Wh | Lenovo ThinkPad L460-20FVS01400 6500U, Radeon R5 M330, 48 Wh | Dell Latitude 14 E5470 6300U, HD Graphics 520, 62 Wh | Toshiba Tecra Z40-C-106 6200U, HD Graphics 520, 64 Wh | |
|---|---|---|---|---|
| Battery runtime | -18% | 16% | -3% | |
| Reader / Idle (h) | 16.6 | 19.2 16% | 21.7 31% | 17.4 5% |
| WiFi v1.3 (h) | 9.6 | 7.1 -26% | 11.1 16% | 9 -6% |
| Load (h) | 2.9 | 1.6 -45% | 2.9 0% | 2.7 -7% |
| H.264 (h) | 7.2 | 10.8 |
Pros
Cons
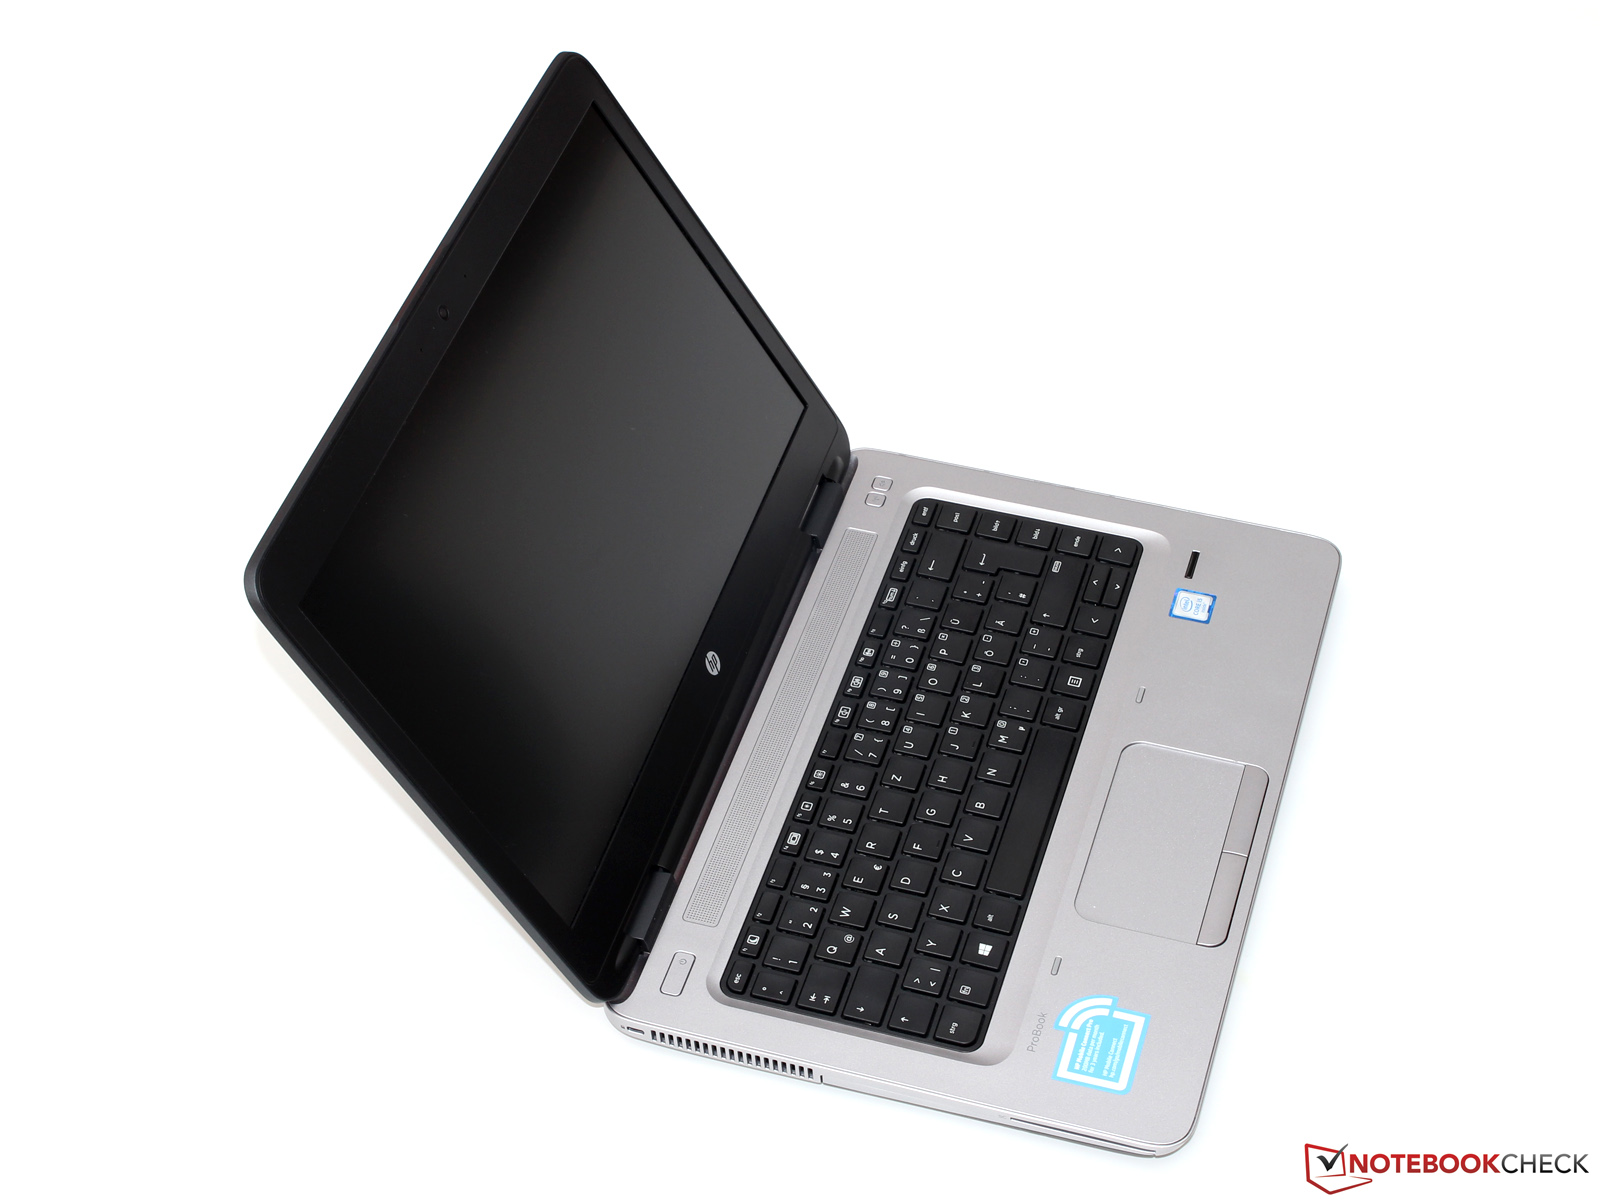
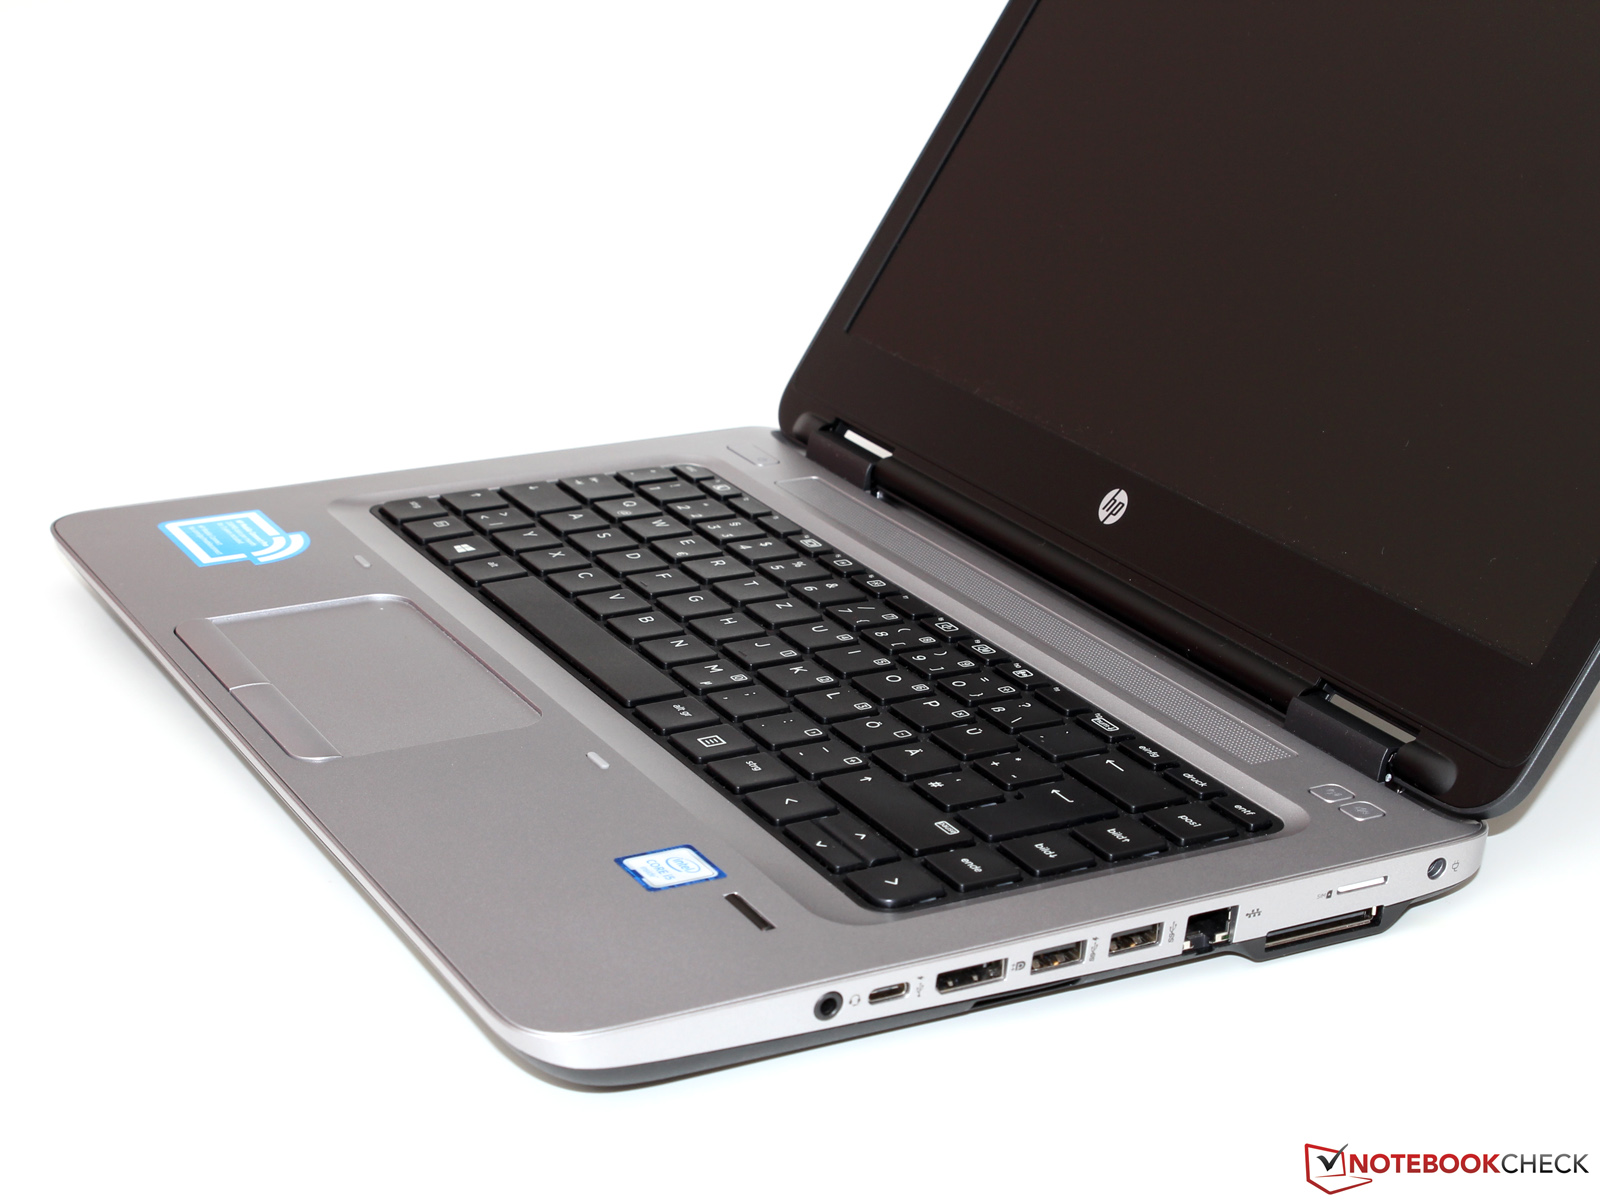
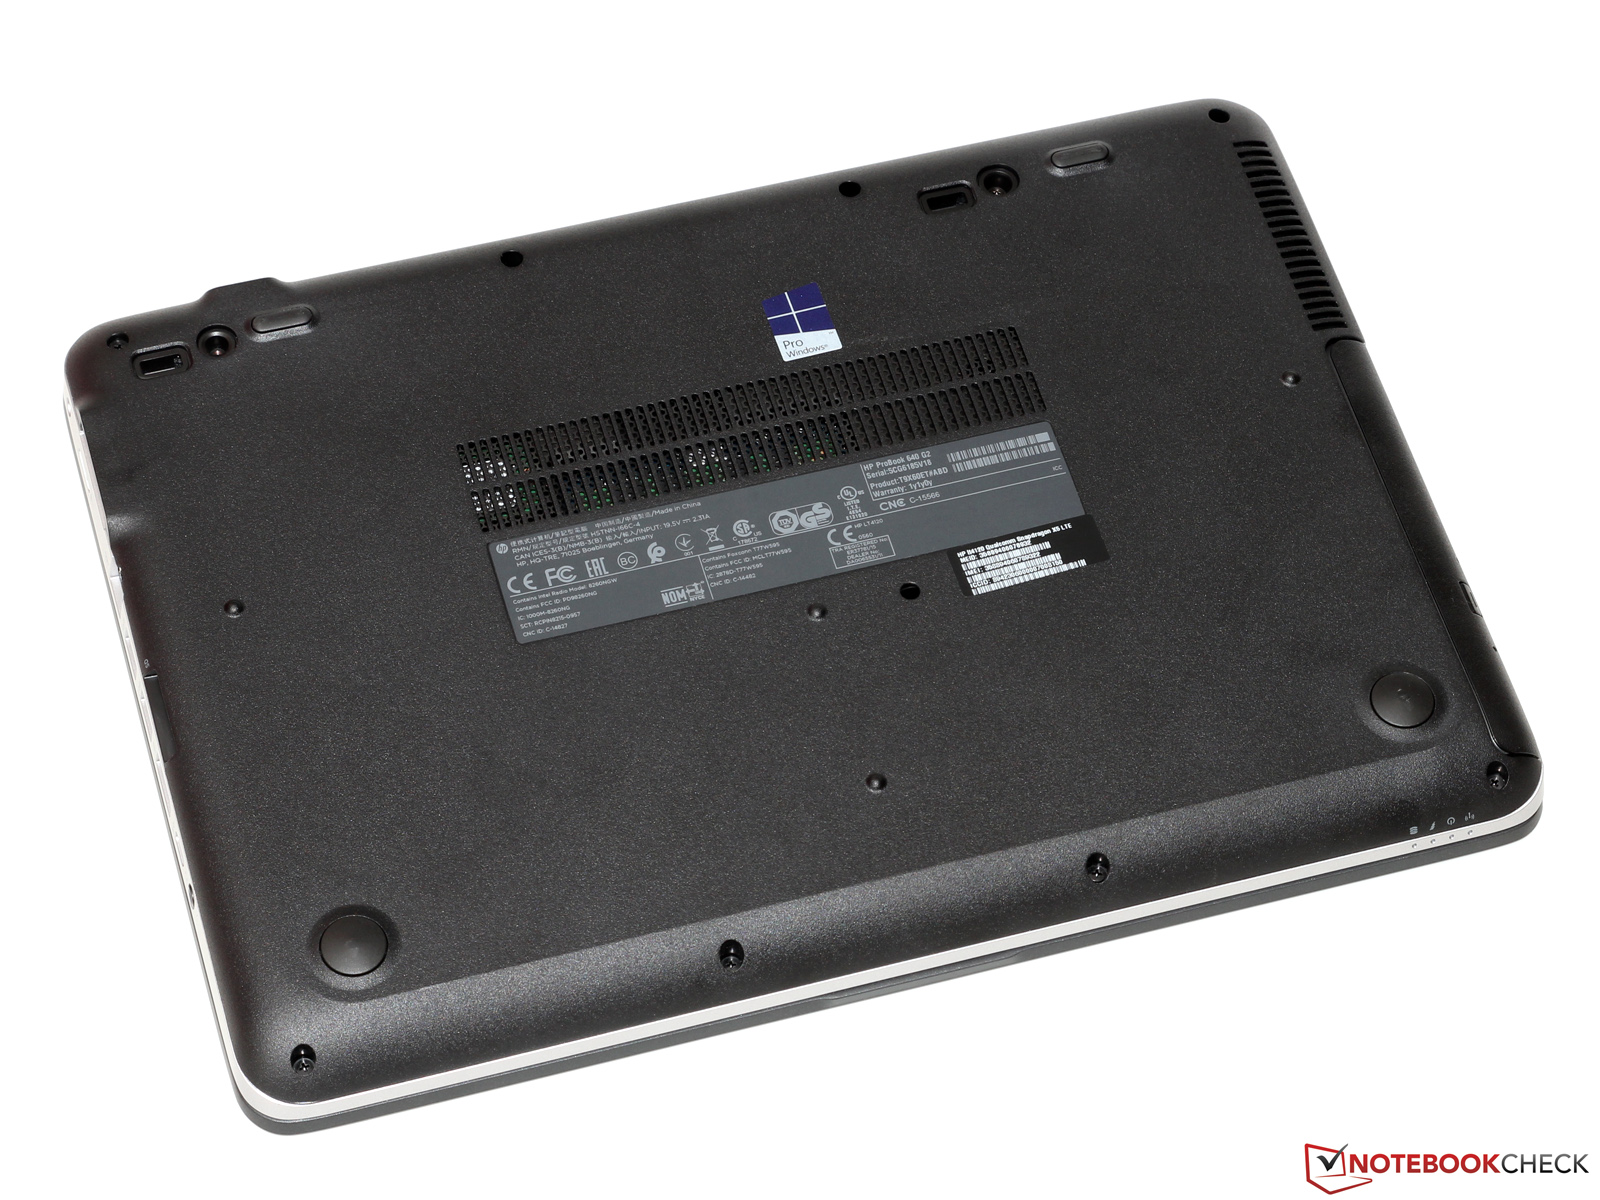
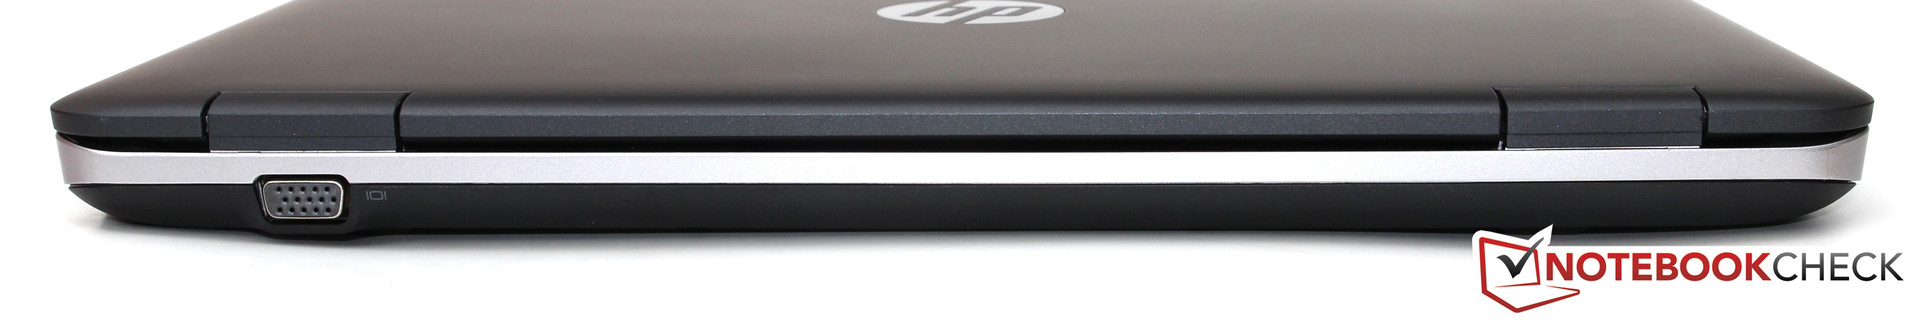
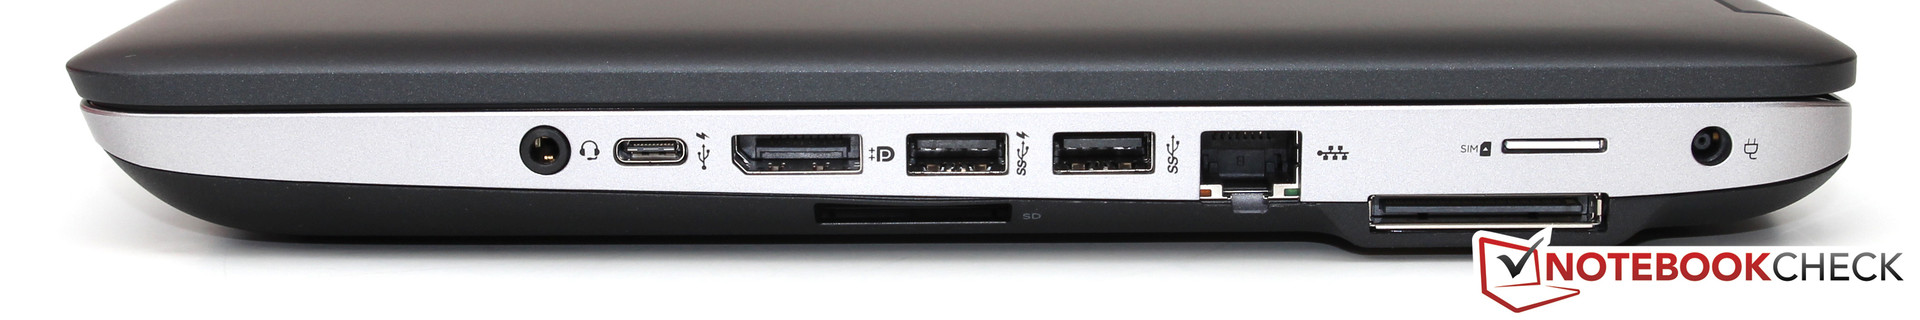
尽管相比ProBook 640 G2还有更薄更雅致的办公笔记本电脑,但毫无疑问惠普在其他的方面都赋予了这台14寸设备优秀的品质。只有不多的几个竞争对手提供了光驱和VGA接口。不过,这也为它增加了额外的重量。相对的,ProBook也带来了无可挑剔的键盘、高应用程序性能以及长电池续航作为回报。生产商也应该为搭配了内置LTE模组和低发热得到我们的掌声。
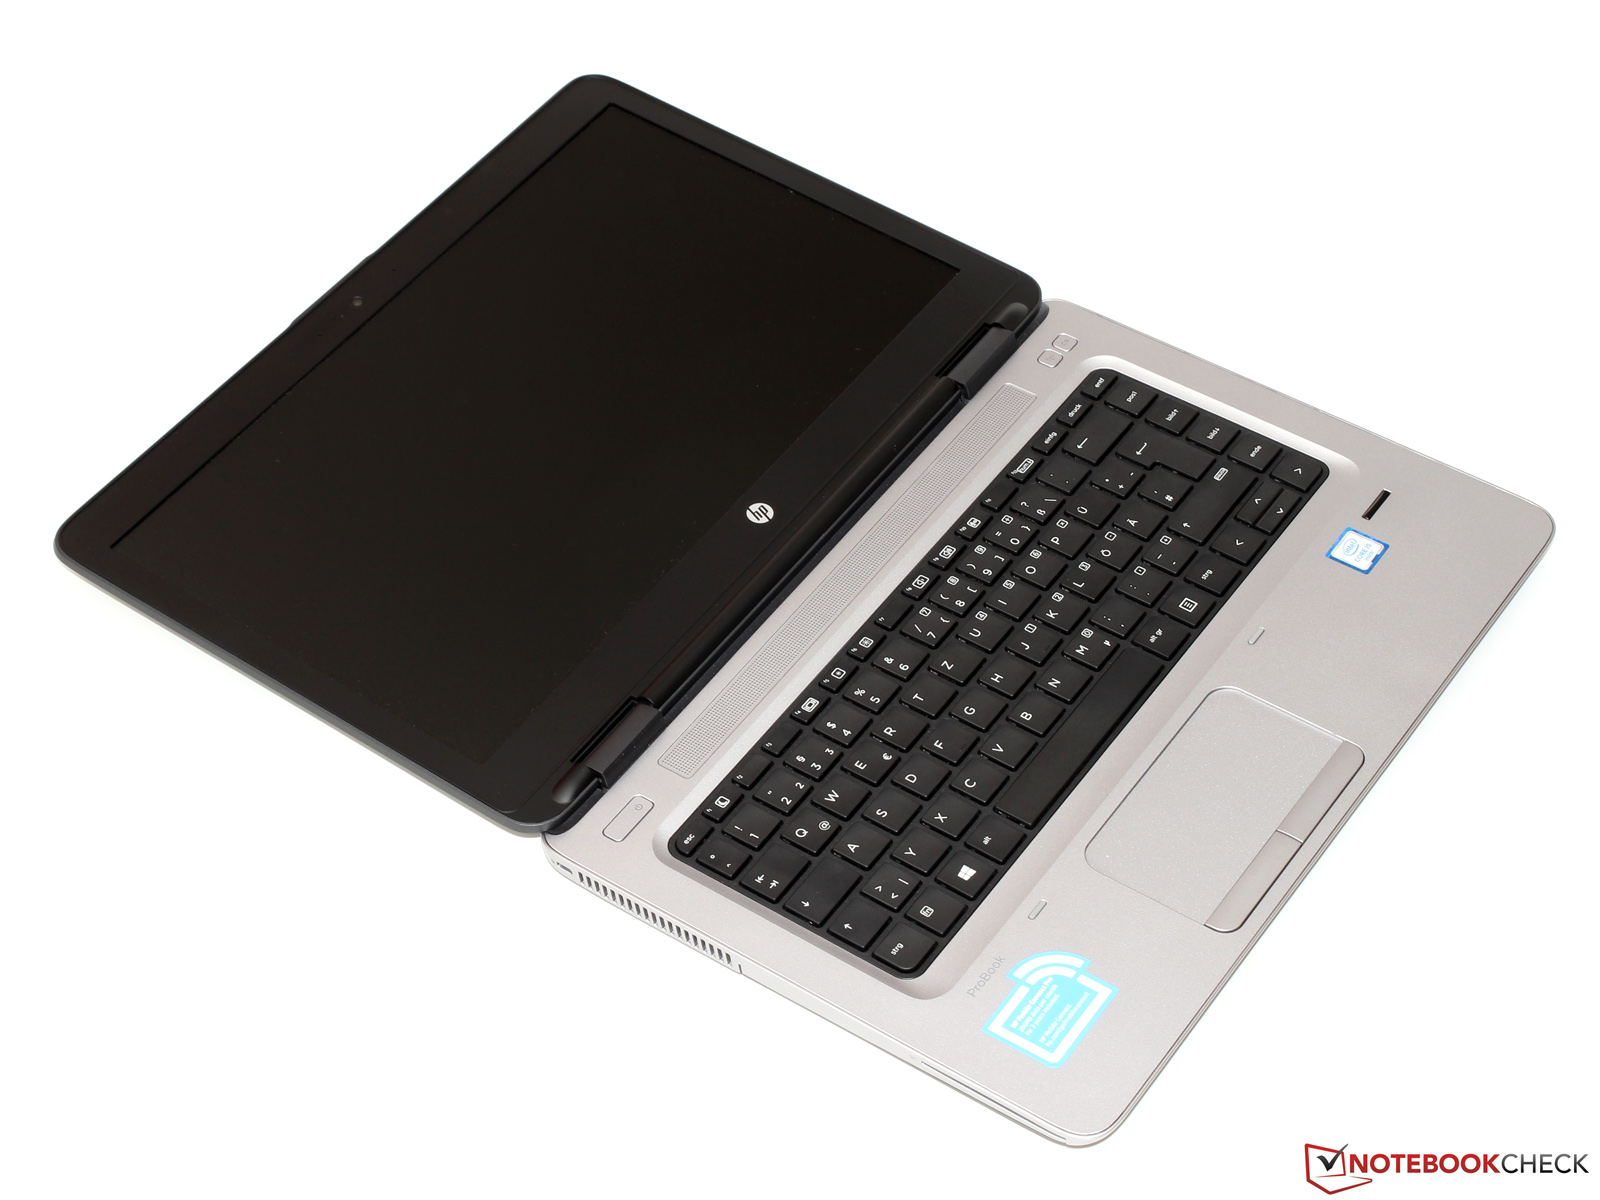
遗憾的是,一些在细节上的缺点影响了之前提到的优秀整体表现。我们不太喜欢它不够合理的借口布局,吵闹的风扇,以及可视角度极窄的TN屏幕。
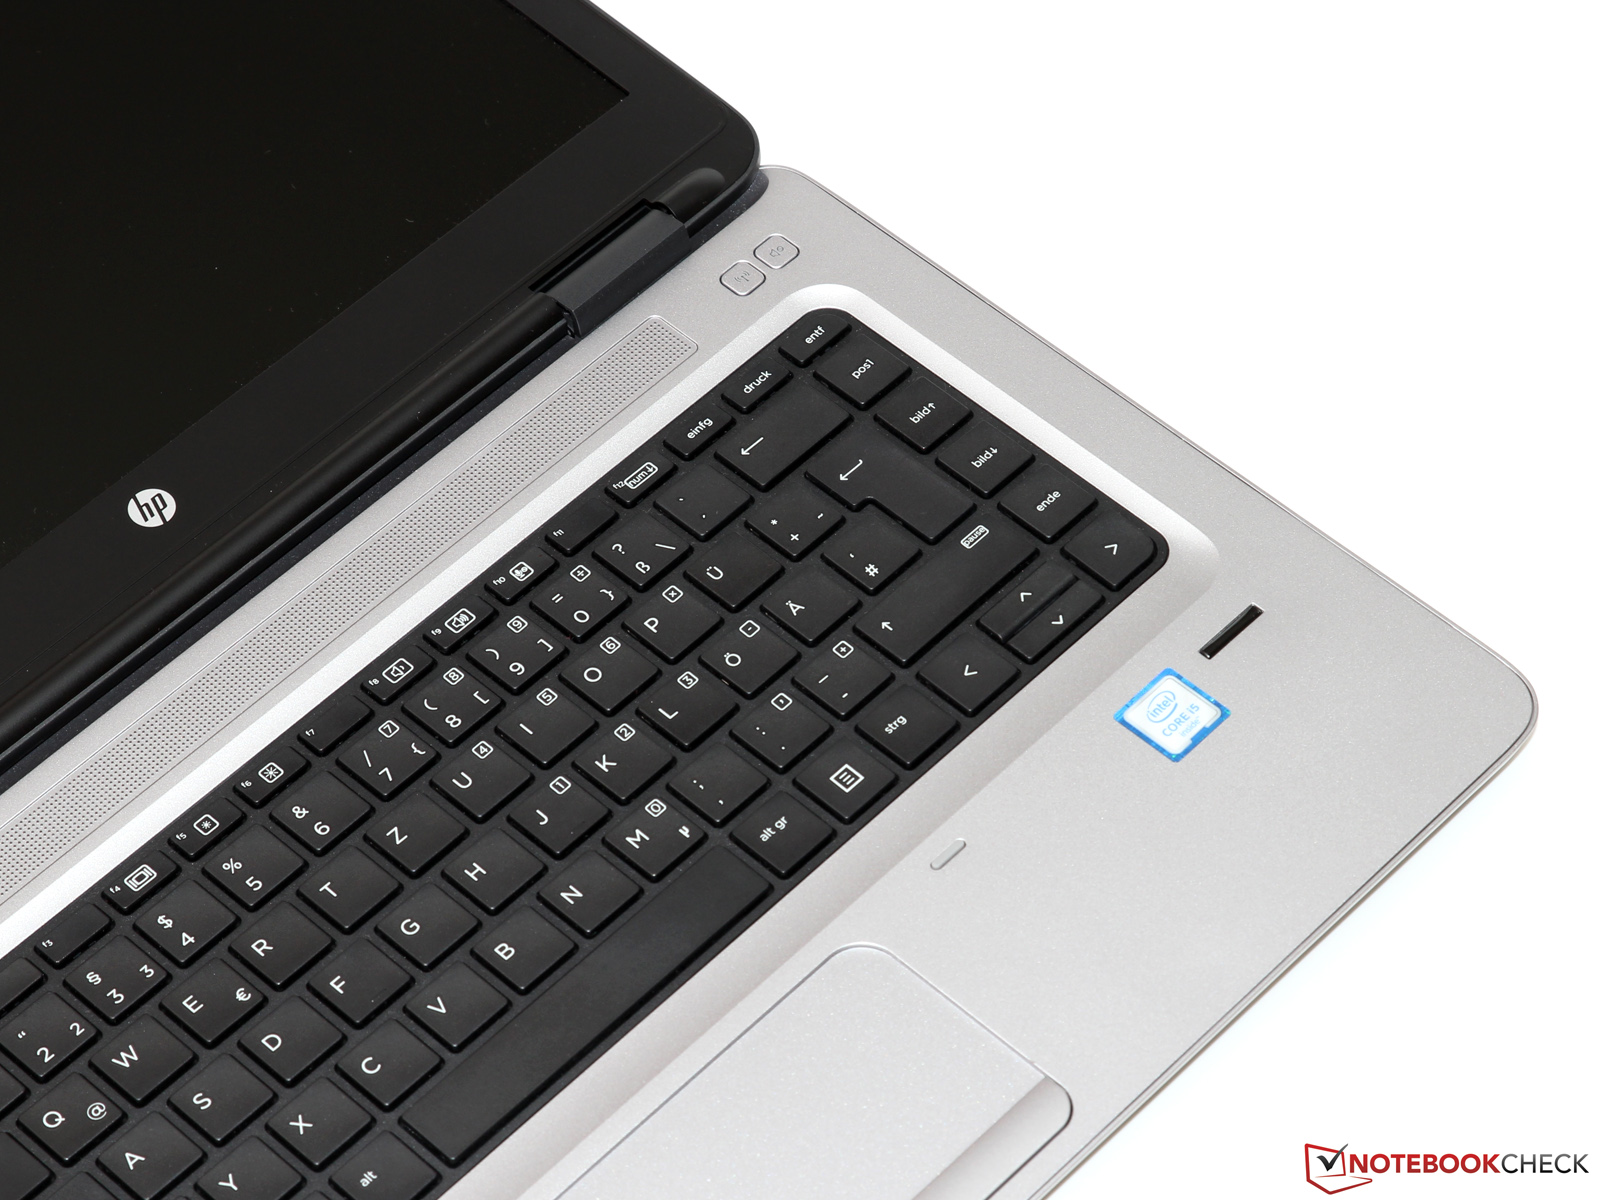
特别是后者,考虑到四位数的价码让人十分难以接受,而且其他的竞争对手大都提供了高品质的IPS屏幕(至少是可选升级)。很高的屏幕亮度对此也只能略作弥补。对这个缺点不太在意的消费者依然可以考虑这台设备,同样来自戴尔,联想或东芝的笔记本电脑也都不是完美无缺。
可以接受可视角度范围很窄的屏幕,笨重的机身的用户可以ProBook 640 G2这款十分全面的办公笔记本电脑。在竞争中它表现不俗,同时还有搭配光驱这个独特卖点。
注:本文是基于完整评测的缩减版本,阅读完整的英文评测,请点击这里。
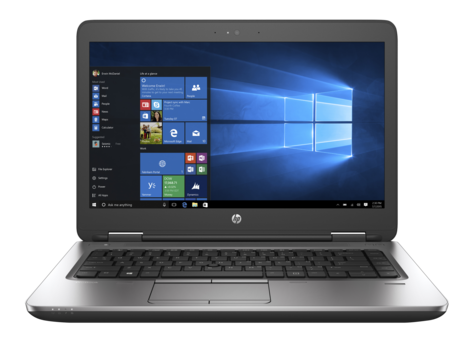
HP ProBook 640 G2-T9X60ET
- 08/09/2016 v5.1 (old)
Till Schönborn