结论 - 速度最快的 RTX 5090 笔记本之一
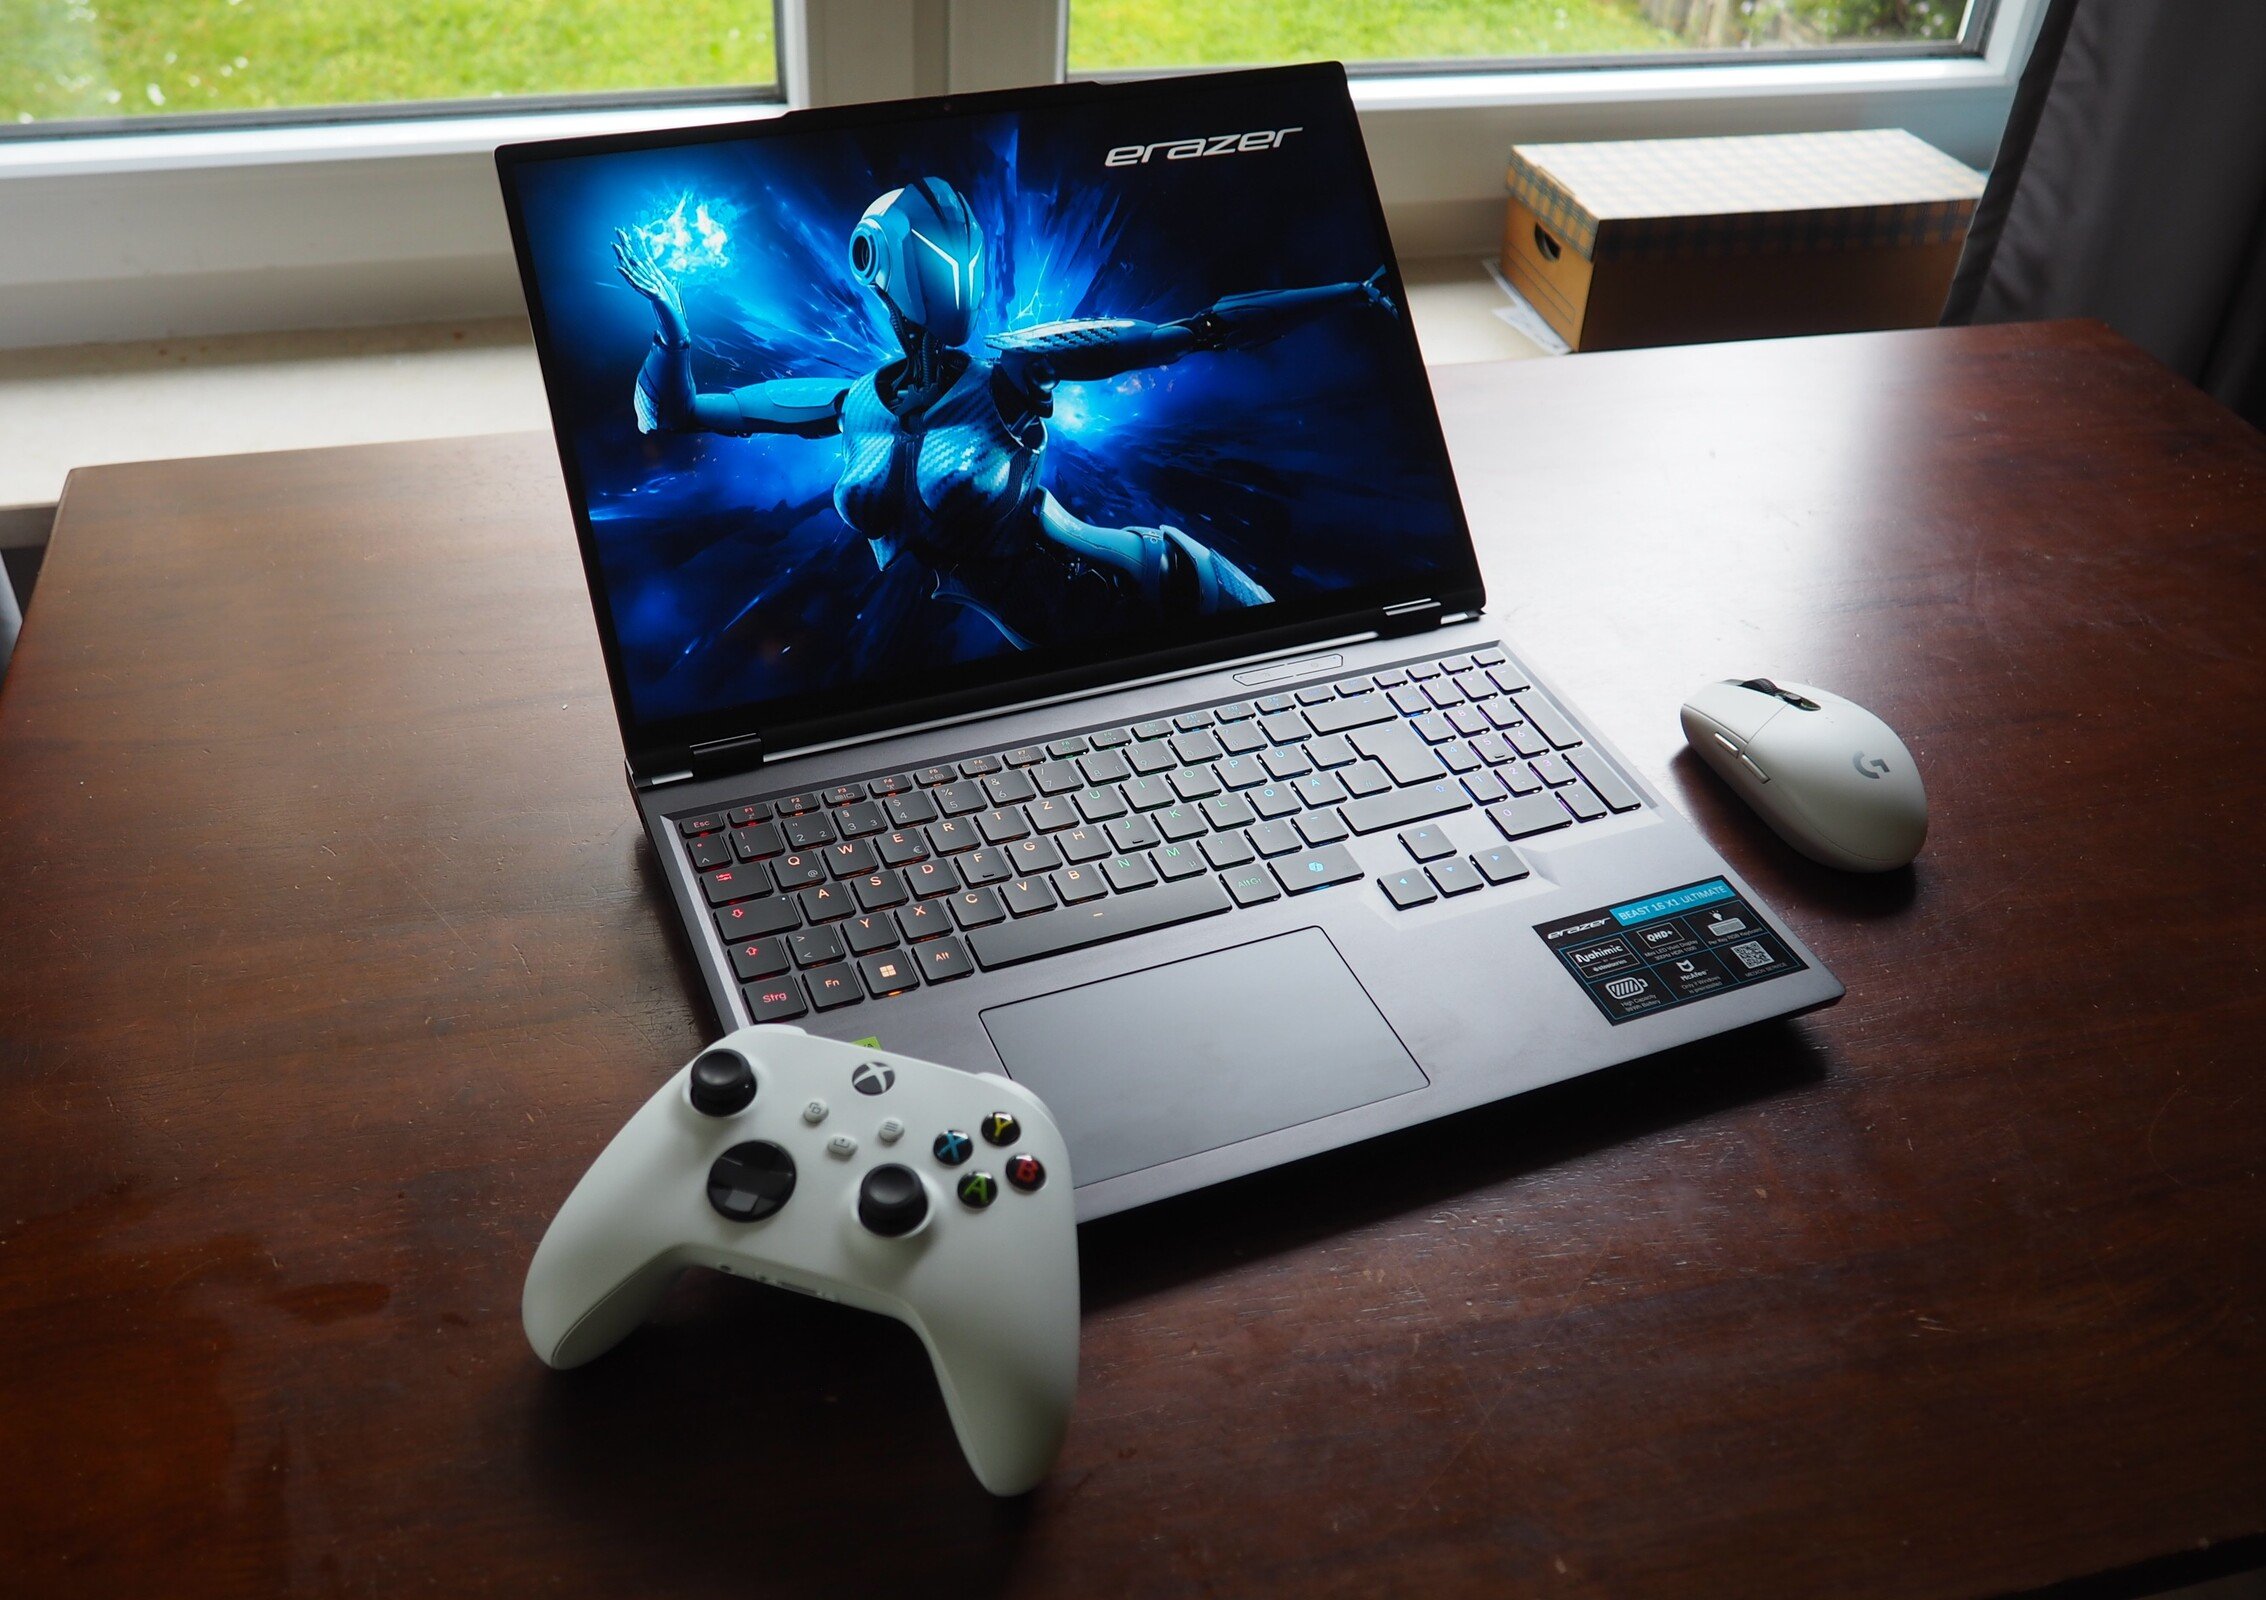
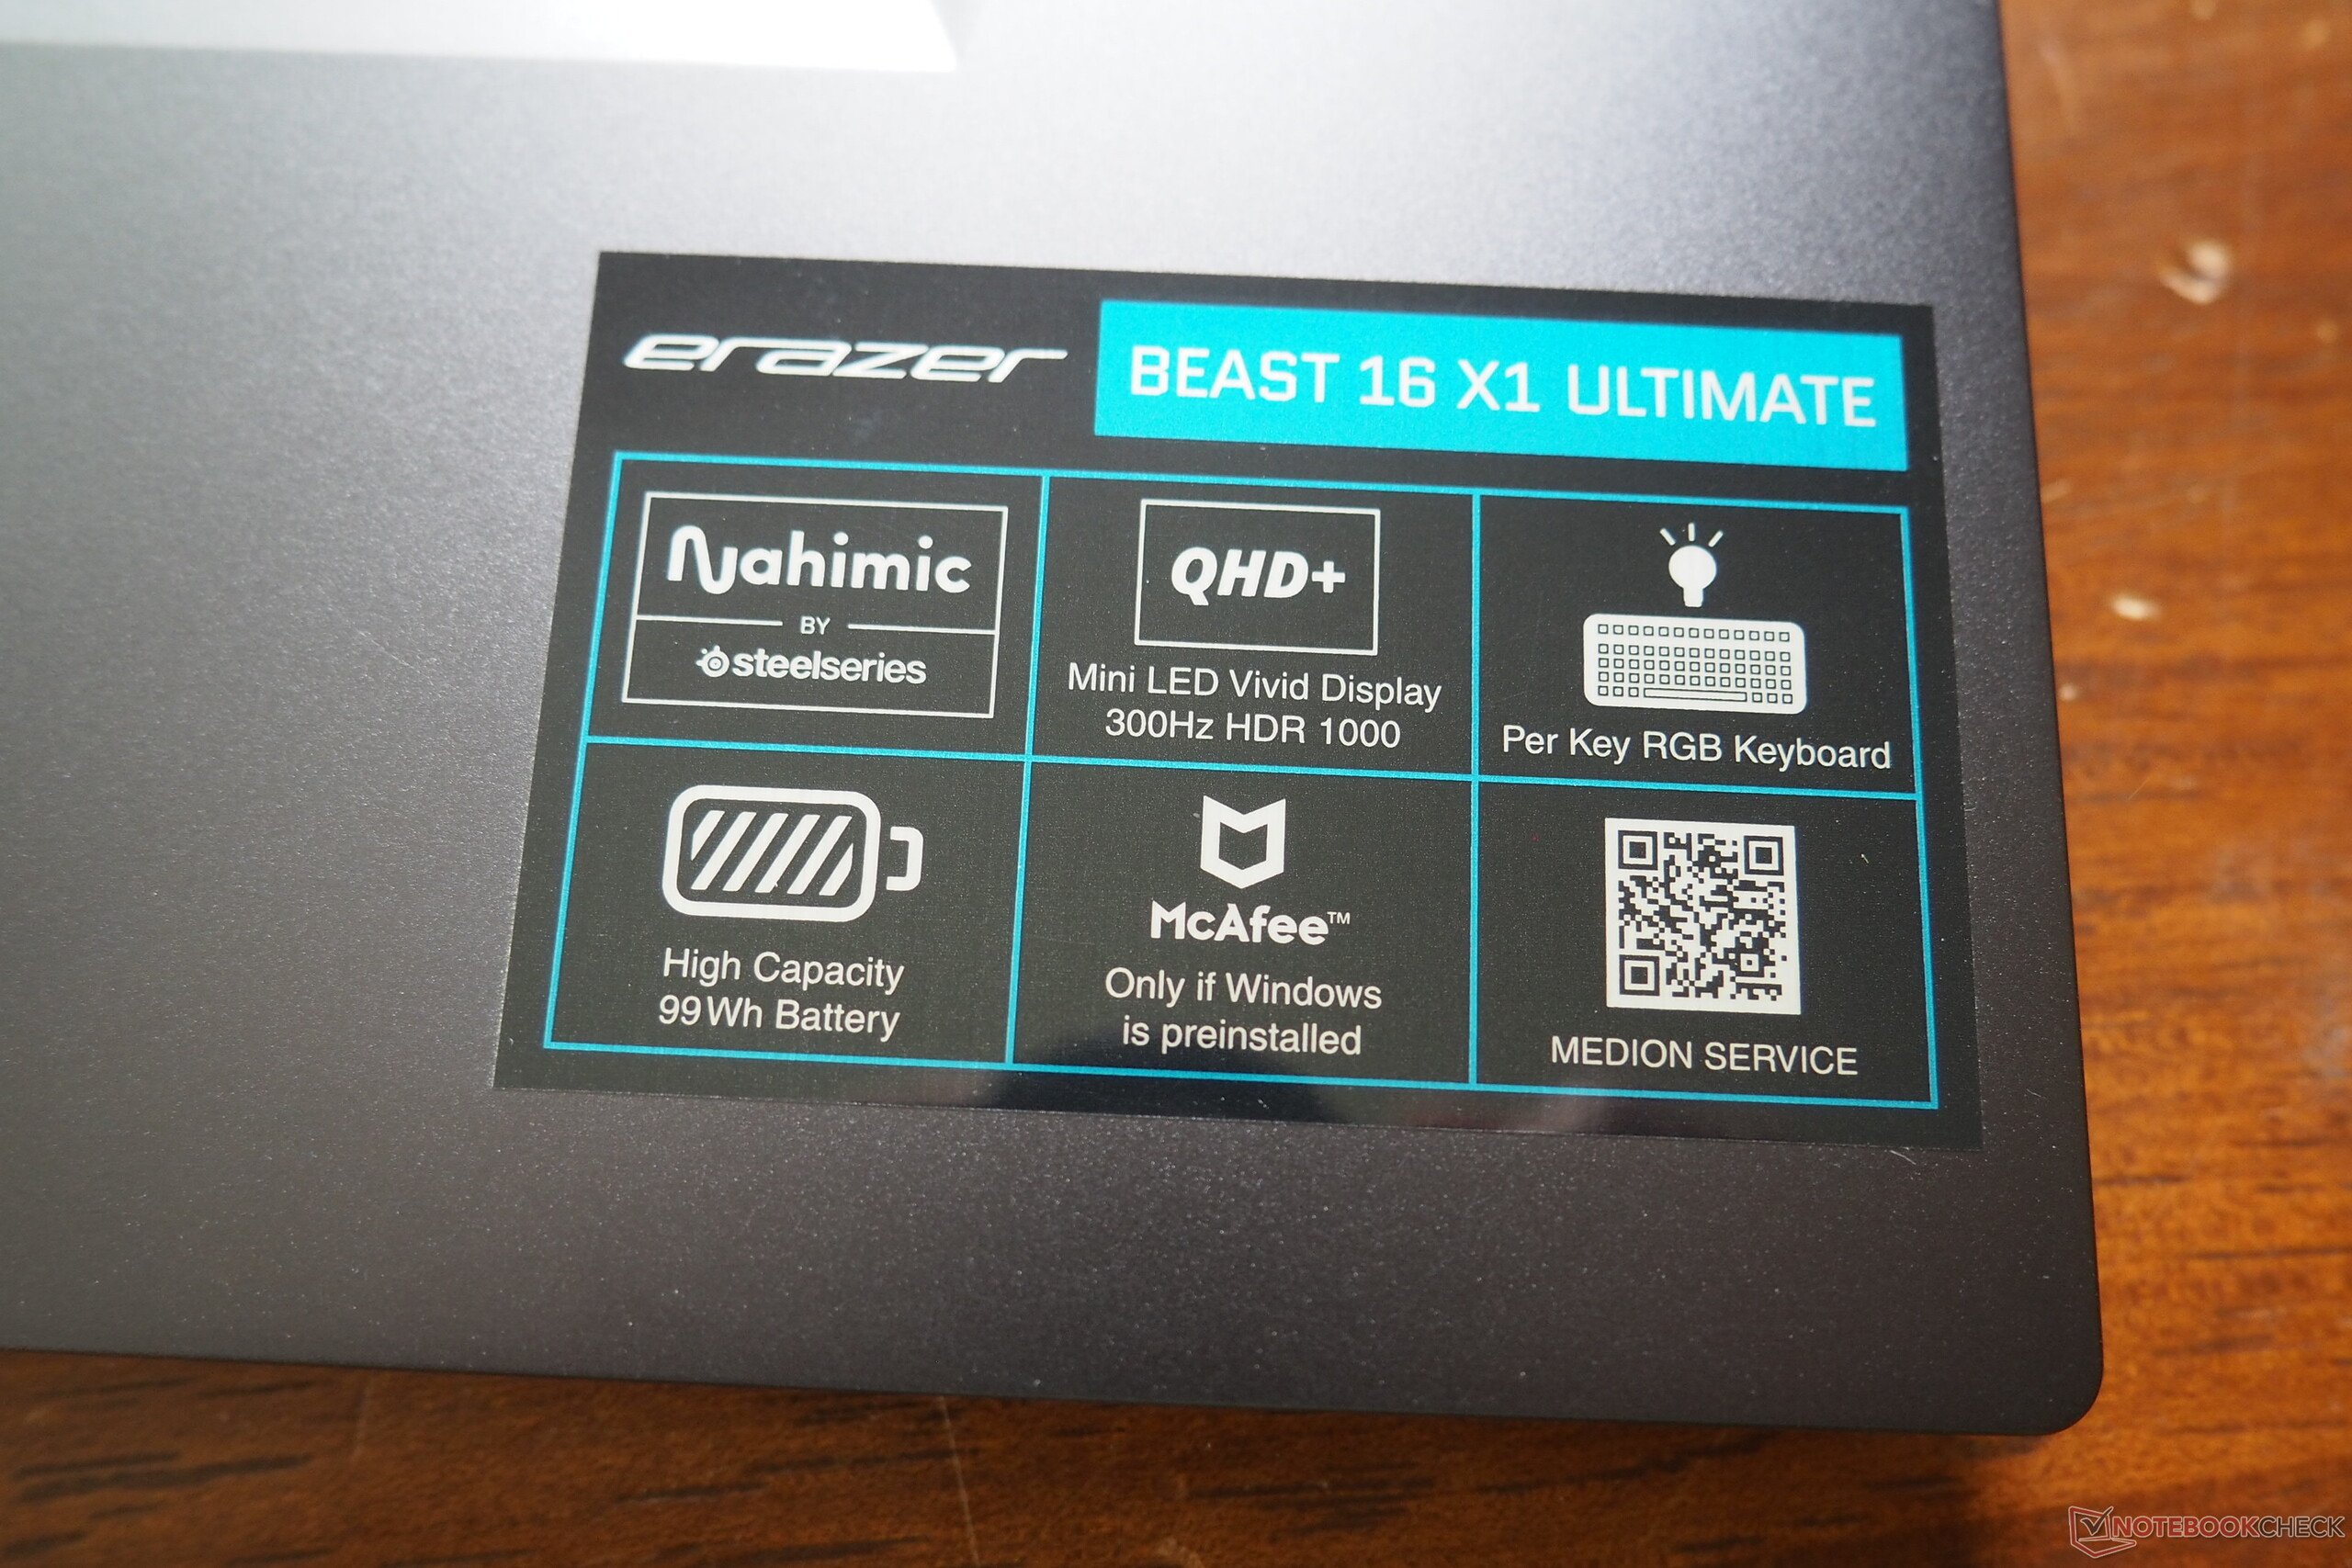
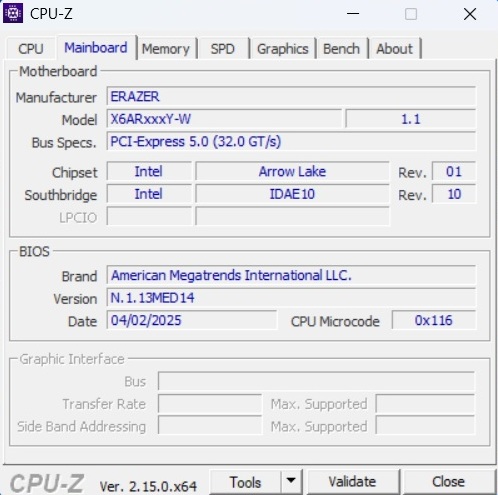
Medion Erazer Beast 16 X1 当然不便宜:在测试时,要购买配备 Core Ultra 9 275HX、GeForce RTX 5090、32 GB 内存和 2 TB SSD 的顶级版本 MD62732,您必须在桌面上放上 4000 多欧元(约合 4539 美元)。我们将在本文中分析与 RTX 5080 设备相比,这笔附加费用是否值得。总而言之,这款 16 英寸笔记本电脑获得了 "非常好 "的评价,这归功于它的性能、显示屏和外壳。16:10 格式(2,560 x 1,600 像素,300 Hz)的迷你 LED 面板凭借其高亮度、丰富的对比度和宽色域获得了不少分数,这不仅会让游戏玩家满意,也会让专业用户满意。
由于采用了金属嵌件,机箱的质量很高,而且稳定性很好,给人留下了深刻印象。输入设备和连接也不错。Erazer Beast 16 X1 提供了一个 Thunderbolt 4 端口。批评的地方不多,但在测试中最让我们头疼的是在负载情况下产生的巨大噪音。遗憾的是,几乎所有游戏笔记本电脑都存在这一缺陷。
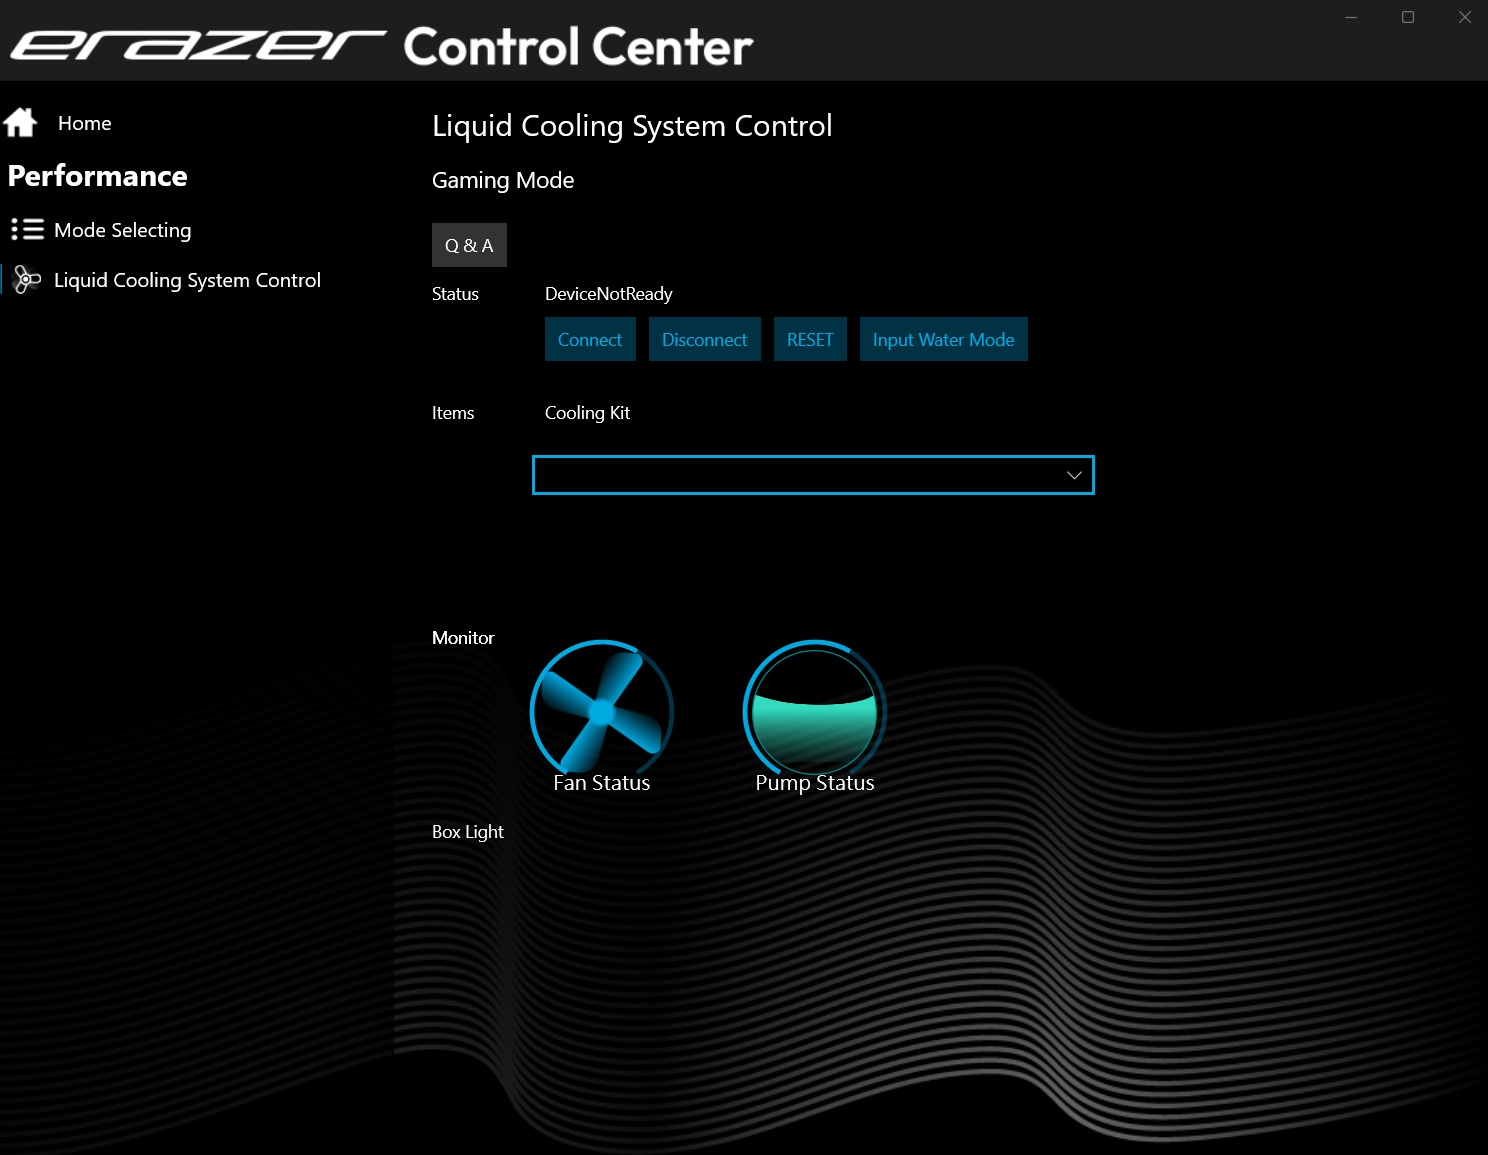
如果你想让笔记本电脑发挥更大的效能,你可以购买可选的Erazer 冷却套件 V2价格约为 250 欧元(约合 284 美元)。我们将很快发布一篇单独的文章,介绍一些合适的测量方法。
Pros
Cons
价格和供应情况
Erazer Beast 16 X1 Ultimate MD62732 在Medion 主页上的售价约为 4,300 欧元(约合人民币 4879 元)。(目前降至 4090 欧元/~4641 美元)。
例如,同样包含 RTX 5000 GPU 的 16 英寸同类产品有 惠普 Omen Max 16以及 华硕 ROG Strix Scar 16、联想 联想Legion Pro 7i 16和 华硕 ROG Strix G16都作为对比设备出现在表格中。不过,主要竞争对手是大致相同的 XMG Neo 16 E25.
规格
住房
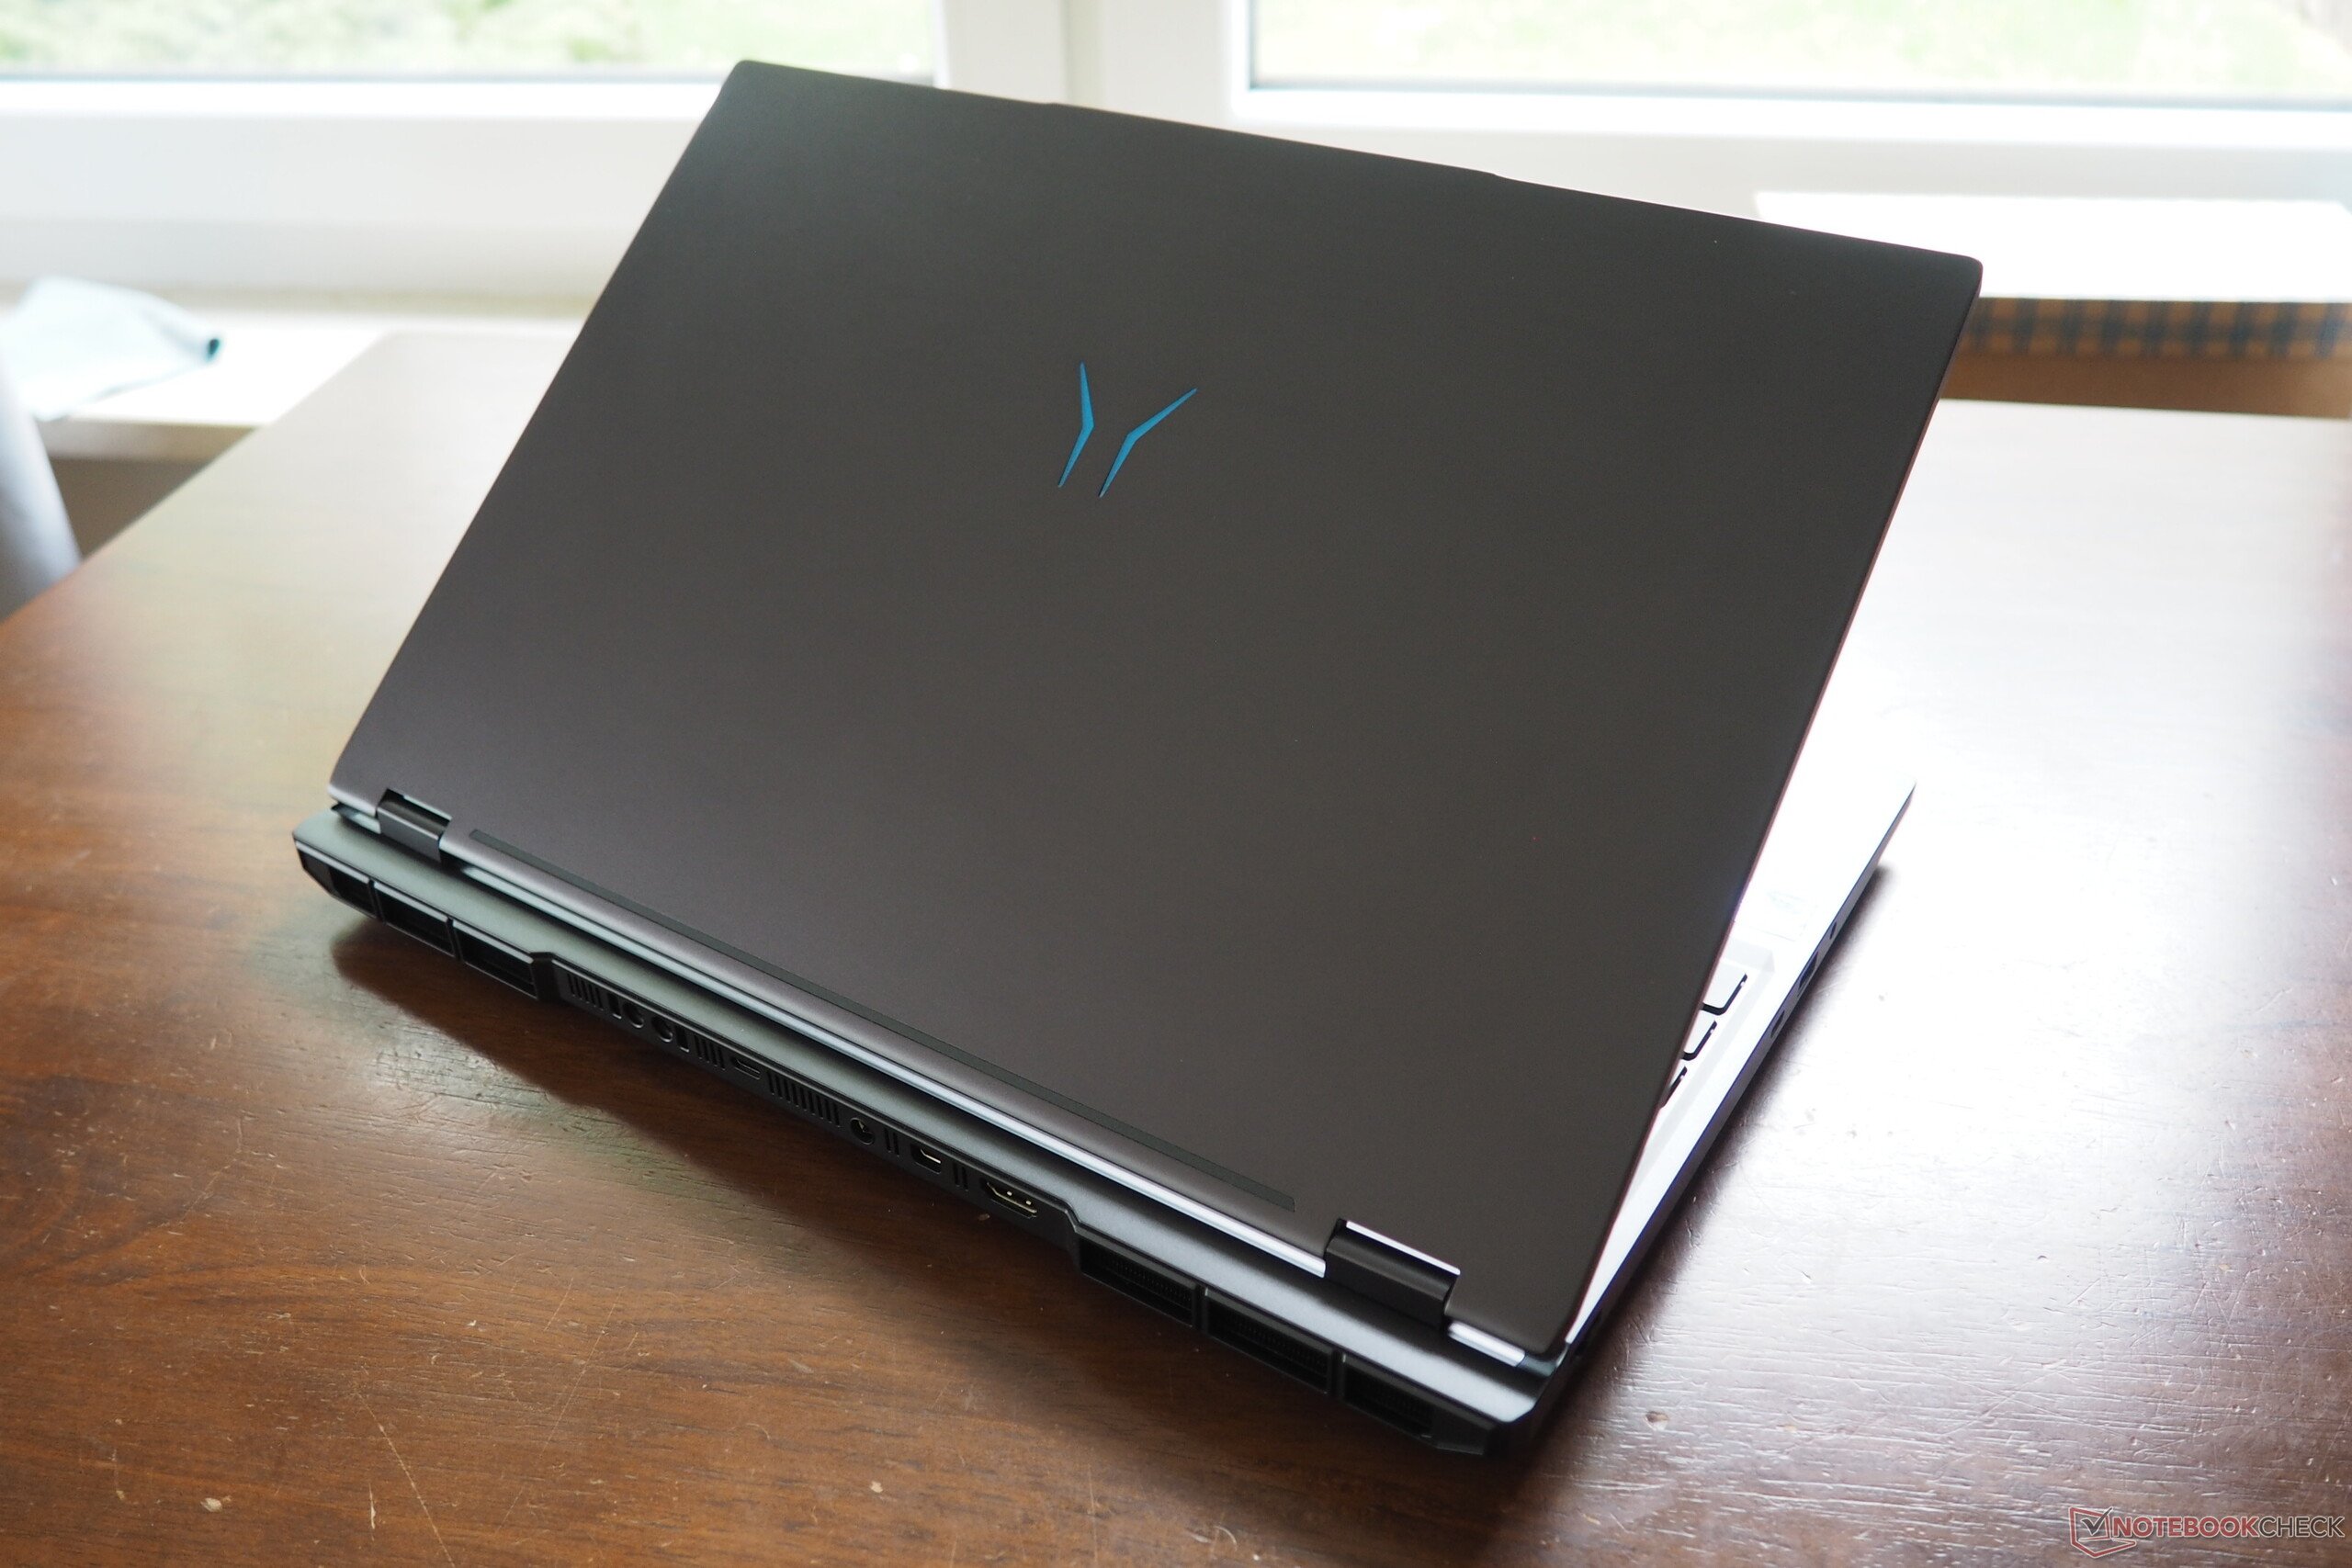
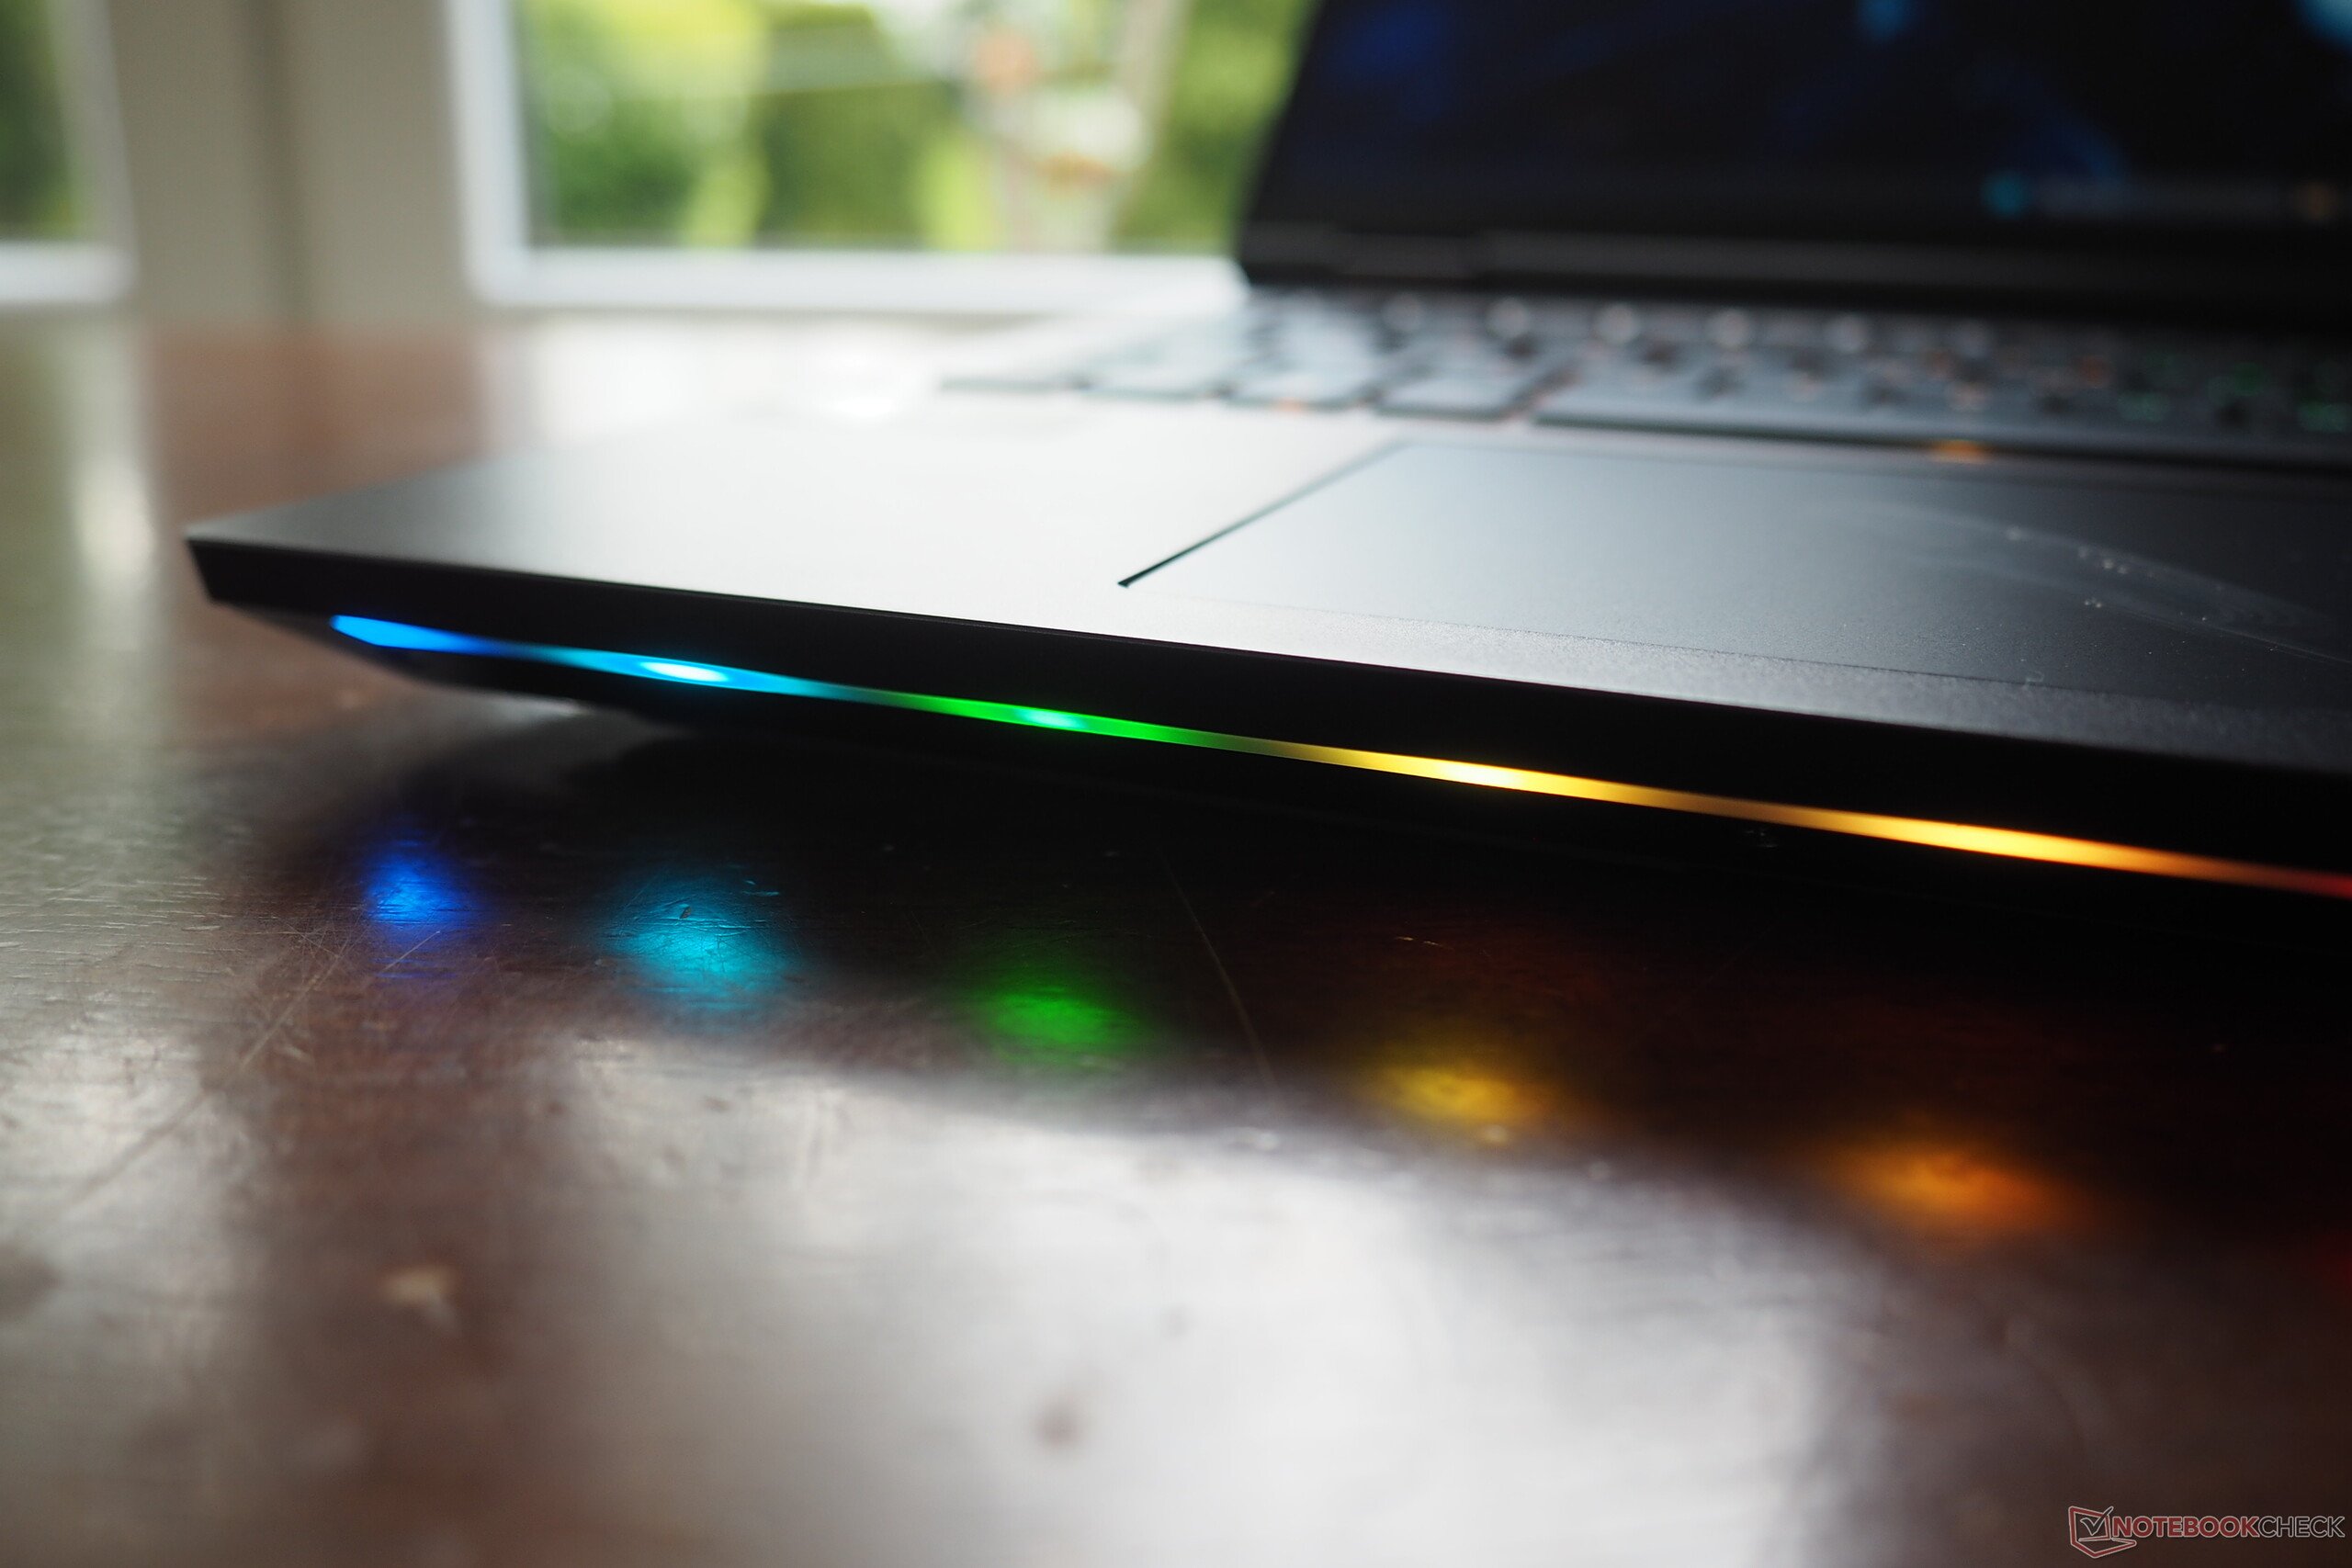
正如开头提到的,机壳给人留下了非常好的印象。Medion 选用了同方的机箱,即使在重压下也能保持良好的稳定性,整体感觉非常优雅。其形状和边缘设计将优雅和俏皮完美地结合在一起,而照明爱好者可以期待正面时尚的 LED 灯带(见照片)。2.8 千克(约 6.2 磅)的重量不轻也不重,与 Strix Scar 16 和 Omen Max 16 不相上下。3 厘米的高度也不算过高。180° 的大开合角度值得特别推崇--不是每个竞争对手都能做到这一点。


设备
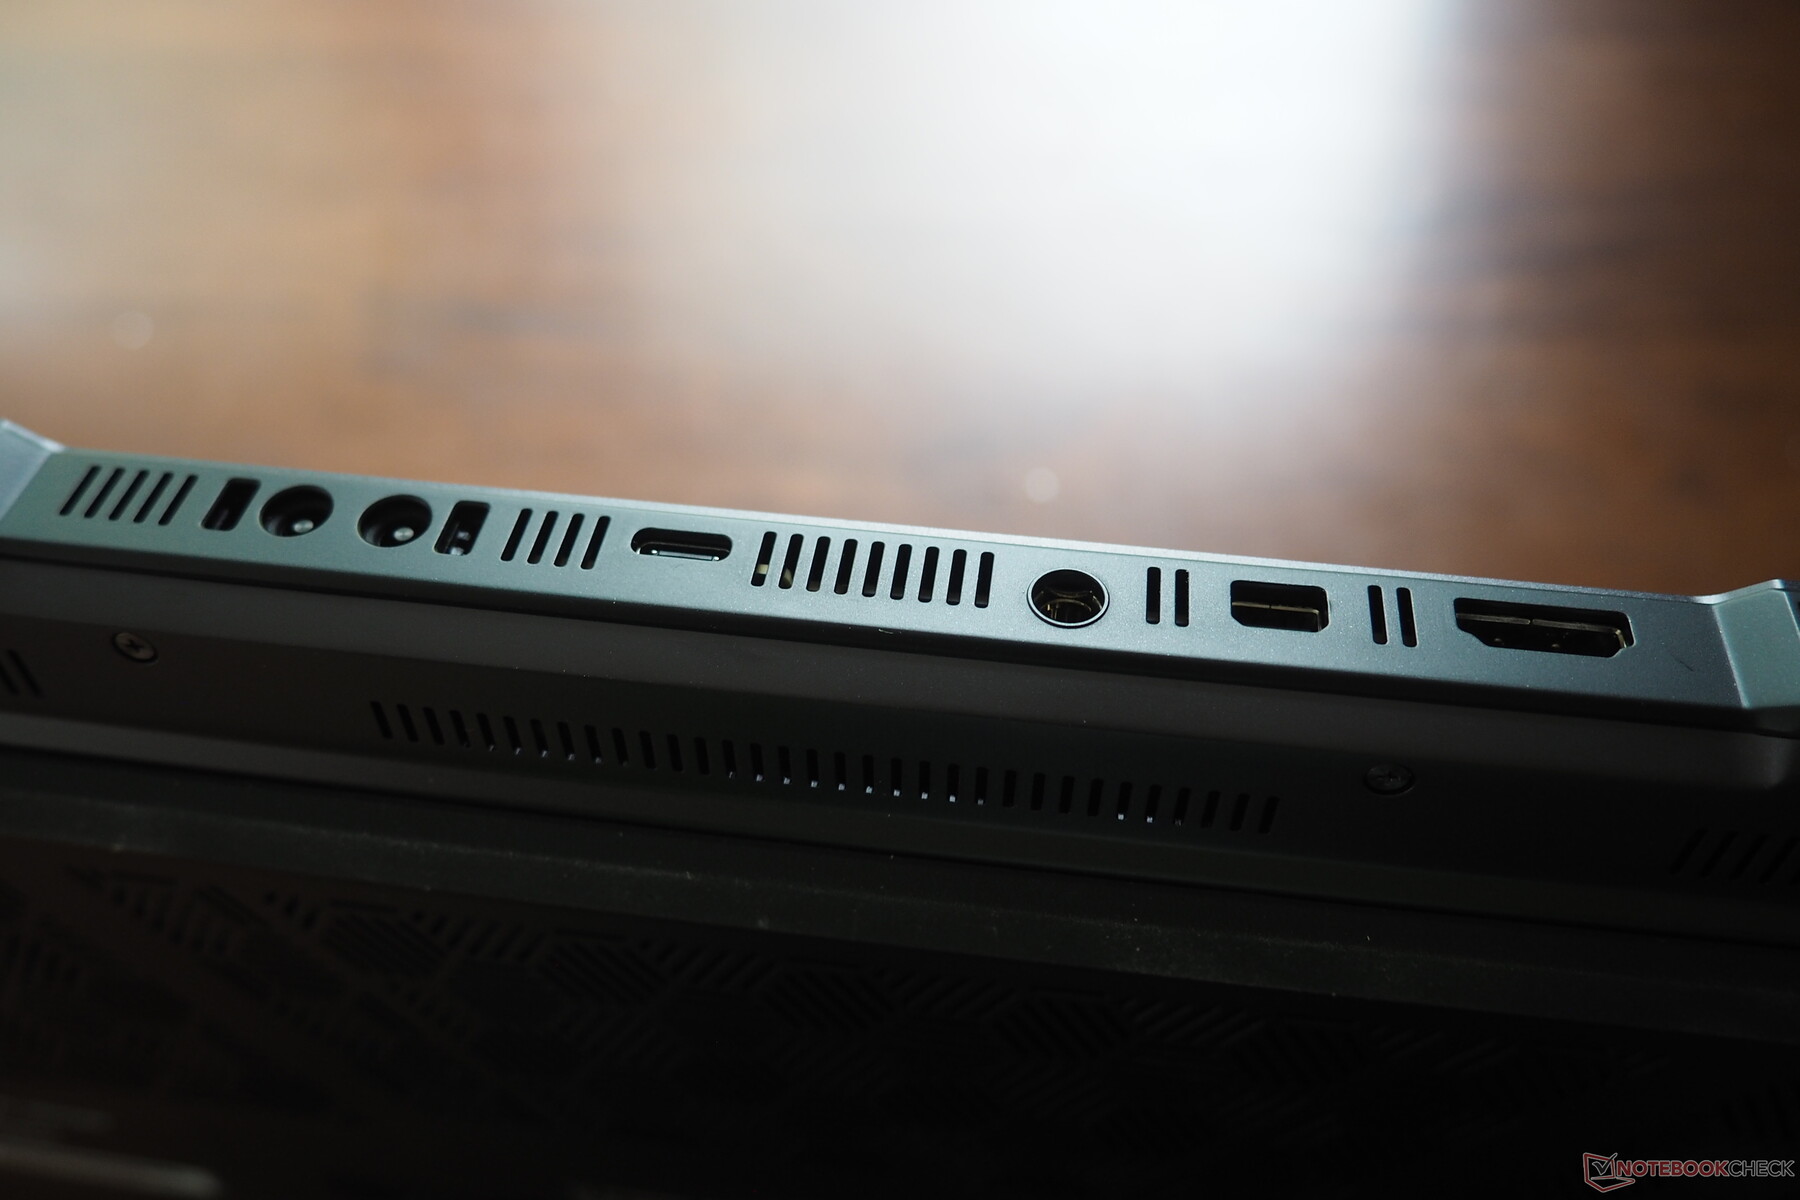
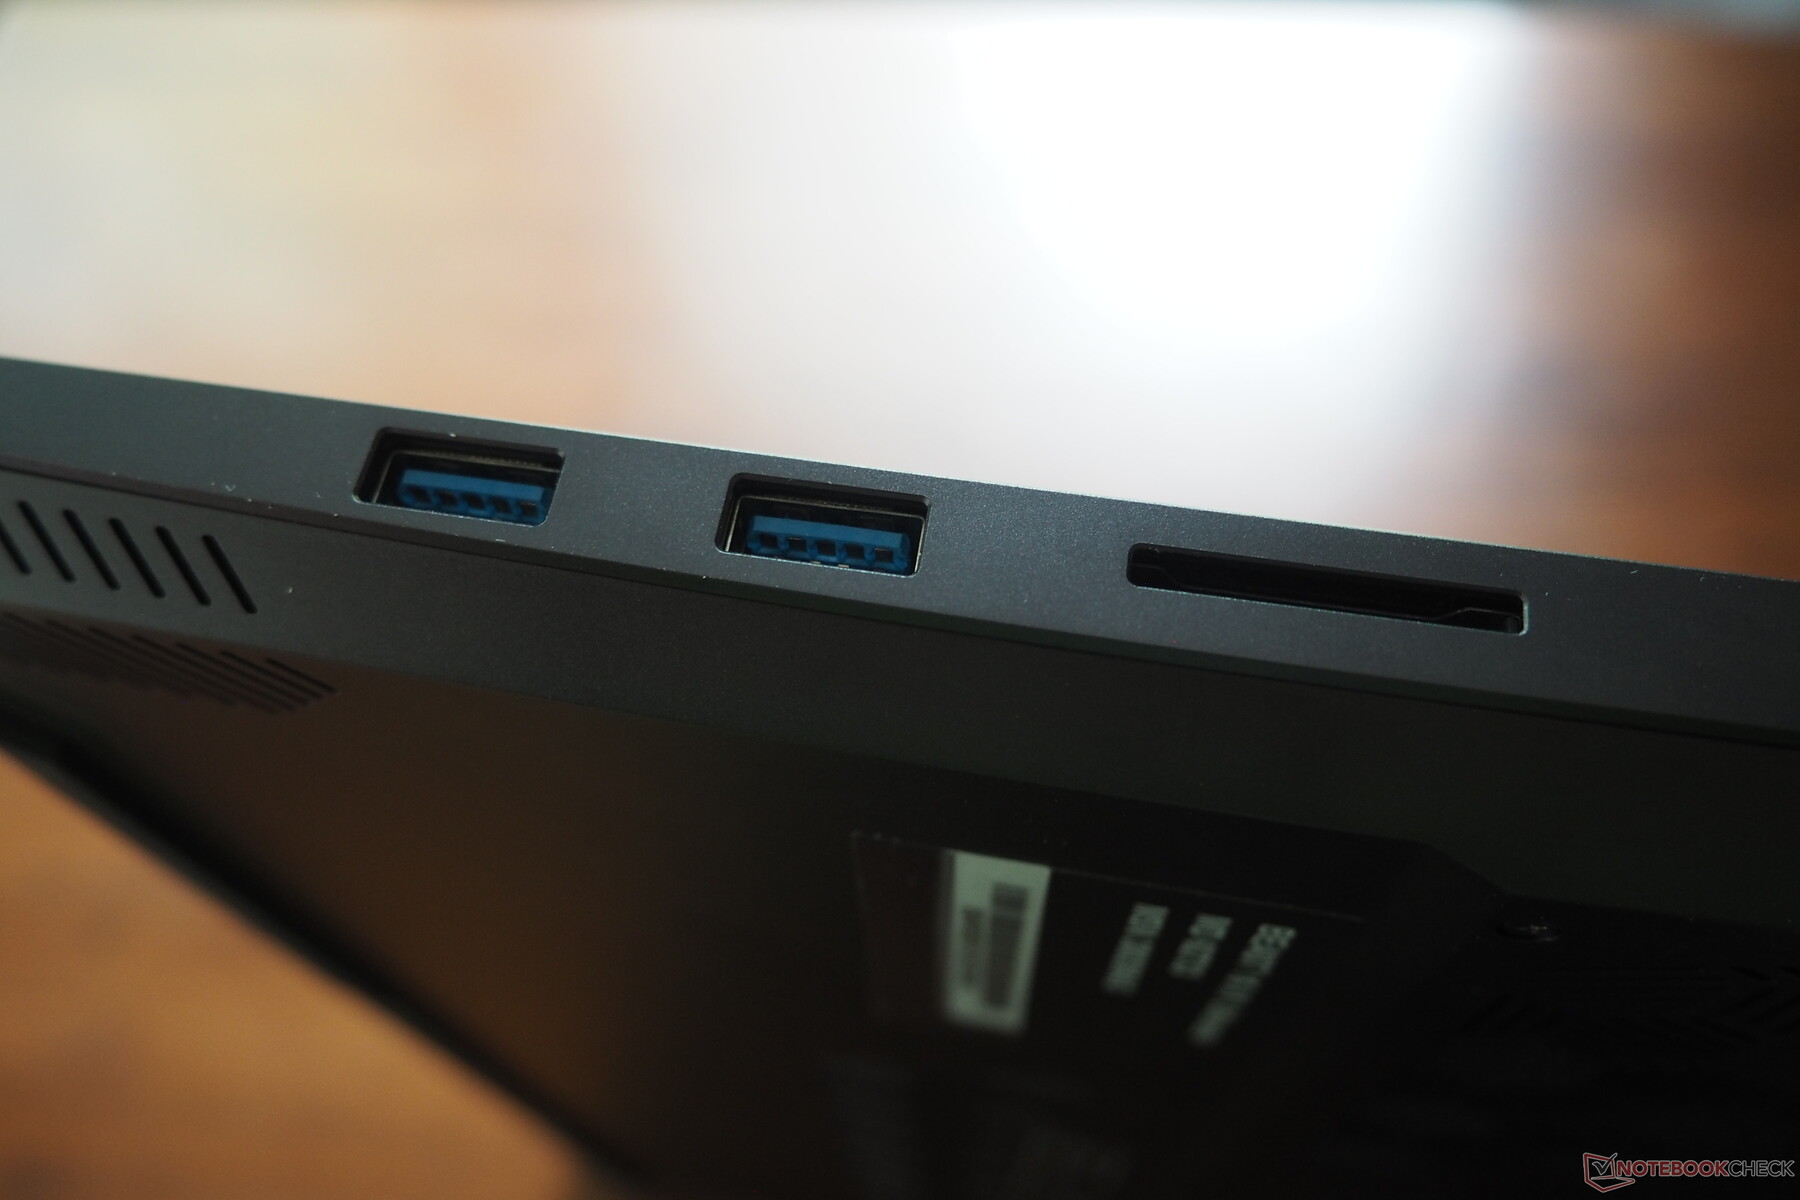
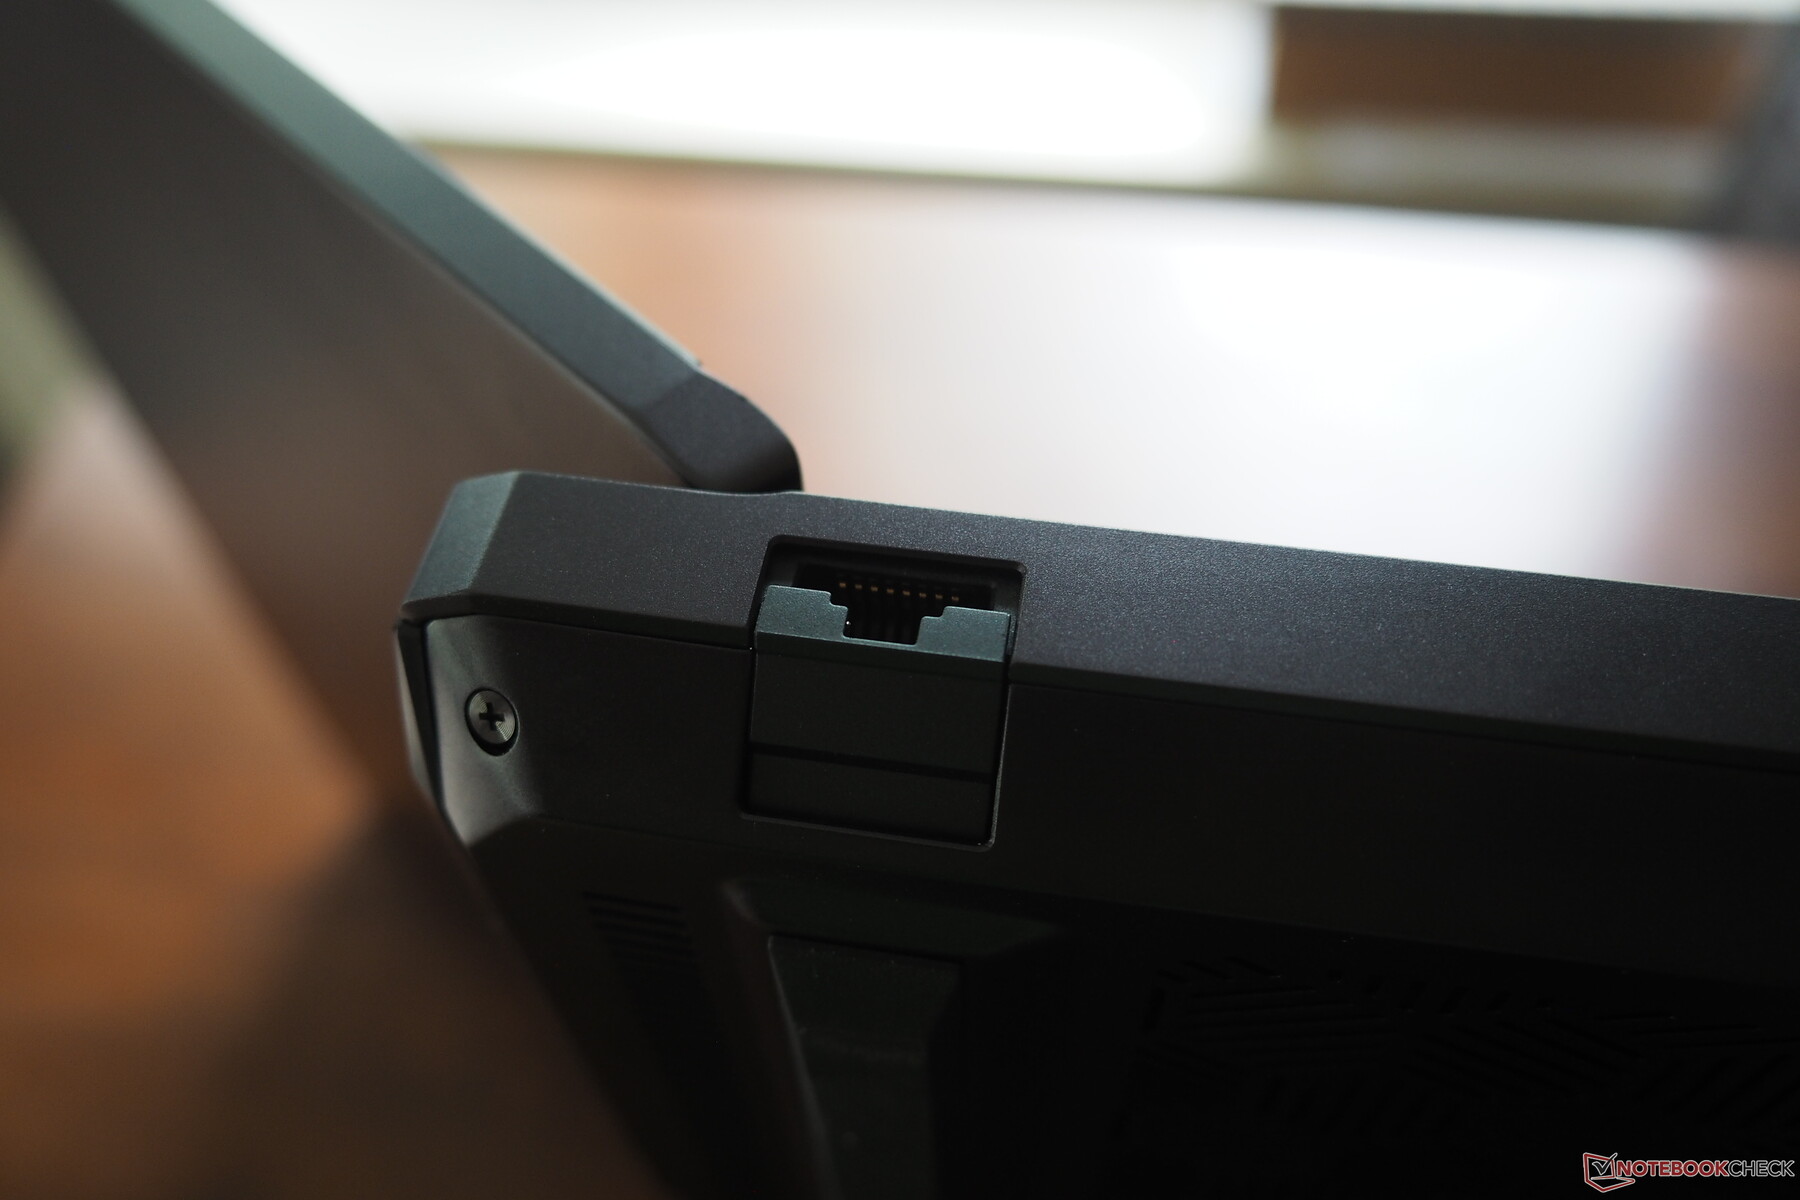
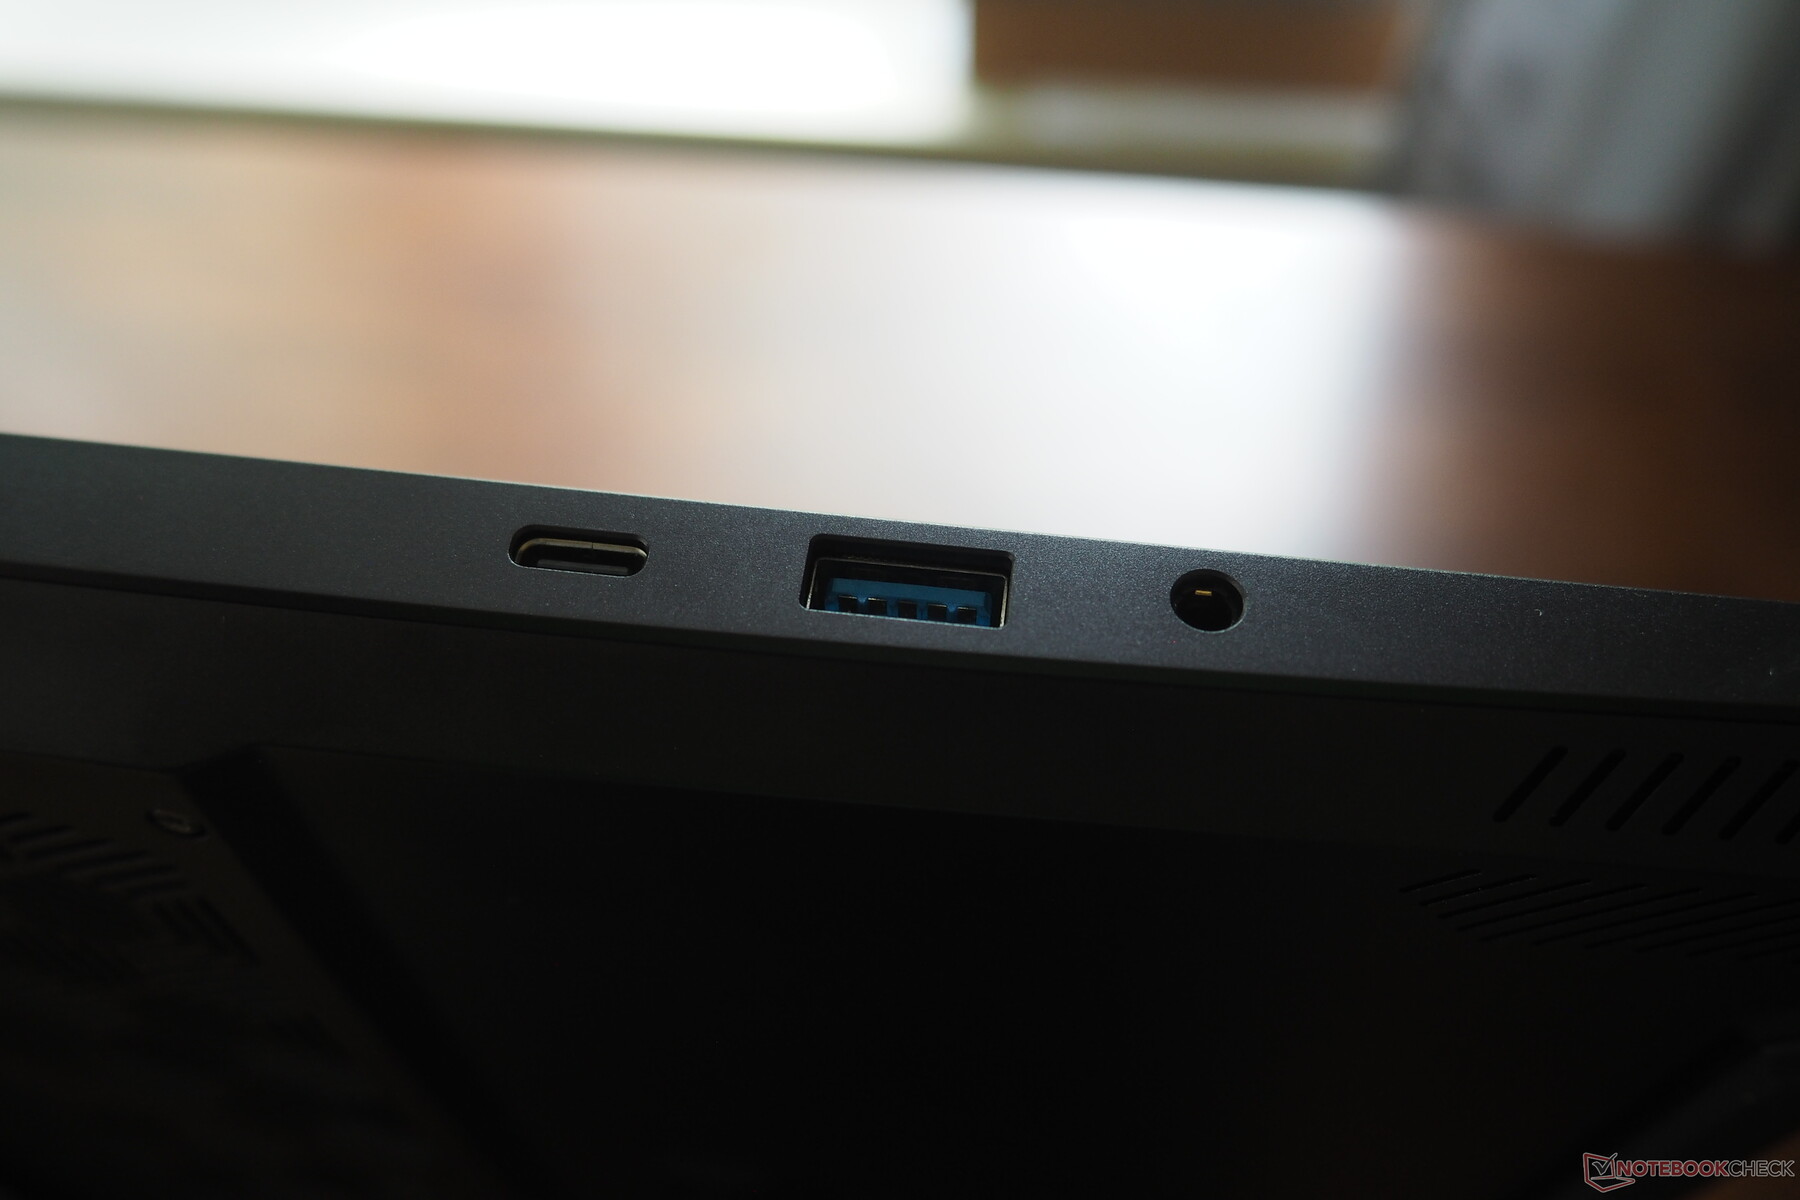
Beast 16 X1 拥有各种现代化接口。 2.5 Gbit LAN 与 HDMI 2.1、(迷你)DisplayPort 2.1a 和 Thunderbolt 4 以及一个 USB-C 3.2 Gen2 端口、两个 USB-A 3.2 Gen1 端口、一个音频插座和一个快速读卡器一样先进。外部水冷系统的输入接口也位于机身后部。无线模块的性能也无可挑剔;虽然英特尔的 AX211 芯片不支持 Wi-Fi 7,但仍能达到很高甚至非常高的速度。
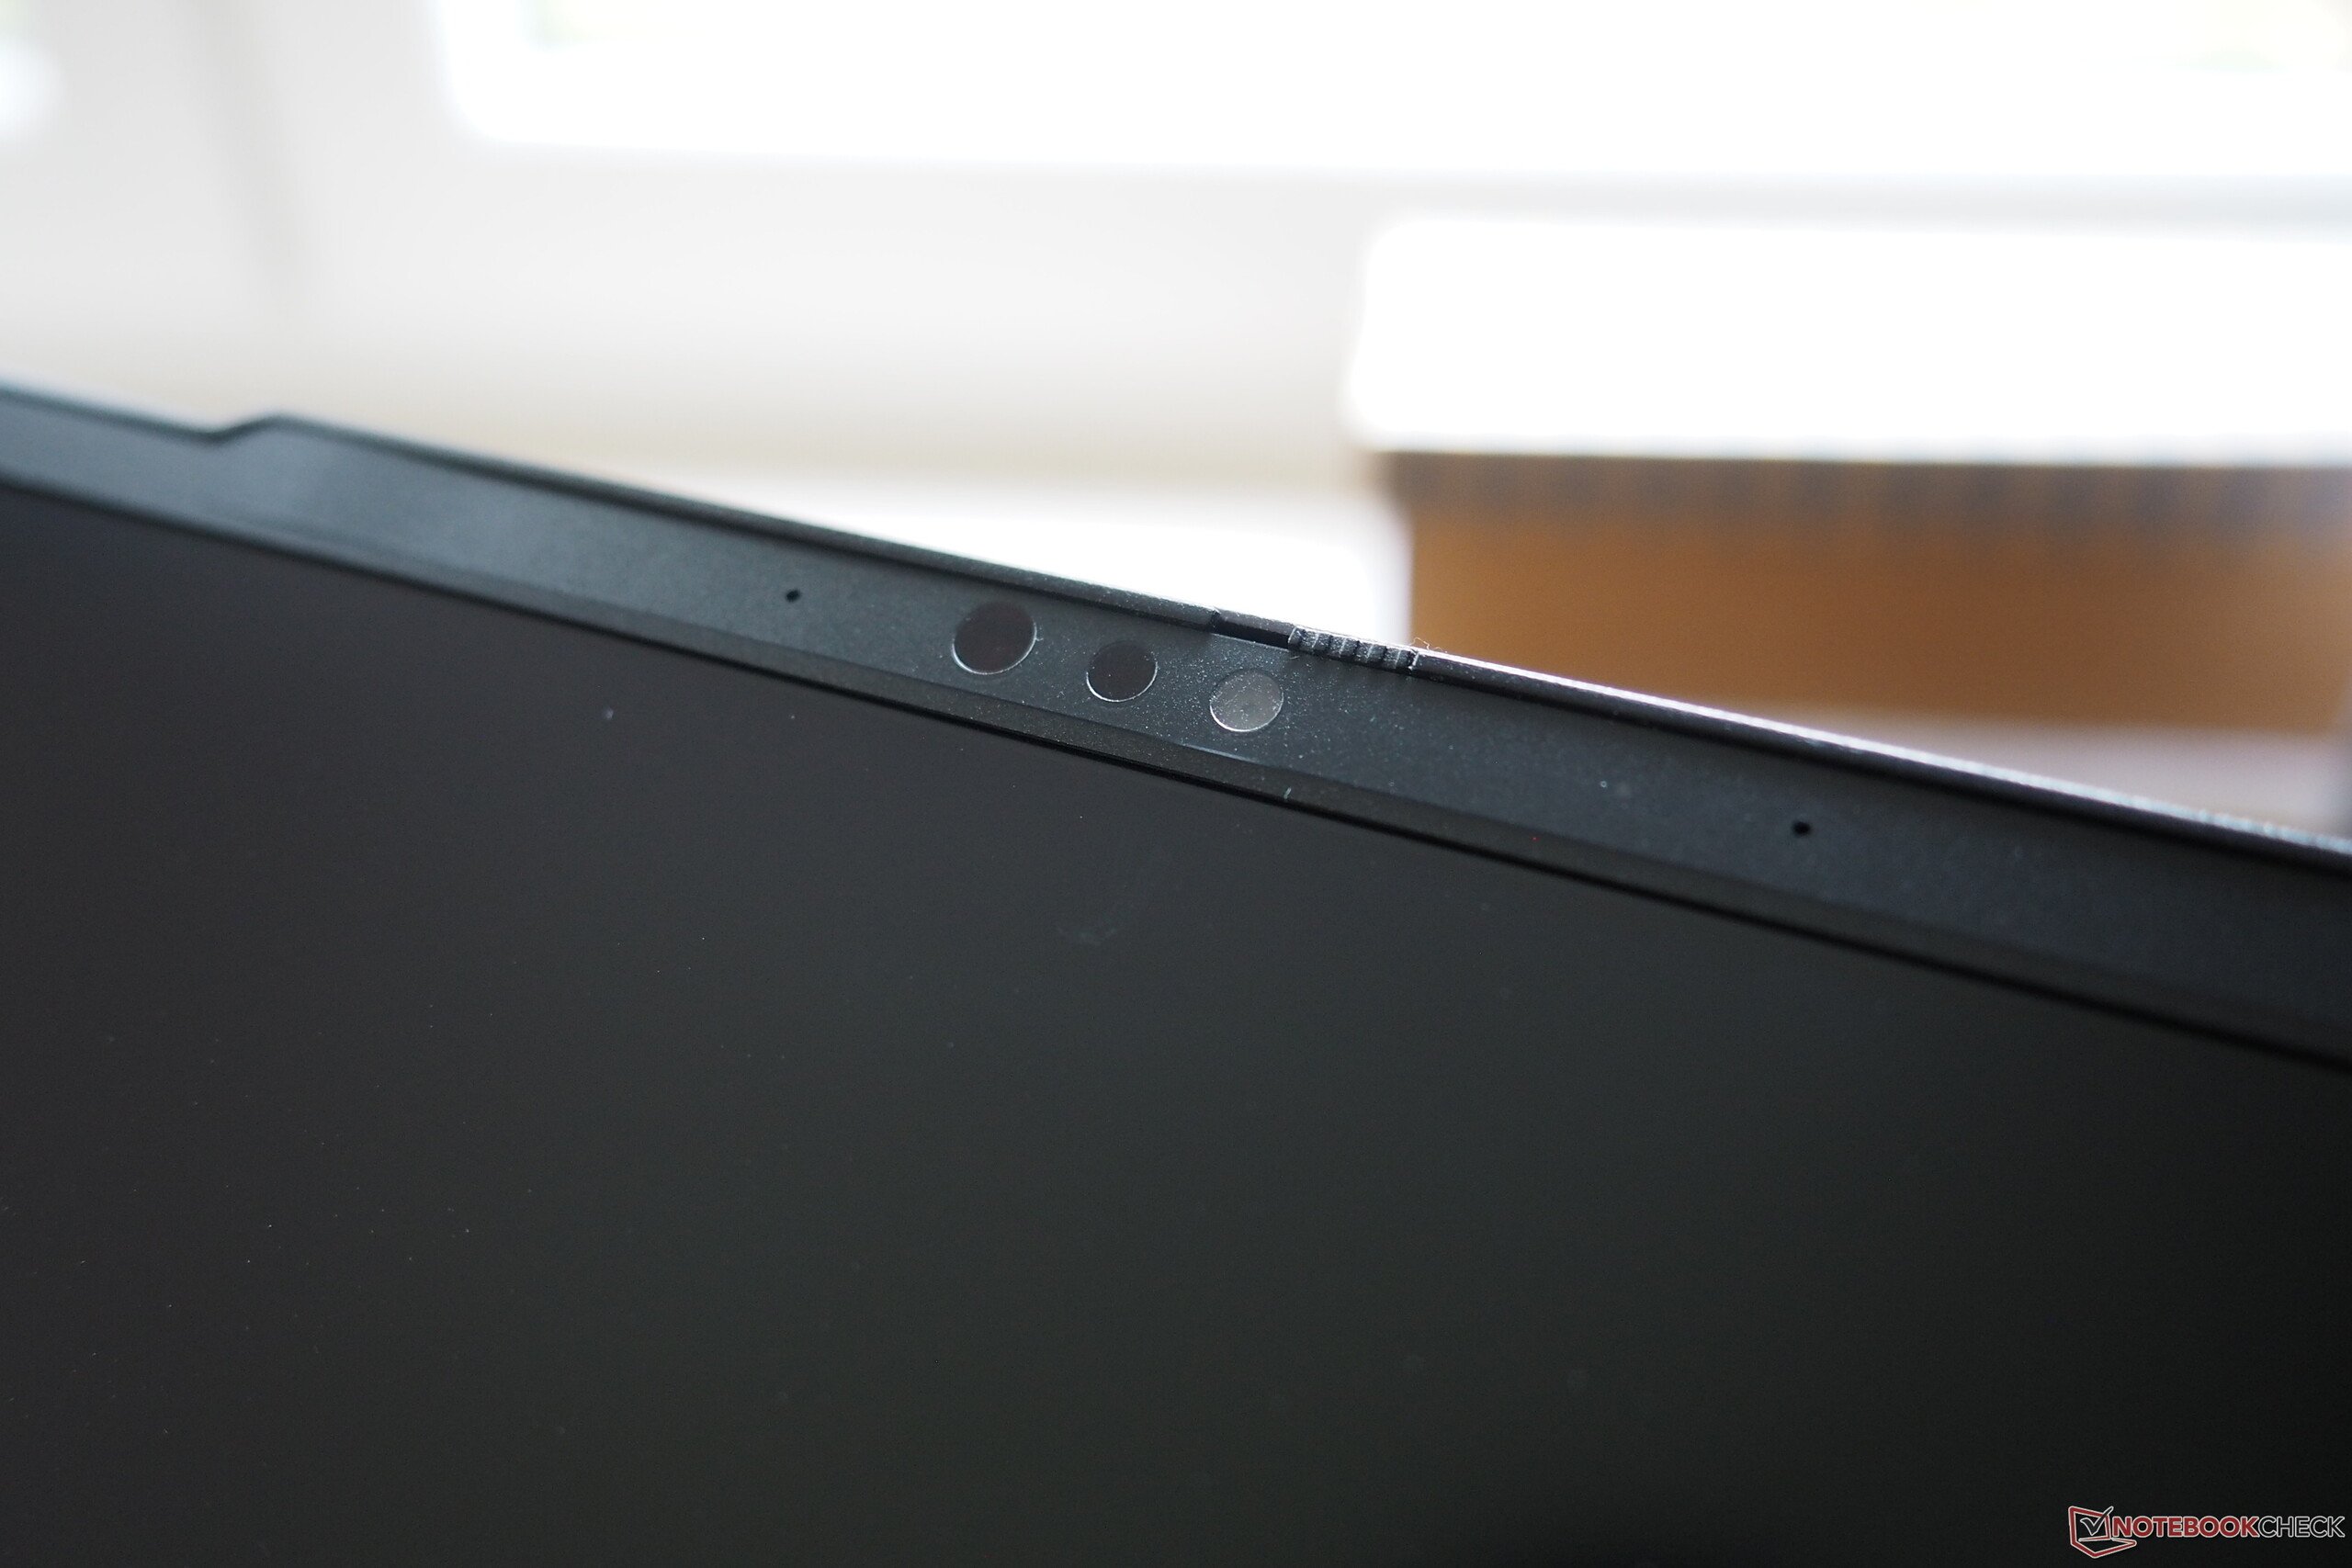
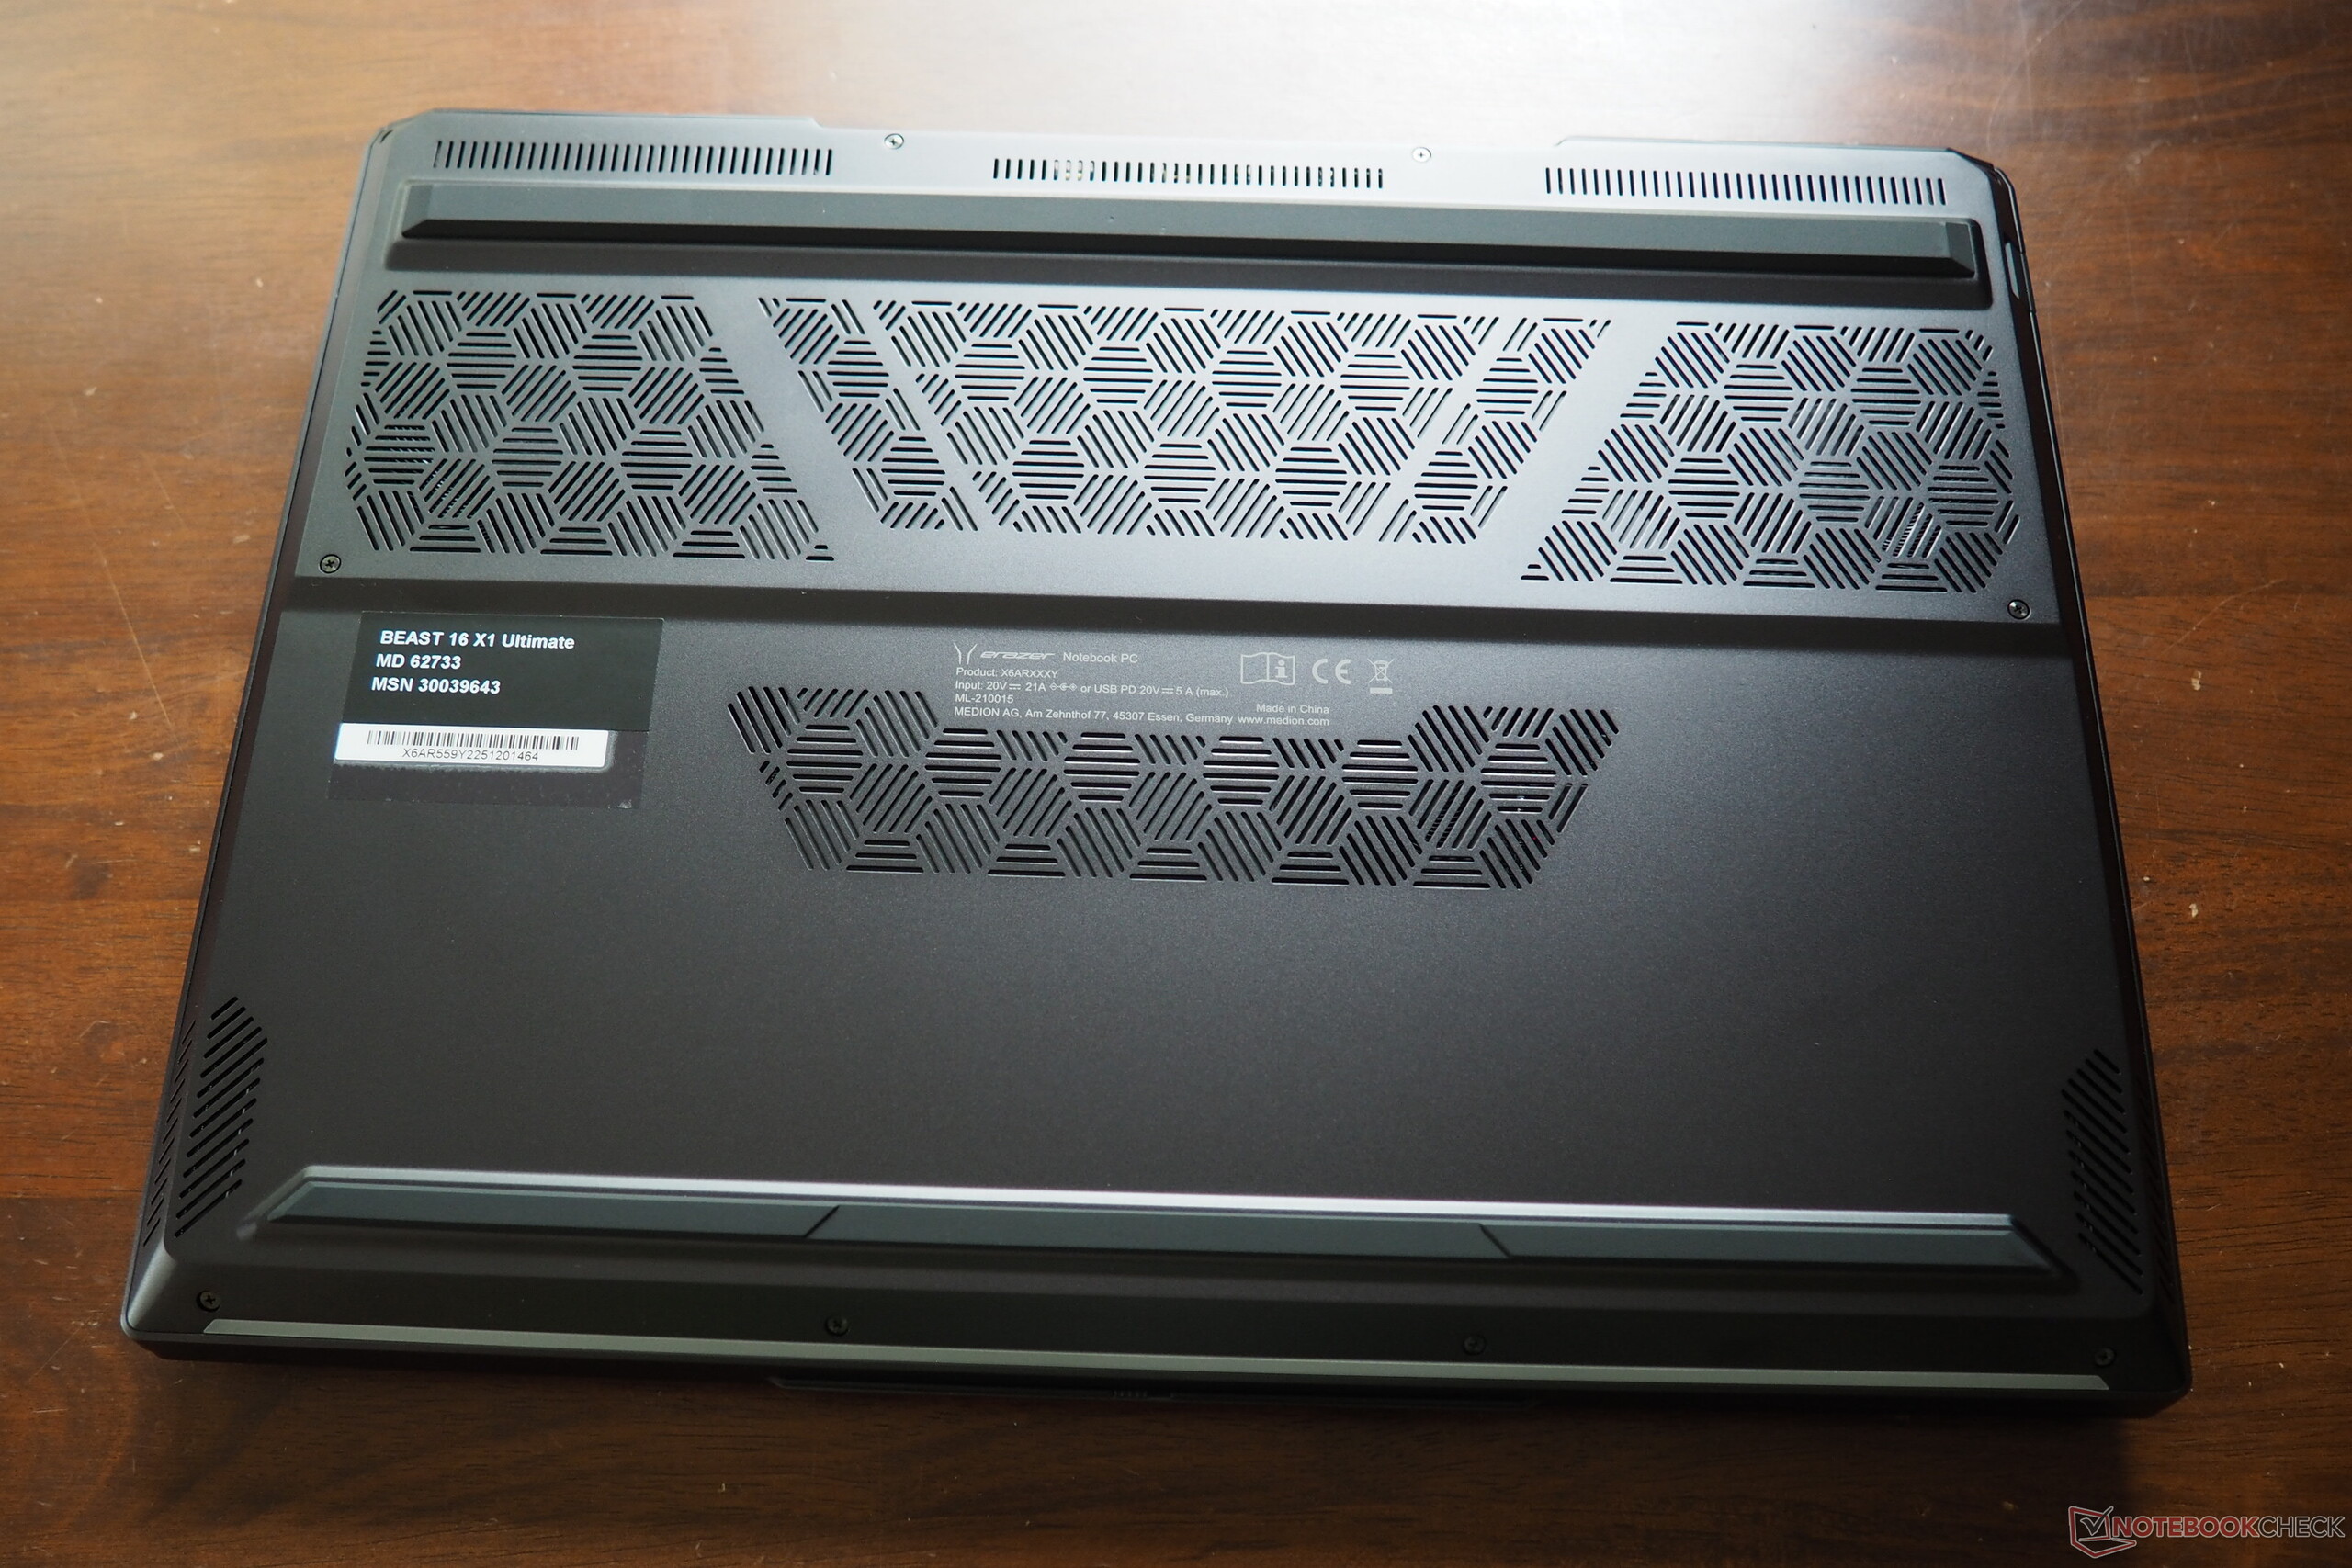
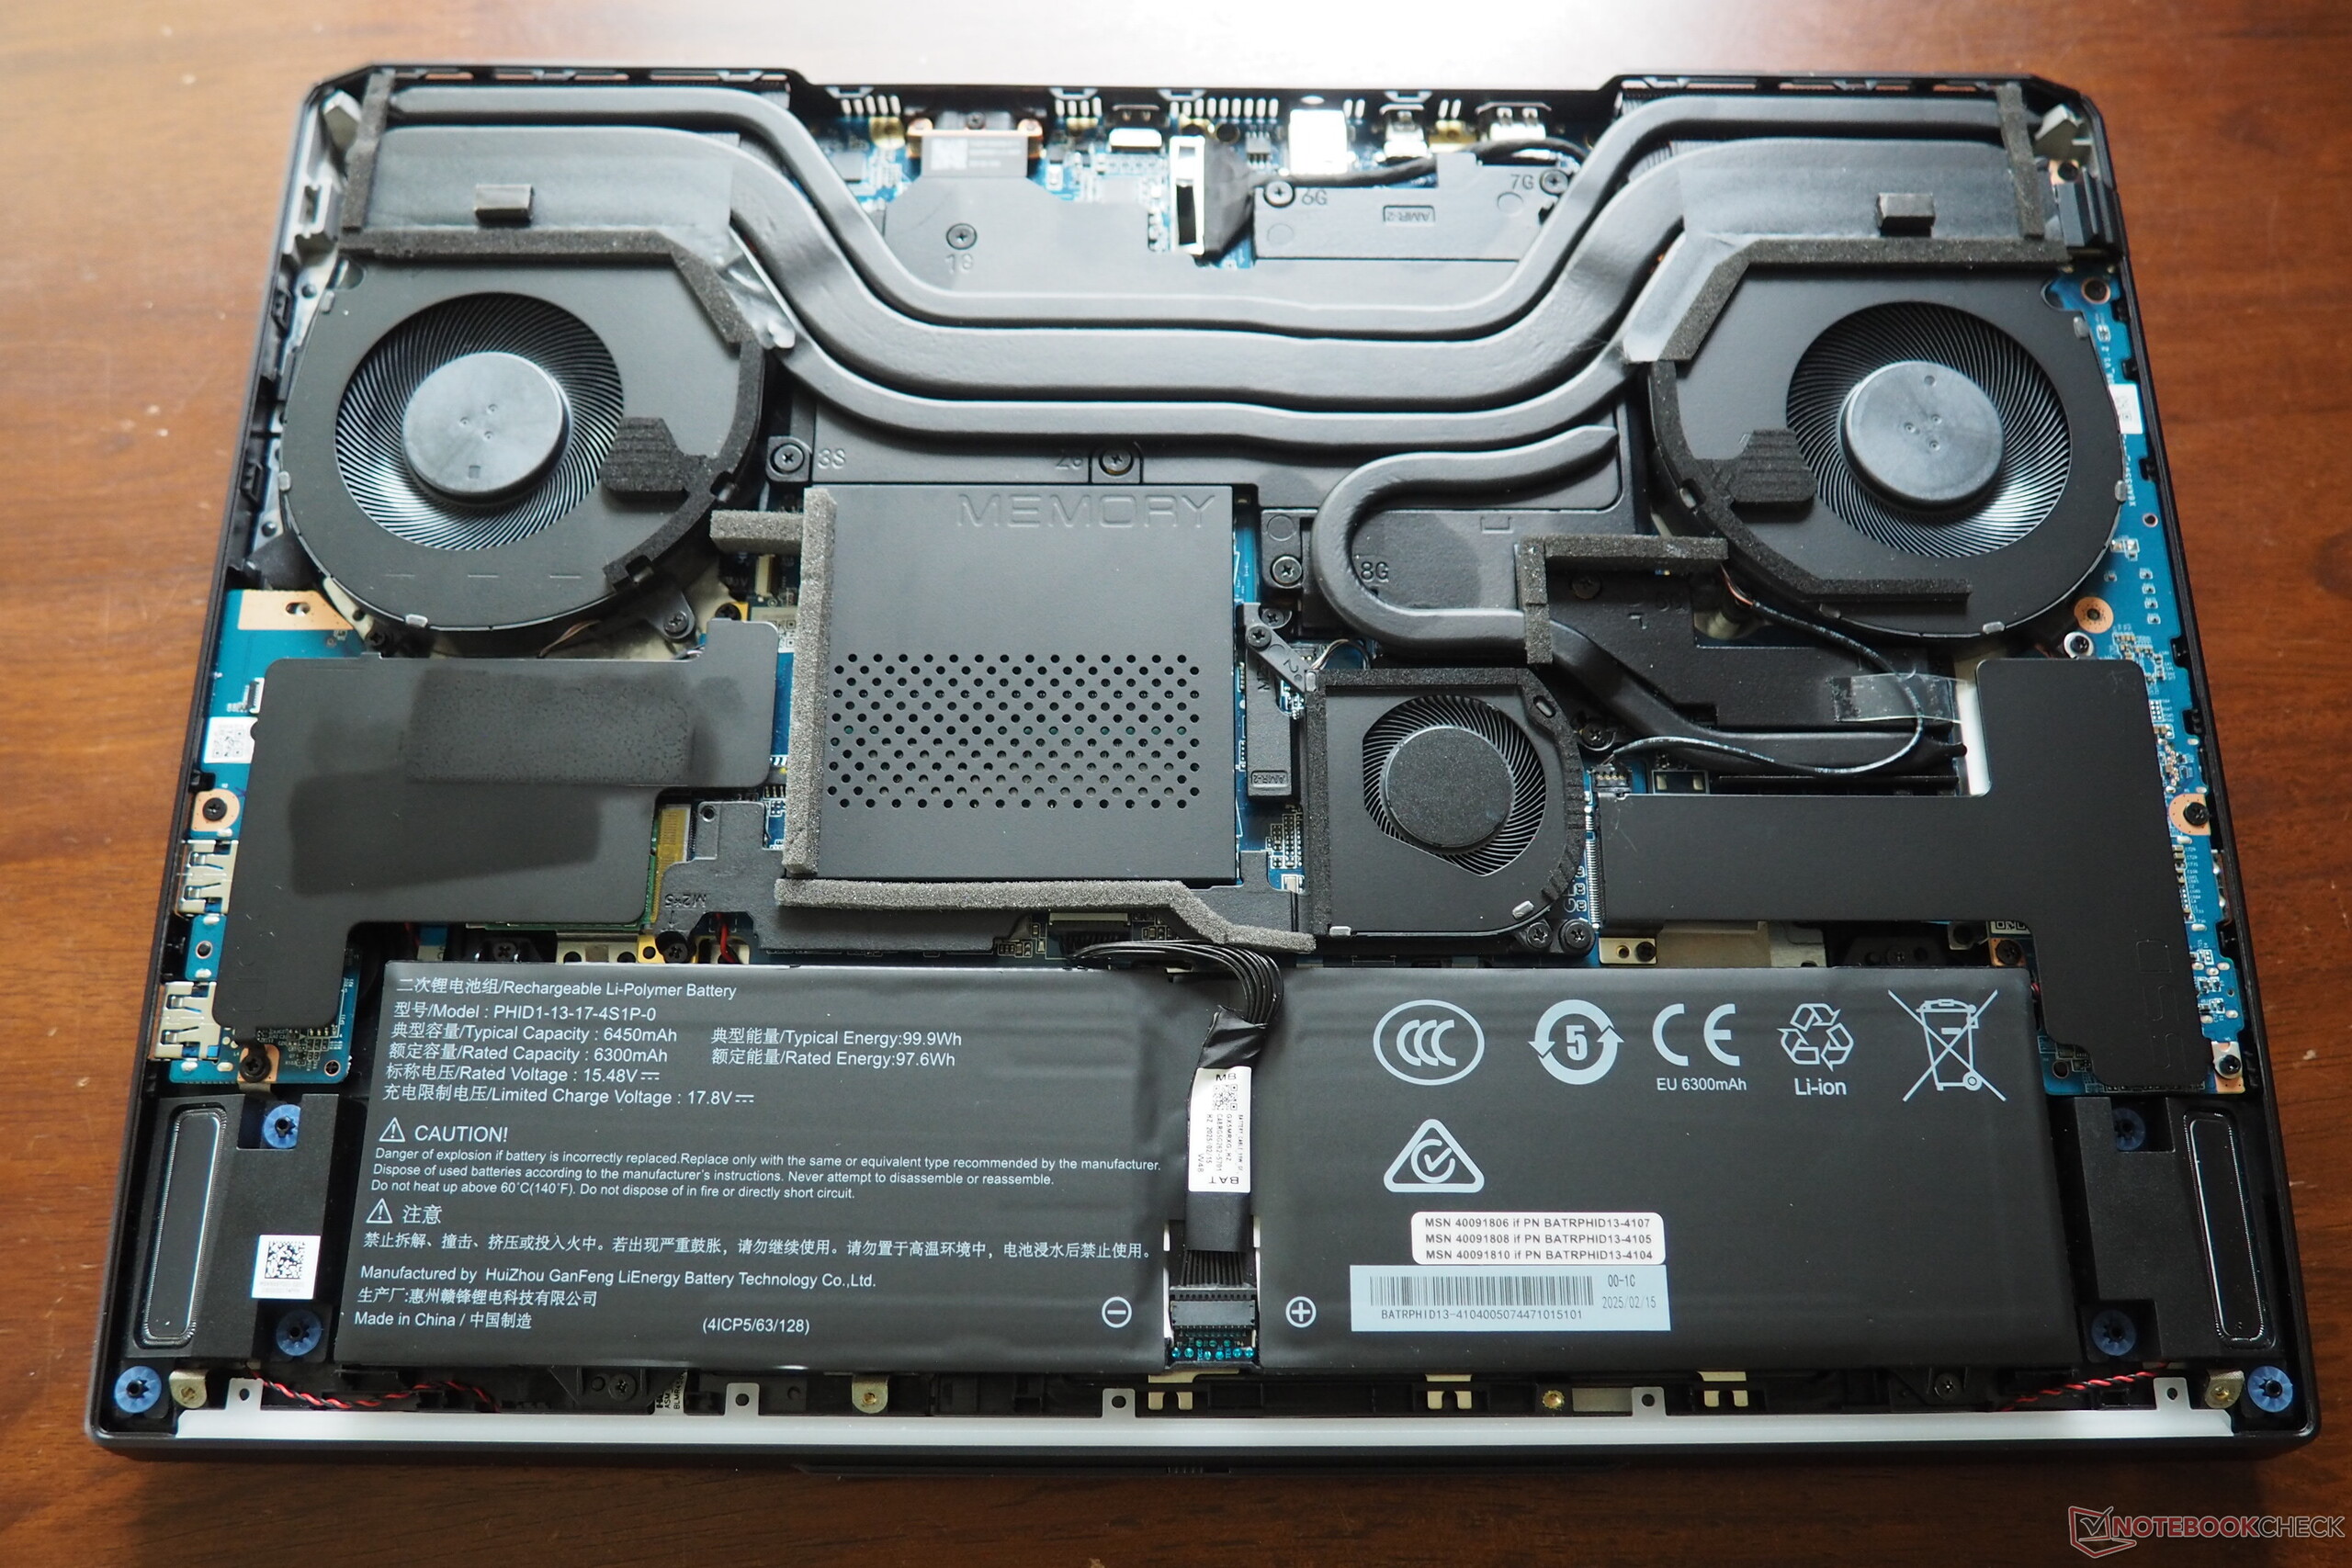
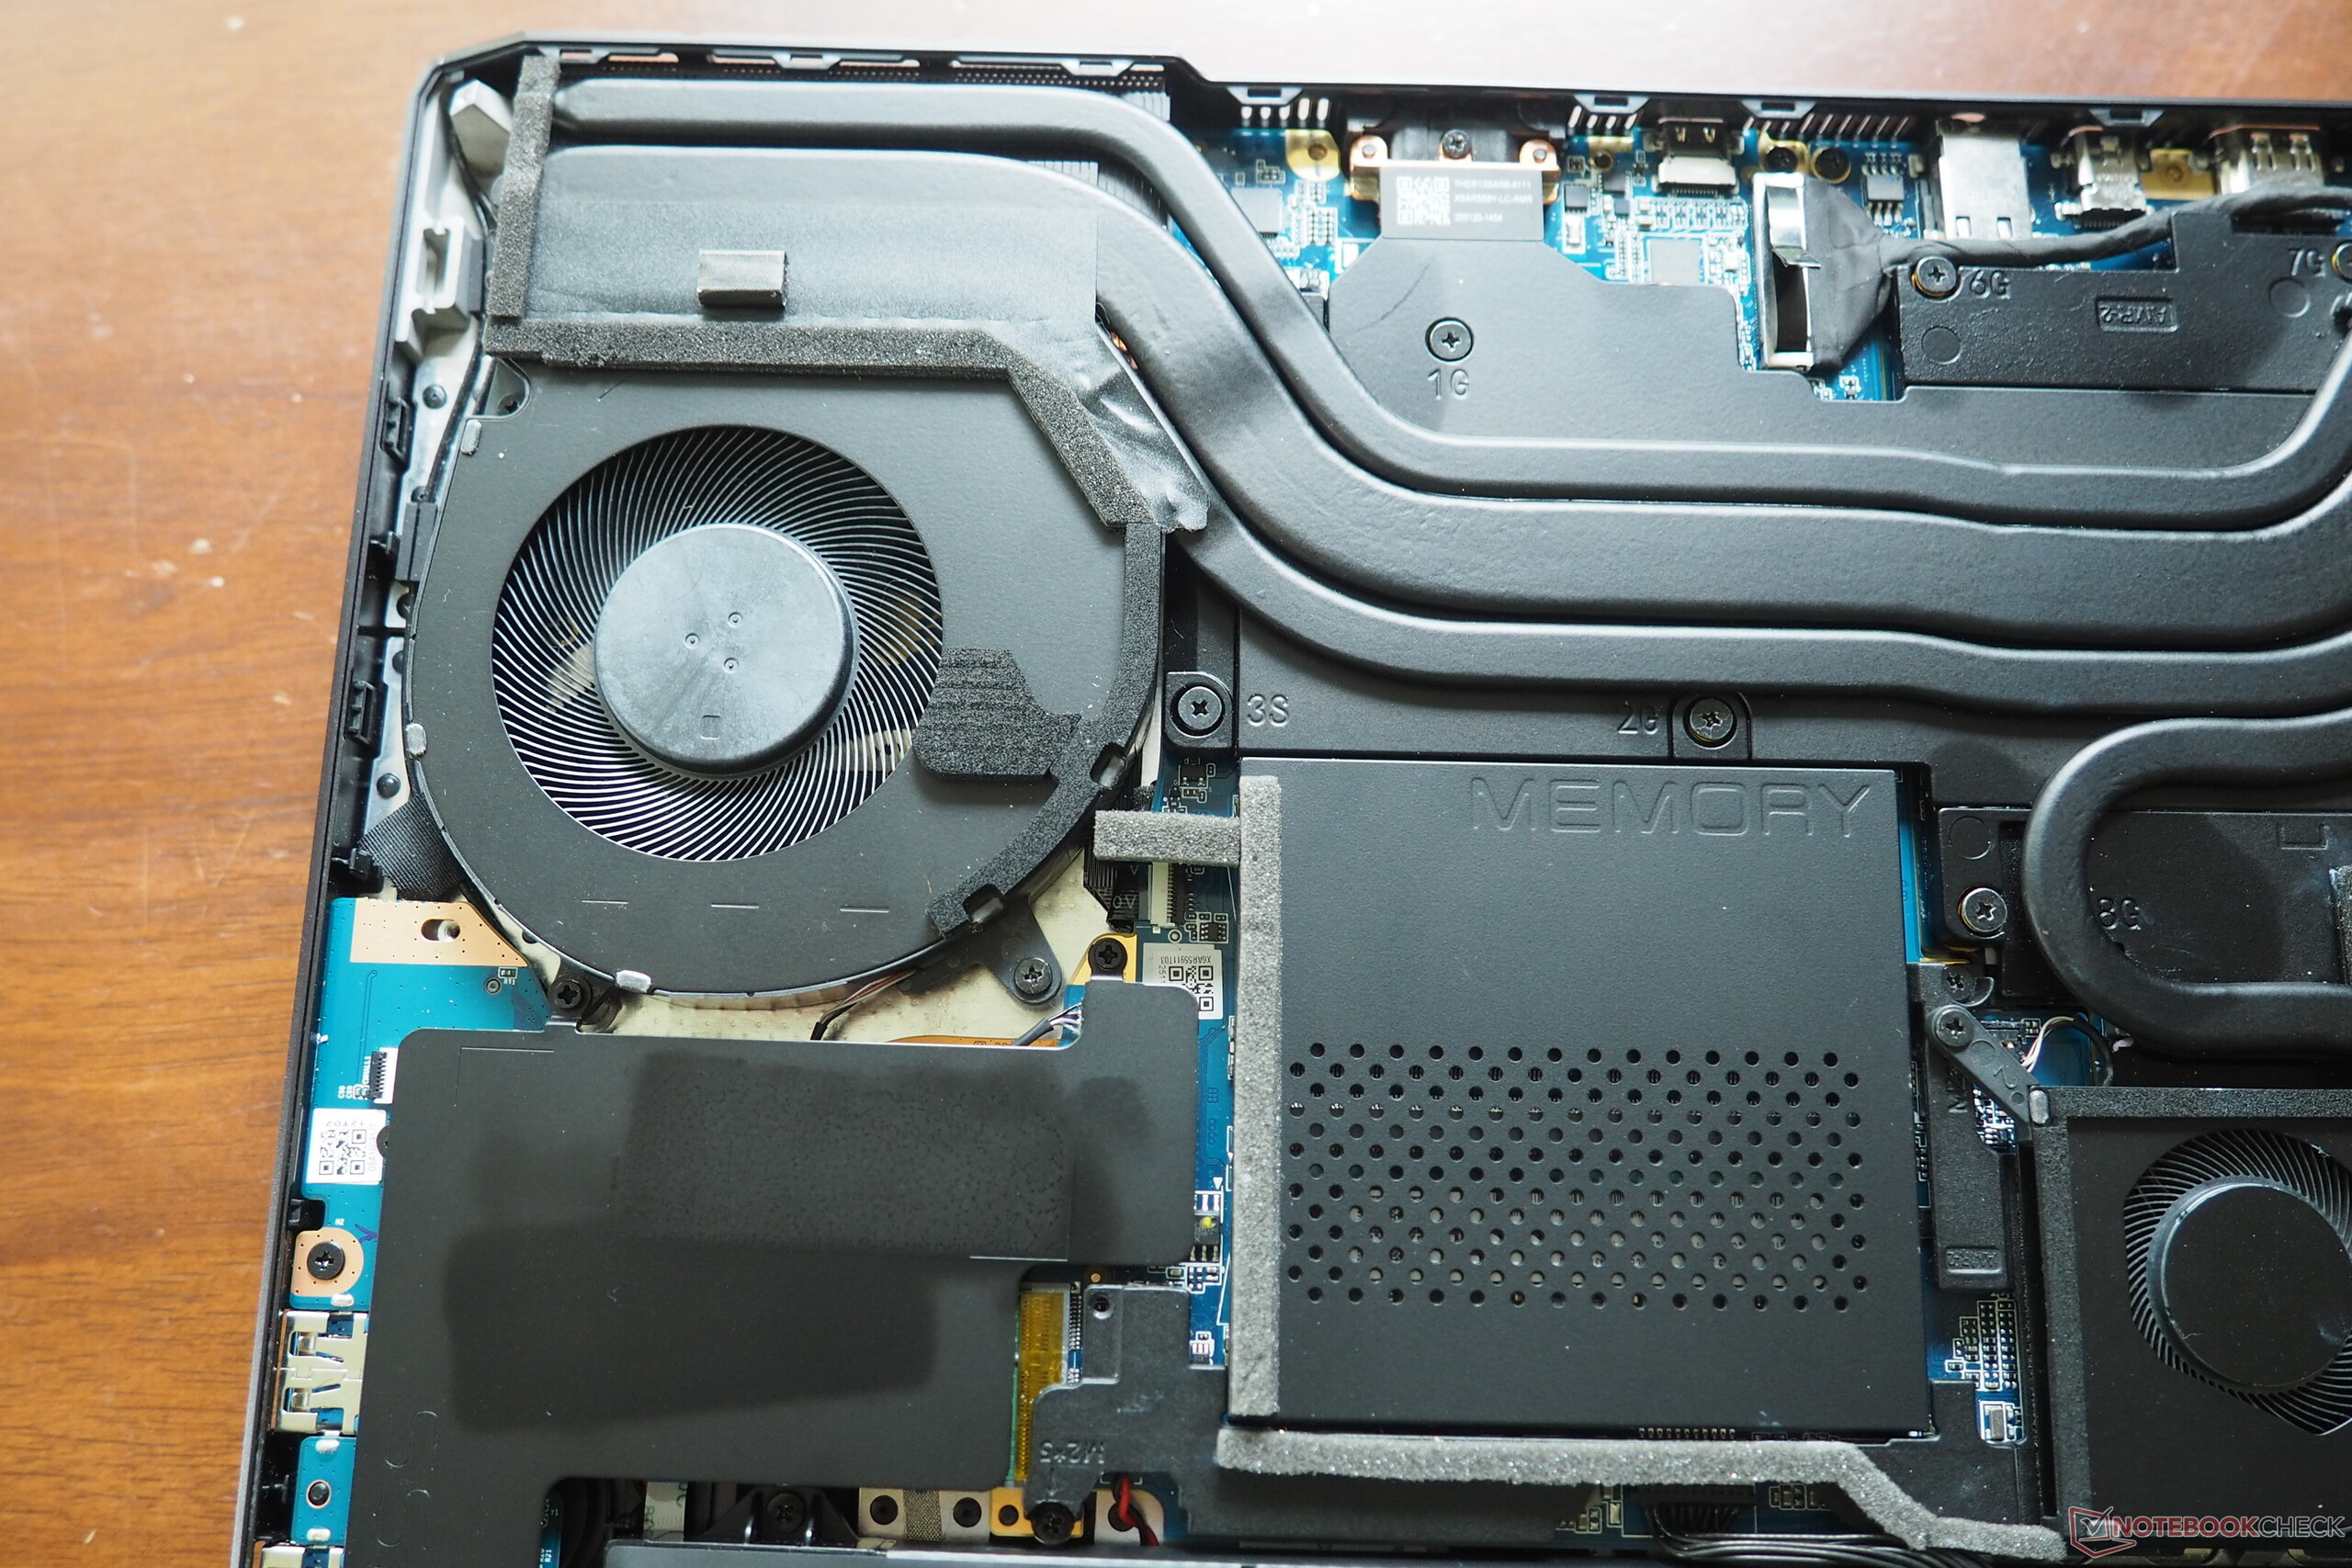
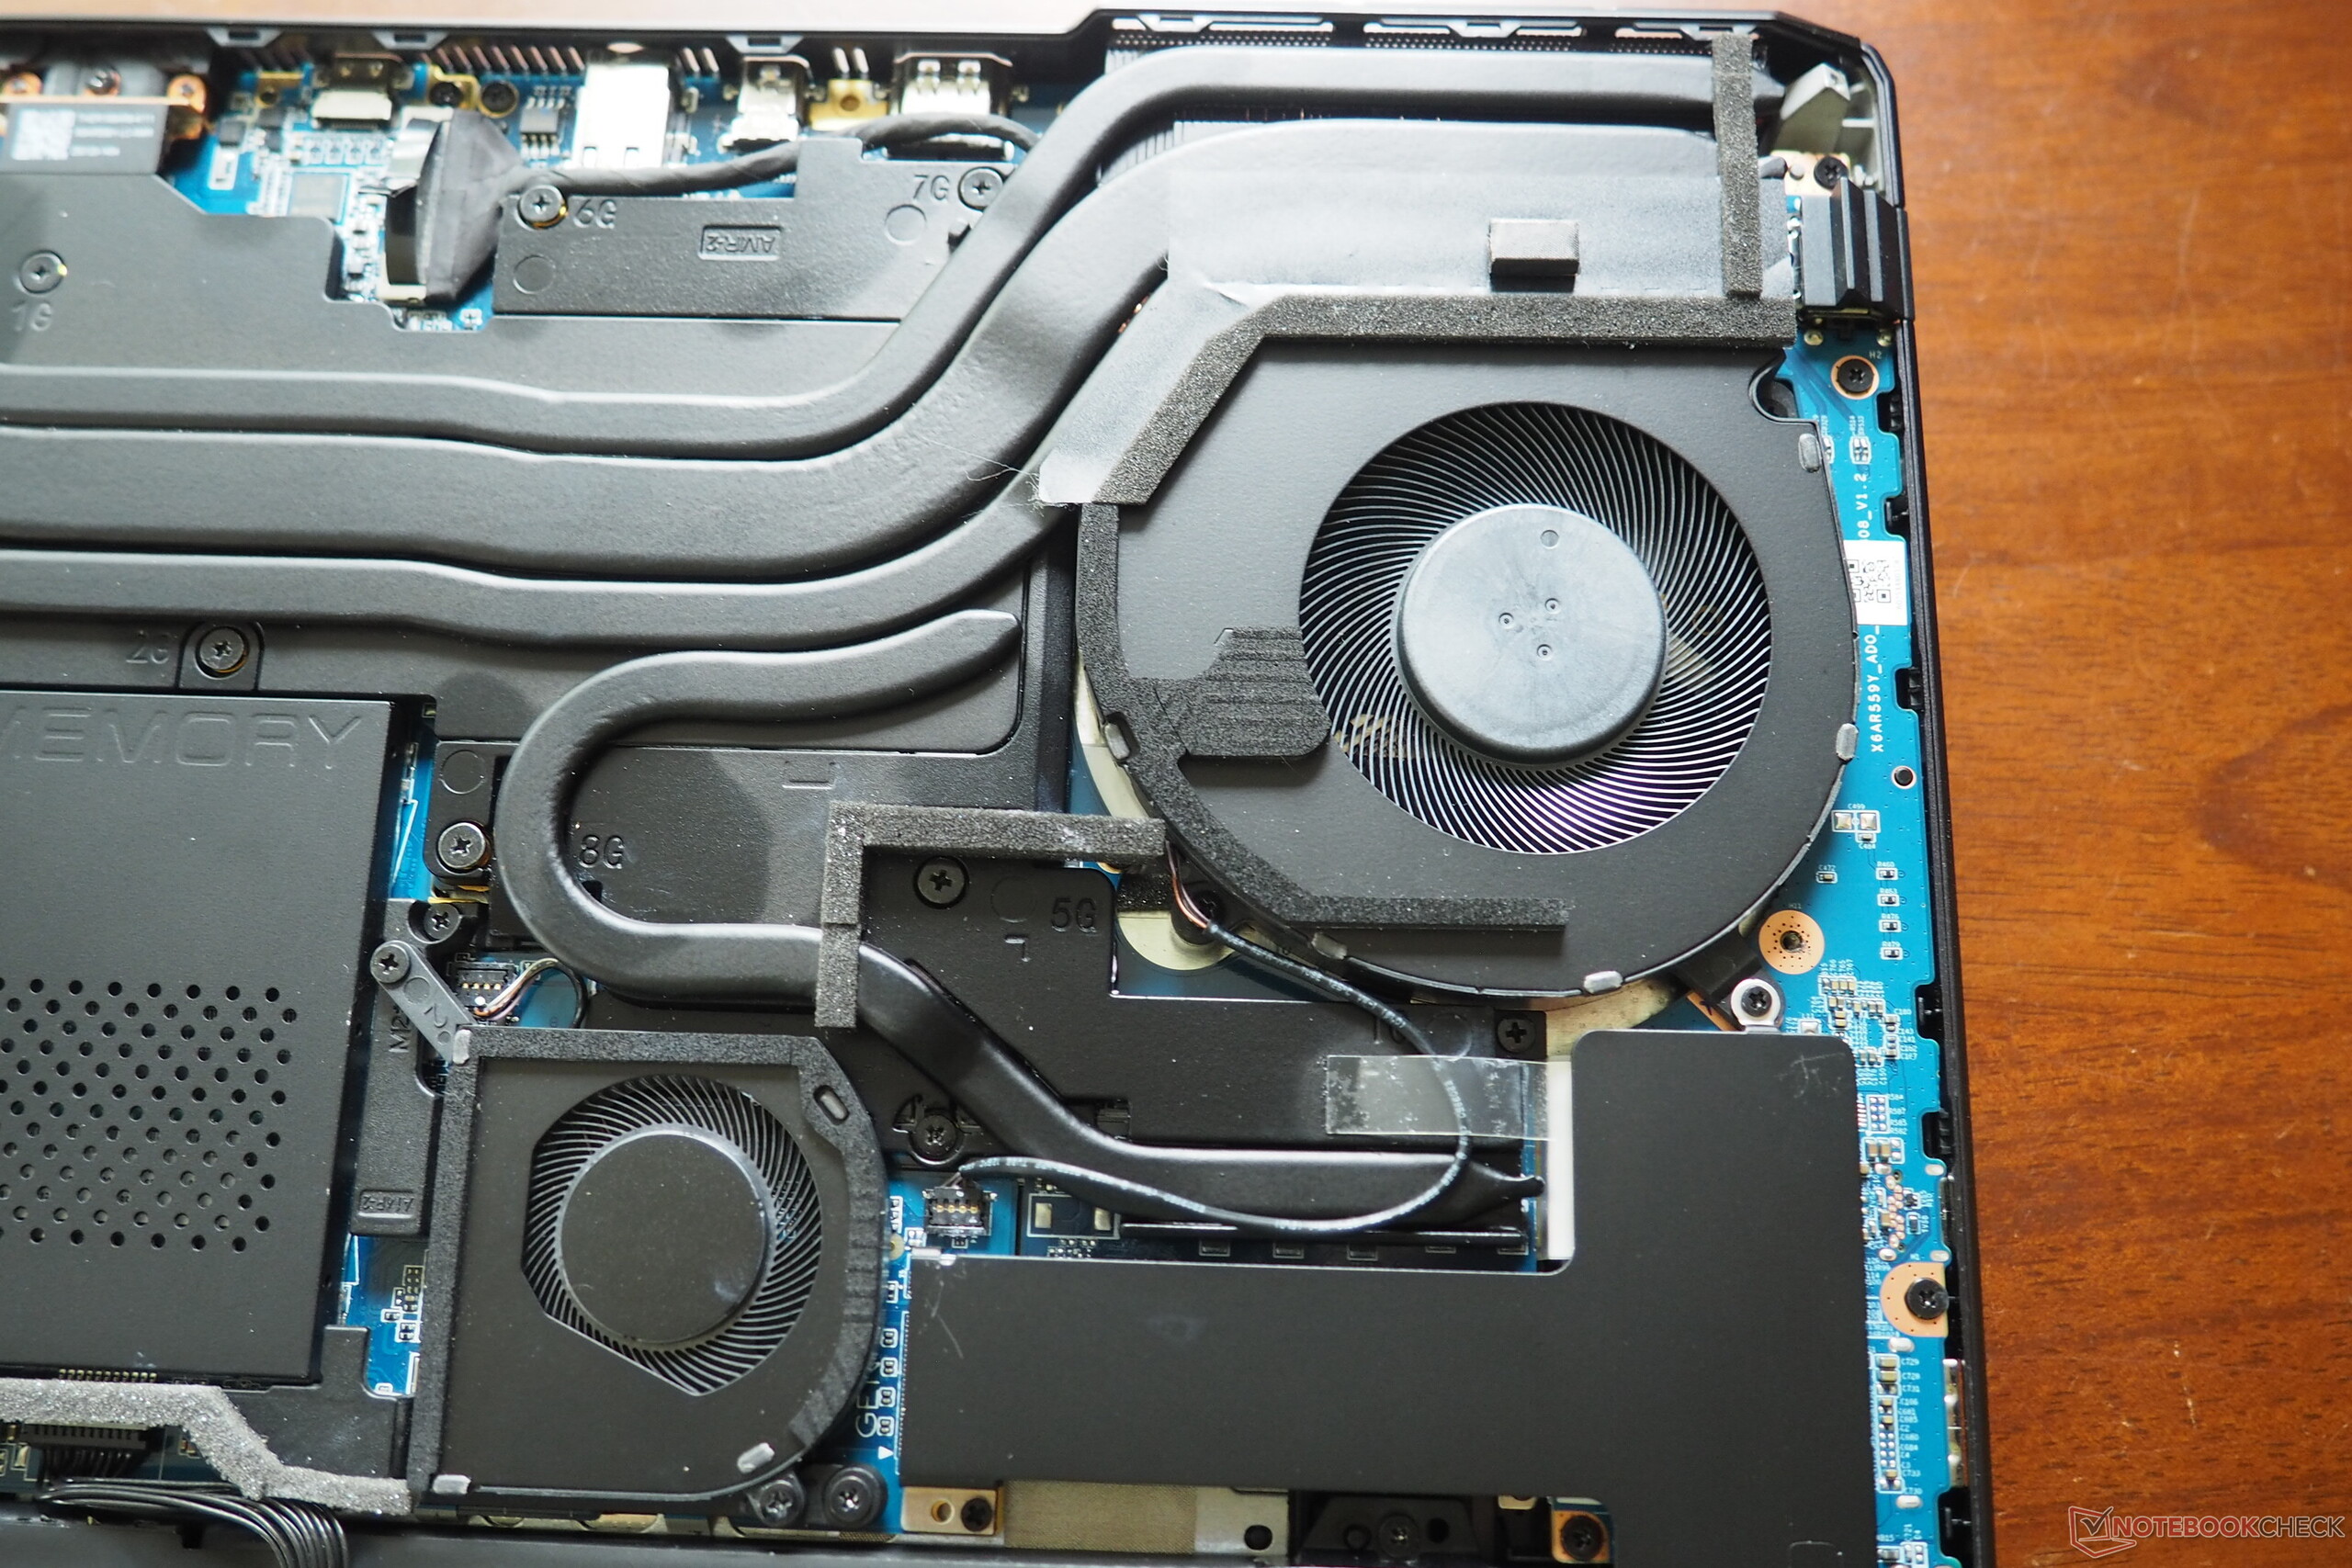
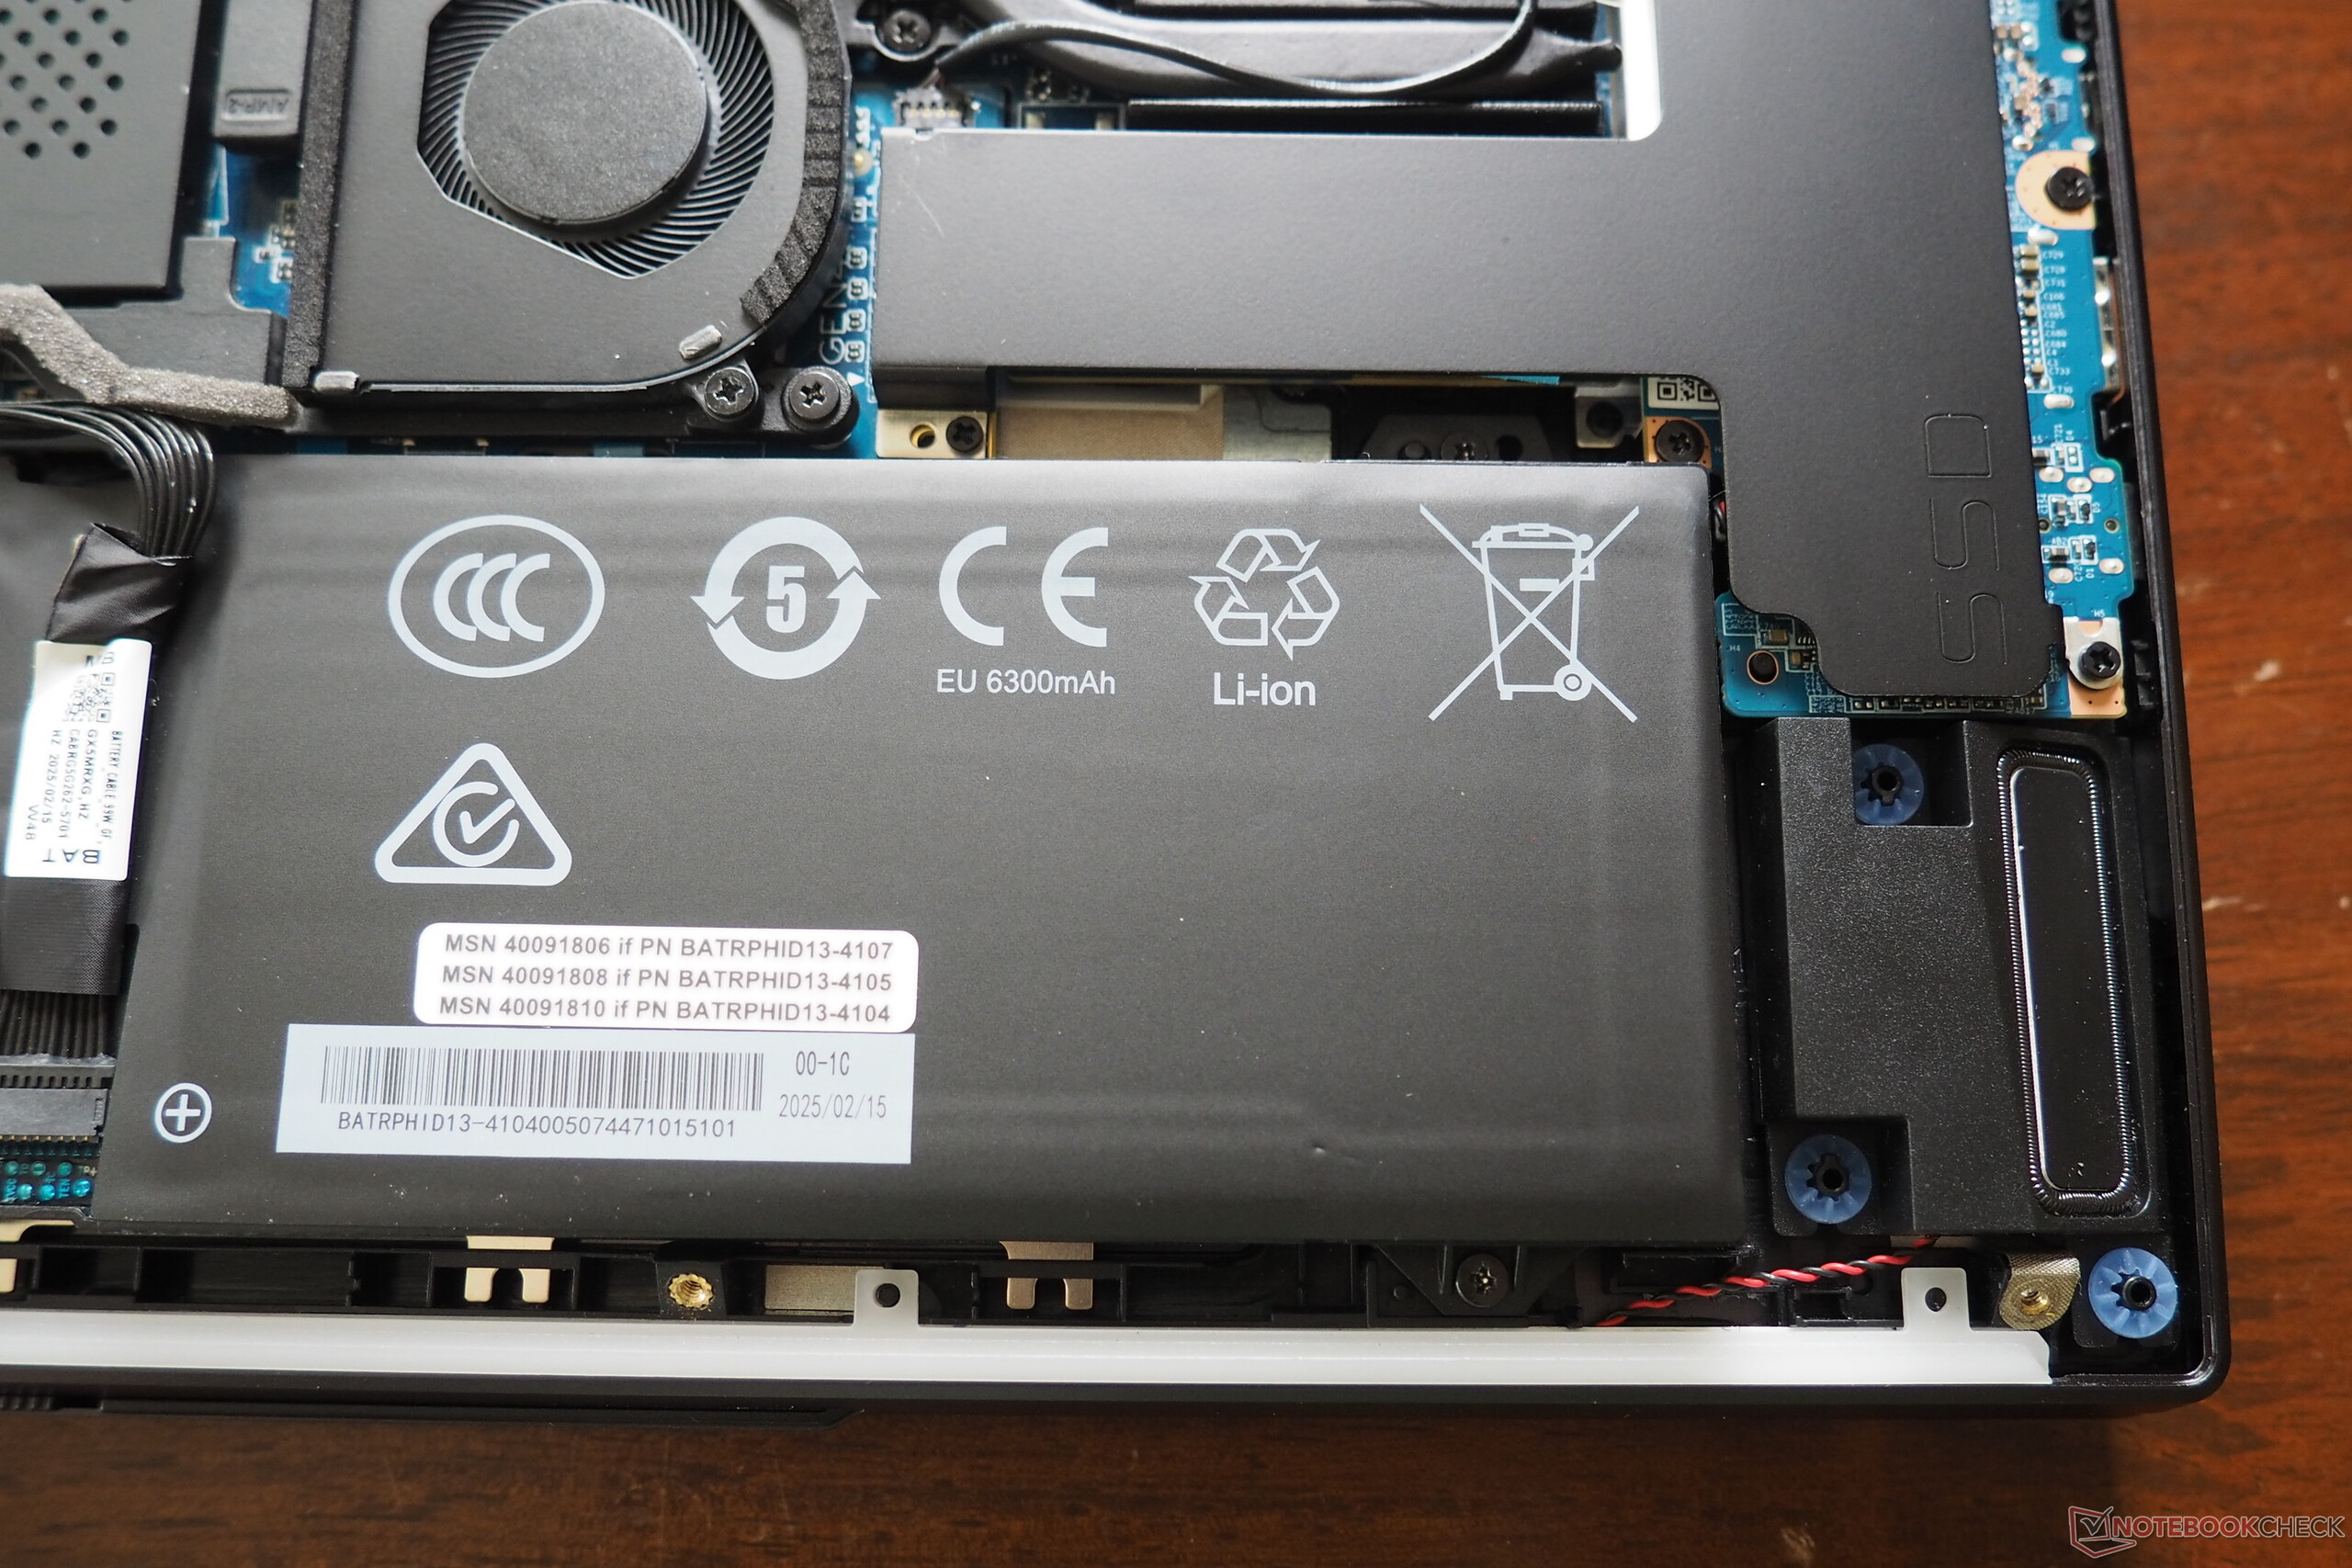
网络摄像头的图像质量一般:由于采用了全高清分辨率,它比某些竞争对手的高清摄像头要清晰一些,但你也不要期望它能创造奇迹。Medion 在物理覆盖方面值得加分。卸下 10 颗十字螺丝和外壳底座后,就可以对 Beast 16 X1 进行维修。16 英寸型号可容纳两个 SO-DIMM 组和两个 M.2-2280 插槽(1 个 PCIe 5、1 个 PCIe 4),每个插槽都隐藏在散热器下。说到散热系统:游戏机配备了三个风扇。
SD 读卡器
| SD Card Reader | |
| average JPG Copy Test (av. of 3 runs) | |
| Medion Erazer Beast 16 X1 Ultimate (AV PRO microSD 128 GB V60) | |
| Average of class Gaming (20.9 - 210, n=53, last 2 years) | |
| Schenker XMG Neo 16 E25 RTX 5090 Laptop (Angelbird AV Pro V60) | |
| maximum AS SSD Seq Read Test (1GB) | |
| Schenker XMG Neo 16 E25 RTX 5090 Laptop (Angelbird AV Pro V60) | |
| Medion Erazer Beast 16 X1 Ultimate (AV PRO microSD 128 GB V60) | |
| Average of class Gaming (25.5 - 261, n=50, last 2 years) | |
交流
网络摄像头


维护
输入设备
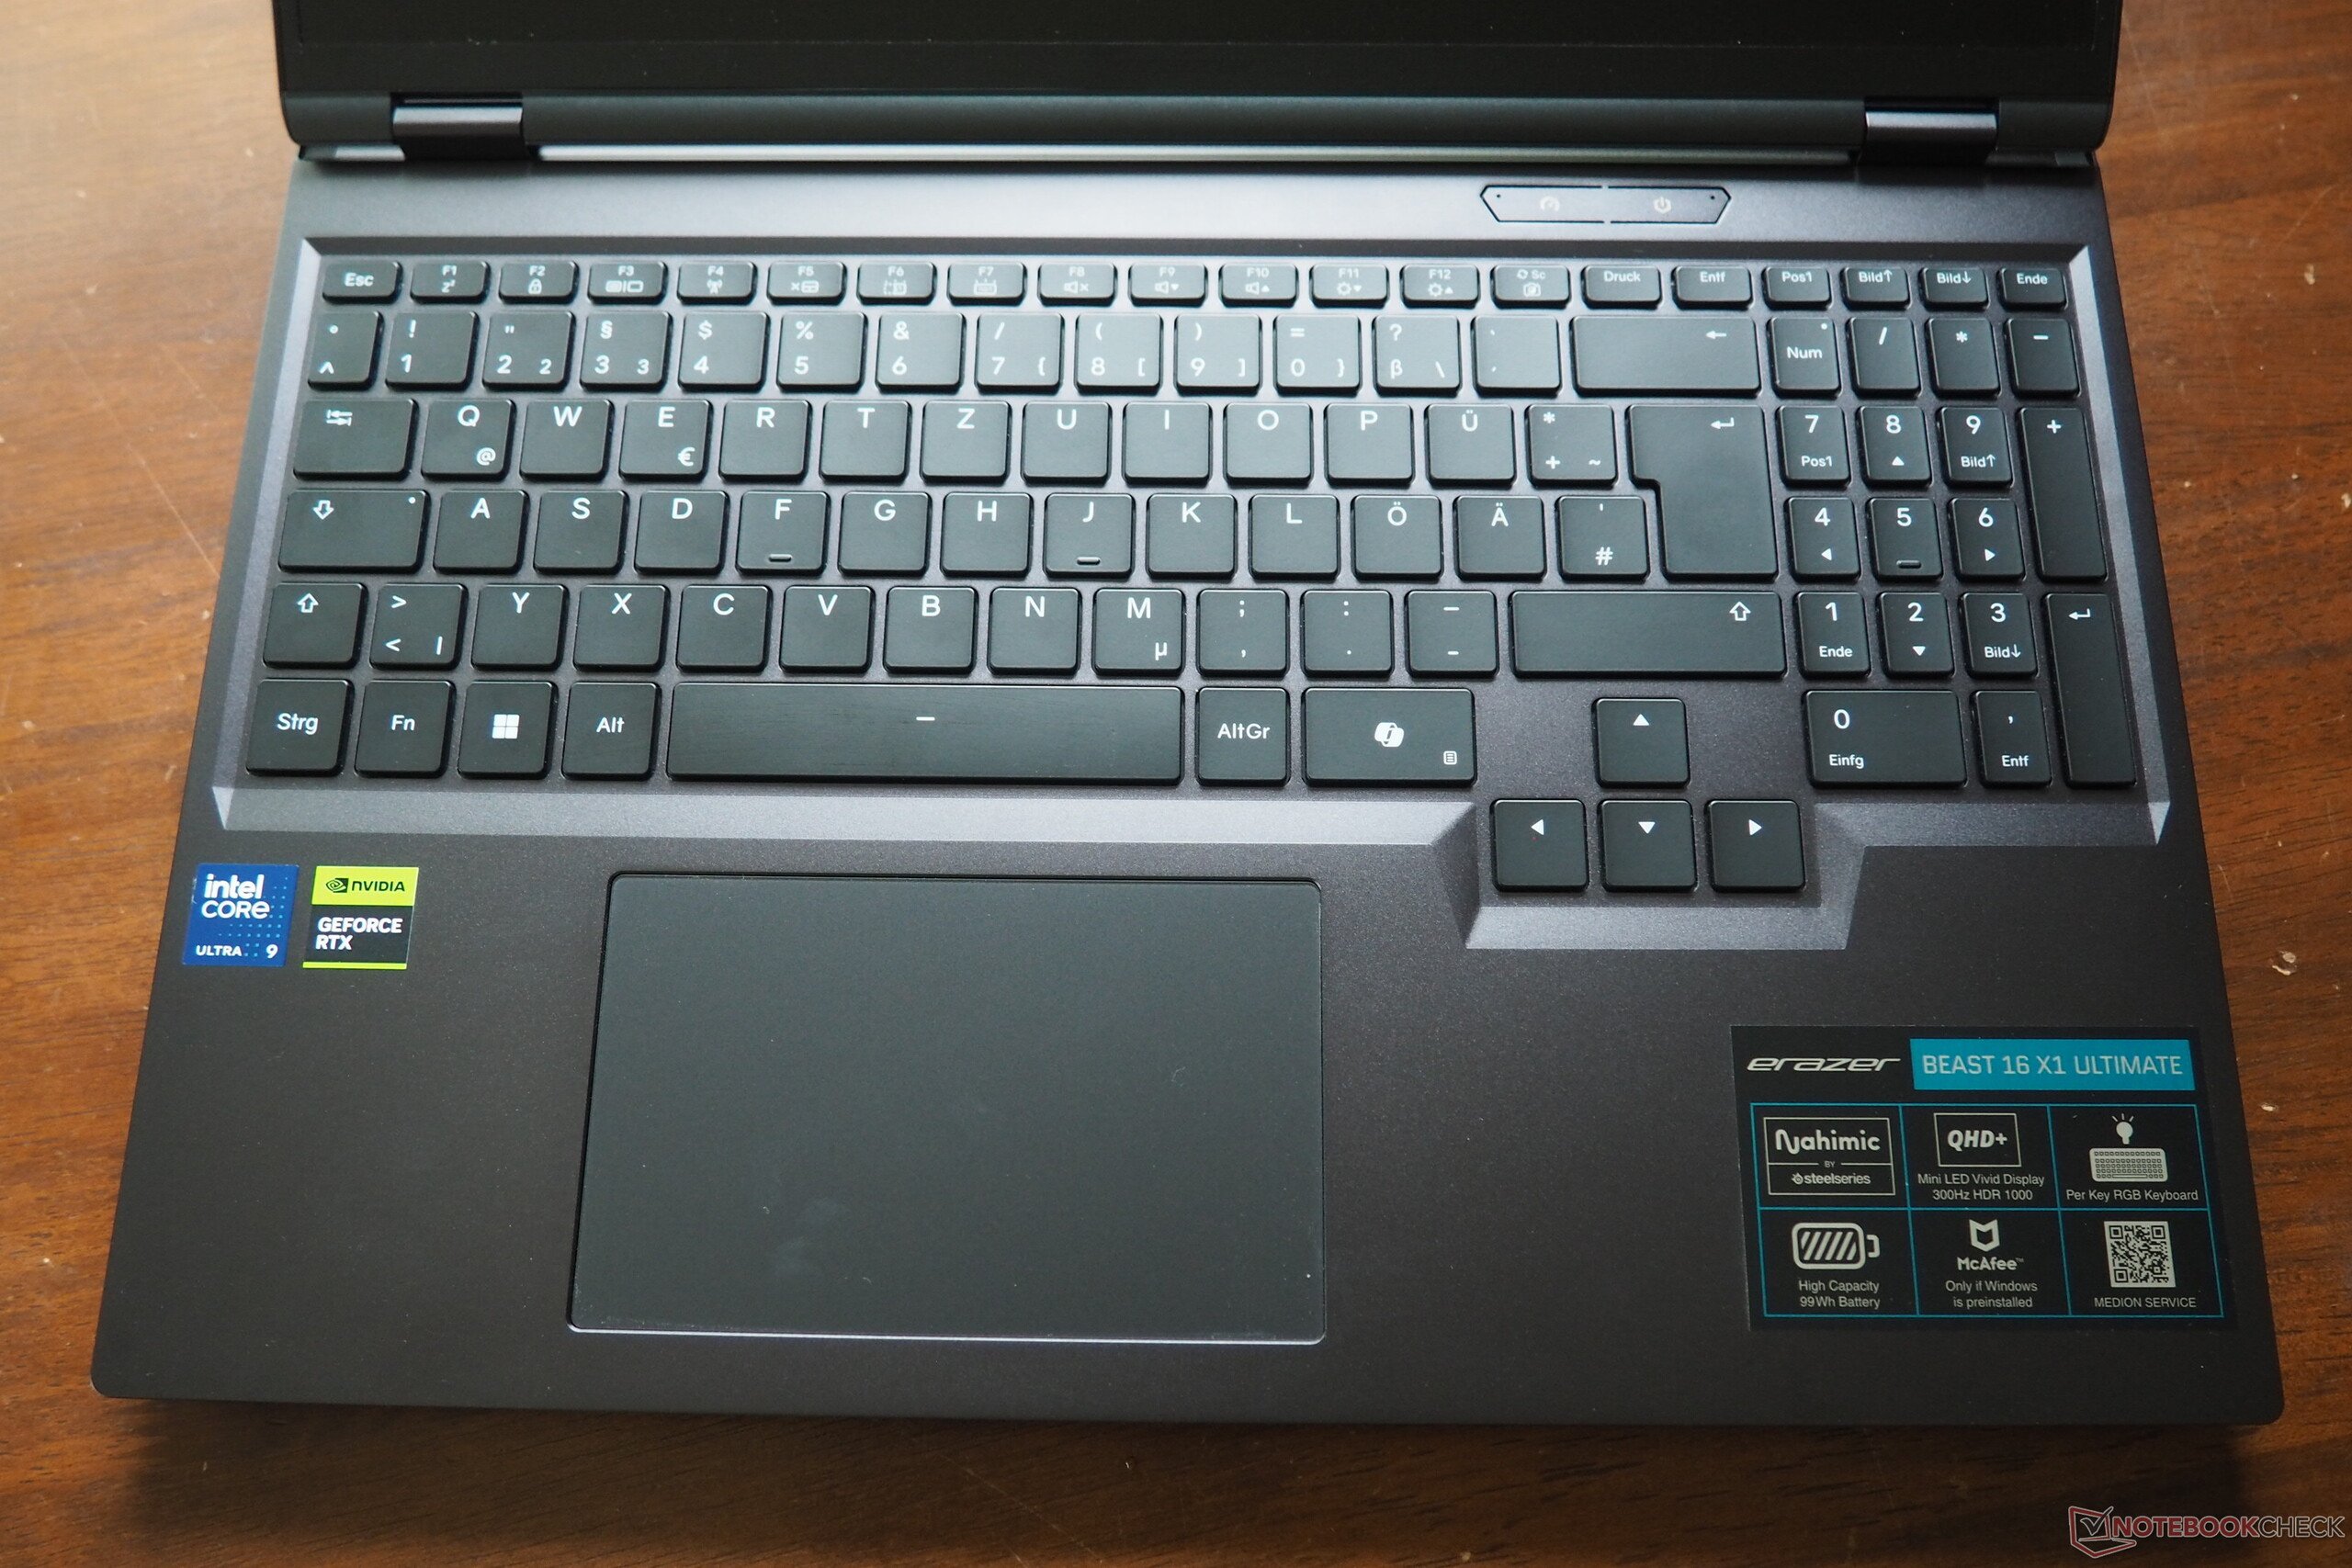
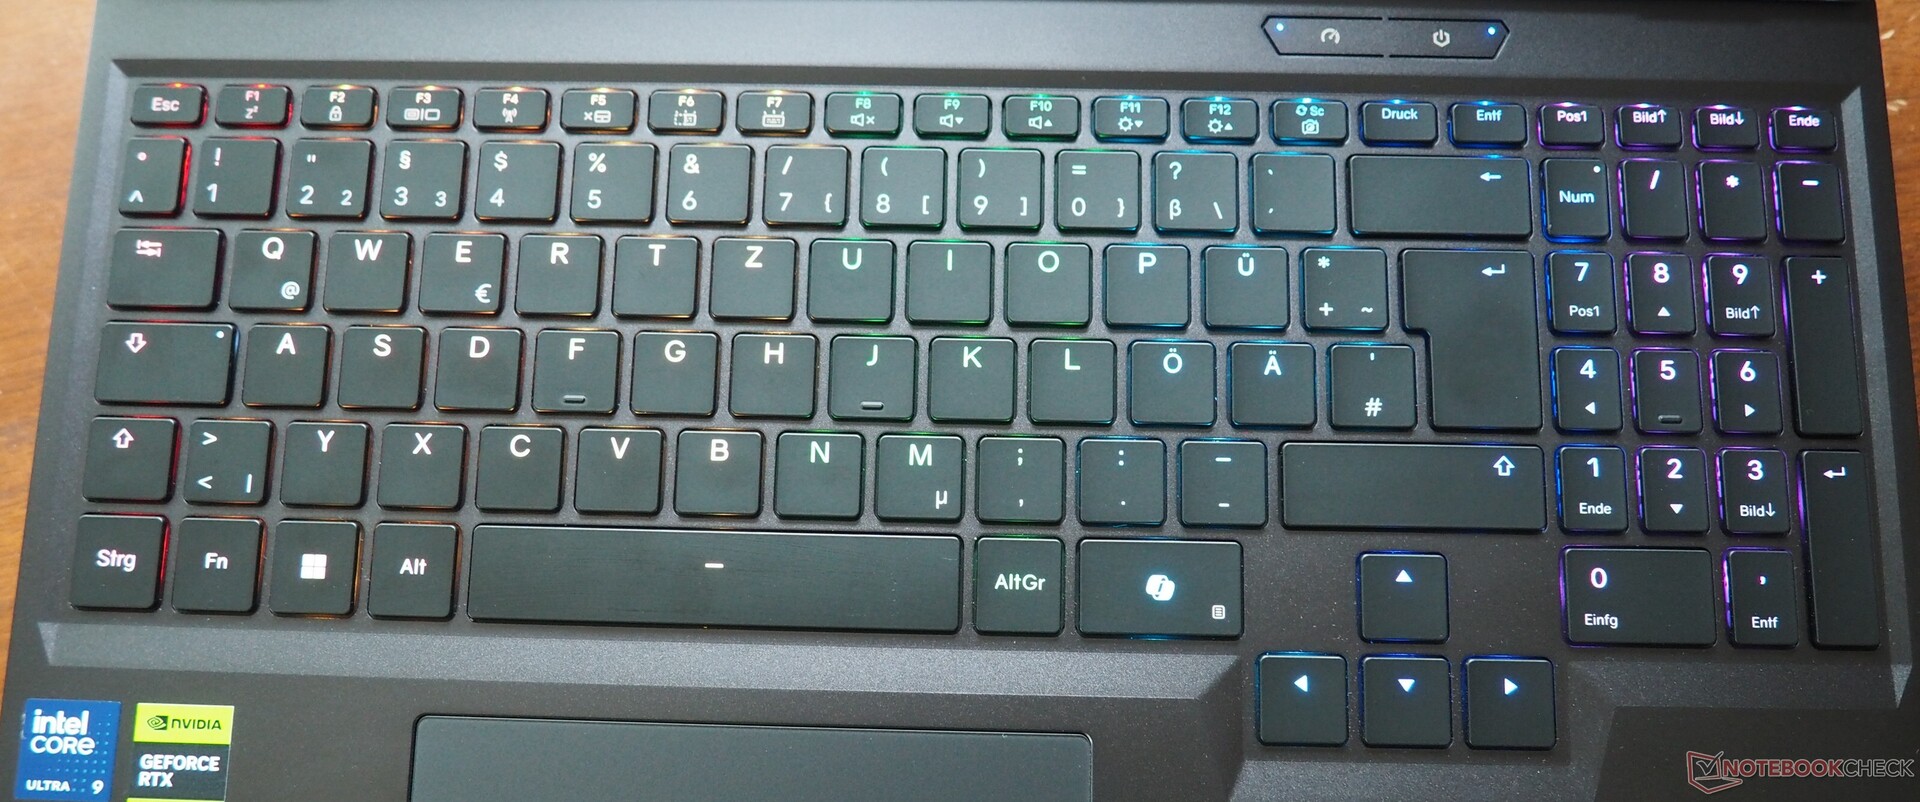
Beast 16 X1 的键盘给人留下了非常好的反馈印象,几乎与机械键盘相当。右侧有一个专用数字键盘,其按键比其他按键略窄。这些按键的正常尺寸会让方向箭头爱好者感到欣喜。内置照明(每个按键 RGB)可调节到多个级别。
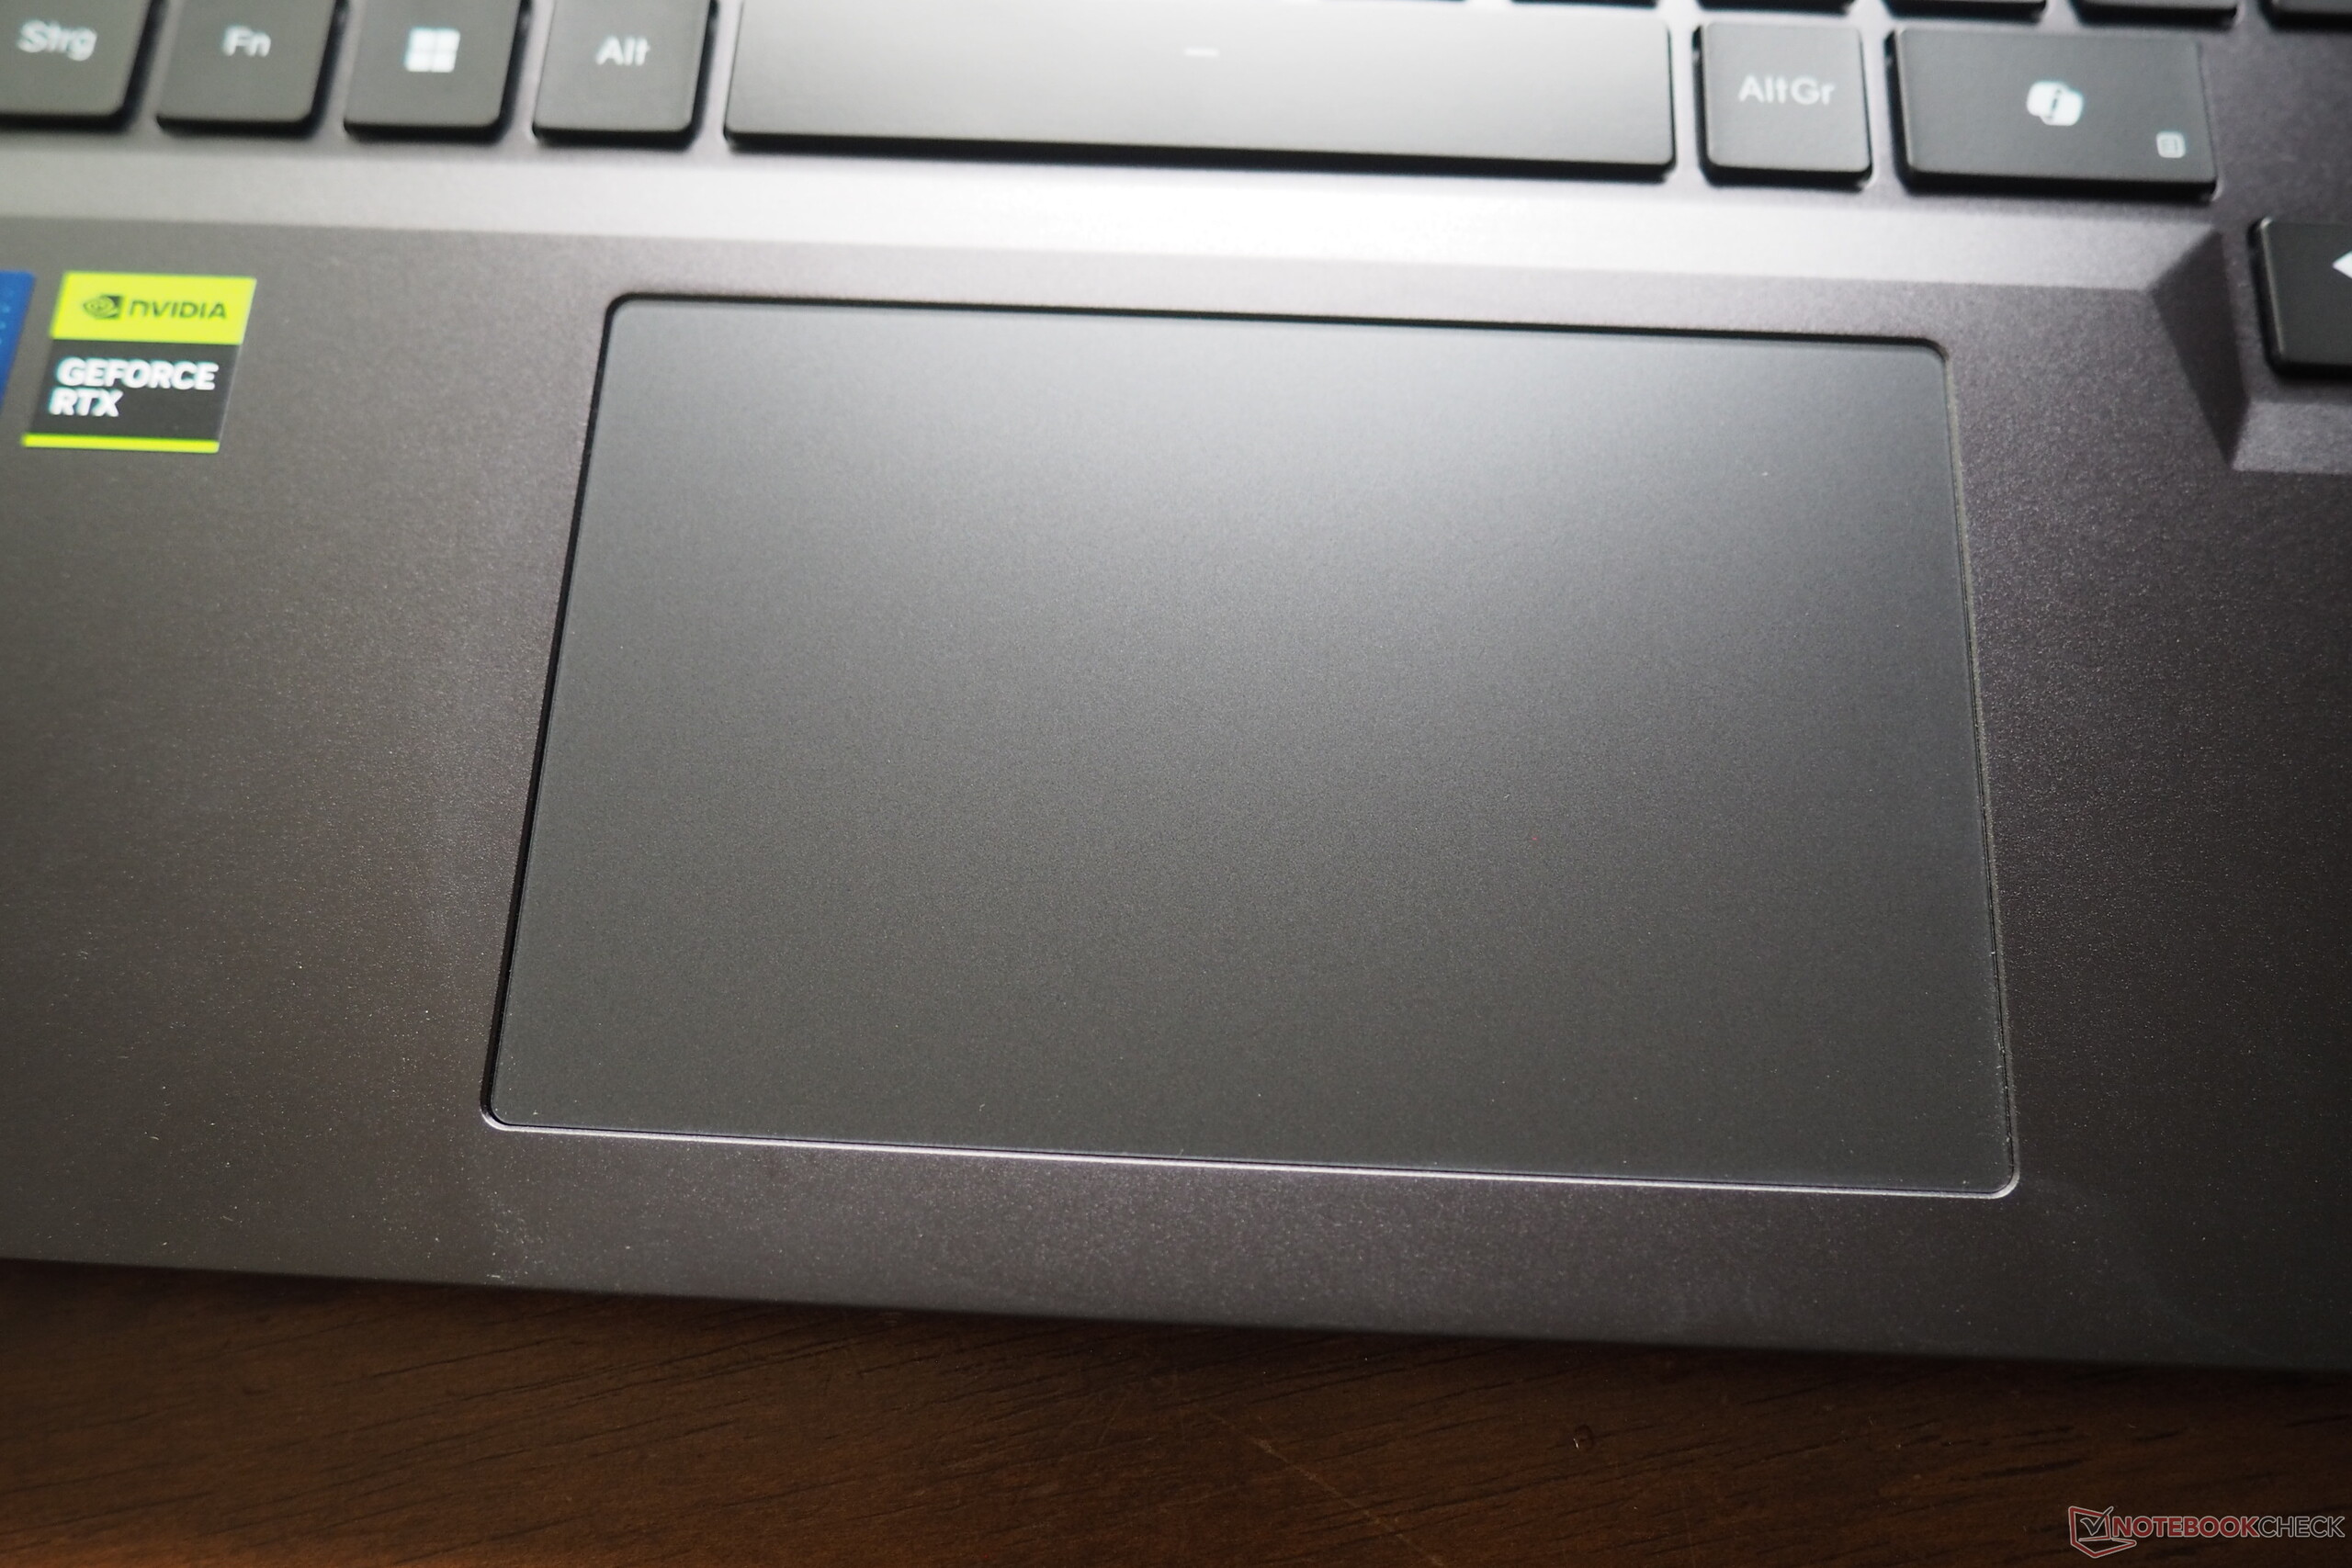
触摸板在精确度、滑动性能和手势支持等方面都非常出色。触摸板的尺寸为 12.4 x 7.6 厘米(约 4.9 x 3.0 英寸),大小适中。下边缘的点击区域触发时声音较大,但具有与键盘类似的实体(触觉)反馈。
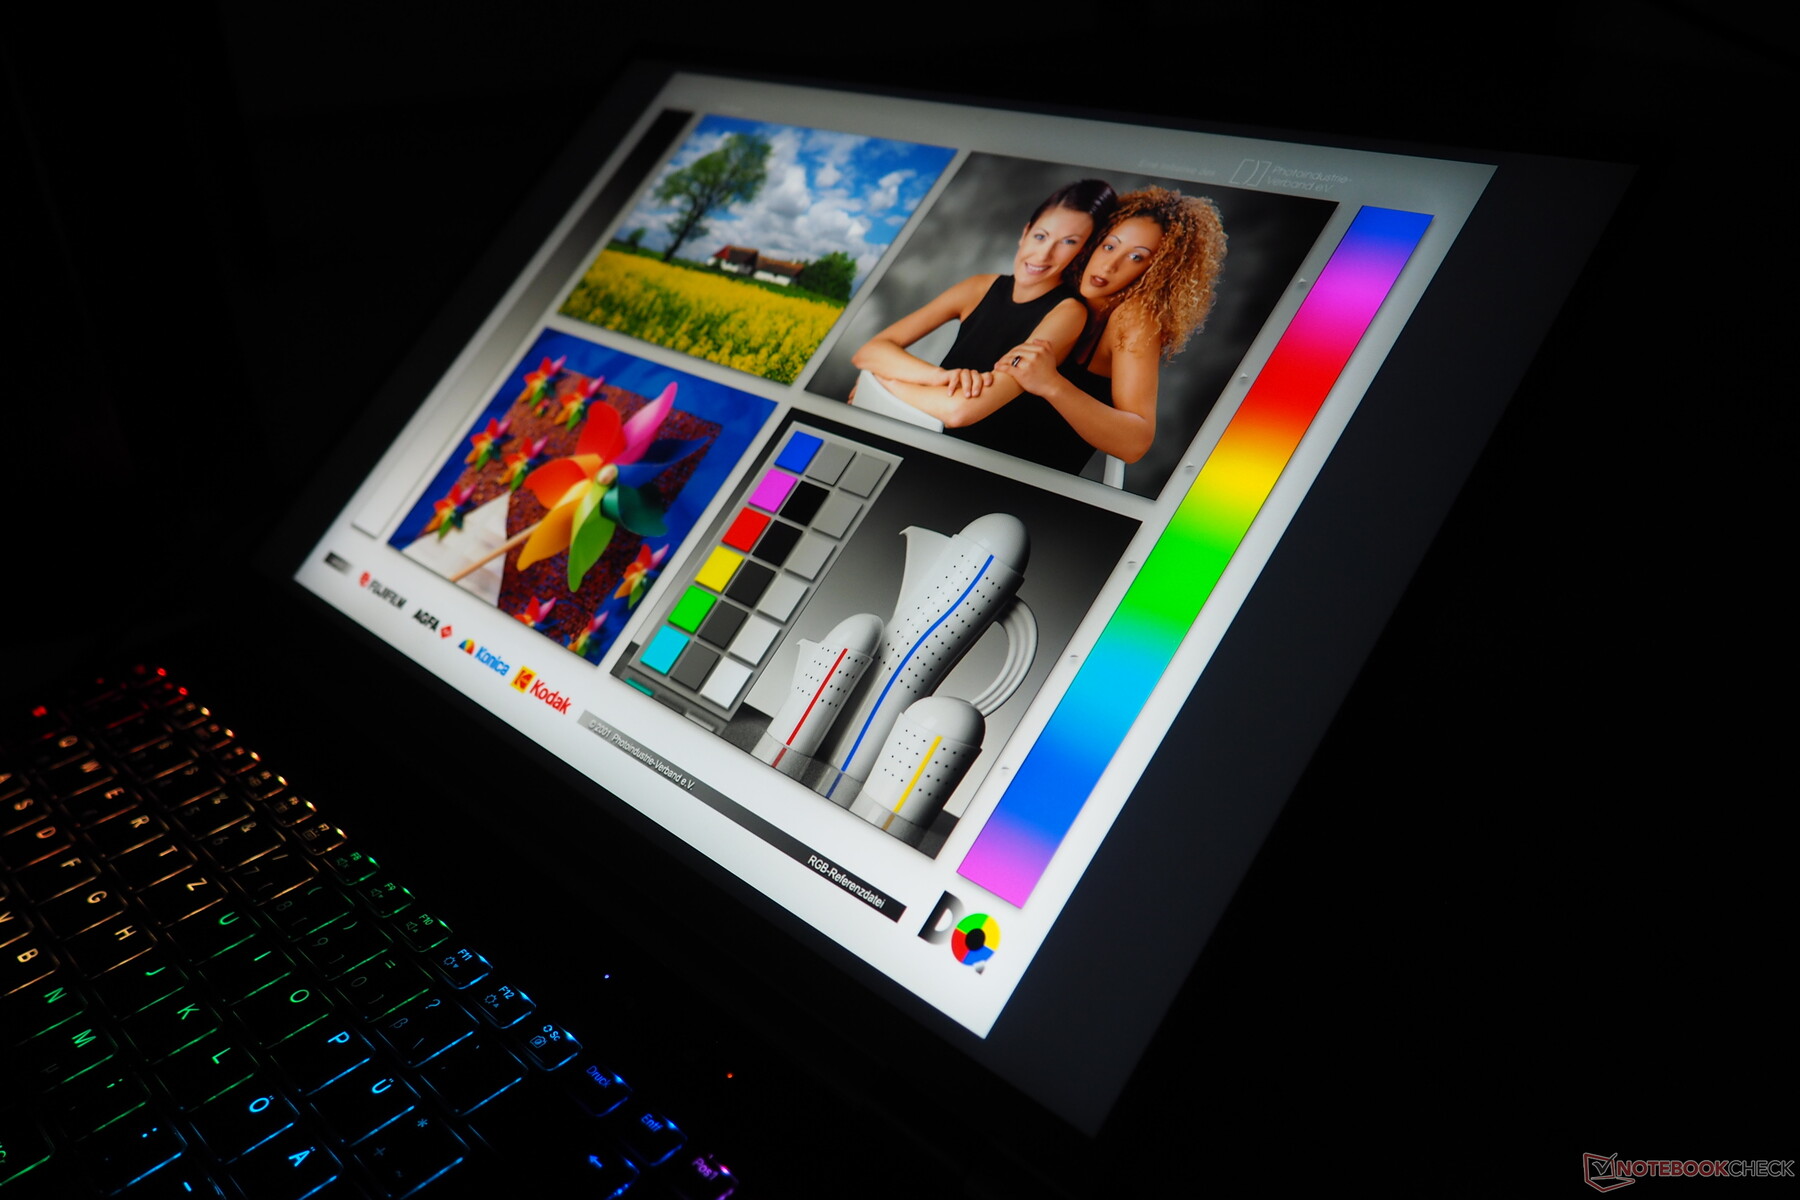
显示屏
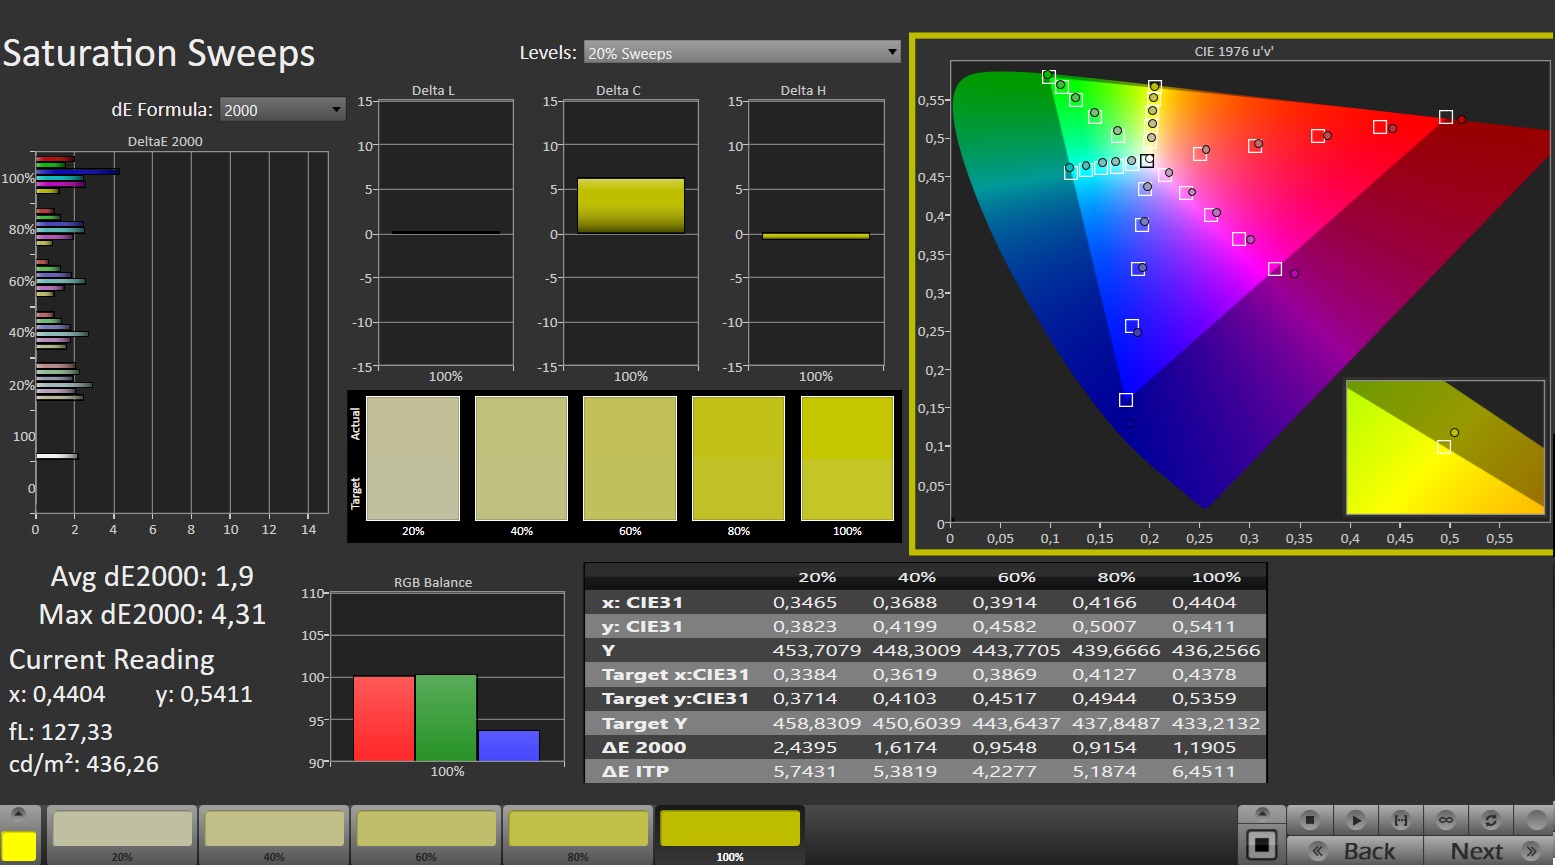
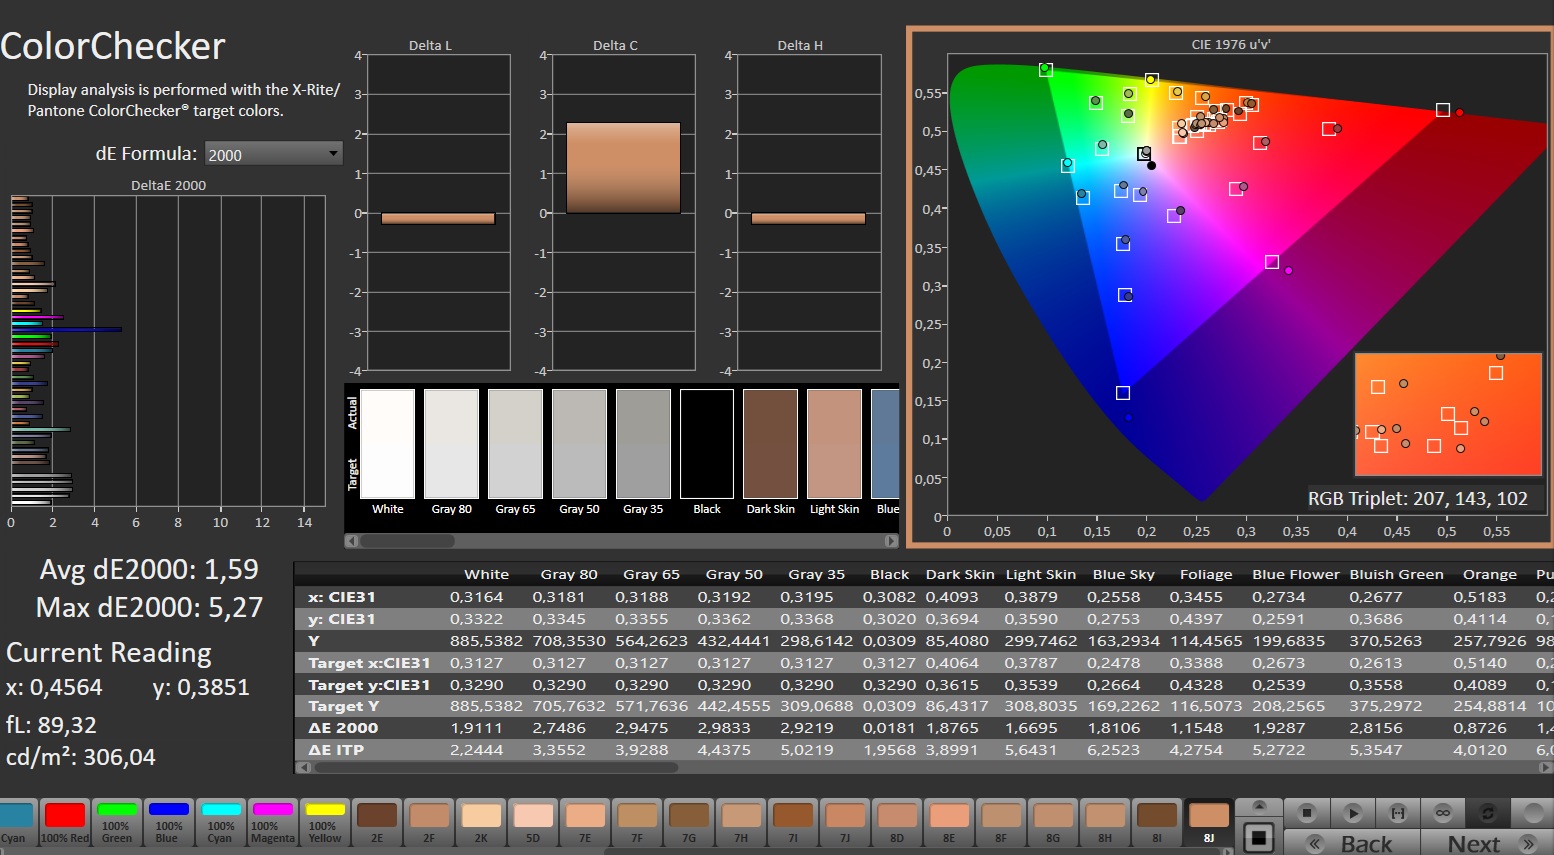
Beast 16 X1 的最大亮点之一是其一流的微型 LED 显示屏。即使开箱即用,16 英寸屏幕也能提供相当高的色彩准确度。
| |||||||||||||||||||||||||
Brightness Distribution: 94 %
Center on Battery: 837 cd/m²
Contrast: ∞:1 (Black: 0 cd/m²)
ΔE ColorChecker Calman: 1.59 | ∀{0.5-29.43 Ø4.72}
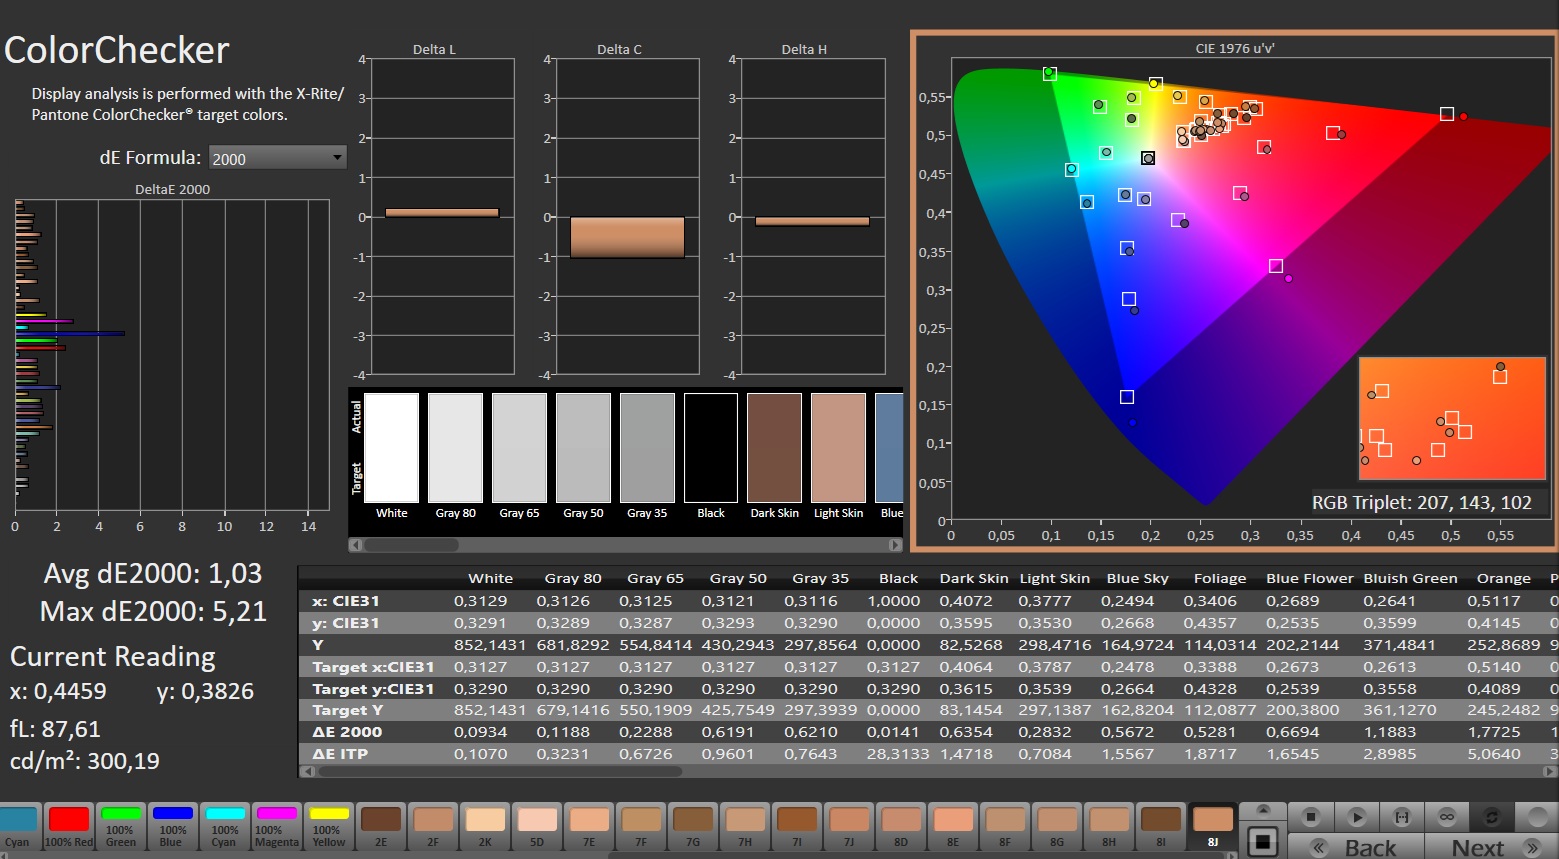
calibrated: 1.03
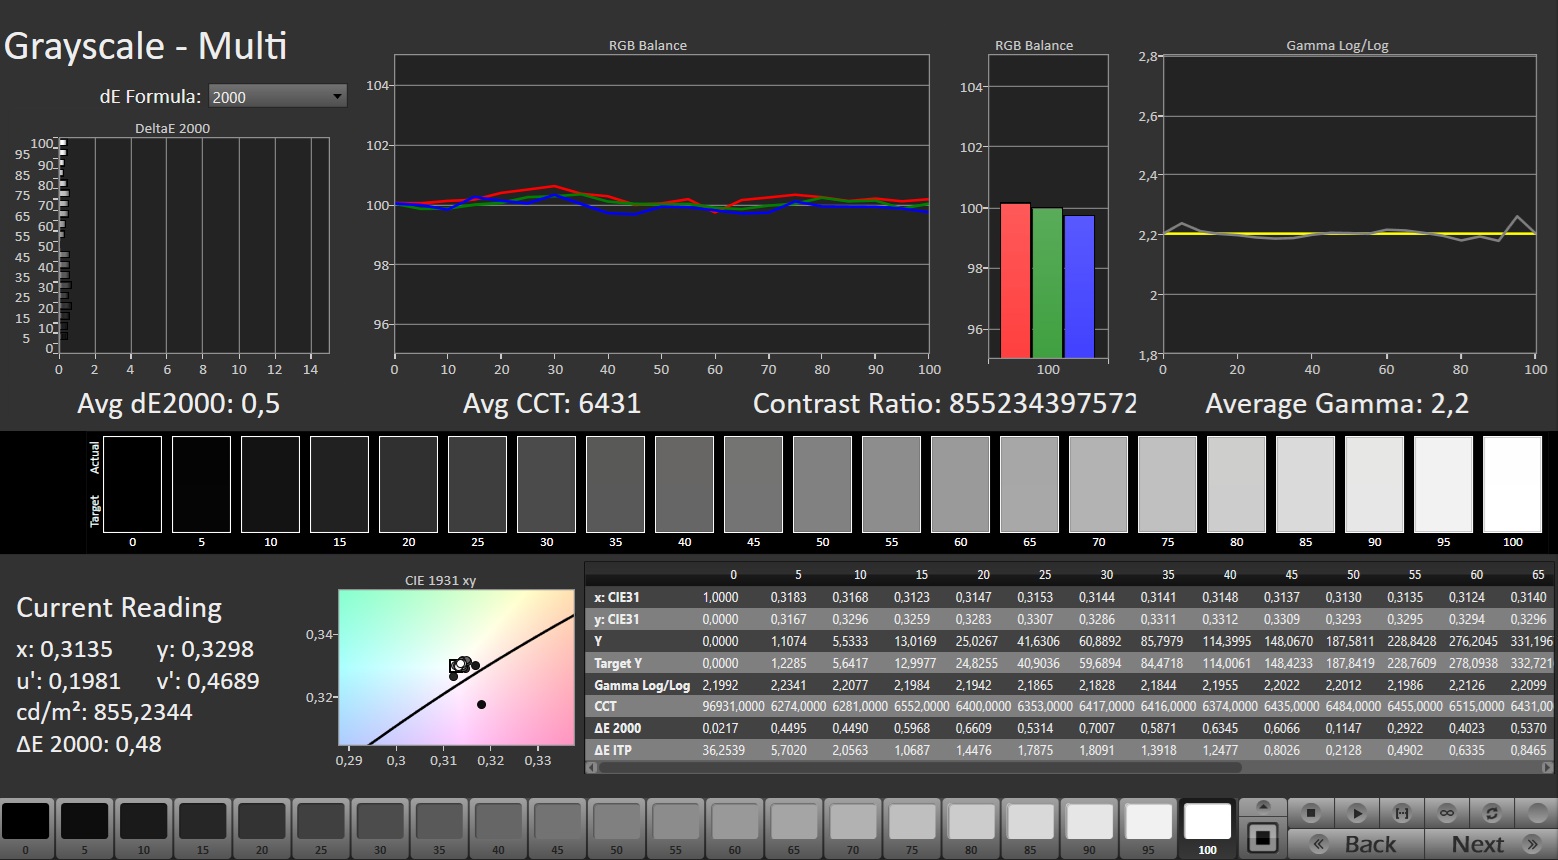
ΔE Greyscale Calman: 2.4 | ∀{0.09-98 Ø4.97}
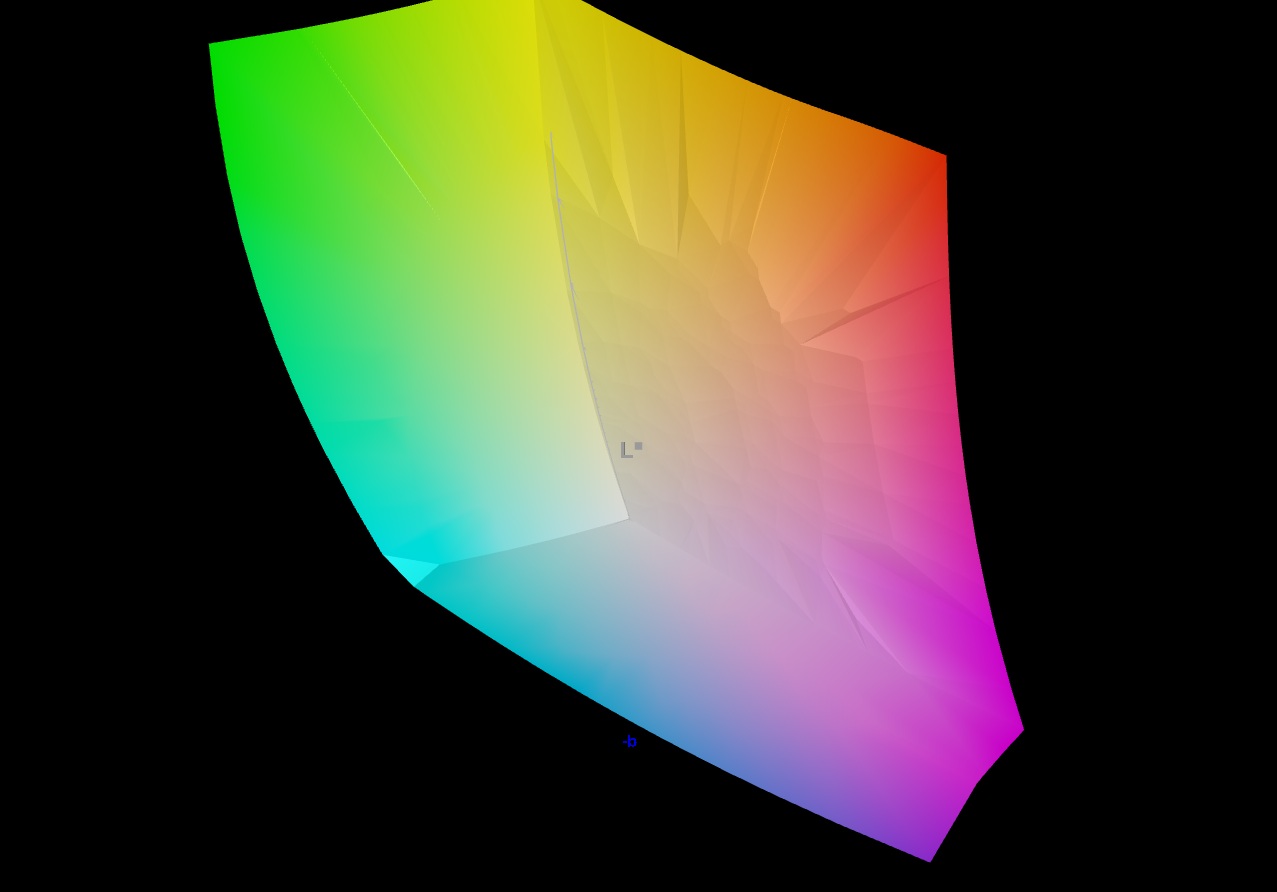
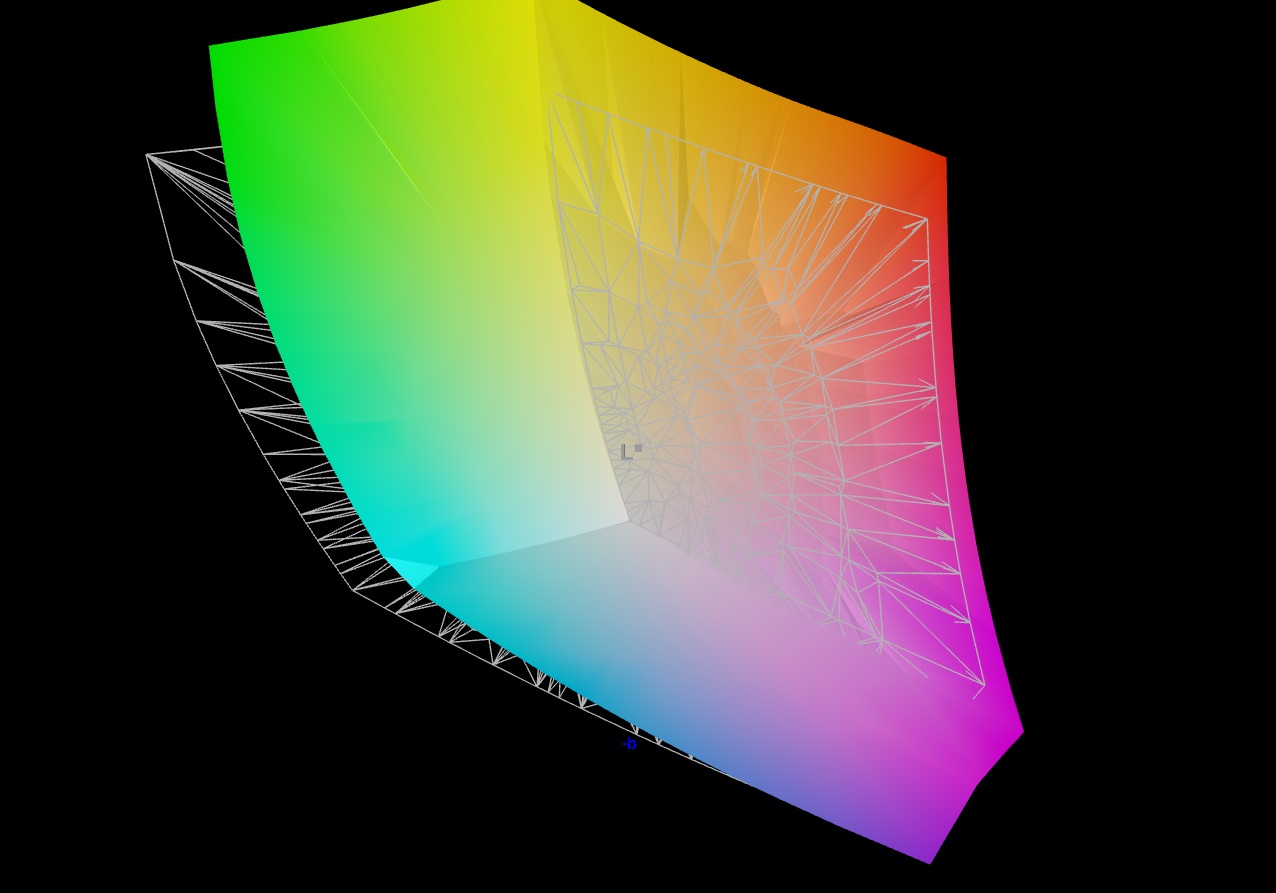
86.9% AdobeRGB 1998 (Argyll 3D)
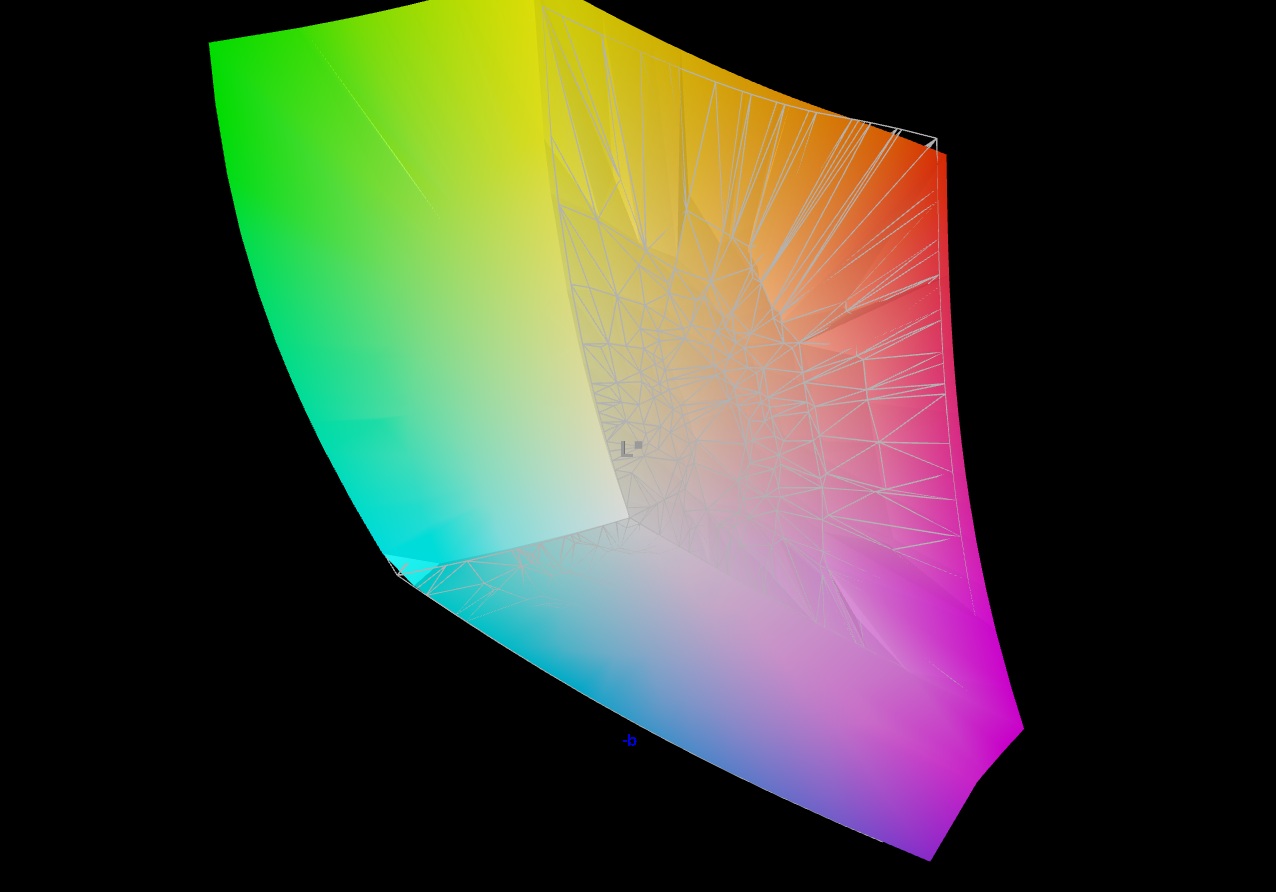
100% sRGB (Argyll 3D)
99.7% Display P3 (Argyll 3D)
Gamma: 2.214
CCT: 6186 K
| Medion Erazer Beast 16 X1 Ultimate NE160QDM-NM9 (BOE0D5A), Mini-LED, 2560x1600, 16", 300 Hz | Schenker XMG Neo 16 E25 RTX 5090 Laptop NE160QDM-NM9, Mini-LED, 2560x1600, 16", 300 Hz | HP Omen Max 16 ah000 Samsung ATNA60DL02-0, OLED, 2560x1600, 16", 240 Hz | Asus ROG Strix Scar 16 2025 NE160QDM-NM8, Mini-LED, 2560x1600, 16", 240 Hz | Lenovo Legion Pro 7i 16 Gen 10 Samsung ATNA60HU01-0, OLED, 2560x1600, 16", 240 Hz | Asus ROG Strix G16 G615 NE160QDM-NZC, IPS, 2560x1600, 16", 240 Hz | |
|---|---|---|---|---|---|---|
| Display | 1% | 4% | 1% | 3% | 1% | |
| Display P3 Coverage (%) | 99.7 | 99.9 0% | 99.7 0% | 99.9 0% | 99.5 0% | 99.1 -1% |
| sRGB Coverage (%) | 100 | 100 0% | 100 0% | 100 0% | 100 0% | 99.9 0% |
| AdobeRGB 1998 Coverage (%) | 86.9 | 88.5 2% | 98.2 13% | 88.4 2% | 94.4 9% | 89.1 3% |
| Response Times | -33% | 87% | 16% | 88% | 42% | |
| Response Time Grey 50% / Grey 80% * (ms) | 10 ? | 17.4 ? -74% | 0.29 ? 97% | 7 ? 30% | 0.28 ? 97% | 4.6 ? 54% |
| Response Time Black / White * (ms) | 8.6 ? | 13 ? -51% | 0.47 ? 95% | 8.4 ? 2% | 0.43 ? 95% | 6.1 ? 29% |
| PWM Frequency (Hz) | 20457 ? | 20253 | 960 ? | 20555 ? | 1438 ? | |
| PWM Amplitude * (%) | 100 | 75 25% | 31 69% | 29 71% | ||
| Screen | -29% | -30% | 23% | -17% | -4% | |
| Brightness middle (cd/m²) | 837 | 888 6% | 376.5 -55% | 754 -10% | 490.4 -41% | 545 -35% |
| Brightness (cd/m²) | 821 | 859 5% | 382 -53% | 773 -6% | 498 -39% | 536 -35% |
| Brightness Distribution (%) | 94 | 94 0% | 96 2% | 91 -3% | 97 3% | 89 -5% |
| Black Level * (cd/m²) | 0.07 | 0.41 | ||||
| Colorchecker dE 2000 * | 1.59 | 3.3 -108% | 3.67 -131% | 1 37% | 3.2 -101% | 1.6 -1% |
| Colorchecker dE 2000 max. * | 5.27 | 5.5 -4% | 7.24 -37% | 2 62% | 6.04 -15% | 4 24% |
| Colorchecker dE 2000 calibrated * | 1.03 | 1.5 -46% | 0.94 9% | 0.84 18% | 0.8 22% | |
| Greyscale dE 2000 * | 2.4 | 3.8 -58% | 1.1 54% | 1 58% | 1 58% | 2.4 -0% |
| Gamma | 2.214 99% | 2.46 89% | 2.25 98% | 2.14 103% | 2.24 98% | 2.25 98% |
| CCT | 6186 105% | 6267 104% | 6319 103% | 6493 100% | 6373 102% | 6737 96% |
| Contrast (:1) | 10771 | 1329 | ||||
| Total Average (Program / Settings) | -20% /
-23% | 20% /
5% | 13% /
16% | 25% /
12% | 13% /
5% |
* ... smaller is better
总体而言,100% sRGB 或 DCI-P3 和 87% AdobeRGB 的色彩空间覆盖率令人印象深刻,尽管这也适用于竞争对手的 OLED 或 IPS 面板。在亮度方面(我们在 SDR 模式下进行了测试;如果需要,也可以激活 HDR),Beast 16 X1 和 Neo 16 以平均 821 cd/m² 的亮度遥遥领先,这是一个非常出色的结果。
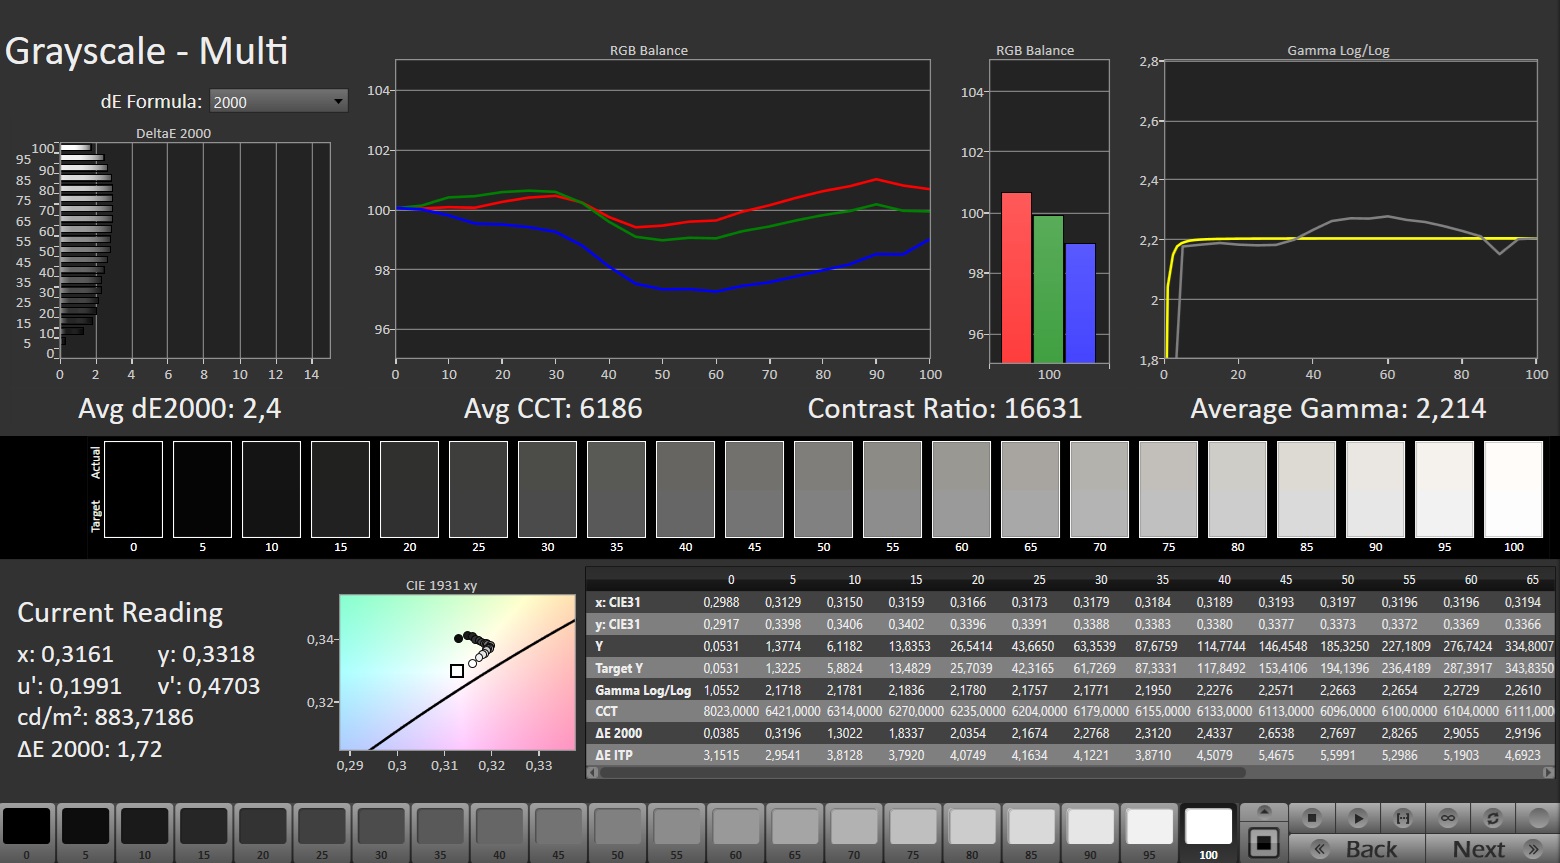
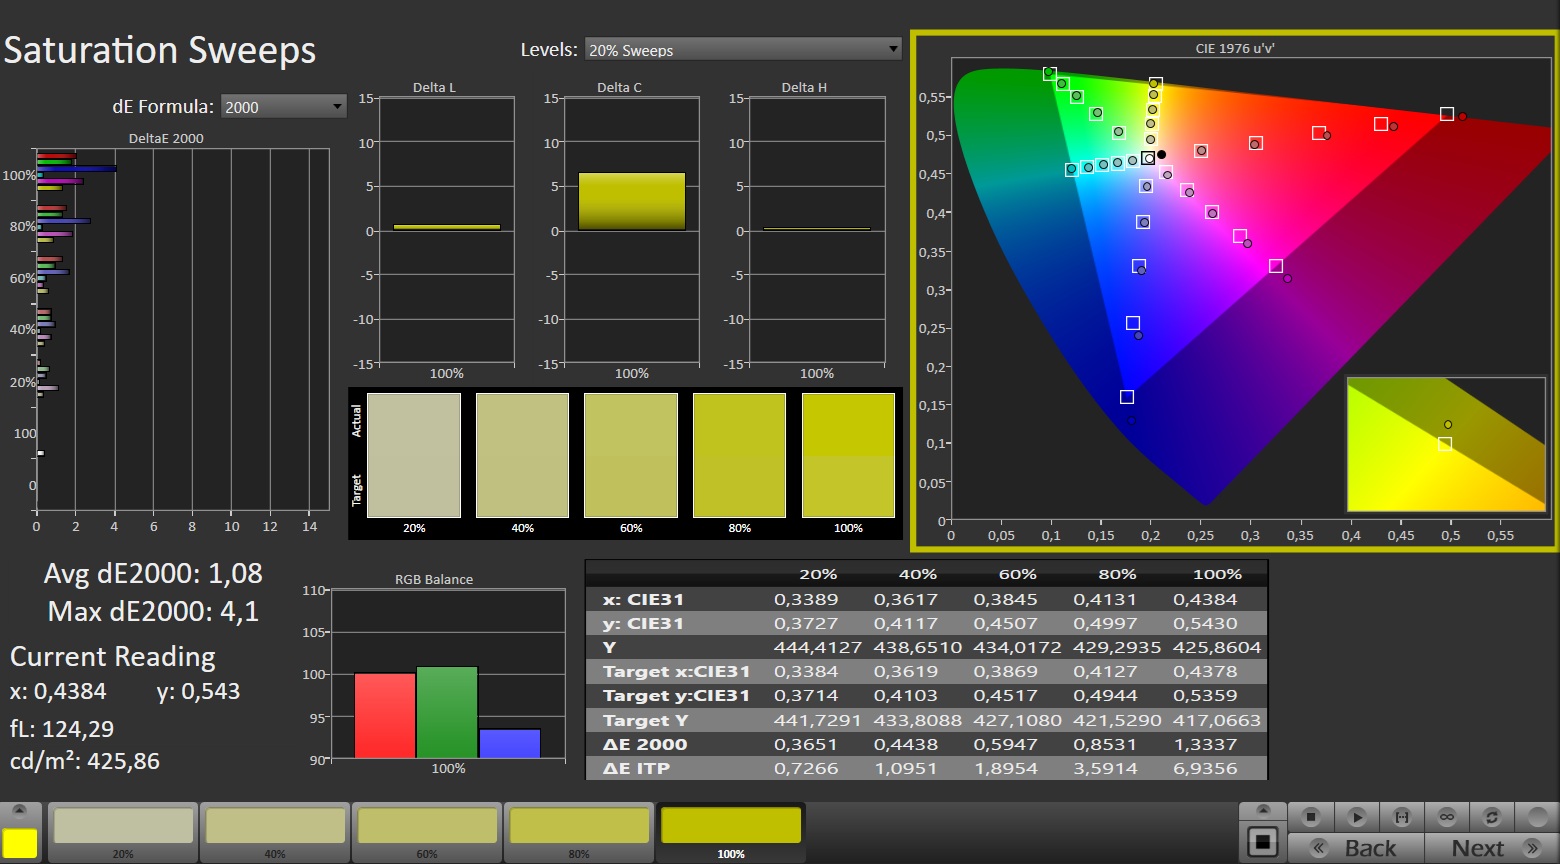
加上较低的黑阶,因此对比度极佳。响应时间与典型的 IPS 面板相当。
遗憾的是,屏幕在亮度达到 92% 时会出现闪烁。不过,由于频率很高,即使是敏感的人也不会有任何问题。

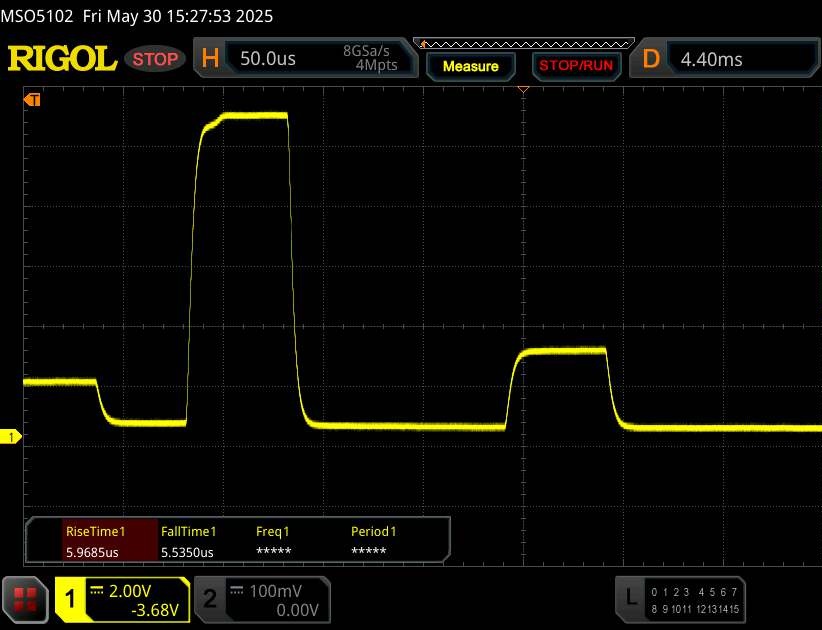
Display Response Times
| ↔ Response Time Black to White | ||
|---|---|---|
| 8.6 ms ... rise ↗ and fall ↘ combined | ↗ 4.2 ms rise | 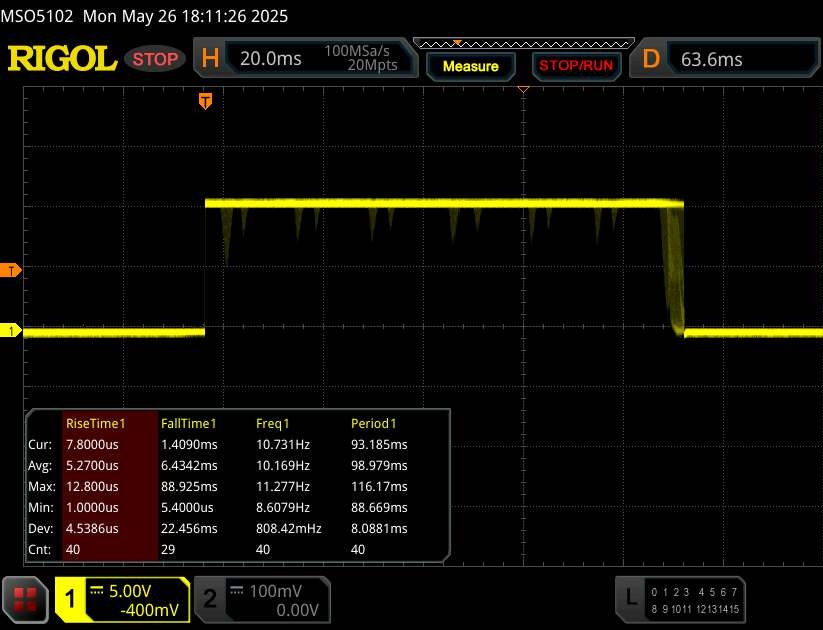 |
| ↘ 6.4 ms fall | ||
| The screen shows fast response rates in our tests and should be suited for gaming. In comparison, all tested devices range from 0.1 (minimum) to 240 (maximum) ms. » 24 % of all devices are better. This means that the measured response time is better than the average of all tested devices (19.8 ms). | ||
| ↔ Response Time 50% Grey to 80% Grey | ||
| 10 ms ... rise ↗ and fall ↘ combined | ↗ 4.7 ms rise | 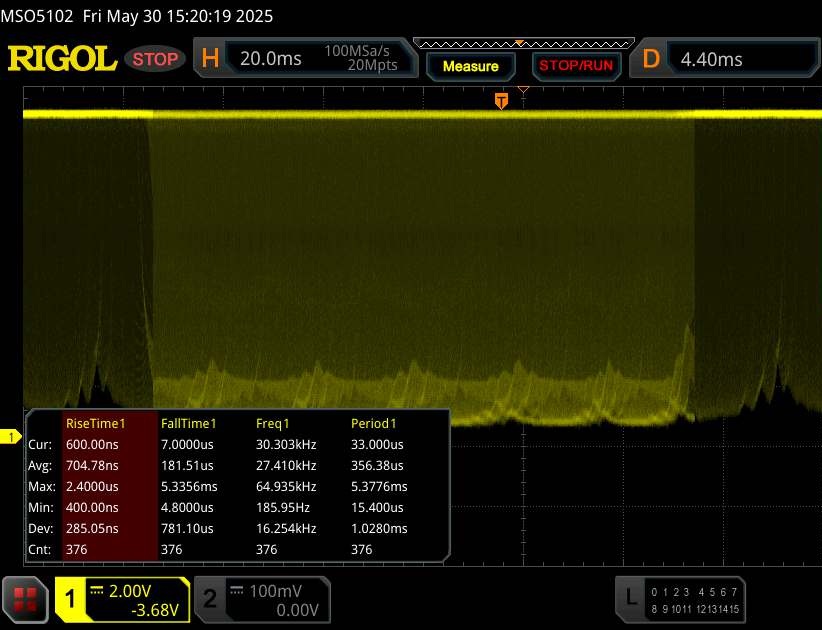 |
| ↘ 5.3 ms fall | ||
| The screen shows good response rates in our tests, but may be too slow for competitive gamers. In comparison, all tested devices range from 0.165 (minimum) to 636 (maximum) ms. » 23 % of all devices are better. This means that the measured response time is better than the average of all tested devices (31 ms). | ||
Screen Flickering / PWM (Pulse-Width Modulation)
| Screen flickering / PWM detected | 20457 Hz Amplitude: 100 % | ≤ 92 % brightness setting | 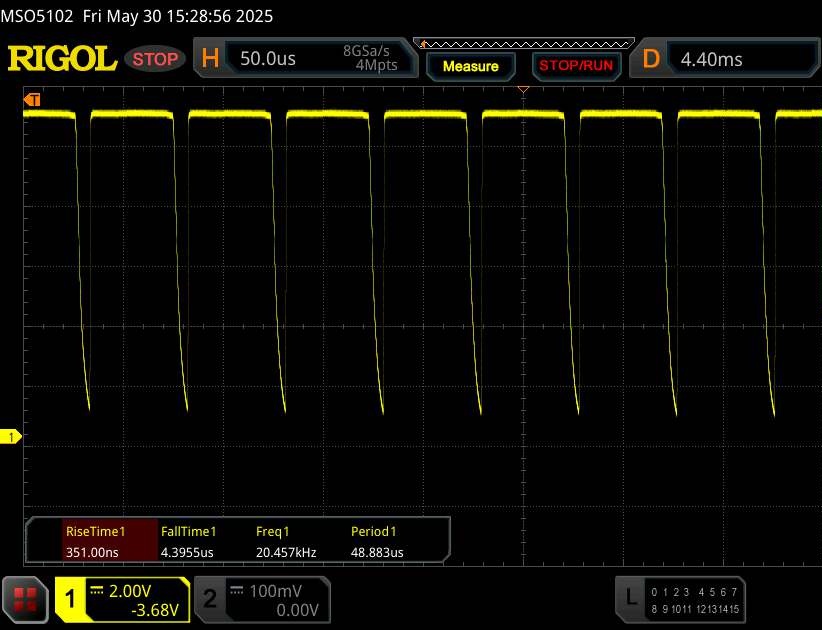 |
The display backlight flickers at 20457 Hz (worst case, e.g., utilizing PWM) Flickering detected at a brightness setting of 92 % and below. There should be no flickering or PWM above this brightness setting. The frequency of 20457 Hz is quite high, so most users sensitive to PWM should not notice any flickering. In comparison: 52 % of all tested devices do not use PWM to dim the display. If PWM was detected, an average of 7750 (minimum: 5 - maximum: 343500) Hz was measured. | |||
性能
野兽 16 X1 可配备 RTX 5090 笔记本电脑或 RTX 5080 笔记本电脑因此,无论哪种情况,它都属于高端产品。使用后一种 GPU 时,该设备的价格要低 1000 欧元(约合 1135 美元)左右,而 RTX 5090 版本的附加费则相应较高。
测试条件
实用:一个特殊的按钮(在电源按钮旁边)可用于快速切换操作模式。"静音 "亮绿色,"平衡 "亮蓝色,"游戏 "亮紫色。对噪音水平和性能的影响见下表。除电池测试外,我们的测量都是在游戏模式下完成的。Erazer 控制中心似乎还存在一个错误,它也可用于切换模式:在(重新)启动笔记本后,这里只选择了 "静音 "模式--至少在显示方面是这样。
| Erazer 控制中心模式 | 静音 | 平衡 | 游戏 |
| 赛博朋克 2077》噪音 | 42 dB(A) | 48 dB(A) | 55 dB(A) |
| 赛博朋克 2077》性能(FHD/超高清) | 83.8 帧/秒 | 148.6 帧/秒 | 158.5 帧/秒 |
| Cinebench R15 Multi Score | 3318 分数 | 4494 分数 | 6067 分数 |
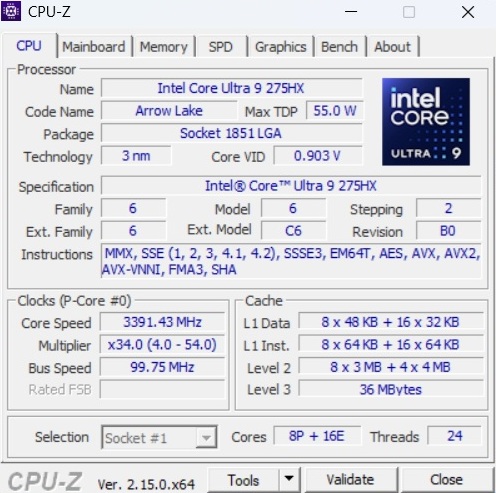
处理器
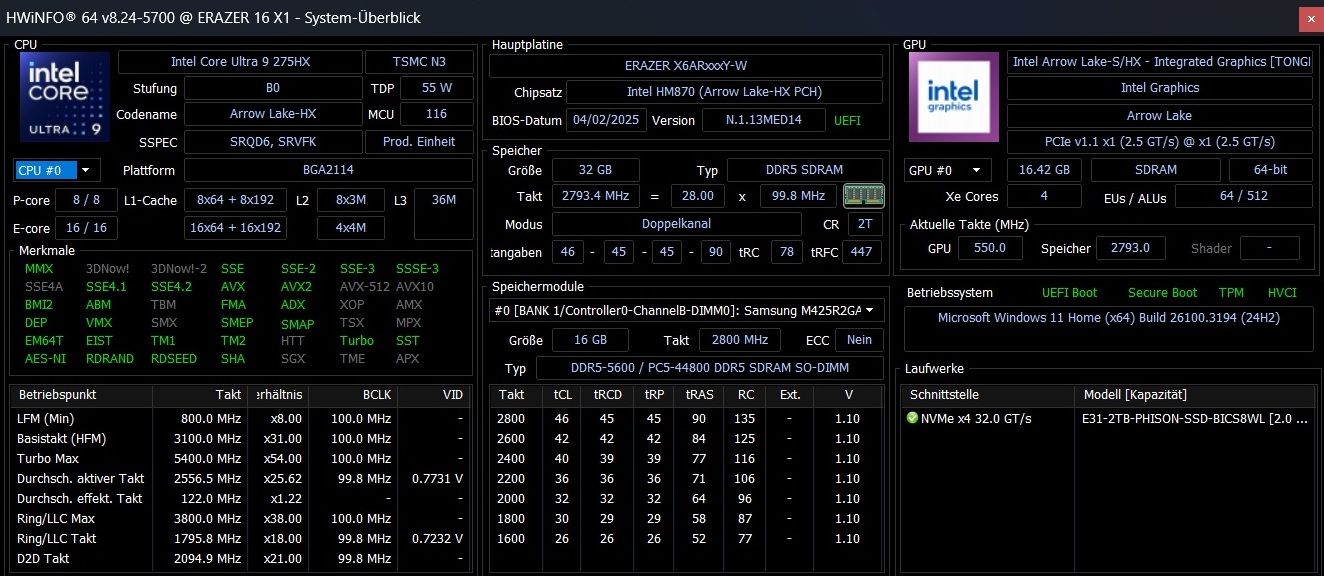
英特尔 酷睿至尊 9 275HX在 Beast 16 X1 中,来自箭湖一代的英特尔酷睿 Ultra 9 275HX 给人留下了喜忧参半的感觉。乍一看,性能达到了预期水平,在某些情况下甚至更高。然而,正如我们的 Cinebench 循环所显示的那样,在长时间负载的情况下,性能会出现下降,而竞争对手却不会出现这种情况。
Cinebench R15 Multi Endurance test
* ... smaller is better
AIDA64: FP32 Ray-Trace | FPU Julia | CPU SHA3 | CPU Queen | FPU SinJulia | FPU Mandel | CPU AES | CPU ZLib | FP64 Ray-Trace | CPU PhotoWorxx
| Performance rating | |
| Schenker XMG Neo 16 E25 RTX 5090 Laptop | |
| Asus ROG Strix Scar 16 2025 | |
| Asus ROG Strix G16 G615 | |
| Medion Erazer Beast 16 X1 Ultimate | |
| Lenovo Legion Pro 7i 16 Gen 10 | |
| Average Intel Core Ultra 9 275HX | |
| HP Omen Max 16 ah000 | |
| Average of class Gaming | |
| AIDA64 / FP32 Ray-Trace | |
| Schenker XMG Neo 16 E25 RTX 5090 Laptop | |
| Asus ROG Strix Scar 16 2025 | |
| Asus ROG Strix G16 G615 | |
| Medion Erazer Beast 16 X1 Ultimate | |
| Lenovo Legion Pro 7i 16 Gen 10 | |
| Average Intel Core Ultra 9 275HX (28039 - 39895, n=30) | |
| HP Omen Max 16 ah000 | |
| Average of class Gaming (10227 - 85542, n=103, last 2 years) | |
| AIDA64 / FPU Julia | |
| Schenker XMG Neo 16 E25 RTX 5090 Laptop | |
| Asus ROG Strix G16 G615 | |
| Asus ROG Strix Scar 16 2025 | |
| Medion Erazer Beast 16 X1 Ultimate | |
| Lenovo Legion Pro 7i 16 Gen 10 | |
| Average Intel Core Ultra 9 275HX (140254 - 200744, n=30) | |
| HP Omen Max 16 ah000 | |
| Average of class Gaming (51376 - 238426, n=103, last 2 years) | |
| AIDA64 / CPU SHA3 | |
| Schenker XMG Neo 16 E25 RTX 5090 Laptop | |
| Asus ROG Strix Scar 16 2025 | |
| Asus ROG Strix G16 G615 | |
| Medion Erazer Beast 16 X1 Ultimate | |
| Lenovo Legion Pro 7i 16 Gen 10 | |
| Average Intel Core Ultra 9 275HX (6710 - 9817, n=30) | |
| HP Omen Max 16 ah000 | |
| Average of class Gaming (2180 - 9817, n=103, last 2 years) | |
| AIDA64 / CPU Queen | |
| Schenker XMG Neo 16 E25 RTX 5090 Laptop | |
| Medion Erazer Beast 16 X1 Ultimate | |
| Asus ROG Strix Scar 16 2025 | |
| Asus ROG Strix G16 G615 | |
| Lenovo Legion Pro 7i 16 Gen 10 | |
| Average Intel Core Ultra 9 275HX (113887 - 140937, n=30) | |
| HP Omen Max 16 ah000 | |
| Average of class Gaming (49785 - 173351, n=90, last 2 years) | |
| AIDA64 / FPU SinJulia | |
| Average of class Gaming (4424 - 33636, n=103, last 2 years) | |
| Medion Erazer Beast 16 X1 Ultimate | |
| Schenker XMG Neo 16 E25 RTX 5090 Laptop | |
| Lenovo Legion Pro 7i 16 Gen 10 | |
| Asus ROG Strix Scar 16 2025 | |
| Asus ROG Strix G16 G615 | |
| Average Intel Core Ultra 9 275HX (11172 - 14425, n=30) | |
| HP Omen Max 16 ah000 | |
| AIDA64 / FPU Mandel | |
| Asus ROG Strix G16 G615 | |
| Asus ROG Strix Scar 16 2025 | |
| Schenker XMG Neo 16 E25 RTX 5090 Laptop | |
| Medion Erazer Beast 16 X1 Ultimate | |
| Lenovo Legion Pro 7i 16 Gen 10 | |
| Average Intel Core Ultra 9 275HX (72596 - 104508, n=30) | |
| HP Omen Max 16 ah000 | |
| Average of class Gaming (25115 - 128721, n=103, last 2 years) | |
| AIDA64 / CPU AES | |
| Schenker XMG Neo 16 E25 RTX 5090 Laptop | |
| Medion Erazer Beast 16 X1 Ultimate | |
| Asus ROG Strix G16 G615 | |
| Lenovo Legion Pro 7i 16 Gen 10 | |
| Asus ROG Strix Scar 16 2025 | |
| Average Intel Core Ultra 9 275HX (105608 - 247074, n=30) | |
| HP Omen Max 16 ah000 | |
| Average of class Gaming (39258 - 247074, n=103, last 2 years) | |
| AIDA64 / CPU ZLib | |
| Schenker XMG Neo 16 E25 RTX 5090 Laptop | |
| Medion Erazer Beast 16 X1 Ultimate | |
| Asus ROG Strix G16 G615 | |
| Asus ROG Strix Scar 16 2025 | |
| Lenovo Legion Pro 7i 16 Gen 10 | |
| Average Intel Core Ultra 9 275HX (1582 - 2263, n=30) | |
| HP Omen Max 16 ah000 | |
| Average of class Gaming (574 - 2531, n=103, last 2 years) | |
| AIDA64 / FP64 Ray-Trace | |
| Asus ROG Strix Scar 16 2025 | |
| Asus ROG Strix G16 G615 | |
| Schenker XMG Neo 16 E25 RTX 5090 Laptop | |
| Medion Erazer Beast 16 X1 Ultimate | |
| Lenovo Legion Pro 7i 16 Gen 10 | |
| Average Intel Core Ultra 9 275HX (14847 - 21854, n=30) | |
| HP Omen Max 16 ah000 | |
| Average of class Gaming (5509 - 45446, n=103, last 2 years) | |
| AIDA64 / CPU PhotoWorxx | |
| Asus ROG Strix Scar 16 2025 | |
| Schenker XMG Neo 16 E25 RTX 5090 Laptop | |
| Lenovo Legion Pro 7i 16 Gen 10 | |
| Average Intel Core Ultra 9 275HX (37482 - 62916, n=30) | |
| Medion Erazer Beast 16 X1 Ultimate | |
| HP Omen Max 16 ah000 | |
| Asus ROG Strix G16 G615 | |
| Average of class Gaming (12271 - 89891, n=103, last 2 years) | |
系统性能
不过,在系统性能方面,Medion 笔记本电脑的综合评分最高。
PCMark 10: Score | Essentials | Productivity | Digital Content Creation
CrossMark: Overall | Productivity | Creativity | Responsiveness
WebXPRT 3: Overall
WebXPRT 4: Overall
Mozilla Kraken 1.1: Total
| Performance rating | |
| Schenker XMG Neo 16 E25 RTX 5090 Laptop | |
| Asus ROG Strix G16 G615 | |
| Average Intel Core Ultra 9 275HX, NVIDIA GeForce RTX 5090 Laptop | |
| Asus ROG Strix Scar 16 2025 | |
| Medion Erazer Beast 16 X1 Ultimate | |
| Lenovo Legion Pro 7i 16 Gen 10 | |
| HP Omen Max 16 ah000 -1! | |
| Average of class Gaming | |
| PCMark 10 / Score | |
| Lenovo Legion Pro 7i 16 Gen 10 | |
| Schenker XMG Neo 16 E25 RTX 5090 Laptop | |
| Asus ROG Strix G16 G615 | |
| Asus ROG Strix Scar 16 2025 | |
| HP Omen Max 16 ah000 | |
| Average Intel Core Ultra 9 275HX, NVIDIA GeForce RTX 5090 Laptop (7474 - 9497, n=11) | |
| Medion Erazer Beast 16 X1 Ultimate | |
| Average of class Gaming (5828 - 11574, n=92, last 2 years) | |
| PCMark 10 / Essentials | |
| Medion Erazer Beast 16 X1 Ultimate | |
| Lenovo Legion Pro 7i 16 Gen 10 | |
| Asus ROG Strix G16 G615 | |
| Schenker XMG Neo 16 E25 RTX 5090 Laptop | |
| Asus ROG Strix Scar 16 2025 | |
| HP Omen Max 16 ah000 | |
| Average Intel Core Ultra 9 275HX, NVIDIA GeForce RTX 5090 Laptop (9994 - 11369, n=12) | |
| Average of class Gaming (8810 - 11935, n=96, last 2 years) | |
| PCMark 10 / Productivity | |
| Average of class Gaming (6845 - 21327, n=94, last 2 years) | |
| Average Intel Core Ultra 9 275HX, NVIDIA GeForce RTX 5090 Laptop (9122 - 10925, n=11) | |
| Lenovo Legion Pro 7i 16 Gen 10 | |
| Medion Erazer Beast 16 X1 Ultimate | |
| Schenker XMG Neo 16 E25 RTX 5090 Laptop | |
| Asus ROG Strix G16 G615 | |
| Asus ROG Strix Scar 16 2025 | |
| HP Omen Max 16 ah000 | |
| PCMark 10 / Digital Content Creation | |
| Lenovo Legion Pro 7i 16 Gen 10 | |
| Schenker XMG Neo 16 E25 RTX 5090 Laptop | |
| HP Omen Max 16 ah000 | |
| Asus ROG Strix G16 G615 | |
| Asus ROG Strix Scar 16 2025 | |
| Average Intel Core Ultra 9 275HX, NVIDIA GeForce RTX 5090 Laptop (9952 - 19234, n=11) | |
| Medion Erazer Beast 16 X1 Ultimate | |
| Average of class Gaming (7602 - 19657, n=94, last 2 years) | |
| CrossMark / Overall | |
| Schenker XMG Neo 16 E25 RTX 5090 Laptop | |
| Medion Erazer Beast 16 X1 Ultimate | |
| Average Intel Core Ultra 9 275HX, NVIDIA GeForce RTX 5090 Laptop (1995 - 2339, n=12) | |
| Asus ROG Strix G16 G615 | |
| Asus ROG Strix Scar 16 2025 | |
| Lenovo Legion Pro 7i 16 Gen 10 | |
| HP Omen Max 16 ah000 | |
| Average of class Gaming (1366 - 2409, n=93, last 2 years) | |
| CrossMark / Productivity | |
| Schenker XMG Neo 16 E25 RTX 5090 Laptop | |
| Medion Erazer Beast 16 X1 Ultimate | |
| Average Intel Core Ultra 9 275HX, NVIDIA GeForce RTX 5090 Laptop (1847 - 2211, n=12) | |
| Asus ROG Strix G16 G615 | |
| Asus ROG Strix Scar 16 2025 | |
| Lenovo Legion Pro 7i 16 Gen 10 | |
| Average of class Gaming (1386 - 2254, n=93, last 2 years) | |
| HP Omen Max 16 ah000 | |
| CrossMark / Creativity | |
| Schenker XMG Neo 16 E25 RTX 5090 Laptop | |
| Medion Erazer Beast 16 X1 Ultimate | |
| Asus ROG Strix Scar 16 2025 | |
| Average Intel Core Ultra 9 275HX, NVIDIA GeForce RTX 5090 Laptop (2170 - 2642, n=12) | |
| Asus ROG Strix G16 G615 | |
| Lenovo Legion Pro 7i 16 Gen 10 | |
| HP Omen Max 16 ah000 | |
| Average of class Gaming (1343 - 2729, n=93, last 2 years) | |
| CrossMark / Responsiveness | |
| Average Intel Core Ultra 9 275HX, NVIDIA GeForce RTX 5090 Laptop (1673 - 2217, n=12) | |
| Schenker XMG Neo 16 E25 RTX 5090 Laptop | |
| Asus ROG Strix G16 G615 | |
| Medion Erazer Beast 16 X1 Ultimate | |
| Average of class Gaming (1226 - 2334, n=93, last 2 years) | |
| Asus ROG Strix Scar 16 2025 | |
| HP Omen Max 16 ah000 | |
| Lenovo Legion Pro 7i 16 Gen 10 | |
| WebXPRT 3 / Overall | |
| HP Omen Max 16 ah000 | |
| Lenovo Legion Pro 7i 16 Gen 10 | |
| Schenker XMG Neo 16 E25 RTX 5090 Laptop | |
| Asus ROG Strix G16 G615 | |
| Average Intel Core Ultra 9 275HX, NVIDIA GeForce RTX 5090 Laptop (315 - 372, n=12) | |
| Asus ROG Strix Scar 16 2025 | |
| Medion Erazer Beast 16 X1 Ultimate | |
| Average of class Gaming (220 - 532, n=97, last 2 years) | |
| WebXPRT 4 / Overall | |
| Asus ROG Strix Scar 16 2025 | |
| Asus ROG Strix G16 G615 | |
| Medion Erazer Beast 16 X1 Ultimate | |
| Lenovo Legion Pro 7i 16 Gen 10 | |
| Schenker XMG Neo 16 E25 RTX 5090 Laptop | |
| Average Intel Core Ultra 9 275HX, NVIDIA GeForce RTX 5090 Laptop (301 - 341, n=11) | |
| Average of class Gaming (165 - 354, n=97, last 2 years) | |
| Mozilla Kraken 1.1 / Total | |
| Average of class Gaming (391 - 590, n=99, last 2 years) | |
| HP Omen Max 16 ah000 | |
| Asus ROG Strix Scar 16 2025 | |
| Average Intel Core Ultra 9 275HX, NVIDIA GeForce RTX 5090 Laptop (402 - 424, n=12) | |
| Medion Erazer Beast 16 X1 Ultimate | |
| Lenovo Legion Pro 7i 16 Gen 10 | |
| Asus ROG Strix G16 G615 | |
| Schenker XMG Neo 16 E25 RTX 5090 Laptop | |
* ... smaller is better
| PCMark 10 Score | 8518 points | |
Help | ||
| AIDA64 / Memory Copy | |
| Schenker XMG Neo 16 E25 RTX 5090 Laptop | |
| Asus ROG Strix G16 G615 | |
| Lenovo Legion Pro 7i 16 Gen 10 | |
| Asus ROG Strix Scar 16 2025 | |
| Medion Erazer Beast 16 X1 Ultimate | |
| Average Intel Core Ultra 9 275HX (56003 - 94460, n=30) | |
| HP Omen Max 16 ah000 | |
| Average of class Gaming (21750 - 129946, n=103, last 2 years) | |
| AIDA64 / Memory Read | |
| Schenker XMG Neo 16 E25 RTX 5090 Laptop | |
| Lenovo Legion Pro 7i 16 Gen 10 | |
| Asus ROG Strix Scar 16 2025 | |
| Medion Erazer Beast 16 X1 Ultimate | |
| Average Intel Core Ultra 9 275HX (55795 - 97151, n=30) | |
| HP Omen Max 16 ah000 | |
| Asus ROG Strix G16 G615 | |
| Average of class Gaming (22956 - 118858, n=103, last 2 years) | |
| AIDA64 / Memory Write | |
| Schenker XMG Neo 16 E25 RTX 5090 Laptop | |
| Lenovo Legion Pro 7i 16 Gen 10 | |
| Asus ROG Strix Scar 16 2025 | |
| Average Intel Core Ultra 9 275HX (55663 - 116129, n=30) | |
| HP Omen Max 16 ah000 | |
| Medion Erazer Beast 16 X1 Ultimate | |
| Average of class Gaming (22297 - 135096, n=103, last 2 years) | |
| Asus ROG Strix G16 G615 | |
| AIDA64 / Memory Latency | |
| HP Omen Max 16 ah000 | |
| Average Intel Core Ultra 9 275HX (105.8 - 161.6, n=30) | |
| Asus ROG Strix G16 G615 | |
| Asus ROG Strix Scar 16 2025 | |
| Medion Erazer Beast 16 X1 Ultimate | |
| Lenovo Legion Pro 7i 16 Gen 10 | |
| Schenker XMG Neo 16 E25 RTX 5090 Laptop | |
| Average of class Gaming (75.3 - 259, n=103, last 2 years) | |
* ... smaller is better
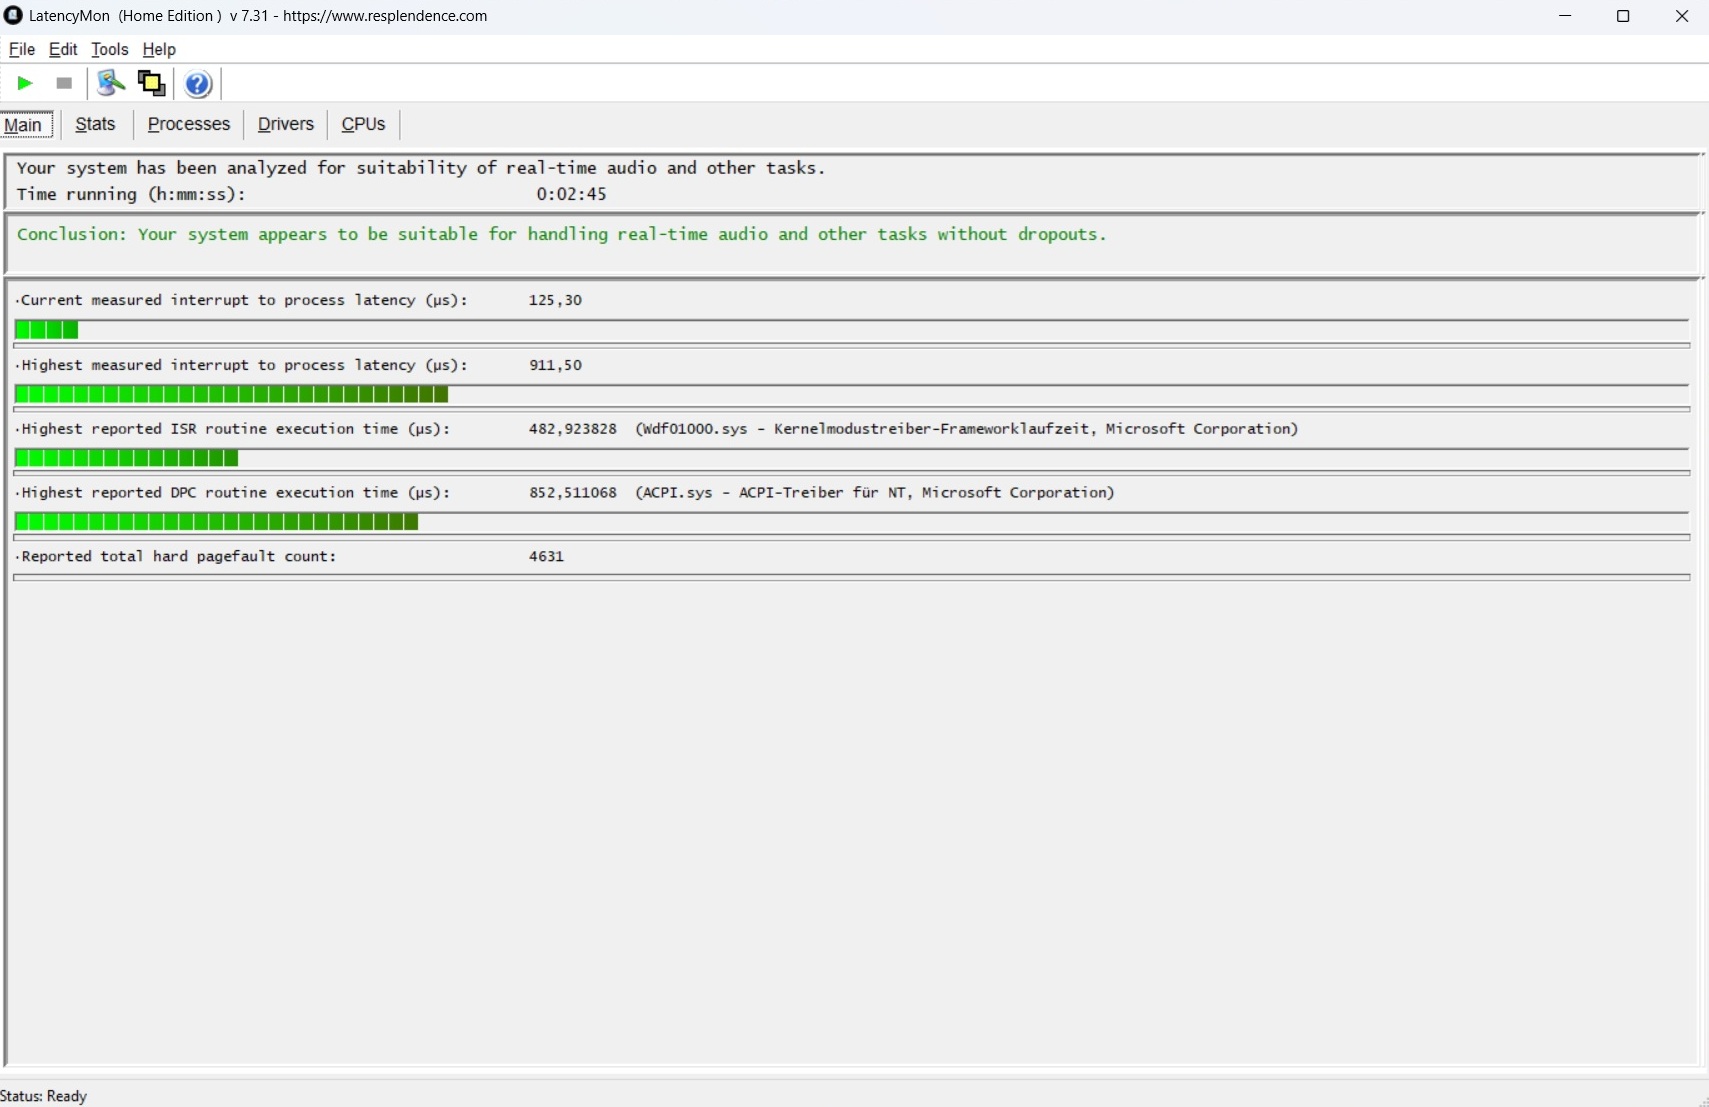
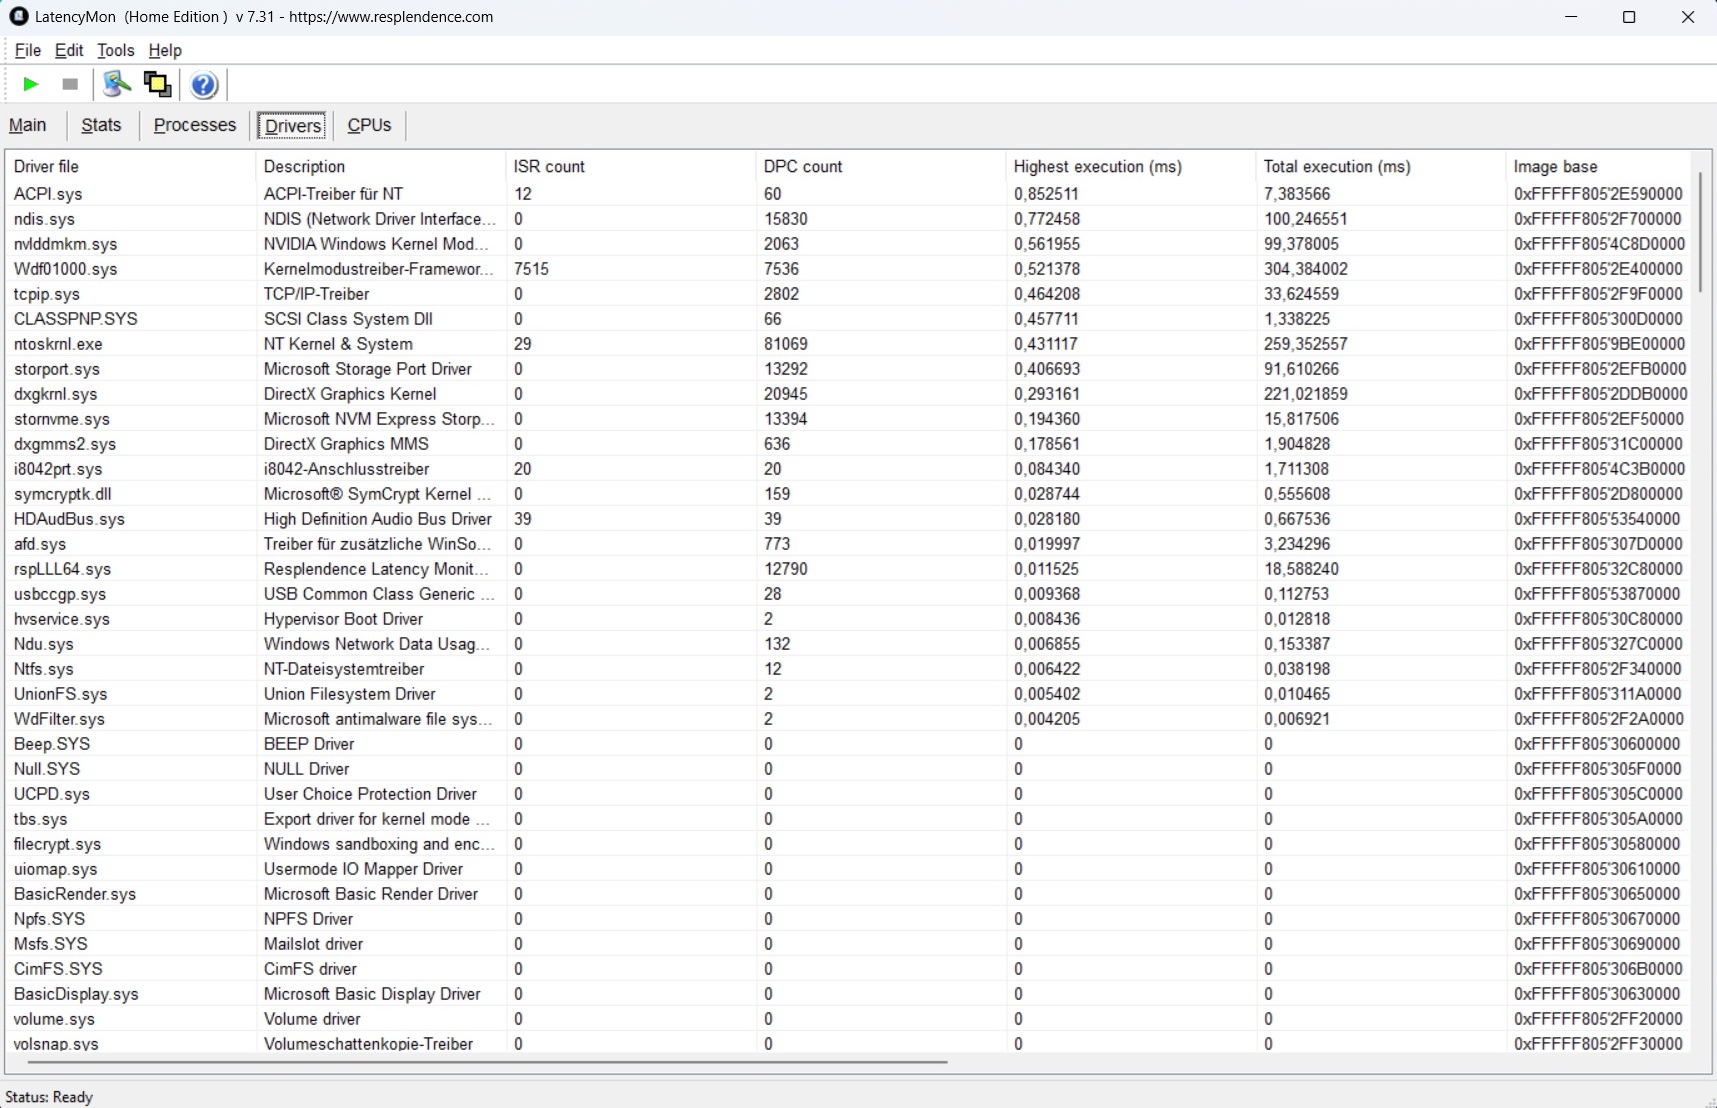
DPC 延迟
延迟也没有引起任何抱怨。根据 LatencyMon 工具,实时音频和视频处理应该没有问题。
| DPC Latencies / LatencyMon - interrupt to process latency (max), Web, Youtube, Prime95 | |
| Asus ROG Strix Scar 16 2025 | |
| HP Omen Max 16 ah000 | |
| Asus ROG Strix G16 G615 | |
| Schenker XMG Neo 16 E25 RTX 5090 Laptop | |
| Medion Erazer Beast 16 X1 Ultimate | |
| Lenovo Legion Pro 7i 16 Gen 10 | |
* ... smaller is better
大容量存储器
大容量存储也令人印象深刻。从顺序上看,Phison 内置的 PCIe 5 硬盘最高可达到约 10,000 MB/s,不过你也可以期待 4 TB 的型号,而不是 2 TB 的价格。顶部:与 CPU 性能相比,固态硬盘的性能保持稳定。

* ... smaller is better
Continuous Power: DiskSpd Read Loop, Queue Depth 8
图形处理器性能
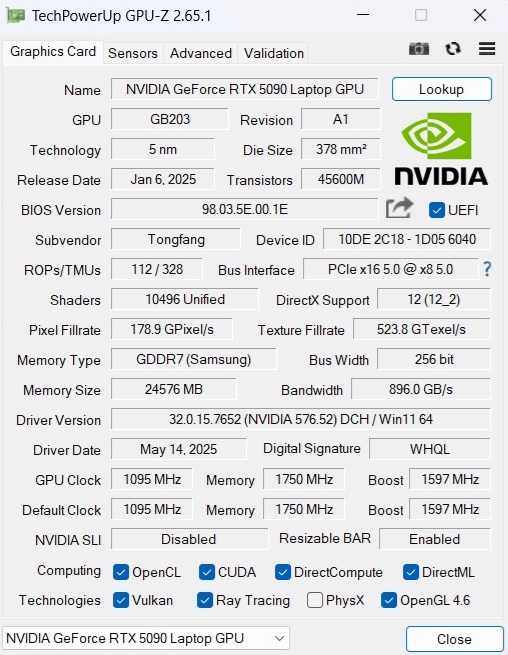
与 RTX 5080 相比,RTX 5090 提供了完整的 24 GB GDDR7 VRAM,而不是 16 GB。在 GPU 测试中,Beast 16 X1 提供了非常出色的性能,经常领先竞争对手或之前确定的 RTX 5090 平均值几个百分点。不过,从对手的情况来看,RTX 5080 只落后了一部分。
| 3DMark 11 Performance | 54178 points | |
| 3DMark Cloud Gate Standard Score | 75355 points | |
| 3DMark Fire Strike Score | 42189 points | |
| 3DMark Time Spy Score | 22368 points | |
Help | ||
游戏性能
游戏测试中的情况也类似。在这里,RTX 5090 的性能有时也勉强快于 RTX 5080,尤其是在中等分辨率(全高清)下。
| Stalker 2 | |
| 2560x1440 Epic Preset | |
| Average NVIDIA GeForce RTX 5090 Laptop (59.8 - 110.7, n=3) | |
| Medion Erazer Beast 16 X1 Ultimate | |
| Aorus Master 18 AM8H | |
| Average of class Gaming (29 - 110.7, n=13, last 2 years) | |
| 2560x1440 Epic Preset + Quality DLSS + FG | |
| Medion Erazer Beast 16 X1 Ultimate | |
| Average NVIDIA GeForce RTX 5090 Laptop (124.9 - 134.6, n=2) | |
| Aorus Master 18 AM8H | |
| Average of class Gaming (58.3 - 134.6, n=12, last 2 years) | |
| Doom: The Dark Ages | |
| 2560x1440 Ultra Nightmare AA:T | |
| Average NVIDIA GeForce RTX 5090 Laptop (77 - 92.2, n=3) | |
| Medion Erazer Beast 16 X1 Ultimate | |
| Asus ROG Strix G16 G615 | |
| Average of class Gaming (30.4 - 92.2, n=19, last 2 years) | |
| 2560x1440 Ultra Nightmare - DLSS Quality | |
| Medion Erazer Beast 16 X1 Ultimate | |
| Average NVIDIA GeForce RTX 5090 Laptop (102.3 - 107.3, n=2) | |
| Asus ROG Strix G16 G615 | |
| Average of class Gaming (48 - 107.3, n=18, last 2 years) | |
| F1 25 | |
| 2560x1440 Ultra Max Preset AA:T AF:16x | |
| Medion Erazer Beast 16 X1 Ultimate | |
| Average NVIDIA GeForce RTX 5090 Laptop (30.2 - 37.5, n=8) | |
| Average of class Gaming (5 - 37.5, n=24, last 2 years) | |
| 2560x1440 Ultra Max Preset + DLSS Quality AA:DLSS AF:16x | |
| Medion Erazer Beast 16 X1 Ultimate | |
| Average NVIDIA GeForce RTX 5090 Laptop (51.8 - 67.5, n=6) | |
| Average of class Gaming (9 - 67.5, n=22, last 2 years) | |
| The Elder Scrolls IV Oblivion Remastered | |
| 2560x1440 Ultra Preset AA:T | |
| Average NVIDIA GeForce RTX 5090 Laptop (41.7 - 45.9, n=2) | |
| Medion Erazer Beast 16 X1 Ultimate | |
| Average of class Gaming (12.7 - 45.9, n=14, last 2 years) | |
| 2560x1440 Ultra Preset + Quality DLSS | |
| Medion Erazer Beast 16 X1 Ultimate | |
| Average NVIDIA GeForce RTX 5090 Laptop (n=1) | |
| Average of class Gaming (25.3 - 59.7, n=12, last 2 years) | |
| Kingdom Come Deliverance 2 | |
| 2560x1440 Ultra Preset | |
| Average NVIDIA GeForce RTX 5090 Laptop (82.6 - 97.2, n=3) | |
| Medion Erazer Beast 16 X1 Ultimate | |
| Aorus Master 18 AM8H | |
| Average of class Gaming (36.8 - 97.2, n=13, last 2 years) | |
| 2560x1440 Ultra Preset + Quality DLSS | |
| Medion Erazer Beast 16 X1 Ultimate | |
| Average NVIDIA GeForce RTX 5090 Laptop (98.7 - 115.5, n=3) | |
| Aorus Master 18 AM8H | |
| Average of class Gaming (50.3 - 115.5, n=13, last 2 years) | |
| Until Dawn | |
| 2560x1440 Ultra Preset | |
| Average NVIDIA GeForce RTX 5090 Laptop (65.6 - 76.6, n=3) | |
| Medion Erazer Beast 16 X1 Ultimate | |
| Aorus Master 18 AM8H | |
| Average of class Gaming (30.4 - 76.6, n=11, last 2 years) | |
| 2560x1440 Ultra Preset + Quality DLSS + Ray Tracing | |
| Medion Erazer Beast 16 X1 Ultimate | |
| Average NVIDIA GeForce RTX 5090 Laptop (79.7 - 86.3, n=2) | |
| Aorus Master 18 AM8H | |
| Average of class Gaming (39.5 - 86.3, n=10, last 2 years) | |
| Space Marine 2 | |
| 2560x1440 Ultra Preset AA:T | |
| Average NVIDIA GeForce RTX 5090 Laptop (97.2 - 107.4, n=3) | |
| Aorus Master 18 AM8H | |
| Medion Erazer Beast 16 X1 Ultimate | |
| Average of class Gaming (48.2 - 107.4, n=11, last 2 years) | |
| 2560x1440 Ultra Preset + Quality DLSS | |
| Aorus Master 18 AM8H | |
| Average NVIDIA GeForce RTX 5090 Laptop (97.5 - 100.8, n=2) | |
| Medion Erazer Beast 16 X1 Ultimate | |
| Average of class Gaming (58.5 - 100.8, n=10, last 2 years) | |
| low | med. | high | ultra | QHD DLSS | QHD | |
|---|---|---|---|---|---|---|
| GTA V (2015) | 187.5 | 185.3 | 142.4 | 133.4 | ||
| Dota 2 Reborn (2015) | 234 | 204 | 193 | 176.4 | ||
| Final Fantasy XV Benchmark (2018) | 234 | 205 | 172.2 | |||
| X-Plane 11.11 (2018) | 161.6 | 139.2 | 114.2 | |||
| Baldur's Gate 3 (2023) | 217 | 202 | 200 | 151 | ||
| Cyberpunk 2077 (2023) | 188.1 | 171.9 | 158.5 | 110.8 | ||
| Star Wars Outlaws (2024) | 79.3 | 72.7 | 70 | 70.8 | 61 | |
| Space Marine 2 (2024) | 102.8 | 102.1 | 101.4 | 97.5 | 97.2 | |
| Until Dawn (2024) | 109.9 | 102.4 | 93.9 | 86.3 | 69.5 | |
| Stalker 2 (2024) | 106.1 | 92.6 | 81.8 | 134.6 | 65.4 | |
| Kingdom Come Deliverance 2 (2025) | 195.8 | 165.7 | 118.5 | 114.5 | 86 | |
| Civilization 7 (2025) | 231 | 225 | 184.9 | |||
| The Elder Scrolls IV Oblivion Remastered (2025) | 118.4 | 104.2 | 57.5 | 59.7 | 41.7 | |
| Doom: The Dark Ages (2025) | 124.3 | 113.9 | 111.3 | 107.3 | 82.1 | |
| F1 25 (2025) | 256 | 241 | 57 | 61 | 34 |
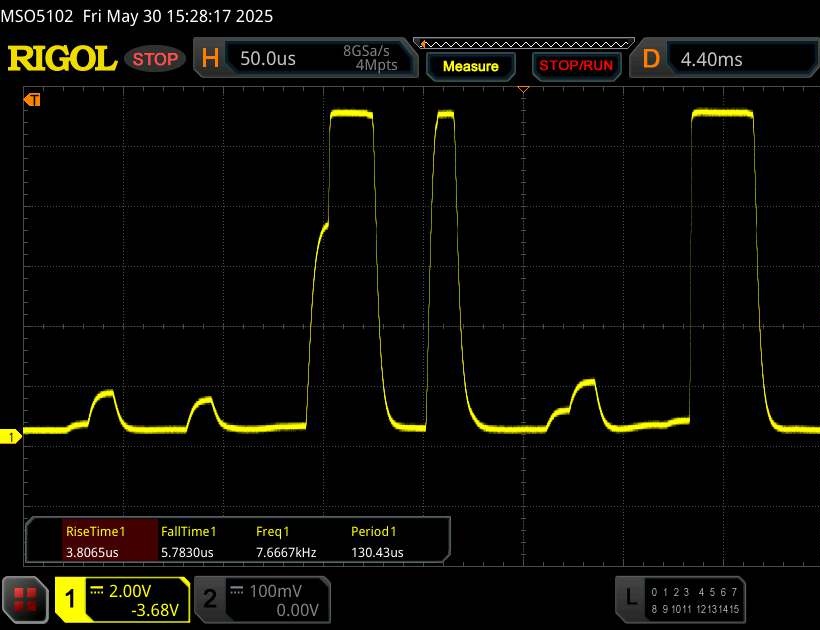
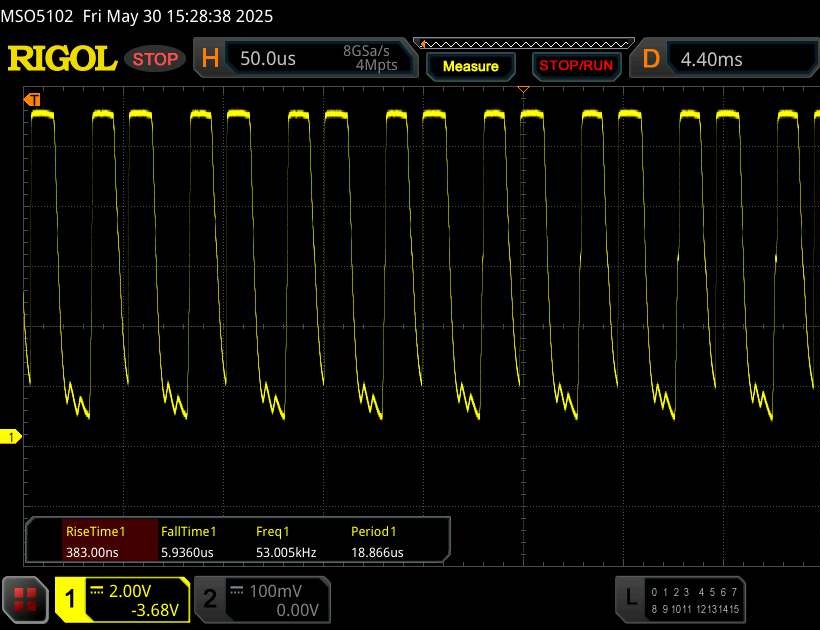
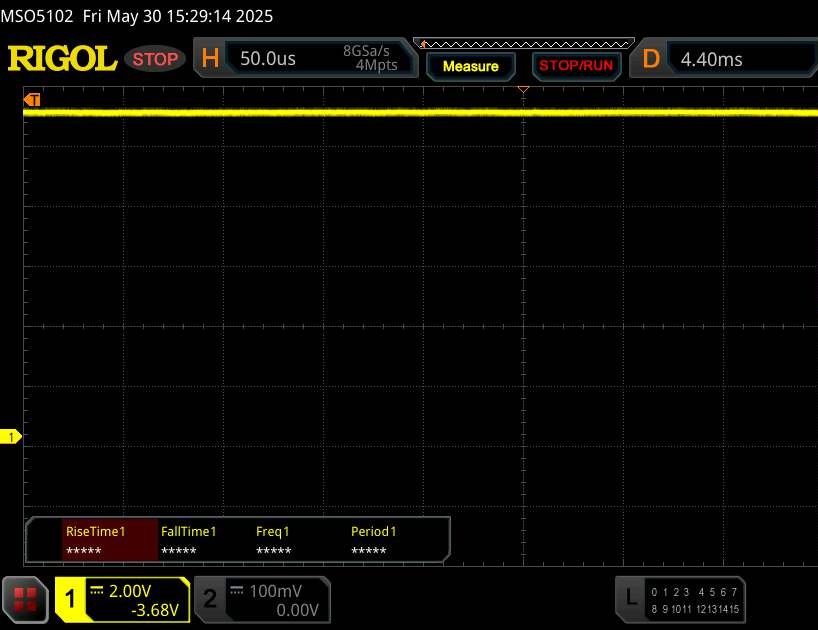
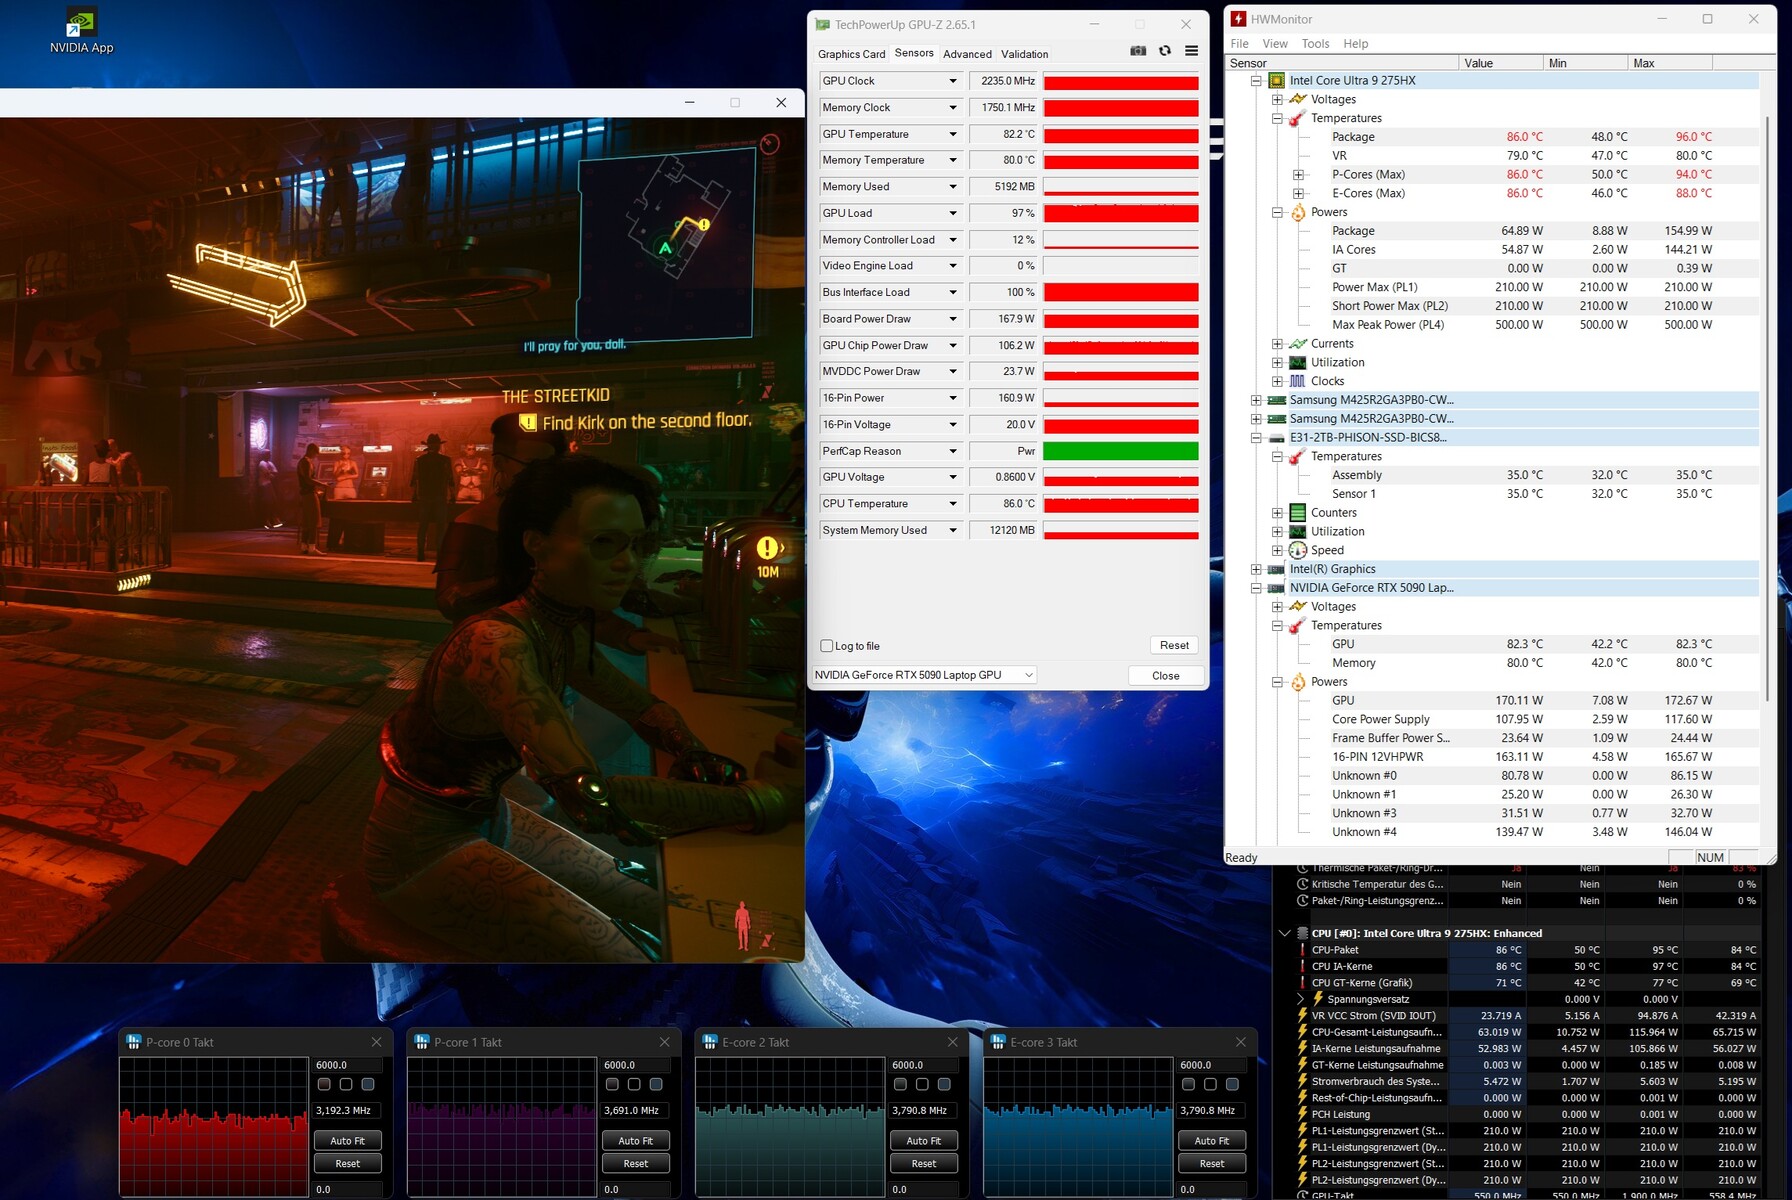
长时间 GPU 负载会导致 Beast 16 X1 的性能略有下降。不过,FPS 损失有限。我们的 赛博朋克-测试说明了这一现象(红线)。
Cyberpunk 2077 ultra FPS-Diagram
排放量
噪音排放
16 英寸机身在负载情况下的音量与竞争对手不相上下。在典型游戏模式下,55 分贝(A)以下的噪音清晰可闻,需要佩戴耳机。在空闲模式下,Medion 笔记本电脑要安静得多,风扇的噪音通常在 25 到 29 分贝(A)之间。
Noise level
| Idle |
| 25 / 27 / 29 dB(A) |
| Load |
| 52 / 55 dB(A) |
 | ||
30 dB silent 40 dB(A) audible 50 dB(A) loud |
||
min: | ||
| Medion Erazer Beast 16 X1 Ultimate GeForce RTX 5090 Laptop, Ultra 9 275HX | Schenker XMG Neo 16 E25 RTX 5090 Laptop GeForce RTX 5090 Laptop, Ultra 9 275HX | HP Omen Max 16 ah000 GeForce RTX 5090 Laptop, Ultra 9 275HX | Asus ROG Strix Scar 16 2025 GeForce RTX 5090 Laptop, Ultra 9 275HX | Lenovo Legion Pro 7i 16 Gen 10 GeForce RTX 5080 Laptop, Ultra 9 275HX | Asus ROG Strix G16 G615 GeForce RTX 5080 Laptop, Ultra 9 275HX | |
|---|---|---|---|---|---|---|
| Noise | 1% | -3% | 1% | 12% | 2% | |
| off / environment * (dB) | 24 | 24 -0% | 22.8 5% | 23.8 1% | 22.9 5% | 24 -0% |
| Idle Minimum * (dB) | 25 | 26 -4% | 29 -16% | 29 -16% | 22.9 8% | 24 4% |
| Idle Average * (dB) | 27 | 26 4% | 29 -7% | 29 -7% | 22.9 15% | 30.1 -11% |
| Idle Maximum * (dB) | 29 | 26 10% | 29 -0% | 29 -0% | 26.3 9% | 30.1 -4% |
| Load Average * (dB) | 52 | 52.4 -1% | 47.7 8% | 40.5 22% | 27.8 47% | 41.1 21% |
| Cyberpunk 2077 ultra * (dB) | 55 | 55.4 -1% | 54.8 -0% | 53.6 3% | 54.2 1% | 54.2 1% |
| Load Maximum * (dB) | 55 | 55.4 -1% | 61.1 -11% | 53.6 3% | 53.9 2% | 54.2 1% |
* ... smaller is better
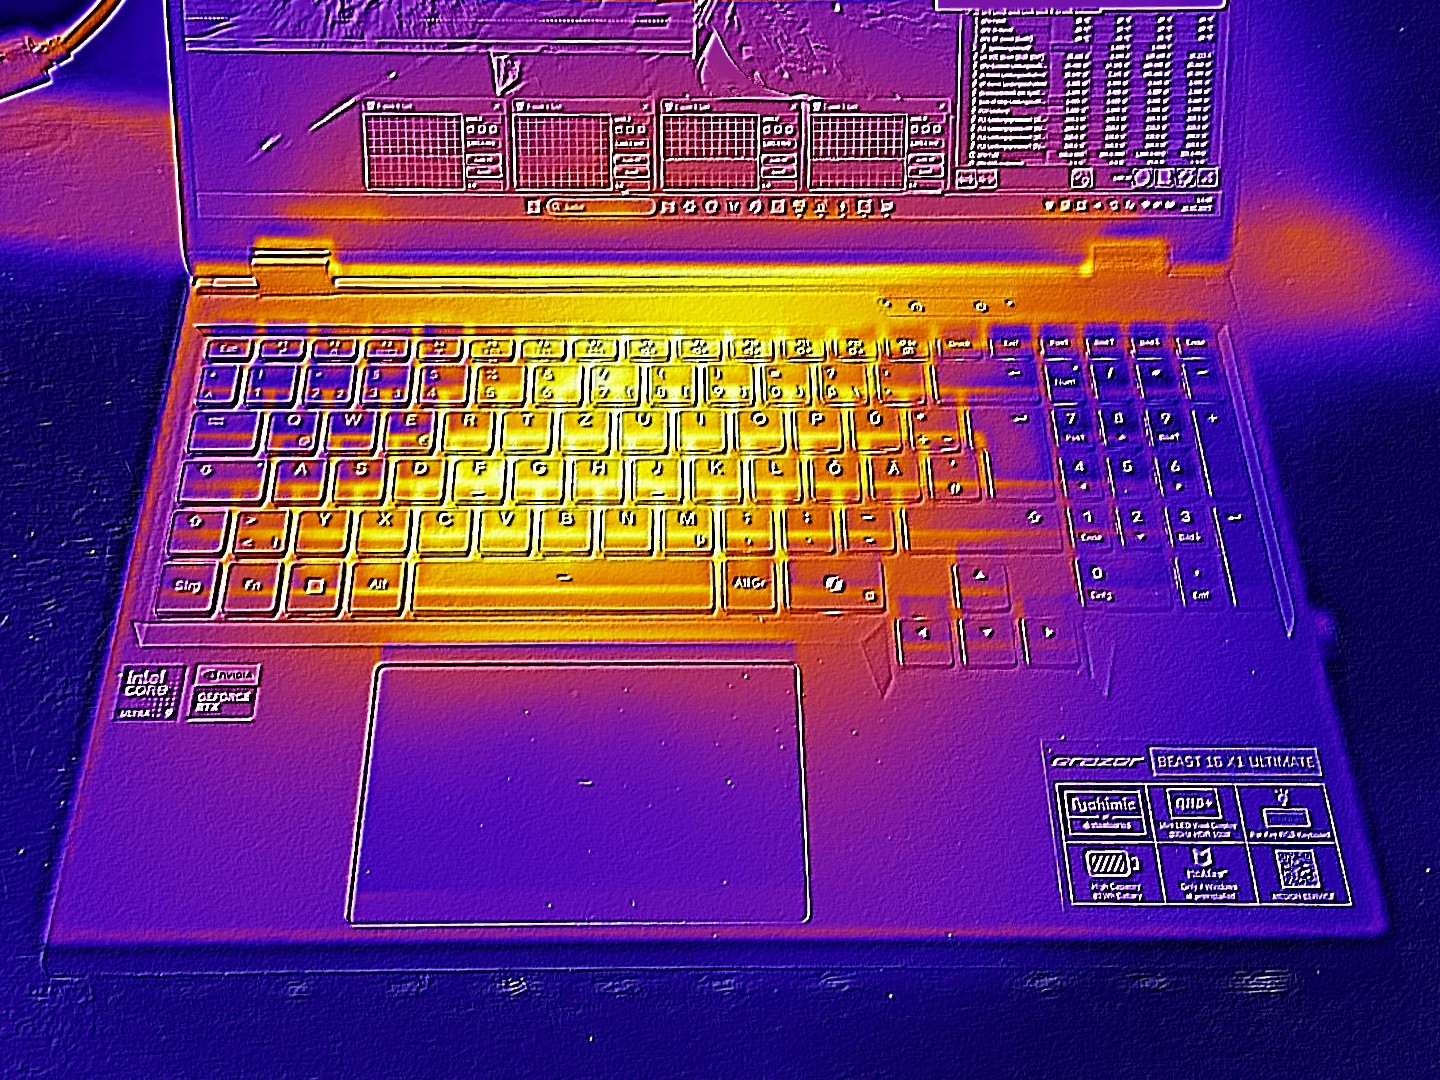
温度
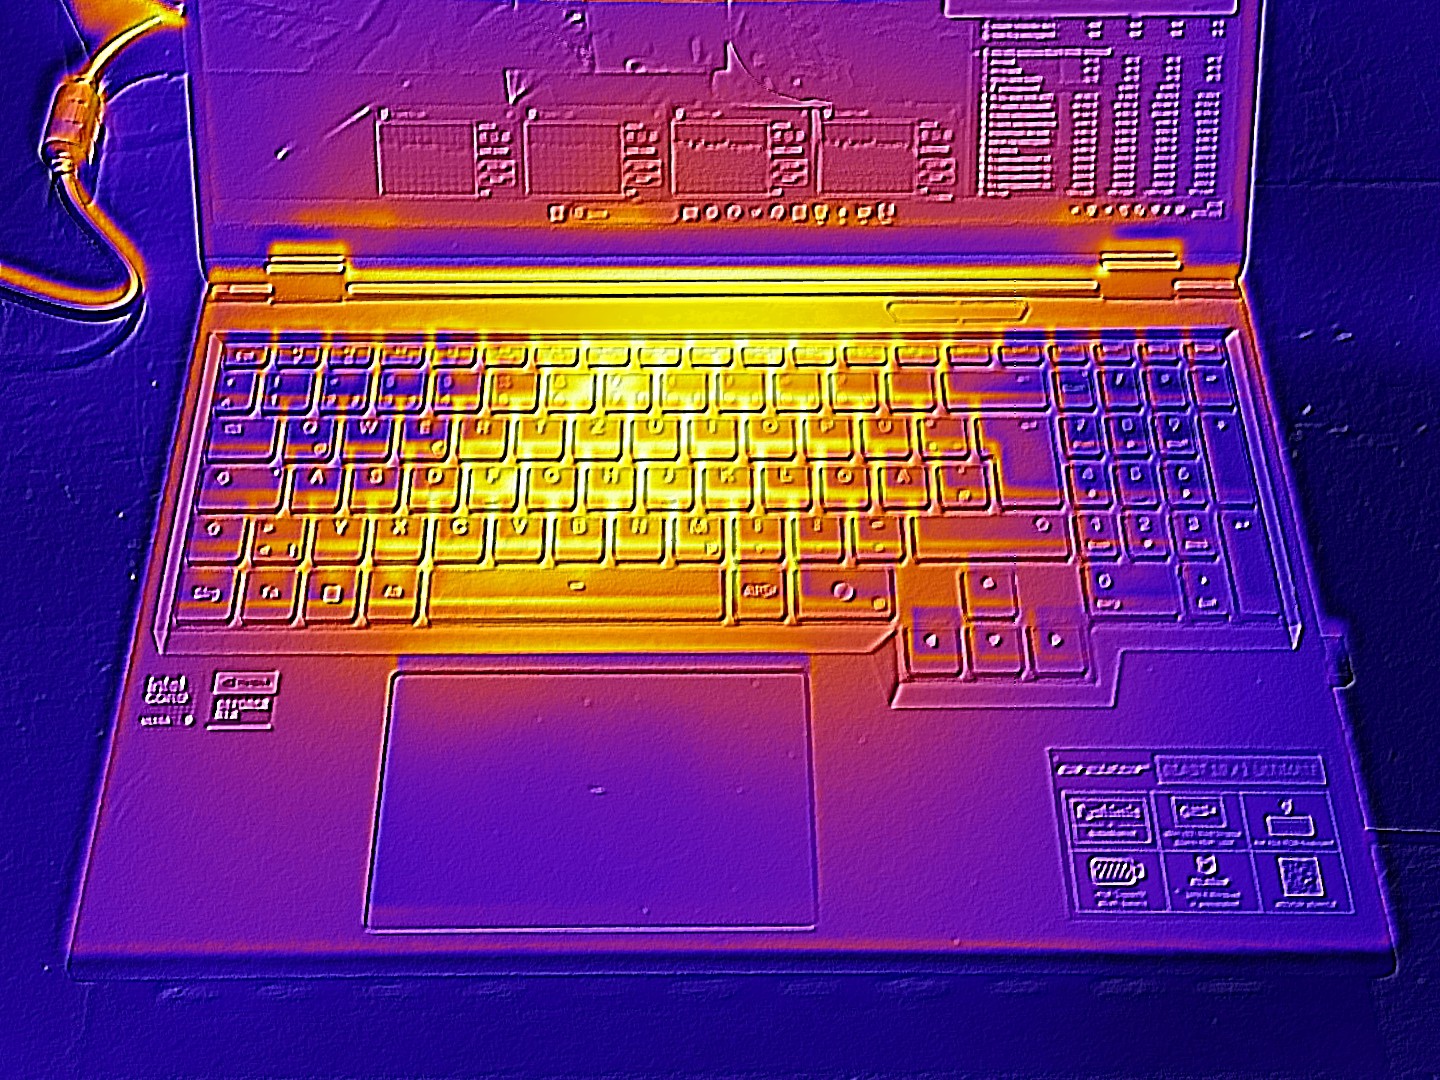
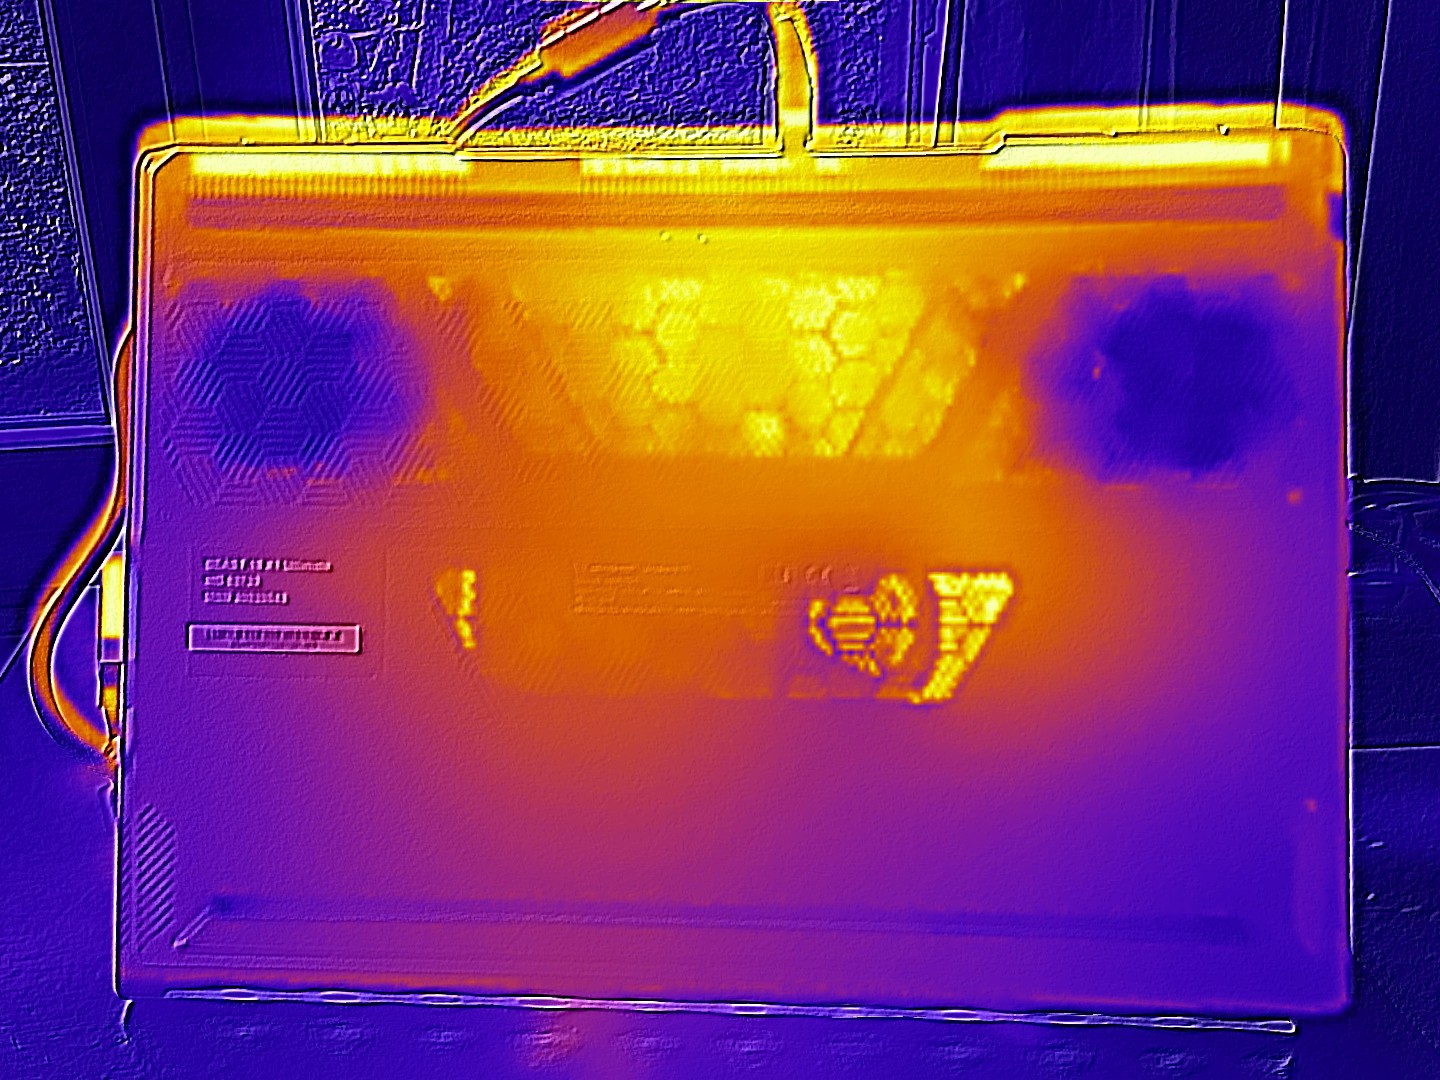
虽然 Beast 16 X1 在空闲模式(最高 30 °C/86°F)下保持凉爽宜人,但在负载较重的情况下,外壳表面最高温度可达 49 °C(120.2 °F/顶部)和 45 °C(113 °F/底部),与同类产品相比,这两个温度值既不算高,也不算低。
(-) The maximum temperature on the upper side is 49 °C / 120 F, compared to the average of 40.4 °C / 105 F, ranging from 21.2 to 68.8 °C for the class Gaming.
(±) The bottom heats up to a maximum of 45 °C / 113 F, compared to the average of 43.2 °C / 110 F
(+) In idle usage, the average temperature for the upper side is 29.1 °C / 84 F, compared to the device average of 33.9 °C / 93 F.
(-) 3: The average temperature for the upper side is 40.2 °C / 104 F, compared to the average of 33.9 °C / 93 F for the class Gaming.
(±) The palmrests and touchpad can get very hot to the touch with a maximum of 37 °C / 98.6 F.
(-) The average temperature of the palmrest area of similar devices was 28.8 °C / 83.8 F (-8.2 °C / -14.8 F).
| Medion Erazer Beast 16 X1 Ultimate GeForce RTX 5090 Laptop, Ultra 9 275HX | Schenker XMG Neo 16 E25 RTX 5090 Laptop GeForce RTX 5090 Laptop, Ultra 9 275HX | HP Omen Max 16 ah000 GeForce RTX 5090 Laptop, Ultra 9 275HX | Asus ROG Strix Scar 16 2025 GeForce RTX 5090 Laptop, Ultra 9 275HX | Lenovo Legion Pro 7i 16 Gen 10 GeForce RTX 5080 Laptop, Ultra 9 275HX | Asus ROG Strix G16 G615 GeForce RTX 5080 Laptop, Ultra 9 275HX | |
|---|---|---|---|---|---|---|
| Heat | 2% | 6% | -7% | 1% | 8% | |
| Maximum Upper Side * (°C) | 49 | 47.8 2% | 42.8 13% | 44.2 10% | 42.6 13% | 39.6 19% |
| Maximum Bottom * (°C) | 45 | 46.7 -4% | 50.2 -12% | 48.1 -7% | 41.2 8% | 49.7 -10% |
| Idle Upper Side * (°C) | 30 | 28.4 5% | 27.6 8% | 33 -10% | 32.6 -9% | 26.3 12% |
| Idle Bottom * (°C) | 30 | 28.9 4% | 26.2 13% | 36.1 -20% | 32.4 -8% | 27.3 9% |
* ... smaller is better
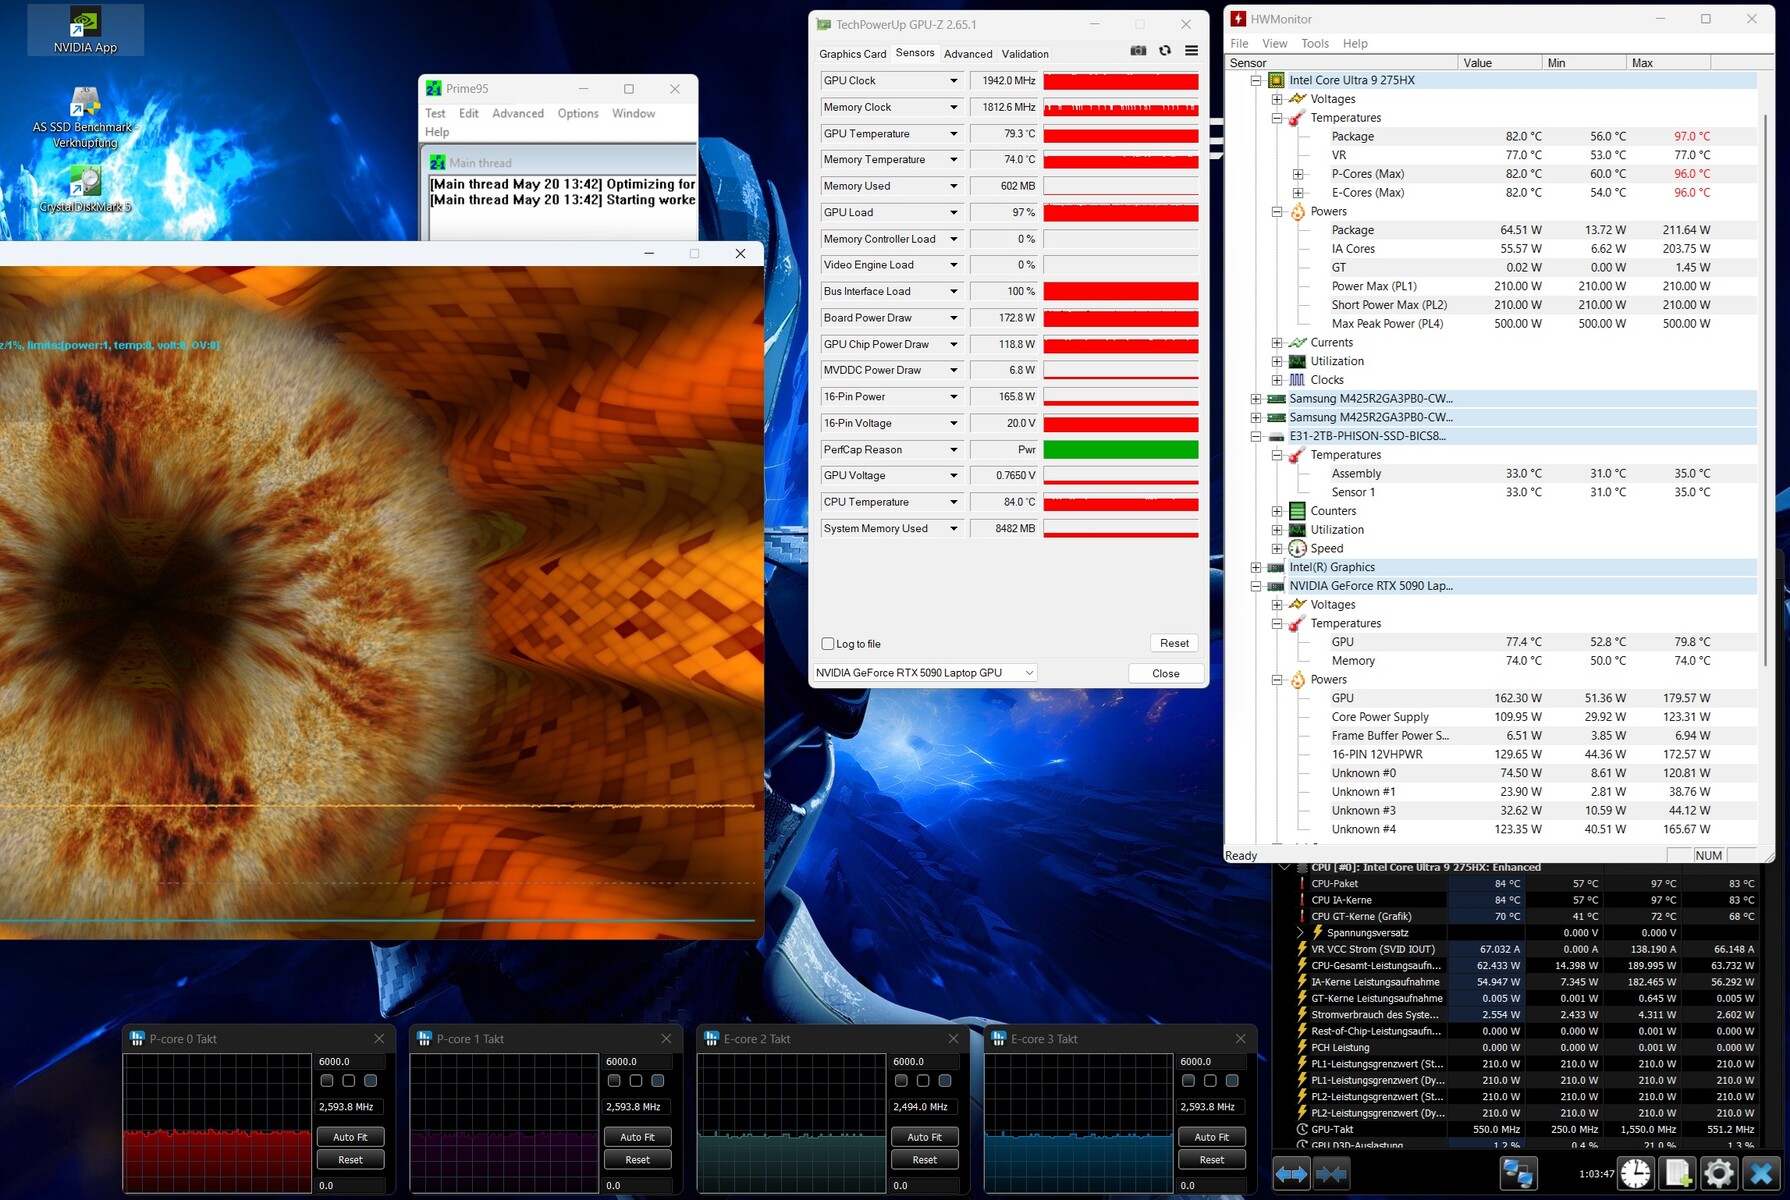
压力测试
我们使用 FurMark 和 Prime95 工具进行了压力测试,CPU 和 GPU 的温度控制在 80 °C(176 °F)左右,可以接受。在《赛博朋克 2077》中,由于时钟频率较高,温度略高。

发言人
以笔记本电脑的标准来看,Beast 16 X1 的音响系统好得出奇,丝毫不落后于竞争对手。与惠普 Omen Max 16 相比,最大音量也更大。
Medion Erazer Beast 16 X1 Ultimate audio analysis
(+) | speakers can play relatively loud (85 dB)
Bass 100 - 315 Hz
(±) | reduced bass - on average 11.2% lower than median
(+) | bass is linear (6.8% delta to prev. frequency)
Mids 400 - 2000 Hz
(+) | balanced mids - only 4.7% away from median
(+) | mids are linear (4.6% delta to prev. frequency)
Highs 2 - 16 kHz
(+) | balanced highs - only 3.6% away from median
(±) | linearity of highs is average (8% delta to prev. frequency)
Overall 100 - 16.000 Hz
(+) | overall sound is linear (10.8% difference to median)
Compared to same class
» 7% of all tested devices in this class were better, 3% similar, 90% worse
» The best had a delta of 6%, average was 18%, worst was 132%
Compared to all devices tested
» 6% of all tested devices were better, 2% similar, 92% worse
» The best had a delta of 4%, average was 23%, worst was 134%
HP Omen Max 16 ah000 audio analysis
(±) | speaker loudness is average but good (77.9 dB)
Bass 100 - 315 Hz
(±) | reduced bass - on average 9.9% lower than median
(±) | linearity of bass is average (13.4% delta to prev. frequency)
Mids 400 - 2000 Hz
(+) | balanced mids - only 2.3% away from median
(+) | mids are linear (4.3% delta to prev. frequency)
Highs 2 - 16 kHz
(+) | balanced highs - only 1.9% away from median
(+) | highs are linear (4.8% delta to prev. frequency)
Overall 100 - 16.000 Hz
(+) | overall sound is linear (11.4% difference to median)
Compared to same class
» 9% of all tested devices in this class were better, 3% similar, 88% worse
» The best had a delta of 6%, average was 18%, worst was 132%
Compared to all devices tested
» 7% of all tested devices were better, 2% similar, 91% worse
» The best had a delta of 4%, average was 23%, worst was 134%
能源管理
能源消耗
关于能耗,结论是矛盾的。虽然在闲置模式下,Beast 16 X1 比竞争对手更经济,但在 3D 模式下的能耗略高于平均水平。注:连接外部显示器时,dGPU 会自动激活。
| Off / Standby | |
| Idle | |
| Load |
|
Key:
min: | |
| Medion Erazer Beast 16 X1 Ultimate GeForce RTX 5090 Laptop, Ultra 9 275HX | Schenker XMG Neo 16 E25 RTX 5090 Laptop GeForce RTX 5090 Laptop, Ultra 9 275HX | HP Omen Max 16 ah000 GeForce RTX 5090 Laptop, Ultra 9 275HX | Asus ROG Strix Scar 16 2025 GeForce RTX 5090 Laptop, Ultra 9 275HX | Lenovo Legion Pro 7i 16 Gen 10 GeForce RTX 5080 Laptop, Ultra 9 275HX | Asus ROG Strix G16 G615 GeForce RTX 5080 Laptop, Ultra 9 275HX | Average of class Gaming | |
|---|---|---|---|---|---|---|---|
| Power Consumption | -4% | -17% | -40% | -56% | -1% | 1% | |
| Idle Minimum * (Watt) | 13.1 | 11.8 10% | 9.9 24% | 22.5 -72% | 28.5 -118% | 10.8 18% | 13 ? 1% |
| Idle Average * (Watt) | 17.5 | 15.1 14% | 28.6 -63% | 32.2 -84% | 38.8 -122% | 17.7 -1% | 18.6 ? -6% |
| Idle Maximum * (Watt) | 23 | 15.8 31% | 47.1 -105% | 34.3 -49% | 45.6 -98% | 18.8 18% | 24.2 ? -5% |
| Load Average * (Watt) | 88 | 165.3 -88% | 141.8 -61% | 169.3 -92% | 132.2 -50% | 139.4 -58% | 109.2 ? -24% |
| Cyberpunk 2077 ultra * (Watt) | 299 | 296 1% | 253 15% | 294 2% | 318 -6% | 295 1% | |
| Cyberpunk 2077 ultra external monitor * (Watt) | 297 | 289 3% | 230 23% | 288 3% | 319 -7% | 291 2% | |
| Load Maximum * (Watt) | 428 | 415.5 3% | 233 46% | 371.5 13% | 384 10% | 359.3 16% | 256 ? 40% |
* ... smaller is better
Power consumption Cyberpunk / Stress test
Power consumption with external Monitor
电池寿命
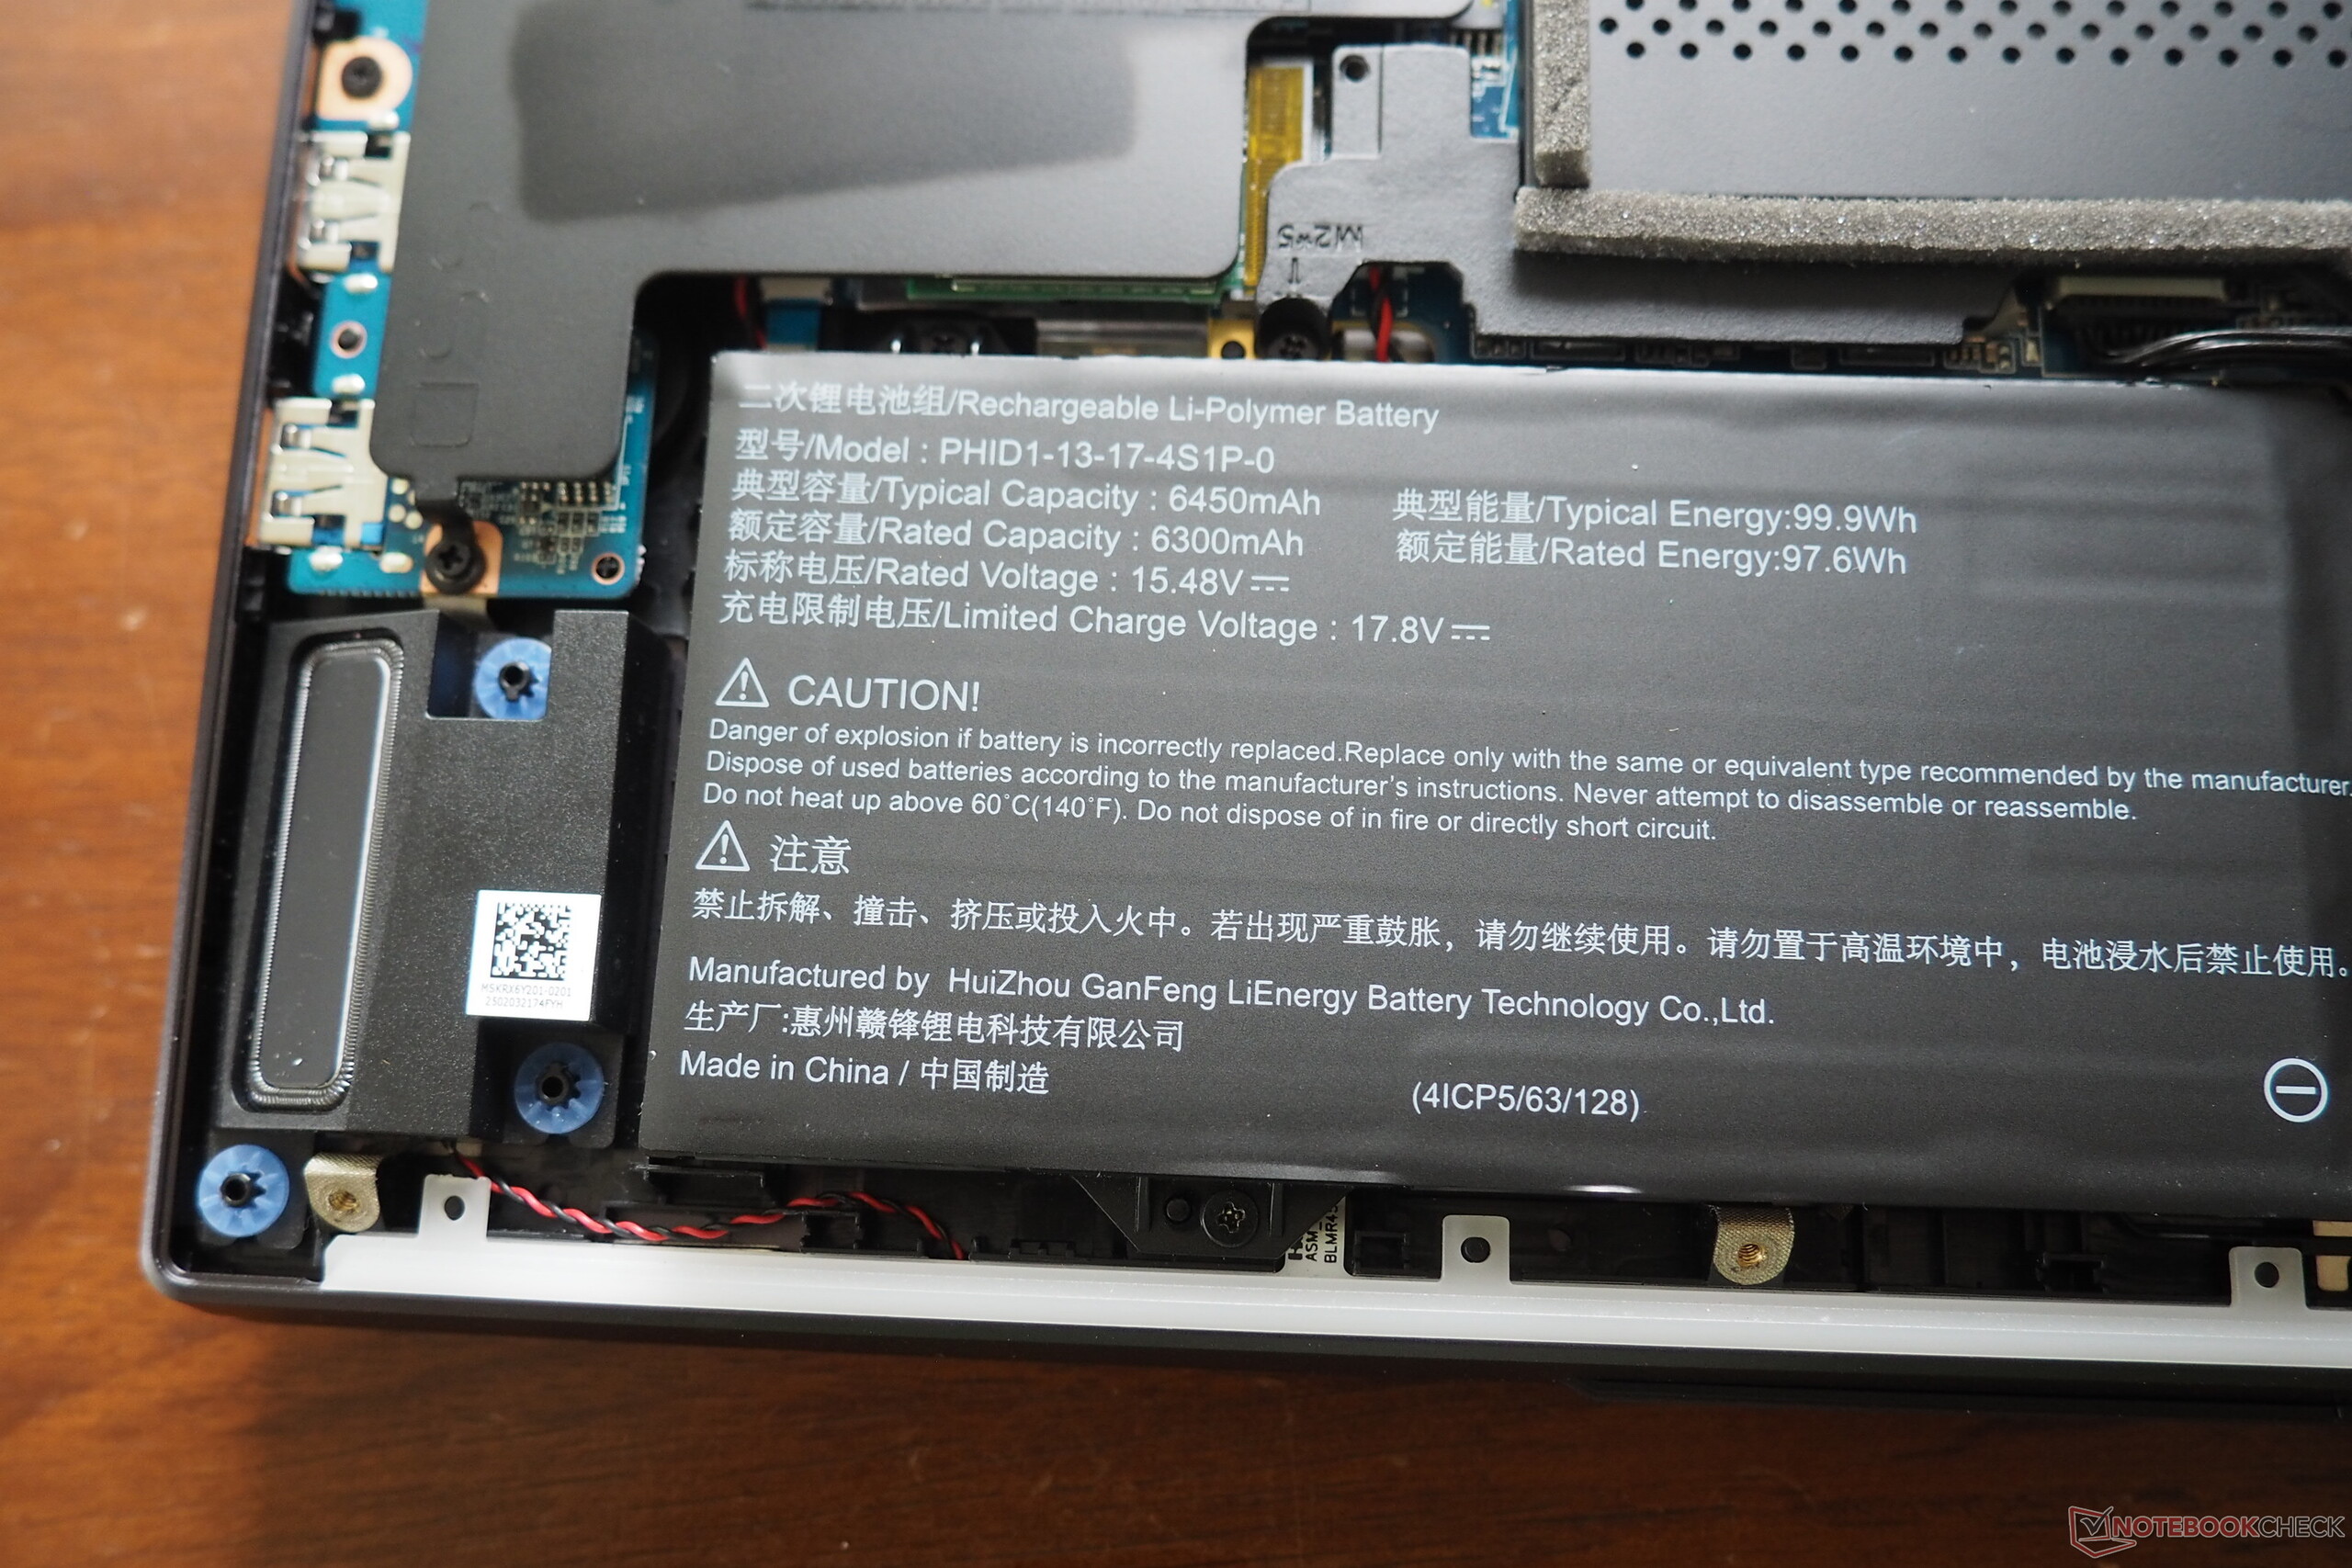
Medion 为这款 16 英寸设备配备了一块 99 Wh 的大容量电池,在我们的 WLAN 测试中(亮度降低到 150 cd/m²),它的续航时间略低于 8 小时,这一相对较好的成绩与 ROG Strix G16(90 Wh)几乎是 1:1。
| Medion Erazer Beast 16 X1 Ultimate Ultra 9 275HX, GeForce RTX 5090 Laptop, 99 Wh | Schenker XMG Neo 16 E25 RTX 5090 Laptop Ultra 9 275HX, GeForce RTX 5090 Laptop, 99.8 Wh | HP Omen Max 16 ah000 Ultra 9 275HX, GeForce RTX 5090 Laptop, 83 Wh | Asus ROG Strix Scar 16 2025 Ultra 9 275HX, GeForce RTX 5090 Laptop, 90 Wh | Lenovo Legion Pro 7i 16 Gen 10 Ultra 9 275HX, GeForce RTX 5080 Laptop, 99 Wh | Asus ROG Strix G16 G615 Ultra 9 275HX, GeForce RTX 5080 Laptop, 90 Wh | Average of class Gaming | |
|---|---|---|---|---|---|---|---|
| Battery runtime | 20% | -27% | -18% | -32% | -1% | -10% | |
| WiFi v1.3 (h) | 7.9 | 9.5 20% | 5.8 -27% | 6.5 -18% | 5.4 -32% | 7.8 -1% | 7.11 ? -10% |
| H.264 (h) | 7.7 | 11 | 8.64 ? | ||||
| Load (h) | 2 | 1.2 | 0.8 | 1.5 | 1.502 ? | ||
| Reader / Idle (h) | 8.7 | 8.71 ? | |||||
| Cyberpunk 2077 ultra 150cd (h) | 0.8 |
Notebookcheck 总体评分
Medion Erazer Beast 16 X1 是一款高品质的游戏和创作型笔记本电脑,拥有绚丽的显示屏和强劲的性能,但噪音也很高。
Medion Erazer Beast 16 X1 Ultimate
- 05/30/2025 v8
Florian Glaser
 Total Sustainability Score:
 可比较的替代品
Transparency
The selection of devices to be reviewed is made by our editorial team. The test sample was provided to the author as a loan by the manufacturer or retailer for the purpose of this review. The lender had no influence on this review, nor did the manufacturer receive a copy of this review before publication. There was no obligation to publish this review. As an independent media company, Notebookcheck is not subjected to the authority of manufacturers, retailers or publishers.
This is how Notebookcheck is testing
Every year, Notebookcheck independently reviews hundreds of laptops and smartphones using standardized procedures to ensure that all results are comparable. We have continuously developed our test methods for around 20 years and set industry standards in the process. In our test labs, high-quality measuring equipment is utilized by experienced technicians and editors. These tests involve a multi-stage validation process. Our complex rating system is based on hundreds of well-founded measurements and benchmarks, which maintains objectivity. Further information on our test methods can be found here.
