Notebookcheck Logo

戴尔Precision 5470工作站回顾。Nvidia RTX A1000首次亮相

像XPS 14。 仅仅因为你很小,并不意味着你不能像大枪一样强大。Precision 5470采用了目前在庞大的游戏笔记本和其他超过其两倍大小的工作站上使用的相同的Core i9 CPU,但它的实际表现如何呢?
Alder Lake Business Workstation XPS Laptop / Notebook

Precision 5470是戴尔迄今为止最小的移动工作站。与XPS 17启发的 Precision 5750和XPS 15启发的 Precision 556014英寸Precision 5470在外观和设计方面受到XPS 13 9300/9310的启发。如果你过去玩过XPS系统,那么Precision 5470的外观和感觉应该非常熟悉。

Precision 5470的两个显著因素涉及其第12代酷睿H系列CPU和可选的Nvidia RTX A1000 GPU,考虑到14英寸的外形尺寸,其处理能力非常大。我们的特定审查单位配备了酷睿i9-12900H CPU、A1000 GPU和1600p光面触摸屏,零售价约为3000美元。其他配有i5-12500H到i7-12800H的SKU,仅集成Iris Xe图形,以及哑光1200p显示屏,也有较低的起始价格。

直接竞争对手包括其他高端14英寸移动工作站,如 惠普ZBook Firefly 14联想ThinkPad P14s.当谈到工作站时,这一尺寸类别仍然是新的,因此我们也将把Precision 5470与一些较大的机型进行比较,而不是像 ThinkPad P15 G2或戴尔自己的Precision 5560。

更多戴尔评论。

Dell Precision 5000 5470 (Precision 5000 Series)
Processor
Intel Core i9-12900H 14 x 1.8 - 5 GHz, 91 W PL2 / Short Burst, 20 W PL1 / Sustained, Alder Lake-H
Graphics adapter
NVIDIA RTX A1000 Laptop GPU - 4 GB VRAM, Core: 1140 MHz, Memory: 1375 MHz, 40 W TDP, GDDR6, 516.54, Optimus
Memory
32 GB 
, LPDDR5, 5200 MHz, dual-channel, soldered, 32-24-24-52
Display
14.00 inch 16:10, 2560 x 1600 pixel 216 PPI, 10-point capacitive, AU Optronics B140QAN, IPS, Controller: AUO4F9B, Dell P/N: X6NRM, glossy: yes, 60 Hz
Mainboard
Intel Alder Lake-P PCH
Storage
Samsung PM9A1 MZVL21T0HCLR, 1024 GB 
Soundcard
Intel Alder Lake-P PCH - cAVS (Audio, Voice, Speech)
Connections
4 USB 3.1 Gen2, 4 Thunderbolt, USB-C Power Delivery (PD), 4 DisplayPort, 1 Kensington Lock, Audio Connections: 3.5 mm combo, Card Reader: MicroSD, 1 Fingerprint Reader, Brightness Sensor, Sensors: Accelerometer, Hall Effect, Adaptive Thermal Performance
Networking
Intel Wi-Fi 6E AX211 (a/b/g/h/n = Wi-Fi 4/ac = Wi-Fi 5/ax = Wi-Fi 6/ Wi-Fi 6E 6 GHz), Bluetooth 5.2
Size
height x width x depth (in mm): 18.95 x 310.6 x 210.3
Battery
72 Wh Lithium-Polymer, 4-cell
Operating System
Microsoft Windows 11 Pro
Camera
Webcam: 720p
Primary Camera: 0.9 MPix
Additional features
Speakers: 2W x 4, Keyboard: Chiclet, Keyboard Light: yes, Dell Power Manager, Command, Optimizer, PremierColor, Digital Delivery, 12 Months Warranty
Weight
1.621 kg, Power Supply: 415 g
Price
3200 USD
Note: The manufacturer may use components from different suppliers including display panels, drives or memory sticks with similar specifications.


潜在的竞争对手比较

Rating
Date
Model
Weight
Height
Size
Resolution
Best Price
87.6 %
09/2022
Dell Precision 5000 5470
i9-12900H, RTX A1000 Laptop GPU
1.6 kg18.95 mm14.00"2560x1600
86.2 %
06/2022
Lenovo ThinkPad P15v G2 21A9000XGE
i7-11800H, T1200 Laptop GPU
2.3 kg22.7 mm15.60"1920x1080
88.3 %
10/2021
Dell Precision 5000 5560
i7-11850H, RTX A2000 Laptop GPU
2 kg18 mm15.60"3840x2400
85.2 %
09/2021
Lenovo ThinkPad P14s G2 AMD
R7 PRO 5850U, Vega 8
1.5 kg17.9 mm14.00"3840x2160
85.2 %
09/2021
HP ZBook Firefly 14 G8 2C9Q2EA
i7-1165G7, T500 Laptop GPU
1.4 kg17.9 mm14.00"1920x1080
82.4 %
HP ZBook Firefly 14 G7
i7-10610U, Quadro P520
1.4 kg17.9 mm14.00"1920x1080

案例 - XPS外观和感觉

在撰写本文时,还没有XPS 14,但Precision 5470基本上是其前身。它舒适地坐落在经典的13英寸XPS 13和15英寸 XPS 15同时利用同样的灰色镁合金外壳和碳纤维甲板,这已经成为XPS型号的标准。

底盘质量很好,在试图扭转或弯曲其表面时只有轻微的吱吱作响或翘曲。它当然比新的XPS 13 9320感觉更强大,更专业。 新的XPS 13 9320设计。尽管如此,铰链本可以更硬或更坚硬,以获得更好的寿命感。

14英寸的Precision 5470比13英寸的XPS 13 9300大得多,也重得多,有明显的差距。它甚至比XPS 15还要厚一点,而在重量上则更接近XPS 15而不是XPS 13。然而,就其级别而言,它仍然非常紧凑,特别是在与惠普萤火虫14 G8或ThinkPad P14s相比的占地面积方面。

可选的智能卡阅读器
可选的智能卡阅读器
外盖可以很好地阻止指纹,但黑色的甲板和钥匙盖是指纹磁铁。
盖子打开到最大角度(~145度)。
盖子打开到最大角度(~145度)。
与XPS系列相同的金属骨架和碳纤维甲板材料
支持指纹识别的电源按钮
支持指纹识别的电源按钮
铰链打开到最大角度时有轻微的吱吱声
铰链打开到最大角度时有轻微的吱吱声

尺寸比较

344.72 mm 230.14 mm 18 mm 2 kg329 mm 227 mm 17.9 mm 1.5 kg323 mm 214.6 mm 17.9 mm 1.4 kg323 mm 214.6 mm 17.9 mm 1.4 kg310.6 mm 210.3 mm 18.95 mm 1.6 kg296 mm 199 mm 14.8 mm 1.2 kg297 mm 210 mm 1 mm 5.7 g

连接性 - 只有USB-C

端口选项仅限于USB-C,而大多数工作站的种类要多得多。 Precision 因此,5470的拥有者预计要依靠适配器或扩展坞来连接大多数设备。

前面。没有端口
前面。没有端口
右边。MicroSD读卡器,2个USB-C带Thunderbolt 4 + DisplayPort + Power Delivery,楔形锁。
后方。没有端口
后方。没有端口
左边:3.5毫米耳机,2个USB-C w/Thunderbolt 4 + DisplayPort + Power Delivery

SD卡阅读器

从我们的UHS-II测试卡来看,集成读卡器的传输速率非常快,接近230MB/s。然而,根据所涉及的文件大小,实际传输率可能会更低。移动1GB的图片(每张约4MB)的速度较慢,大约需要13秒。

完全插入的MicroSD卡几乎与边缘平齐,以便更安全地运输。
SD Card Reader
average JPG Copy Test (av. of 3 runs)
Dell Precision 5000 5560
Intel Core i7-11850H (AV Pro V60)
196.9 MB/s +151%
Lenovo ThinkPad P15v G2 21A9000XGE
Intel Core i7-11800H
95.8 MB/s +22%
Dell Precision 5000 5470
Intel Core i9-12900H (AV Pro V60)
78.6 MB/s
Lenovo ThinkPad P14s G2 AMD
AMD Ryzen 7 PRO 5850U (AV PRO V60)
72 MB/s -8%
maximum AS SSD Seq Read Test (1GB)
Lenovo ThinkPad P15v G2 21A9000XGE
Intel Core i7-11800H
261.5 MB/s +16%
Dell Precision 5000 5470
Intel Core i9-12900H (AV Pro V60)
226.4 MB/s
Dell Precision 5000 5560
Intel Core i7-11850H (AV Pro V60)
198.4 MB/s -12%
Lenovo ThinkPad P14s G2 AMD
AMD Ryzen 7 PRO 5850U (AV PRO V60)
87.4 MB/s -61%

沟通

英特尔AX211是Wi-Fi 6E和蓝牙5.2连接的标准配置。虽然我们没有遇到明显的问题,但传输速率会比预期的要慢,而且变化较大。

不可拆卸的1216 WLAN模块
不可拆卸的1216 WLAN模块
Networking
iperf3 transmit AX12
Lenovo ThinkPad P15v G2 21A9000XGE
Intel Wi-Fi 6 AX201
1421 (1336min - 1474max) MBit/s
HP ZBook Firefly 14 G8 2C9Q2EA
Intel Wi-Fi 6 AX201
1396 (1168min - 1517max) MBit/s
HP ZBook Firefly 14 G7
Intel Wi-Fi 6 AX201
1132 (824min - 1302max) MBit/s
Dell Precision 5000 5560
Intel Wi-Fi 6 AX201
981 (864min - 1044max) MBit/s
Lenovo ThinkPad P14s G2 AMD
RealTek Semiconductor RTL8852AE
914 (464min - 996max) MBit/s
iperf3 receive AX12
HP ZBook Firefly 14 G8 2C9Q2EA
Intel Wi-Fi 6 AX201
1402 (1306min - 1480max) MBit/s
Lenovo ThinkPad P15v G2 21A9000XGE
Intel Wi-Fi 6 AX201
1385 (1285min - 1610max) MBit/s
Dell Precision 5000 5560
Intel Wi-Fi 6 AX201
1382 (1340min - 1446max) MBit/s
HP ZBook Firefly 14 G7
Intel Wi-Fi 6 AX201
1300 (676min - 1410max) MBit/s
Lenovo ThinkPad P14s G2 AMD
RealTek Semiconductor RTL8852AE
690 (654min - 739max) MBit/s
iperf3 receive AXE11000 6GHz
Dell Precision 5000 5470
Intel Wi-Fi 6E AX211
1305 (500min - 1450max) MBit/s
iperf3 transmit AXE11000 6GHz
Dell Precision 5000 5470
Intel Wi-Fi 6E AX211
1049 (764min - 1342max) MBit/s
050100150200250300350400450500550600650700750800850900950100010501100115012001250130013501400Tooltip
Dell Precision 5000 5470; iperf3 transmit AXE11000 6GHz; iperf 3.1.3: Ø1049 (764-1342)
Dell Precision 5000 5470; iperf3 receive AXE11000 6GHz; iperf 3.1.3: Ø1304 (500-1450)

网络摄像头

网络摄像头仅限于100万像素或720p,而其他大多数笔记本电脑已经发展到200万像素,甚至500万像素,就像许多高端惠普笔记本电脑一样。 许多高端惠普笔记本电脑.图像质量很模糊,就像XPS 13系列上的网络摄像头。

红外线用于支持你好,但没有网络摄像头快门以保护隐私。
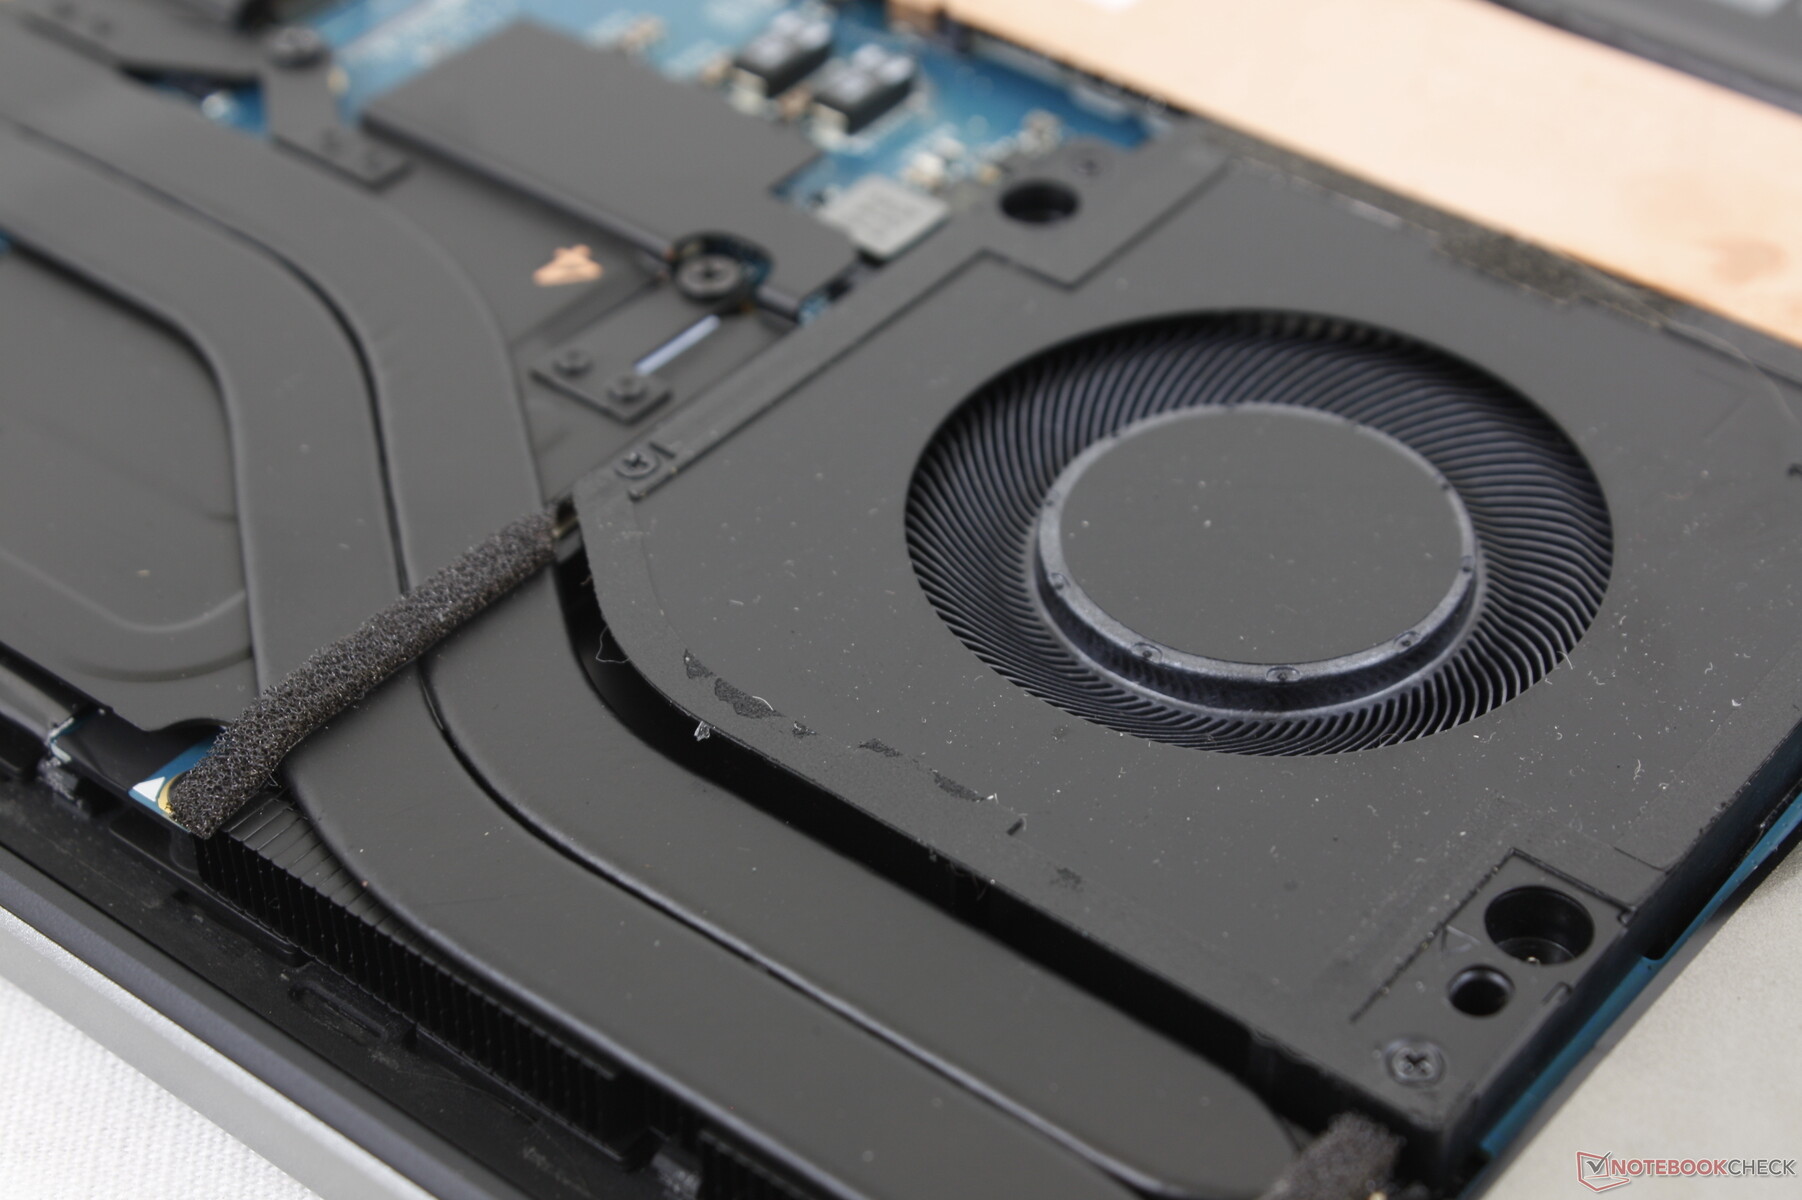
ColorChecker
9.1 ∆E
12.2 ∆E
12.8 ∆E
12.4 ∆E
13.1 ∆E
16.7 ∆E
10.3 ∆E
6.7 ∆E
11 ∆E
6.8 ∆E
11.9 ∆E
7.4 ∆E
3.8 ∆E
10.7 ∆E
10.7 ∆E
7.7 ∆E
12.1 ∆E
9.7 ∆E
13.4 ∆E
12.8 ∆E
12.7 ∆E
11 ∆E
7.8 ∆E
5.7 ∆E
ColorChecker Dell Precision 5000 5470: 10.36 ∆E min: 3.81 - max: 16.67 ∆E

维护

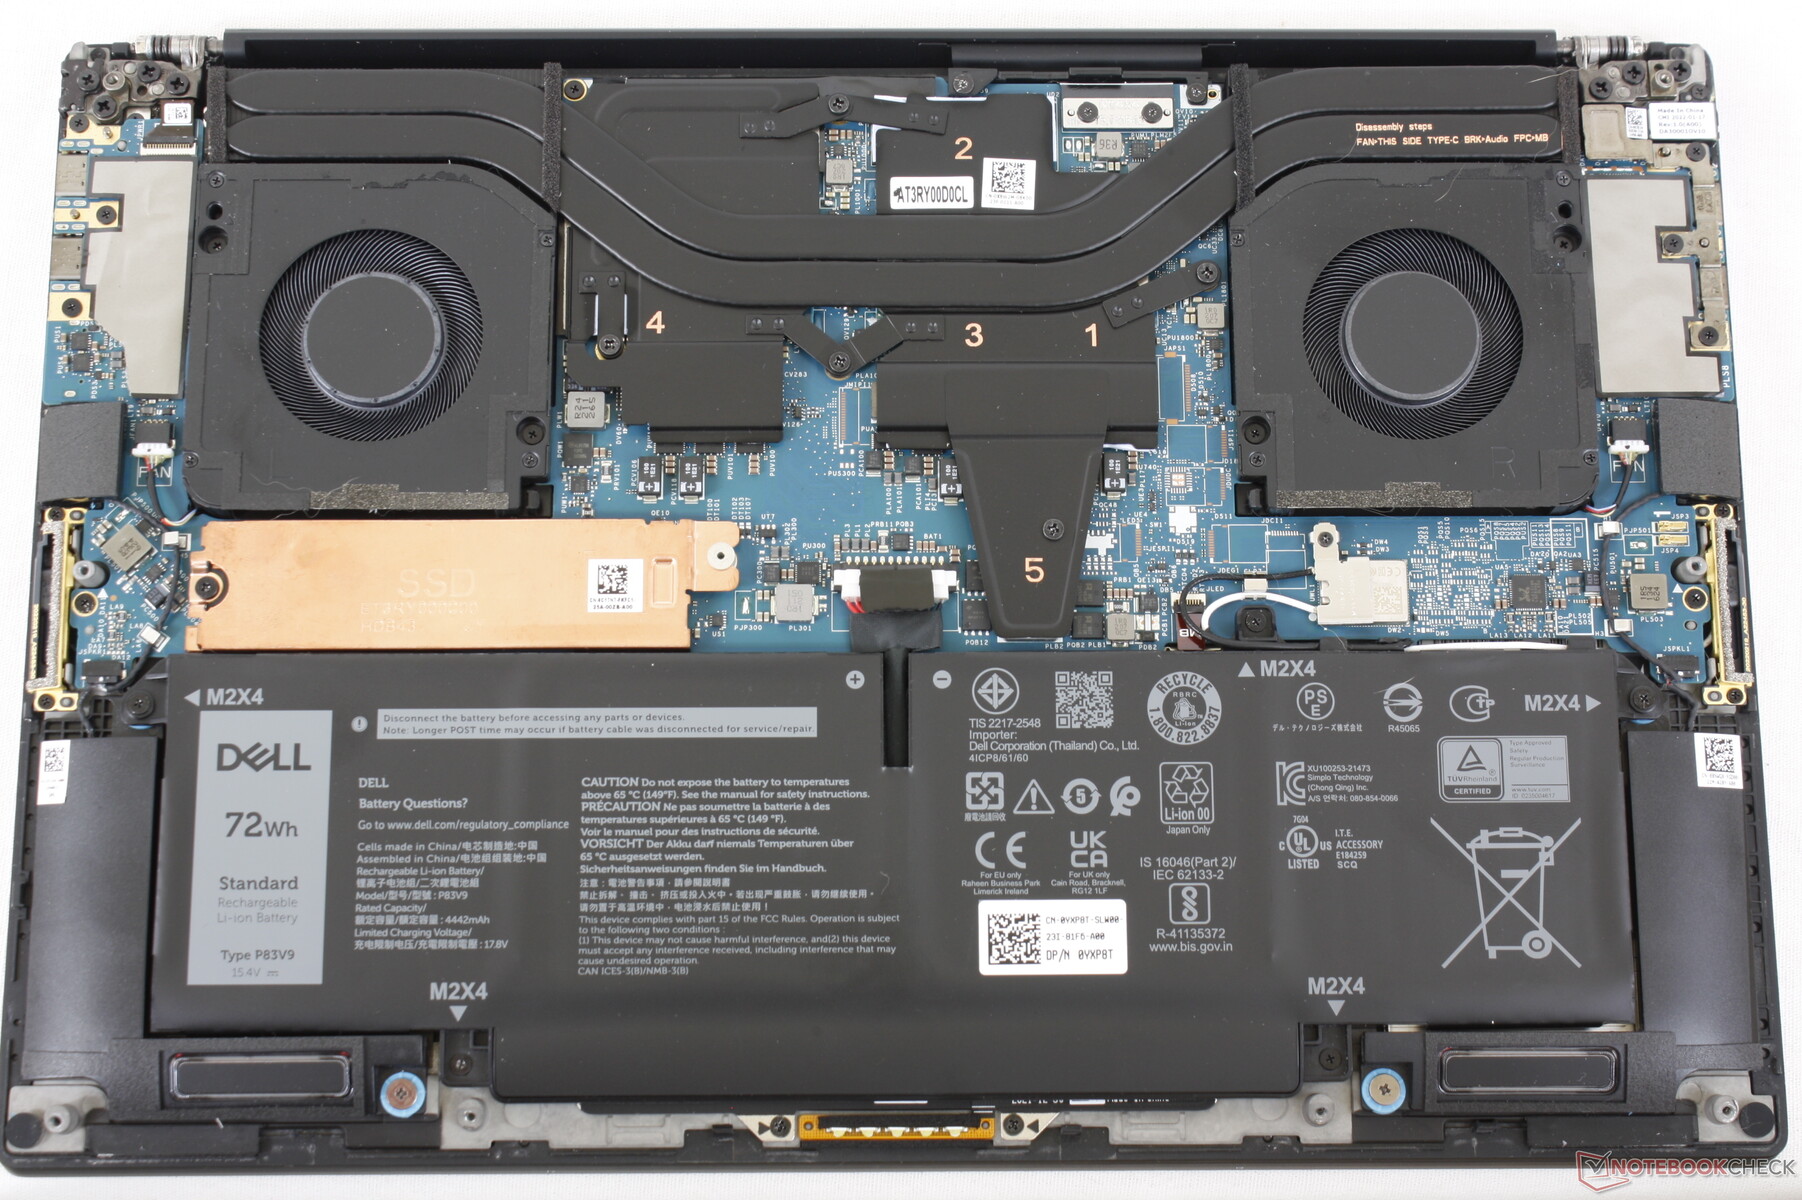
底部面板由八个T5 Torx螺钉固定,便于拆卸。不过,由于内存和WLAN模块是焊接的,所以没有什么可升级的。

担保

美国的基本保修期只有12个月,而不是我们期待的大多数移动工作站和高端专业笔记本电脑的36个月。

输入设备

键盘

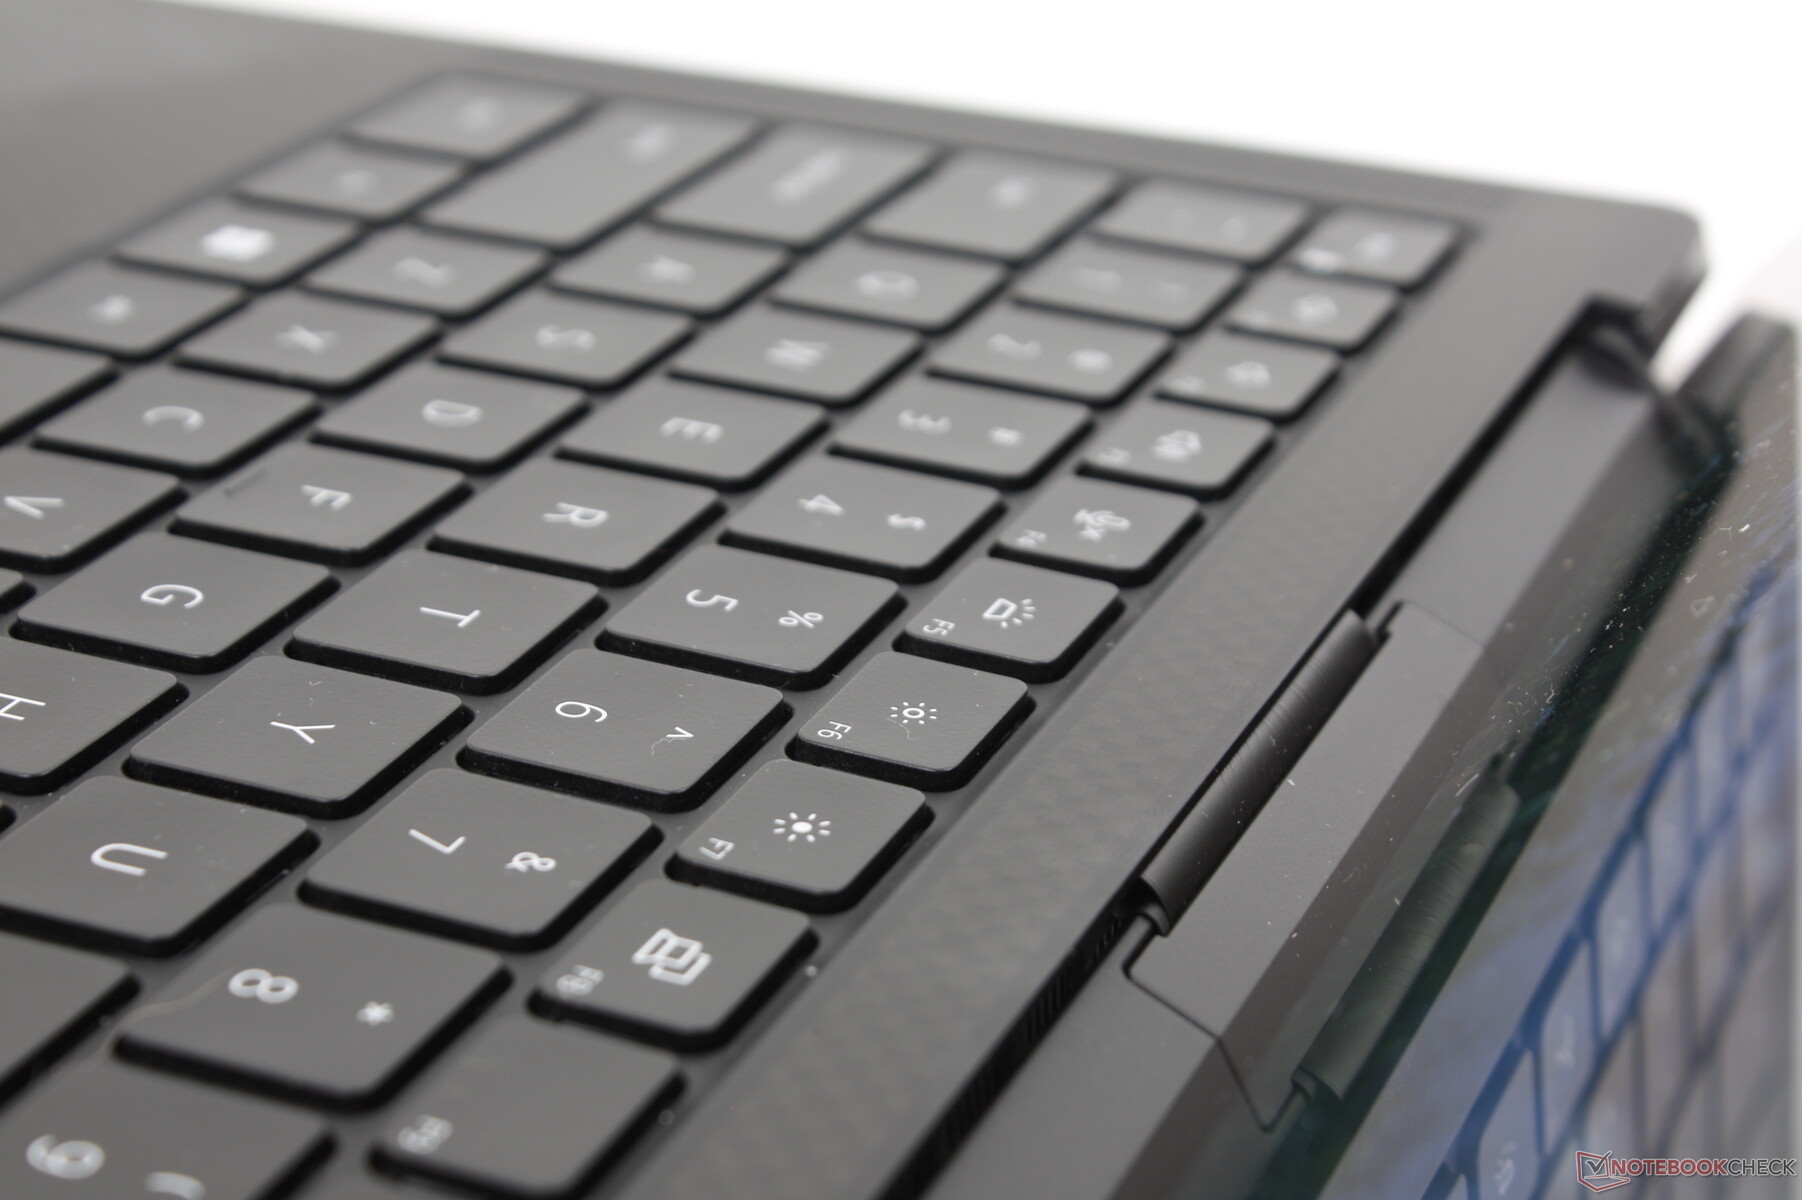
这款机型继承了老款产品的键盘。 XPS 13 9300或9310的设计。如果你以前在XPS 13上打过字,那么你就会知道在Precision 5470上应该期待什么。按键反馈均匀,行程适中,但惠普EliteBook或Firefly系列的按键在按下时往往更清晰或更尖锐。

触摸板

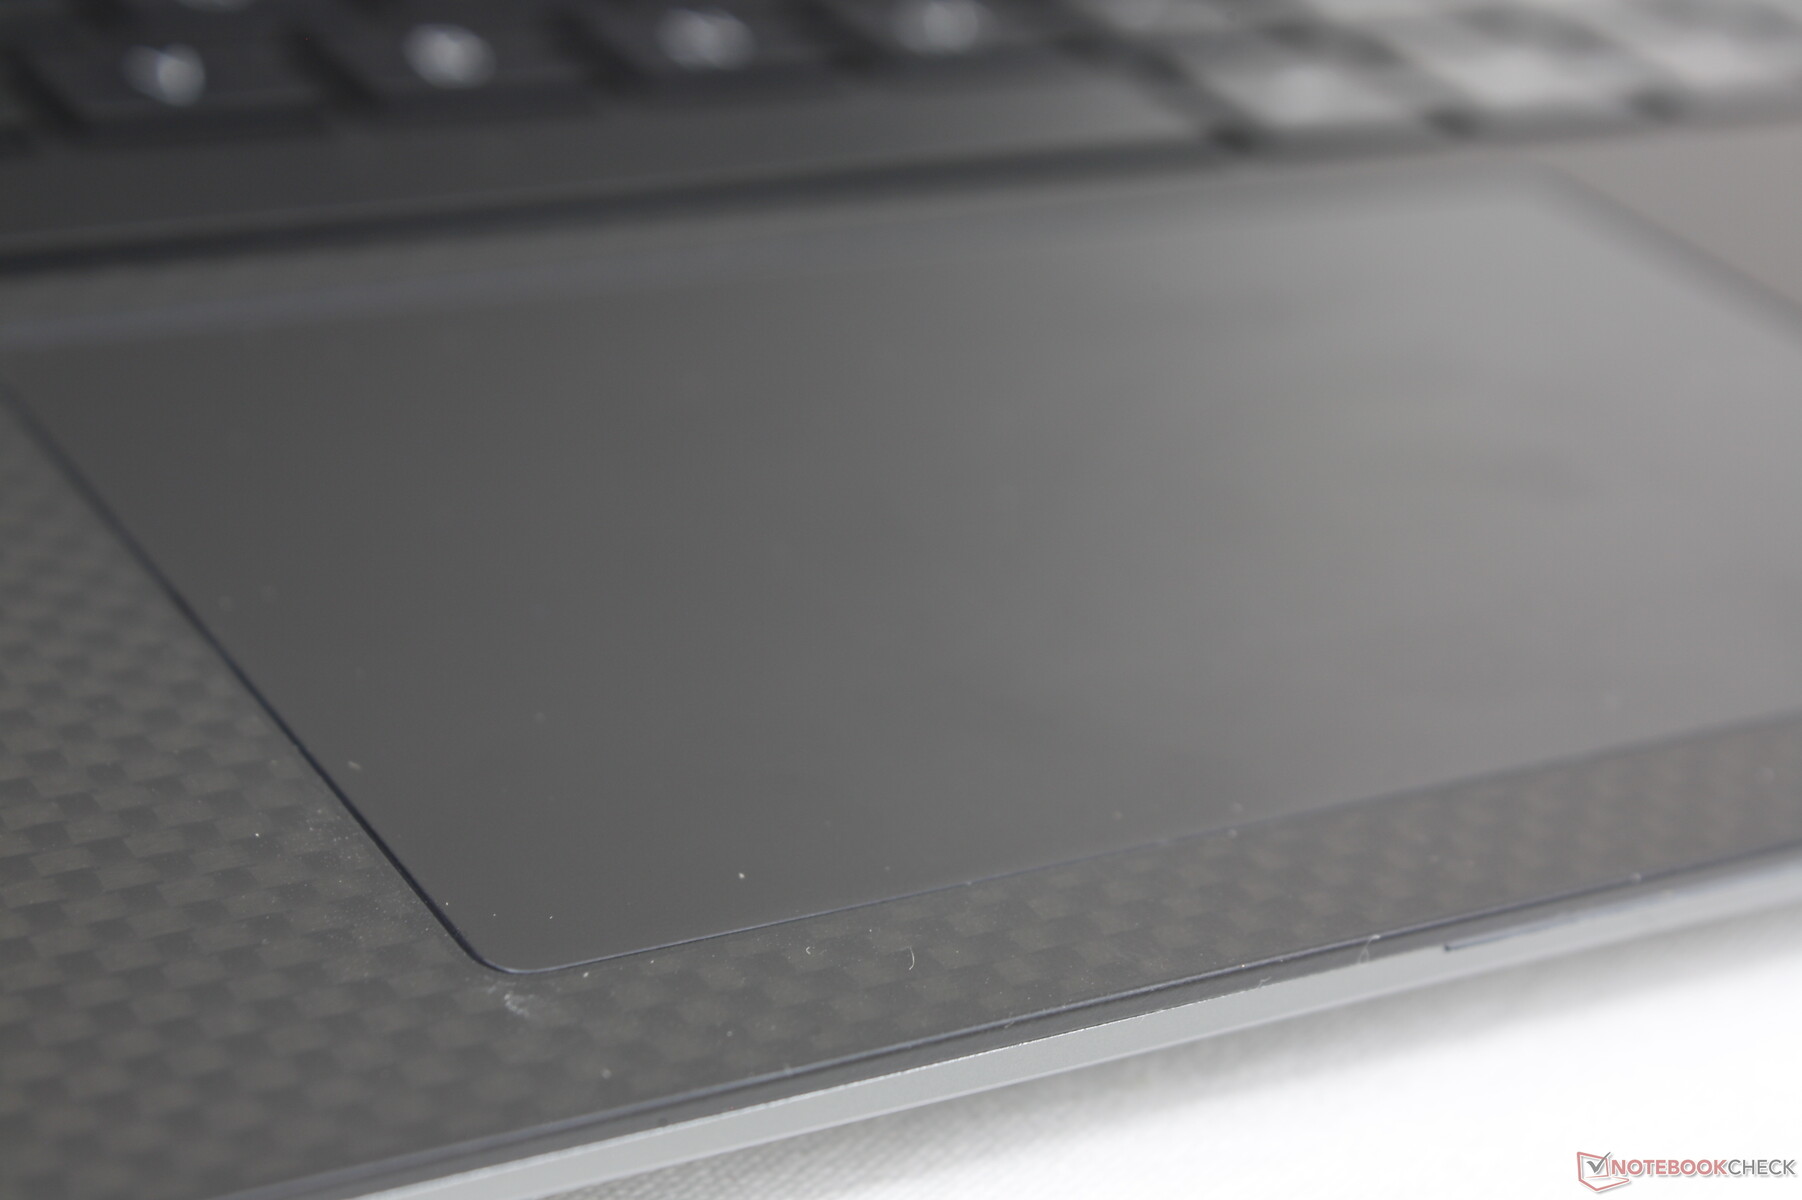
点击板的表面积与XPS 13 9300上的大致相同(10.8 x 6.7厘米对11.2 x 6.5厘米)。牵引力很平稳,只是在较慢的速度下稍有粘性,以便在需要时有更好的精度。在点击板上的反馈相对较软和浅,但与大多数其他笔记本电脑相比,有一个更安静的咔哒声。

传统的XPS布局和按键
传统的XPS布局和按键
两级白色背光可照亮所有按键和符号
两级白色背光可照亮所有按键和符号

显示屏 - 与Latitude 9430 2合1相同

Precision 5470与9430二合一电脑上的友达光电B140QAN IPS触摸屏一样,都是高质量的。 Latitude 9430二合一.因此,这两款机型共享类似的黑白响应时间、色域、对比度,甚至整体亮度。这款显示器对于希望获得全sRGB覆盖率和相对较深的黑色水平的用户来说是非常好的,但不幸的是,它遭受了明显的重影,如果处理涉及快速移动的图形或视频的应用,这可能是一个问题。

没有OLED、AdobeRGB或P3颜色或更高的刷新率选项可供选择,这意味着用户在目前所有的配置上都被限制在IPS和60赫兹。

边缘到边缘的玻璃保护。尽管只有较小的1200p分辨率面板存在哑光选项,但也存在哑光选项。
狭窄的侧面和顶部边框
狭窄的侧面和顶部边框
清晰的RGB子像素,颗粒感最小
清晰的RGB子像素,颗粒感最小
只有沿着角落的轻微不均匀背光出血
只有沿着角落的轻微不均匀背光出血
506.1
cd/m²
510.5
cd/m²
512.5
cd/m²
504.1
cd/m²
537
cd/m²
526.7
cd/m²
511.3
cd/m²
527.9
cd/m²
529.6
cd/m²
Distribution of brightness
AU Optronics B140QAN tested with X-Rite i1Pro 2
Maximum: 537 cd/m² (Nits) Average: 518.4 cd/m² Minimum: 51.46 cd/m²
Brightness Distribution: 94 %
Center on Battery: 537 cd/m²
Contrast: 1627:1 (Black: 0.33 cd/m²)
ΔE Color 2.97 | 0.5-29.43 Ø5, calibrated: 0.88
ΔE Greyscale 2.4 | 0.57-98 Ø5.3
78.7% AdobeRGB 1998 (Argyll 2.2.0 3D)
100% sRGB (Argyll 2.2.0 3D)
79.3% Display P3 (Argyll 2.2.0 3D)
Gamma: 2.06
Dell Precision 5000 5470
AU Optronics B140QAN, IPS, 2560x1600, 14.00
Lenovo ThinkPad P15v G2 21A9000XGE
N156HCA-EAC, IPS LED, 1920x1080, 15.60
Dell Precision 5000 5560
Sharp LQ156R1, IPS, 3840x2400, 15.60
Lenovo ThinkPad P14s G2 AMD
MNE001EA1-5, IPS LED, 3840x2160, 14.00
HP ZBook Firefly 14 G8 2C9Q2EA
AU Optronics AUO068B, IPS, 1920x1080, 14.00
HP ZBook Firefly 14 G7
InfoVision IVO8C78 (X140NVFC R0), IPS, 1920x1080, 14.00
Display
-41%
16%
10%
-7%
-4%
Display P3 Coverage
79.3
43.7
-45%
94.9
20%
96.8
22%


70
-12%
73.8
-7%
sRGB Coverage
100
65.1
-35%
100
0%
99.9
0%


99.5
0%
99
-1%
AdobeRGB 1998 Coverage
78.7
45.3
-42%
100
27%
85.8
9%


71.4
-9%
75.5
-4%
Response Times
11%
8%
8%
-7%
-19%
Response Time Grey 50% / Grey 80% *
52.4 ?(24.4, 28)
48 ?(26, 22)
8%
47.2 ?(25.2, 22)
10%
52 ?(26, 26)
1%
64.4 ?(30.4, 34)
-23%
54.8 ?(28.4, 26.4)
-5%
Response Time Black / White *
32.4 ?(15.6, 16.8)
28 ?(17, 11)
14%
30.4 ?(16.4, 14)
6%
28 ?(13, 15)
14%
29.2 ?(12.4, 16.8)
10%
43.2 ?(25.2, 18)
-33%
PWM Frequency
284.1 ?(100)
Screen
-116%
-24%
-19%
-10%
-27%
Brightness middle
537
305
-43%
501.5
-7%
512
-5%
461
-14%
934
74%
Brightness
518
281
-46%
467
-10%
487
-6%
439
-15%
937
81%
Brightness Distribution
94
88
-6%
83
-12%
90
-4%
89
-5%
87
-7%
Black Level *
0.33
0.32
3%
0.44
-33%
0.35
-6%
0.24
27%
0.37
-12%
Contrast
1627
953
-41%
1140
-30%
1463
-10%
1921
18%
2524
55%
Colorchecker dE 2000 *
2.97
5.9
-99%
4.73
-59%
3.1
-4%
2.6
12%
4.7
-58%
Colorchecker dE 2000 max. *
5.33
20.1
-277%
8.45
-59%
8.4
-58%
5.8
-9%
10.5
-97%
Colorchecker dE 2000 calibrated *
0.88
4.5
-411%
0.51
42%
0.4
55%
1.1
-25%
1.6
-82%
Greyscale dE 2000 *
2.4
5.3
-121%
3.6
-50%
5.5
-129%
4.4
-83%
7.1
-196%
Gamma
2.06 107%
2.1 105%
2.08 106%
2.22 99%
2.29 96%
2.31 95%
CCT
6668 97%
6307 103%
6447 101%
6373 102%
6478 100%
6348 102%
Color Space (Percent of AdobeRGB 1998)
65.2
68.5
Color Space (Percent of sRGB)
99.4
98.9
Total Average (Program / Settings)
-49% / -82%
0% / -11%
-0% / -9%
-8% / -9%
-17% / -21%

* ... smaller is better

vs. sRGB
vs. sRGB
vs. P3
vs. P3

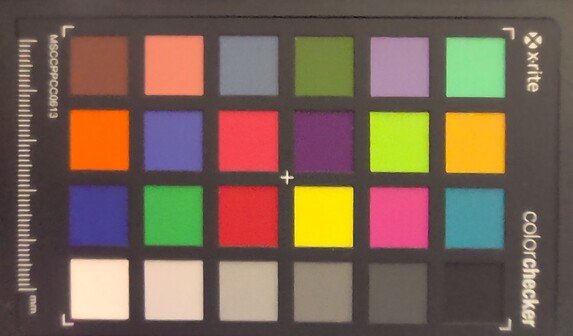
该显示器在开箱时就根据sRGB标准进行了很好的校准,其平均灰度和色彩DeltaE值分别为2.4和2.97。我们能够用X-Rite色度计将这些值进一步提高到<2,如下图的CalMan结果所示。

校准前的灰度
校准前的灰度
校准前的饱和扫频
校准前的饱和扫频
校准前的ColorChecker
校准前的ColorChecker
校准后的灰度
校准后的灰度
校准后的饱和扫频
校准后的饱和扫频
校准后的ColorChecker
校准后的ColorChecker

Display Response Times

Display response times show how fast the screen is able to change from one color to the next. Slow response times can lead to afterimages and can cause moving objects to appear blurry (ghosting). Gamers of fast-paced 3D titles should pay special attention to fast response times.
       Response Time Black to White
32.4 ms ... rise ↗ and fall ↘ combined↗ 15.6 ms rise
↘ 16.8 ms fall
The screen shows slow response rates in our tests and will be unsatisfactory for gamers.
In comparison, all tested devices range from 0.1 (minimum) to 240 (maximum) ms. » 86 % of all devices are better.
This means that the measured response time is worse than the average of all tested devices (21.5 ms).
       Response Time 50% Grey to 80% Grey
52.4 ms ... rise ↗ and fall ↘ combined↗ 24.4 ms rise
↘ 28 ms fall
The screen shows slow response rates in our tests and will be unsatisfactory for gamers.
In comparison, all tested devices range from 0.2 (minimum) to 636 (maximum) ms. » 88 % of all devices are better.
This means that the measured response time is worse than the average of all tested devices (33.7 ms).

Screen Flickering / PWM (Pulse-Width Modulation)

To dim the screen, some notebooks will simply cycle the backlight on and off in rapid succession - a method called Pulse Width Modulation (PWM) . This cycling frequency should ideally be undetectable to the human eye. If said frequency is too low, users with sensitive eyes may experience strain or headaches or even notice the flickering altogether.
Screen flickering / PWM not detected

In comparison: 53 % of all tested devices do not use PWM to dim the display. If PWM was detected, an average of 17844 (minimum: 5 - maximum: 3846000) Hz was measured.

该显示屏比大多数基于消费者的超极本更亮,以获得更好的户外可视性。尽管如此,许多HP EliteBook或 ZBook机型提供1000尼特的面板选项,在户外使用时明显更容易。戴尔还没有为其Precision 系列提供类似的亮度选项。

阳光下的室外
阳光下的室外
在户外的阴凉处
在户外的阴凉处
阳光下的室外
阳光下的室外
宽广的IPS可视角度。只有在从极端角度观看时,对比度和颜色才会发生变化

性能 - 酷睿i9 H系列CPU和独立GPU


测试条件

在运行以下任何基准测试之前,我们通过戴尔优化器软件将我们的设备设置为超性能模式。我们还通过Nvidia控制面板启用了独立的Nvidia GPU。请注意,同样的电源设置可以通过戴尔电源管理器或戴尔优化器进行配置。值得庆幸的是,在一个程序上进行电源配置文件的更改将自动改变另一个程序上的设置。

处理器

CPU性能是一个混合包。当与其他14英寸商务笔记本或工作站相比,Precision 5470提供了明显更快的性能,甚至与更大的工作站如 微星WE76惠普ZBook Fury 17 G8.这基本上是一个为较厚的笔记本电脑设计的CPU,被挤压到14英寸的外形尺寸。当与其他具有相同的笔记本电脑相比 Core i9-12900H然而,我们的Precision 中的处理器平均慢了约15%至20%。

该CPU的另一个缺点是其不稳定的时钟速率。例如,在循环运行CineBench R15 xT时,分数会在1500和2100分之间波动,正如我们的下图所示,这表明时钟速率在波动。相比之下,在惠普ZBook Fury 17 G8或微星Creator Z17上运行同样的测试时,不会出现这样的波动,每台电脑都有Core i9级CPU。

Cinebench R15 Multi Loop

0135270405540675810945108012151350148516201755189020252160229524302565Tooltip
Dell Precision 5000 5470 Intel Core i9-12900H: Ø1847 (1355.47-2312.54)
HP ZBook Fury 17 G8-4A6A9EA Intel Core i9-11950H: Ø1949 (1895.02-2129.93)
MSI WE76 11UM-456 Intel Core i9-11980HK: Ø2021 (1955.32-2192.14)
MSI Creator Z17 A12UGST-054 Intel Core i9-12900H: Ø2349 (2273.63-2626.4)
Cinebench R20: CPU (Multi Core) | CPU (Single Core)
Cinebench R23: Multi Core | Single Core
Cinebench R15: CPU Multi 64Bit | CPU Single 64Bit
Blender: v2.79 BMW27 CPU
7-Zip 18.03: 7z b 4 | 7z b 4 -mmt1
Geekbench 5.5: Multi-Core | Single-Core
HWBOT x265 Benchmark v2.2: 4k Preset
LibreOffice : 20 Documents To PDF
R Benchmark 2.5: Overall mean
Cinebench R20 / CPU (Multi Core)
Average Intel Core i9-12900H
  (2681 - 7471, n=26)
5705 Points +24%
HP ZBook Fury 17 G8-4A6A9EA
Intel Core i9-11950H
5000 Points +9%
Dell Precision 5000 5470
Intel Core i9-12900H
4594 Points
MSI WE76 11UM-456
Intel Core i9-11980HK
4437 Points -3%
HP ZBook Power 15 G8 313S5EA
Intel Core i7-11800H
4363 Points -5%
Asus ProArt StudioBook 16 W7600H5A-2BL2
Intel Xeon W-11955M
4250 Points -7%
Dell Precision 5000 5560
Intel Core i7-11850H
3826 Points -17%
HP ZBook Fury 17 G7 119W5EA
Intel Core i9-10885H
3639 Points -21%
Lenovo ThinkPad P15v G2 21A9000XGE
Intel Core i7-11800H
3600 Points -22%
Lenovo ThinkPad P14s G2 AMD
AMD Ryzen 7 PRO 5850U
3523 Points -23%
Acer ConceptD 9 Pro
Intel Core i9-9980HK
2974 Points -35%
Lenovo ThinkPad P14s Gen2-20VX000GGE
Intel Core i7-1185G7
2269 Points -51%
HP ZBook Firefly 14 G8 2C9Q2EA
Intel Core i7-1165G7
2036 Points -56%
HP ZBook Firefly 14 G7
Intel Core i7-10610U
1663 Points -64%
Cinebench R20 / CPU (Single Core)
Average Intel Core i9-12900H
  (624 - 738, n=26)
705 Points +3%
Dell Precision 5000 5470
Intel Core i9-12900H
685 Points
HP ZBook Fury 17 G8-4A6A9EA
Intel Core i9-11950H
632 Points -8%
MSI WE76 11UM-456
Intel Core i9-11980HK
622 Points -9%
HP ZBook Power 15 G8 313S5EA
Intel Core i7-11800H
585 Points -15%
Dell Precision 5000 5560
Intel Core i7-11850H
583 Points -15%
HP ZBook Firefly 14 G8 2C9Q2EA
Intel Core i7-1165G7
581 Points -15%
Lenovo ThinkPad P15v G2 21A9000XGE
Intel Core i7-11800H
569 Points -17%
Asus ProArt StudioBook 16 W7600H5A-2BL2
Intel Xeon W-11955M
568 Points -17%
Lenovo ThinkPad P14s G2 AMD
AMD Ryzen 7 PRO 5850U
543 Points -21%
Lenovo ThinkPad P14s Gen2-20VX000GGE
Intel Core i7-1185G7
529 Points -23%
Acer ConceptD 9 Pro
Intel Core i9-9980HK
505 Points -26%
HP ZBook Fury 17 G7 119W5EA
Intel Core i9-10885H
489 Points -29%
HP ZBook Firefly 14 G7
Intel Core i7-10610U
482 Points -30%
Cinebench R23 / Multi Core
Average Intel Core i9-12900H
  (7359 - 19648, n=26)
15137 Points +16%
MSI WE76 11UM-456
Intel Core i9-11980HK
13387 Points +2%
HP ZBook Fury 17 G8-4A6A9EA
Intel Core i9-11950H
13113 Points 0%
Dell Precision 5000 5470
Intel Core i9-12900H
13077 (12213.6min - 13076.7max) Points
HP ZBook Power 15 G8 313S5EA
Intel Core i7-11800H
12612 Points -4%
Asus ProArt StudioBook 16 W7600H5A-2BL2
Intel Xeon W-11955M
10862 (10718min - 10862.2max) Points -17%
Lenovo ThinkPad P15v G2 21A9000XGE
Intel Core i7-11800H
10118 Points -23%
Dell Precision 5000 5560
Intel Core i7-11850H
9779 (9273.99min - 9779.26max) Points -25%
Lenovo ThinkPad P14s G2 AMD
AMD Ryzen 7 PRO 5850U
9111 Points -30%
HP ZBook Fury 17 G7 119W5EA
Intel Core i9-10885H
8802 (8415.48min - 8801.64max) Points -33%
Lenovo ThinkPad P14s Gen2-20VX000GGE
Intel Core i7-1185G7
5876 Points -55%
HP ZBook Firefly 14 G7
Intel Core i7-10610U
4245 Points -68%
Cinebench R23 / Single Core
Average Intel Core i9-12900H
  (1634 - 1921, n=26)
1822 Points +3%
Dell Precision 5000 5470
Intel Core i9-12900H
1777 Points
HP ZBook Fury 17 G8-4A6A9EA
Intel Core i9-11950H
1633 Points -8%
MSI WE76 11UM-456
Intel Core i9-11980HK
1613 Points -9%
HP ZBook Power 15 G8 313S5EA
Intel Core i7-11800H
1522 Points -14%
Dell Precision 5000 5560
Intel Core i7-11850H
1513 Points -15%
Lenovo ThinkPad P14s Gen2-20VX000GGE
Intel Core i7-1185G7
1493 Points -16%
Asus ProArt StudioBook 16 W7600H5A-2BL2
Intel Xeon W-11955M
1480 Points -17%
Lenovo ThinkPad P14s G2 AMD
AMD Ryzen 7 PRO 5850U
1401 Points -21%
HP ZBook Fury 17 G7 119W5EA
Intel Core i9-10885H
1284 Points -28%
HP ZBook Firefly 14 G7
Intel Core i7-10610U
1263 Points -29%
Cinebench R15 / CPU Multi 64Bit
Average Intel Core i9-12900H
  (1395 - 3077, n=26)
2468 Points +7%
Dell Precision 5000 5470
Intel Core i9-12900H
2313 (1355.47min - 2312.54max) Points
MSI WE76 11UM-456
Intel Core i9-11980HK
2192 (1955.32min - 2192.14max) Points -5%
HP ZBook Fury 17 G8-4A6A9EA
Intel Core i9-11950H
2130 (1895.02min - 2129.93max) Points -8%
HP ZBook Power 15 G8 313S5EA
Intel Core i7-11800H
2075 (1826.07min - 2075.23max) Points -10%
HP ZBook Power 15 G8 313S5EA
Intel Core i7-11800H
1717 (1548min - 1717max) Points -26%
Asus ProArt StudioBook 16 W7600H5A-2BL2
Intel Xeon W-11955M
1846 (1747.11min - 1845.61max) Points -20%
Lenovo ThinkPad P15v G2 21A9000XGE
Intel Core i7-11800H
1706 Points -26%
Acer ConceptD 9 Pro
Intel Core i9-9980HK
1585 Points -31%
Dell Precision 5000 5560
Intel Core i7-11850H
1547 (1468.05min - 1546.97max) Points -33%
Lenovo ThinkPad P14s G2 AMD
AMD Ryzen 7 PRO 5850U
1527 (1510.92min - 1526.95max) Points -34%
HP ZBook Fury 17 G7 119W5EA
Intel Core i9-10885H
1517 (1429.34min - 1516.82max) Points -34%
Lenovo ThinkPad P14s Gen2-20VX000GGE
Intel Core i7-1185G7
902 (538.67min - 901.88max) Points -61%
HP ZBook Firefly 14 G8 2C9Q2EA
Intel Core i7-1165G7
843 (671.68min - 843.29max) Points -64%
HP ZBook Firefly 14 G7
Intel Core i7-10610U
738 Points -68%
Cinebench R15 / CPU Single 64Bit
Average Intel Core i9-12900H
  (235 - 277, n=27)
262 Points +6%
HP ZBook Fury 17 G8-4A6A9EA
Intel Core i9-11950H
249 Points 0%
Dell Precision 5000 5470
Intel Core i9-12900H
248 Points
MSI WE76 11UM-456
Intel Core i9-11980HK
244 Points -2%
Dell Precision 5000 5560
Intel Core i7-11850H
232 Points -6%
HP ZBook Power 15 G8 313S5EA
Intel Core i7-11800H
231 Points -7%
Asus ProArt StudioBook 16 W7600H5A-2BL2
Intel Xeon W-11955M
230 Points -7%
HP ZBook Firefly 14 G8 2C9Q2EA
Intel Core i7-1165G7
225 Points -9%
Lenovo ThinkPad P14s G2 AMD
AMD Ryzen 7 PRO 5850U
225 Points -9%
Lenovo ThinkPad P15v G2 21A9000XGE
Intel Core i7-11800H
221.7 Points -11%
Lenovo ThinkPad P14s Gen2-20VX000GGE
Intel Core i7-1185G7
213 Points -14%
HP ZBook Fury 17 G7 119W5EA
Intel Core i9-10885H
211 Points -15%
Acer ConceptD 9 Pro
Intel Core i9-9980HK
201 Points -19%
HP ZBook Firefly 14 G7
Intel Core i7-10610U
200 Points -19%
Blender / v2.79 BMW27 CPU
HP ZBook Firefly 14 G7
Intel Core i7-10610U
641 Seconds * -158%
Lenovo ThinkPad P14s Gen2-20VX000GGE
Intel Core i7-1185G7
630 Seconds * -154%
HP ZBook Firefly 14 G8 2C9Q2EA
Intel Core i7-1165G7
580 Seconds * -134%
Lenovo ThinkPad P14s G2 AMD
AMD Ryzen 7 PRO 5850U
331 Seconds * -33%
Lenovo ThinkPad P15v G2 21A9000XGE
Intel Core i7-11800H
319 Seconds * -29%
Dell Precision 5000 5560
Intel Core i7-11850H
313 Seconds * -26%
HP ZBook Fury 17 G7 119W5EA
Intel Core i9-10885H
302 Seconds * -22%
Asus ProArt StudioBook 16 W7600H5A-2BL2
Intel Xeon W-11955M
276 Seconds * -11%
HP ZBook Power 15 G8 313S5EA
Intel Core i7-11800H
258 Seconds * -4%
Dell Precision 5000 5470
Intel Core i9-12900H
248 Seconds *
HP ZBook Fury 17 G8-4A6A9EA
Intel Core i9-11950H
244 Seconds * +2%
Average Intel Core i9-12900H
  (160 - 451, n=26)
232 Seconds * +6%
7-Zip 18.03 / 7z b 4
Average Intel Core i9-12900H
  (34684 - 76677, n=26)
60982 MIPS +17%
MSI WE76 11UM-456
Intel Core i9-11980HK
53426 MIPS +3%
Dell Precision 5000 5470
Intel Core i9-12900H
51968 MIPS
HP ZBook Fury 17 G8-4A6A9EA
Intel Core i9-11950H
51402 MIPS -1%
HP ZBook Power 15 G8 313S5EA
Intel Core i7-11800H
48410 MIPS -7%
Asus ProArt StudioBook 16 W7600H5A-2BL2
Intel Xeon W-11955M
47264 MIPS -9%
Lenovo ThinkPad P14s G2 AMD
AMD Ryzen 7 PRO 5850U
45543 MIPS -12%
Dell Precision 5000 5560
Intel Core i7-11850H
44890 MIPS -14%
HP ZBook Fury 17 G7 119W5EA
Intel Core i9-10885H
41823 MIPS -20%
Acer ConceptD 9 Pro
Intel Core i9-9980HK
39571 MIPS -24%
Lenovo ThinkPad P15v G2 21A9000XGE
Intel Core i7-11800H
37996 MIPS -27%
HP ZBook Firefly 14 G8 2C9Q2EA
Intel Core i7-1165G7
22854 MIPS -56%
Lenovo ThinkPad P14s Gen2-20VX000GGE
Intel Core i7-1185G7
21244 MIPS -59%
HP ZBook Firefly 14 G7
Intel Core i7-10610U
20332 MIPS -61%
7-Zip 18.03 / 7z b 4 -mmt1
HP ZBook Fury 17 G8-4A6A9EA
Intel Core i9-11950H
5919 MIPS +8%
Average Intel Core i9-12900H
  (5302 - 6289, n=26)
5836 MIPS +6%
Dell Precision 5000 5560
Intel Core i7-11850H
5727 MIPS +4%
MSI WE76 11UM-456
Intel Core i9-11980HK
5726 MIPS +4%
HP ZBook Power 15 G8 313S5EA
Intel Core i7-11800H
5676 MIPS +3%
HP ZBook Fury 17 G7 119W5EA
Intel Core i9-10885H
5589 MIPS +2%
Lenovo ThinkPad P14s Gen2-20VX000GGE
Intel Core i7-1185G7
5507 MIPS 0%
Dell Precision 5000 5470
Intel Core i9-12900H
5505 MIPS
Acer ConceptD 9 Pro
Intel Core i9-9980HK
5412 MIPS -2%
HP ZBook Firefly 14 G8 2C9Q2EA
Intel Core i7-1165G7
5352 MIPS -3%
Lenovo ThinkPad P14s G2 AMD
AMD Ryzen 7 PRO 5850U
5300 MIPS -4%
Lenovo ThinkPad P15v G2 21A9000XGE
Intel Core i7-11800H
5250 MIPS -5%
Asus ProArt StudioBook 16 W7600H5A-2BL2
Intel Xeon W-11955M
5222 MIPS -5%
HP ZBook Firefly 14 G7
Intel Core i7-10610U
4853 MIPS -12%
Geekbench 5.5 / Multi-Core
Dell Precision 5000 5470
Intel Core i9-12900H
12252 Points
Average Intel Core i9-12900H
  (8519 - 14376, n=29)
11920 Points -3%
MSI WE76 11UM-456
Intel Core i9-11980HK
10081 Points -18%
Asus ProArt StudioBook 16 W7600H5A-2BL2
Intel Xeon W-11955M
8349 Points -32%
HP ZBook Fury 17 G8-4A6A9EA
Intel Core i9-11950H
8152 Points -33%
HP ZBook Power 15 G8 313S5EA
Intel Core i7-11800H
7941 Points -35%
Acer ConceptD 9 Pro
Intel Core i9-9980HK
7703 Points -37%
Lenovo ThinkPad P14s G2 AMD
AMD Ryzen 7 PRO 5850U
7039 Points -43%
HP ZBook Fury 17 G7 119W5EA
Intel Core i9-10885H
6529 Points -47%
Lenovo ThinkPad P15v G2 21A9000XGE
Intel Core i7-11800H
6379 Points -48%
Lenovo ThinkPad P14s Gen2-20VX000GGE
Intel Core i7-1185G7
5692 Points -54%
HP ZBook Firefly 14 G8 2C9Q2EA
Intel Core i7-1165G7
4999 Points -59%
HP ZBook Firefly 14 G7
Intel Core i7-10610U
4386 Points -64%
Geekbench 5.5 / Single-Core
Dell Precision 5000 5470
Intel Core i9-12900H
1805 Points
Average Intel Core i9-12900H
  (1631 - 1892, n=29)
1795 Points -1%
MSI WE76 11UM-456
Intel Core i9-11980HK
1679 Points -7%
Lenovo ThinkPad P14s Gen2-20VX000GGE
Intel Core i7-1185G7
1626 Points -10%
HP ZBook Fury 17 G8-4A6A9EA
Intel Core i9-11950H
1623 Points -10%
HP ZBook Firefly 14 G8 2C9Q2EA
Intel Core i7-1165G7
1551 Points -14%
HP ZBook Power 15 G8 313S5EA
Intel Core i7-11800H
1528 Points -15%
Asus ProArt StudioBook 16 W7600H5A-2BL2
Intel Xeon W-11955M
1487 Points -18%
Lenovo ThinkPad P15v G2 21A9000XGE
Intel Core i7-11800H
1476 Points -18%
Lenovo ThinkPad P14s G2 AMD
AMD Ryzen 7 PRO 5850U
1448 Points -20%
HP ZBook Fury 17 G7 119W5EA
Intel Core i9-10885H
1317 Points -27%
Acer ConceptD 9 Pro
Intel Core i9-9980HK
1314 Points -27%
HP ZBook Firefly 14 G7
Intel Core i7-10610U
1261 Points -30%
HWBOT x265 Benchmark v2.2 / 4k Preset
Average Intel Core i9-12900H
  (8.05 - 22.5, n=26)
17.1 fps +28%
MSI WE76 11UM-456
Intel Core i9-11980HK
15.8 fps +18%
HP ZBook Fury 17 G8-4A6A9EA
Intel Core i9-11950H
14.2 fps +6%
HP ZBook Power 15 G8 313S5EA
Intel Core i7-11800H
13.8 fps +3%
Asus ProArt StudioBook 16 W7600H5A-2BL2
Intel Xeon W-11955M
13.4 fps 0%
Dell Precision 5000 5470
Intel Core i9-12900H
13.4 fps
Dell Precision 5000 5560
Intel Core i7-11850H
12.6 fps -6%
Lenovo ThinkPad P14s G2 AMD
AMD Ryzen 7 PRO 5850U
11.6 fps -13%
Lenovo ThinkPad P15v G2 21A9000XGE
Intel Core i7-11800H
11.6 fps -13%
HP ZBook Fury 17 G7 119W5EA
Intel Core i9-10885H
11.3 fps -16%
Lenovo ThinkPad P14s Gen2-20VX000GGE
Intel Core i7-1185G7
7.18 fps -46%
HP ZBook Firefly 14 G8 2C9Q2EA
Intel Core i7-1165G7
6.7 fps -50%
HP ZBook Firefly 14 G7
Intel Core i7-10610U
5.63 fps -58%
LibreOffice / 20 Documents To PDF
HP ZBook Firefly 14 G7
Intel Core i7-10610U
106 s * -131%
Acer ConceptD 9 Pro
Intel Core i9-9980HK
57.5 s * -26%
HP ZBook Fury 17 G7 119W5EA
Intel Core i9-10885H
54.8 s * -20%
Lenovo ThinkPad P15v G2 21A9000XGE
Intel Core i7-11800H
54 s * -18%
HP ZBook Fury 17 G8-4A6A9EA
Intel Core i9-11950H
53.2 s * -16%
HP ZBook Firefly 14 G8 2C9Q2EA
Intel Core i7-1165G7
52.8 s * -15%
Lenovo ThinkPad P14s G2 AMD
AMD Ryzen 7 PRO 5850U
49.2 s * -7%
Dell Precision 5000 5560
Intel Core i7-11850H
48 s * -5%
MSI WE76 11UM-456
Intel Core i9-11980HK
47.7 s * -4%
Dell Precision 5000 5470
Intel Core i9-12900H
45.8 s *
HP ZBook Power 15 G8 313S5EA
Intel Core i7-11800H
42.8 s * +7%
Average Intel Core i9-12900H
  (36.8 - 59.8, n=26)
42.6 s * +7%
Lenovo ThinkPad P14s Gen2-20VX000GGE
Intel Core i7-1185G7
41.3 s * +10%
Asus ProArt StudioBook 16 W7600H5A-2BL2
Intel Xeon W-11955M
23 s * +50%
R Benchmark 2.5 / Overall mean
HP ZBook Firefly 14 G7
Intel Core i7-10610U
0.637 sec * -34%
HP ZBook Power 15 G8 313S5EA
Intel Core i7-11800H
0.615 sec * -29%
Lenovo ThinkPad P15v G2 21A9000XGE
Intel Core i7-11800H
0.594 sec * -25%
HP ZBook Fury 17 G7 119W5EA
Intel Core i9-10885H
0.571 sec * -20%
Asus ProArt StudioBook 16 W7600H5A-2BL2
Intel Xeon W-11955M
0.57 sec * -19%
HP ZBook Firefly 14 G8 2C9Q2EA
Intel Core i7-1165G7
0.567 sec * -19%
Lenovo ThinkPad P14s Gen2-20VX000GGE
Intel Core i7-1185G7
0.55 sec * -15%
MSI WE76 11UM-456
Intel Core i9-11980HK
0.545 sec * -14%
Lenovo ThinkPad P14s G2 AMD
AMD Ryzen 7 PRO 5850U
0.543 sec * -14%
Dell Precision 5000 5560
Intel Core i7-11850H
0.543 sec * -14%
HP ZBook Fury 17 G8-4A6A9EA
Intel Core i9-11950H
0.521 sec * -9%
Dell Precision 5000 5470
Intel Core i9-12900H
0.4771 sec *
Average Intel Core i9-12900H
  (0.4218 - 0.506, n=26)
0.4551 sec * +5%
Cinebench R20: CPU (Multi Core) | CPU (Single Core)
Cinebench R23: Multi Core | Single Core
Cinebench R15: CPU Multi 64Bit | CPU Single 64Bit
Blender: v2.79 BMW27 CPU
7-Zip 18.03: 7z b 4 | 7z b 4 -mmt1
Geekbench 5.5: Multi-Core | Single-Core
HWBOT x265 Benchmark v2.2: 4k Preset
LibreOffice : 20 Documents To PDF
R Benchmark 2.5: Overall mean

* ... smaller is better

Cinebench R15 CPU Multi 64Bit
2313 Points
Cinebench R15 OpenGL 64Bit
294 fps
Cinebench R15 Ref. Match 64Bit
99.6 %
Cinebench R15 CPU Single 64Bit
248 Points
Help
Performance Rating
Average Intel Core i9-12900H
 
87.1 pt
Dell Precision 5000 5470
Intel Core i9-12900H, RTX A1000 Laptop GPU
84.1 pt
Lenovo ThinkPad P14s G2 AMD
AMD Ryzen 7 PRO 5850U, Vega 8
80.7 pt
Lenovo ThinkPad P15v G2 21A9000XGE
Intel Core i7-11800H, T1200 Laptop GPU
80.6 pt
HP ZBook Firefly 14 G8 2C9Q2EA
Intel Core i7-1165G7, T500 Laptop GPU
50.8 pt
HP ZBook Firefly 14 G7
Intel Core i7-10610U, Quadro P520
39.7 pt
AIDA64 / FP32 Ray-Trace
Dell Precision 5000 5470
Intel Core i9-12900H, RTX A1000 Laptop GPU
12918 KRay/s
Lenovo ThinkPad P15v G2 21A9000XGE
Intel Core i7-11800H, T1200 Laptop GPU
12429 KRay/s -4%
Average Intel Core i9-12900H
  (4074 - 18289, n=26)
11009 KRay/s -15%
Lenovo ThinkPad P14s G2 AMD
AMD Ryzen 7 PRO 5850U, Vega 8
10606 KRay/s -18%
HP ZBook Firefly 14 G8 2C9Q2EA
Intel Core i7-1165G7, T500 Laptop GPU
6909 KRay/s -47%
HP ZBook Firefly 14 G7
Intel Core i7-10610U, Quadro P520
5313 KRay/s -59%
AIDA64 / FPU Julia
Lenovo ThinkPad P14s G2 AMD
AMD Ryzen 7 PRO 5850U, Vega 8
65754 Points +1%
Dell Precision 5000 5470
Intel Core i9-12900H, RTX A1000 Laptop GPU
65170 Points
Average Intel Core i9-12900H
  (22307 - 93236, n=26)
54468 Points -16%
Lenovo ThinkPad P15v G2 21A9000XGE
Intel Core i7-11800H, T1200 Laptop GPU
53052 Points -19%
HP ZBook Firefly 14 G8 2C9Q2EA
Intel Core i7-1165G7, T500 Laptop GPU
29814 Points -54%
HP ZBook Firefly 14 G7
Intel Core i7-10610U, Quadro P520
27989 Points -57%
AIDA64 / CPU SHA3
Lenovo ThinkPad P15v G2 21A9000XGE
Intel Core i7-11800H, T1200 Laptop GPU
3437 MB/s +17%
Average Intel Core i9-12900H
  (1378 - 4215, n=26)
3042 MB/s +3%
Dell Precision 5000 5470
Intel Core i9-12900H, RTX A1000 Laptop GPU
2950 MB/s
Lenovo ThinkPad P14s G2 AMD
AMD Ryzen 7 PRO 5850U, Vega 8
2322 MB/s -21%
HP ZBook Firefly 14 G8 2C9Q2EA
Intel Core i7-1165G7, T500 Laptop GPU
1921 MB/s -35%
HP ZBook Firefly 14 G7
Intel Core i7-10610U, Quadro P520
1344 MB/s -54%
AIDA64 / CPU Queen
Dell Precision 5000 5470
Intel Core i9-12900H, RTX A1000 Laptop GPU
109214 Points
Average Intel Core i9-12900H
  (78172 - 111241, n=26)
100783 Points -8%
Lenovo ThinkPad P15v G2 21A9000XGE
Intel Core i7-11800H, T1200 Laptop GPU
90186 Points -17%
Lenovo ThinkPad P14s G2 AMD
AMD Ryzen 7 PRO 5850U, Vega 8
82538 Points -24%
HP ZBook Firefly 14 G7
Intel Core i7-10610U, Quadro P520
52220 Points -52%
HP ZBook Firefly 14 G8 2C9Q2EA
Intel Core i7-1165G7, T500 Laptop GPU
49352 Points -55%
AIDA64 / FPU SinJulia
Lenovo ThinkPad P14s G2 AMD
AMD Ryzen 7 PRO 5850U, Vega 8
10108 Points +18%
Average Intel Core i9-12900H
  (5709 - 10410, n=26)
9023 Points +5%
Lenovo ThinkPad P15v G2 21A9000XGE
Intel Core i7-11800H, T1200 Laptop GPU
8815 Points +3%
Dell Precision 5000 5470
Intel Core i9-12900H, RTX A1000 Laptop GPU
8599 Points
HP ZBook Firefly 14 G8 2C9Q2EA
Intel Core i7-1165G7, T500 Laptop GPU
4749 Points -45%
HP ZBook Firefly 14 G7
Intel Core i7-10610U, Quadro P520
4662 Points -46%
AIDA64 / FPU Mandel
Lenovo ThinkPad P14s G2 AMD
AMD Ryzen 7 PRO 5850U, Vega 8
36663 Points +16%
Dell Precision 5000 5470
Intel Core i9-12900H, RTX A1000 Laptop GPU
31638 Points
Lenovo ThinkPad P15v G2 21A9000XGE
Intel Core i7-11800H, T1200 Laptop GPU
31515 Points 0%
Average Intel Core i9-12900H
  (11257 - 45581, n=26)
28287 Points -11%
HP ZBook Firefly 14 G8 2C9Q2EA
Intel Core i7-1165G7, T500 Laptop GPU
17895 Points -43%
HP ZBook Firefly 14 G7
Intel Core i7-10610U, Quadro P520
13758 Points -57%
AIDA64 / CPU AES
Lenovo ThinkPad P14s G2 AMD
AMD Ryzen 7 PRO 5850U, Vega 8
94210 MB/s +171%
Average Intel Core i9-12900H
  (31935 - 151546, n=26)
85619 MB/s +147%
Lenovo ThinkPad P15v G2 21A9000XGE
Intel Core i7-11800H, T1200 Laptop GPU
74617 MB/s +115%
HP ZBook Firefly 14 G8 2C9Q2EA
Intel Core i7-1165G7, T500 Laptop GPU
67771 MB/s +95%
Dell Precision 5000 5470
Intel Core i9-12900H, RTX A1000 Laptop GPU
34721 MB/s
HP ZBook Firefly 14 G7
Intel Core i7-10610U, Quadro P520
17719 MB/s -49%
AIDA64 / CPU ZLib
Average Intel Core i9-12900H
  (449 - 1193, n=26)
933 MB/s +108%
Lenovo ThinkPad P15v G2 21A9000XGE
Intel Core i7-11800H, T1200 Laptop GPU
681 MB/s +52%
Lenovo ThinkPad P14s G2 AMD
AMD Ryzen 7 PRO 5850U, Vega 8
599 MB/s +33%
Dell Precision 5000 5470
Intel Core i9-12900H, RTX A1000 Laptop GPU
449 MB/s
HP ZBook Firefly 14 G8 2C9Q2EA
Intel Core i7-1165G7, T500 Laptop GPU
379 MB/s -16%
HP ZBook Firefly 14 G7
Intel Core i7-10610U, Quadro P520
362 MB/s -19%
AIDA64 / FP64 Ray-Trace
Dell Precision 5000 5470
Intel Core i9-12900H, RTX A1000 Laptop GPU
7085 KRay/s
Lenovo ThinkPad P15v G2 21A9000XGE
Intel Core i7-11800H, T1200 Laptop GPU
6747 KRay/s -5%
Average Intel Core i9-12900H
  (2235 - 10511, n=26)
6117 KRay/s -14%
Lenovo ThinkPad P14s G2 AMD
AMD Ryzen 7 PRO 5850U, Vega 8
5599 KRay/s -21%
HP ZBook Firefly 14 G8 2C9Q2EA
Intel Core i7-1165G7, T500 Laptop GPU
3724 KRay/s -47%
HP ZBook Firefly 14 G7
Intel Core i7-10610U, Quadro P520
2833 KRay/s -60%
AIDA64 / CPU PhotoWorxx
Dell Precision 5000 5470
Intel Core i9-12900H, RTX A1000 Laptop GPU
46123 MPixel/s
Average Intel Core i9-12900H
  (20960 - 48269, n=27)
36335 MPixel/s -21%
HP ZBook Firefly 14 G8 2C9Q2EA
Intel Core i7-1165G7, T500 Laptop GPU
21725 MPixel/s -53%
HP ZBook Firefly 14 G7
Intel Core i7-10610U, Quadro P520
20866 MPixel/s -55%
Lenovo ThinkPad P14s G2 AMD
AMD Ryzen 7 PRO 5850U, Vega 8
17829 MPixel/s -61%
Lenovo ThinkPad P15v G2 21A9000XGE
Intel Core i7-11800H, T1200 Laptop GPU
11898 MPixel/s -74%

系统性能

与其他移动工作站相比,PCMark 10的结果高于预期。我们把这归功于第12代酷睿i9 H系列CPU和PCIe4 x4固态硬盘,这对14英寸工作站来说是相对不常见的选择。

PCMark 10 / Score
Dell Precision 5000 5470
RTX A1000 Laptop GPU, i9-12900H, Samsung PM9A1 MZVL21T0HCLR
6870 Points
Average Intel Core i9-12900H, NVIDIA RTX A1000 Laptop GPU
  ()
6870 Points 0%
Dell Precision 5000 5560
RTX A2000 Laptop GPU, i7-11850H, Samsung PM9A1 MZVL22T0HBLB
6676 Points -3%
Lenovo ThinkPad P15v G2 21A9000XGE
T1200 Laptop GPU, i7-11800H, Toshiba XG6 KXG6AZNV512G
5889 Points -14%
Lenovo ThinkPad P14s G2 AMD
Vega 8, R7 PRO 5850U, SK Hynix PC711 1TB HFS001TDE9X081N
5491 Points -20%
HP ZBook Firefly 14 G8 2C9Q2EA
T500 Laptop GPU, i7-1165G7, Toshiba XG6 KXG60ZNV1T02
5282 Points -23%
HP ZBook Firefly 14 G7
Quadro P520, i7-10610U, Toshiba XG6 KXG60ZNV512G
4456 Points -35%
PCMark 10 / Essentials
Dell Precision 5000 5470
RTX A1000 Laptop GPU, i9-12900H, Samsung PM9A1 MZVL21T0HCLR
10876 Points
Average Intel Core i9-12900H, NVIDIA RTX A1000 Laptop GPU
  ()
10876 Points 0%
Dell Precision 5000 5560
RTX A2000 Laptop GPU, i7-11850H, Samsung PM9A1 MZVL22T0HBLB
10596 Points -3%
Lenovo ThinkPad P15v G2 21A9000XGE
T1200 Laptop GPU, i7-11800H, Toshiba XG6 KXG6AZNV512G
9776 Points -10%
Lenovo ThinkPad P14s G2 AMD
Vega 8, R7 PRO 5850U, SK Hynix PC711 1TB HFS001TDE9X081N
8772 Points -19%
HP ZBook Firefly 14 G8 2C9Q2EA
T500 Laptop GPU, i7-1165G7, Toshiba XG6 KXG60ZNV1T02
8765 Points -19%
HP ZBook Firefly 14 G7
Quadro P520, i7-10610U, Toshiba XG6 KXG60ZNV512G
8494 Points -22%
PCMark 10 / Productivity
Dell Precision 5000 5560
RTX A2000 Laptop GPU, i7-11850H, Samsung PM9A1 MZVL22T0HBLB
9005 Points +6%
Lenovo ThinkPad P14s G2 AMD
Vega 8, R7 PRO 5850U, SK Hynix PC711 1TB HFS001TDE9X081N
8967 Points +5%
Dell Precision 5000 5470
RTX A1000 Laptop GPU, i9-12900H, Samsung PM9A1 MZVL21T0HCLR
8522 Points
Average Intel Core i9-12900H, NVIDIA RTX A1000 Laptop GPU
  ()
8522 Points 0%
HP ZBook Firefly 14 G8 2C9Q2EA
T500 Laptop GPU, i7-1165G7, Toshiba XG6 KXG60ZNV1T02
8337 Points -2%
Lenovo ThinkPad P15v G2 21A9000XGE
T1200 Laptop GPU, i7-11800H, Toshiba XG6 KXG6AZNV512G
8276 Points -3%
HP ZBook Firefly 14 G7
Quadro P520, i7-10610U, Toshiba XG6 KXG60ZNV512G
7060 Points -17%
PCMark 10 / Digital Content Creation
Dell Precision 5000 5470
RTX A1000 Laptop GPU, i9-12900H, Samsung PM9A1 MZVL21T0HCLR
9494 Points
Average Intel Core i9-12900H, NVIDIA RTX A1000 Laptop GPU
  ()
9494 Points 0%
Dell Precision 5000 5560
RTX A2000 Laptop GPU, i7-11850H, Samsung PM9A1 MZVL22T0HBLB
8463 Points -11%
Lenovo ThinkPad P15v G2 21A9000XGE
T1200 Laptop GPU, i7-11800H, Toshiba XG6 KXG6AZNV512G
6851 Points -28%
Lenovo ThinkPad P14s G2 AMD
Vega 8, R7 PRO 5850U, SK Hynix PC711 1TB HFS001TDE9X081N
5714 Points -40%
HP ZBook Firefly 14 G8 2C9Q2EA
T500 Laptop GPU, i7-1165G7, Toshiba XG6 KXG60ZNV1T02
5476 Points -42%
HP ZBook Firefly 14 G7
Quadro P520, i7-10610U, Toshiba XG6 KXG60ZNV512G
4006 Points -58%
CrossMark / Overall
Dell Precision 5000 5470
RTX A1000 Laptop GPU, i9-12900H, Samsung PM9A1 MZVL21T0HCLR
1801 Points
Average Intel Core i9-12900H, NVIDIA RTX A1000 Laptop GPU
  ()
1801 Points 0%
Lenovo ThinkPad P15v G2 21A9000XGE
T1200 Laptop GPU, i7-11800H, Toshiba XG6 KXG6AZNV512G
1367 Points -24%
CrossMark / Productivity
Dell Precision 5000 5470
RTX A1000 Laptop GPU, i9-12900H, Samsung PM9A1 MZVL21T0HCLR
1679 Points
Average Intel Core i9-12900H, NVIDIA RTX A1000 Laptop GPU
  ()
1679 Points 0%
Lenovo ThinkPad P15v G2 21A9000XGE
T1200 Laptop GPU, i7-11800H, Toshiba XG6 KXG6AZNV512G
1389 Points -17%
CrossMark / Creativity
Dell Precision 5000 5470
RTX A1000 Laptop GPU, i9-12900H, Samsung PM9A1 MZVL21T0HCLR
2060 Points
Average Intel Core i9-12900H, NVIDIA RTX A1000 Laptop GPU
  ()
2060 Points 0%
Lenovo ThinkPad P15v G2 21A9000XGE
T1200 Laptop GPU, i7-11800H, Toshiba XG6 KXG6AZNV512G
1430 Points -31%
CrossMark / Responsiveness
Dell Precision 5000 5470
RTX A1000 Laptop GPU, i9-12900H, Samsung PM9A1 MZVL21T0HCLR
1488 Points
Average Intel Core i9-12900H, NVIDIA RTX A1000 Laptop GPU
  ()
1488 Points 0%
Lenovo ThinkPad P15v G2 21A9000XGE
T1200 Laptop GPU, i7-11800H, Toshiba XG6 KXG6AZNV512G
1137 Points -24%
PCMark 10 Score
6870 points
Help
AIDA64 / Memory Copy
Dell Precision 5000 5470
Intel Core i9-12900H, RTX A1000 Laptop GPU
70937 MB/s
Average Intel Core i9-12900H
  (34438 - 74264, n=26)
58643 MB/s -17%
Lenovo ThinkPad P14s G2 AMD
AMD Ryzen 7 PRO 5850U, Vega 8
38412 MB/s -46%
HP ZBook Firefly 14 G8 2C9Q2EA
Intel Core i7-1165G7, T500 Laptop GPU
36216 MB/s -49%
HP ZBook Firefly 14 G7
Intel Core i7-10610U, Quadro P520
31528 MB/s -56%
Lenovo ThinkPad P15v G2 21A9000XGE
Intel Core i7-11800H, T1200 Laptop GPU
24508 MB/s -65%
AIDA64 / Memory Read
Dell Precision 5000 5470
Intel Core i9-12900H, RTX A1000 Laptop GPU
73331 MB/s
Average Intel Core i9-12900H
  (36365 - 74642, n=26)
61370 MB/s -16%
Lenovo ThinkPad P14s G2 AMD
AMD Ryzen 7 PRO 5850U, Vega 8
43938 MB/s -40%
HP ZBook Firefly 14 G8 2C9Q2EA
Intel Core i7-1165G7, T500 Laptop GPU
43806 MB/s -40%
HP ZBook Firefly 14 G7
Intel Core i7-10610U, Quadro P520
36015 MB/s -51%
Lenovo ThinkPad P15v G2 21A9000XGE
Intel Core i7-11800H, T1200 Laptop GPU
25882 MB/s -65%
AIDA64 / Memory Write
Dell Precision 5000 5470
Intel Core i9-12900H, RTX A1000 Laptop GPU
62635 MB/s
Average Intel Core i9-12900H
  (32276 - 67858, n=26)
58829 MB/s -6%
HP ZBook Firefly 14 G8 2C9Q2EA
Intel Core i7-1165G7, T500 Laptop GPU
40480 MB/s -35%
Lenovo ThinkPad P14s G2 AMD
AMD Ryzen 7 PRO 5850U, Vega 8
38997 MB/s -38%
HP ZBook Firefly 14 G7
Intel Core i7-10610U, Quadro P520
38467 MB/s -39%
Lenovo ThinkPad P15v G2 21A9000XGE
Intel Core i7-11800H, T1200 Laptop GPU
22240 MB/s -64%
AIDA64 / Memory Latency
Dell Precision 5000 5470
Intel Core i9-12900H, RTX A1000 Laptop GPU
112.8 ns *
Lenovo ThinkPad P14s G2 AMD
AMD Ryzen 7 PRO 5850U, Vega 8
94.7 ns * +16%
Lenovo ThinkPad P15v G2 21A9000XGE
Intel Core i7-11800H, T1200 Laptop GPU
94.2 ns * +16%
Average Intel Core i9-12900H
  (74.7 - 118.1, n=25)
85.4 ns * +24%
HP ZBook Firefly 14 G7
Intel Core i7-10610U, Quadro P520
83.1 ns * +26%
HP ZBook Firefly 14 G8 2C9Q2EA
Intel Core i7-1165G7, T500 Laptop GPU
49.3 ns * +56%

* ... smaller is better

DPC延时

LatencyMon显示,在我们的主页上打开多个浏览器标签时有轻微的DPC问题,这在工作站上看到有点令人失望。在我们长达1分钟的视频测试中,4K播放在60FPS下是完美的,没有丢帧。

DPC Latencies / LatencyMon - interrupt to process latency (max), Web, Youtube, Prime95
Lenovo ThinkPad P15v G2 21A9000XGE
T1200 Laptop GPU, i7-11800H, Toshiba XG6 KXG6AZNV512G
6955.6 μs * -444%
HP ZBook Firefly 14 G8 2C9Q2EA
T500 Laptop GPU, i7-1165G7, Toshiba XG6 KXG60ZNV1T02
3084 μs * -141%
Lenovo ThinkPad P14s G2 AMD
Vega 8, R7 PRO 5850U, SK Hynix PC711 1TB HFS001TDE9X081N
2356 μs * -84%
HP ZBook Firefly 14 G7
Quadro P520, i7-10610U, Toshiba XG6 KXG60ZNV512G
2046 μs * -60%
Dell Precision 5000 5470
RTX A1000 Laptop GPU, i9-12900H, Samsung PM9A1 MZVL21T0HCLR
1279.7 μs *
Dell Precision 5000 5560
RTX A2000 Laptop GPU, i7-11850H, Samsung PM9A1 MZVL22T0HBLB
759 μs * +41%

* ... smaller is better

存储设备

戴尔提供256GB至4TB的PCIe3或PCIe4存储选项,并可选择自我加密。PCIe4的 三星PM9A1驱动器包括自己的铜质散热片,与没有SSD散热片的笔记本电脑相比,具有更好的持续性能,如 Latitude 7330.

只有一个PCIe4 x4存储空间,没有辅助选项
Samsung PM9A1 MZVL21T0HCLR
CDM 5/6 Read Seq Q32T1: 6817 MB/s
CDM 5/6 Write Seq Q32T1: 5086 MB/s
CDM 5/6 Read 4K Q32T1: 448.3 MB/s
CDM 5/6 Write 4K Q32T1: 395.7 MB/s
CDM 5 Read Seq: 3790 MB/s
CDM 5 Write Seq: 3105 MB/s
CDM 5/6 Read 4K: 73.28 MB/s
CDM 5/6 Write 4K: 153.8 MB/s
Drive Performance Rating - Percent
Dell Precision 5000 5560
Samsung PM9A1 MZVL22T0HBLB
88.6 pt
Dell Precision 5000 5470
Samsung PM9A1 MZVL21T0HCLR
85.3 pt
Lenovo ThinkPad P14s G2 AMD
SK Hynix PC711 1TB HFS001TDE9X081N
67.2 pt
HP ZBook Firefly 14 G8 2C9Q2EA
Toshiba XG6 KXG60ZNV1T02
64 pt
HP ZBook Firefly 14 G7
Toshiba XG6 KXG60ZNV512G
60.2 pt
Lenovo ThinkPad P15v G2 21A9000XGE
Toshiba XG6 KXG6AZNV512G
54.9 pt
DiskSpd
seq read
Dell Precision 5000 5470
Samsung PM9A1 MZVL21T0HCLR
3698 (3679.02min - 3698.06max) MB/s
Dell Precision 5000 5560
Samsung PM9A1 MZVL22T0HBLB
3402 (3327.13min - 3402.21max) MB/s -8%
Lenovo ThinkPad P15v G2 21A9000XGE
Toshiba XG6 KXG6AZNV512G
2260 (2232.84min - 2259.78max) MB/s -39%
HP ZBook Firefly 14 G7
Toshiba XG6 KXG60ZNV512G
2233 (2200.33min - 2232.78max) MB/s -40%
HP ZBook Firefly 14 G8 2C9Q2EA
Toshiba XG6 KXG60ZNV1T02
2161 (2145.08min - 2160.78max) MB/s -42%
Lenovo ThinkPad P14s G2 AMD
SK Hynix PC711 1TB HFS001TDE9X081N
1836 (1793.46min - 1836.27max) MB/s -50%
seq write
Dell Precision 5000 5470
Samsung PM9A1 MZVL21T0HCLR
3108 (3002.78min - 3108.47max) MB/s
Dell Precision 5000 5560
Samsung PM9A1 MZVL22T0HBLB
2950 (2919.03min - 2949.85max) MB/s -5%
HP ZBook Firefly 14 G7
Toshiba XG6 KXG60ZNV512G
1924 (1894.97min - 1924.27max) MB/s -38%
Lenovo ThinkPad P15v G2 21A9000XGE
Toshiba XG6 KXG6AZNV512G
1837 (1808.58min - 1837max) MB/s -41%
HP ZBook Firefly 14 G8 2C9Q2EA
Toshiba XG6 KXG60ZNV1T02
1811 (1607.4min - 1811.25max) MB/s -42%
Lenovo ThinkPad P14s G2 AMD
SK Hynix PC711 1TB HFS001TDE9X081N
1808 (1748.67min - 1807.75max) MB/s -42%
seq q8 t1 read
Dell Precision 5000 5560
Samsung PM9A1 MZVL22T0HBLB
7036 (6609.8min - 7035.53max) MB/s +4%
Dell Precision 5000 5470
Samsung PM9A1 MZVL21T0HCLR
6766 (6120.04min - 6766.46max) MB/s
Lenovo ThinkPad P14s G2 AMD
SK Hynix PC711 1TB HFS001TDE9X081N
3593 (2631.28min - 3593.47max) MB/s -47%
HP ZBook Firefly 14 G8 2C9Q2EA
Toshiba XG6 KXG60ZNV1T02
3294 (2823.83min - 3293.7max) MB/s -51%
Lenovo ThinkPad P15v G2 21A9000XGE
Toshiba XG6 KXG6AZNV512G
3290 (2822.99min - 3289.93max) MB/s -51%
HP ZBook Firefly 14 G7
Toshiba XG6 KXG60ZNV512G
3282 (3037.1min - 3281.56max) MB/s -51%
seq q8 t1 write
Dell Precision 5000 5470
Samsung PM9A1 MZVL21T0HCLR
5131 (5069.16min - 5131.12max) MB/s
Dell Precision 5000 5560
Samsung PM9A1 MZVL22T0HBLB
5109 (5060.79min - 5108.66max) MB/s 0%
Lenovo ThinkPad P14s G2 AMD
SK Hynix PC711 1TB HFS001TDE9X081N
3263 (3213.26min - 3262.96max) MB/s -36%
HP ZBook Firefly 14 G8 2C9Q2EA
Toshiba XG6 KXG60ZNV1T02
3057 (3052.8min - 3057.23max) MB/s -40%
HP ZBook Firefly 14 G7
Toshiba XG6 KXG60ZNV512G
2927 (2917.39min - 2927.01max) MB/s -43%
Lenovo ThinkPad P15v G2 21A9000XGE
Toshiba XG6 KXG6AZNV512G
2902 (2883.48min - 2901.83max) MB/s -43%
4k q1 t1 read
Dell Precision 5000 5560
Samsung PM9A1 MZVL22T0HBLB
80.8 (80.46min - 80.76max) MB/s +9%
Dell Precision 5000 5470
Samsung PM9A1 MZVL21T0HCLR
74.4 (68.01min - 74.39max) MB/s
Lenovo ThinkPad P14s G2 AMD
SK Hynix PC711 1TB HFS001TDE9X081N
53.8 (53.07min - 53.81max) MB/s -28%
HP ZBook Firefly 14 G8 2C9Q2EA
Toshiba XG6 KXG60ZNV1T02
52.2 (51.9min - 52.2max) MB/s -30%
HP ZBook Firefly 14 G7
Toshiba XG6 KXG60ZNV512G
47.36 (46.43min - 47.36max) MB/s -36%
Lenovo ThinkPad P15v G2 21A9000XGE
Toshiba XG6 KXG6AZNV512G
44.3 (43.4min - 44.27max) MB/s -40%
4k q1 t1 write
Dell Precision 5000 5560
Samsung PM9A1 MZVL22T0HBLB
183 (182.04min - 183.17max) MB/s +18%
Dell Precision 5000 5470
Samsung PM9A1 MZVL21T0HCLR
155.6 (153.47min - 155.6max) MB/s
HP ZBook Firefly 14 G8 2C9Q2EA
Toshiba XG6 KXG60ZNV1T02
137 (133.1min - 137.36max) MB/s -12%
HP ZBook Firefly 14 G7
Toshiba XG6 KXG60ZNV512G
135.2 (133.94min - 135.24max) MB/s -13%
Lenovo ThinkPad P14s G2 AMD
SK Hynix PC711 1TB HFS001TDE9X081N
123 (119.19min - 122.54max) MB/s -21%
Lenovo ThinkPad P15v G2 21A9000XGE
Toshiba XG6 KXG6AZNV512G
113.3 (112.88min - 113.32max) MB/s -27%
4k q32 t16 read
HP ZBook Firefly 14 G8 2C9Q2EA
Toshiba XG6 KXG60ZNV1T02
1156 (1024.51min - 1155.67max) MB/s +76%
Lenovo ThinkPad P14s G2 AMD
SK Hynix PC711 1TB HFS001TDE9X081N
1065 (1034.06min - 1065.28max) MB/s +62%
HP ZBook Firefly 14 G7
Toshiba XG6 KXG60ZNV512G
1007 (785.54min - 1006.71max) MB/s +54%
Lenovo ThinkPad P15v G2 21A9000XGE
Toshiba XG6 KXG6AZNV512G
890 (871.49min - 889.94max) MB/s +36%
Dell Precision 5000 5560
Samsung PM9A1 MZVL22T0HBLB
756 (747.7min - 756.38max) MB/s +15%
Dell Precision 5000 5470
Samsung PM9A1 MZVL21T0HCLR
656 (632.27min - 655.69max) MB/s
4k q32 t16 write
HP ZBook Firefly 14 G8 2C9Q2EA
Toshiba XG6 KXG60ZNV1T02
514 (454.65min - 514.16max) MB/s +17%
Lenovo ThinkPad P14s G2 AMD
SK Hynix PC711 1TB HFS001TDE9X081N
502 (488.84min - 502max) MB/s +14%
HP ZBook Firefly 14 G7
Toshiba XG6 KXG60ZNV512G
448.2 (400.06min - 448.22max) MB/s +2%
Dell Precision 5000 5470
Samsung PM9A1 MZVL21T0HCLR
440 (428.53min - 439.68max) MB/s
Dell Precision 5000 5560
Samsung PM9A1 MZVL22T0HBLB
422 (415.41min - 421.56max) MB/s -4%
Lenovo ThinkPad P15v G2 21A9000XGE
Toshiba XG6 KXG6AZNV512G
332 (323.33min - 331.99max) MB/s -25%
AS SSD
Score Total
Dell Precision 5000 5560
Samsung PM9A1 MZVL22T0HBLB
5753 Points +5%
Dell Precision 5000 5470
Samsung PM9A1 MZVL21T0HCLR
5478 Points
Lenovo ThinkPad P14s G2 AMD
SK Hynix PC711 1TB HFS001TDE9X081N
4405 Points -20%
HP ZBook Firefly 14 G8 2C9Q2EA
Toshiba XG6 KXG60ZNV1T02
3827 Points -30%
Lenovo ThinkPad P15v G2 21A9000XGE
Toshiba XG6 KXG6AZNV512G
3582 Points -35%
HP ZBook Firefly 14 G7
Toshiba XG6 KXG60ZNV512G
3409 Points -38%
Score Read
Dell Precision 5000 5560
Samsung PM9A1 MZVL22T0HBLB
1827 Points +25%
Dell Precision 5000 5470
Samsung PM9A1 MZVL21T0HCLR
1467 Points
HP ZBook Firefly 14 G8 2C9Q2EA
Toshiba XG6 KXG60ZNV1T02
1430 Points -3%
HP ZBook Firefly 14 G7
Toshiba XG6 KXG60ZNV512G
1314 Points -10%
Lenovo ThinkPad P14s G2 AMD
SK Hynix PC711 1TB HFS001TDE9X081N
1304 Points -11%
Lenovo ThinkPad P15v G2 21A9000XGE
Toshiba XG6 KXG6AZNV512G
1289 Points -12%
Score Write
Dell Precision 5000 5470
Samsung PM9A1 MZVL21T0HCLR
3358 Points
Dell Precision 5000 5560
Samsung PM9A1 MZVL22T0HBLB
3133 Points -7%
Lenovo ThinkPad P14s G2 AMD
SK Hynix PC711 1TB HFS001TDE9X081N
2477 Points -26%
HP ZBook Firefly 14 G8 2C9Q2EA
Toshiba XG6 KXG60ZNV1T02
1727 Points -49%
Lenovo ThinkPad P15v G2 21A9000XGE
Toshiba XG6 KXG6AZNV512G
1693 Points -50%
HP ZBook Firefly 14 G7
Toshiba XG6 KXG60ZNV512G
1500 Points -55%
Seq Read
Dell Precision 5000 5560
Samsung PM9A1 MZVL22T0HBLB
5169 MB/s +6%
Dell Precision 5000 5470
Samsung PM9A1 MZVL21T0HCLR
4881.51 MB/s
Lenovo ThinkPad P14s G2 AMD
SK Hynix PC711 1TB HFS001TDE9X081N
2762 MB/s -43%
Lenovo ThinkPad P15v G2 21A9000XGE
Toshiba XG6 KXG6AZNV512G
2684 MB/s -45%
HP ZBook Firefly 14 G8 2C9Q2EA
Toshiba XG6 KXG60ZNV1T02
2674 MB/s -45%
HP ZBook Firefly 14 G7
Toshiba XG6 KXG60ZNV512G
2613 MB/s -46%
Seq Write
Dell Precision 5000 5470
Samsung PM9A1 MZVL21T0HCLR
2519.78 MB/s
Dell Precision 5000 5560
Samsung PM9A1 MZVL22T0HBLB
1986 MB/s -21%
Lenovo ThinkPad P14s G2 AMD
SK Hynix PC711 1TB HFS001TDE9X081N
1712 MB/s -32%
Lenovo ThinkPad P15v G2 21A9000XGE
Toshiba XG6 KXG6AZNV512G
1352 MB/s -46%
HP ZBook Firefly 14 G8 2C9Q2EA
Toshiba XG6 KXG60ZNV1T02
1289 MB/s -49%
HP ZBook Firefly 14 G7
Toshiba XG6 KXG60ZNV512G
908 MB/s -64%
4K Read
Dell Precision 5000 5560
Samsung PM9A1 MZVL22T0HBLB
78 MB/s +3%
Dell Precision 5000 5470
Samsung PM9A1 MZVL21T0HCLR
76.03 MB/s
HP ZBook Firefly 14 G8 2C9Q2EA
Toshiba XG6 KXG60ZNV1T02
49.52 MB/s -35%
Lenovo ThinkPad P14s G2 AMD
SK Hynix PC711 1TB HFS001TDE9X081N
48.36 MB/s -36%
HP ZBook Firefly 14 G7
Toshiba XG6 KXG60ZNV512G
48.25 MB/s -37%
Lenovo ThinkPad P15v G2 21A9000XGE
Toshiba XG6 KXG6AZNV512G
43.68 MB/s -43%
4K Write
Dell Precision 5000 5560
Samsung PM9A1 MZVL22T0HBLB
214.6 MB/s +9%
Dell Precision 5000 5470
Samsung PM9A1 MZVL21T0HCLR
197.59 MB/s
HP ZBook Firefly 14 G7
Toshiba XG6 KXG60ZNV512G
137.9 MB/s -30%
HP ZBook Firefly 14 G8 2C9Q2EA
Toshiba XG6 KXG60ZNV1T02
128 MB/s -35%
Lenovo ThinkPad P14s G2 AMD
SK Hynix PC711 1TB HFS001TDE9X081N
126.4 MB/s -36%
Lenovo ThinkPad P15v G2 21A9000XGE
Toshiba XG6 KXG6AZNV512G
105.56 MB/s -47%
4K-64 Read
Dell Precision 5000 5560
Samsung PM9A1 MZVL22T0HBLB
1232 MB/s +36%
HP ZBook Firefly 14 G8 2C9Q2EA
Toshiba XG6 KXG60ZNV1T02
1113 MB/s +23%
HP ZBook Firefly 14 G7
Toshiba XG6 KXG60ZNV512G
1004 MB/s +11%
Lenovo ThinkPad P14s G2 AMD
SK Hynix PC711 1TB HFS001TDE9X081N
980 MB/s +9%
Lenovo ThinkPad P15v G2 21A9000XGE
Toshiba XG6 KXG6AZNV512G
976.92 MB/s +8%
Dell Precision 5000 5470
Samsung PM9A1 MZVL21T0HCLR
902.75 MB/s
4K-64 Write
Dell Precision 5000 5470
Samsung PM9A1 MZVL21T0HCLR
2908.32 MB/s
Dell Precision 5000 5560
Samsung PM9A1 MZVL22T0HBLB
2719 MB/s -7%
Lenovo ThinkPad P14s G2 AMD
SK Hynix PC711 1TB HFS001TDE9X081N
2179 MB/s -25%
HP ZBook Firefly 14 G8 2C9Q2EA
Toshiba XG6 KXG60ZNV1T02
1470 MB/s -49%
Lenovo ThinkPad P15v G2 21A9000XGE
Toshiba XG6 KXG6AZNV512G
1452.09 MB/s -50%
HP ZBook Firefly 14 G7
Toshiba XG6 KXG60ZNV512G
1271 MB/s -56%
Access Time Read
Lenovo ThinkPad P15v G2 21A9000XGE
Toshiba XG6 KXG6AZNV512G
0.124 ms * -254%
HP ZBook Firefly 14 G8 2C9Q2EA
Toshiba XG6 KXG60ZNV1T02
0.072 ms * -106%
HP ZBook Firefly 14 G7
Toshiba XG6 KXG60ZNV512G
0.066 ms * -89%
Lenovo ThinkPad P14s G2 AMD
SK Hynix PC711 1TB HFS001TDE9X081N
0.05 ms * -43%
Dell Precision 5000 5470
Samsung PM9A1 MZVL21T0HCLR
0.035 ms *
Dell Precision 5000 5560
Samsung PM9A1 MZVL22T0HBLB
0.024 ms * +31%
Access Time Write
Dell Precision 5000 5470
Samsung PM9A1 MZVL21T0HCLR
0.061 ms *
Dell Precision 5000 5560
Samsung PM9A1 MZVL22T0HBLB
0.059 ms * +3%
Lenovo ThinkPad P15v G2 21A9000XGE
Toshiba XG6 KXG6AZNV512G
0.038 ms * +38%
HP ZBook Firefly 14 G8 2C9Q2EA
Toshiba XG6 KXG60ZNV1T02
0.032 ms * +48%
HP ZBook Firefly 14 G7
Toshiba XG6 KXG60ZNV512G
0.03 ms * +51%
Lenovo ThinkPad P14s G2 AMD
SK Hynix PC711 1TB HFS001TDE9X081N
0.029 ms * +52%

* ... smaller is better

Disk Throttling: DiskSpd Read Loop, Queue Depth 8

034068010201360170020402380272030603400374040804420476051005440578061206460Tooltip
Dell Precision 5000 5470: Ø6727 (6305.27-6765.93)

GPU性能 - 40 W RTX A1000图形

整体的图形性能比去年的图形性能快了约10%至20%。英伟达T1200.然而,最值得注意的是, RTX A1000只比去年的T1200慢了10%到15%。 RTX A2000在Precision 5560,除非涉及到光线追踪应用,A2000的速度可以超过2倍。如果你的工作负载涉及到光线追踪效果,那么RTX A1000是要避免的。

在平衡模式而不是超性能模式下运行,CPU性能降低了约33%,而GPU性能受到的影响较小。

3DMark 11
3DMark 11
Cloud Gate
Cloud Gate
Time Spy
Time Spy
Fire Strike (超性能模式)
Fire Strike (超性能模式)
Fire Strike (平衡模式)
Fire Strike (平衡模式)
Fire Strike 超强
Fire Strike 超强
3DMark 11 - 1280x720 Performance GPU
HP ZBook Fury 17 G8-4A6A9EA
NVIDIA RTX A3000 Laptop GPU, Intel Core i9-11950H
23699 Points +65%
HP ZBook Fury 17 G7 119W5EA
NVIDIA Quadro RTX 4000 Max-Q, Intel Core i9-10885H
23684 Points +64%
Dell G15 5510
NVIDIA GeForce RTX 3050 4GB Laptop GPU, Intel Core i5-10500H
18091 Points +26%
Dell Precision 5000 5560
NVIDIA RTX A2000 Laptop GPU, Intel Core i7-11850H
16236 Points +13%
Average NVIDIA RTX A1000 Laptop GPU
  (14402 - 15867, n=2)
15135 Points +5%
Dell Precision 5000 5470
NVIDIA RTX A1000 Laptop GPU, Intel Core i9-12900H
14402 Points
Lenovo ThinkPad P1 G4-20Y4Z9DVUS
NVIDIA T1200 Laptop GPU, Intel Core i7-11800H
14387 Points 0%
Lenovo ThinkPad P15v G2 21A9000XGE
NVIDIA T1200 Laptop GPU, Intel Core i7-11800H
12142 Points -16%
HP ZBook Power 15 G8 313S5EA
NVIDIA T600 Laptop GPU, Intel Core i7-11800H
10498 Points -27%
HP ZBook Firefly 15 G8 2C9R7EA
NVIDIA T500 Laptop GPU, Intel Core i7-1165G7
8475 Points -41%
Dell Precision 3000 3551
NVIDIA Quadro P620, Intel Core i9-10885H
5850 Points -59%
Lenovo ThinkPad P15s Gen1-20T4000JGE
NVIDIA Quadro P520, Intel Core i7-10510U
4243 Points -71%
3DMark
1920x1080 Fire Strike Graphics
HP ZBook Fury 17 G7 119W5EA
NVIDIA Quadro RTX 4000 Max-Q, Intel Core i9-10885H
17049 Points +56%
HP ZBook Fury 17 G8-4A6A9EA
NVIDIA RTX A3000 Laptop GPU, Intel Core i9-11950H
17034 Points +56%
Dell G15 5510
NVIDIA GeForce RTX 3050 4GB Laptop GPU, Intel Core i5-10500H
13646 Points +25%
Dell Precision 5000 5560
NVIDIA RTX A2000 Laptop GPU, Intel Core i7-11850H
11970 Points +10%
Average NVIDIA RTX A1000 Laptop GPU
  (10914 - 11728, n=2)
11321 Points +4%
Dell Precision 5000 5470
NVIDIA RTX A1000 Laptop GPU, Intel Core i9-12900H
10914 Points
Lenovo ThinkPad P1 G4-20Y4Z9DVUS
NVIDIA T1200 Laptop GPU, Intel Core i7-11800H
10134 Points -7%
Lenovo ThinkPad P15v G2 21A9000XGE
NVIDIA T1200 Laptop GPU, Intel Core i7-11800H
9030 Points -17%
HP ZBook Power 15 G8 313S5EA
NVIDIA T600 Laptop GPU, Intel Core i7-11800H
7928 Points -27%
HP ZBook Firefly 15 G8 2C9R7EA
NVIDIA T500 Laptop GPU, Intel Core i7-1165G7
5141 Points -53%
Dell Precision 3000 3551
NVIDIA Quadro P620, Intel Core i9-10885H
4600 Points -58%
Lenovo ThinkPad P15s Gen1-20T4000JGE
NVIDIA Quadro P520, Intel Core i7-10510U
3281 Points -70%
2560x1440 Time Spy Graphics
HP ZBook Fury 17 G7 119W5EA
NVIDIA Quadro RTX 4000 Max-Q, Intel Core i9-10885H
6764 Points +65%
HP ZBook Fury 17 G8-4A6A9EA
NVIDIA RTX A3000 Laptop GPU, Intel Core i9-11950H
6530 Points +59%
Dell G15 5510
NVIDIA GeForce RTX 3050 4GB Laptop GPU, Intel Core i5-10500H
5266 Points +28%
Dell Precision 5000 5560
NVIDIA RTX A2000 Laptop GPU, Intel Core i7-11850H
4616 Points +13%
Average NVIDIA RTX A1000 Laptop GPU
  (4101 - 4410, n=2)
4256 Points +4%
Dell Precision 5000 5470
NVIDIA RTX A1000 Laptop GPU, Intel Core i9-12900H
4101 Points
Lenovo ThinkPad P1 G4-20Y4Z9DVUS
NVIDIA T1200 Laptop GPU, Intel Core i7-11800H
3595 Points -12%
Lenovo ThinkPad P15v G2 21A9000XGE
NVIDIA T1200 Laptop GPU, Intel Core i7-11800H
3229 Points -21%
HP ZBook Power 15 G8 313S5EA
NVIDIA T600 Laptop GPU, Intel Core i7-11800H
2766 Points -33%
HP ZBook Firefly 15 G8 2C9R7EA
NVIDIA T500 Laptop GPU, Intel Core i7-1165G7
2127 Points -48%
Dell Precision 3000 3551
NVIDIA Quadro P620, Intel Core i9-10885H
1393 Points -66%
Lenovo ThinkPad P15s Gen1-20T4000JGE
NVIDIA Quadro P520, Intel Core i7-10510U
1024 Points -75%
2560x1440 Port Royal Graphics
HP ZBook Fury 17 G8-4A6A9EA
NVIDIA RTX A3000 Laptop GPU, Intel Core i9-11950H
3880 Points +1176%
Average NVIDIA RTX A1000 Laptop GPU
  (304 - 2649, n=2)
1477 Points +386%
Dell Precision 5000 5560
NVIDIA RTX A2000 Laptop GPU, Intel Core i7-11850H
707 Points +133%
Dell G15 5510
NVIDIA GeForce RTX 3050 4GB Laptop GPU, Intel Core i5-10500H
496 Points +63%
Dell Precision 5000 5470
NVIDIA RTX A1000 Laptop GPU, Intel Core i9-12900H
304 Points
SPECviewperf 2020
1920x1080 3ds Max (3dsmax-07)
HP ZBook Fury 17 G8-4A6A9EA
NVIDIA RTX A3000 Laptop GPU, Intel Core i9-11950H
69.7 fps +28%
HP ZBook Fury 17 G7 119W5EA
NVIDIA Quadro RTX 4000 Max-Q, Intel Core i9-10885H
64.1 fps +18%
Dell Precision 5000 5560
NVIDIA RTX A2000 Laptop GPU, Intel Core i7-11850H
59.6 fps +10%
Average NVIDIA RTX A1000 Laptop GPU
  (54.4 - 55.4, n=2)
54.9 fps +1%
Dell Precision 5000 5470
NVIDIA RTX A1000 Laptop GPU, Intel Core i9-12900H
54.35 fps
Lenovo ThinkPad P1 G4-20Y4Z9DVUS
NVIDIA T1200 Laptop GPU, Intel Core i7-11800H
50.2 fps -8%
Lenovo ThinkPad P15v G2 21A9000XGE
NVIDIA T1200 Laptop GPU, Intel Core i7-11800H
43 fps -21%
HP ZBook Power 15 G8 313S5EA
NVIDIA T600 Laptop GPU, Intel Core i7-11800H
40.9 fps -25%
HP ZBook Firefly 15 G8 2C9R7EA
NVIDIA T500 Laptop GPU, Intel Core i7-1165G7
28.9 fps -47%
Lenovo ThinkPad P15s Gen1-20T4000JGE
NVIDIA Quadro P520, Intel Core i7-10510U
11.78 fps -78%
1920x1080 CATIA (catia-06)
HP ZBook Fury 17 G8-4A6A9EA
NVIDIA RTX A3000 Laptop GPU, Intel Core i9-11950H
73.7 fps +55%
HP ZBook Fury 17 G7 119W5EA
NVIDIA Quadro RTX 4000 Max-Q, Intel Core i9-10885H
60.5 fps +28%
Dell Precision 5000 5560
NVIDIA RTX A2000 Laptop GPU, Intel Core i7-11850H
53.5 fps +13%
Average NVIDIA RTX A1000 Laptop GPU
  (47.4 - 52.2, n=2)
49.8 fps +5%
Dell Precision 5000 5470
NVIDIA RTX A1000 Laptop GPU, Intel Core i9-12900H
47.4 fps
Lenovo ThinkPad P1 G4-20Y4Z9DVUS
NVIDIA T1200 Laptop GPU, Intel Core i7-11800H
41.6 fps -12%
Lenovo ThinkPad P15v G2 21A9000XGE
NVIDIA T1200 Laptop GPU, Intel Core i7-11800H
38.2 fps -19%
HP ZBook Power 15 G8 313S5EA
NVIDIA T600 Laptop GPU, Intel Core i7-11800H
33.1 fps -30%
HP ZBook Firefly 15 G8 2C9R7EA
NVIDIA T500 Laptop GPU, Intel Core i7-1165G7
23.22 fps -51%
Lenovo ThinkPad P15s Gen1-20T4000JGE
NVIDIA Quadro P520, Intel Core i7-10510U
12.9 fps -73%
1920x1080 Creo (creo-03)
HP ZBook Fury 17 G8-4A6A9EA
NVIDIA RTX A3000 Laptop GPU, Intel Core i9-11950H
119.7 fps +37%
Dell Precision 5000 5560
NVIDIA RTX A2000 Laptop GPU, Intel Core i7-11850H
91.5 fps +5%
Average NVIDIA RTX A1000 Laptop GPU
  (87.2 - 90.9, n=2)
89 fps +2%
HP ZBook Fury 17 G7 119W5EA
NVIDIA Quadro RTX 4000 Max-Q, Intel Core i9-10885H
88.3 fps +1%
Dell Precision 5000 5470
NVIDIA RTX A1000 Laptop GPU, Intel Core i9-12900H
87.16 fps
Lenovo ThinkPad P1 G4-20Y4Z9DVUS
NVIDIA T1200 Laptop GPU, Intel Core i7-11800H
78.7 fps -10%
Lenovo ThinkPad P15v G2 21A9000XGE
NVIDIA T1200 Laptop GPU, Intel Core i7-11800H
73.4 fps -16%
HP ZBook Power 15 G8 313S5EA
NVIDIA T600 Laptop GPU, Intel Core i7-11800H
67.3 fps -23%
HP ZBook Firefly 15 G8 2C9R7EA
NVIDIA T500 Laptop GPU, Intel Core i7-1165G7
41.95 fps -52%
Lenovo ThinkPad P15s Gen1-20T4000JGE
NVIDIA Quadro P520, Intel Core i7-10510U
24.11 fps -72%
1920x1080 Energy (energy-03)
HP ZBook Fury 17 G8-4A6A9EA
NVIDIA RTX A3000 Laptop GPU, Intel Core i9-11950H
45.04 fps +89%
HP ZBook Fury 17 G7 119W5EA
NVIDIA Quadro RTX 4000 Max-Q, Intel Core i9-10885H
35.71 fps +50%
Dell Precision 5000 5560
NVIDIA RTX A2000 Laptop GPU, Intel Core i7-11850H
29.44 fps +24%
Average NVIDIA RTX A1000 Laptop GPU
  (23.8 - 30.3, n=2)
27 fps +14%
Dell Precision 5000 5470
NVIDIA RTX A1000 Laptop GPU, Intel Core i9-12900H
23.77 fps
Lenovo ThinkPad P1 G4-20Y4Z9DVUS
NVIDIA T1200 Laptop GPU, Intel Core i7-11800H
19.3 fps -19%
Lenovo ThinkPad P15v G2 21A9000XGE
NVIDIA T1200 Laptop GPU, Intel Core i7-11800H
18 fps -24%
HP ZBook Power 15 G8 313S5EA
NVIDIA T600 Laptop GPU, Intel Core i7-11800H
16 fps -33%
HP ZBook Firefly 15 G8 2C9R7EA
NVIDIA T500 Laptop GPU, Intel Core i7-1165G7
11.96 fps -50%
Lenovo ThinkPad P15s Gen1-20T4000JGE
NVIDIA Quadro P520, Intel Core i7-10510U
0.77 fps -97%
1920x1080 Maya (maya-06)
HP ZBook Fury 17 G8-4A6A9EA
NVIDIA RTX A3000 Laptop GPU, Intel Core i9-11950H
207 fps +9%
Dell Precision 5000 5560
NVIDIA RTX A2000 Laptop GPU, Intel Core i7-11850H
196.6 fps +4%
Average NVIDIA RTX A1000 Laptop GPU
  (189.6 - 202, n=2)
195.7 fps +3%
Dell Precision 5000 5470
NVIDIA RTX A1000 Laptop GPU, Intel Core i9-12900H
189.59 fps
HP ZBook Fury 17 G7 119W5EA
NVIDIA Quadro RTX 4000 Max-Q, Intel Core i9-10885H
159.9 fps -16%
Lenovo ThinkPad P1 G4-20Y4Z9DVUS
NVIDIA T1200 Laptop GPU, Intel Core i7-11800H
144.9 fps -24%
Lenovo ThinkPad P15v G2 21A9000XGE
NVIDIA T1200 Laptop GPU, Intel Core i7-11800H
133 fps -30%
HP ZBook Power 15 G8 313S5EA
NVIDIA T600 Laptop GPU, Intel Core i7-11800H
125 fps -34%
HP ZBook Firefly 15 G8 2C9R7EA
NVIDIA T500 Laptop GPU, Intel Core i7-1165G7
78.1 fps -59%
Lenovo ThinkPad P15s Gen1-20T4000JGE
NVIDIA Quadro P520, Intel Core i7-10510U
50.1 fps -74%
1920x1080 Medical (medical-03)
HP ZBook Fury 17 G8-4A6A9EA
NVIDIA RTX A3000 Laptop GPU, Intel Core i9-11950H
44.4 fps +47%
Average NVIDIA RTX A1000 Laptop GPU
  (30.3 - 57.3, n=2)
43.8 fps +45%
HP ZBook Fury 17 G7 119W5EA
NVIDIA Quadro RTX 4000 Max-Q, Intel Core i9-10885H
38.33 fps +27%
Dell Precision 5000 5560
NVIDIA RTX A2000 Laptop GPU, Intel Core i7-11850H
33.98 fps +12%
Dell Precision 5000 5470
NVIDIA RTX A1000 Laptop GPU, Intel Core i9-12900H
30.29 fps
Lenovo ThinkPad P1 G4-20Y4Z9DVUS
NVIDIA T1200 Laptop GPU, Intel Core i7-11800H
24.85 fps -18%
Lenovo ThinkPad P15v G2 21A9000XGE
NVIDIA T1200 Laptop GPU, Intel Core i7-11800H
22.7 fps -25%
HP ZBook Power 15 G8 313S5EA
NVIDIA T600 Laptop GPU, Intel Core i7-11800H
18.7 fps -38%
HP ZBook Firefly 15 G8 2C9R7EA
NVIDIA T500 Laptop GPU, Intel Core i7-1165G7
14.74 fps -51%
Lenovo ThinkPad P15s Gen1-20T4000JGE
NVIDIA Quadro P520, Intel Core i7-10510U
8.33 fps -72%
1920x1080 Siemens NX (snx-04)
HP ZBook Fury 17 G8-4A6A9EA
NVIDIA RTX A3000 Laptop GPU, Intel Core i9-11950H
232.4 fps +33%
Average NVIDIA RTX A1000 Laptop GPU
  (174.1 - 194.8, n=2)
184.5 fps +6%
HP ZBook Fury 17 G7 119W5EA
NVIDIA Quadro RTX 4000 Max-Q, Intel Core i9-10885H
181 fps +4%
Dell Precision 5000 5560
NVIDIA RTX A2000 Laptop GPU, Intel Core i7-11850H
175.1 fps +1%
Dell Precision 5000 5470
NVIDIA RTX A1000 Laptop GPU, Intel Core i9-12900H
174.1 fps
Lenovo ThinkPad P1 G4-20Y4Z9DVUS
NVIDIA T1200 Laptop GPU, Intel Core i7-11800H
164.1 fps -6%
Lenovo ThinkPad P15v G2 21A9000XGE
NVIDIA T1200 Laptop GPU, Intel Core i7-11800H
151 fps -13%
HP ZBook Power 15 G8 313S5EA
NVIDIA T600 Laptop GPU, Intel Core i7-11800H
136 fps -22%
HP ZBook Firefly 15 G8 2C9R7EA
NVIDIA T500 Laptop GPU, Intel Core i7-1165G7
93.1 fps -47%
Lenovo ThinkPad P15s Gen1-20T4000JGE
NVIDIA Quadro P520, Intel Core i7-10510U
49.66 fps -71%
1920x1080 Solidworks (solidworks-05)
HP ZBook Fury 17 G8-4A6A9EA
NVIDIA RTX A3000 Laptop GPU, Intel Core i9-11950H
147.4 fps +36%
HP ZBook Fury 17 G7 119W5EA
NVIDIA Quadro RTX 4000 Max-Q, Intel Core i9-10885H
114.4 fps +5%
Dell Precision 5000 5560
NVIDIA RTX A2000 Laptop GPU, Intel Core i7-11850H
114.3 fps +5%
Average NVIDIA RTX A1000 Laptop GPU
  (108.5 - 113.7, n=2)
111.1 fps +2%
Dell Precision 5000 5470
NVIDIA RTX A1000 Laptop GPU, Intel Core i9-12900H
108.5 fps
Lenovo ThinkPad P1 G4-20Y4Z9DVUS
NVIDIA T1200 Laptop GPU, Intel Core i7-11800H
91.2 fps -16%
Lenovo ThinkPad P15v G2 21A9000XGE
NVIDIA T1200 Laptop GPU, Intel Core i7-11800H
82.8 fps -24%
HP ZBook Power 15 G8 313S5EA
NVIDIA T600 Laptop GPU, Intel Core i7-11800H
73.4 fps -32%
HP ZBook Firefly 15 G8 2C9R7EA
NVIDIA T500 Laptop GPU, Intel Core i7-1165G7
43.59 fps -60%
Lenovo ThinkPad P15s Gen1-20T4000JGE
NVIDIA Quadro P520, Intel Core i7-10510U
26.4 fps -76%
SPECviewperf 13
3ds Max (3dsmax-06)
HP ZBook Fury 17 G8-4A6A9EA
NVIDIA RTX A3000 Laptop GPU, Intel Core i9-11950H
145.9 fps +18%
Dell Precision 5000 5560
NVIDIA RTX A2000 Laptop GPU, Intel Core i7-11850H
135.1 fps +9%
HP ZBook Fury 17 G7 119W5EA
NVIDIA Quadro RTX 4000 Max-Q, Intel Core i9-10885H
129.5 fps +5%
Average NVIDIA RTX A1000 Laptop GPU
  (123.7 - 127.8, n=2)
125.8 fps +2%
Dell Precision 5000 5470
NVIDIA RTX A1000 Laptop GPU, Intel Core i9-12900H
123.69 fps
Lenovo ThinkPad P1 G4-20Y4Z9DVUS
NVIDIA T1200 Laptop GPU, Intel Core i7-11800H
105.4 fps -15%
Lenovo ThinkPad P15v G2 21A9000XGE
NVIDIA T1200 Laptop GPU, Intel Core i7-11800H
94 fps -24%
HP ZBook Power 15 G8 313S5EA
NVIDIA T600 Laptop GPU, Intel Core i7-11800H
89.8 fps -27%
HP ZBook Firefly 15 G8 2C9R7EA
NVIDIA T500 Laptop GPU, Intel Core i7-1165G7
57.9 fps -53%
Dell Precision 3000 3551
NVIDIA Quadro P620, Intel Core i9-10885H
55.2 fps -55%
Lenovo ThinkPad P15s Gen1-20T4000JGE
NVIDIA Quadro P520, Intel Core i7-10510U
25.31 fps -80%
Catia (catia-05)
HP ZBook Fury 17 G8-4A6A9EA
NVIDIA RTX A3000 Laptop GPU, Intel Core i9-11950H
231.4 fps +25%
Average NVIDIA RTX A1000 Laptop GPU
  (184.4 - 218, n=2)
201 fps +9%
Dell Precision 5000 5560
NVIDIA RTX A2000 Laptop GPU, Intel Core i7-11850H
186.1 fps +1%
Dell Precision 5000 5470
NVIDIA RTX A1000 Laptop GPU, Intel Core i9-12900H
184.4 fps
HP ZBook Fury 17 G7 119W5EA
NVIDIA Quadro RTX 4000 Max-Q, Intel Core i9-10885H
181.6 fps -2%
Lenovo ThinkPad P1 G4-20Y4Z9DVUS
NVIDIA T1200 Laptop GPU, Intel Core i7-11800H
169.4 fps -8%
Lenovo ThinkPad P15v G2 21A9000XGE
NVIDIA T1200 Laptop GPU, Intel Core i7-11800H
149 fps -19%
HP ZBook Power 15 G8 313S5EA
NVIDIA T600 Laptop GPU, Intel Core i7-11800H
130 fps -30%
HP ZBook Firefly 15 G8 2C9R7EA
NVIDIA T500 Laptop GPU, Intel Core i7-1165G7
95.8 fps -48%
Dell Precision 3000 3551
NVIDIA Quadro P620, Intel Core i9-10885H
76.6 fps -58%
Lenovo ThinkPad P15s Gen1-20T4000JGE
NVIDIA Quadro P520, Intel Core i7-10510U
48.59 fps -74%
Creo (creo-02)
HP ZBook Fury 17 G8-4A6A9EA
NVIDIA RTX A3000 Laptop GPU, Intel Core i9-11950H
186.9 fps +20%
HP ZBook Fury 17 G7 119W5EA
NVIDIA Quadro RTX 4000 Max-Q, Intel Core i9-10885H
162.1 fps +4%
Dell Precision 5000 5560
NVIDIA RTX A2000 Laptop GPU, Intel Core i7-11850H
161.4 fps +4%
Average NVIDIA RTX A1000 Laptop GPU
  (155.7 - 164.8, n=2)
160.2 fps +3%
Dell Precision 5000 5470
NVIDIA RTX A1000 Laptop GPU, Intel Core i9-12900H
155.73 fps
Lenovo ThinkPad P1 G4-20Y4Z9DVUS
NVIDIA T1200 Laptop GPU, Intel Core i7-11800H
132.9 fps -15%
Lenovo ThinkPad P15v G2 21A9000XGE
NVIDIA T1200 Laptop GPU, Intel Core i7-11800H
124 fps -20%
HP ZBook Power 15 G8 313S5EA
NVIDIA T600 Laptop GPU, Intel Core i7-11800H
110 fps -29%
HP ZBook Firefly 15 G8 2C9R7EA
NVIDIA T500 Laptop GPU, Intel Core i7-1165G7
74.3 fps -52%
Dell Precision 3000 3551
NVIDIA Quadro P620, Intel Core i9-10885H
66.2 fps -57%
Lenovo ThinkPad P15s Gen1-20T4000JGE
NVIDIA Quadro P520, Intel Core i7-10510U
36.01 fps -77%
Energy (energy-02)
HP ZBook Fury 17 G8-4A6A9EA
NVIDIA RTX A3000 Laptop GPU, Intel Core i9-11950H
45.12 fps +80%
HP ZBook Fury 17 G7 119W5EA
NVIDIA Quadro RTX 4000 Max-Q, Intel Core i9-10885H
35.33 fps +41%
Dell Precision 5000 5560
NVIDIA RTX A2000 Laptop GPU, Intel Core i7-11850H
29.09 fps +16%
Average NVIDIA RTX A1000 Laptop GPU
  (25.1 - 30.3, n=2)
27.7 fps +10%
Dell Precision 5000 5470
NVIDIA RTX A1000 Laptop GPU, Intel Core i9-12900H
25.13 fps
Lenovo ThinkPad P1 G4-20Y4Z9DVUS
NVIDIA T1200 Laptop GPU, Intel Core i7-11800H
19.29 fps -23%
Lenovo ThinkPad P15v G2 21A9000XGE
NVIDIA T1200 Laptop GPU, Intel Core i7-11800H
18 fps -28%
HP ZBook Power 15 G8 313S5EA
NVIDIA T600 Laptop GPU, Intel Core i7-11800H
16.1 fps -36%
HP ZBook Firefly 15 G8 2C9R7EA
NVIDIA T500 Laptop GPU, Intel Core i7-1165G7
12.41 fps -51%
Dell Precision 3000 3551
NVIDIA Quadro P620, Intel Core i9-10885H
8.07 fps -68%
Lenovo ThinkPad P15s Gen1-20T4000JGE
NVIDIA Quadro P520, Intel Core i7-10510U
0.77 fps -97%
Maya (maya-05)
HP ZBook Fury 17 G8-4A6A9EA
NVIDIA RTX A3000 Laptop GPU, Intel Core i9-11950H
194.8 fps +20%
Average NVIDIA RTX A1000 Laptop GPU
  (161.7 - 169, n=2)
165.4 fps +2%
HP ZBook Fury 17 G7 119W5EA
NVIDIA Quadro RTX 4000 Max-Q, Intel Core i9-10885H
162 fps 0%
Dell Precision 5000 5560
NVIDIA RTX A2000 Laptop GPU, Intel Core i7-11850H
162 fps 0%
Dell Precision 5000 5470
NVIDIA RTX A1000 Laptop GPU, Intel Core i9-12900H
161.74 fps
Lenovo ThinkPad P1 G4-20Y4Z9DVUS
NVIDIA T1200 Laptop GPU, Intel Core i7-11800H
127.8 fps -21%
Lenovo ThinkPad P15v G2 21A9000XGE
NVIDIA T1200 Laptop GPU, Intel Core i7-11800H
120 fps -26%
HP ZBook Power 15 G8 313S5EA
NVIDIA T600 Laptop GPU, Intel Core i7-11800H
110 fps -32%
Dell Precision 3000 3551
NVIDIA Quadro P620, Intel Core i9-10885H
68.3 fps -58%
HP ZBook Firefly 15 G8 2C9R7EA
NVIDIA T500 Laptop GPU, Intel Core i7-1165G7
62 fps -62%
Lenovo ThinkPad P15s Gen1-20T4000JGE
NVIDIA Quadro P520, Intel Core i7-10510U
40.97 fps -75%
Medical (medical-02)
HP ZBook Fury 17 G8-4A6A9EA
NVIDIA RTX A3000 Laptop GPU, Intel Core i9-11950H
94.8 fps +53%
Average NVIDIA RTX A1000 Laptop GPU
  (62.1 - 105.5, n=2)
83.8 fps +35%
HP ZBook Fury 17 G7 119W5EA
NVIDIA Quadro RTX 4000 Max-Q, Intel Core i9-10885H
81.9 fps +32%
Dell Precision 5000 5560
NVIDIA RTX A2000 Laptop GPU, Intel Core i7-11850H
66.6 fps +7%
Dell Precision 5000 5470
NVIDIA RTX A1000 Laptop GPU, Intel Core i9-12900H
62.13 fps
Lenovo ThinkPad P1 G4-20Y4Z9DVUS
NVIDIA T1200 Laptop GPU, Intel Core i7-11800H
53.6 fps -14%
Lenovo ThinkPad P15v G2 21A9000XGE
NVIDIA T1200 Laptop GPU, Intel Core i7-11800H
49.9 fps -20%
HP ZBook Power 15 G8 313S5EA
NVIDIA T600 Laptop GPU, Intel Core i7-11800H
42.6 fps -31%
HP ZBook Firefly 15 G8 2C9R7EA
NVIDIA T500 Laptop GPU, Intel Core i7-1165G7
36.14 fps -42%
Dell Precision 3000 3551
NVIDIA Quadro P620, Intel Core i9-10885H
25.1 fps -60%
Lenovo ThinkPad P15s Gen1-20T4000JGE
NVIDIA Quadro P520, Intel Core i7-10510U
19.34 fps -69%
Showcase (showcase-02)
HP ZBook Fury 17 G7 119W5EA
NVIDIA Quadro RTX 4000 Max-Q, Intel Core i9-10885H
89.3 fps +54%
HP ZBook Fury 17 G8-4A6A9EA
NVIDIA RTX A3000 Laptop GPU, Intel Core i9-11950H
84.1 fps +45%
Dell Precision 5000 5560
NVIDIA RTX A2000 Laptop GPU, Intel Core i7-11850H
63 fps +9%
Dell Precision 5000 5470
NVIDIA RTX A1000 Laptop GPU, Intel Core i9-12900H
57.85 fps
Average NVIDIA RTX A1000 Laptop GPU
  (55.7 - 57.9, n=2)
56.8 fps -2%
Lenovo ThinkPad P1 G4-20Y4Z9DVUS
NVIDIA T1200 Laptop GPU, Intel Core i7-11800H
46.84 fps -19%
Lenovo ThinkPad P15v G2 21A9000XGE
NVIDIA T1200 Laptop GPU, Intel Core i7-11800H
45.1 fps -22%
HP ZBook Power 15 G8 313S5EA
NVIDIA T600 Laptop GPU, Intel Core i7-11800H
41.4 fps -28%
Dell Precision 3000 3551
NVIDIA Quadro P620, Intel Core i9-10885H
25.28 fps -56%
HP ZBook Firefly 15 G8 2C9R7EA
NVIDIA T500 Laptop GPU, Intel Core i7-1165G7
23.87 fps -59%
Lenovo ThinkPad P15s Gen1-20T4000JGE
NVIDIA Quadro P520, Intel Core i7-10510U
14.52 fps -75%
Siemens NX (snx-03)
HP ZBook Fury 17 G8-4A6A9EA
NVIDIA RTX A3000 Laptop GPU, Intel Core i9-11950H
232.9 fps +26%
HP ZBook Fury 17 G7 119W5EA
NVIDIA Quadro RTX 4000 Max-Q, Intel Core i9-10885H
225.4 fps +22%
Average NVIDIA RTX A1000 Laptop GPU
  (185.1 - 195.8, n=2)
190.4 fps +3%
Dell Precision 5000 5470
NVIDIA RTX A1000 Laptop GPU, Intel Core i9-12900H
185.06 fps
Dell Precision 5000 5560
NVIDIA RTX A2000 Laptop GPU, Intel Core i7-11850H
176.3 fps -5%
Lenovo ThinkPad P1 G4-20Y4Z9DVUS
NVIDIA T1200 Laptop GPU, Intel Core i7-11800H
161.3 fps -13%
Lenovo ThinkPad P15v G2 21A9000XGE
NVIDIA T1200 Laptop GPU, Intel Core i7-11800H
150 fps -19%
HP ZBook Power 15 G8 313S5EA
NVIDIA T600 Laptop GPU, Intel Core i7-11800H
137 fps -26%
HP ZBook Firefly 15 G8 2C9R7EA
NVIDIA T500 Laptop GPU, Intel Core i7-1165G7
90.8 fps -51%
Dell Precision 3000 3551
NVIDIA Quadro P620, Intel Core i9-10885H
89 fps -52%
Lenovo ThinkPad P15s Gen1-20T4000JGE
NVIDIA Quadro P520, Intel Core i7-10510U
49.83 fps -73%
Solidworks (sw-04)
HP ZBook Fury 17 G8-4A6A9EA
NVIDIA RTX A3000 Laptop GPU, Intel Core i9-11950H
149.8 fps +11%
Average NVIDIA RTX A1000 Laptop GPU
  (134.9 - 147.9, n=2)
141.4 fps +5%
Dell Precision 5000 5560
NVIDIA RTX A2000 Laptop GPU, Intel Core i7-11850H
140.8 fps +4%
Dell Precision 5000 5470
NVIDIA RTX A1000 Laptop GPU, Intel Core i9-12900H
134.89 fps
Lenovo ThinkPad P1 G4-20Y4Z9DVUS
NVIDIA T1200 Laptop GPU, Intel Core i7-11800H
128.5 fps -5%
Lenovo ThinkPad P15v G2 21A9000XGE
NVIDIA T1200 Laptop GPU, Intel Core i7-11800H
120 fps -11%
HP ZBook Fury 17 G7 119W5EA
NVIDIA Quadro RTX 4000 Max-Q, Intel Core i9-10885H
112.1 fps -17%
HP ZBook Power 15 G8 313S5EA
NVIDIA T600 Laptop GPU, Intel Core i7-11800H
106 fps -21%
HP ZBook Firefly 15 G8 2C9R7EA
NVIDIA T500 Laptop GPU, Intel Core i7-1165G7
93.6 fps -31%
Dell Precision 3000 3551
NVIDIA Quadro P620, Intel Core i9-10885H
86.7 fps -36%
Lenovo ThinkPad P15s Gen1-20T4000JGE
NVIDIA Quadro P520, Intel Core i7-10510U
60.5 fps -55%
SPECviewperf 12
1900x1060 Catia (catia-04)
Dell Precision 5000 5560
NVIDIA RTX A2000 Laptop GPU, Intel Core i7-11850H
122.2 fps +5%
Dell Precision 5000 5470
NVIDIA RTX A1000 Laptop GPU, Intel Core i9-12900H
116.61 fps
Average NVIDIA RTX A1000 Laptop GPU
  ()
116.6 fps 0%
Dell Precision 3000 3551
NVIDIA Quadro P620, Intel Core i9-10885H
53.2 fps -54%
1900x1060 Creo (creo-01)
Dell Precision 5000 5560
NVIDIA RTX A2000 Laptop GPU, Intel Core i7-11850H
106.8 fps +3%
Average NVIDIA RTX A1000 Laptop GPU
  ()
103.5 fps 0%
Dell Precision 5000 5470
NVIDIA RTX A1000 Laptop GPU, Intel Core i9-12900H
103.45 fps
Dell Precision 3000 3551
NVIDIA Quadro P620, Intel Core i9-10885H
59 fps -43%
1900x1060 Energy (energy-01)
Dell Precision 5000 5560
NVIDIA RTX A2000 Laptop GPU, Intel Core i7-11850H
9.33 fps +10%
Dell Precision 5000 5470
NVIDIA RTX A1000 Laptop GPU, Intel Core i9-12900H
8.45 fps
Average NVIDIA RTX A1000 Laptop GPU
  ()
8.45 fps 0%
Dell Precision 3000 3551
NVIDIA Quadro P620, Intel Core i9-10885H
3.86 fps -54%
1900x1060 Maya (maya-04)
Dell Precision 5000 5560
NVIDIA RTX A2000 Laptop GPU, Intel Core i7-11850H
89.7 fps +17%
Average NVIDIA RTX A1000 Laptop GPU
  ()
76.8 fps 0%
Dell Precision 5000 5470
NVIDIA RTX A1000 Laptop GPU, Intel Core i9-12900H
76.79 fps
Dell Precision 3000 3551
NVIDIA Quadro P620, Intel Core i9-10885H
41.03 fps -47%
1900x1060 Medical (medical-01)
Dell Precision 5000 5560
NVIDIA RTX A2000 Laptop GPU, Intel Core i7-11850H
40.04 fps +10%
Dell Precision 5000 5470
NVIDIA RTX A1000 Laptop GPU, Intel Core i9-12900H
36.33 fps
Average NVIDIA RTX A1000 Laptop GPU
  ()
36.3 fps 0%
Dell Precision 3000 3551
NVIDIA Quadro P620, Intel Core i9-10885H
14.32 fps -61%
1900x1060 Showcase (showcase-01)
Dell Precision 5000 5560
NVIDIA RTX A2000 Laptop GPU, Intel Core i7-11850H
63.3 fps +5%
Dell Precision 5000 5470
NVIDIA RTX A1000 Laptop GPU, Intel Core i9-12900H
60.33 fps
Average NVIDIA RTX A1000 Laptop GPU
  ()
60.3 fps 0%
Dell Precision 3000 3551
NVIDIA Quadro P620, Intel Core i9-10885H
26.84 fps -56%
1900x1060 Siemens NX (snx-02)
Dell Precision 5000 5470
NVIDIA RTX A1000 Laptop GPU, Intel Core i9-12900H
100.82 fps
Average NVIDIA RTX A1000 Laptop GPU
  ()
100.8 fps 0%
Dell Precision 5000 5560
NVIDIA RTX A2000 Laptop GPU, Intel Core i7-11850H
97.9 fps -3%
Dell Precision 3000 3551
NVIDIA Quadro P620, Intel Core i9-10885H
49.5 fps -51%
1900x1060 Solidworks (sw-03)
Dell Precision 5000 5560
NVIDIA RTX A2000 Laptop GPU, Intel Core i7-11850H
141.6 fps +9%
Dell Precision 5000 5470
NVIDIA RTX A1000 Laptop GPU, Intel Core i9-12900H
129.42 fps
Average NVIDIA RTX A1000 Laptop GPU
  ()
129.4 fps 0%
Dell Precision 3000 3551
NVIDIA Quadro P620, Intel Core i9-10885H
93.9 fps -27%
3DMark 11 Performance
15198 points
3DMark Cloud Gate Standard Score
40266 points
3DMark Fire Strike Score
10123 points
3DMark Time Spy Score
4558 points
Help
The Witcher 3
1024x768 Low Graphics & Postprocessing
HP ZBook Fury 17 G8-4A6A9EA
Intel Core i9-11950H, NVIDIA RTX A3000 Laptop GPU
263 fps +8%
Dell Precision 5000 5560
Intel Core i7-11850H, NVIDIA RTX A2000 Laptop GPU
259.8 (202min) fps +6%
Average NVIDIA RTX A1000 Laptop GPU
  (244 - 257, n=2)
251 fps +3%
Dell Precision 5000 5470
Intel Core i9-12900H, NVIDIA RTX A1000 Laptop GPU
244.1 (220min) fps
HP ZBook Fury 17 G7 119W5EA
Intel Core i9-10885H, NVIDIA Quadro RTX 4000 Max-Q
221 fps -9%
Lenovo ThinkPad P1 G4-20Y4Z9DVUS
Intel Core i7-11800H, NVIDIA T1200 Laptop GPU
198 fps -19%
HP ZBook Power 15 G8 313S5EA
Intel Core i7-11800H, NVIDIA T600 Laptop GPU
158.6 (9min, 50.6P0.1, 112.4P1) fps -35%
Dell Precision 3000 3551
Intel Core i9-10885H, NVIDIA Quadro P620
90.7 (87min) fps -63%
Lenovo ThinkPad P15s Gen1-20T4000JGE
Intel Core i7-10510U, NVIDIA Quadro P520
61.9 (37min) fps -75%
1366x768 Medium Graphics & Postprocessing
HP ZBook Fury 17 G7 119W5EA
Intel Core i9-10885H, NVIDIA Quadro RTX 4000 Max-Q
178 (25min) fps +21%
HP ZBook Fury 17 G8-4A6A9EA
Intel Core i9-11950H, NVIDIA RTX A3000 Laptop GPU
176 fps +19%
Average NVIDIA RTX A1000 Laptop GPU
  (147.5 - 165, n=2)
156.3 fps +6%
Dell Precision 5000 5560
Intel Core i7-11850H, NVIDIA RTX A2000 Laptop GPU
151.9 (141min) fps +3%
Dell Precision 5000 5470
Intel Core i9-12900H, NVIDIA RTX A1000 Laptop GPU
147.5 (135min) fps
Lenovo ThinkPad P1 G4-20Y4Z9DVUS
Intel Core i7-11800H, NVIDIA T1200 Laptop GPU
125 fps -15%
HP ZBook Power 15 G8 313S5EA
Intel Core i7-11800H, NVIDIA T600 Laptop GPU
92.7 (12.4min, 43.7P0.1, 71.6P1) fps -37%
Dell Precision 3000 3551
Intel Core i9-10885H, NVIDIA Quadro P620
51.7 (49min) fps -65%
Lenovo ThinkPad P15s Gen1-20T4000JGE
Intel Core i7-10510U, NVIDIA Quadro P520
26.3 (16min) fps -82%
1920x1080 High Graphics & Postprocessing (Nvidia HairWorks Off)
HP ZBook Fury 17 G7 119W5EA
Intel Core i9-10885H, NVIDIA Quadro RTX 4000 Max-Q
115 fps +40%
HP ZBook Fury 17 G8-4A6A9EA
Intel Core i9-11950H, NVIDIA RTX A3000 Laptop GPU
112 fps +36%
Dell Precision 5000 5560
Intel Core i7-11850H, NVIDIA RTX A2000 Laptop GPU
92.4 (86min) fps +13%
Average NVIDIA RTX A1000 Laptop GPU
  (82.1 - 87, n=2)
84.6 fps +3%
Dell Precision 5000 5470
Intel Core i9-12900H, NVIDIA RTX A1000 Laptop GPU
82.1 (77min) fps
Lenovo ThinkPad P1 G4-20Y4Z9DVUS
Intel Core i7-11800H, NVIDIA T1200 Laptop GPU
71 fps -14%
Lenovo ThinkPad P15v G2 21A9000XGE
Intel Core i7-11800H, NVIDIA T1200 Laptop GPU
59 (7.59min, 13.7P0.1, 33.3P1) fps -28%
HP ZBook Power 15 G8 313S5EA
Intel Core i7-11800H, NVIDIA T600 Laptop GPU
52.2 (9.95min, 15.3P0.1, 27.4P1) fps -36%
Dell Precision 3000 3551
Intel Core i9-10885H, NVIDIA Quadro P620
31.5 (28min) fps -62%
Lenovo ThinkPad P15s Gen1-20T4000JGE
Intel Core i7-10510U, NVIDIA Quadro P520
18.7 (15min) fps -77%
1920x1080 Ultra Graphics & Postprocessing (HBAO+)
HP ZBook Fury 17 G7 119W5EA
Intel Core i9-10885H, NVIDIA Quadro RTX 4000 Max-Q
62.6 (58min, 59P1) fps +47%
HP ZBook Fury 17 G8-4A6A9EA
Intel Core i9-11950H, NVIDIA RTX A3000 Laptop GPU
61.1 (58min, 59P1) fps +43%
Dell Precision 5000 5560
Intel Core i7-11850H, NVIDIA RTX A2000 Laptop GPU
50 (48min) fps +17%
Average NVIDIA RTX A1000 Laptop GPU
  (42.7 - 43.2, n=2)
43 fps +1%
Dell Precision 5000 5470
Intel Core i9-12900H, NVIDIA RTX A1000 Laptop GPU
42.7 (40min) fps
Lenovo ThinkPad P1 G4-20Y4Z9DVUS
Intel Core i7-11800H, NVIDIA T1200 Laptop GPU
36.7 (34min, 35P1) fps -14%
Lenovo ThinkPad P15v G2 21A9000XGE
Intel Core i7-11800H, NVIDIA T1200 Laptop GPU
33.2 (32min, 32P1) fps -22%
HP ZBook Power 15 G8 313S5EA
Intel Core i7-11800H, NVIDIA T600 Laptop GPU
27.6 (26min, 26P1) fps -35%
HP ZBook Firefly 15 G8 2C9R7EA
Intel Core i7-1165G7, NVIDIA T500 Laptop GPU
22.3 (16min, 17P1) fps -48%
Dell Precision 3000 3551
Intel Core i9-10885H, NVIDIA Quadro P620
16.5 (14min) fps -61%
GTA V
1024x768 Lowest Settings possible
Dell Precision 5000 5560
Intel Core i7-11850H, NVIDIA RTX A2000 Laptop GPU
179 (3.37min, 111P1) fps +7%
Lenovo ThinkPad P15v G2 21A9000XGE
Intel Core i7-11800H, NVIDIA T1200 Laptop GPU
169.9 (5.54min, 100P1) fps +1%
Dell Precision 5000 5470
Intel Core i9-12900H, NVIDIA RTX A1000 Laptop GPU
168 (2.71min, 90.9P1) fps
Average NVIDIA RTX A1000 Laptop GPU
  ()
168 fps 0%
HP ZBook Fury 17 G8-4A6A9EA
Intel Core i9-11950H, NVIDIA RTX A3000 Laptop GPU
163 (4.47min, 90.9P1) fps -3%
HP ZBook Power 15 G8 313S5EA
Intel Core i7-11800H, NVIDIA T600 Laptop GPU
142.6 (4.35min, 71.4P1) fps -15%
1920x1080 Lowest Settings possible
Dell Precision 5000 5560
Intel Core i7-11850H, NVIDIA RTX A2000 Laptop GPU
167 (4.58min, 83.3P1) fps +3%
Dell Precision 5000 5470
Intel Core i9-12900H, NVIDIA RTX A1000 Laptop GPU
161.9 (5.13min, 90.9P1) fps
Average NVIDIA RTX A1000 Laptop GPU
  ()
161.9 fps 0%
1366x768 Normal/Off AF:4x
Dell Precision 5000 5560
Intel Core i7-11850H, NVIDIA RTX A2000 Laptop GPU
170 (5.7min, 111P1) fps +6%
Average NVIDIA RTX A1000 Laptop GPU
  (159.8 - 168.2, n=2)
164 fps +3%
Dell Precision 5000 5470
Intel Core i9-12900H, NVIDIA RTX A1000 Laptop GPU
159.8 (3.92min, 83.3P1) fps
Lenovo ThinkPad P15v G2 21A9000XGE
Intel Core i7-11800H, NVIDIA T1200 Laptop GPU
158.5 (4.19min, 90.9P1) fps -1%
HP ZBook Fury 17 G8-4A6A9EA
Intel Core i9-11950H, NVIDIA RTX A3000 Laptop GPU
150 (3.91min, 76.9P1) fps -6%
HP ZBook Power 15 G8 313S5EA
Intel Core i7-11800H, NVIDIA T600 Laptop GPU
137.6 (4.7min, 66.7P1) fps -14%
1920x1080 Normal/Off AF:4x
Dell Precision 5000 5560
Intel Core i7-11850H, NVIDIA RTX A2000 Laptop GPU
163 (6.83min, 90.9P1) fps +6%
Dell Precision 5000 5470
Intel Core i9-12900H, NVIDIA RTX A1000 Laptop GPU
154.3 (4.2min, 83.3P1) fps
Average NVIDIA RTX A1000 Laptop GPU
  ()
154.3 fps 0%
HP ZBook Fury 17 G8-4A6A9EA
Intel Core i9-11950H, NVIDIA RTX A3000 Laptop GPU
122 (19.5min, 66.7P1) fps -21%
HP ZBook Power 15 G8 313S5EA
Intel Core i7-11800H, NVIDIA T600 Laptop GPU
116.7 (0.658min, 66.7P1) fps -24%
1920x1080 High/On (Advanced Graphics Off) AA:2xMSAA + FX AF:8x
Average NVIDIA RTX A1000 Laptop GPU
  (113.7 - 129.4, n=2)
121.6 fps +7%
Dell Precision 5000 5470
Intel Core i9-12900H, NVIDIA RTX A1000 Laptop GPU
113.7 (13.2min, 76.9P1) fps
Dell Precision 5000 5560
Intel Core i7-11850H, NVIDIA RTX A2000 Laptop GPU
112 (15.5min, 55.6P1) fps -1%
HP ZBook Fury 17 G8-4A6A9EA
Intel Core i9-11950H, NVIDIA RTX A3000 Laptop GPU
101 (12min, 58.8P1) fps -11%
Lenovo ThinkPad P15v G2 21A9000XGE
Intel Core i7-11800H, NVIDIA T1200 Laptop GPU
89.7 (15.7min, 62.5P1) fps -21%
HP ZBook Power 15 G8 313S5EA
Intel Core i7-11800H, NVIDIA T600 Laptop GPU
82.3 (13.7min, 50P1) fps -28%
1920x1080 Highest Settings possible AA:4xMSAA + FX AF:16x
HP ZBook Fury 17 G8-4A6A9EA
Intel Core i9-11950H, NVIDIA RTX A3000 Laptop GPU
64.3 (4.67min, 41.7P1) fps +9%
Average NVIDIA RTX A1000 Laptop GPU
  (58.9 - 62.7, n=2)
60.8 fps +3%
Dell Precision 5000 5470
Intel Core i9-12900H, NVIDIA RTX A1000 Laptop GPU
58.9 (9.57min, 38.5P1) fps
Dell Precision 5000 5560
Intel Core i7-11850H, NVIDIA RTX A2000 Laptop GPU
57.8 (7.07min, 23.3P1) fps -2%
Lenovo ThinkPad P15v G2 21A9000XGE
Intel Core i7-11800H, NVIDIA T1200 Laptop GPU
48.5 (6.57min, 31.3P1) fps -18%
HP ZBook Power 15 G8 313S5EA
Intel Core i7-11800H, NVIDIA T600 Laptop GPU
44.1 (5.56min, 12.3P1) fps -25%
Dota 2 Reborn
1280x720 min (0/3) fastest
Dell Precision 5000 5560
Intel Core i7-11850H, NVIDIA RTX A2000 Laptop GPU
173 (149min) fps +8%
Dell Precision 5000 5470
Intel Core i9-12900H, NVIDIA RTX A1000 Laptop GPU
160.8 (143.8min) fps
Lenovo ThinkPad P1 G4-20Y4Z9DVUS
Intel Core i7-11800H, NVIDIA T1200 Laptop GPU
157 (139.4min) fps -2%
Dell Precision 3000 3551
Intel Core i9-10885H, NVIDIA Quadro P620
156 (132.6min) fps -3%
HP ZBook Fury 17 G8-4A6A9EA
Intel Core i9-11950H, NVIDIA RTX A3000 Laptop GPU
156 (133.6min) fps -3%
Average NVIDIA RTX A1000 Laptop GPU
  (139.4 - 160.8, n=2)
150.1 fps -7%
HP ZBook Power 15 G8 313S5EA
Intel Core i7-11800H, NVIDIA T600 Laptop GPU
149.4 (129.9min) fps -7%
Lenovo ThinkPad P15s Gen1-20T4000JGE
Intel Core i7-10510U, NVIDIA Quadro P520
135 (116.6min) fps -16%
HP ZBook Firefly 15 G8 2C9R7EA
Intel Core i7-1165G7, NVIDIA T500 Laptop GPU
134 (120.2min) fps -17%
Lenovo ThinkPad P15v G2 21A9000XGE
Intel Core i7-11800H, NVIDIA T1200 Laptop GPU
133.3 (116.1min) fps -17%
HP ZBook Fury 17 G7 119W5EA
Intel Core i9-10885H, NVIDIA Quadro RTX 4000 Max-Q
131 (116.1min) fps -19%
1366x768 med (1/3)
Dell Precision 5000 5560
Intel Core i7-11850H, NVIDIA RTX A2000 Laptop GPU
155 (136.7min) fps +5%
Dell Precision 5000 5470
Intel Core i9-12900H, NVIDIA RTX A1000 Laptop GPU
147.9 (106.5min) fps
Dell Precision 3000 3551
Intel Core i9-10885H, NVIDIA Quadro P620
139 (122.6min) fps -6%
Average NVIDIA RTX A1000 Laptop GPU
  (128.7 - 147.9, n=2)
138.3 fps -6%
Lenovo ThinkPad P1 G4-20Y4Z9DVUS
Intel Core i7-11800H, NVIDIA T1200 Laptop GPU
138 (122min) fps -7%
HP ZBook Fury 17 G8-4A6A9EA
Intel Core i9-11950H, NVIDIA RTX A3000 Laptop GPU
131 (116.3min) fps -11%
HP ZBook Power 15 G8 313S5EA
Intel Core i7-11800H, NVIDIA T600 Laptop GPU
127.6 (113.4min) fps -14%
Lenovo ThinkPad P15s Gen1-20T4000JGE
Intel Core i7-10510U, NVIDIA Quadro P520
118 (97.9min) fps -20%
HP ZBook Firefly 15 G8 2C9R7EA
Intel Core i7-1165G7, NVIDIA T500 Laptop GPU
117 (103.1min) fps -21%
Lenovo ThinkPad P15v G2 21A9000XGE
Intel Core i7-11800H, NVIDIA T1200 Laptop GPU
116.5 (101.9min) fps -21%
HP ZBook Fury 17 G7 119W5EA
Intel Core i9-10885H, NVIDIA Quadro RTX 4000 Max-Q
116 (102.9min) fps -22%
1920x1080 high (2/3)
Dell Precision 5000 5560
Intel Core i7-11850H, NVIDIA RTX A2000 Laptop GPU
130 (112.5min) fps +16%
Lenovo ThinkPad P1 G4-20Y4Z9DVUS
Intel Core i7-11800H, NVIDIA T1200 Laptop GPU
128 (112.6min) fps +14%
HP ZBook Fury 17 G8-4A6A9EA
Intel Core i9-11950H, NVIDIA RTX A3000 Laptop GPU
119 (105.9min) fps +6%
Average NVIDIA RTX A1000 Laptop GPU
  (112.3 - 125, n=2)
118.7 fps +6%
HP ZBook Power 15 G8 313S5EA
Intel Core i7-11800H, NVIDIA T600 Laptop GPU
115.8 (99.1min) fps +3%
Dell Precision 5000 5470
Intel Core i9-12900H, NVIDIA RTX A1000 Laptop GPU
112.3 (97.8min) fps
Lenovo ThinkPad P15v G2 21A9000XGE
Intel Core i7-11800H, NVIDIA T1200 Laptop GPU
107.8 (92.4min) fps -4%
HP ZBook Fury 17 G7 119W5EA
Intel Core i9-10885H, NVIDIA Quadro RTX 4000 Max-Q
107 (94.5min) fps -5%
HP ZBook Firefly 15 G8 2C9R7EA
Intel Core i7-1165G7, NVIDIA T500 Laptop GPU
104 (92.9min) fps -7%
Dell Precision 3000 3551
Intel Core i9-10885H, NVIDIA Quadro P620
90.2 (81.2min) fps -20%
Lenovo ThinkPad P15s Gen1-20T4000JGE
Intel Core i7-10510U, NVIDIA Quadro P520
33.4 (23.2min) fps -70%
1920x1080 ultra (3/3) best looking
Dell Precision 5000 5470
Intel Core i9-12900H, NVIDIA RTX A1000 Laptop GPU
132.1 (114.8min) fps
Average NVIDIA RTX A1000 Laptop GPU
  (118.2 - 132.1, n=2)
125.2 fps -5%
Dell Precision 5000 5560
Intel Core i7-11850H, NVIDIA RTX A2000 Laptop GPU
119 (102min) fps -10%
Lenovo ThinkPad P1 G4-20Y4Z9DVUS
Intel Core i7-11800H, NVIDIA T1200 Laptop GPU
116 (100.4min) fps -12%
HP ZBook Fury 17 G8-4A6A9EA
Intel Core i9-11950H, NVIDIA RTX A3000 Laptop GPU
108 (95.1min) fps -18%
HP ZBook Power 15 G8 313S5EA
Intel Core i7-11800H, NVIDIA T600 Laptop GPU
107.1 (93.8min) fps -19%
HP ZBook Fury 17 G7 119W5EA
Intel Core i9-10885H, NVIDIA Quadro RTX 4000 Max-Q
101 (88.8min) fps -24%
Lenovo ThinkPad P15v G2 21A9000XGE
Intel Core i7-11800H, NVIDIA T1200 Laptop GPU
100.4 (84.6min) fps -24%
HP ZBook Firefly 15 G8 2C9R7EA
Intel Core i7-1165G7, NVIDIA T500 Laptop GPU
96.2 (84.2min) fps -27%
Dell Precision 3000 3551
Intel Core i9-10885H, NVIDIA Quadro P620
82.8 (73.7min) fps -37%
Lenovo ThinkPad P15s Gen1-20T4000JGE
Intel Core i7-10510U, NVIDIA Quadro P520
20.9 (6.3min) fps -84%
Final Fantasy XV Benchmark
1280x720 Lite Quality
HP ZBook Fury 17 G8-4A6A9EA
Intel Core i9-11950H, NVIDIA RTX A3000 Laptop GPU
130 fps +23%
HP ZBook Fury 17 G7 119W5EA
Intel Core i9-10885H, NVIDIA Quadro RTX 4000 Max-Q
118 fps +12%
Average NVIDIA RTX A1000 Laptop GPU
  (105.3 - 129.2, n=2)
117.3 fps +11%
Dell Precision 5000 5470
Intel Core i9-12900H, NVIDIA RTX A1000 Laptop GPU
105.3 fps
Lenovo ThinkPad P1 G4-20Y4Z9DVUS
Intel Core i7-11800H, NVIDIA T1200 Laptop GPU
102 fps -3%
Lenovo ThinkPad P15v G2 21A9000XGE
Intel Core i7-11800H, NVIDIA T1200 Laptop GPU
88 fps -16%
Dell Precision 5000 5560
Intel Core i7-11850H, NVIDIA RTX A2000 Laptop GPU
86.9 fps -17%
HP ZBook Power 15 G8 313S5EA
Intel Core i7-11800H, NVIDIA T600 Laptop GPU
86 fps -18%
Dell Precision 3000 3551
Intel Core i9-10885H, NVIDIA Quadro P620
51.7 fps -51%
1920x1080 Standard Quality
HP ZBook Fury 17 G8-4A6A9EA
Intel Core i9-11950H, NVIDIA RTX A3000 Laptop GPU
86.7 fps +47%
HP ZBook Fury 17 G7 119W5EA
Intel Core i9-10885H, NVIDIA Quadro RTX 4000 Max-Q
86.5 fps +46%
Average NVIDIA RTX A1000 Laptop GPU
  (59.1 - 67.9, n=2)
63.5 fps +7%
Dell Precision 5000 5560
Intel Core i7-11850H, NVIDIA RTX A2000 Laptop GPU
63.2 fps +7%
Dell Precision 5000 5470
Intel Core i9-12900H, NVIDIA RTX A1000 Laptop GPU
59.1 fps
Lenovo ThinkPad P1 G4-20Y4Z9DVUS
Intel Core i7-11800H, NVIDIA T1200 Laptop GPU
56.5 fps -4%
Lenovo ThinkPad P15v G2 21A9000XGE
Intel Core i7-11800H, NVIDIA T1200 Laptop GPU
49.5 fps -16%
HP ZBook Power 15 G8 313S5EA
Intel Core i7-11800H, NVIDIA T600 Laptop GPU
43.9 fps -26%
Dell Precision 3000 3551
Intel Core i9-10885H, NVIDIA Quadro P620
25.8 fps -56%
1920x1080 High Quality
HP ZBook Fury 17 G7 119W5EA
Intel Core i9-10885H, NVIDIA Quadro RTX 4000 Max-Q
68.3 fps +59%
HP ZBook Fury 17 G8-4A6A9EA
Intel Core i9-11950H, NVIDIA RTX A3000 Laptop GPU
67 fps +56%
Dell Precision 5000 5560
Intel Core i7-11850H, NVIDIA RTX A2000 Laptop GPU
46.6 fps +8%
Average NVIDIA RTX A1000 Laptop GPU
  (43 - 48.3, n=2)
45.7 fps +6%
Dell Precision 5000 5470
Intel Core i9-12900H, NVIDIA RTX A1000 Laptop GPU
43 fps
Lenovo ThinkPad P1 G4-20Y4Z9DVUS
Intel Core i7-11800H, NVIDIA T1200 Laptop GPU
39 fps -9%
Lenovo ThinkPad P15v G2 21A9000XGE
Intel Core i7-11800H, NVIDIA T1200 Laptop GPU
35 fps -19%
HP ZBook Power 15 G8 313S5EA
Intel Core i7-11800H, NVIDIA T600 Laptop GPU
31 fps -28%
Dell Precision 3000 3551
Intel Core i9-10885H, NVIDIA Quadro P620
18.5 fps -57%
X-Plane 11.11
1280x720 low (fps_test=1)
Dell Precision 5000 5470
Intel Core i9-12900H, NVIDIA RTX A1000 Laptop GPU
118.7 fps
Dell Precision 5000 5560
Intel Core i7-11850H, NVIDIA RTX A2000 Laptop GPU
112 fps -6%
Average NVIDIA RTX A1000 Laptop GPU
  (99.8 - 118.7, n=2)
109.3 fps -8%
Lenovo ThinkPad P1 G4-20Y4Z9DVUS
Intel Core i7-11800H, NVIDIA T1200 Laptop GPU
109 fps -8%
HP ZBook Power 15 G8 313S5EA
Intel Core i7-11800H, NVIDIA T600 Laptop GPU
107.9 fps -9%
Dell Precision 3000 3551
Intel Core i9-10885H, NVIDIA Quadro P620
104 fps -12%
HP ZBook Fury 17 G8-4A6A9EA
Intel Core i9-11950H, NVIDIA RTX A3000 Laptop GPU
103 fps -13%
Lenovo ThinkPad P15v G2 21A9000XGE
Intel Core i7-11800H, NVIDIA T1200 Laptop GPU
96.2 fps -19%
HP ZBook Fury 17 G7 119W5EA
Intel Core i9-10885H, NVIDIA Quadro RTX 4000 Max-Q
93.3 fps -21%
HP ZBook Firefly 15 G8 2C9R7EA
Intel Core i7-1165G7, NVIDIA T500 Laptop GPU
81.1 fps -32%
Lenovo ThinkPad P15s Gen1-20T4000JGE
Intel Core i7-10510U, NVIDIA Quadro P520
64.5 fps -46%
1920x1080 med (fps_test=2)
Dell Precision 5000 5470
Intel Core i9-12900H, NVIDIA RTX A1000 Laptop GPU
94.8 fps
Lenovo ThinkPad P1 G4-20Y4Z9DVUS
Intel Core i7-11800H, NVIDIA T1200 Laptop GPU
94 fps -1%
HP ZBook Power 15 G8 313S5EA
Intel Core i7-11800H, NVIDIA T600 Laptop GPU
92.4 fps -3%
Average NVIDIA RTX A1000 Laptop GPU
  (88.6 - 94.8, n=2)
91.7 fps -3%
Dell Precision 5000 5560
Intel Core i7-11850H, NVIDIA RTX A2000 Laptop GPU
89.2 fps -6%
HP ZBook Fury 17 G8-4A6A9EA
Intel Core i9-11950H, NVIDIA RTX A3000 Laptop GPU
82.1 fps -13%
HP ZBook Fury 17 G7 119W5EA
Intel Core i9-10885H, NVIDIA Quadro RTX 4000 Max-Q
78.8 fps -17%
Lenovo ThinkPad P15v G2 21A9000XGE
Intel Core i7-11800H, NVIDIA T1200 Laptop GPU
77.5 fps -18%
Dell Precision 3000 3551
Intel Core i9-10885H, NVIDIA Quadro P620
71.3 fps -25%
HP ZBook Firefly 15 G8 2C9R7EA
Intel Core i7-1165G7, NVIDIA T500 Laptop GPU
69 fps -27%
Lenovo ThinkPad P15s Gen1-20T4000JGE
Intel Core i7-10510U, NVIDIA Quadro P520
24.5 fps -74%
1920x1080 high (fps_test=3)
HP ZBook Power 15 G8 313S5EA
Intel Core i7-11800H, NVIDIA T600 Laptop GPU
77 fps +1%
Dell Precision 5000 5470
Intel Core i9-12900H, NVIDIA RTX A1000 Laptop GPU
76.3 fps
Lenovo ThinkPad P1 G4-20Y4Z9DVUS
Intel Core i7-11800H, NVIDIA T1200 Laptop GPU
75.6 fps -1%
Dell Precision 5000 5560
Intel Core i7-11850H, NVIDIA RTX A2000 Laptop GPU
75.1 fps -2%
Average NVIDIA RTX A1000 Laptop GPU
  (71.9 - 76.3, n=2)
74.1 fps -3%
HP ZBook Fury 17 G8-4A6A9EA
Intel Core i9-11950H, NVIDIA RTX A3000 Laptop GPU
66.7 fps -13%
HP ZBook Fury 17 G7 119W5EA
Intel Core i9-10885H, NVIDIA Quadro RTX 4000 Max-Q
66.2 fps -13%
Lenovo ThinkPad P15v G2 21A9000XGE
Intel Core i7-11800H, NVIDIA T1200 Laptop GPU
64.8 fps -15%
Dell Precision 3000 3551
Intel Core i9-10885H, NVIDIA Quadro P620
63.9 fps -16%
HP ZBook Firefly 15 G8 2C9R7EA
Intel Core i7-1165G7, NVIDIA T500 Laptop GPU
60 fps -21%
Lenovo ThinkPad P15s Gen1-20T4000JGE
Intel Core i7-10510U, NVIDIA Quadro P520
18.4 fps -76%
Strange Brigade
1280x720 lowest AF:1
HP ZBook Fury 17 G8-4A6A9EA
Intel Core i9-11950H, NVIDIA RTX A3000 Laptop GPU
324 fps +34%
Average NVIDIA RTX A1000 Laptop GPU
  (242 - 261, n=2)
252 fps +4%
Dell Precision 5000 5560
Intel Core i7-11850H, NVIDIA RTX A2000 Laptop GPU
251 (24.2min, 179P1) fps +4%
Dell Precision 5000 5470
Intel Core i9-12900H, NVIDIA RTX A1000 Laptop GPU
242 (128.8min, 183.1P1) fps
Lenovo ThinkPad P15v G2 21A9000XGE
Intel Core i7-11800H, NVIDIA T1200 Laptop GPU
208 (36.3min, 170.3P1) fps -14%
HP ZBook Power 15 G8 313S5EA
Intel Core i7-11800H, NVIDIA T600 Laptop GPU
190.4 (74.5min, 147.1P1) fps -21%
1920x1080 medium AA:medium AF:4
HP ZBook Fury 17 G8-4A6A9EA
Intel Core i9-11950H, NVIDIA RTX A3000 Laptop GPU
164 fps +54%
Average NVIDIA RTX A1000 Laptop GPU
  (106.2 - 111.4, n=2)
108.8 fps +2%
Dell Precision 5000 5470
Intel Core i9-12900H, NVIDIA RTX A1000 Laptop GPU
106.2 (82.7min, 91.1P1) fps
Lenovo ThinkPad P15v G2 21A9000XGE
Intel Core i7-11800H, NVIDIA T1200 Laptop GPU
84 (66.7min, 72P1) fps -21%
HP ZBook Power 15 G8 313S5EA
Intel Core i7-11800H, NVIDIA T600 Laptop GPU
76.2 (62min, 67.3P1) fps -28%
1920x1080 high AA:high AF:8
HP ZBook Fury 17 G8-4A6A9EA
Intel Core i9-11950H, NVIDIA RTX A3000 Laptop GPU
134 fps +58%
Average NVIDIA RTX A1000 Laptop GPU
  (84.7 - 90.2, n=2)
87.5 fps +3%
Dell Precision 5000 5470
Intel Core i9-12900H, NVIDIA RTX A1000 Laptop GPU
84.7 (61.1min, 63.7P1) fps
Lenovo ThinkPad P15v G2 21A9000XGE
Intel Core i7-11800H, NVIDIA T1200 Laptop GPU
68.5 (51.5min, 54.2P1) fps -19%
HP ZBook Power 15 G8 313S5EA
Intel Core i7-11800H, NVIDIA T600 Laptop GPU
60.7 (46.9min, 47.9P1) fps -28%
1920x1080 ultra AA:ultra AF:16
HP ZBook Fury 17 G8-4A6A9EA
Intel Core i9-11950H, NVIDIA RTX A3000 Laptop GPU
118 fps +62%
Average NVIDIA RTX A1000 Laptop GPU
  (72.8 - 78.4, n=2)
75.6 fps +4%
Dell Precision 5000 5470
Intel Core i9-12900H, NVIDIA RTX A1000 Laptop GPU
72.8 (53.2min, 56.3P1) fps
Lenovo ThinkPad P15v G2 21A9000XGE
Intel Core i7-11800H, NVIDIA T1200 Laptop GPU
59.3 (44.7min, 46.9P1) fps -19%
HP ZBook Power 15 G8 313S5EA
Intel Core i7-11800H, NVIDIA T600 Laptop GPU
52.7 (37.2min, 42P1) fps -28%
Cyberpunk 2077 1.6
1920x1080 Low Preset
Dell Precision 5000 5470
Intel Core i9-12900H, NVIDIA RTX A1000 Laptop GPU
61.3 (20.5min) fps
Average NVIDIA RTX A1000 Laptop GPU
  ()
61.3 fps 0%
1920x1080 Medium Preset
Dell Precision 5000 5470
Intel Core i9-12900H, NVIDIA RTX A1000 Laptop GPU
50.4 (30.8min) fps
Average NVIDIA RTX A1000 Laptop GPU
  ()
50.4 fps 0%
1920x1080 High Preset
Dell Precision 5000 5470
Intel Core i9-12900H, NVIDIA RTX A1000 Laptop GPU
36.7 (15.3min) fps
Average NVIDIA RTX A1000 Laptop GPU
  ()
36.7 fps 0%
1920x1080 Ultra Preset
Dell Precision 5000 5470
Intel Core i9-12900H, NVIDIA RTX A1000 Laptop GPU
29 (11.4min) fps
Average NVIDIA RTX A1000 Laptop GPU
  ()
29 fps 0%

Witcher 3 FPS Chart

0510152025303540Tooltip
Dell Precision 5000 5470 i9-12900H, RTX A1000 Laptop GPU: Ø41.4 (37-44)
low med. high ultraQHD
GTA V (2015) 168 159.8 113.7 58.9
The Witcher 3 (2015) 244.1 147.5 82.1 42.7
Dota 2 Reborn (2015) 160.8 147.9 112.3 132.1
Final Fantasy XV Benchmark (2018) 105.3 59.1 43
X-Plane 11.11 (2018) 118.7 94.8 76.3
Strange Brigade (2018) 242 106.2 84.7 72.8
Metro Exodus (2019) 111 53.3 39.3 31.2 23.6
Borderlands 3 (2019) 110.4 68.4 42.6 31.3 18.8
Gears Tactics (2020) 161.5 106.5 63.9 46.8 31.1
Horizon Zero Dawn (2020) 82 68 58 48 38
Watch Dogs Legion (2020) 75 62 54 26 17
Dirt 5 (2020) 135 62.4 48.5 37.2 25.8
Assassin´s Creed Valhalla (2020) 103 50 33 25 22
Hitman 3 (2021) 171.9 83.7 71.3 66.1 41
F1 2021 (2021) 195 127 103 54 34
Far Cry 6 (2021) 103 64 54
Guardians of the Galaxy (2021) 92 64 64 61 37
God of War (2022) 60.2 49.1 40.9 25.8 20.5
Cyberpunk 2077 1.6 (2022) 61.3 50.4 36.7 29
F1 22 (2022) 112 107 76 22 13

排放

系统噪音 - 负载下声音大

Precision 5470的运行声音比较大的 Precision 5560负载时的噪音。例如,在超性能模式下运行 Witcher 3例如,在超性能模式下运行,将导致风扇噪音略低于49 dB(A),而15.6英寸的Precision ,只有40 dB(A)。事实上,Precision 5470很容易成为14英寸小型工作站中噪音最大的机型之一。

当在平衡模式而不是超性能模式下运行重负荷时,系统变得更加安静,为40.3 dB(A)。如上所述,你会失去一些CPU性能,但根据环境的不同,更安静的风扇可能值得折衷。

如果设置为超性能模式,即使只是在桌面上闲置,内部风扇也会周期性地脉冲,似乎没有任何理由。如果运行要求不高的应用程序,建议使用平衡模式或静音模式。

冷却解决方案包括两个45至50毫米的风扇,它们之间有两个热管。
我们的设备会出现轻微的线圈啸叫或电子噪音
风扇噪音曲线(白色。背景,红色。系统空闲,蓝色:3DMark 06,橙色。Witcher 3,绿色。Prime95+FurMark压力)

Noise Level

Idle
23.3 / 23.3 / 23.3 dB(A)
Load
48.5 / 50.4 dB(A)
  red to green bar
 
 
30 dB
silent
40 dB(A)
audible
50 dB(A)
loud
 
min: dark, med: mid, max: light   Earthworks M23R, Arta (15 cm distance)   environment noise: 23 dB(A)
dB(A) 0102030405060708090Deep BassMiddle BassHigh BassLower RangeMidsHigher MidsLower HighsMid HighsUpper HighsSuper Highs2032.330.628.331.830.22527.727.625.62623.83126.322.522.621.122.74023.929.223.820.521.95024.530.821.418.822.36326.533.623.819218026.727.120.120.225.610023.222.217.81825.712523.9221615.323.716023.123.814.313.824.220026.52714.114.526.925029.128.413.813.229.231530.83115.214.431.740031.732.212.212.332.85003333.311.31234.363032.632.51010.133.680032.732.89.99.433.5100034.534.59.79.335.7125035.535.99.99.437.5160037.737.510.19.939.4200038.738.611.210.140.6250037.837.411.610.539.3315037.137.210.910.839.7400037.637.711.211.239.750003838.111.511.340.1630036.736.711.911.738.5800036.13611.811.937.61000034.934.81211.837.11250033.433.511.711.536.61600027.827.811.710.831.7SPL48.648.523.32350.4N6.46.40.50.47.2median 33.4median 33.5median 11.7median 11.5median 35.7Delta4.74.71.81.84.8hearing rangehide median Fan NoiseDell Precision 5000 5470
Dell Precision 5000 5470
RTX A1000 Laptop GPU, i9-12900H, Samsung PM9A1 MZVL21T0HCLR
Lenovo ThinkPad P15v G2 21A9000XGE
T1200 Laptop GPU, i7-11800H, Toshiba XG6 KXG6AZNV512G
Dell Precision 5000 5560
RTX A2000 Laptop GPU, i7-11850H, Samsung PM9A1 MZVL22T0HBLB
Lenovo ThinkPad P14s G2 AMD
Vega 8, R7 PRO 5850U, SK Hynix PC711 1TB HFS001TDE9X081N
HP ZBook Firefly 14 G8 2C9Q2EA
T500 Laptop GPU, i7-1165G7, Toshiba XG6 KXG60ZNV1T02
HP ZBook Firefly 14 G7
Quadro P520, i7-10610U, Toshiba XG6 KXG60ZNV512G
Noise
3%
11%
8%
-4%
-4%
off / environment *
23
25.21
-10%
23.4
-2%
24.04
-5%
28.7
-25%
29.7
-29%
Idle Minimum *
23.3
25.21
-8%
23.6
-1%
24.04
-3%
28.7
-23%
29.7
-27%
Idle Average *
23.3
25.21
-8%
23.6
-1%
24.04
-3%
28.7
-23%
29.7
-27%
Idle Maximum *
23.3
25.21
-8%
23.6
-1%
24.04
-3%
28.7
-23%
30.4
-30%
Load Average *
48.5
39.09
19%
25.8
47%
28.19
42%
34
30%
33.1
32%
Witcher 3 ultra *
48.6
36.6
25%
40.1
17%
40.1
17%
35.3
27%
Load Maximum *
50.4
43.53
14%
41.4
18%
40.77
19%
40.1
20%
37.9
25%

* ... smaller is better

温度

考虑到酷睿H级CPU、独立的Nvidia GPU和小机箱尺寸,表面温度比预期的要低。其他14英寸工作站,如ZBook Firefly 14 G8或ThinkPad P14s G2,都配备了较慢的CPU,但它们的温度会变得更高,热点达到49℃,而我们的Precision 。尽管如此,键盘中心仍然可以在42摄氏度时变得相当热。

后排气管
后排气管
长时间运行要求高的负载时,AC适配器可达到50 C
Max. Load
 39 °C41.8 °C36.2 °C 
 33.8 °C39.8 °C35 °C 
 26 °C27.4 °C26.4 °C 
Maximum: 41.8 °C
Average: 33.9 °C
35.2 °C36 °C29.6 °C
30.4 °C31 °C28.6 °C
27.2 °C28.6 °C26.6 °C
Maximum: 36 °C
Average: 30.4 °C
Power Supply (max.)  50 °C | Room Temperature 21 °C | Fluke 62 Mini IR Thermometer
(±) The average temperature for the upper side under maximal load is 33.9 °C / 93 F, compared to the average of 32 °C / 90 F for the devices in the class Workstation.
(±) The maximum temperature on the upper side is 41.8 °C / 107 F, compared to the average of 38.2 °C / 101 F, ranging from 22.2 to 69.8 °C for the class Workstation.
(+) The bottom heats up to a maximum of 36 °C / 97 F, compared to the average of 41.2 °C / 106 F
(+) In idle usage, the average temperature for the upper side is 31 °C / 88 F, compared to the device average of 32 °C / 90 F.
(±) Playing The Witcher 3, the average temperature for the upper side is 32.2 °C / 90 F, compared to the device average of 32 °C / 90 F.
(+) The palmrests and touchpad are cooler than skin temperature with a maximum of 27.6 °C / 81.7 F and are therefore cool to the touch.
(±) The average temperature of the palmrest area of similar devices was 27.8 °C / 82 F (+0.2 °C / 0.3 F).
系统空闲(顶部)
系统空闲(顶部)
系统闲置(底部)
系统闲置(底部)
Witcher 3 压力(顶部)
Witcher 3 压力(顶部)
Witcher 3 压力(底部)
Witcher 3 压力(底部)
Prime95+FurMark的压力(顶)。
Prime95+FurMark的压力(底部)。
Dell Precision 5000 5470
Intel Core i9-12900H, NVIDIA RTX A1000 Laptop GPU
Lenovo ThinkPad P15v G2 21A9000XGE
Intel Core i7-11800H, NVIDIA T1200 Laptop GPU
Dell Precision 5000 5560
Intel Core i7-11850H, NVIDIA RTX A2000 Laptop GPU
Lenovo ThinkPad P14s G2 AMD
AMD Ryzen 7 PRO 5850U, AMD Radeon RX Vega 8 (Ryzen 4000/5000)
HP ZBook Firefly 14 G8 2C9Q2EA
Intel Core i7-1165G7, NVIDIA T500 Laptop GPU
HP ZBook Firefly 14 G7
Intel Core i7-10610U, NVIDIA Quadro P520
Heat
-9%
-10%
1%
5%
-7%
Maximum Upper Side *
41.8
53.8
-29%
48.2
-15%
42.8
-2%
42.6
-2%
52.3
-25%
Maximum Bottom *
36
52.1
-45%
42.6
-18%
47.5
-32%
49.4
-37%
60.9
-69%
Idle Upper Side *
34.6
27.6
20%
34.8
-1%
27
22%
24.2
30%
23.1
33%
Idle Bottom *
33.6
27.7
18%
35.2
-5%
28.3
16%
24.6
27%
23
32%

* ... smaller is better

压力测试--循环的CPU时钟速率

启动Prime95会导致CPU时钟速率、电路板功耗和核心温度分别飙升至3.6 GHz、91 W和101 C。然而,仅仅几秒钟后,时钟频率、功耗和温度将开始在1.0至2.4 GHz、20至50 W和61至82 C之间分别循环变化。这种循环行为与我们上面的CineBency R15 xT循环测试结果一致,表明Precision 5470无法长时间保持稳定的Turbo Boost时钟速率。在这么小的机箱中运行Core i9-12900H CPU以发挥其最大潜力仍然是一个梦想。

当运行 Witcher 3代表高处理负荷时,CPU和GPU将分别稳定在82摄氏度和71摄氏度,而在Precision 5560上为69摄氏度和75摄氏度。

用电池供电运行限制了CPU的性能。在电池上进行的Fire Strike 测试将返回物理和图形分数,分别为21067和10542分,而在主电源上则为27514和10914分。

系统空闲
系统空闲
Witcher 3 压力
Witcher 3 压力
Prime95压力
Prime95压力
Prime95+FurMark压力
Prime95+FurMark压力
CPU时钟(GHz) GPU时钟(MHz) CPU平均温度(℃) GPU平均温度(℃)
系统空闲 -- -- 54 53
Prime95压力 1.0 - 2.4 - 61 - 80 ~61
Prime95 + FurMark 压力 1.1 1027 67 68
Witcher 3 应力 1.0 1387 82 71

发言人

四个扬声器,在前角附近有2个2W的向下发射的扬声器,沿键盘两侧有2个2W的向上发射的扬声器。
在最大音量下的粉红噪音显示出良好的平衡性,但低音再现不佳
dB(A) 0102030405060708090Deep BassMiddle BassHigh BassLower RangeMidsHigher MidsLower HighsMid HighsUpper HighsSuper Highs2028.528.328.52527.525.627.53121.822.621.84022.923.822.95021.921.421.9632623.8268032.320.132.310039.117.839.112543164316048.114.348.120053.114.153.125059.313.859.33156415.26440062.812.262.850065.511.365.563070.51070.5800739.973100071.29.771.2125065.29.965.2160063.910.163.9200070.711.270.725007011.670315069.810.969.8400067.311.267.350006411.564630060.411.960.4800059.911.859.91000063.21263.21250066.511.766.51600063.711.763.7SPL80.223.380.2N48.20.548.2median 64median 11.7median 64Delta4.31.84.326.325.821.422.12624.925.127.622.532.523.448.72655.818.860.922.167.2267019.372.317.674.217.774.319.575.31571.711.871.311.27410.574.21072.710.17210.67210.97511.374.811.671.71269.71269.612.371.112.669.61270.111.269.824.784.70.666.6median 12median 71.73.42.2hearing rangehide median Pink NoiseDell Precision 5000 5470Apple MacBook Pro 16 2021 M1 Pro
Frequency diagram (checkboxes can be checked and unchecked to compare devices)
Dell Precision 5000 5470 audio analysis

(±) | speaker loudness is average but good (80.2 dB)
Bass 100 - 315 Hz
(±) | reduced bass - on average 12.9% lower than median
(±) | linearity of bass is average (10.1% delta to prev. frequency)
Mids 400 - 2000 Hz
(+) | balanced mids - only 4.2% away from median
(+) | mids are linear (6.5% delta to prev. frequency)
Highs 2 - 16 kHz
(+) | balanced highs - only 3.4% away from median
(+) | highs are linear (3.9% delta to prev. frequency)
Overall 100 - 16.000 Hz
(+) | overall sound is linear (12.9% difference to median)
Compared to same class
» 16% of all tested devices in this class were better, 6% similar, 78% worse
» The best had a delta of 7%, average was 18%, worst was 35%
Compared to all devices tested
» 9% of all tested devices were better, 2% similar, 88% worse
» The best had a delta of 4%, average was 25%, worst was 134%

Apple MacBook Pro 16 2021 M1 Pro audio analysis

(+) | speakers can play relatively loud (84.7 dB)
Bass 100 - 315 Hz
(+) | good bass - only 3.8% away from median
(+) | bass is linear (5.2% delta to prev. frequency)
Mids 400 - 2000 Hz
(+) | balanced mids - only 1.3% away from median
(+) | mids are linear (2.1% delta to prev. frequency)
Highs 2 - 16 kHz
(+) | balanced highs - only 1.9% away from median
(+) | highs are linear (2.7% delta to prev. frequency)
Overall 100 - 16.000 Hz
(+) | overall sound is linear (4.6% difference to median)
Compared to same class
» 0% of all tested devices in this class were better, 0% similar, 100% worse
» The best had a delta of 5%, average was 18%, worst was 45%
Compared to all devices tested
» 0% of all tested devices were better, 0% similar, 100% worse
» The best had a delta of 4%, average was 25%, worst was 134%

能源管理

耗电量--一个要求苛刻的小机器

在最低亮度设置和电源配置文件下,桌面上的空转只需要4.3瓦,而最大亮度设置和电源配置文件下的dGPU激活需要近19瓦。 Precision 5560装备更快的RTX A2000 GPU,但i7-11850H CPU较慢。该系统通常比其他14英寸工作站要求更高,这也是其更快的内部硬件所预期的。

在运行Prim95时,我们能够从中小型(约14.3 x 6.5 x 2.2厘米)的130瓦USB-C交流适配器中记录到近138瓦的最大电流。如下面的截图所示,由于冷却解决方案的热限制,这个速率只是暂时的。功耗曲线的形状与我们在上面观察到的时钟速率和电路板功耗密切相关。

请注意,没有独立RTX A1000 GPU的SKU将配备一个较小的90 W USB-C交流适配器,而不是较大的130 W。

3DMark 06的耗电量
3DMark 06的耗电量
Witcher 3 1080p超强消费
Witcher 3 1080p超强消费
启动Prime95会使消耗量在几秒钟内飙升至137.5瓦,然后由于涡轮增压的可持续性不佳而降至42瓦。
Prime95+FurMark在10秒处启动
Power Consumption
Off / Standbydarklight 0.55 / 1.08 Watt
Idledarkmidlight 4.3 / 8.9 / 18.9 Watt
Load midlight 94 / 137.5 Watt
 color bar
Key: min: dark, med: mid, max: light        Metrahit Energy
Currently we use the Metrahit Energy, a professional single phase power quality and energy measurement digital multimeter, for our measurements. Find out more about it here. All of our test methods can be found here.
Dell Precision 5000 5470
i9-12900H, RTX A1000 Laptop GPU, Samsung PM9A1 MZVL21T0HCLR, IPS, 2560x1600, 14.00
Lenovo ThinkPad P15v G2 21A9000XGE
i7-11800H, T1200 Laptop GPU, Toshiba XG6 KXG6AZNV512G, IPS LED, 1920x1080, 15.60
Dell Precision 5000 5560
i7-11850H, RTX A2000 Laptop GPU, Samsung PM9A1 MZVL22T0HBLB, IPS, 3840x2400, 15.60
Lenovo ThinkPad P14s G2 AMD
R7 PRO 5850U, Vega 8, SK Hynix PC711 1TB HFS001TDE9X081N, IPS LED, 3840x2160, 14.00
HP ZBook Firefly 14 G8 2C9Q2EA
i7-1165G7, T500 Laptop GPU, Toshiba XG6 KXG60ZNV1T02, IPS, 1920x1080, 14.00
HP ZBook Firefly 14 G7
i7-10610U, Quadro P520, Toshiba XG6 KXG60ZNV512G, IPS, 1920x1080, 14.00
Power Consumption
1%
-22%
35%
40%
30%
Idle Minimum *
4.3
5.96
-39%
6.2
-44%
4.49
-4%
3.1
28%
3.3
23%
Idle Average *
8.9
8.37
6%
13.9
-56%
9.62
-8%
4.7
47%
9.3
-4%
Idle Maximum *
18.9
9.05
52%
23.8
-26%
10.24
46%
8.6
54%
12.1
36%
Load Average *
94
91.82
2%
95.7
-2%
31.56
66%
64.8
31%
59.4
37%
Witcher 3 ultra *
83.2
102
-23%
87
-5%
43.7
47%
59.6
28%
52.7
37%
Load Maximum *
137.5
126.38
8%
132.6
4%
52.37
62%
68.5
50%
69.4
50%

* ... smaller is better

Power Consumption Witcher 3 / Stresstest

0102030405060708090100110120130Tooltip
Dell Precision 5000 5470 i9-12900H, RTX A1000 Laptop GPU; Witcher 3 ultra: Ø83.2 (77.2-122)
Dell Precision 5000 5470 i9-12900H, RTX A1000 Laptop GPU; 1280x720 Prime95 28.10 and Furmark 1.25: Ø91.7 (82.8-137.5)

Power Consumption external Monitor

0102030405060708090100110120130Tooltip
Dell Precision 5000 5470 i9-12900H, RTX A1000 Laptop GPU; Prime95 V2810 Stress (external Monitor): Ø52 (41-137.5)
Dell Precision 5000 5470 i9-12900H, RTX A1000 Laptop GPU; Cinebench R15 Multi (external Monitor): Ø100.6 (86.1-124)
Dell Precision 5000 5470 i9-12900H, RTX A1000 Laptop GPU; 1280x720 FurMark 1.19 GPU Stress Test (external Monitor): Ø63.9 (57.8-69.7)
Dell Precision 5000 5470 i9-12900H, RTX A1000 Laptop GPU; 1920x1080 The Witcher 3 ultra (external Monitor): Ø79.8 (74.7-101.1)

电池寿命

对于一个超薄的14英寸笔记本电脑来说,电池容量是比较大的,为72Wh。在充满电的情况下,WLAN运行时间刚刚超过9.5小时,这比我们在较慢的酷睿U系列动力的惠普ZBook Firefly 14 G8上记录的时间短了几个小时。

从空电到满电大约需要2小时。

Battery Runtime
Idle (without WLAN, min brightness)
14h 43min
WiFi Websurfing
9h 33min
Load (maximum brightness)
1h 03min
Dell Precision 5000 5470
i9-12900H, RTX A1000 Laptop GPU, 72 Wh
Lenovo ThinkPad P15v G2 21A9000XGE
i7-11800H, T1200 Laptop GPU, 68 Wh
Dell Precision 5000 5560
i7-11850H, RTX A2000 Laptop GPU, 86 Wh
Lenovo ThinkPad P14s G2 AMD
R7 PRO 5850U, Vega 8, 50 Wh
HP ZBook Firefly 14 G8 2C9Q2EA
i7-1165G7, T500 Laptop GPU, 53 Wh
HP ZBook Firefly 14 G7
i7-10610U, Quadro P520, 53 Wh
Battery Runtime
-6%
8%
10%
171%
23%
Reader / Idle
883
1029
17%
722
-18%
WiFi v1.3
573
452
-21%
380
-34%
498
-13%
770
34%
608
6%
Load
63
54
-14%
110
75%
83
32%
257
308%
88
40%
H.264
482
637
752

Pros

+ 就尺寸而言,CPU性能非常高
+ 独立的Nvidia Quadro选项
+ 高达64GB的内存(焊接)。
+ 紧凑的外形尺寸
+ 全sRGB覆盖

Cons

- 没有AdobeRGB或P3颜色、USB-A、HDMI、Xeon或ECC内存选项
- 颗粒状的720p网络摄像头,没有隐私快门
- 在压力下,CPU的性能循环往复
- 基本保修期只有12个月
- 负载时非常响亮

Verdict — Uber Powerful Without The Uber Size

在审查中。戴尔Precision 5470。测试装置由戴尔提供

Precision 5470可以说是一个轻薄的工作站,拥有厚重的游戏笔记本的处理器。你不会再找到另一台如此紧凑的14英寸工作站,拥有与这台戴尔相同的酷睿i9-12900H CPU,甚至是独立的Nvidia RTX GPU。如果你想在保持重量和尺寸尽可能低的同时最大限度地提高性能,那么Precision 5470可能值得考虑。

Precision

5470比它的小尺寸所显示的更快、更强大。如果你想在14英寸的小尺寸上保持尽可能高的性能,这就是要买的工作站型号。

不幸的是,在性能方面,该系统有点过于雄心勃勃。它的酷睿i9-12900H与其他采用相同CPU的笔记本电脑相比,表现不佳。它的速度相对于其他14英寸工作站但它绝对可以更快。鉴于我们审查期间不理想的时钟频率波动,我们对酷睿i9-12900HK SKU比我们的酷睿i9-12900H的实际表现能好多少表示担忧。同时,尽管RTX A1000的名字里有RTX,但它的光线追踪潜力很差,就像我们对A1000所基于的GeForce RTX 3050的观察。

苛刻的第12代H系列CPU直接导致了Precision 5470相对响亮的风扇噪音和高耗电量。它的外观和感觉可能是一台14英寸的笔记本电脑,但它的声音有时绝对会像一台游戏笔记本电脑。这个缺点在小型高性能笔记本电脑上很常见。

价格和可用性

Precision 5470现在已经通过在线经销商广泛发售,如Newegg 亚马逊 尽管只有有限的FHD配置,价格从2000美元到2300美元不等。而用户可以直接从戴尔购买https://www.dell.com/en-us/shop/workstations-isv-certified/precision-5470-workstation/spd/precision-14-5470-laptop/他们将有更多可配置的选项可供选择。

Dell Precision 5000 5470 - 09/16/2022 v7
Allen Ngo

Chassis
88 / 98 → 90%
Keyboard
86%
Pointing Device
83%
Connectivity
71 / 80 → 89%
Weight
68 / 10-66 → 100%
Battery
88 / 95 → 93%
Display
87%
Games Performance
90%
Application Performance
95%
Temperature
91 / 95 → 96%
Noise
81 / 90 → 90%
Audio
85%
Camera
30 / 85 → 35%
Average
81%
88%
Workstation - Weighted Average

Pricecompare

Please share our article, every link counts!
> Notebookcheck中文版(NBC中国) > 评测 > 戴尔Precision 5470工作站回顾。Nvidia RTX A1000首次亮相
Allen Ngo, 2022-09-17 (Update: 2022-09-17)