惠普ZBook 15u G6笔记本电脑评测:高对比度4K屏降低了续航水平
#compare_competitor
Rating | Date | Model | Weight | Height | Size | Resolution | Price |
|---|---|---|---|---|---|---|---|
| 80.8 % v7 (old) | 12 / 2019 | HP ZBook 15u G6 6TP54EA i7-8565U, Radeon Pro WX 3200 | 1.6 kg | 19 mm | 15.60" | 3840x2160 | |
| 87.8 % v7 (old) | 10 / 2019 | Lenovo ThinkPad P1 2019-20QT000RGE i7-9850H, Quadro T1000 (Laptop) | 1.7 kg | 18.4 mm | 15.60" | 1920x1080 | |
| 85.6 % v6 (old) | Fujitsu Celsius H780 i7-8850H, Quadro P2000 | 2.8 kg | 31.9 mm | 15.60" | 1920x1080 | ||
| 89.2 % v6 (old) | Dell Latitude 5420 Rugged-P85G i7-8650U, Radeon RX 540 | 2.8 kg | 32.9 mm | 14.00" | 1920x1080 | ||
| 80.2 % v6 (old) | 07 / 2018 | HP ZBook 15u G5 2ZC05EA i5-8550U, Radeon Pro WX 3100 | 1.9 kg | 19 mm | 15.60" | 1920x1080 |

| Networking | |
| iperf3 transmit AX12 | |
| Lenovo ThinkPad P1 2019-20QT000RGE | |
| HP ZBook 15u G6 6TP54EA | |
| Fujitsu Celsius H780 | |
| Dell Latitude 5420 Rugged-P85G | |
| HP ZBook 15u G5 2ZC05EA | |
| iperf3 receive AX12 | |
| Dell Latitude 5420 Rugged-P85G | |
| HP ZBook 15u G6 6TP54EA | |
| HP ZBook 15u G5 2ZC05EA | |
| Fujitsu Celsius H780 | |
| Lenovo ThinkPad P1 2019-20QT000RGE | |
| |||||||||||||||||||||||||
Brightness Distribution: 89 %
Center on Battery: 450 cd/m²
Contrast: 1804:1 (Black: 0.25 cd/m²)
ΔE ColorChecker Calman: 4.4 | ∀{0.5-29.43 Ø4.73}
calibrated: 1.8
ΔE Greyscale Calman: 5 | ∀{0.09-98 Ø4.97}
97% sRGB (Argyll 1.6.3 3D)
63% AdobeRGB 1998 (Argyll 1.6.3 3D)
69.7% AdobeRGB 1998 (Argyll 3D)
97.1% sRGB (Argyll 3D)
69.2% Display P3 (Argyll 3D)
Gamma: 2.31
CCT: 7717 K
| HP ZBook 15u G6 6TP54EA AU Optronics AUO30EB, , 3840x2160, 15.6" | HP ZBook 15u G5 2ZC05EA CMN15E7, , 1920x1080, 15.6" | Lenovo ThinkPad P1 2019-20QT000RGE N156HCE-GN1, , 1920x1080, 15.6" | Fujitsu Celsius H780 LP156WF6-SPP1, , 1920x1080, 15.6" | Dell Latitude 5420 Rugged-P85G AU Optronics AUO523D, , 1920x1080, 14" | |
|---|---|---|---|---|---|
| Display | -36% | -8% | -9% | -8% | |
| Display P3 Coverage (%) | 69.2 | 43.05 -38% | 62.4 -10% | 66.3 -4% | 62.5 -10% |
| sRGB Coverage (%) | 97.1 | 64.7 -33% | 91.5 -6% | 85.9 -12% | 92.4 -5% |
| AdobeRGB 1998 Coverage (%) | 69.7 | 44.5 -36% | 63.4 -9% | 62.8 -10% | 64.2 -8% |
| Response Times | 22% | 52% | 27% | -7% | |
| Response Time Grey 50% / Grey 80% * (ms) | 68.8 ? | 41.6 ? 40% | 34.4 ? 50% | 38 ? 45% | 68 ? 1% |
| Response Time Black / White * (ms) | 29.6 | 28.8 ? 3% | 14 ? 53% | 26.8 ? 9% | 33.6 ? -14% |
| PWM Frequency (Hz) | 25770 ? | 26040 ? | 20830 ? | 735 ? | |
| Screen | -40% | -3% | -20% | -6% | |
| Brightness middle (cd/m²) | 451 | 229 -49% | 542 20% | 271 -40% | 1111.7 146% |
| Brightness (cd/m²) | 434 | 212 -51% | 528 22% | 260 -40% | 1026 136% |
| Brightness Distribution (%) | 89 | 88 -1% | 84 -6% | 86 -3% | 80 -10% |
| Black Level * (cd/m²) | 0.25 | 0.23 8% | 0.41 -64% | 0.29 -16% | 0.81 -224% |
| Contrast (:1) | 1804 | 996 -45% | 1322 -27% | 934 -48% | 1372 -24% |
| Colorchecker dE 2000 * | 4.4 | 4.2 5% | 3.5 20% | 3.9 11% | 3.83 13% |
| Colorchecker dE 2000 max. * | 6.7 | 18 -169% | 7.8 -16% | 10.2 -52% | 7.85 -17% |
| Colorchecker dE 2000 calibrated * | 1.8 | 4.2 -133% | 1.3 28% | 2.9 -61% | 2.98 -66% |
| Greyscale dE 2000 * | 5 | 2 60% | 4.8 4% | 2.6 48% | 5.6 -12% |
| Gamma | 2.31 95% | 2.23 99% | 2.33 94% | 2.29 96% | 2.306 95% |
| CCT | 7717 84% | 6292 103% | 7690 85% | 6517 100% | 7676 85% |
| Color Space (Percent of AdobeRGB 1998) (%) | 63 | 41 -35% | 58.8 -7% | 56.1 -11% | 59 -6% |
| Color Space (Percent of sRGB) (%) | 97 | 64.5 -34% | 91.1 -6% | 85.8 -12% | 93 -4% |
| Total Average (Program / Settings) | -18% /
-32% | 14% /
3% | -1% /
-12% | -7% /
-7% |
* ... smaller is better
Display Response Times
| ↔ Response Time Black to White | ||
|---|---|---|
| 29.6 ms ... rise ↗ and fall ↘ combined | ↗ ms rise | 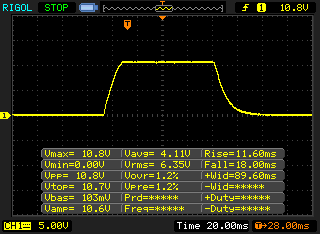 |
| ↘ ms fall | ||
| The screen shows relatively slow response rates in our tests and may be too slow for gamers. In comparison, all tested devices range from 0.1 (minimum) to 240 (maximum) ms. » 79 % of all devices are better. This means that the measured response time is worse than the average of all tested devices (19.9 ms). | ||
| ↔ Response Time 50% Grey to 80% Grey | ||
| 68.8 ms ... rise ↗ and fall ↘ combined | ↗ 33.2 ms rise | 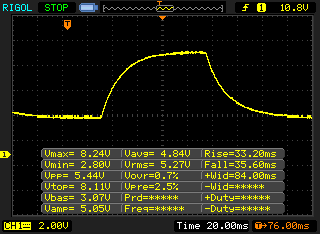 |
| ↘ 35.6 ms fall | ||
| The screen shows slow response rates in our tests and will be unsatisfactory for gamers. In comparison, all tested devices range from 0.165 (minimum) to 636 (maximum) ms. » 98 % of all devices are better. This means that the measured response time is worse than the average of all tested devices (31.1 ms). | ||
Screen Flickering / PWM (Pulse-Width Modulation)
| Screen flickering / PWM not detected |  | ||
In comparison: 52 % of all tested devices do not use PWM to dim the display. If PWM was detected, an average of 7798 (minimum: 5 - maximum: 343500) Hz was measured. | |||
| Cinebench R15 | |
| CPU Single 64Bit | |
| Average of class Workstation (191.4 - 328, n=25, last 2 years) | |
| Lenovo ThinkPad P1 2019-20QT000RGE | |
| Fujitsu Celsius H780 | |
| Average Intel Core i7-8565U (138.3 - 193, n=51) | |
| HP ZBook 15u G5 2ZC05EA | |
| HP ZBook 15u G6 6TP54EA | |
| Dell Latitude 5420 Rugged-P85G | |
| CPU Multi 64Bit | |
| Average of class Workstation (2489 - 5810, n=25, last 2 years) | |
| Fujitsu Celsius H780 | |
| Lenovo ThinkPad P1 2019-20QT000RGE | |
| Average Intel Core i7-8565U (452 - 815, n=52) | |
| HP ZBook 15u G5 2ZC05EA | |
| HP ZBook 15u G6 6TP54EA | |
| Dell Latitude 5420 Rugged-P85G | |
| PCMark 8 | |
| Home Score Accelerated v2 | |
| Fujitsu Celsius H780 | |
| Dell Latitude 5420 Rugged-P85G | |
| Lenovo ThinkPad P1 2019-20QT000RGE | |
| HP ZBook 15u G5 2ZC05EA | |
| Average Intel Core i7-8565U, AMD Radeon Pro WX 3200 (3257 - 3954, n=2) | |
| HP ZBook 15u G6 6TP54EA | |
| Work Score Accelerated v2 | |
| Lenovo ThinkPad P1 2019-20QT000RGE | |
| Fujitsu Celsius H780 | |
| Dell Latitude 5420 Rugged-P85G | |
| HP ZBook 15u G5 2ZC05EA | |
| Average Intel Core i7-8565U, AMD Radeon Pro WX 3200 (4022 - 4885, n=2) | |
| HP ZBook 15u G6 6TP54EA | |
| PCMark 8 Home Score Accelerated v2 | 3257 points | |
| PCMark 8 Work Score Accelerated v2 | 4022 points | |
| PCMark 10 Score | 2817 points | |
Help | ||
| HP ZBook 15u G6 6TP54EA Samsung SSD PM981 MZVLB512HAJQ | HP ZBook 15u G5 2ZC05EA Toshiba XG5 KXG50ZNV256G | Lenovo ThinkPad P1 2019-20QT000RGE WDC PC SN720 SDAQNTW-512G | Fujitsu Celsius H780 Samsung SSD PM981 MZVLB512HAJQ | Dell Latitude 5420 Rugged-P85G SK hynix PC401 NVMe 500 GB | Average Samsung SSD PM981 MZVLB512HAJQ | |
|---|---|---|---|---|---|---|
| CrystalDiskMark 5.2 / 6 | -25% | 25% | -7% | -26% | 7% | |
| Write 4K (MB/s) | 156 | 98.8 -37% | 162.2 4% | 98.3 -37% | 98.8 -37% | 126.7 ? -19% |
| Read 4K (MB/s) | 45.73 | 33.98 -26% | 43.71 -4% | 40.18 -12% | 38.51 -16% | 44 ? -4% |
| Write Seq (MB/s) | 1158 | 395.7 -66% | 2441 111% | 1777 53% | 843 -27% | 1617 ? 40% |
| Read Seq (MB/s) | 1132 | 2063 82% | 1753 55% | 1247 10% | 1282 13% | 1716 ? 52% |
| Write 4K Q32T1 (MB/s) | 369.2 | 352.3 -5% | 397.6 8% | 344.7 -7% | 355.5 -4% | 413 ? 12% |
| Read 4K Q32T1 (MB/s) | 573 | 281.8 -51% | 520 -9% | 383.1 -33% | 241.4 -58% | 420 ? -27% |
| Write Seq Q32T1 (MB/s) | 1969 | 355 -82% | 2519 28% | 2019 3% | 893 -55% | 2076 ? 5% |
| Read Seq Q32T1 (MB/s) | 3138 | 2775 -12% | 3448 10% | 2076 -34% | 2478 -21% | 3130 ? 0% |
| Write 4K Q8T8 (MB/s) | 361 | 1381 | 1751 | 1264 ? | ||
| Read 4K Q8T8 (MB/s) | 447.3 | 1371 | 1568 | 1193 ? | ||
| AS SSD | -65% | 4% | -10% | -38% | -26% | |
| Seq Read (MB/s) | 2083 | 1696 -19% | 2980 43% | 1049 -50% | 2054 -1% | 1976 ? -5% |
| Seq Write (MB/s) | 1715 | 441 -74% | 2094 22% | 1882 10% | 653 -62% | 1637 ? -5% |
| 4K Read (MB/s) | 55.3 | 31.28 -43% | 45.05 -19% | 48.35 -13% | 39.34 -29% | 50.5 ? -9% |
| 4K Write (MB/s) | 137.6 | 101.5 -26% | 155.4 13% | 102.5 -26% | 96.4 -30% | 112 ? -19% |
| 4K-64 Read (MB/s) | 1211 | 488.4 -60% | 1291 7% | 1395 15% | 677 -44% | 1203 ? -1% |
| 4K-64 Write (MB/s) | 1446 | 564 -61% | 1506 4% | 1789 24% | 982 -32% | 1504 ? 4% |
| Access Time Read * (ms) | 0.039 | 0.103 -164% | 0.064 -64% | 0.066 -69% | 0.044 -13% | 0.05092 ? -31% |
| Access Time Write * (ms) | 0.026 | 0.051 -96% | 0.024 8% | 0.037 -42% | 0.051 -96% | 0.08337 ? -221% |
| Score Read (Points) | 1474 | 689 -53% | 1634 11% | 1549 5% | 921 -38% | 1451 ? -2% |
| Score Write (Points) | 1755 | 710 -60% | 1871 7% | 2080 19% | 1143 -35% | 1780 ? 1% |
| Score Total (Points) | 3976 | 1697 -57% | 4300 8% | 4469 12% | 2475 -38% | 3966 ? 0% |
| Copy ISO MB/s (MB/s) | 1146 | 2015 | 1547 | 1622 | 1755 ? | |
| Copy Program MB/s (MB/s) | 324.8 | 597 | 405.9 | 378.1 | 454 ? | |
| Copy Game MB/s (MB/s) | 742 | 1449 | 1170 | 793 | 1057 ? | |
| Total Average (Program / Settings) | -45% /
-48% | 15% /
13% | -9% /
-9% | -32% /
-33% | -10% /
-12% |
* ... smaller is better

| 3DMark 11 - 1280x720 Performance GPU | |
| Average of class Workstation (10888 - 69594, n=25, last 2 years) | |
| Lenovo ThinkPad P1 2019-20QT000RGE | |
| Fujitsu Celsius H780 | |
| Dell Latitude 5420 Rugged-P85G | |
| Average AMD Radeon Pro WX 3200 (4256 - 4419, n=2) | |
| HP ZBook 15u G6 6TP54EA | |
| HP ZBook 15u G5 2ZC05EA | |
| 3DMark | |
| 1280x720 Cloud Gate Standard Graphics | |
| Average of class Workstation (46927 - 152418, n=15, last 2 years) | |
| Lenovo ThinkPad P1 2019-20QT000RGE | |
| Fujitsu Celsius H780 | |
| Dell Latitude 5420 Rugged-P85G | |
| HP ZBook 15u G6 6TP54EA | |
| Average AMD Radeon Pro WX 3200 (18780 - 18952, n=2) | |
| HP ZBook 15u G5 2ZC05EA | |
| 1920x1080 Fire Strike Graphics | |
| Average of class Workstation (7578 - 52560, n=25, last 2 years) | |
| Lenovo ThinkPad P1 2019-20QT000RGE | |
| Fujitsu Celsius H780 | |
| Dell Latitude 5420 Rugged-P85G | |
| Average AMD Radeon Pro WX 3200 (3088 - 3224, n=2) | |
| HP ZBook 15u G6 6TP54EA | |
| HP ZBook 15u G5 2ZC05EA | |
| 2560x1440 Time Spy Graphics | |
| Average of class Workstation (2725 - 24806, n=25, last 2 years) | |
| Lenovo ThinkPad P1 2019-20QT000RGE | |
| Average AMD Radeon Pro WX 3200 (938 - 973, n=2) | |
| HP ZBook 15u G6 6TP54EA | |
| Dell Latitude 5420 Rugged-P85G | |
| Unigine Valley 1.0 | |
| 1920x1080 Extreme HD DirectX AA:x8 | |
| Average of class Workstation (n=1last 2 years) | |
| Lenovo ThinkPad P1 2019-20QT000RGE | |
| Fujitsu Celsius H780 | |
| HP ZBook 15u G6 6TP54EA | |
| Average AMD Radeon Pro WX 3200 (n=1) | |
| HP ZBook 15u G5 2ZC05EA | |
| 1920x1080 Extreme HD Preset OpenGL AA:x8 | |
| Average of class Workstation (n=1last 2 years) | |
| Lenovo ThinkPad P1 2019-20QT000RGE | |
| Fujitsu Celsius H780 | |
| HP ZBook 15u G6 6TP54EA | |
| Average AMD Radeon Pro WX 3200 (n=1) | |
| HP ZBook 15u G5 2ZC05EA | |
| Unigine Heaven 4.0 | |
| Extreme Preset OpenGL | |
| Average of class Workstation (72.4 - 185.3, n=4, last 2 years) | |
| Lenovo ThinkPad P1 2019-20QT000RGE | |
| Fujitsu Celsius H780 | |
| HP ZBook 15u G6 6TP54EA | |
| Average AMD Radeon Pro WX 3200 (n=1) | |
| HP ZBook 15u G5 2ZC05EA | |
| Extreme Preset DX11 | |
| Average of class Workstation (77.7 - 222, n=4, last 2 years) | |
| Lenovo ThinkPad P1 2019-20QT000RGE | |
| Fujitsu Celsius H780 | |
| HP ZBook 15u G6 6TP54EA | |
| Average AMD Radeon Pro WX 3200 (n=1) | |
| HP ZBook 15u G5 2ZC05EA | |
| 3DMark 06 Standard Score | 16604 points | |
| 3DMark Vantage P Result | 12538 points | |
| 3DMark 11 Performance | 4592 points | |
| 3DMark Cloud Gate Standard Score | 11979 points | |
| 3DMark Fire Strike Score | 2822 points | |
| 3DMark Time Spy Score | 1039 points | |
Help | ||
| The Witcher 3 | |
| 1366x768 Medium Graphics & Postprocessing | |
| Average of class Workstation (81.6 - 175, n=2, last 2 years) | |
| Lenovo ThinkPad P1 2019-20QT000RGE | |
| Fujitsu Celsius H780 | |
| Dell Latitude 5420 Rugged-P85G | |
| Average AMD Radeon Pro WX 3200 (26.5 - 35.6, n=2) | |
| HP ZBook 15u G5 2ZC05EA | |
| HP ZBook 15u G6 6TP54EA | |
| 1920x1080 High Graphics & Postprocessing (Nvidia HairWorks Off) | |
| Average of class Workstation (53.4 - 156.4, n=3, last 2 years) | |
| Lenovo ThinkPad P1 2019-20QT000RGE | |
| Fujitsu Celsius H780 | |
| HP ZBook 15u G5 2ZC05EA | |
| Average AMD Radeon Pro WX 3200 (12.3 - 18, n=2) | |
| HP ZBook 15u G6 6TP54EA | |
| Dell Latitude 5420 Rugged-P85G | |
| 1920x1080 Ultra Graphics & Postprocessing (HBAO+) | |
| Average of class Workstation (26.3 - 91.7, n=3, last 2 years) | |
| Lenovo ThinkPad P1 2019-20QT000RGE | |
| Fujitsu Celsius H780 | |
| Average AMD Radeon Pro WX 3200 (9.4 - 11.2, n=2) | |
| HP ZBook 15u G6 6TP54EA | |
| HP ZBook 15u G5 2ZC05EA | |
| Dell Latitude 5420 Rugged-P85G | |
| BioShock Infinite | |
| 1280x720 Very Low Preset | |
| Lenovo ThinkPad P1 2019-20QT000RGE | |
| Average AMD Radeon Pro WX 3200 (n=1) | |
| HP ZBook 15u G5 2ZC05EA | |
| Dell Latitude 5420 Rugged-P85G | |
| 1366x768 Medium Preset | |
| Lenovo ThinkPad P1 2019-20QT000RGE | |
| Average AMD Radeon Pro WX 3200 (n=1) | |
| Dell Latitude 5420 Rugged-P85G | |
| HP ZBook 15u G5 2ZC05EA | |
| Thief | |
| 1024x768 Very Low Preset | |
| Dell Latitude 5420 Rugged-P85G | |
| 1366x768 Normal Preset AA:FX | |
| Dell Latitude 5420 Rugged-P85G | |
| HP ZBook 15u G6 6TP54EA | |
| Average AMD Radeon Pro WX 3200 (n=1) | |
| 1366x768 High Preset AA:FXAA & Low SS AF:4x | |
| Dell Latitude 5420 Rugged-P85G | |
| HP ZBook 15u G6 6TP54EA | |
| Average AMD Radeon Pro WX 3200 (n=1) | |
| Rise of the Tomb Raider | |
| 1024x768 Lowest Preset | |
| Lenovo ThinkPad P1 2019-20QT000RGE | |
| Dell Latitude 5420 Rugged-P85G | |
| HP ZBook 15u G6 6TP54EA | |
| Average AMD Radeon Pro WX 3200 (n=1) | |
| HP ZBook 15u G5 2ZC05EA | |
| 1366x768 Medium Preset AF:2x | |
| Lenovo ThinkPad P1 2019-20QT000RGE | |
| Dell Latitude 5420 Rugged-P85G | |
| HP ZBook 15u G6 6TP54EA | |
| Average AMD Radeon Pro WX 3200 (n=1) | |
| HP ZBook 15u G5 2ZC05EA | |
| 1920x1080 High Preset AA:FX AF:4x | |
| Lenovo ThinkPad P1 2019-20QT000RGE | |
| Dell Latitude 5420 Rugged-P85G | |
| HP ZBook 15u G6 6TP54EA | |
| Average AMD Radeon Pro WX 3200 (n=1) | |
| HP ZBook 15u G5 2ZC05EA | |
| Far Cry 5 | |
| 1280x720 Low Preset AA:T | |
| Average of class Workstation (75 - 168, n=9, last 2 years) | |
| HP ZBook 15u G6 6TP54EA | |
| Average AMD Radeon Pro WX 3200 (n=1) | |
| Dell Latitude 5420 Rugged-P85G | |
| 1920x1080 Medium Preset AA:T | |
| Average of class Workstation (42 - 148, n=11, last 2 years) | |
| Dell Latitude 5420 Rugged-P85G | |
| HP ZBook 15u G6 6TP54EA | |
| Average AMD Radeon Pro WX 3200 (n=1) | |
| 1920x1080 High Preset AA:T | |
| Average of class Workstation (39 - 138, n=11, last 2 years) | |
| Dell Latitude 5420 Rugged-P85G | |
| HP ZBook 15u G6 6TP54EA | |
| Average AMD Radeon Pro WX 3200 (n=1) | |
| 1920x1080 Ultra Preset AA:T | |
| Average of class Workstation (37 - 128, n=11, last 2 years) | |
| Dell Latitude 5420 Rugged-P85G | |
| HP ZBook 15u G6 6TP54EA | |
| Average AMD Radeon Pro WX 3200 (n=1) | |
| low | med. | high | ultra | 4K | |
|---|---|---|---|---|---|
| BioShock Infinite (2013) | 81.6 | 29.16 | |||
| Thief (2014) | 36.4 | 34.9 | 19.9 | ||
| The Witcher 3 (2015) | 26.5 | 12.3 | 9.4 | 5.2 | |
| Dota 2 Reborn (2015) | 98 | 87 | 48 | 45 | 9.4 |
| Rise of the Tomb Raider (2016) | 50.6 | 36.22 | 18.54 | ||
| X-Plane 11.11 (2018) | 25.4 | 16.7 | 15.2 | ||
| Far Cry 5 (2018) | 43 | 20 | 18 | 17 |
Noise level
| Idle |
| 29.7 / 29.7 / 30.3 dB(A) |
| Load |
| 32.6 / 36.1 dB(A) |
 | ||
30 dB silent 40 dB(A) audible 50 dB(A) loud |
||
min: | ||
(±) The maximum temperature on the upper side is 40.5 °C / 105 F, compared to the average of 38.2 °C / 101 F, ranging from 22.2 to 69.8 °C for the class Workstation.
(±) The bottom heats up to a maximum of 44.9 °C / 113 F, compared to the average of 41.1 °C / 106 F
(+) In idle usage, the average temperature for the upper side is 24 °C / 75 F, compared to the device average of 32 °C / 90 F.
(±) Playing The Witcher 3, the average temperature for the upper side is 35.5 °C / 96 F, compared to the device average of 32 °C / 90 F.
(+) The palmrests and touchpad are cooler than skin temperature with a maximum of 31.6 °C / 88.9 F and are therefore cool to the touch.
(-) The average temperature of the palmrest area of similar devices was 27.8 °C / 82 F (-3.8 °C / -6.9 F).
HP ZBook 15u G6 6TP54EA audio analysis
(±) | speaker loudness is average but good (76.9 dB)
Bass 100 - 315 Hz
(-) | nearly no bass - on average 17.7% lower than median
(±) | linearity of bass is average (12.6% delta to prev. frequency)
Mids 400 - 2000 Hz
(+) | balanced mids - only 3.2% away from median
(+) | mids are linear (5.9% delta to prev. frequency)
Highs 2 - 16 kHz
(+) | balanced highs - only 2.6% away from median
(+) | highs are linear (6.3% delta to prev. frequency)
Overall 100 - 16.000 Hz
(±) | linearity of overall sound is average (18.7% difference to median)
Compared to same class
» 63% of all tested devices in this class were better, 8% similar, 29% worse
» The best had a delta of 7%, average was 17%, worst was 35%
Compared to all devices tested
» 43% of all tested devices were better, 8% similar, 50% worse
» The best had a delta of 4%, average was 24%, worst was 134%
Apple MacBook 12 (Early 2016) 1.1 GHz audio analysis
(+) | speakers can play relatively loud (83.6 dB)
Bass 100 - 315 Hz
(±) | reduced bass - on average 11.3% lower than median
(±) | linearity of bass is average (14.2% delta to prev. frequency)
Mids 400 - 2000 Hz
(+) | balanced mids - only 2.4% away from median
(+) | mids are linear (5.5% delta to prev. frequency)
Highs 2 - 16 kHz
(+) | balanced highs - only 2% away from median
(+) | highs are linear (4.5% delta to prev. frequency)
Overall 100 - 16.000 Hz
(+) | overall sound is linear (10.2% difference to median)
Compared to same class
» 7% of all tested devices in this class were better, 2% similar, 91% worse
» The best had a delta of 5%, average was 18%, worst was 53%
Compared to all devices tested
» 5% of all tested devices were better, 1% similar, 94% worse
» The best had a delta of 4%, average was 24%, worst was 134%
| Off / Standby | |
| Idle | |
| Load |
|
Key:
min: | |
| HP ZBook 15u G6 6TP54EA i7-8565U, Radeon Pro WX 3200, Samsung SSD PM981 MZVLB512HAJQ, IPS, 3840x2160, 15.6" | HP ZBook 15u G5 2ZC05EA i5-8550U, Radeon Pro WX 3100, Toshiba XG5 KXG50ZNV256G, IPS LED, 1920x1080, 15.6" | Dell Latitude 5420 Rugged-P85G i7-8650U, Radeon RX 540, SK hynix PC401 NVMe 500 GB, IPS, 1920x1080, 14" | Acer Swift 3 SF314-55G-768V i7-8565U, GeForce MX250, WDC PC SN520 SDAPNUW-512G, IPS, 1920x1080, 14" | Lenovo ThinkPad P1 2019-20QT000RGE i7-9850H, Quadro T1000 (Laptop), WDC PC SN720 SDAQNTW-512G, IPS LED, 1920x1080, 15.6" | Fujitsu Celsius H780 i7-8850H, Quadro P2000, Samsung SSD PM981 MZVLB512HAJQ, IPS LED, 1920x1080, 15.6" | Average AMD Radeon Pro WX 3200 | Average of class Workstation | |
|---|---|---|---|---|---|---|---|---|
| Power Consumption | 17% | -21% | 9% | -82% | -59% | 5% | -72% | |
| Idle Minimum * (Watt) | 5.5 | 3.2 42% | 4.8 13% | 7.4 -35% | 13.7 -149% | 9.1 -65% | 4.85 ? 12% | 8.94 ? -63% |
| Idle Average * (Watt) | 9.8 | 6.1 38% | 13.6 -39% | 9.9 -1% | 17.5 -79% | 13.2 -35% | 8.87 ? 9% | 13.8 ? -41% |
| Idle Maximum * (Watt) | 12 | 9.7 19% | 13.8 -15% | 11.7 2% | 20.9 -74% | 14.04 -17% | 11.5 ? 4% | 17.5 ? -46% |
| Load Average * (Watt) | 59 | 62 -5% | 67.8 -15% | 29 51% | 77.2 -31% | 78.8 -34% | 59.1 ? -0% | 95 ? -61% |
| Witcher 3 ultra * (Watt) | 51 | 48 6% | 69.1 -35% | |||||
| Load Maximum * (Watt) | 70 | 71 -1% | 93.5 -34% | 52 26% | 123.7 -77% | 172.5 -146% | 70.3 ? -0% | 175.2 ? -150% |
* ... smaller is better
| HP ZBook 15u G6 6TP54EA i7-8565U, Radeon Pro WX 3200, 56 Wh | HP ZBook 15u G5 2ZC05EA i5-8550U, Radeon Pro WX 3100, 56 Wh | Dell Latitude 5420 Rugged-P85G i7-8650U, Radeon RX 540, 102 Wh | Acer Swift 3 SF314-55G-768V i7-8565U, GeForce MX250, 50.7 Wh | Lenovo ThinkPad P1 2019-20QT000RGE i7-9850H, Quadro T1000 (Laptop), 80 Wh | Fujitsu Celsius H780 i7-8850H, Quadro P2000, 96 Wh | Average of class Workstation | |
|---|---|---|---|---|---|---|---|
| Battery runtime | 48% | 109% | 7% | -7% | 9% | 32% | |
| Reader / Idle (h) | 12.4 | 21.7 75% | 31.4 153% | 16.1 30% | 26.1 ? 110% | ||
| WiFi v1.3 (h) | 6.9 | 8.6 25% | 16.2 135% | 8.1 17% | 8.9 29% | 7.5 9% | 8.53 ? 24% |
| Load (h) | 2.3 | 3.3 43% | 3.2 39% | 1.7 -26% | 1.3 -43% | 1.429 ? -38% |
Pros
Cons
Verdict - only in some circumstances may this hardware upgrade warrant a switch
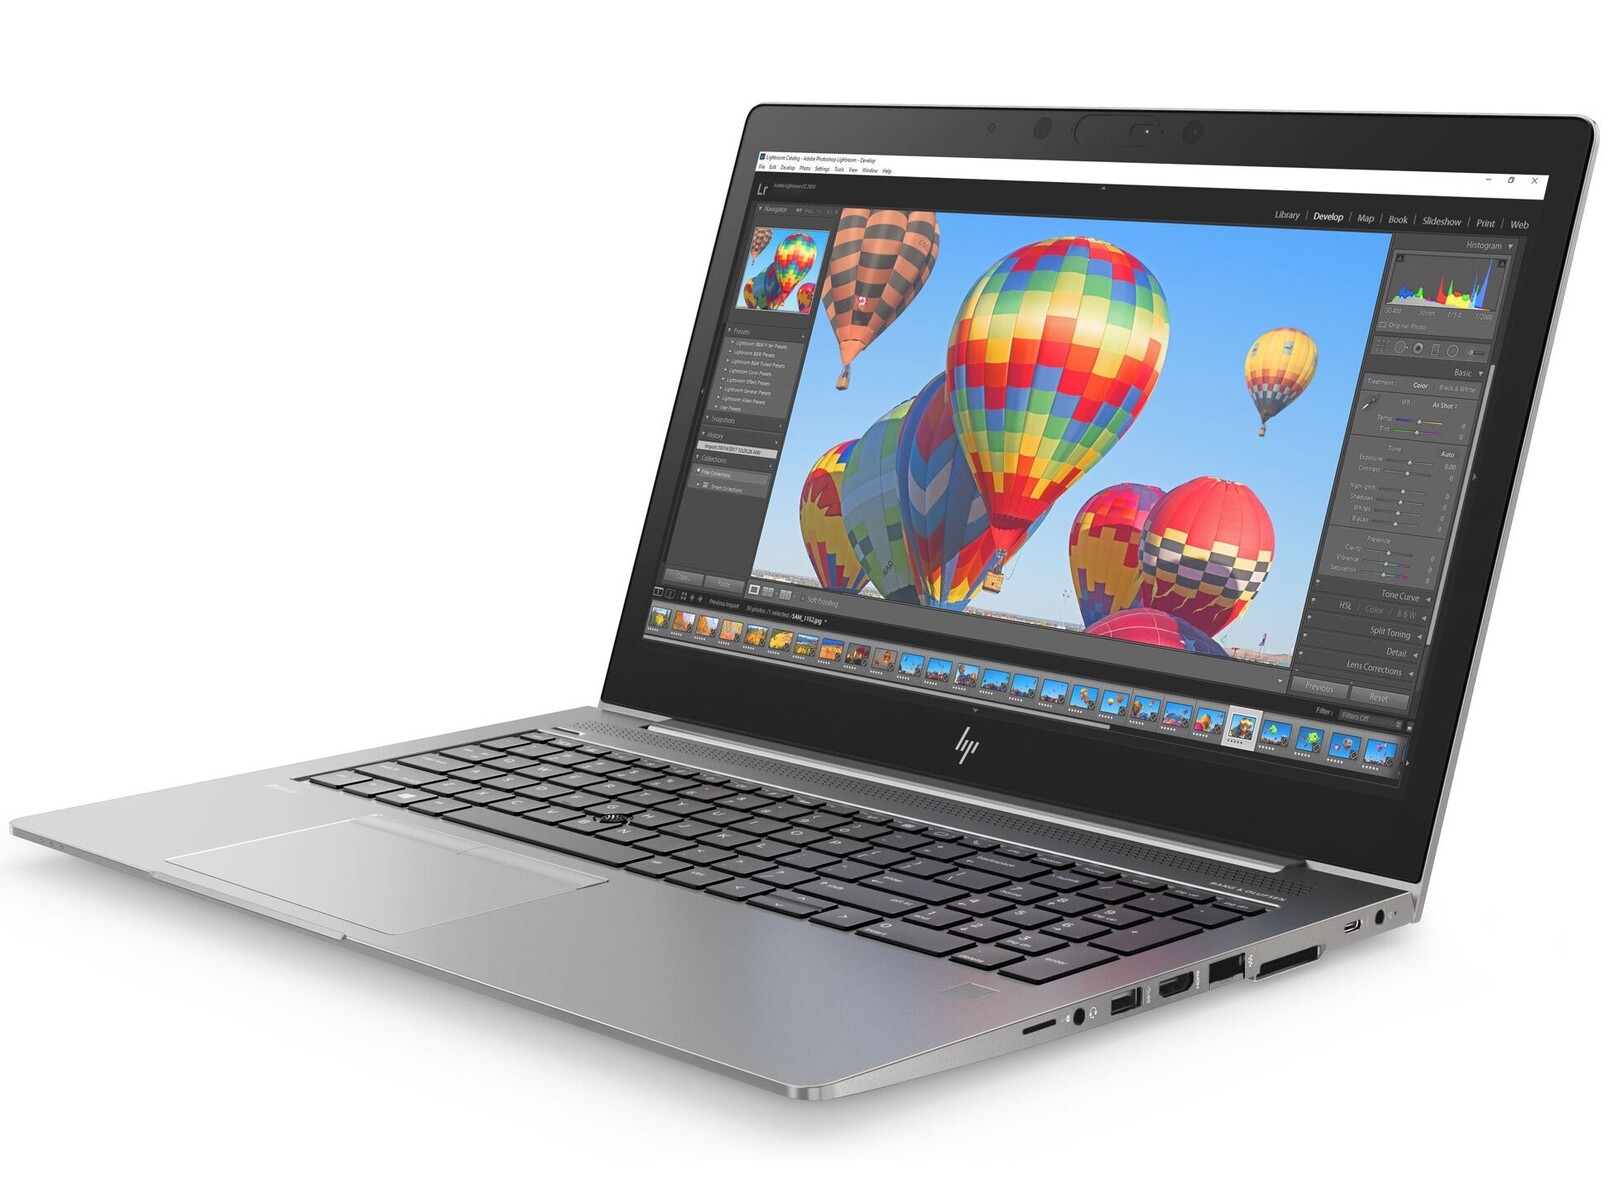
与以前的产品相比,HP ZBook 15u G6的性能仅略有提高。与ZBook 15u G55相比,CPU性能的提升令我们特别失望。但另一方面,AMD Radeon Pro WX 3200 GPU具有更好的性能,并且随附的存储设备在基准测试中也表现出色。 4K显示屏给我们留下了特别深刻的印象,该显示屏提供高亮度,鲜艳的色彩和非常好的对比度。磨砂表面使用户可以在户外使用该设备,而不必担心反光。
惠普未对ZBook 15u G6进行太多更改。虽然我们对硬件升级感到有些失望,但是4K屏幕很棒。
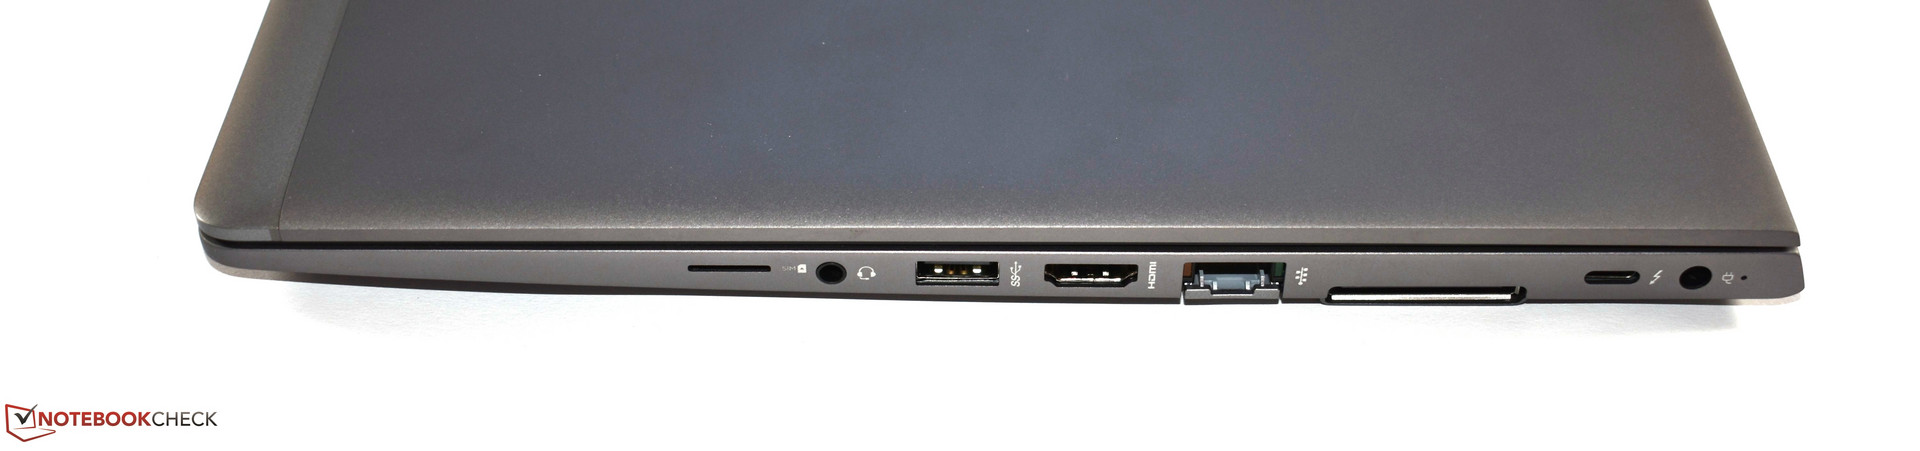
由于更新仅限于ZBook 15u G6的内部,因此买家将获得一如既往的高质量机身和非常好的输入设备。借助雷电3端口,可以轻松扩展端口的选择,并且此工作站的Wi-Fi速度很快。这样使得缺少维护选项的情况更容易接受了。ZBook 15u G5的用户如果选择换新,那么提升仅限于图像处理方面。
HP ZBook 15u G6 6TP54EA
- 10/08/2019 v7 (old)
Mike Wobker
Price comparison

