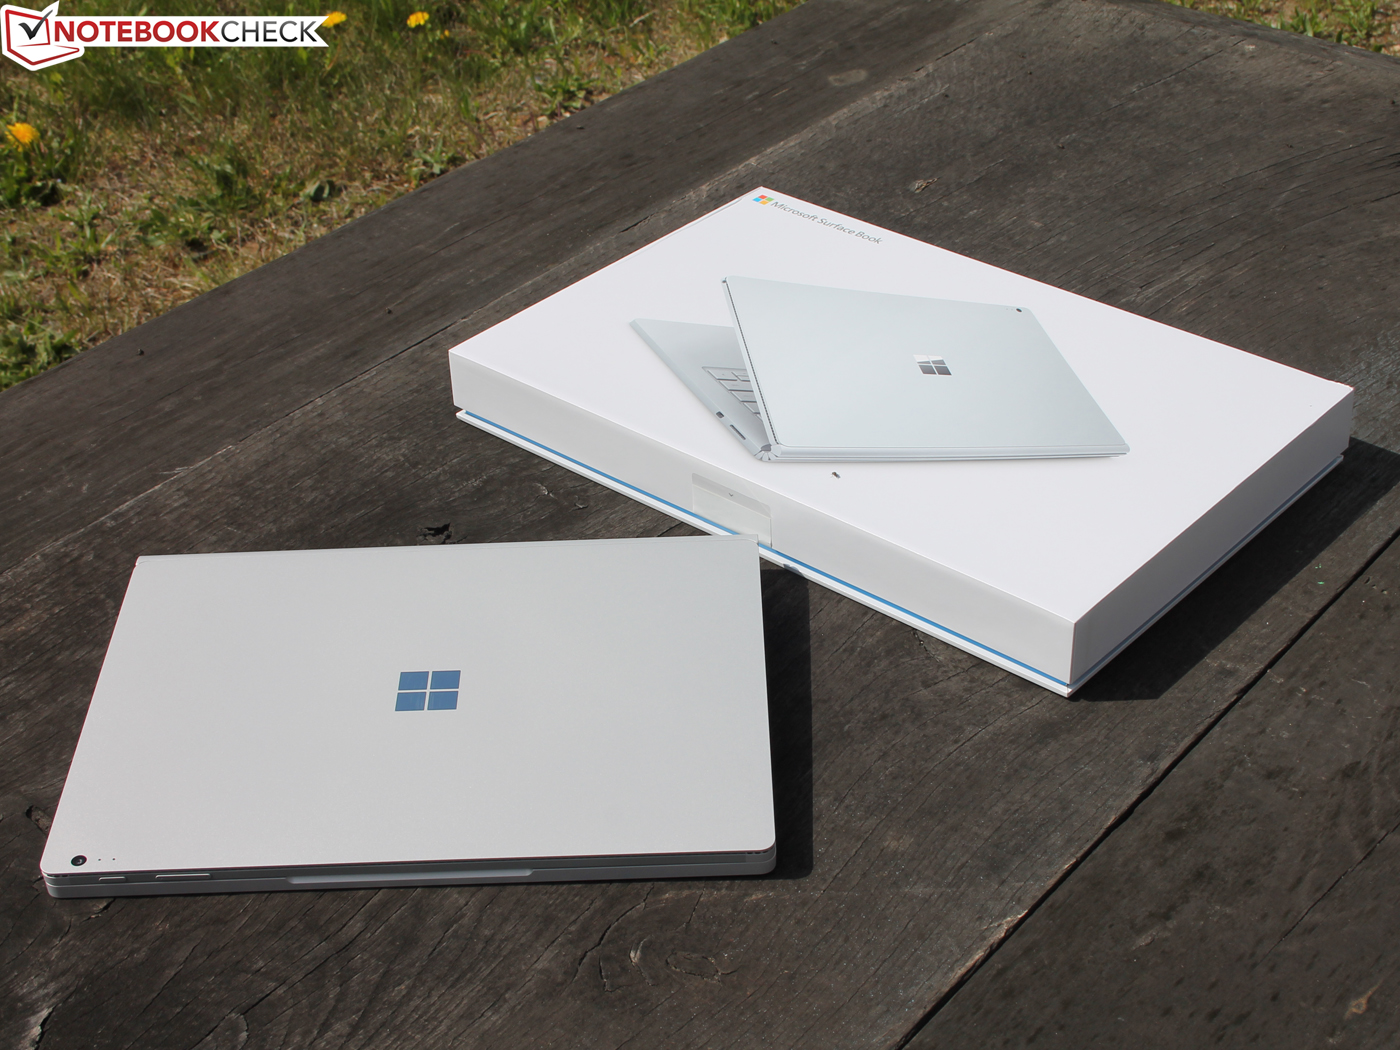
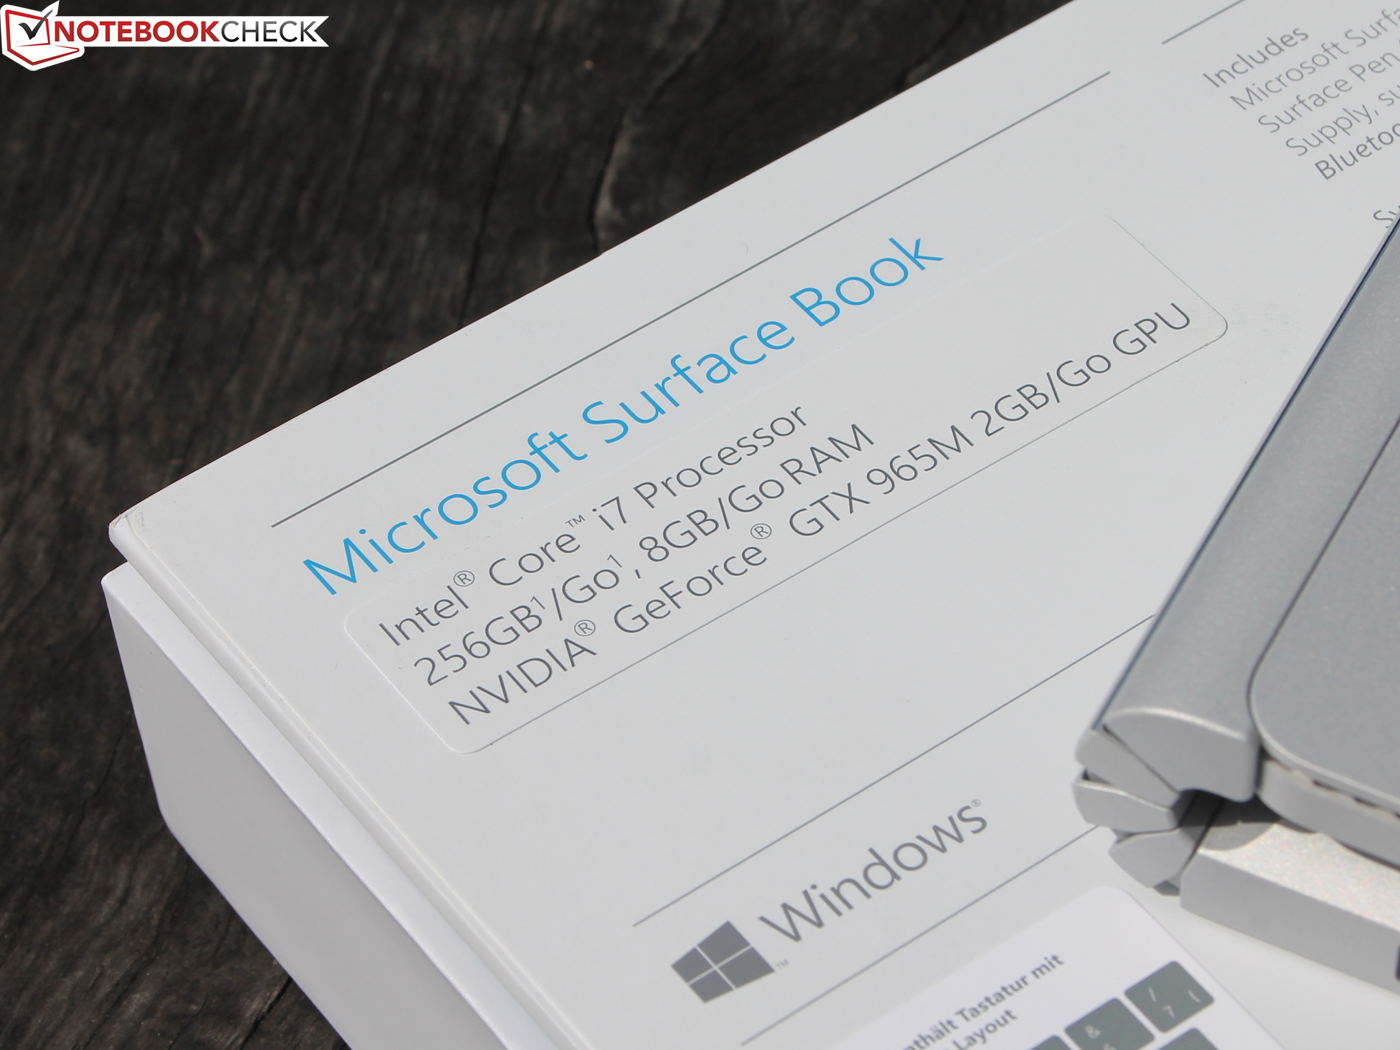
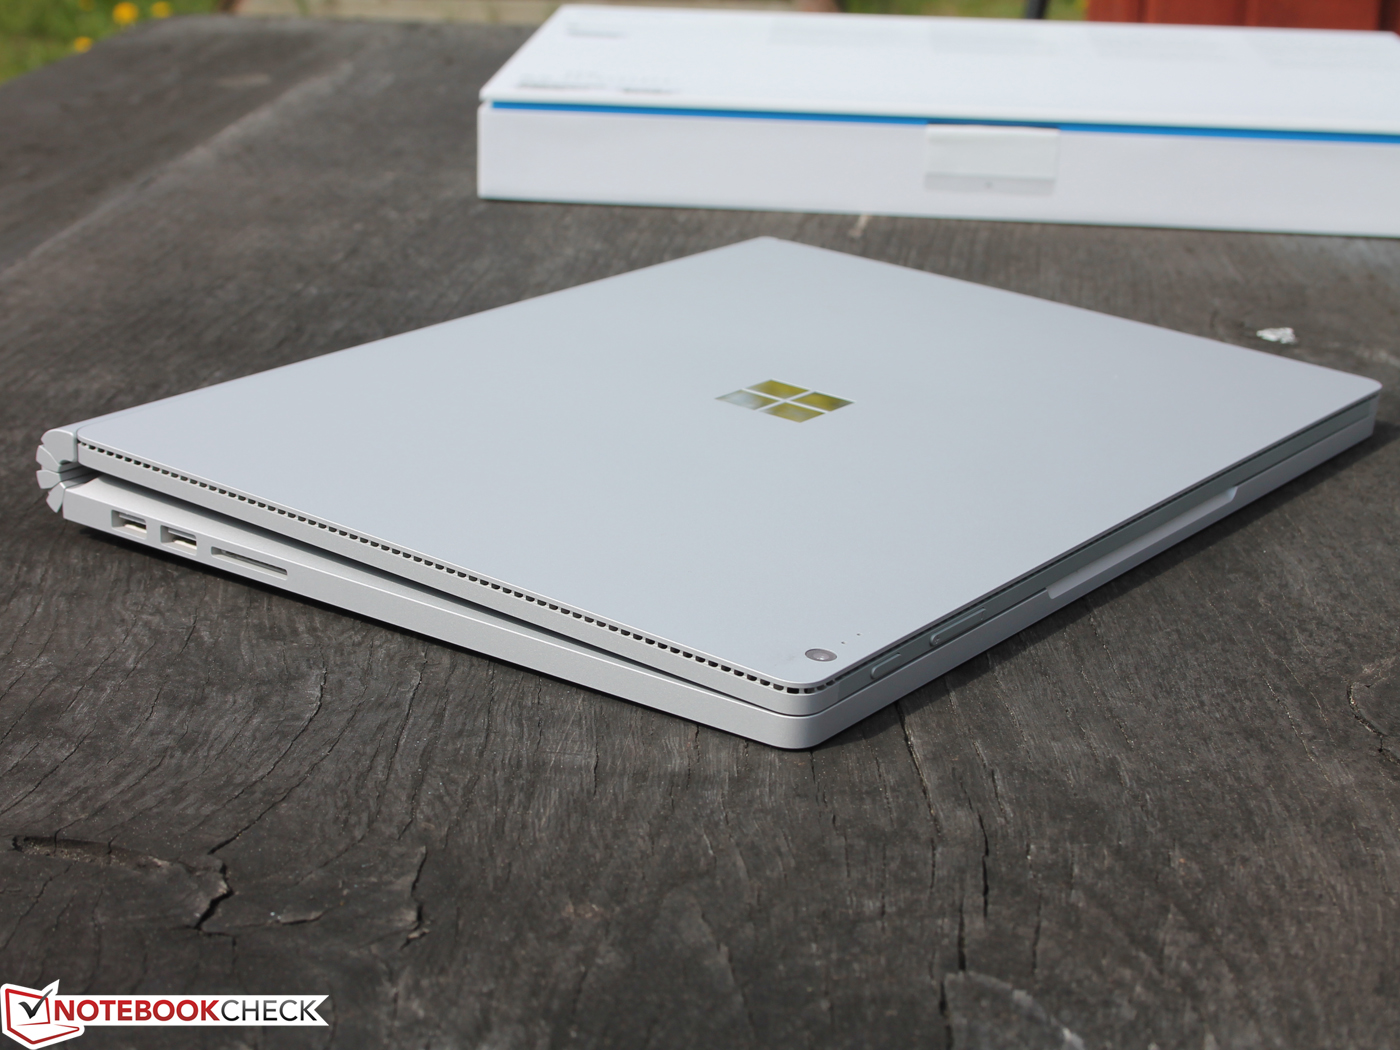
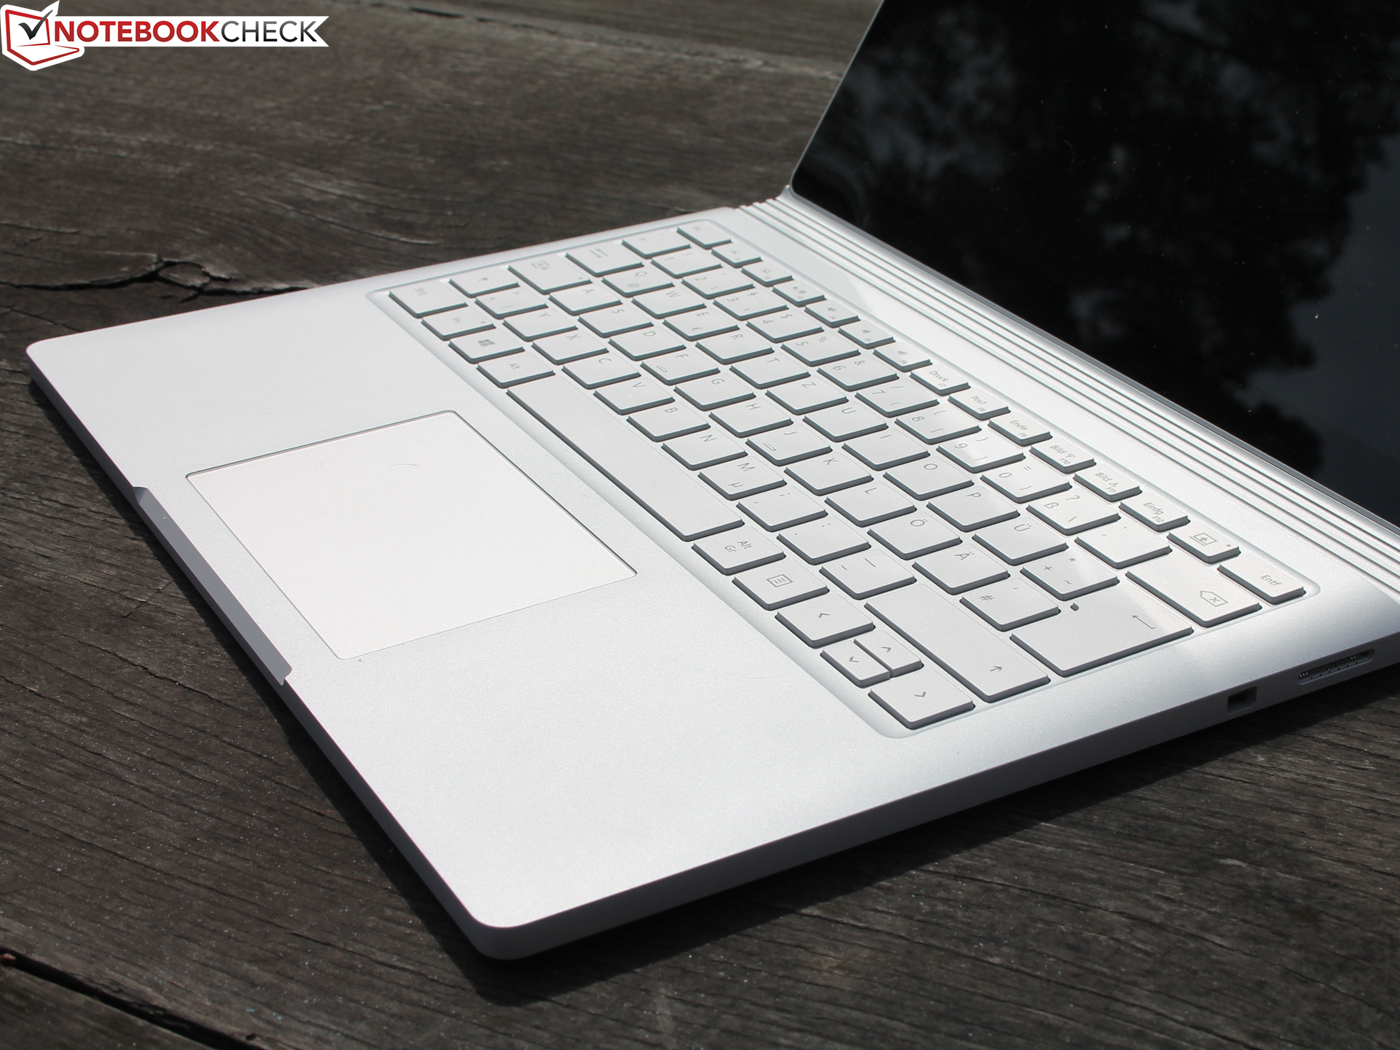
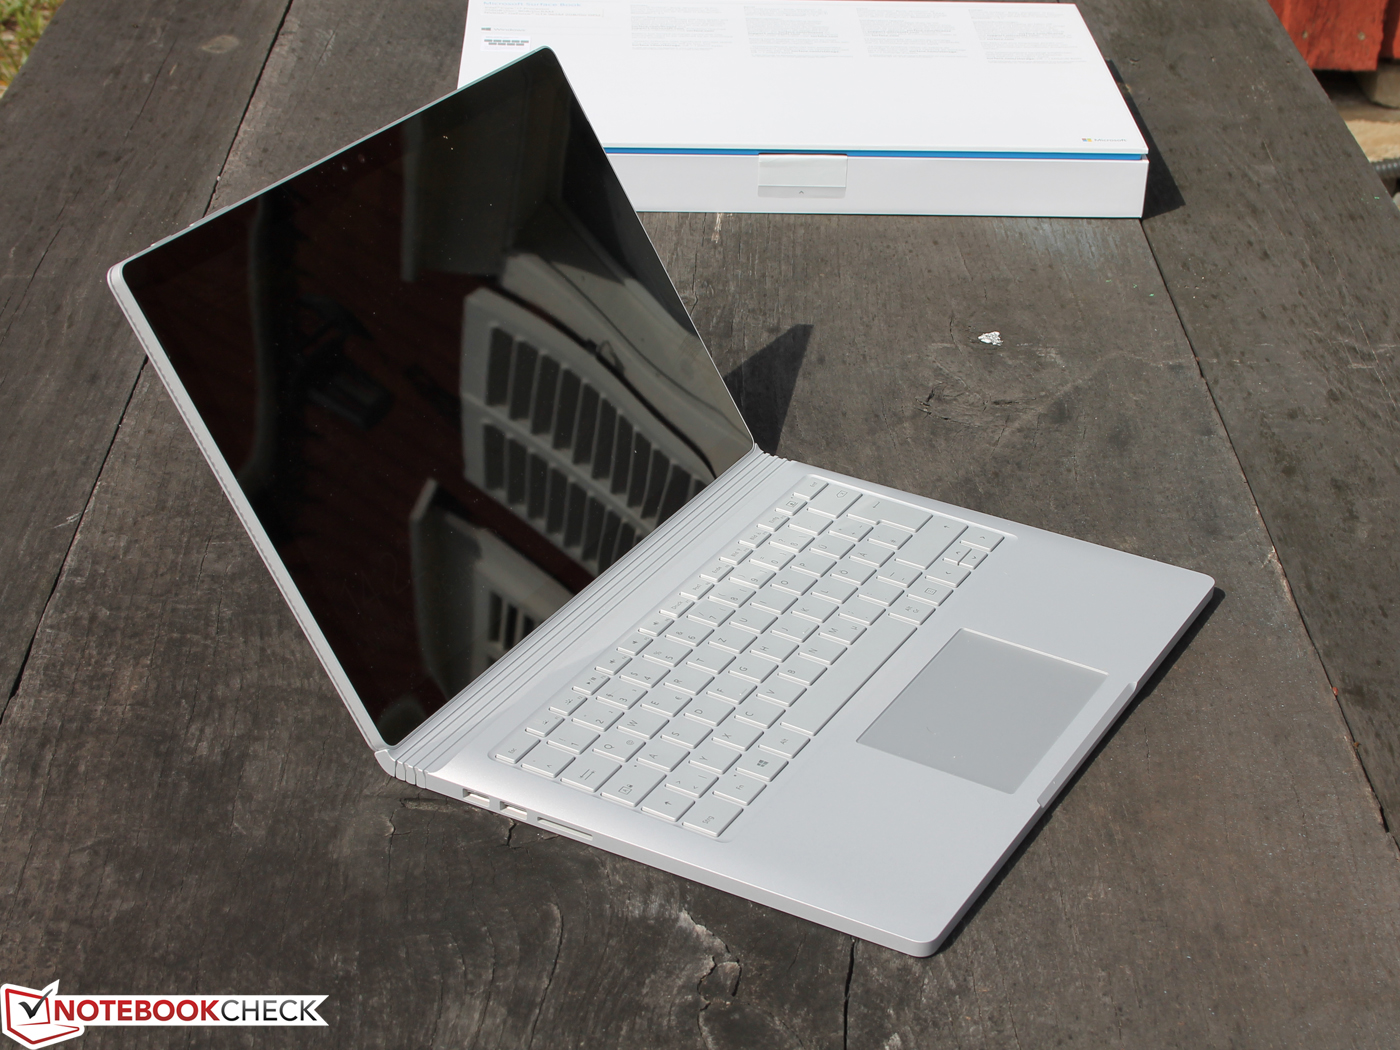
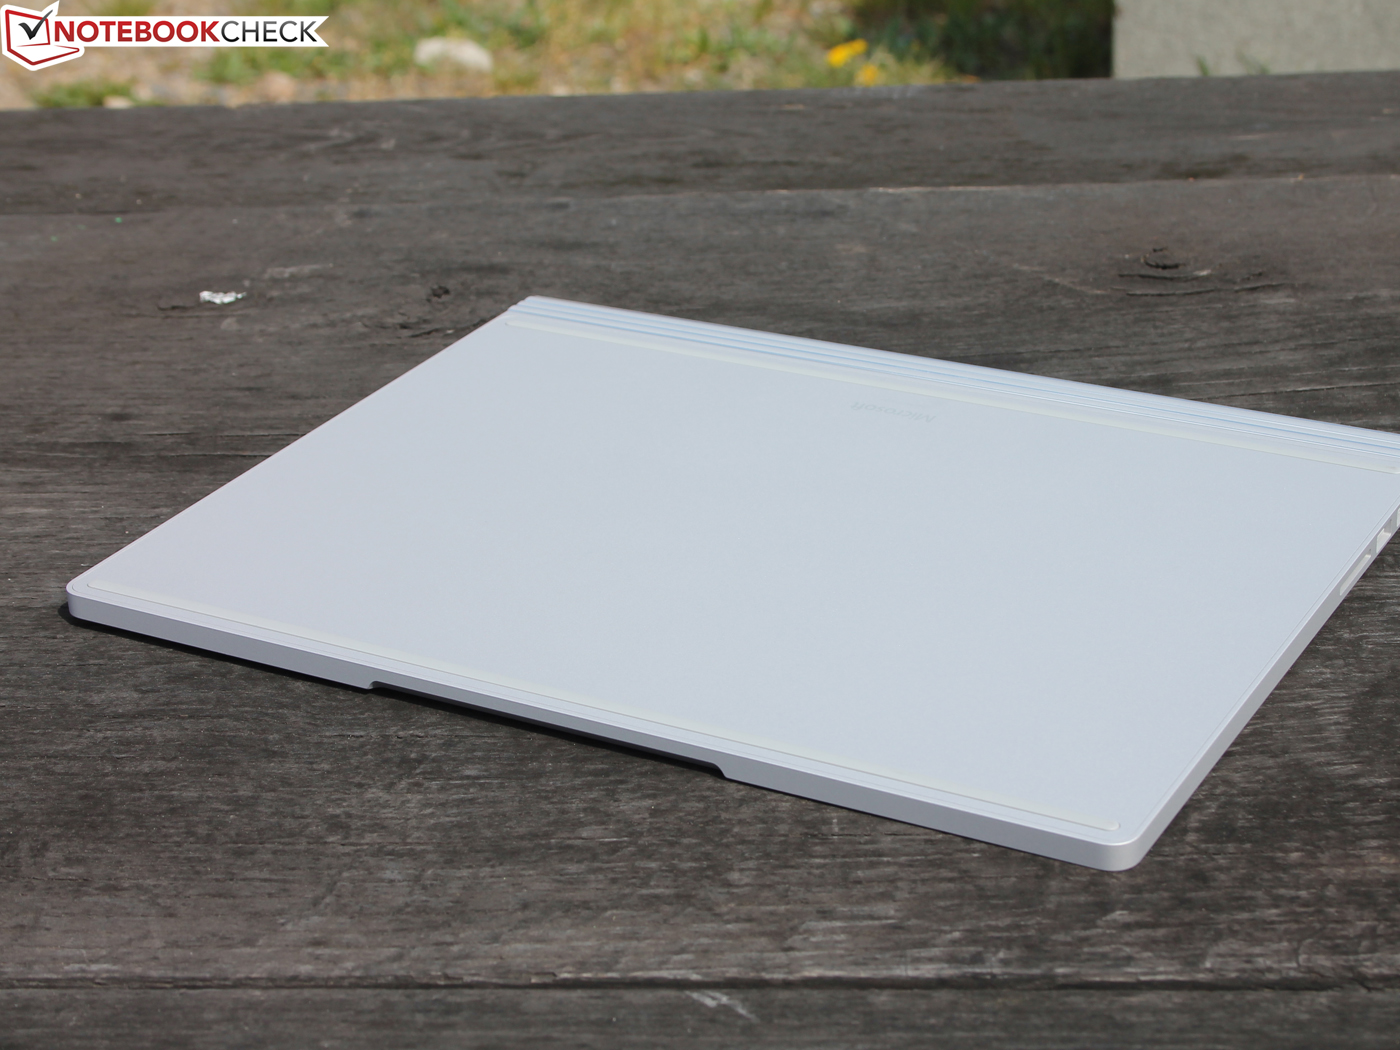
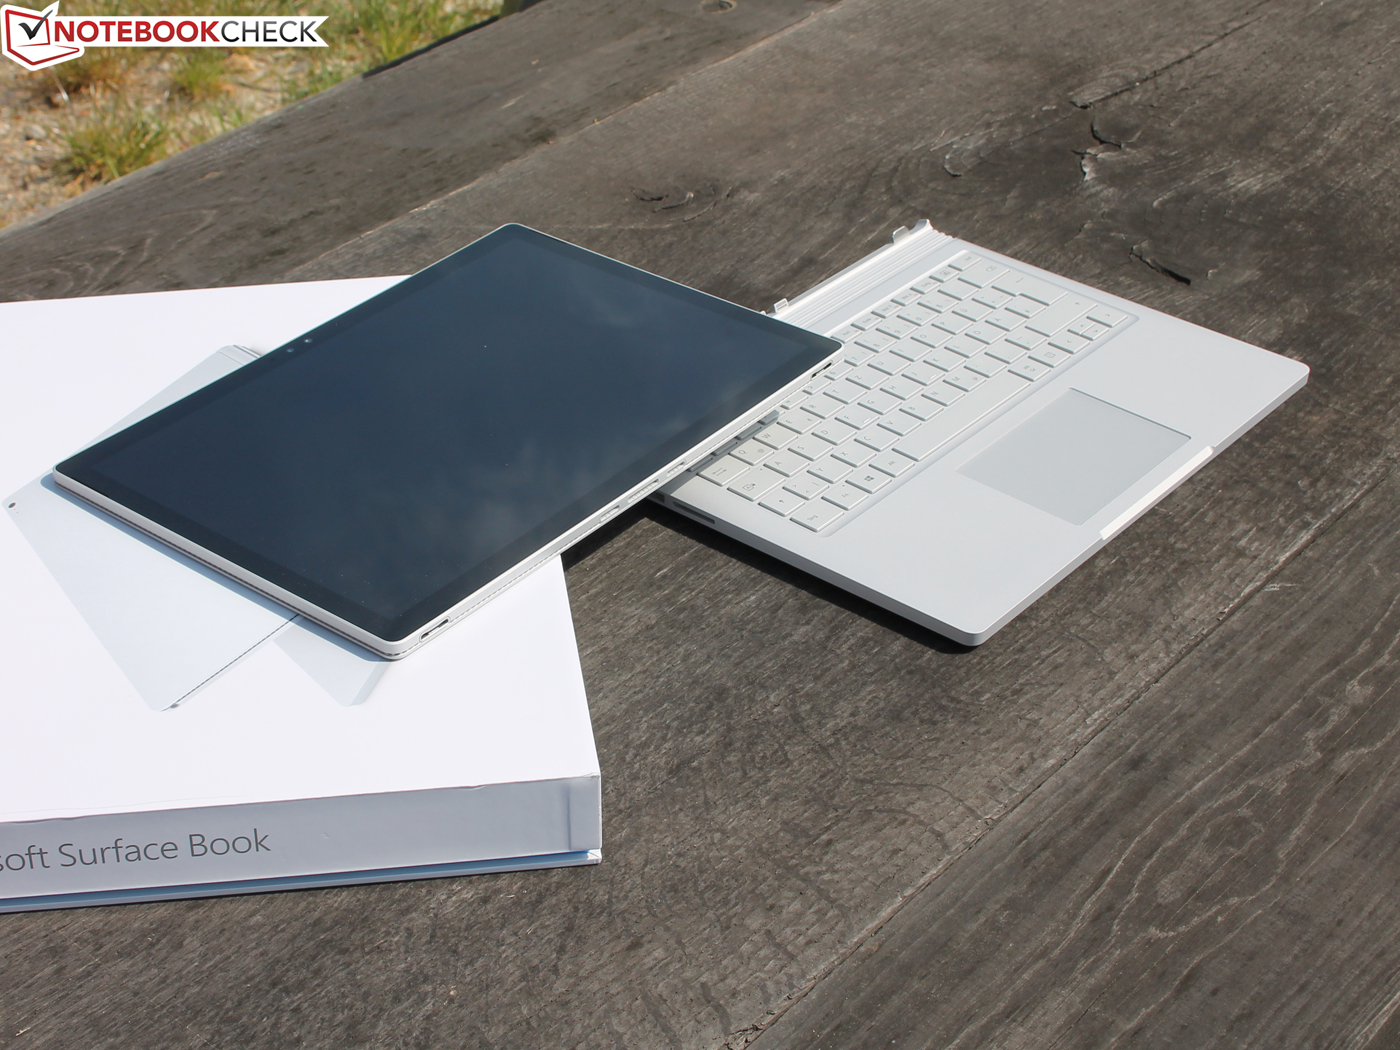
微软 Surface Book 搭配 Performance Base (GTX 965M) 变形本简短评测
| |||||||||||||||||||||||||
Brightness Distribution: 86 %
Center on Battery: 459 cd/m²
Contrast: 1241:1 (Black: 0.37 cd/m²)
ΔE ColorChecker Calman: 2.28 | ∀{0.5-29.43 Ø4.71}
ΔE Greyscale Calman: 2.48 | ∀{0.09-98 Ø4.96}
96% sRGB (Argyll 1.6.3 3D)
62% AdobeRGB 1998 (Argyll 1.6.3 3D)
67.6% AdobeRGB 1998 (Argyll 3D)
95.4% sRGB (Argyll 3D)
66.4% Display P3 (Argyll 3D)
Gamma: 2.5
CCT: 8602 K
| Microsoft Surface Book with Performance Base Panasonic MEI96A2, , 3000x2000, 13.5" | Microsoft Surface Book Core i5 3000x2000, 13.5" | Microsoft Surface Pro 4, Core i5, 128GB Samsung 123YL01-001 ID: SDC3853, , 2736x1824, 12.3" | HP Spectre x360 15-bl002xx UHD UWVA eDP BrightView WLED-backlit , , 3840x2160, 15.6" | Lenovo Yoga 710-14IKB 80V4002HGE AU Optronics B140HAN03.0, , 1920x1080, 14" | Asus UX310UQ-FC396T AU Optronics AUO272D, , 1920x1080, 13.3" | Apple MacBook Pro 13 2016 (2.9 GHz) APPA033, , 2560x1600, 13.3" | |
|---|---|---|---|---|---|---|---|
| Display | 1% | -1% | -4% | -6% | -3% | 28% | |
| Display P3 Coverage (%) | 66.4 | 67 1% | 65 -2% | 67.9 2% | 62 -7% | 64.1 -3% | 99.2 49% |
| sRGB Coverage (%) | 95.4 | 95.8 0% | 96.5 1% | 88.2 -8% | 89.5 -6% | 92.2 -3% | 99.9 5% |
| AdobeRGB 1998 Coverage (%) | 67.6 | 68.9 2% | 67 -1% | 64.4 -5% | 63.3 -6% | 65.3 -3% | 87.6 30% |
| Response Times | 16% | 21% | 12% | 12% | 46% | -10% | |
| Response Time Grey 50% / Grey 80% * (ms) | 61 ? | 48.4 ? 21% | 46 ? 25% | 44 ? 28% | 53 ? 13% | 31 ? 49% | 47.2 ? 23% |
| Response Time Black / White * (ms) | 37 ? | 32.8 ? 11% | 31.2 ? 16% | 38.8 ? -5% | 33 ? 11% | 21 ? 43% | 53 ? -43% |
| PWM Frequency (Hz) | 50 ? | 1000 ? | 50 ? | 192 ? | |||
| Screen | 10% | -13% | -12% | -76% | -43% | 10% | |
| Brightness middle (cd/m²) | 459 | 430.9 -6% | 413 -10% | 351.5 -23% | 340 -26% | 362 -21% | 569 24% |
| Brightness (cd/m²) | 423 | 410 -3% | 396 -6% | 336 -21% | 302 -29% | 343 -19% | 542 28% |
| Brightness Distribution (%) | 86 | 93 8% | 87 1% | 83 -3% | 77 -10% | 92 7% | 90 5% |
| Black Level * (cd/m²) | 0.37 | 0.254 31% | 0.36 3% | 0.24 35% | 0.31 16% | 0.28 24% | 0.56 -51% |
| Contrast (:1) | 1241 | 1696 37% | 1147 -8% | 1465 18% | 1097 -12% | 1293 4% | 1016 -18% |
| Colorchecker dE 2000 * | 2.28 | 2.06 10% | 3.09 -36% | 3.3 -45% | 6.75 -196% | 5.08 -123% | 1.4 39% |
| Colorchecker dE 2000 max. * | 3.61 | 7.3 -102% | 12.4 -243% | 8.95 -148% | 2.9 20% | ||
| Greyscale dE 2000 * | 2.48 | 2.22 10% | 3.92 -58% | 1.9 23% | 8.47 -242% | 6.21 -150% | 1.8 27% |
| Gamma | 2.5 88% | 2.13 103% | 2.3 96% | 2.09 105% | 2.22 99% | 2.4 92% | 2.16 102% |
| CCT | 8602 76% | 6520 100% | 7333 89% | 6784 96% | 6557 99% | 6817 95% | 6877 95% |
| Color Space (Percent of AdobeRGB 1998) (%) | 62 | 64 3% | 61 -2% | 64.4 4% | 58 -6% | 60 -3% | 78.4 26% |
| Color Space (Percent of sRGB) (%) | 96 | 96 0% | 97 1% | 88.2 -8% | 89 -7% | 92 -4% | 99.3 3% |
| Total Average (Program / Settings) | 9% /
9% | 2% /
-5% | -1% /
-7% | -23% /
-50% | 0% /
-23% | 9% /
11% |
* ... smaller is better
Display Response Times
| ↔ Response Time Black to White | ||
|---|---|---|
| 37 ms ... rise ↗ and fall ↘ combined | ↗ 21 ms rise | 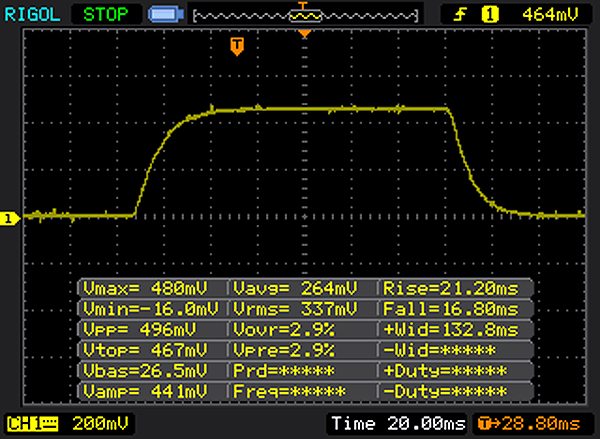 |
| ↘ 16 ms fall | ||
| The screen shows slow response rates in our tests and will be unsatisfactory for gamers. In comparison, all tested devices range from 0.1 (minimum) to 240 (maximum) ms. » 95 % of all devices are better. This means that the measured response time is worse than the average of all tested devices (19.8 ms). | ||
| ↔ Response Time 50% Grey to 80% Grey | ||
| 61 ms ... rise ↗ and fall ↘ combined | ↗ 28 ms rise | 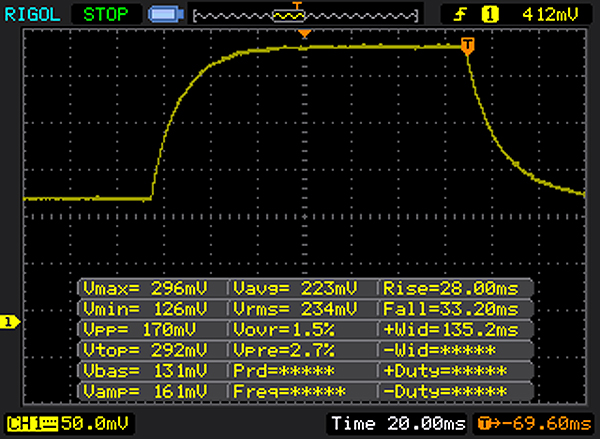 |
| ↘ 33 ms fall | ||
| The screen shows slow response rates in our tests and will be unsatisfactory for gamers. In comparison, all tested devices range from 0.165 (minimum) to 636 (maximum) ms. » 96 % of all devices are better. This means that the measured response time is worse than the average of all tested devices (31 ms). | ||
Screen Flickering / PWM (Pulse-Width Modulation)
| Screen flickering / PWM not detected | ||
In comparison: 52 % of all tested devices do not use PWM to dim the display. If PWM was detected, an average of 7754 (minimum: 5 - maximum: 343500) Hz was measured. | ||
| PCMark 8 Home Score Accelerated v2 | 3040 points | |
| PCMark 8 Creative Score Accelerated v2 | 4136 points | |
| PCMark 8 Work Score Accelerated v2 | 3949 points | |
Help | ||
| Microsoft Surface Book with Performance Base Toshiba NVMe THNSN5256GPU7 | Microsoft Surface Book Core i7 Samsung MZFLV512 NVMe | Lenovo Yoga 710-14IKB 80V4002HGE Samsung MZYTY256HDHP | HP Spectre x360 15-bl002xx Toshiba XG4 NVMe (THNSN5512GPUK) | Asus UX310UQ-FC396T SanDisk SD8SN8U512G1002 | Apple MacBook Pro 13 2016 (2.9 GHz) Apple SSD AP0256 | |
|---|---|---|---|---|---|---|
| CrystalDiskMark 3.0 | 11% | -35% | 21% | -37% | 36% | |
| Read Seq (MB/s) | 1017 | 953 -6% | 490.5 -52% | 1266 24% | 519 -49% | 1662 63% |
| Write Seq (MB/s) | 861 | 592 -31% | 452.3 -47% | 982 14% | 468 -46% | 1336 55% |
| Read 512 (MB/s) | 687 | 520 -24% | 386.2 -44% | 834 21% | 344.8 -50% | 1183 72% |
| Write 512 (MB/s) | 698 | 591 -15% | 219.9 -68% | 714 2% | 458 -34% | 1481 112% |
| Read 4k (MB/s) | 40.91 | 42.66 4% | 34.35 -16% | 40.72 0% | 28.45 -30% | 16.1 -61% |
| Write 4k (MB/s) | 108.6 | 136.3 26% | 91.2 -16% | 139.4 28% | 56.2 -48% | 23.5 -78% |
| Read 4k QD32 (MB/s) | 326.9 | 615 88% | 378.9 16% | 527 61% | 286 -13% | 657 101% |
| Write 4k QD32 (MB/s) | 347.1 | 517 49% | 152.2 -56% | 395.2 14% | 257.7 -26% | 419 21% |

| 3DMark 11 - 1280x720 Performance GPU | |
| Acer Aspire VN7-593G-73HP V15 Nitro BE | |
| HP Omen 15-ax007ng | |
| HP Omen 17-w010ng | |
| Asus G752VL-T7023T | |
| Microsoft Surface Book with Performance Base | |
| Acer TravelMate P658-M-59J7 Graphics Dock | |
| Asus Zenbook UX510UW-CN044T | |
| Acer Aspire V5-591G-50NC | |
| Asus F756UX-T7013T | |
| Apple MacBook Pro 13 2016 (2.9 GHz) | |
| HP Spectre x360 15-bl002xx | |
| Microsoft Surface Book Core i5 | |
| Asus UX310UQ-FC396T | |
| Lenovo Yoga 710-14IKB 80V4002HGE | |
| 3DMark | |
| 1280x720 Cloud Gate Standard Graphics | |
| Acer Aspire VN7-593G-73HP V15 Nitro BE | |
| HP Omen 15-ax007ng | |
| HP Omen 17-w010ng | |
| Dell XPS 15 9560 (i7-7700HQ, UHD) | |
| Dell XPS 15 9550 i7 FHD | |
| Acer TravelMate P658-M-59J7 Graphics Dock | |
| Asus Zenbook UX510UW-CN044T | |
| Acer Aspire V5-591G-50NC | |
| Asus F756UX-T7013T | |
| Asus G752VL-T7023T | |
| Microsoft Surface Book with Performance Base | |
| Apple MacBook Pro 13 2016 (2.9 GHz) | |
| HP Spectre x360 15-bl002xx | |
| Microsoft Surface Book Core i5 | |
| Asus UX310UQ-FC396T | |
| Lenovo Yoga 710-14IKB 80V4002HGE | |
| 1920x1080 Fire Strike Graphics | |
| Acer Aspire VN7-593G-73HP V15 Nitro BE | |
| Dell XPS 15 9560 (i7-7700HQ, UHD) | |
| HP Omen 15-ax007ng | |
| HP Omen 17-w010ng | |
| Asus G752VL-T7023T | |
| Microsoft Surface Book with Performance Base | |
| Dell XPS 15 9550 i7 FHD | |
| Asus Zenbook UX510UW-CN044T | |
| Acer TravelMate P658-M-59J7 Graphics Dock | |
| Acer Aspire V5-591G-50NC | |
| Asus F756UX-T7013T | |
| HP Spectre x360 15-bl002xx | |
| Microsoft Surface Book Core i5 | |
| Apple MacBook Pro 13 2016 (2.9 GHz) | |
| Asus UX310UQ-FC396T | |
| Lenovo Yoga 710-14IKB 80V4002HGE | |
| 3DMark 11 Performance | 5941 points | |
| 3DMark Cloud Gate Standard Score | 8836 points | |
| 3DMark Fire Strike Score | 4395 points | |
Help | ||
| Rise of the Tomb Raider - 1920x1080 High Preset AA:FX AF:4x | |
| Acer Aspire VN7-593G-73HP V15 Nitro BE | |
| Dell XPS 15 9560 (i7-7700HQ, UHD) | |
| HP Omen 15-ax007ng | |
| Microsoft Surface Book with Performance Base | |
| Acer TravelMate P658-M-59J7 Graphics Dock | |
| Dell XPS 15 9550 i7 FHD | |
| HP Spectre x360 15-bl002xx | |
| Lenovo Yoga 710-14IKB 80V4002HGE | |
| Deus Ex Mankind Divided - 1920x1080 High Preset AF:4x | |
| Acer Aspire VN7-593G-73HP V15 Nitro BE | |
| Microsoft Surface Book with Performance Base | |
| Asus Zenbook UX510UW-CN044T | |
| The Witcher 3 - 1920x1080 Ultra Graphics & Postprocessing (HBAO+) | |
| Acer Aspire VN7-593G-73HP V15 Nitro BE | |
| Dell XPS 15 9560 (i7-7700HQ, UHD) | |
| Asus G752VL-T7023T | |
| Microsoft Surface Book with Performance Base | |
| Asus UX310UQ-FC396T | |
| low | med. | high | ultra | |
|---|---|---|---|---|
| BioShock Infinite (2013) | 128 | 118 | 49.9 | |
| The Witcher 3 (2015) | 31.3 | 17.4 | ||
| Rise of the Tomb Raider (2016) | 34.6 | 22.4 | ||
| Deus Ex Mankind Divided (2016) | 49 | 26.4 | 11.4 |
Noise level
| Idle |
| 29.4 / 29.4 / 29.7 dB(A) |
| Load |
| 39 / 40.2 dB(A) |
 | ||
30 dB silent 40 dB(A) audible 50 dB(A) loud |
||
min: | ||
(-) The maximum temperature on the upper side is 47 °C / 117 F, compared to the average of 35.4 °C / 96 F, ranging from 19.6 to 60 °C for the class Convertible.
(-) The bottom heats up to a maximum of 47 °C / 117 F, compared to the average of 36.9 °C / 98 F
(+) In idle usage, the average temperature for the upper side is 28.1 °C / 83 F, compared to the device average of 30.3 °C / 87 F.
(±) Playing The Witcher 3, the average temperature for the upper side is 33.7 °C / 93 F, compared to the device average of 30.3 °C / 87 F.
(-) The palmrests and touchpad can get very hot to the touch with a maximum of 47 °C / 116.6 F.
(-) The average temperature of the palmrest area of similar devices was 28 °C / 82.4 F (-19 °C / -34.2 F).
Microsoft Surface Book with Performance Base audio analysis
(-) | not very loud speakers (63 dB)
Bass 100 - 315 Hz
(±) | reduced bass - on average 5.9% lower than median
(±) | linearity of bass is average (7.1% delta to prev. frequency)
Mids 400 - 2000 Hz
(+) | balanced mids - only 4.3% away from median
(±) | linearity of mids is average (8.1% delta to prev. frequency)
Highs 2 - 16 kHz
(+) | balanced highs - only 4.7% away from median
(±) | linearity of highs is average (8% delta to prev. frequency)
Overall 100 - 16.000 Hz
(±) | linearity of overall sound is average (19% difference to median)
Compared to same class
» 45% of all tested devices in this class were better, 7% similar, 48% worse
» The best had a delta of 6%, average was 20%, worst was 57%
Compared to all devices tested
» 45% of all tested devices were better, 7% similar, 48% worse
» The best had a delta of 4%, average was 23%, worst was 134%
Apple MacBook Pro 13 2016 (2.9 GHz) audio analysis
(+) | speakers can play relatively loud (86.9 dB)
Bass 100 - 315 Hz
(±) | reduced bass - on average 13.2% lower than median
(±) | linearity of bass is average (10.7% delta to prev. frequency)
Mids 400 - 2000 Hz
(+) | balanced mids - only 4.1% away from median
(+) | mids are linear (6.3% delta to prev. frequency)
Highs 2 - 16 kHz
(+) | balanced highs - only 2.9% away from median
(+) | highs are linear (4% delta to prev. frequency)
Overall 100 - 16.000 Hz
(+) | overall sound is linear (12.2% difference to median)
Compared to same class
» 15% of all tested devices in this class were better, 5% similar, 80% worse
» The best had a delta of 5%, average was 18%, worst was 53%
Compared to all devices tested
» 10% of all tested devices were better, 3% similar, 88% worse
» The best had a delta of 4%, average was 23%, worst was 134%
HP Spectre x360 15-bl002xx audio analysis
(±) | speaker loudness is average but good (72.9 dB)
Bass 100 - 315 Hz
(±) | reduced bass - on average 14.8% lower than median
(±) | linearity of bass is average (14% delta to prev. frequency)
Mids 400 - 2000 Hz
(+) | balanced mids - only 4.4% away from median
(±) | linearity of mids is average (10.1% delta to prev. frequency)
Highs 2 - 16 kHz
(+) | balanced highs - only 1.2% away from median
(+) | highs are linear (4.9% delta to prev. frequency)
Overall 100 - 16.000 Hz
(±) | linearity of overall sound is average (20.3% difference to median)
Compared to same class
» 68% of all tested devices in this class were better, 9% similar, 24% worse
» The best had a delta of 5%, average was 17%, worst was 45%
Compared to all devices tested
» 53% of all tested devices were better, 8% similar, 39% worse
» The best had a delta of 4%, average was 23%, worst was 134%
| Off / Standby | |
| Idle | |
| Load |
|
Key:
min: | |
| Microsoft Surface Book with Performance Base 6600U, GeForce GTX 965M, Toshiba NVMe THNSN5256GPU7, IPS, 3000x2000, 13.5" | Microsoft Surface Book Core i7 6600U, Maxwell GPU (940M, GDDR5), Samsung MZFLV512 NVMe, IPS, 3000x2000, 13.5" | Microsoft Surface Pro 4, Core i5, 128GB 6300U, HD Graphics 520, Samsung MZFLV128 NVMe, IPS, 2736x1824, 12.3" | Lenovo Yoga 710-14IKB 80V4002HGE i5-7200U, HD Graphics 620, Samsung MZYTY256HDHP, a-Si WLED TFT, IPS, 1920x1080, 14" | Apple MacBook Pro 13 2016 (2.9 GHz) 6267U, Iris Graphics 550, Apple SSD AP0256, , 2560x1600, 13.3" | |
|---|---|---|---|---|---|
| Power Consumption | 5% | 27% | 33% | 24% | |
| Idle Minimum * (Watt) | 4.15 | 4.5 -8% | 4.4 -6% | 3.7 11% | 2.1 49% |
| Idle Average * (Watt) | 8 | 9.8 -23% | 9 -13% | 7.16 10% | 7.6 5% |
| Idle Maximum * (Watt) | 11.9 | 12.2 -3% | 10.7 10% | 8.3 30% | 8.2 31% |
| Load Average * (Watt) | 67 | 46 31% | 19.6 71% | 30.4 55% | 56.4 16% |
| Witcher 3 ultra * (Watt) | 58 | ||||
| Load Maximum * (Watt) | 76 | 56 26% | 19.9 74% | 30.3 60% | 59.8 21% |
* ... smaller is better
| Microsoft Surface Book with Performance Base 6600U, GeForce GTX 965M, 78 Wh | Microsoft Surface Book Core i5 6300U, Maxwell GPU (940M, GDDR5), 78 Wh | Microsoft Surface Book Core i7 6600U, Maxwell GPU (940M, GDDR5), 78 Wh | Microsoft Surface Pro 4, Core i5, 128GB 6300U, HD Graphics 520, 38 Wh | Lenovo Yoga 710-14IKB 80V4002HGE i5-7200U, HD Graphics 620, 53 Wh | HP Spectre x360 15-bl002xx i7-7500U, GeForce 940MX, 79.2 Wh | Apple MacBook Pro 13 2016 (2.9 GHz) 6267U, Iris Graphics 550, 49.2 Wh | |
|---|---|---|---|---|---|---|---|
| Battery runtime | 4% | 13% | -13% | 0% | 5% | -15% | |
| Reader / Idle (h) | 25.5 | 17.8 -30% | 15 -41% | 16 -37% | 14.4 -44% | ||
| WiFi v1.3 (h) | 9.6 | 6.7 -30% | 10.8 13% | 7.1 -26% | 9.4 -2% | 8.9 -7% | 9.4 -2% |
| Load (h) | 1.5 | 2.6 73% | 1.9 27% | 2.1 40% | 2.5 67% | 1.1 -27% | |
| H.264 (h) | 10.1 | 8.7 | 8.1 |
Pros
Cons
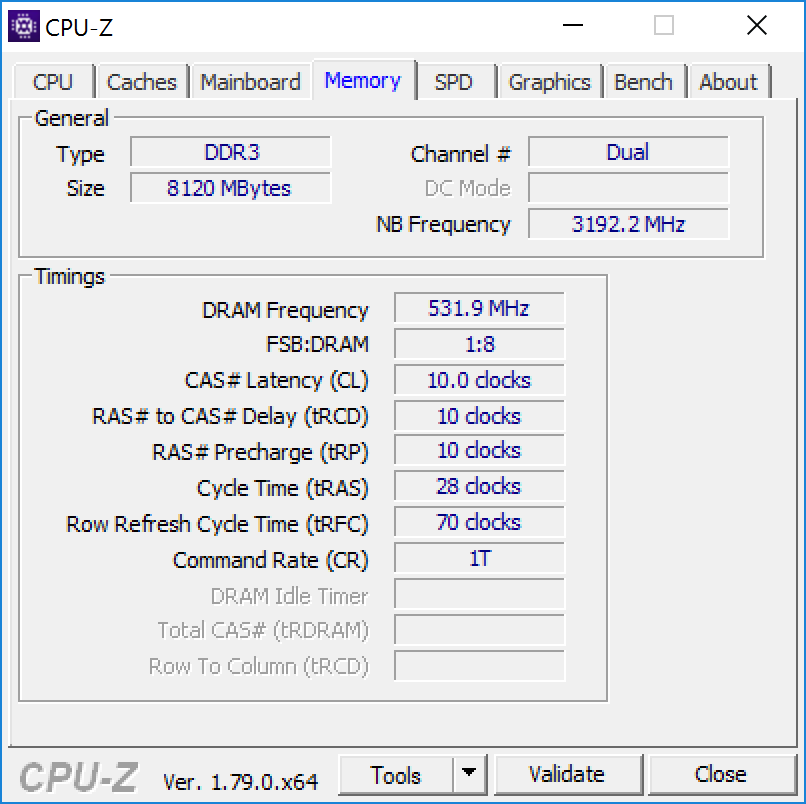
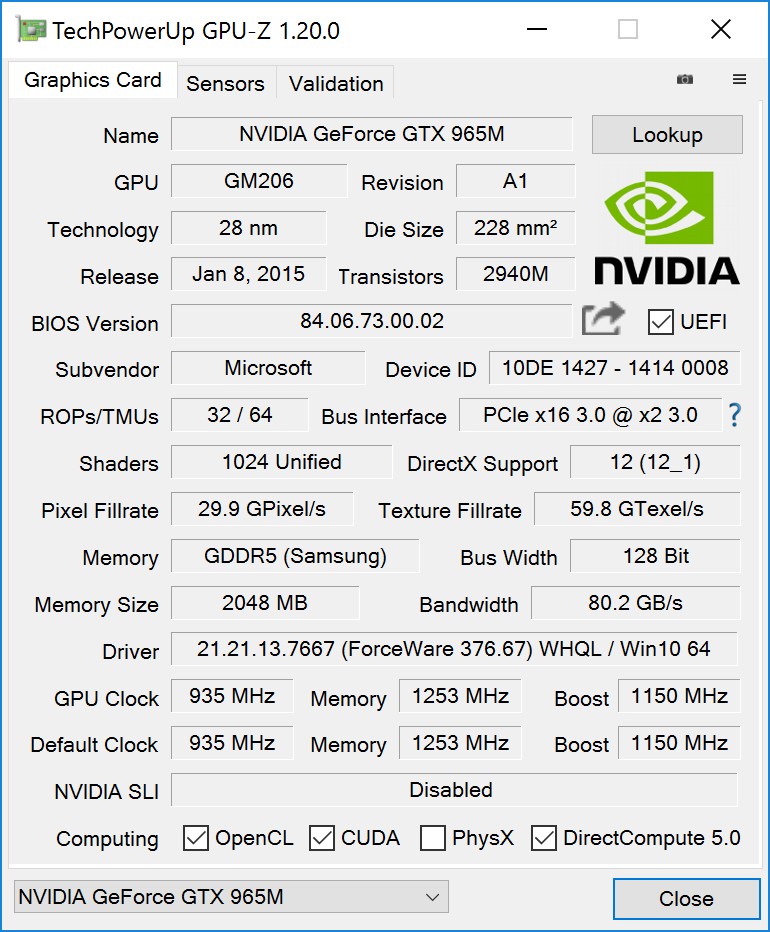
隐身于键盘之中的英伟达芯片很难发挥完全的加速潜能,在运行The Witcher 3时,它的频率仅保持在默认的950MHz速度上。尽管对于实际游戏体验的影响不大,但这个问题在基准测试中反映明显:由于这个缘故它相比其他搭配GTX 965M的笔记本电脑速度明显较慢。
最新游戏将无法在全高清分辨率和高设定下流畅运行。如果你可以接受这一点的话,它可以在保证高便携性的前提下提供十分不错的性能。但请不要期待Surface Book可以与其他45瓦多媒体笔记本电脑相对抗——要实现这一点,微软还需要改进它的散热系统,或者更换英伟达的Pascal架构芯片。
游戏玩家将需要在选购这台设备之前谨慎权衡利弊。我们的测试机型售价在欧洲约2600欧元(约19604人民币),在美国售价2400美元(约18096人民币)。相比之下,同样的预算可以购买两台搭配GTX 1060显卡的宏碁V15笔记本电脑。不过游戏玩家并不是这台设备的主要目标群体,相对的它主要面向设计、建筑、视频和版面编辑等需要强劲显卡的专业用户。
注:本文是基于完整评测的缩减版本,阅读完整的英文评测,请点击这里。
Microsoft Surface Book with Performance Base
- 05/03/2017 v6 (old)
Sebastian Jentsch
Price comparison
