微软 Surface Book (Core i5, Nvidia GPU) 笔记本电脑简短评测
| |||||||||||||||||||||||||
Brightness Distribution: 93 %
Center on Battery: 430.9 cd/m²
Contrast: 1696:1 (Black: 0.254 cd/m²)
ΔE ColorChecker Calman: 2.06 | ∀{0.5-29.43 Ø4.72}
ΔE Greyscale Calman: 2.22 | ∀{0.09-98 Ø4.97}
96% sRGB (Argyll 1.6.3 3D)
64% AdobeRGB 1998 (Argyll 1.6.3 3D)
68.9% AdobeRGB 1998 (Argyll 3D)
95.8% sRGB (Argyll 3D)
67% Display P3 (Argyll 3D)
Gamma: 2.13
CCT: 6520 K
| Microsoft Surface Book Core i5 13.5-inch (3000 x 2000) | Apple MacBook Pro Retina 13 inch 2015-03 13.3-inch (2560 x 1600) | Toshiba KIRA-10D 13.3-inch (1920 x 1080) | Acer Aspire S7-393-75508G25EWS 13.3-inch (2560 x 1440) | Asus Zenbook UX305LA-FC012H 13.3-inch (1920 x 1080) | Dell XPS 13-9343 Non-Touch 13.3-inch (1920 x 1080) | |
|---|---|---|---|---|---|---|
| Display | -1% | 3% | 4% | -5% | -4% | |
| Display P3 Coverage (%) | 67 | 65.9 -2% | 69.1 3% | 70.1 5% | 63.9 -5% | 65.9 -2% |
| sRGB Coverage (%) | 95.8 | 97 1% | 98.2 3% | 98.3 3% | 91.6 -4% | 89.6 -6% |
| AdobeRGB 1998 Coverage (%) | 68.9 | 67.4 -2% | 71 3% | 71.1 3% | 65 -6% | 66.2 -4% |
| Response Times | ||||||
| Response Time Grey 50% / Grey 80% * (ms) | 48.4 ? | |||||
| Response Time Black / White * (ms) | 32.8 ? | |||||
| PWM Frequency (Hz) | ||||||
| Screen | -11% | -14% | -20% | -42% | -59% | |
| Brightness middle (cd/m²) | 430.9 | 361 -16% | 334 -22% | 360 -16% | 349 -19% | 409.7 -5% |
| Brightness (cd/m²) | 410 | 342 -17% | 316 -23% | 341 -17% | 338 -18% | 405 -1% |
| Brightness Distribution (%) | 93 | 81 -13% | 92 -1% | 90 -3% | 87 -6% | 93 0% |
| Black Level * (cd/m²) | 0.254 | 0.361 -42% | 0.29 -14% | 0.23 9% | 0.25 2% | 0.366 -44% |
| Contrast (:1) | 1696 | 1000 -41% | 1152 -32% | 1565 -8% | 1396 -18% | 1119 -34% |
| Colorchecker dE 2000 * | 2.06 | 1.82 12% | 2.27 -10% | 3.35 -63% | 5.49 -167% | 7.67 -272% |
| Greyscale dE 2000 * | 2.22 | 1.8 19% | 2.47 -11% | 3.62 -63% | 5.43 -145% | 4.66 -110% |
| Gamma | 2.13 103% | 2.49 88% | 2.36 93% | 2.51 88% | 2.17 101% | 1.65 133% |
| CCT | 6520 100% | 6417 101% | 6872 95% | 6805 96% | 7055 92% | 6502 100% |
| Color Space (Percent of AdobeRGB 1998) (%) | 64 | 61.9 -3% | 64 0% | 65 2% | 60 -6% | 59.65 -7% |
| Color Space (Percent of sRGB) (%) | 96 | 96.9 1% | 92 -4% | |||
| Colorchecker dE 2000 max. * | 3.26 | |||||
| Total Average (Program / Settings) | -6% /
-9% | -6% /
-9% | -8% /
-13% | -24% /
-33% | -32% /
-44% |
* ... smaller is better
| Cinebench R11.5 | |
| CPU Single 64Bit (sort by value) | |
| Microsoft Surface Book Core i5 | |
| HP EliteBook Folio 1040 G2 H7W22EA | |
| Dell Latitude 14 7414 Rugged Extreme | |
| Lenovo IdeaPad Z40-59422614 | |
| Toshiba Tecra A50-C1510W10 | |
| Asus Transformer Book T300FA-FE001H | |
| Eurocom Shark 4 | |
| CPU Multi 64Bit (sort by value) | |
| Microsoft Surface Book Core i5 | |
| HP EliteBook Folio 1040 G2 H7W22EA | |
| Dell Latitude 14 7414 Rugged Extreme | |
| Lenovo IdeaPad Z40-59422614 | |
| Toshiba Tecra A50-C1510W10 | |
| Asus Transformer Book T300FA-FE001H | |
| Eurocom Shark 4 | |
| Cinebench R15 | |
| CPU Single 64Bit (sort by value) | |
| Microsoft Surface Book Core i5 | |
| HP EliteBook Folio 1040 G2 H7W22EA | |
| Dell Latitude 14 7414 Rugged Extreme | |
| Lenovo IdeaPad Z40-59422614 | |
| Toshiba Tecra A50-C1510W10 | |
| Asus Transformer Book T300FA-FE001H | |
| Eurocom Shark 4 | |
| CPU Multi 64Bit (sort by value) | |
| Microsoft Surface Book Core i5 | |
| HP EliteBook Folio 1040 G2 H7W22EA | |
| Dell Latitude 14 7414 Rugged Extreme | |
| Lenovo IdeaPad Z40-59422614 | |
| Toshiba Tecra A50-C1510W10 | |
| Asus Transformer Book T300FA-FE001H | |
| Eurocom Shark 4 | |
| wPrime 2.10 | |
| 1024m (sort by value) | |
| Microsoft Surface Book Core i5 | |
| HP EliteBook Folio 1040 G2 H7W22EA | |
| Dell Latitude 14 7414 Rugged Extreme | |
| Lenovo IdeaPad Z40-59422614 | |
| Toshiba Tecra A50-C1510W10 | |
| Asus Transformer Book T300FA-FE001H | |
| Eurocom Shark 4 | |
| 32m (sort by value) | |
| Microsoft Surface Book Core i5 | |
| HP EliteBook Folio 1040 G2 H7W22EA | |
| Dell Latitude 14 7414 Rugged Extreme | |
| Lenovo IdeaPad Z40-59422614 | |
| Toshiba Tecra A50-C1510W10 | |
| Asus Transformer Book T300FA-FE001H | |
| Eurocom Shark 4 | |
| Super Pi Mod 1.5 XS 32M - 32M (sort by value) | |
| Microsoft Surface Book Core i5 | |
| HP EliteBook Folio 1040 G2 H7W22EA | |
| Dell Latitude 14 7414 Rugged Extreme | |
| Lenovo IdeaPad Z40-59422614 | |
| Toshiba Tecra A50-C1510W10 | |
| Asus Transformer Book T300FA-FE001H | |
| Eurocom Shark 4 | |
* ... smaller is better
| PCMark 7 Score | 5135 points | |
| PCMark 8 Home Score Accelerated v2 | 2814 points | |
| PCMark 8 Creative Score Accelerated v2 | 3694 points | |
| PCMark 8 Work Score Accelerated v2 | 3644 points | |
Help | ||

| 3DMark 06 Standard Score | 15111 points | |
| 3DMark 11 Performance | 2711 points | |
| 3DMark Ice Storm Standard Score | 49514 points | |
| 3DMark Cloud Gate Standard Score | 7424 points | |
| 3DMark Fire Strike Score | 1886 points | |
| 3DMark Fire Strike Extreme Score | 279 points | |
Help | ||
| 3DMark | |
| 1920x1080 Fire Strike Graphics (sort by value) | |
| Microsoft Surface Book Core i5 | |
| Asus UX501JW-DS71T | |
| Asus GL771JM | |
| MSI GP62-2QEi781FD | |
| MSI GS30 Shadow | |
| Lenovo Yoga 3 14-80JH0035GE | |
| Vizio CT14-A0 | |
| 1280x720 Cloud Gate Standard Graphics (sort by value) | |
| Microsoft Surface Book Core i5 | |
| Asus UX501JW-DS71T | |
| Asus GL771JM | |
| MSI GP62-2QEi781FD | |
| MSI GS30 Shadow | |
| Lenovo Yoga 3 14-80JH0035GE | |
| Vizio CT14-A0 | |
| 3DMark 11 | |
| 1280x720 Performance Combined (sort by value) | |
| Microsoft Surface Book Core i5 | |
| Asus UX501JW-DS71T | |
| Asus GL771JM | |
| MSI GP62-2QEi781FD | |
| MSI GS30 Shadow | |
| Lenovo Yoga 3 14-80JH0035GE | |
| Vizio CT14-A0 | |
| 1280x720 Performance Physics (sort by value) | |
| Microsoft Surface Book Core i5 | |
| Asus UX501JW-DS71T | |
| Asus GL771JM | |
| MSI GP62-2QEi781FD | |
| MSI GS30 Shadow | |
| Lenovo Yoga 3 14-80JH0035GE | |
| Vizio CT14-A0 | |
| 1280x720 Performance GPU (sort by value) | |
| Microsoft Surface Book Core i5 | |
| Asus UX501JW-DS71T | |
| Asus GL771JM | |
| MSI GP62-2QEi781FD | |
| MSI GS30 Shadow | |
| Lenovo Yoga 3 14-80JH0035GE | |
| Vizio CT14-A0 | |
| 1280x720 Performance (sort by value) | |
| Microsoft Surface Book Core i5 | |
| Asus UX501JW-DS71T | |
| Asus GL771JM | |
| MSI GP62-2QEi781FD | |
| MSI GS30 Shadow | |
| Lenovo Yoga 3 14-80JH0035GE | |
| Vizio CT14-A0 | |
| low | med. | high | ultra | |
|---|---|---|---|---|
| Sleeping Dogs (2012) | 112.4 | 85.6 | 42.8 | 10.9 |
| Tomb Raider (2013) | 161.5 | 82.8 | 55.2 | 25.8 |
| StarCraft II: Heart of the Swarm (2013) | 258 | 141.2 | 74.2 | 37.5 |
| BioShock Infinite (2013) | 94.2 | 64.8 | 56.5 | 20.8 |
| Metro: Last Light (2013) | 59.6 | 44.7 | 30.7 | 15.7 |
| Thief (2014) | 45.6 | 28.2 | 22.3 | 9.4 |
| F1 2014 (2014) | 117 | 94 | 76 | 49 |
| Batman: Arkham Knight (2015) | 23 | 14 | ||
| Metal Gear Solid V (2015) | 42 | 35.9 | 19.7 | 13.3 |
| Metro: Last Light | |
| 1366x768 High (DX11) AF:16x (sort by value) | |
| Microsoft Surface Book Core i5 | |
| MSI GP62-2QEi781FD | |
| Eurocom Shark 4 | |
| Lenovo ThinkPad T450s-20BWS1UT00 | |
| 1920x1080 Very High (DX11) AF:16x (sort by value) | |
| Microsoft Surface Book Core i5 | |
| MSI GP62-2QEi781FD | |
| Eurocom Shark 4 | |
| Lenovo ThinkPad T450s-20BWS1UT00 | |
| Tomb Raider | |
| 1366x768 High Preset AA:FX AF:8x (sort by value) | |
| Microsoft Surface Book Core i5 | |
| MSI GP62-2QEi781FD | |
| Eurocom Shark 4 | |
| Lenovo ThinkPad T450s-20BWS1UT00 | |
| 1920x1080 Ultra Preset AA:FX AF:16x (sort by value) | |
| Microsoft Surface Book Core i5 | |
| MSI GP62-2QEi781FD | |
| Eurocom Shark 4 | |
| Lenovo ThinkPad T450s-20BWS1UT00 | |
| Thief | |
| 1366x768 High Preset AA:FXAA & Low SS AF:4x (sort by value) | |
| Microsoft Surface Book Core i5 | |
| MSI GP62-2QEi781FD | |
| Eurocom Shark 4 | |
| 1920x1080 Very High Preset AA:FXAA & High SS AF:8x (sort by value) | |
| Microsoft Surface Book Core i5 | |
| MSI GP62-2QEi781FD | |
| Eurocom Shark 4 | |
| Sleeping Dogs | |
| 1366x768 High Preset AA:High (sort by value) | |
| Microsoft Surface Book Core i5 | |
| MSI GP62-2QEi781FD | |
| Eurocom Shark 4 | |
| 1920x1080 Extreme Preset AA:Extreme (sort by value) | |
| Microsoft Surface Book Core i5 | |
| MSI GP62-2QEi781FD | |
| Eurocom Shark 4 | |
| StarCraft II: Heart of the Swarm | |
| 1366x768 High AA:on (sort by value) | |
| Microsoft Surface Book Core i5 | |
| MSI GP62-2QEi781FD | |
| 1920x1080 Ultra / Extreme AA:on (sort by value) | |
| Microsoft Surface Book Core i5 | |
| MSI GP62-2QEi781FD | |
| BioShock Infinite | |
| 1366x768 High Preset (sort by value) | |
| Microsoft Surface Book Core i5 | |
| MSI GP62-2QEi781FD | |
| Eurocom Shark 4 | |
| 1920x1080 Ultra Preset, DX11 (DDOF) (sort by value) | |
| Microsoft Surface Book Core i5 | |
| MSI GP62-2QEi781FD | |
| Eurocom Shark 4 | |
| F1 2014 | |
| 1920x1080 High Preset (sort by value) | |
| Microsoft Surface Book Core i5 | |
| MSI GP62-2QEi781FD | |
| Eurocom Shark 4 | |
| Lenovo ThinkPad T450s-20BWS1UT00 | |
| 1920x1080 Ultra Preset AA:4x MS (sort by value) | |
| Microsoft Surface Book Core i5 | |
| MSI GP62-2QEi781FD | |
| Eurocom Shark 4 | |
| Lenovo ThinkPad T450s-20BWS1UT00 | |
| Metal Gear Solid V | |
| 1920x1080 High / On (sort by value) | |
| Microsoft Surface Book Core i5 | |
| Eurocom Shark 4 | |
| 1920x1080 Extra High / On (sort by value) | |
| Microsoft Surface Book Core i5 | |
| Eurocom Shark 4 | |
Noise level
| Idle |
| 29.5 / 29.6 / 29.7 dB(A) |
| Load |
| 37.5 / 40.9 dB(A) |
 | ||
30 dB silent 40 dB(A) audible 50 dB(A) loud |
||
min: | ||
(±) The maximum temperature on the upper side is 44.2 °C / 112 F, compared to the average of 35.4 °C / 96 F, ranging from 19.6 to 60 °C for the class Convertible.
(±) The bottom heats up to a maximum of 41.2 °C / 106 F, compared to the average of 36.9 °C / 98 F
(+) In idle usage, the average temperature for the upper side is 24.4 °C / 76 F, compared to the device average of 30.3 °C / 87 F.
(+) The palmrests and touchpad are cooler than skin temperature with a maximum of 27.8 °C / 82 F and are therefore cool to the touch.
(±) The average temperature of the palmrest area of similar devices was 28 °C / 82.4 F (+0.2 °C / 0.4 F).
| Microsoft Surface Book Core i5 69 Wh | Apple MacBook Pro Retina 13 inch 2015-03 75 Wh | Toshiba KIRA-10D 52 Wh | Acer Aspire S7-393-75508G25EWS 47 Wh | Asus Zenbook UX305LA-FC012H 56 Wh | Dell XPS 13-9343 Non-Touch 54 Wh | Lenovo Yoga 3 14-80JH0035GE 47 Wh | |
|---|---|---|---|---|---|---|---|
| Battery runtime | 18% | 16% | -12% | 16% | 21% | -12% | |
| Reader / Idle (h) | 17.8 | 28.2 58% | 23.3 31% | 14 -21% | 24.5 38% | 21.6 21% | 14.8 -17% |
| WiFi v1.3 (h) | 6.7 | 9 34% | 8.6 28% | 7.7 15% | 9.5 42% | 10 49% | 6.4 -4% |
| Load (h) | 2.6 | 1.6 -38% | 2.3 -12% | 1.8 -31% | 1.8 -31% | 2.4 -8% | 2.2 -15% |
Pros
Cons
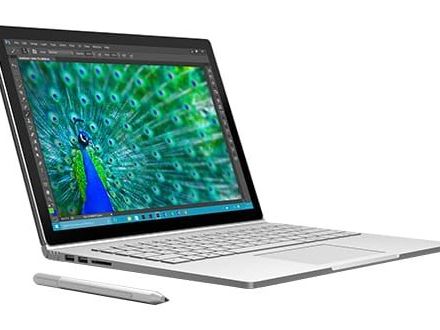
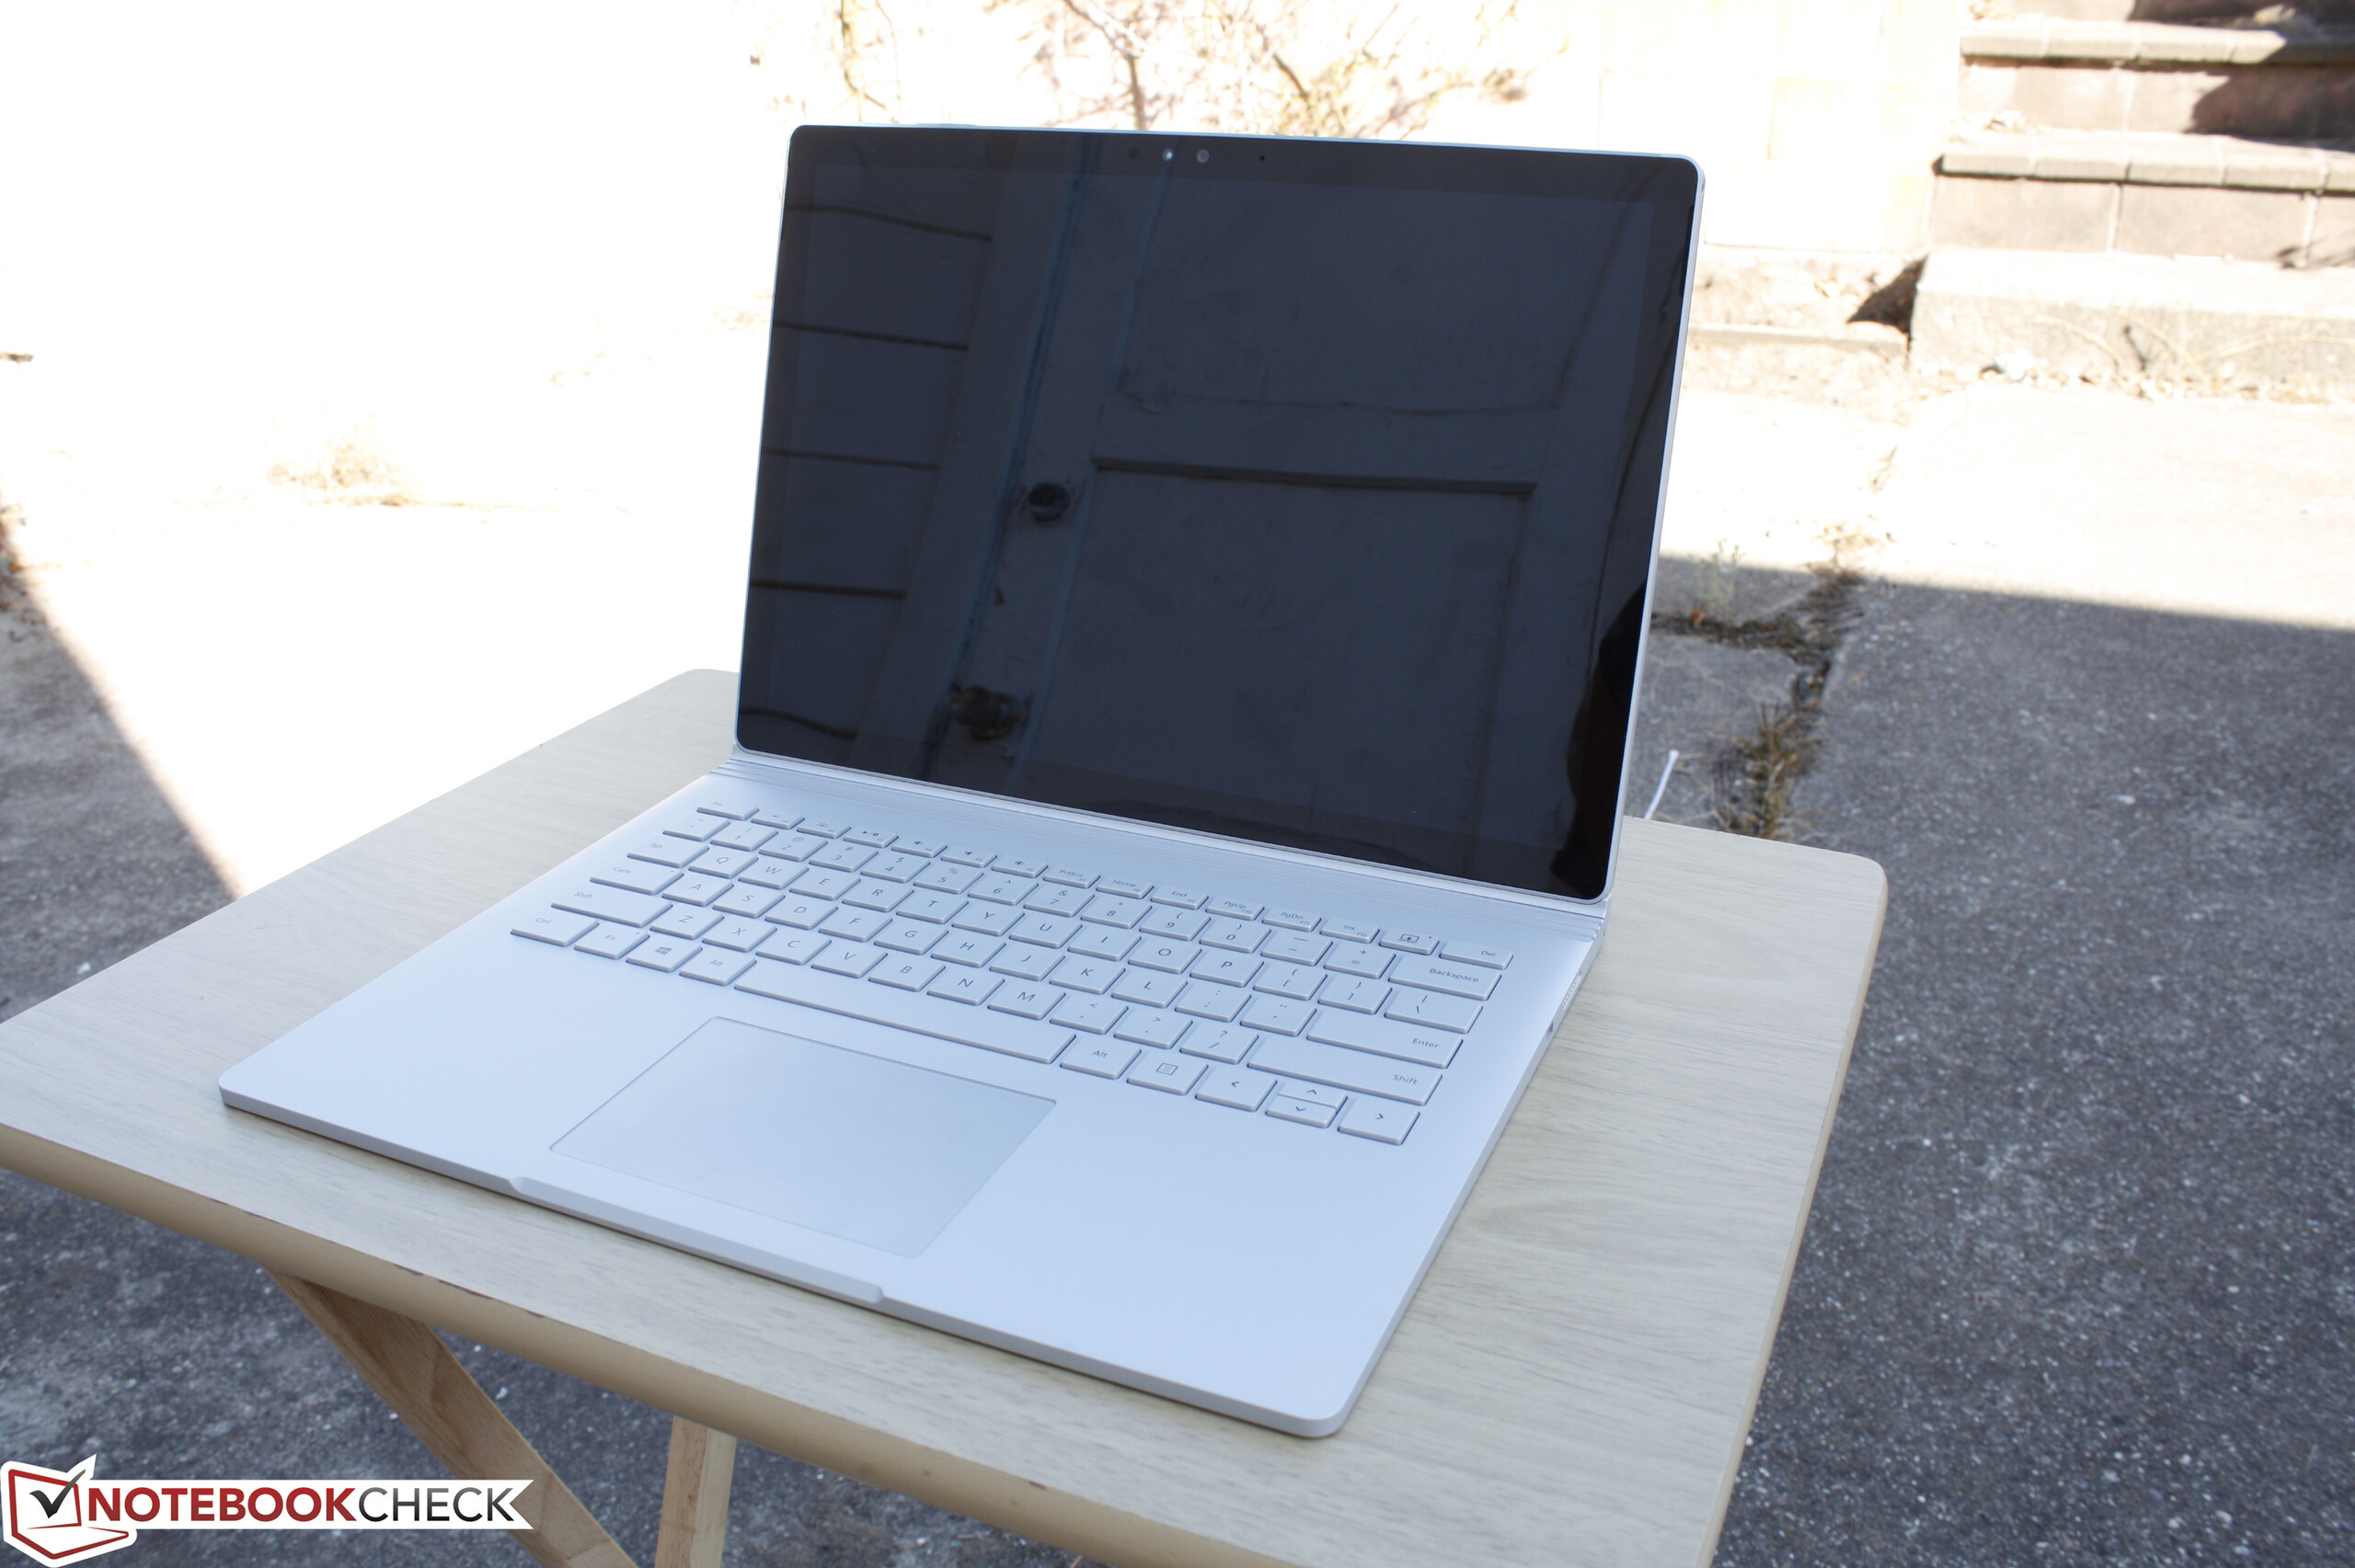
可分离式笔记本电脑的一个主要目标是通过二合一的方式同时取代用户的平板和笔记本电脑。这经常带来不理想的结果,例如品质上的瑕疵,较差的键盘,沉重的屏幕,功能性弱,和较低的性能,因为核心硬件需要装入平板电脑之中。
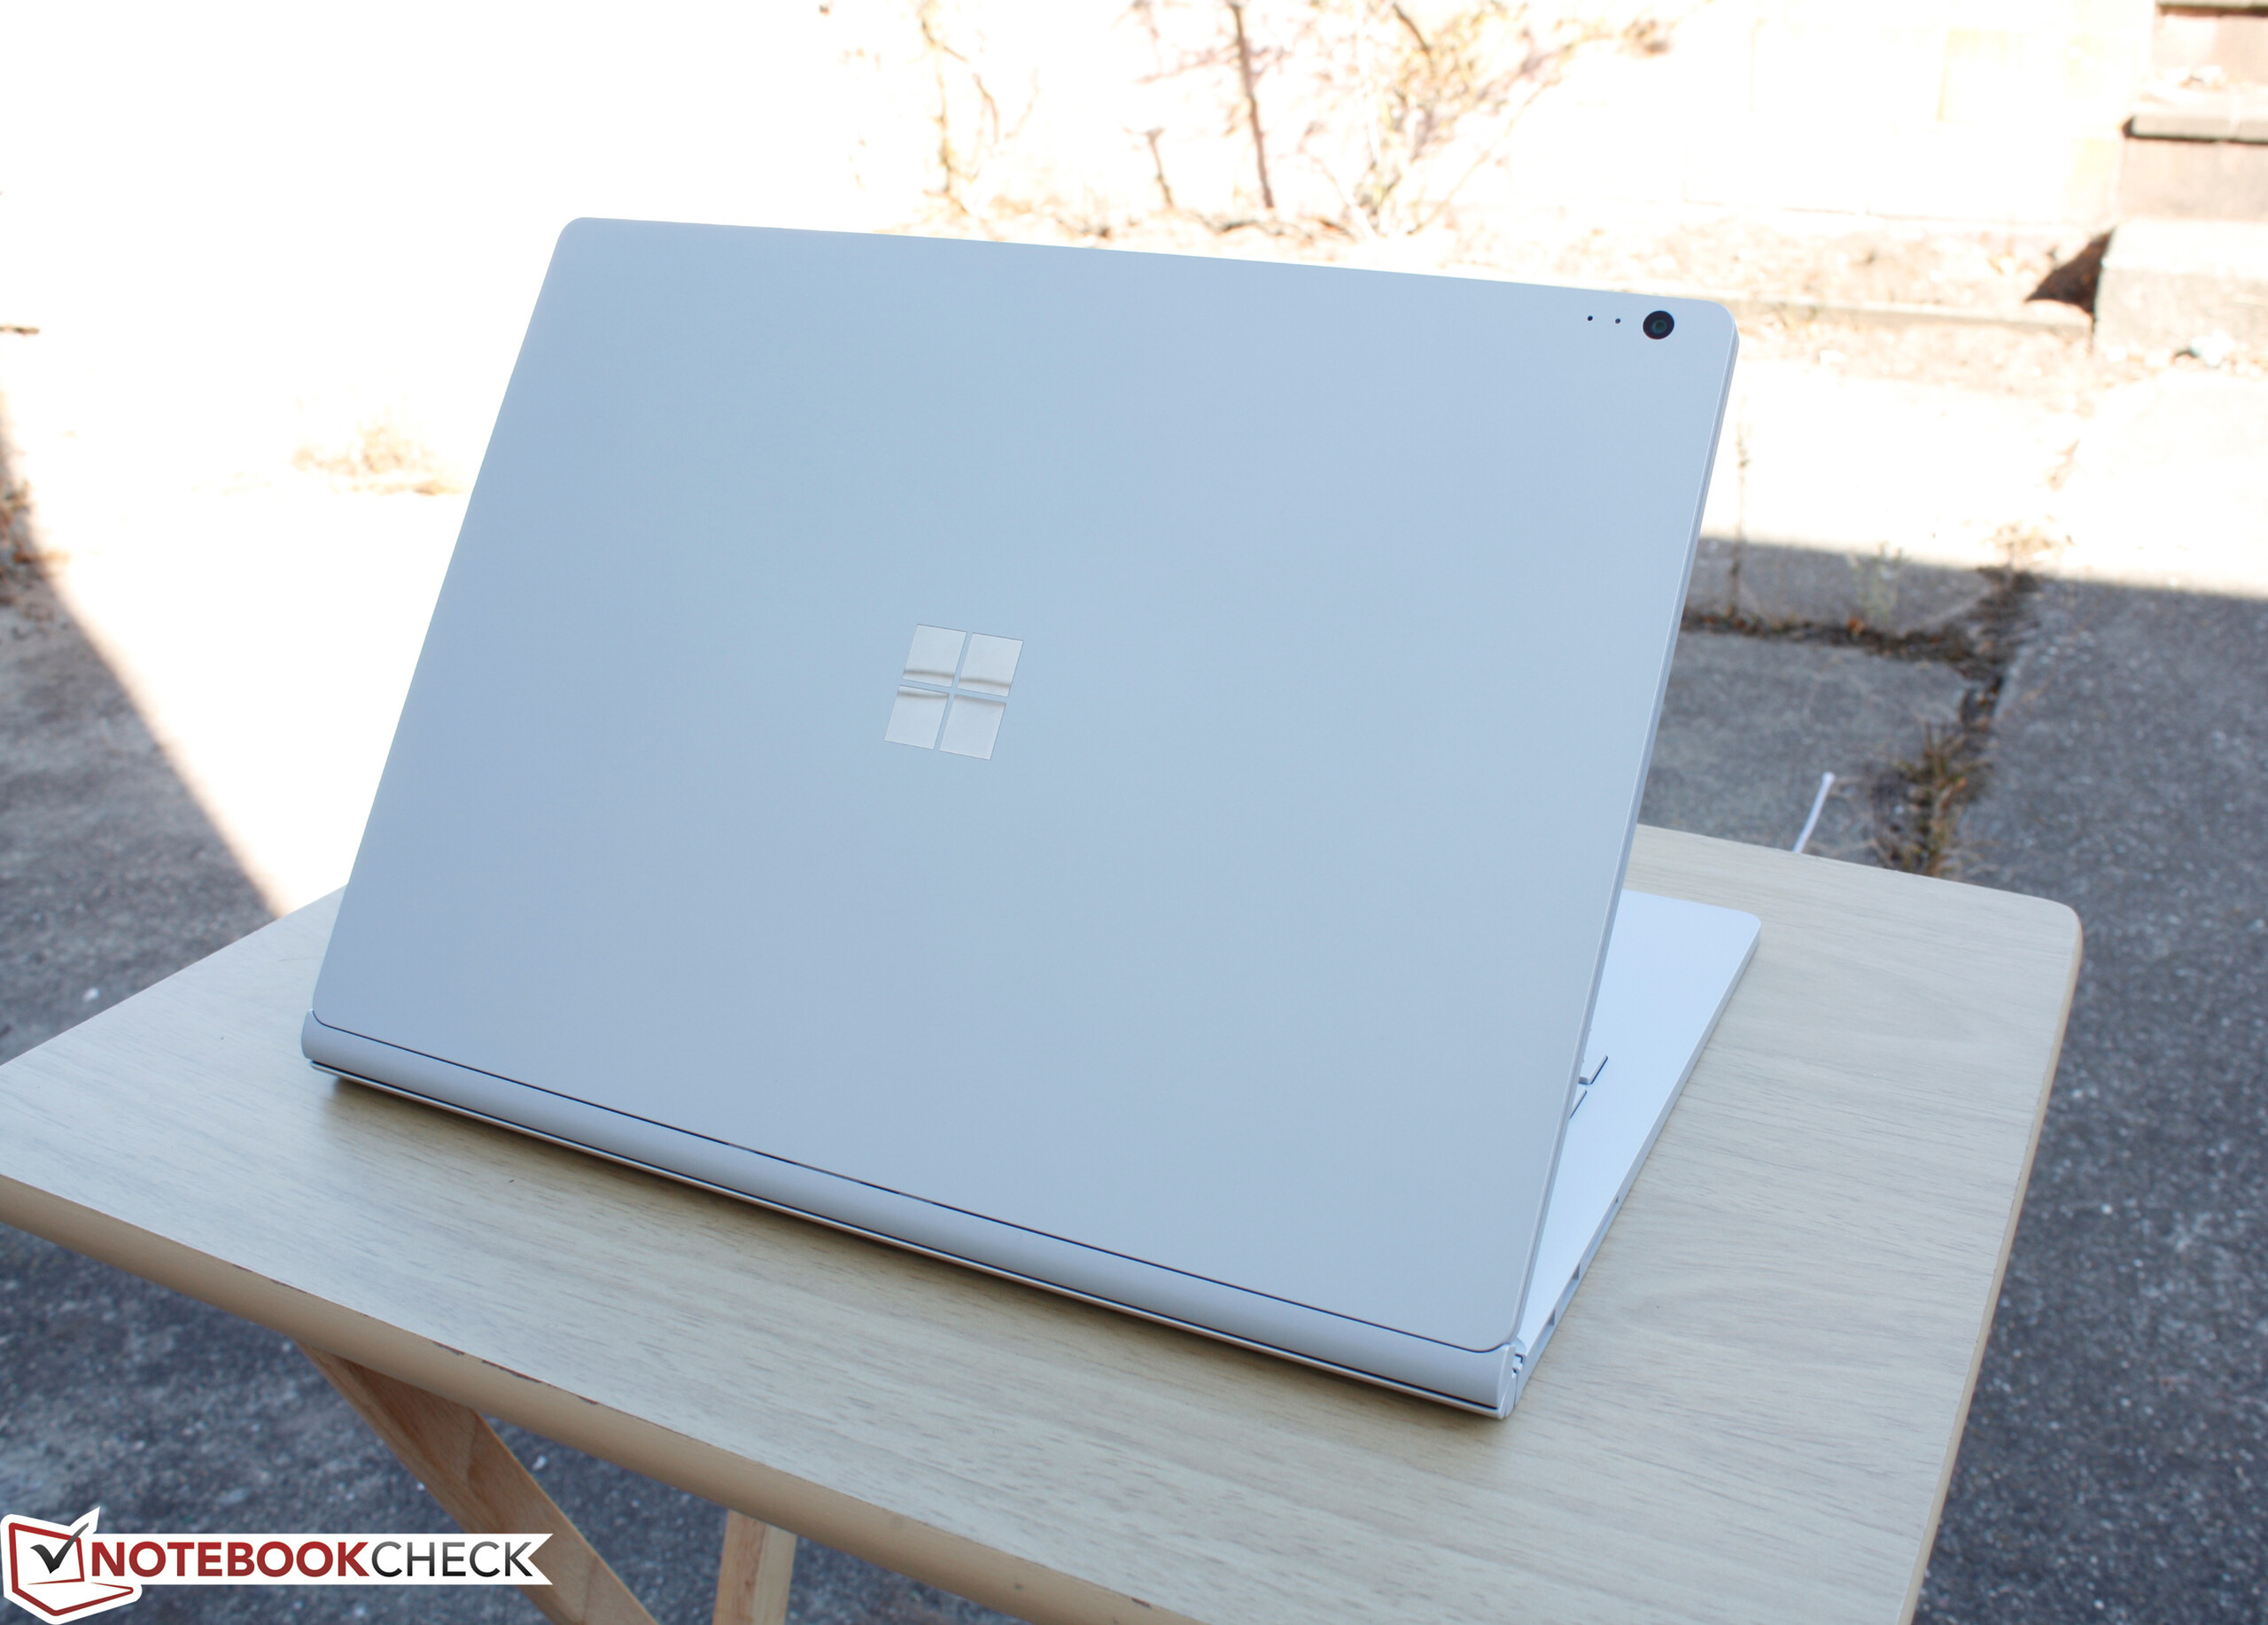
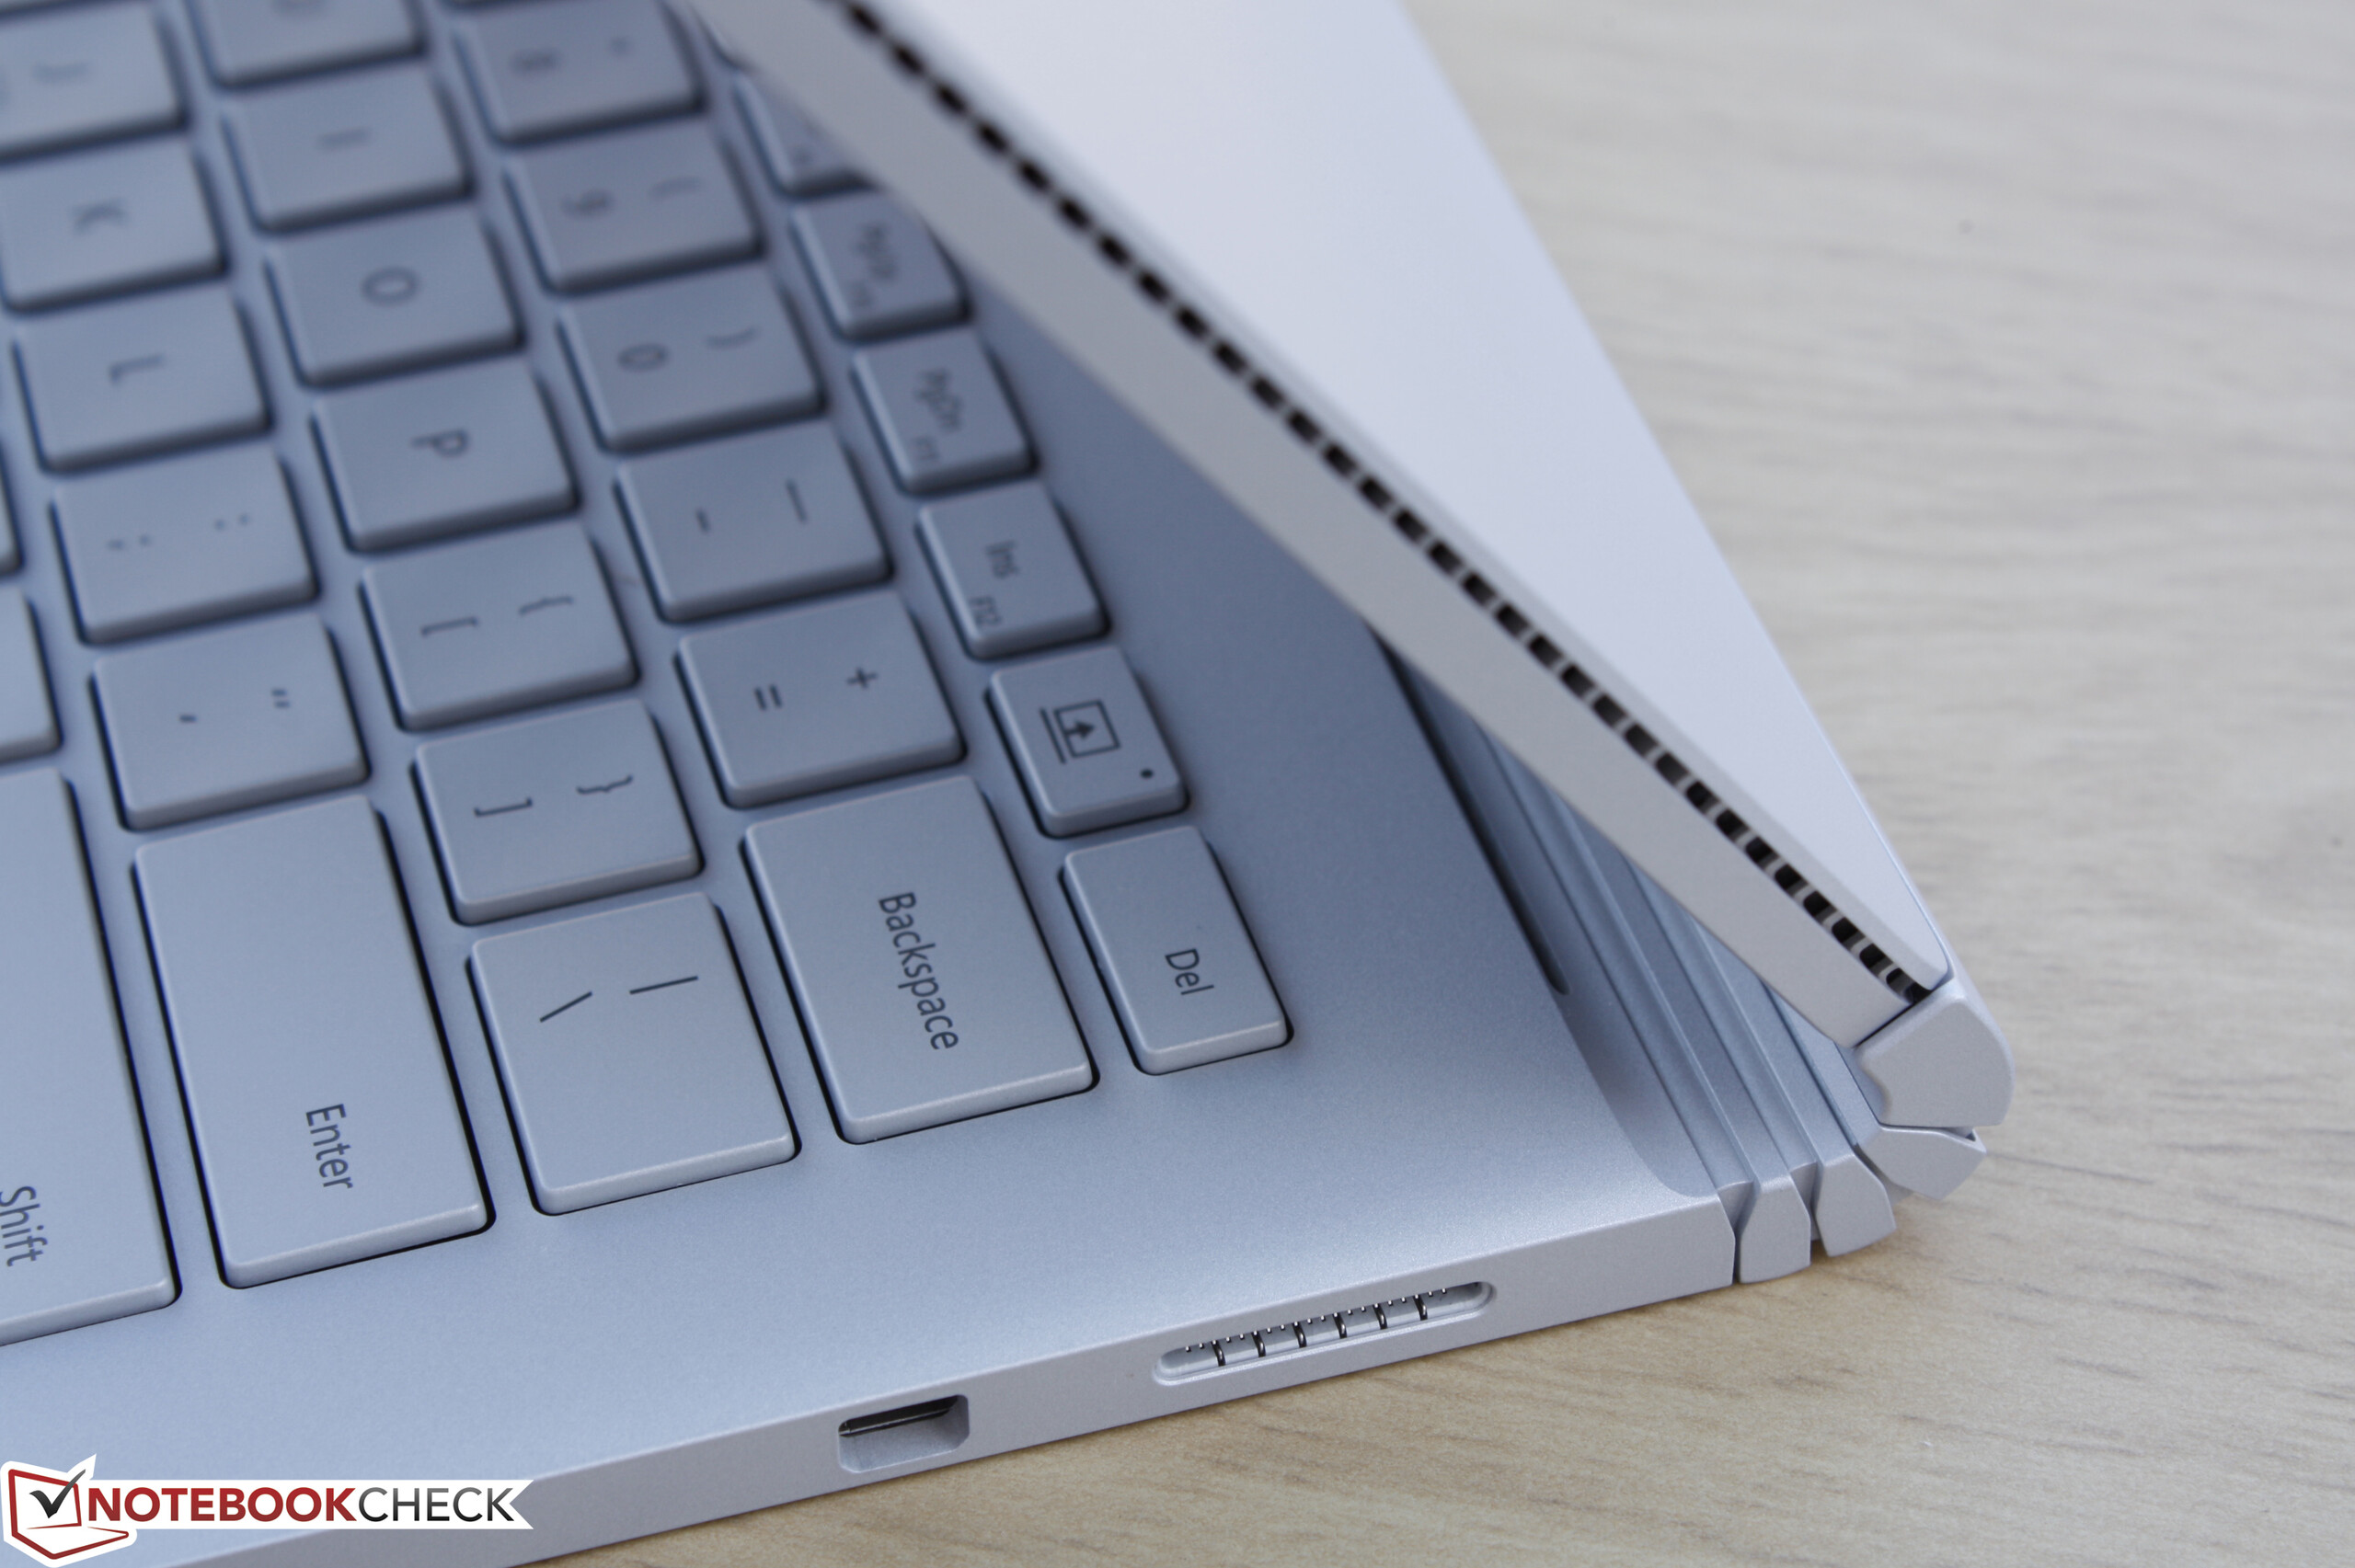
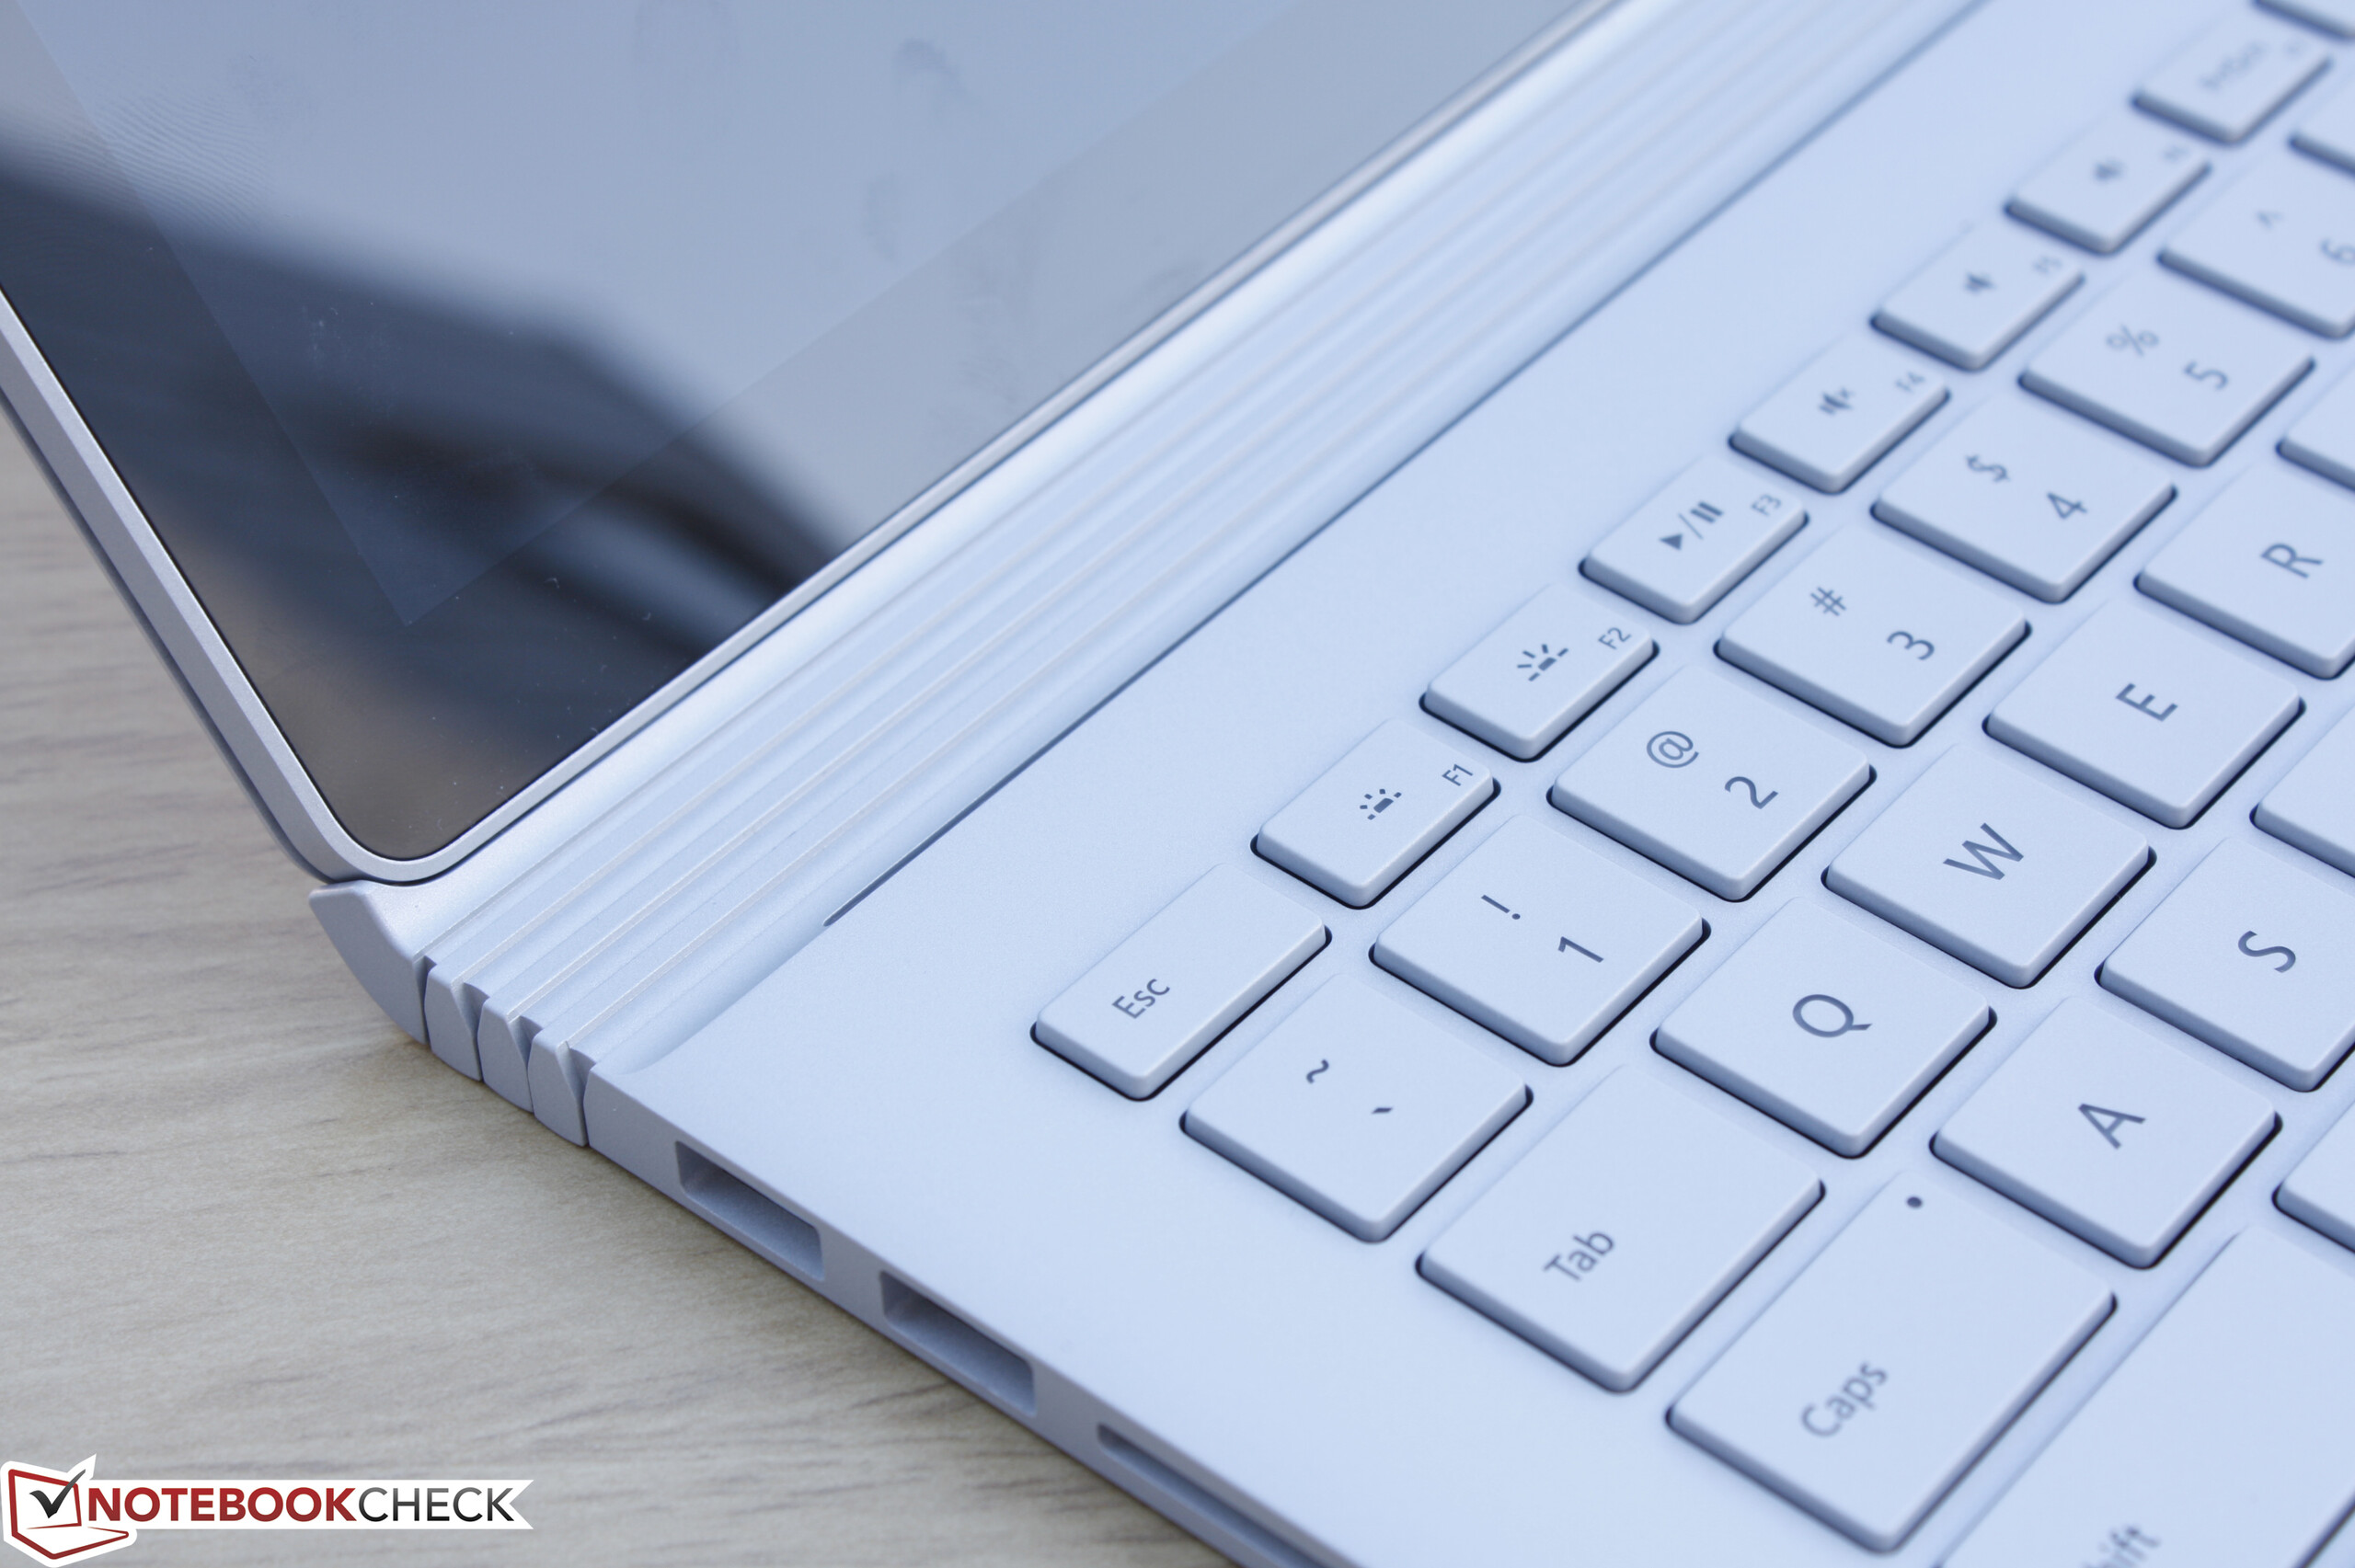
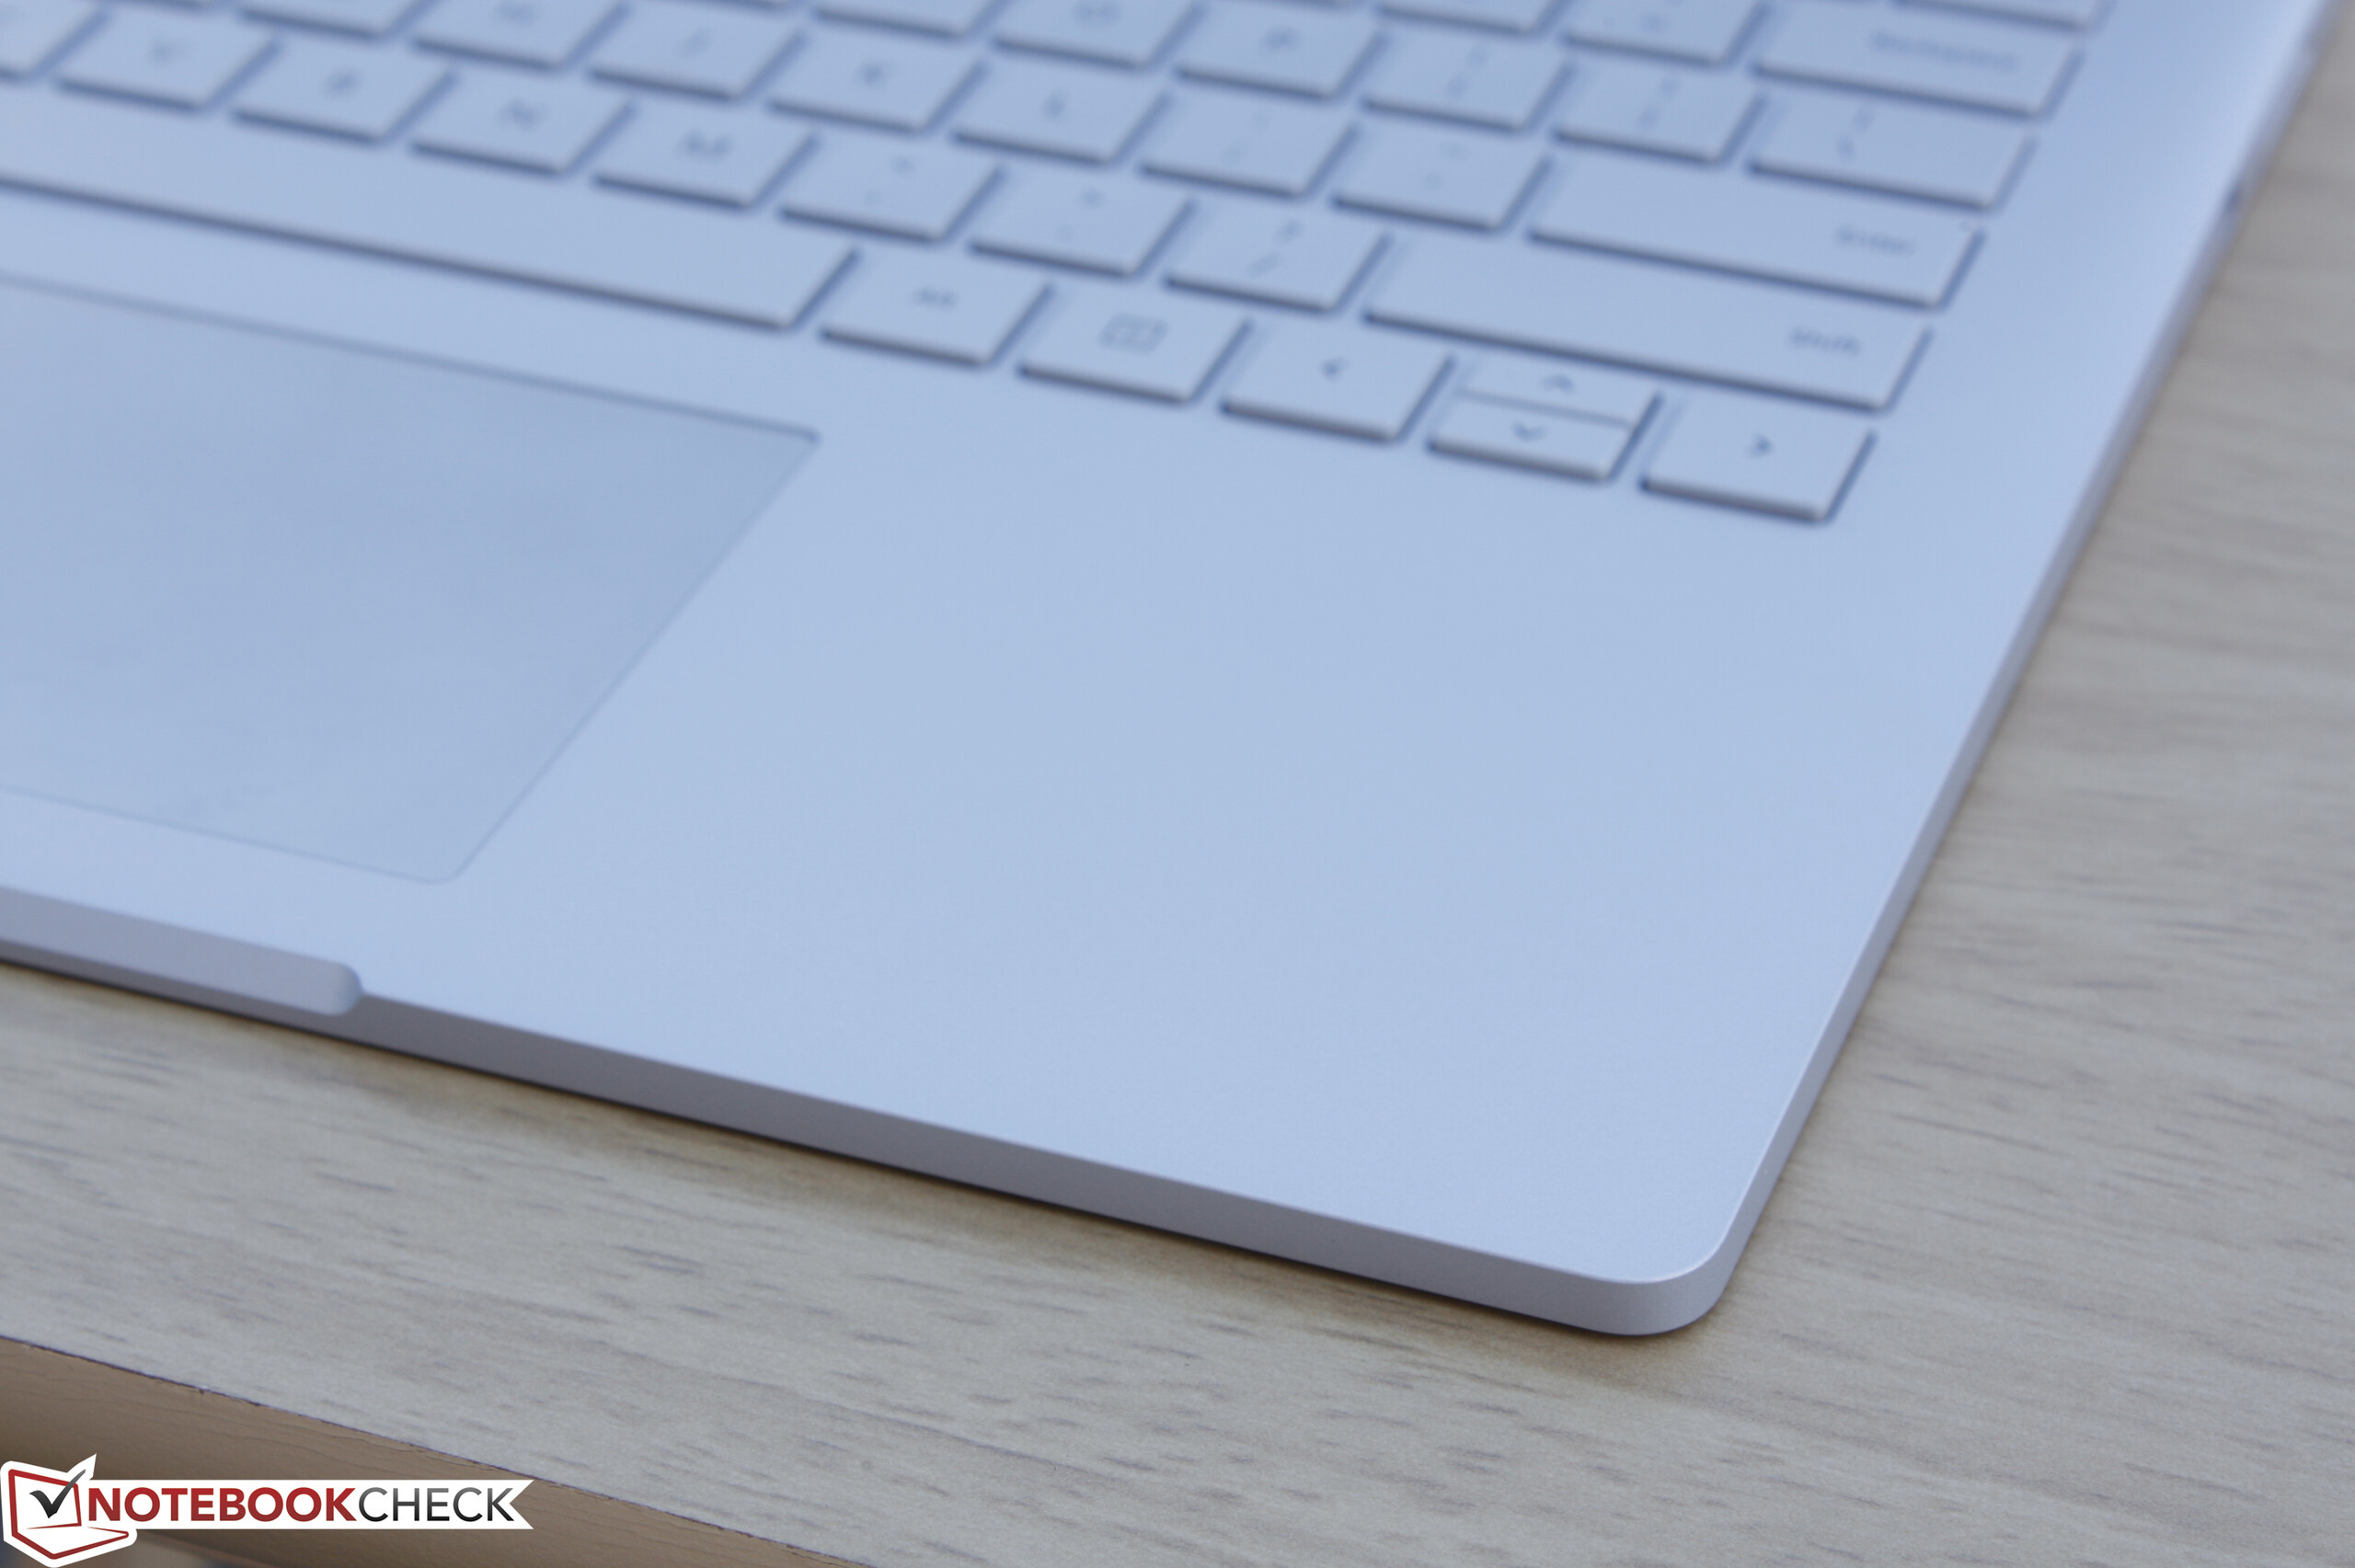
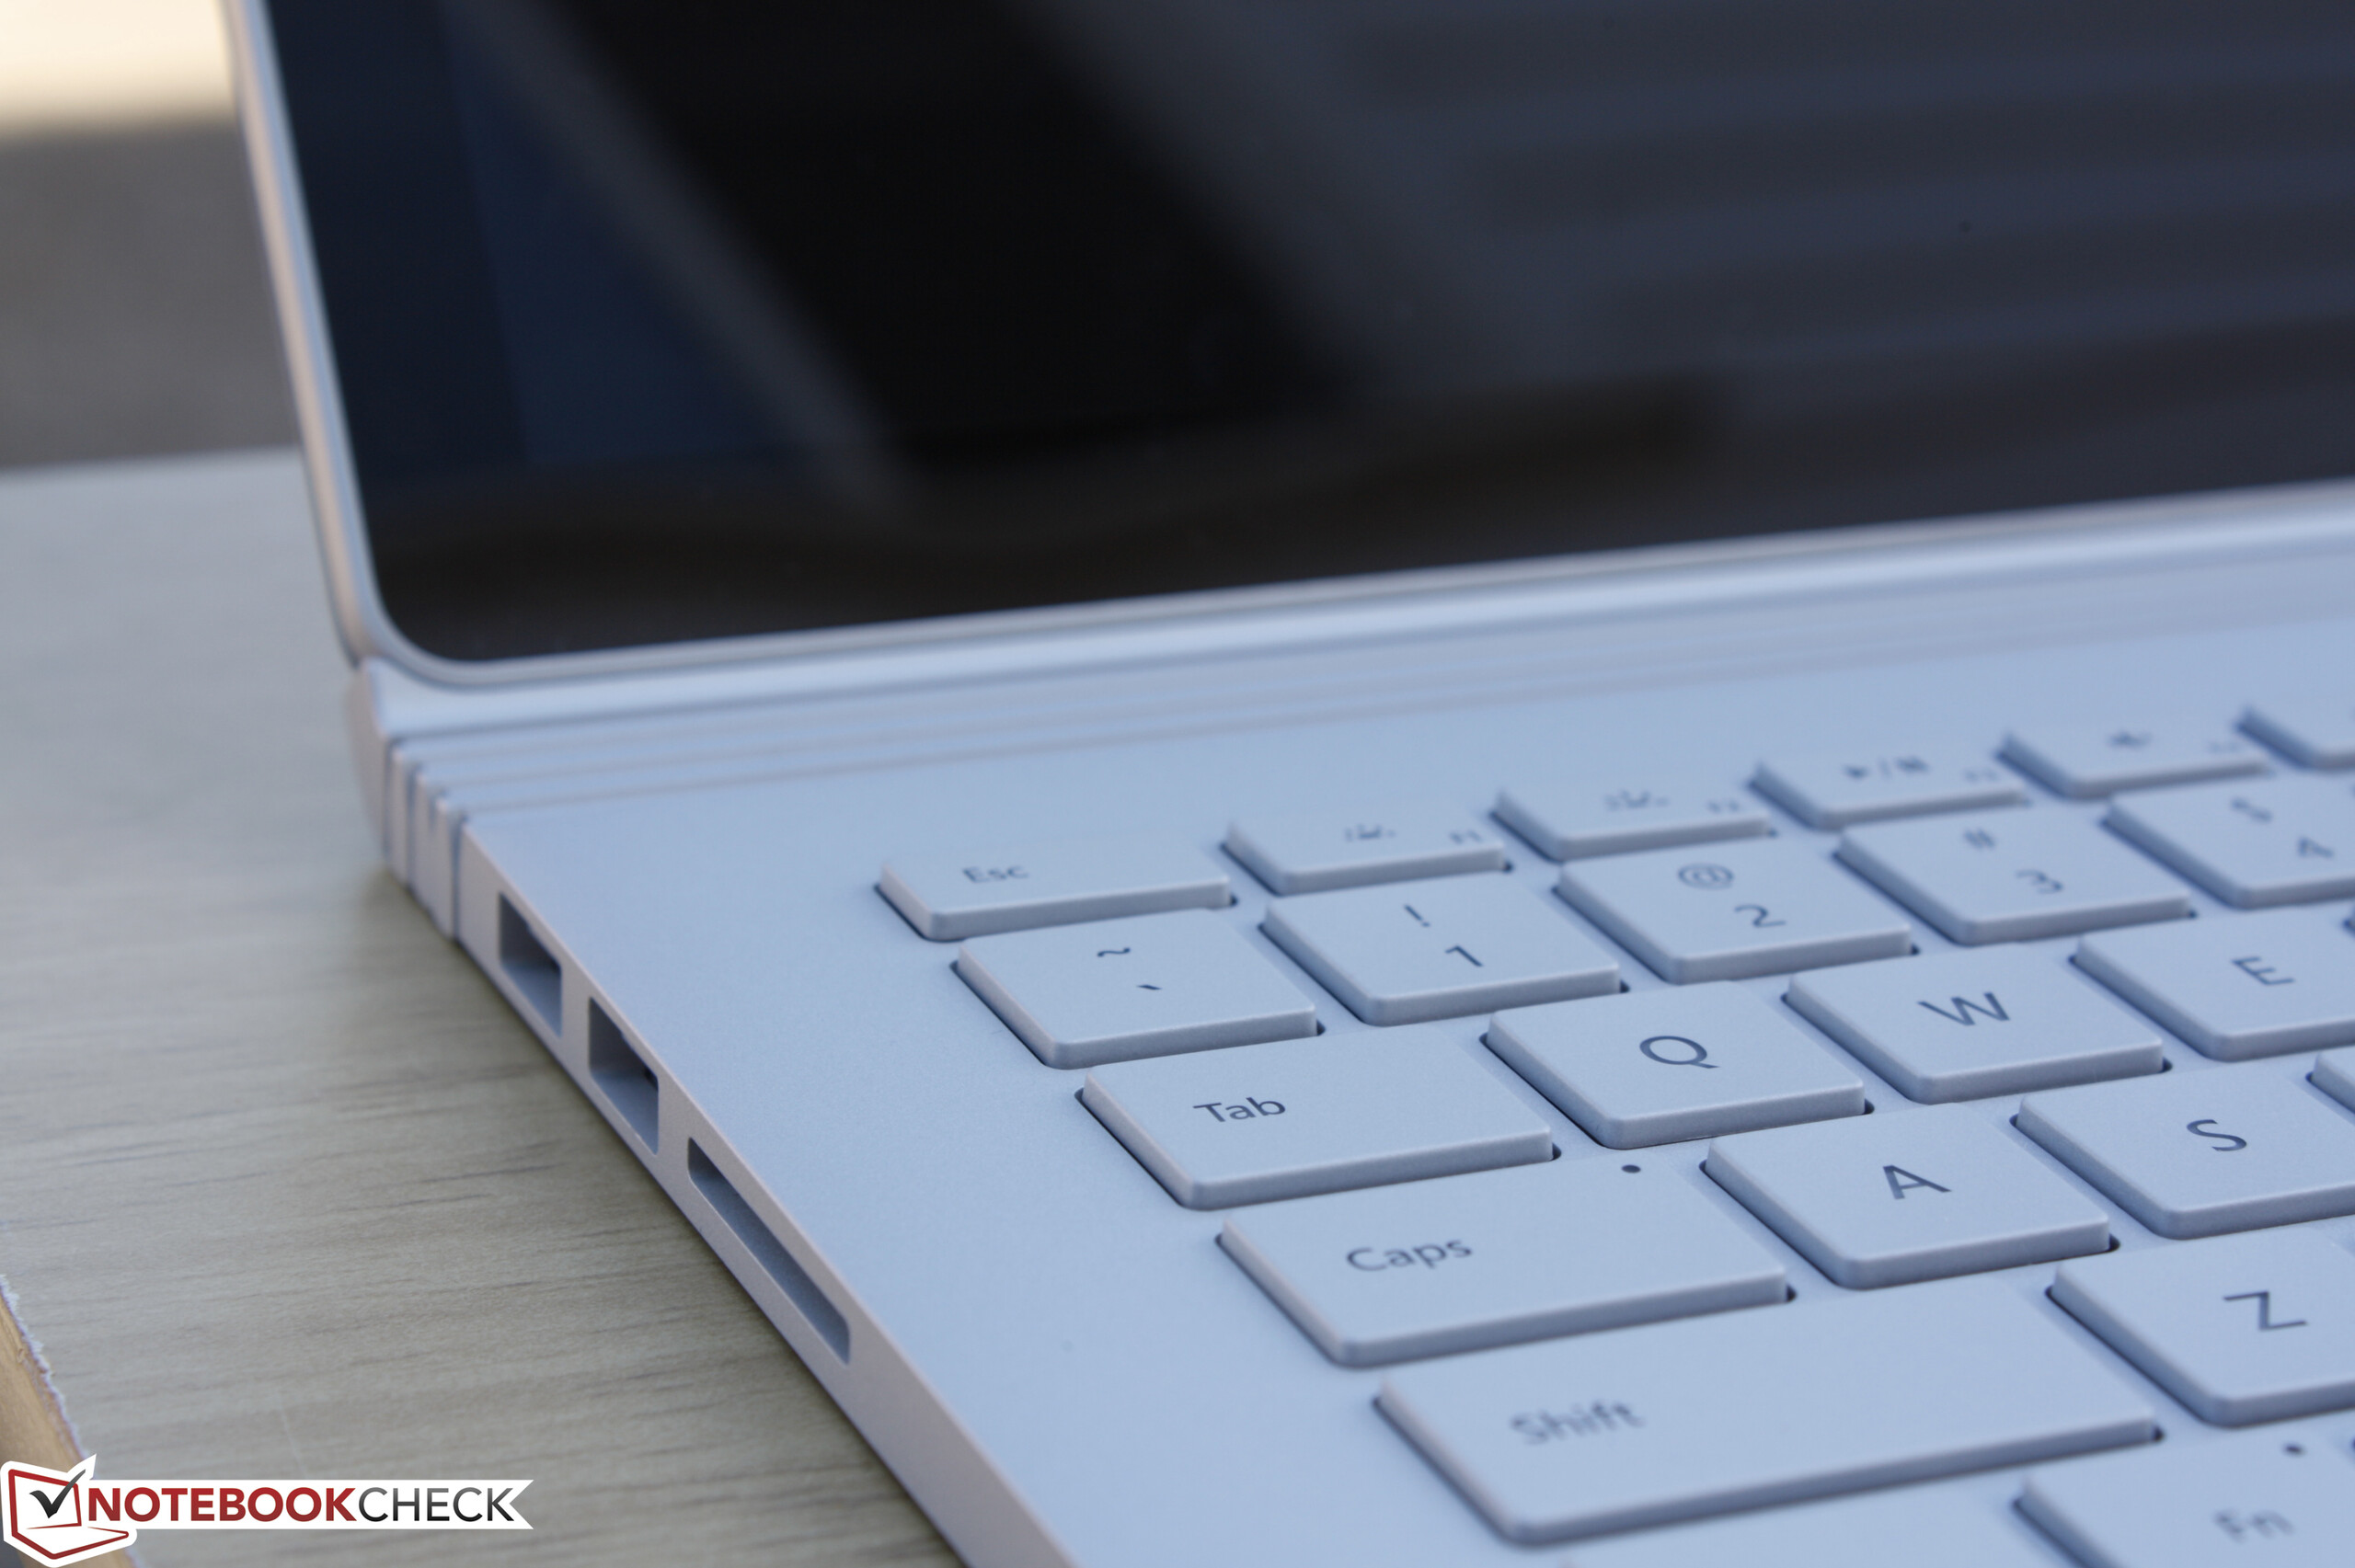
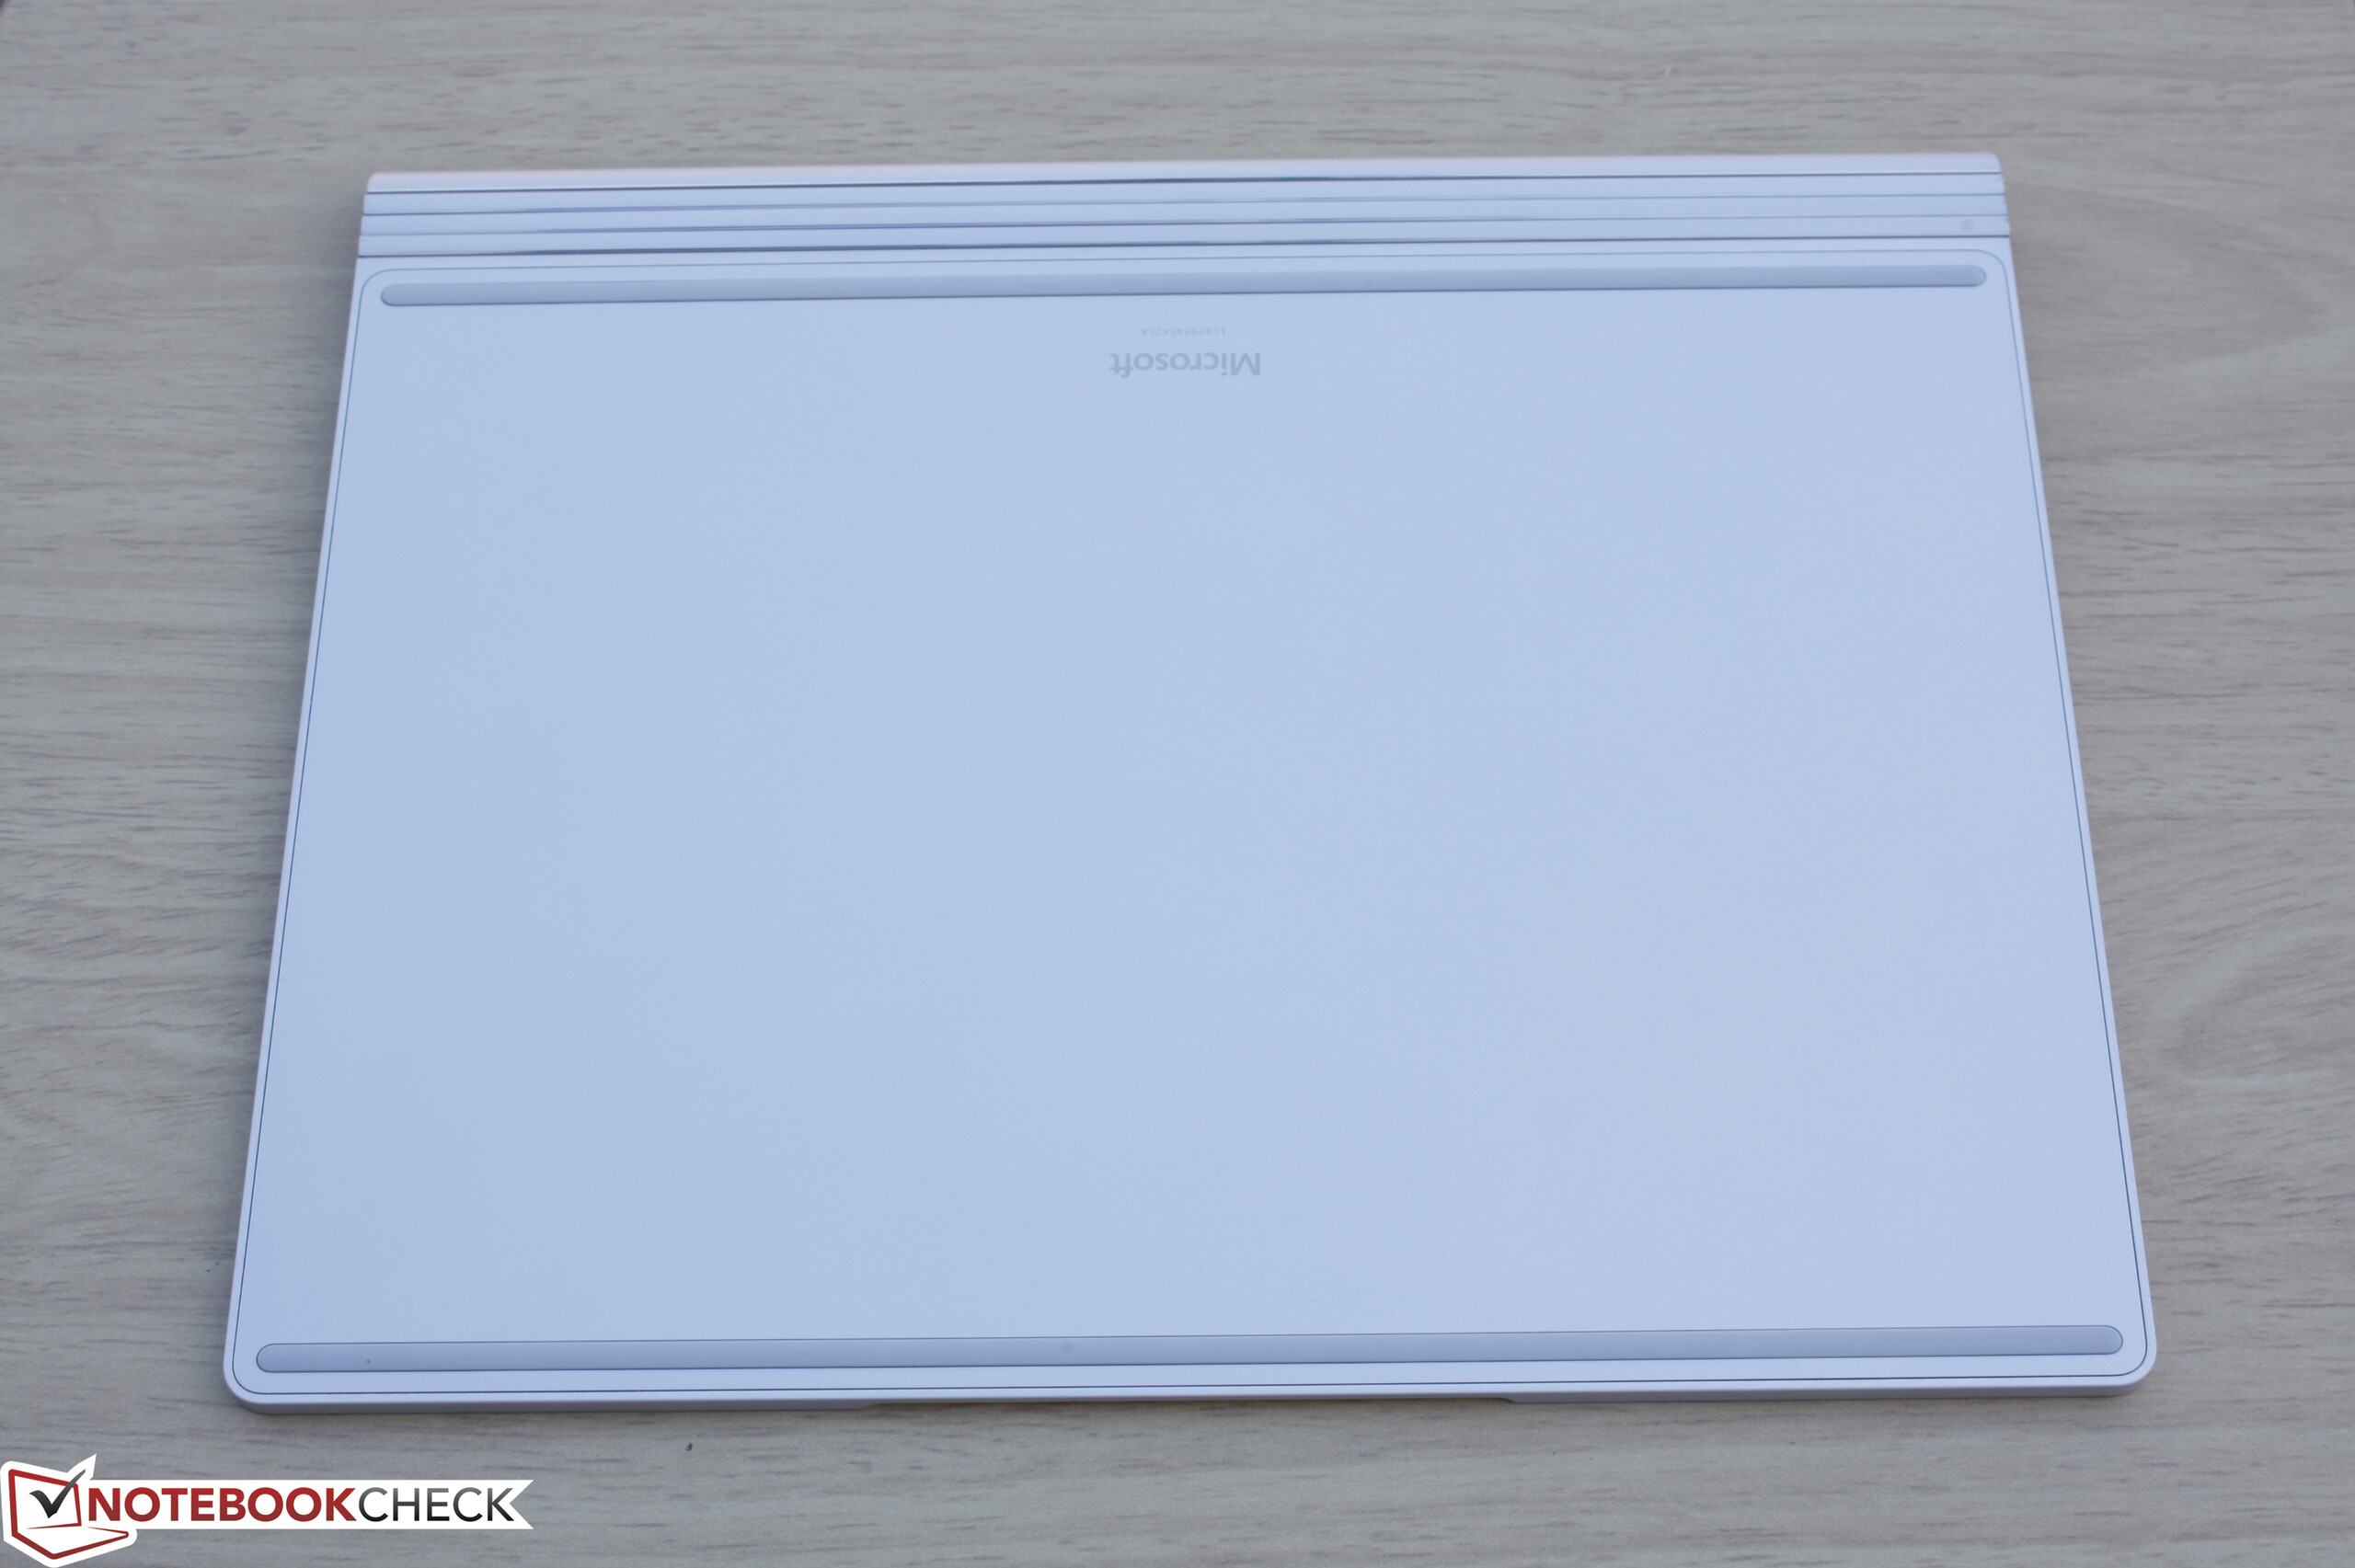
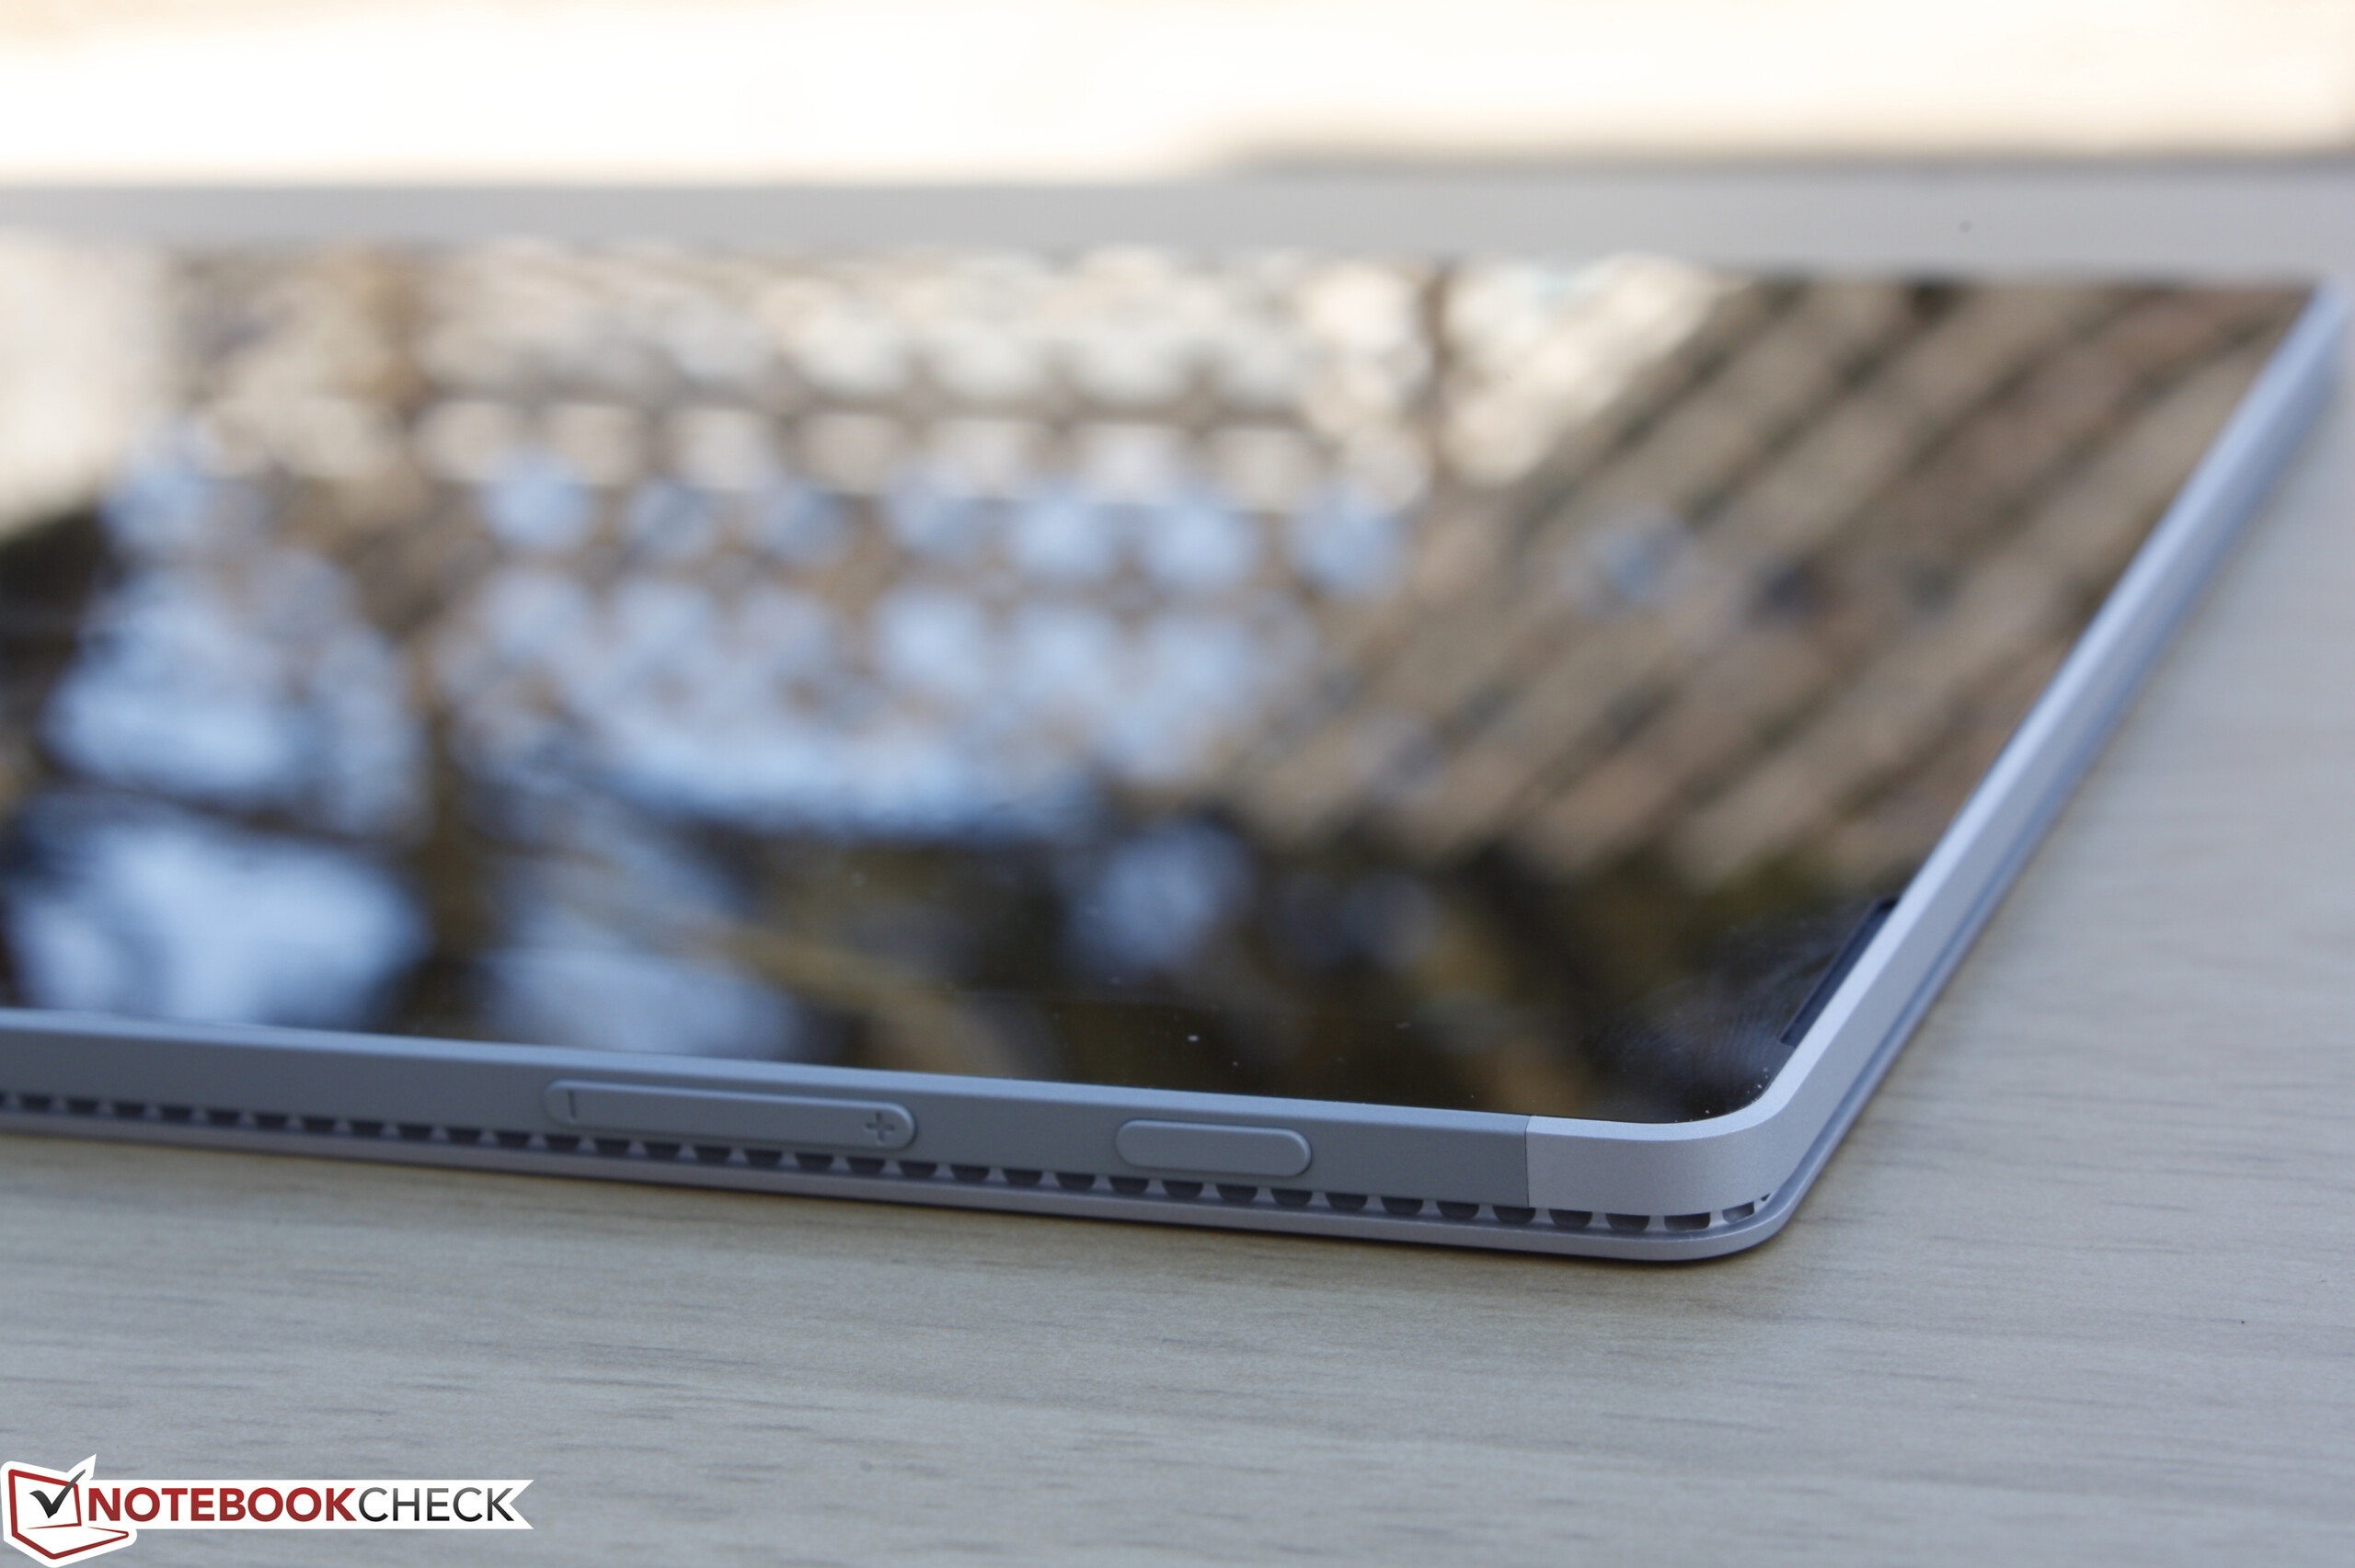
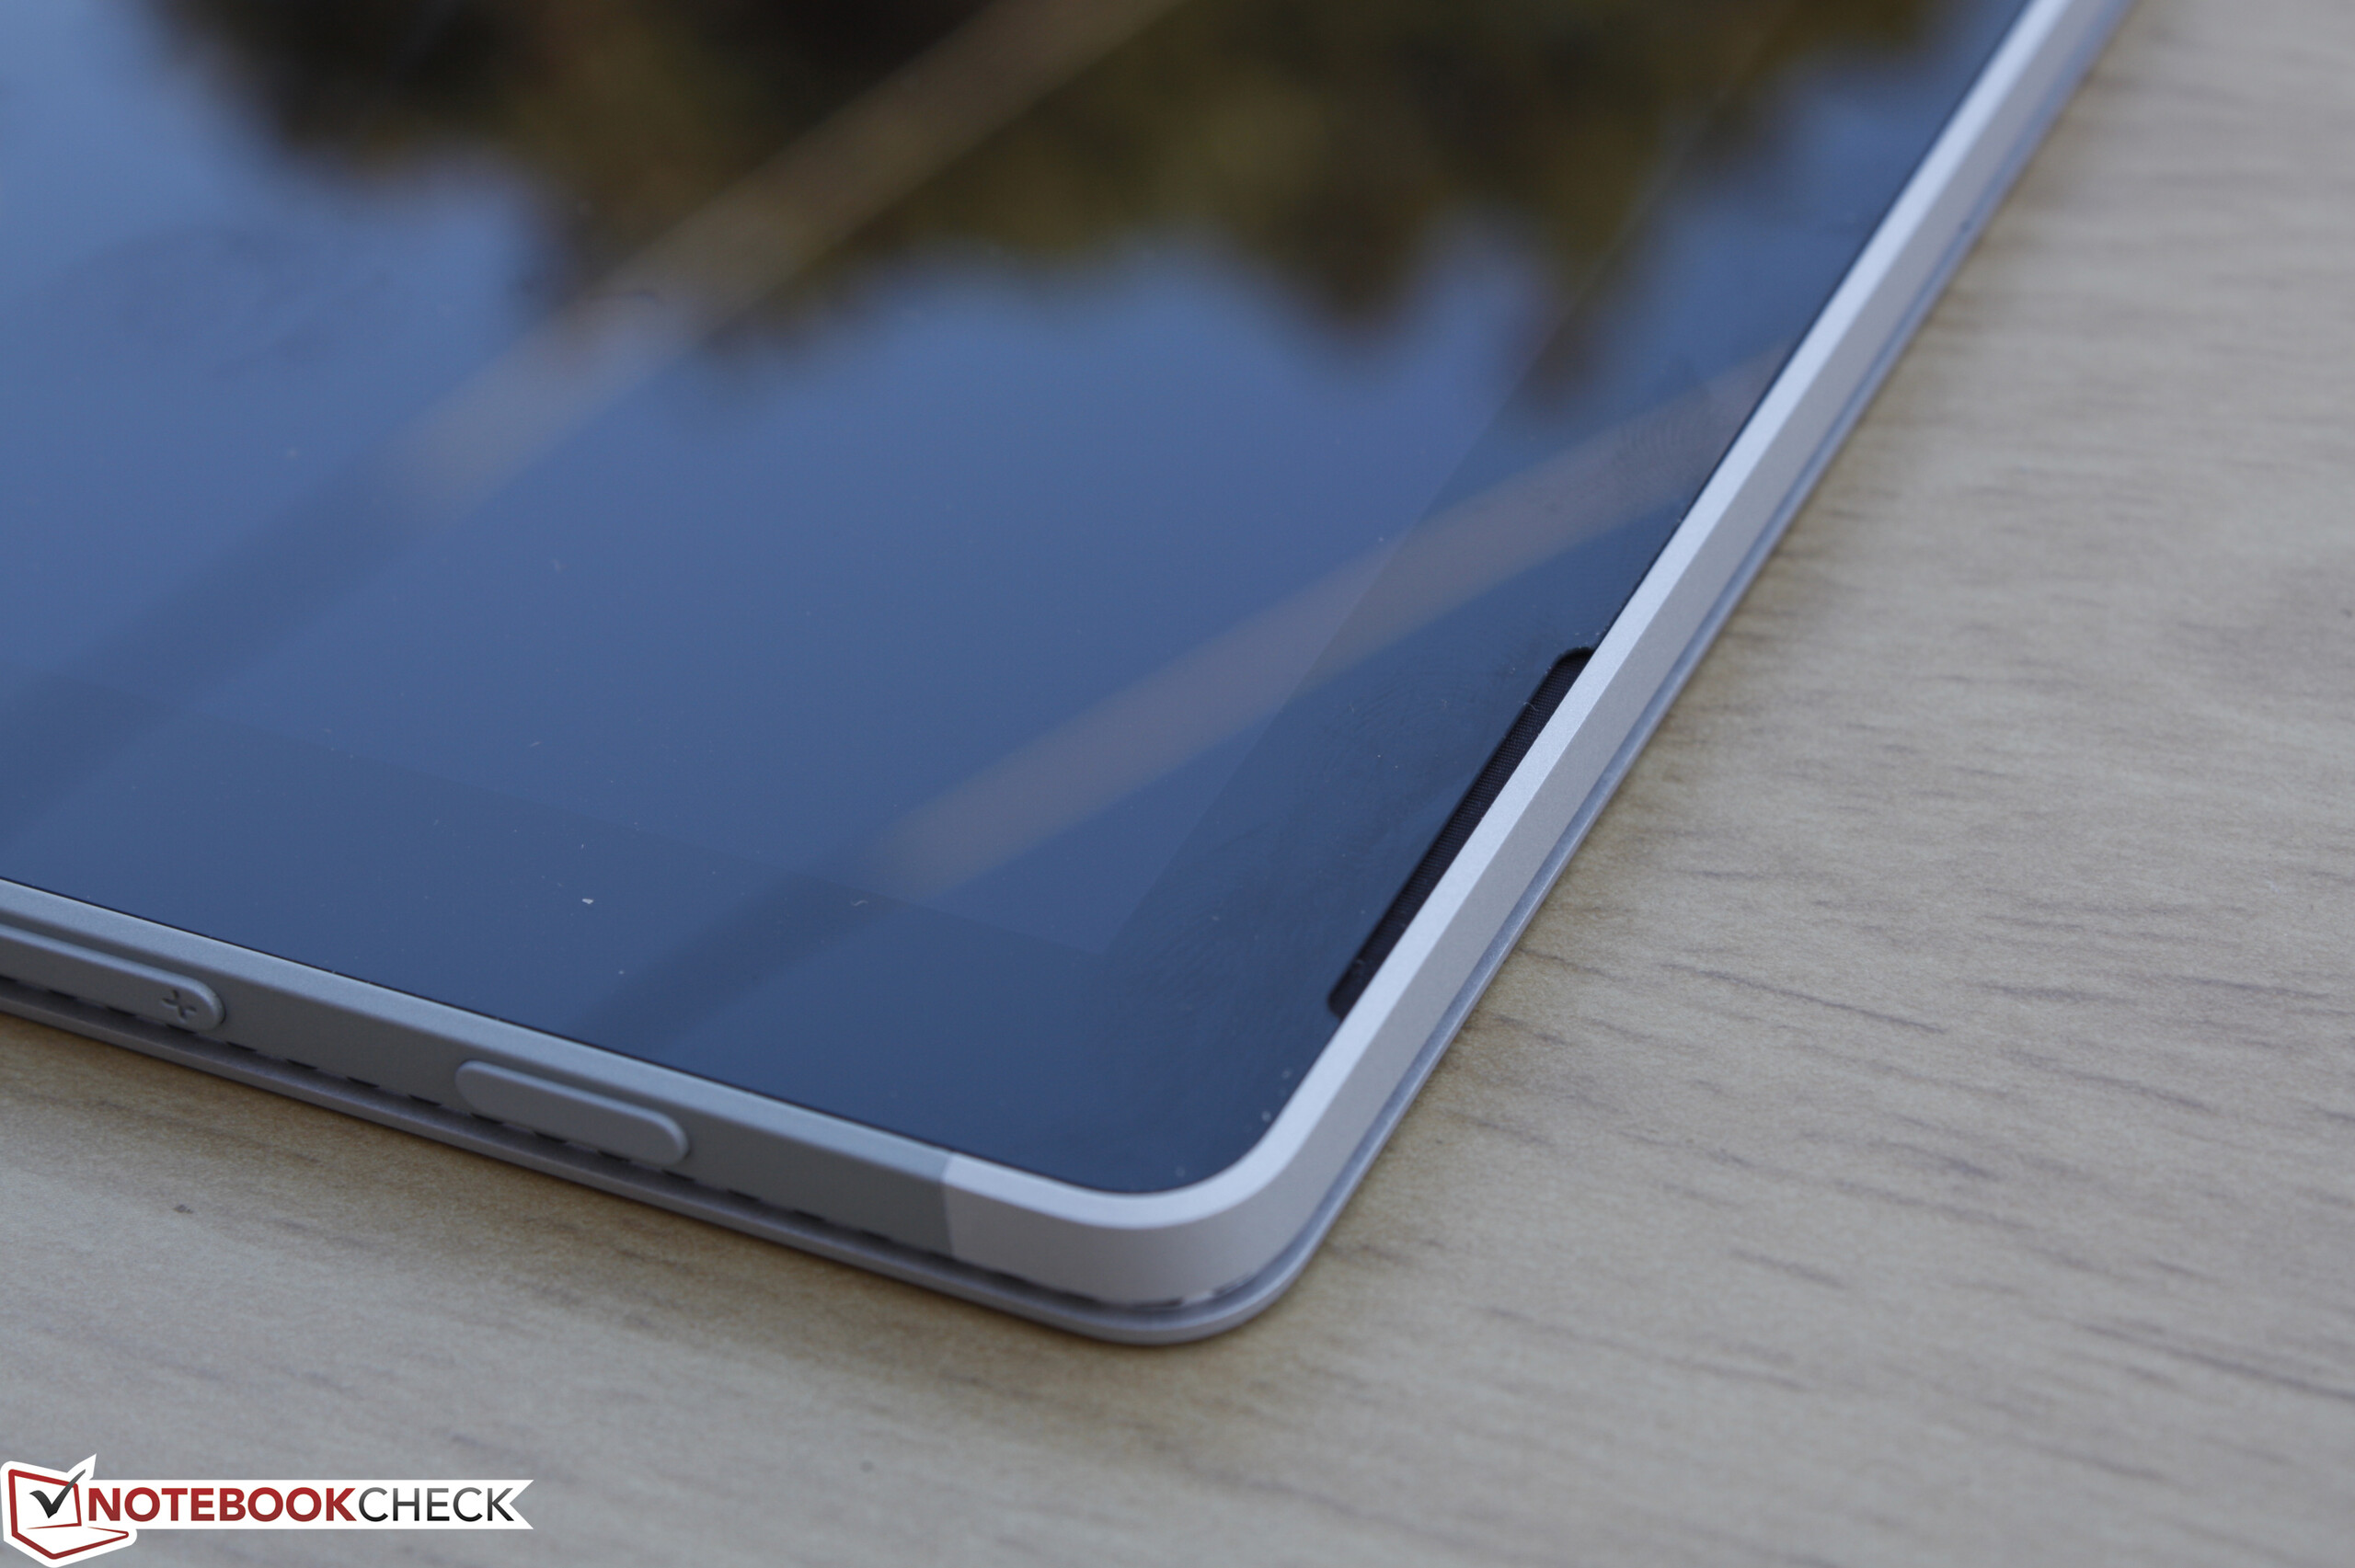
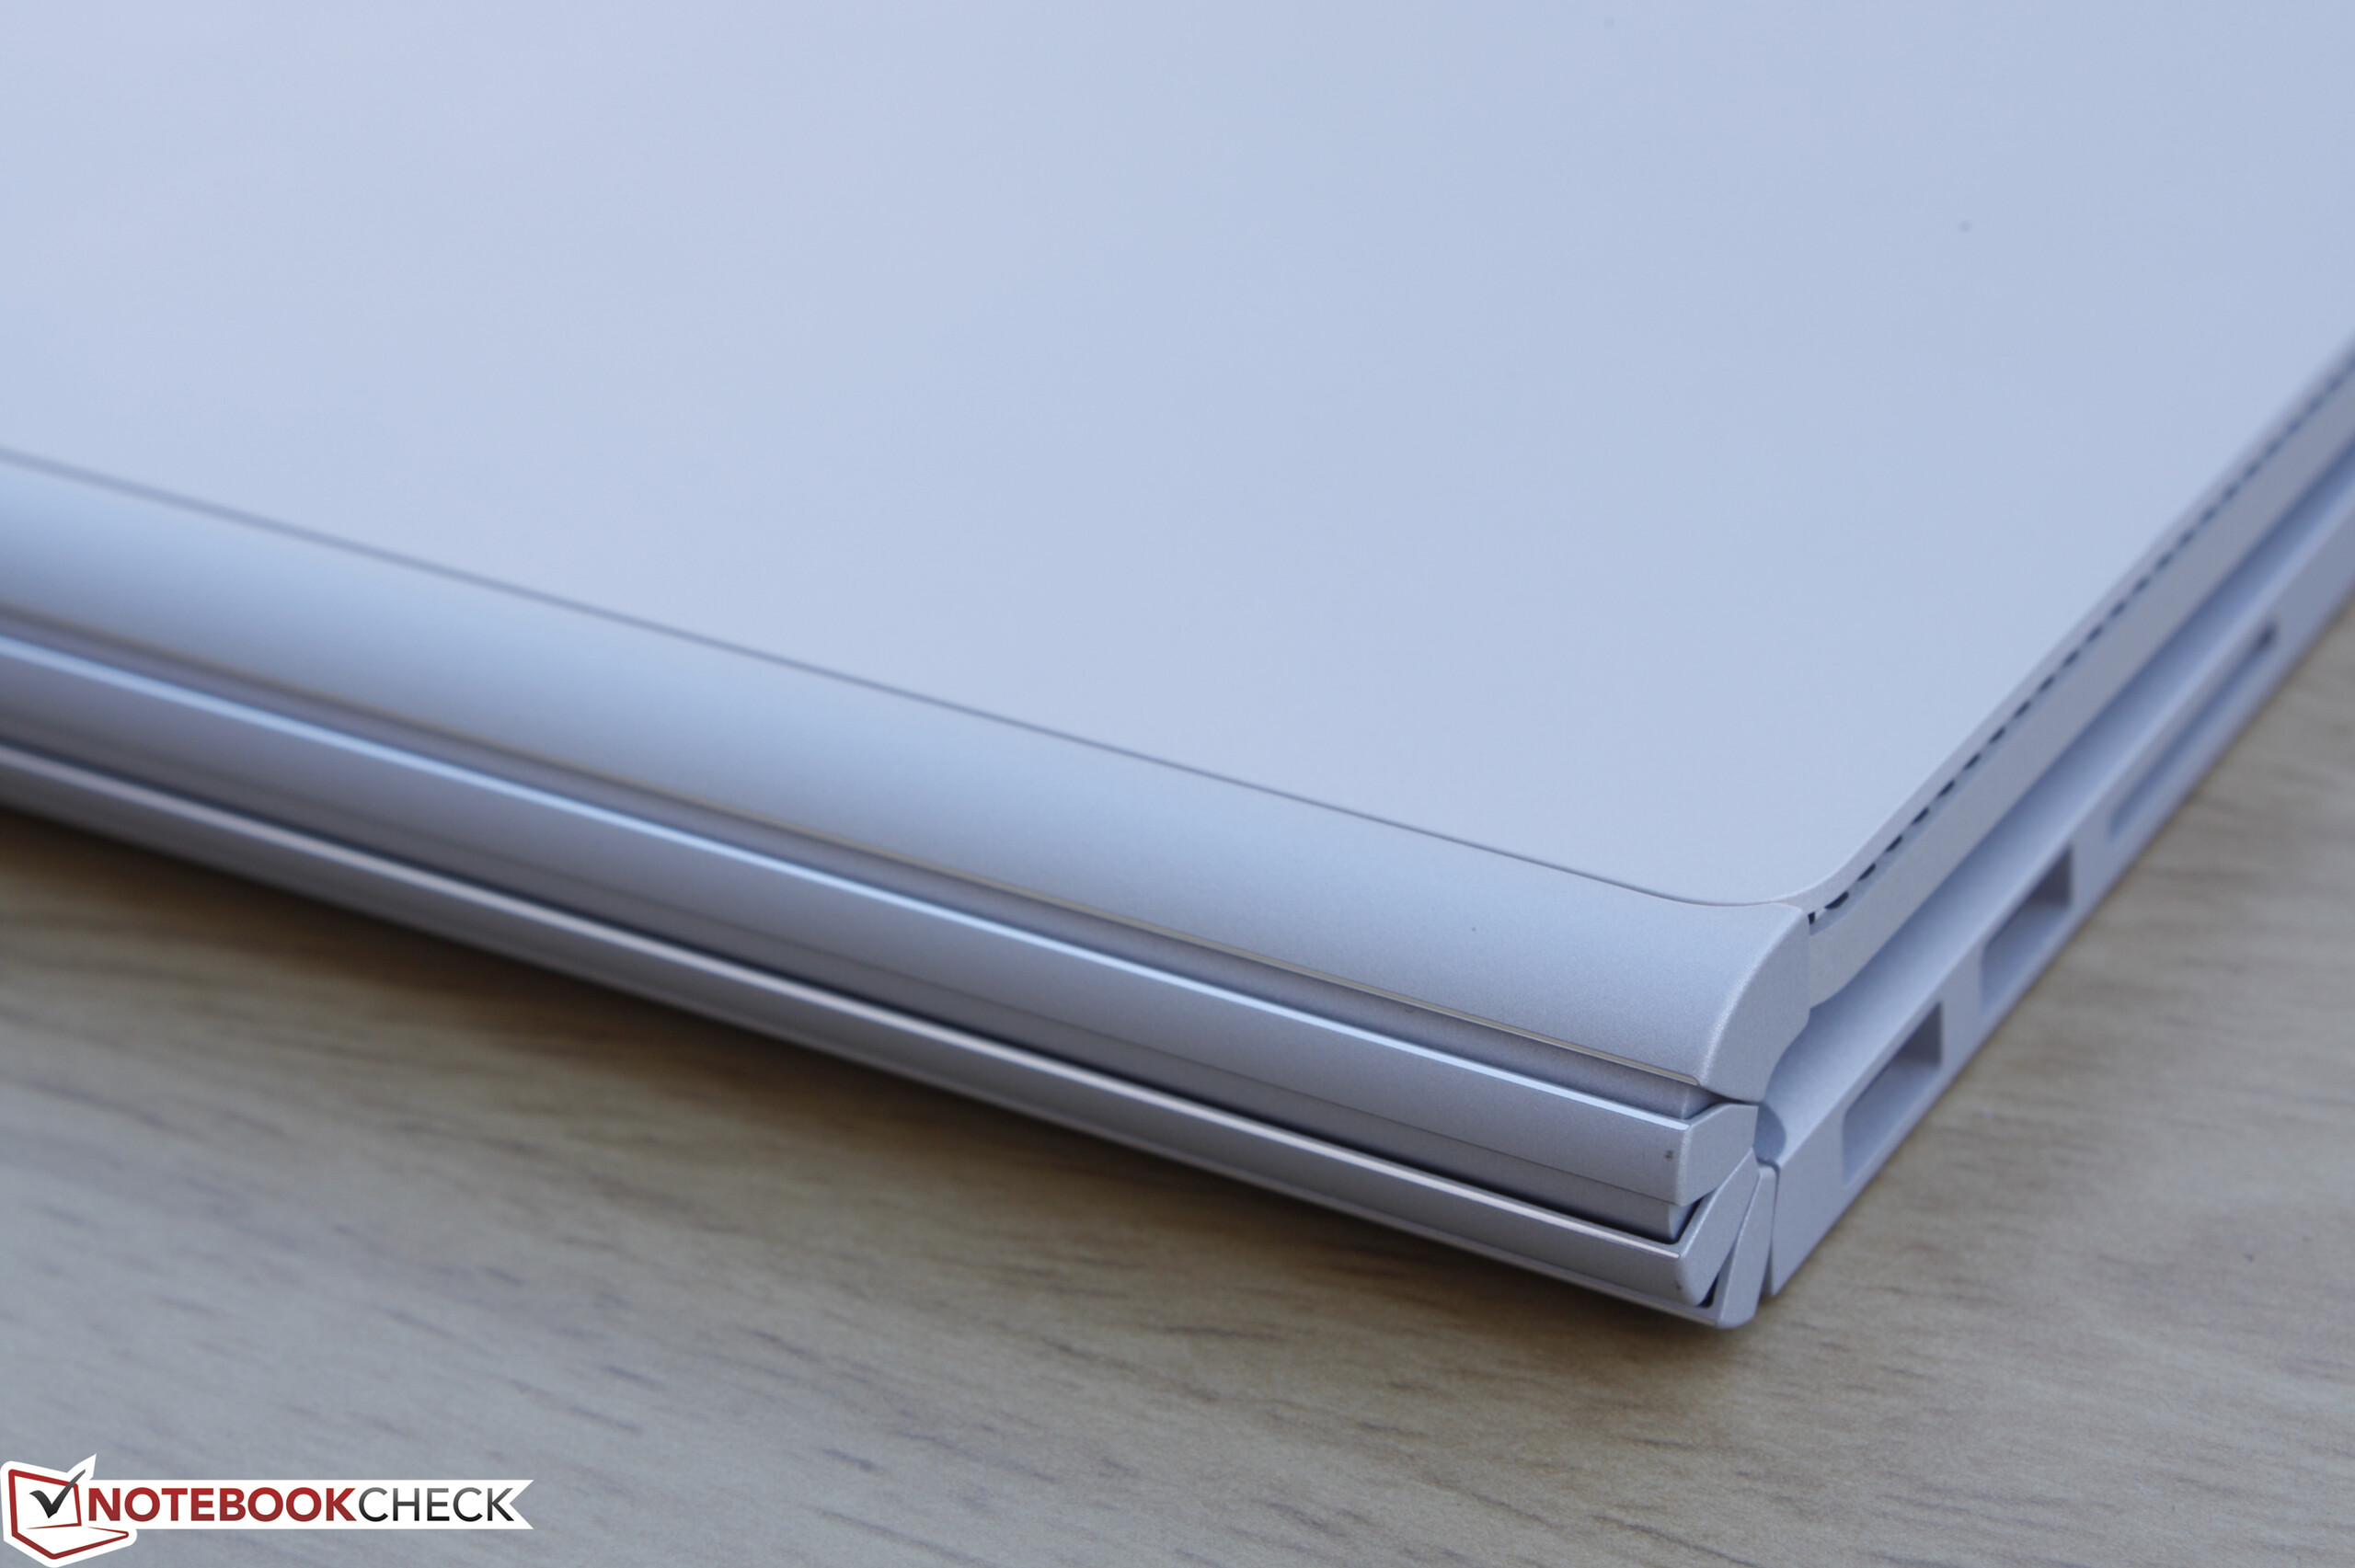
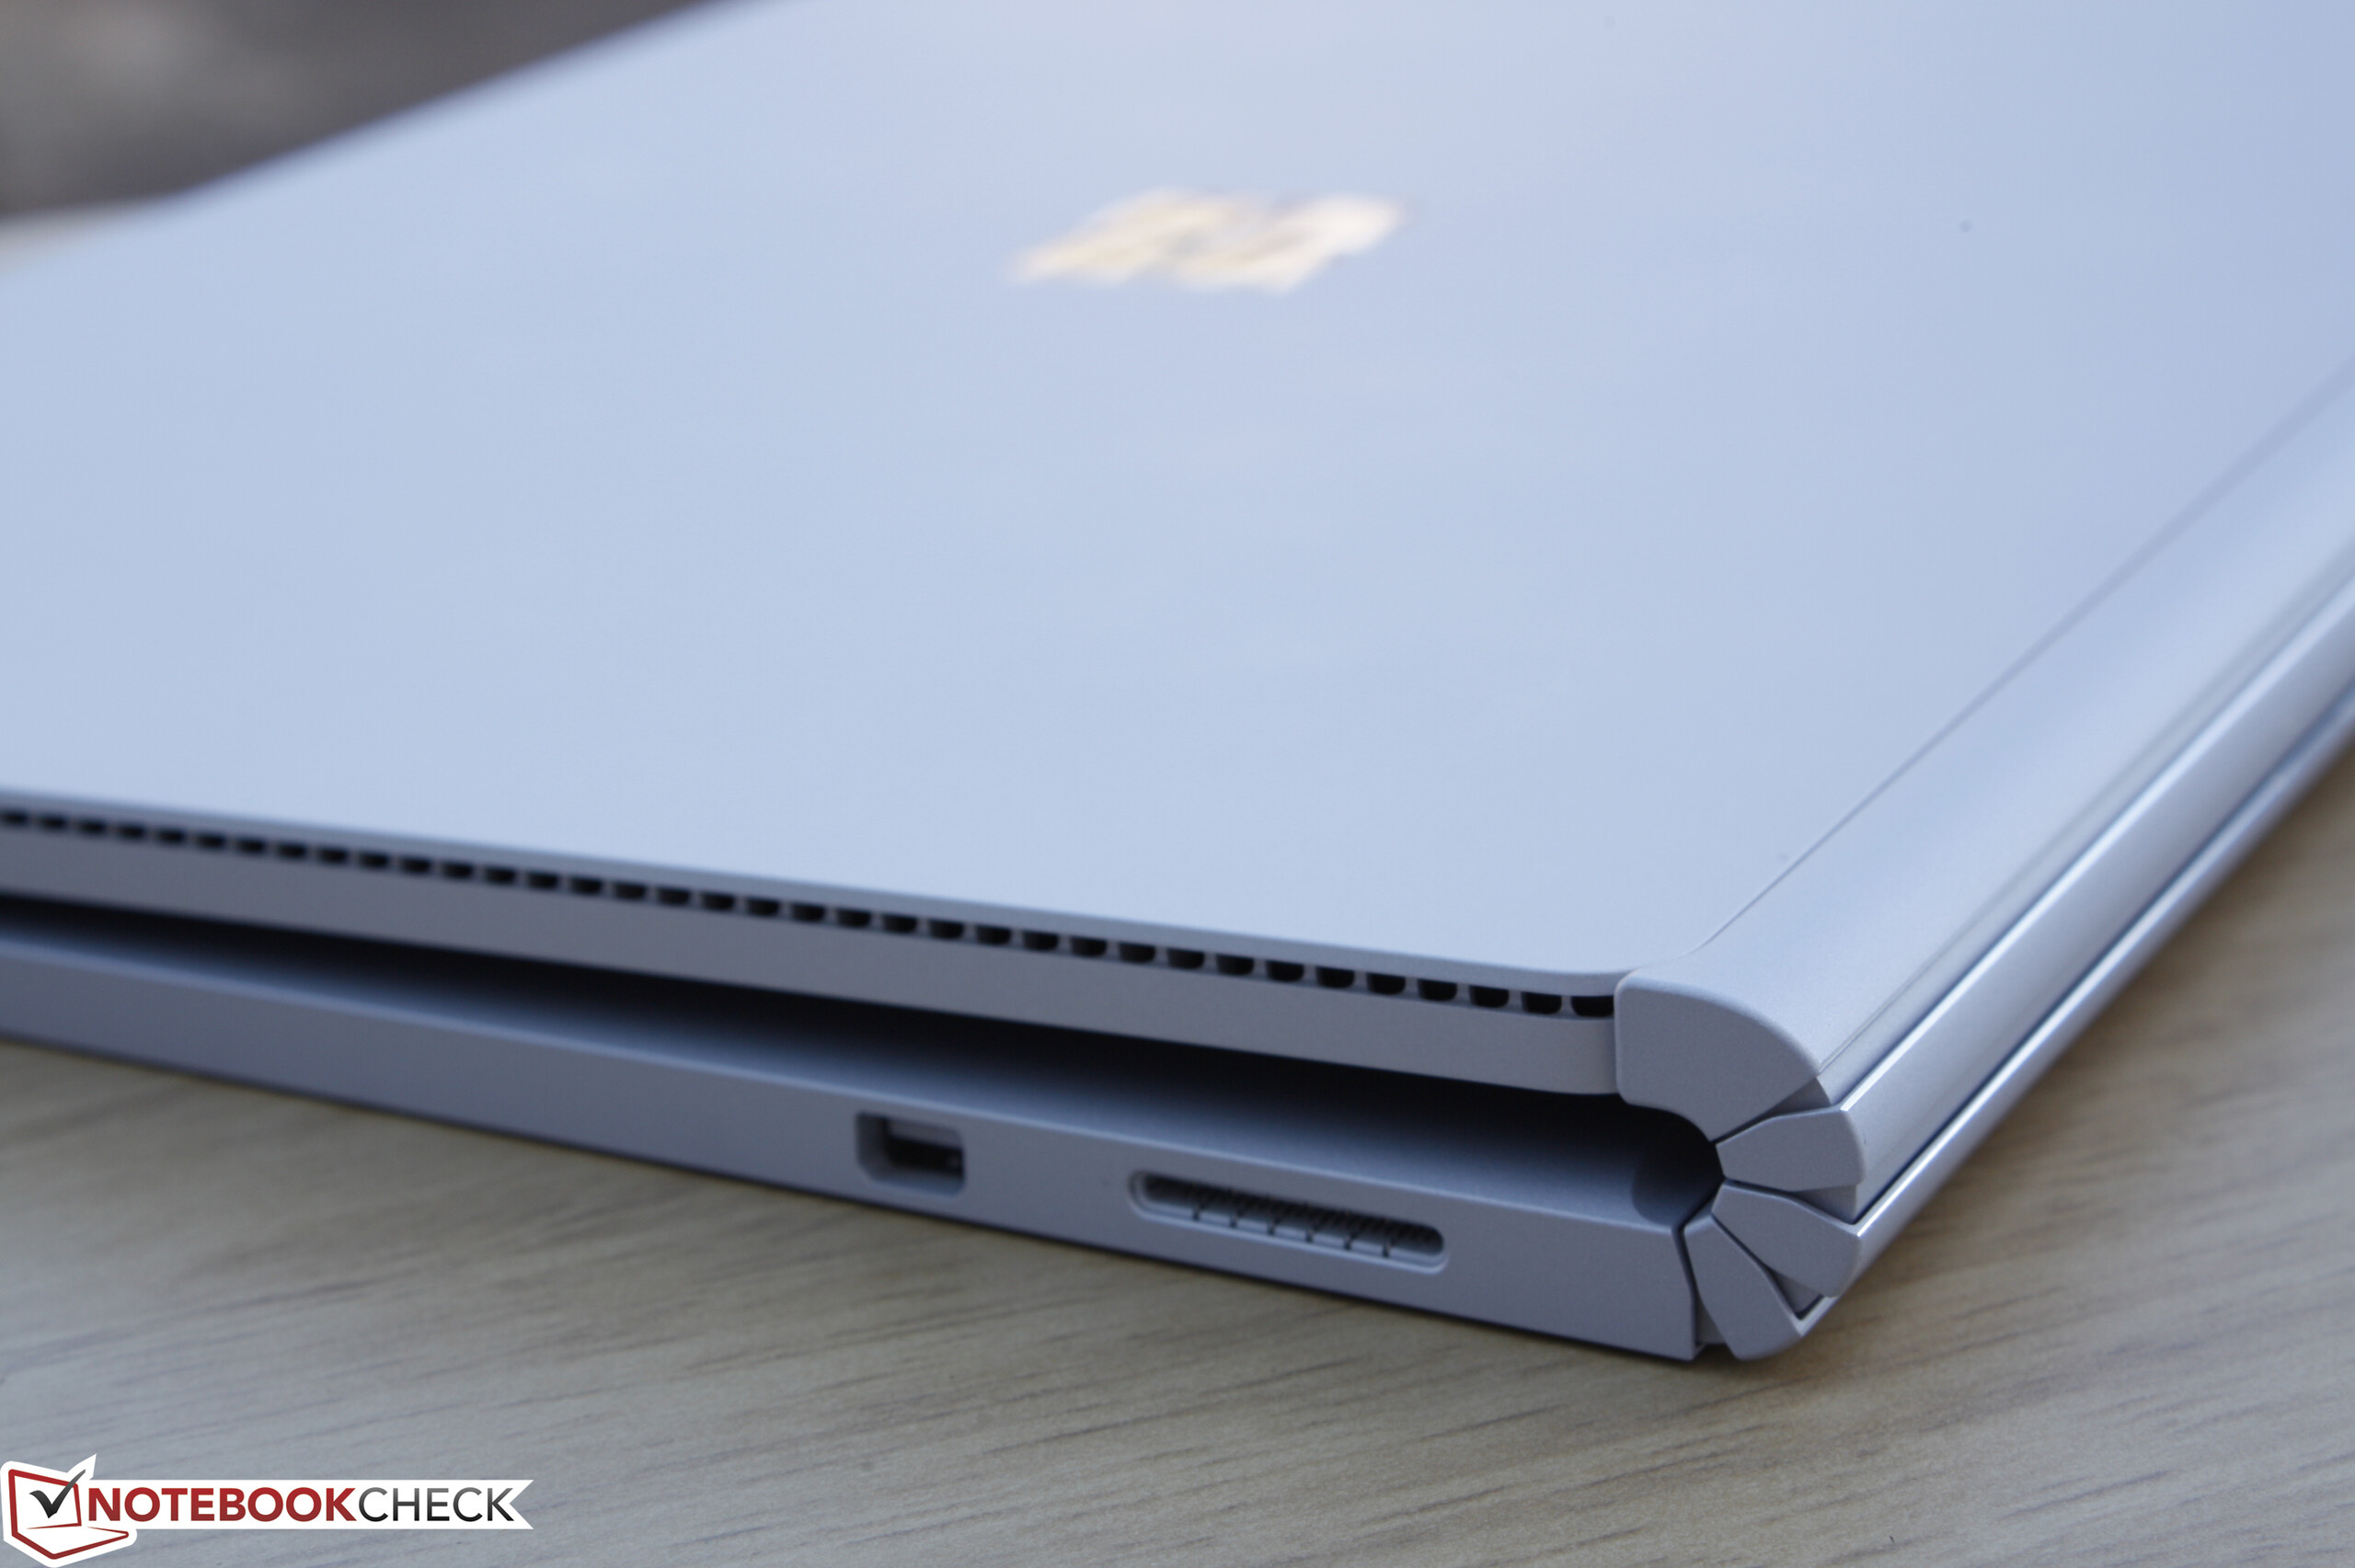
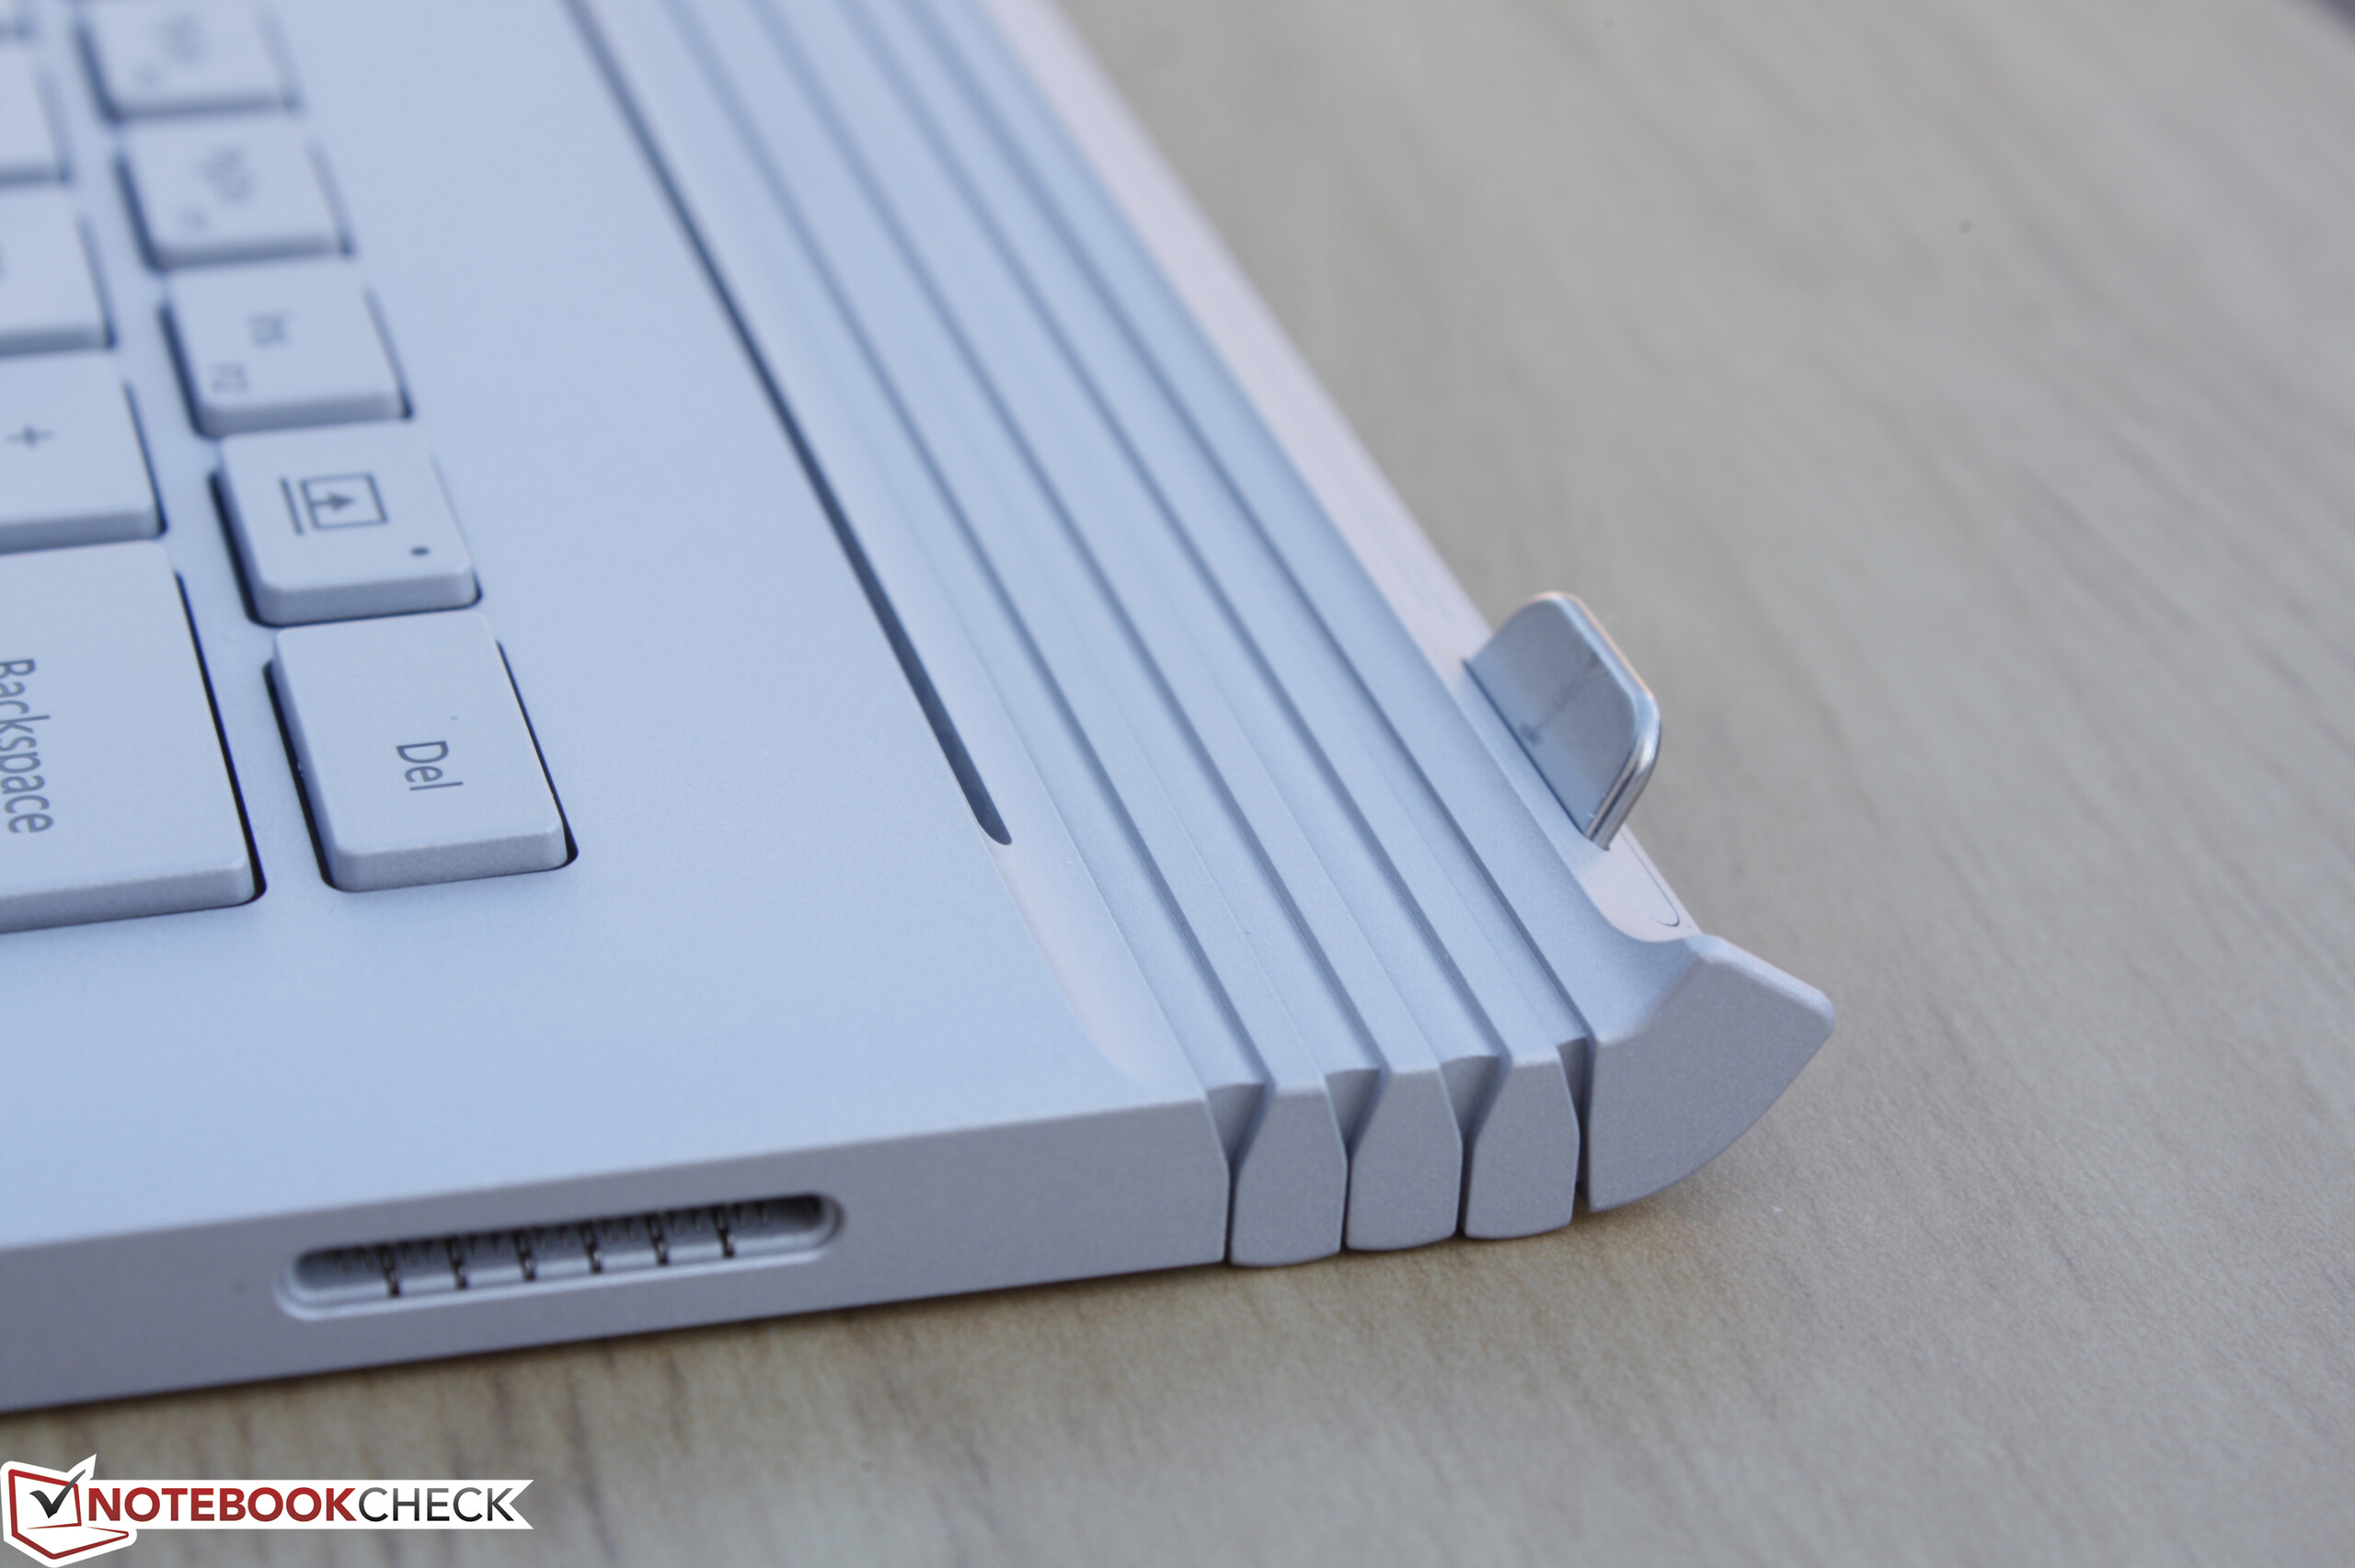
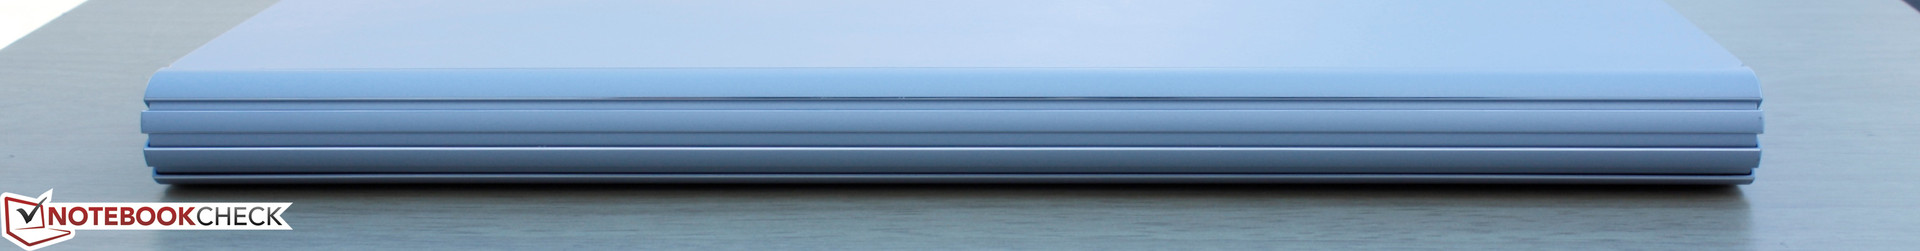
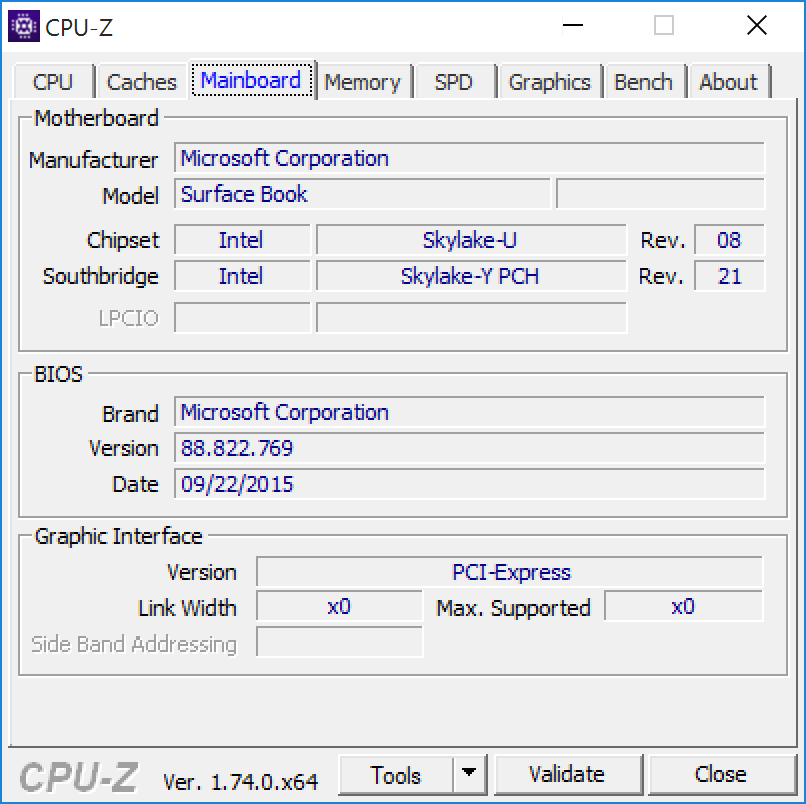
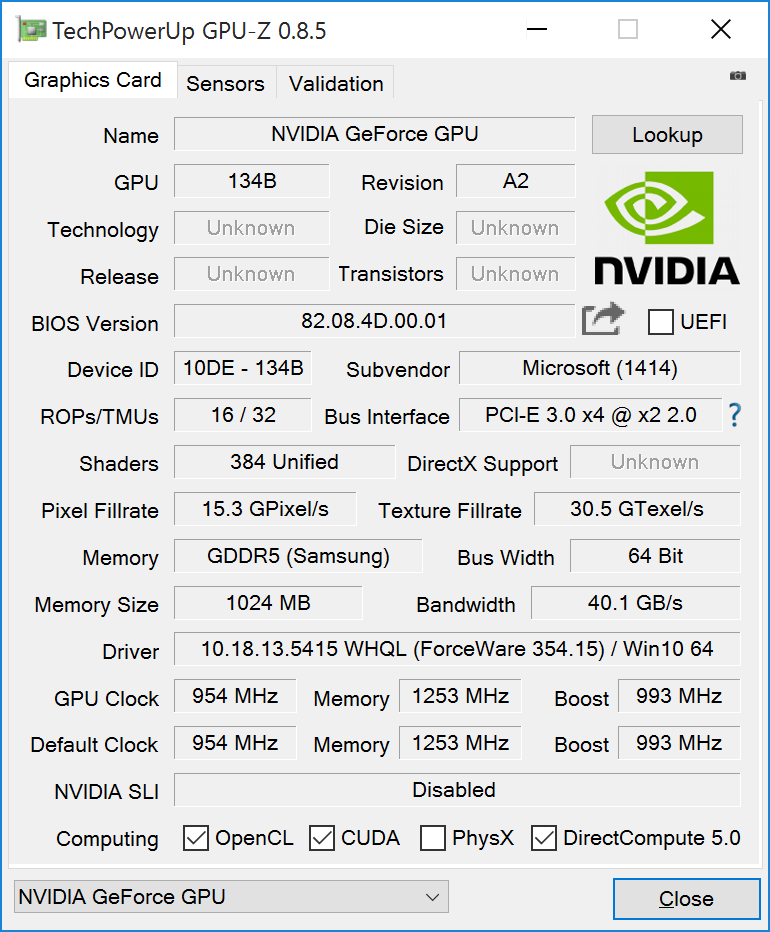
Surface Book是市场上最优秀的可分离式产品之一。它解决了我们所提到了主要问题,它采用了出色品质的机身,手感超越大部分超极本的背光键盘,相对轻盈的窄边框屏幕,独特的Nvidia显卡提供了笔记本级的性能。除了一些接驳处的小问题,Surface Book在大部分方面都无可挑剔。锁链式的转轴的主要问题是让笔记本无法在传统意义上完全合上,可能不够美观。不过相比其它可拆卸设备例如Transformer Book Chi或Toshiba Portege Z20t的扣合式及磁铁式接合机制在实用性上更强。作为1500美元的设备,它在硬件品质上毋庸置疑。
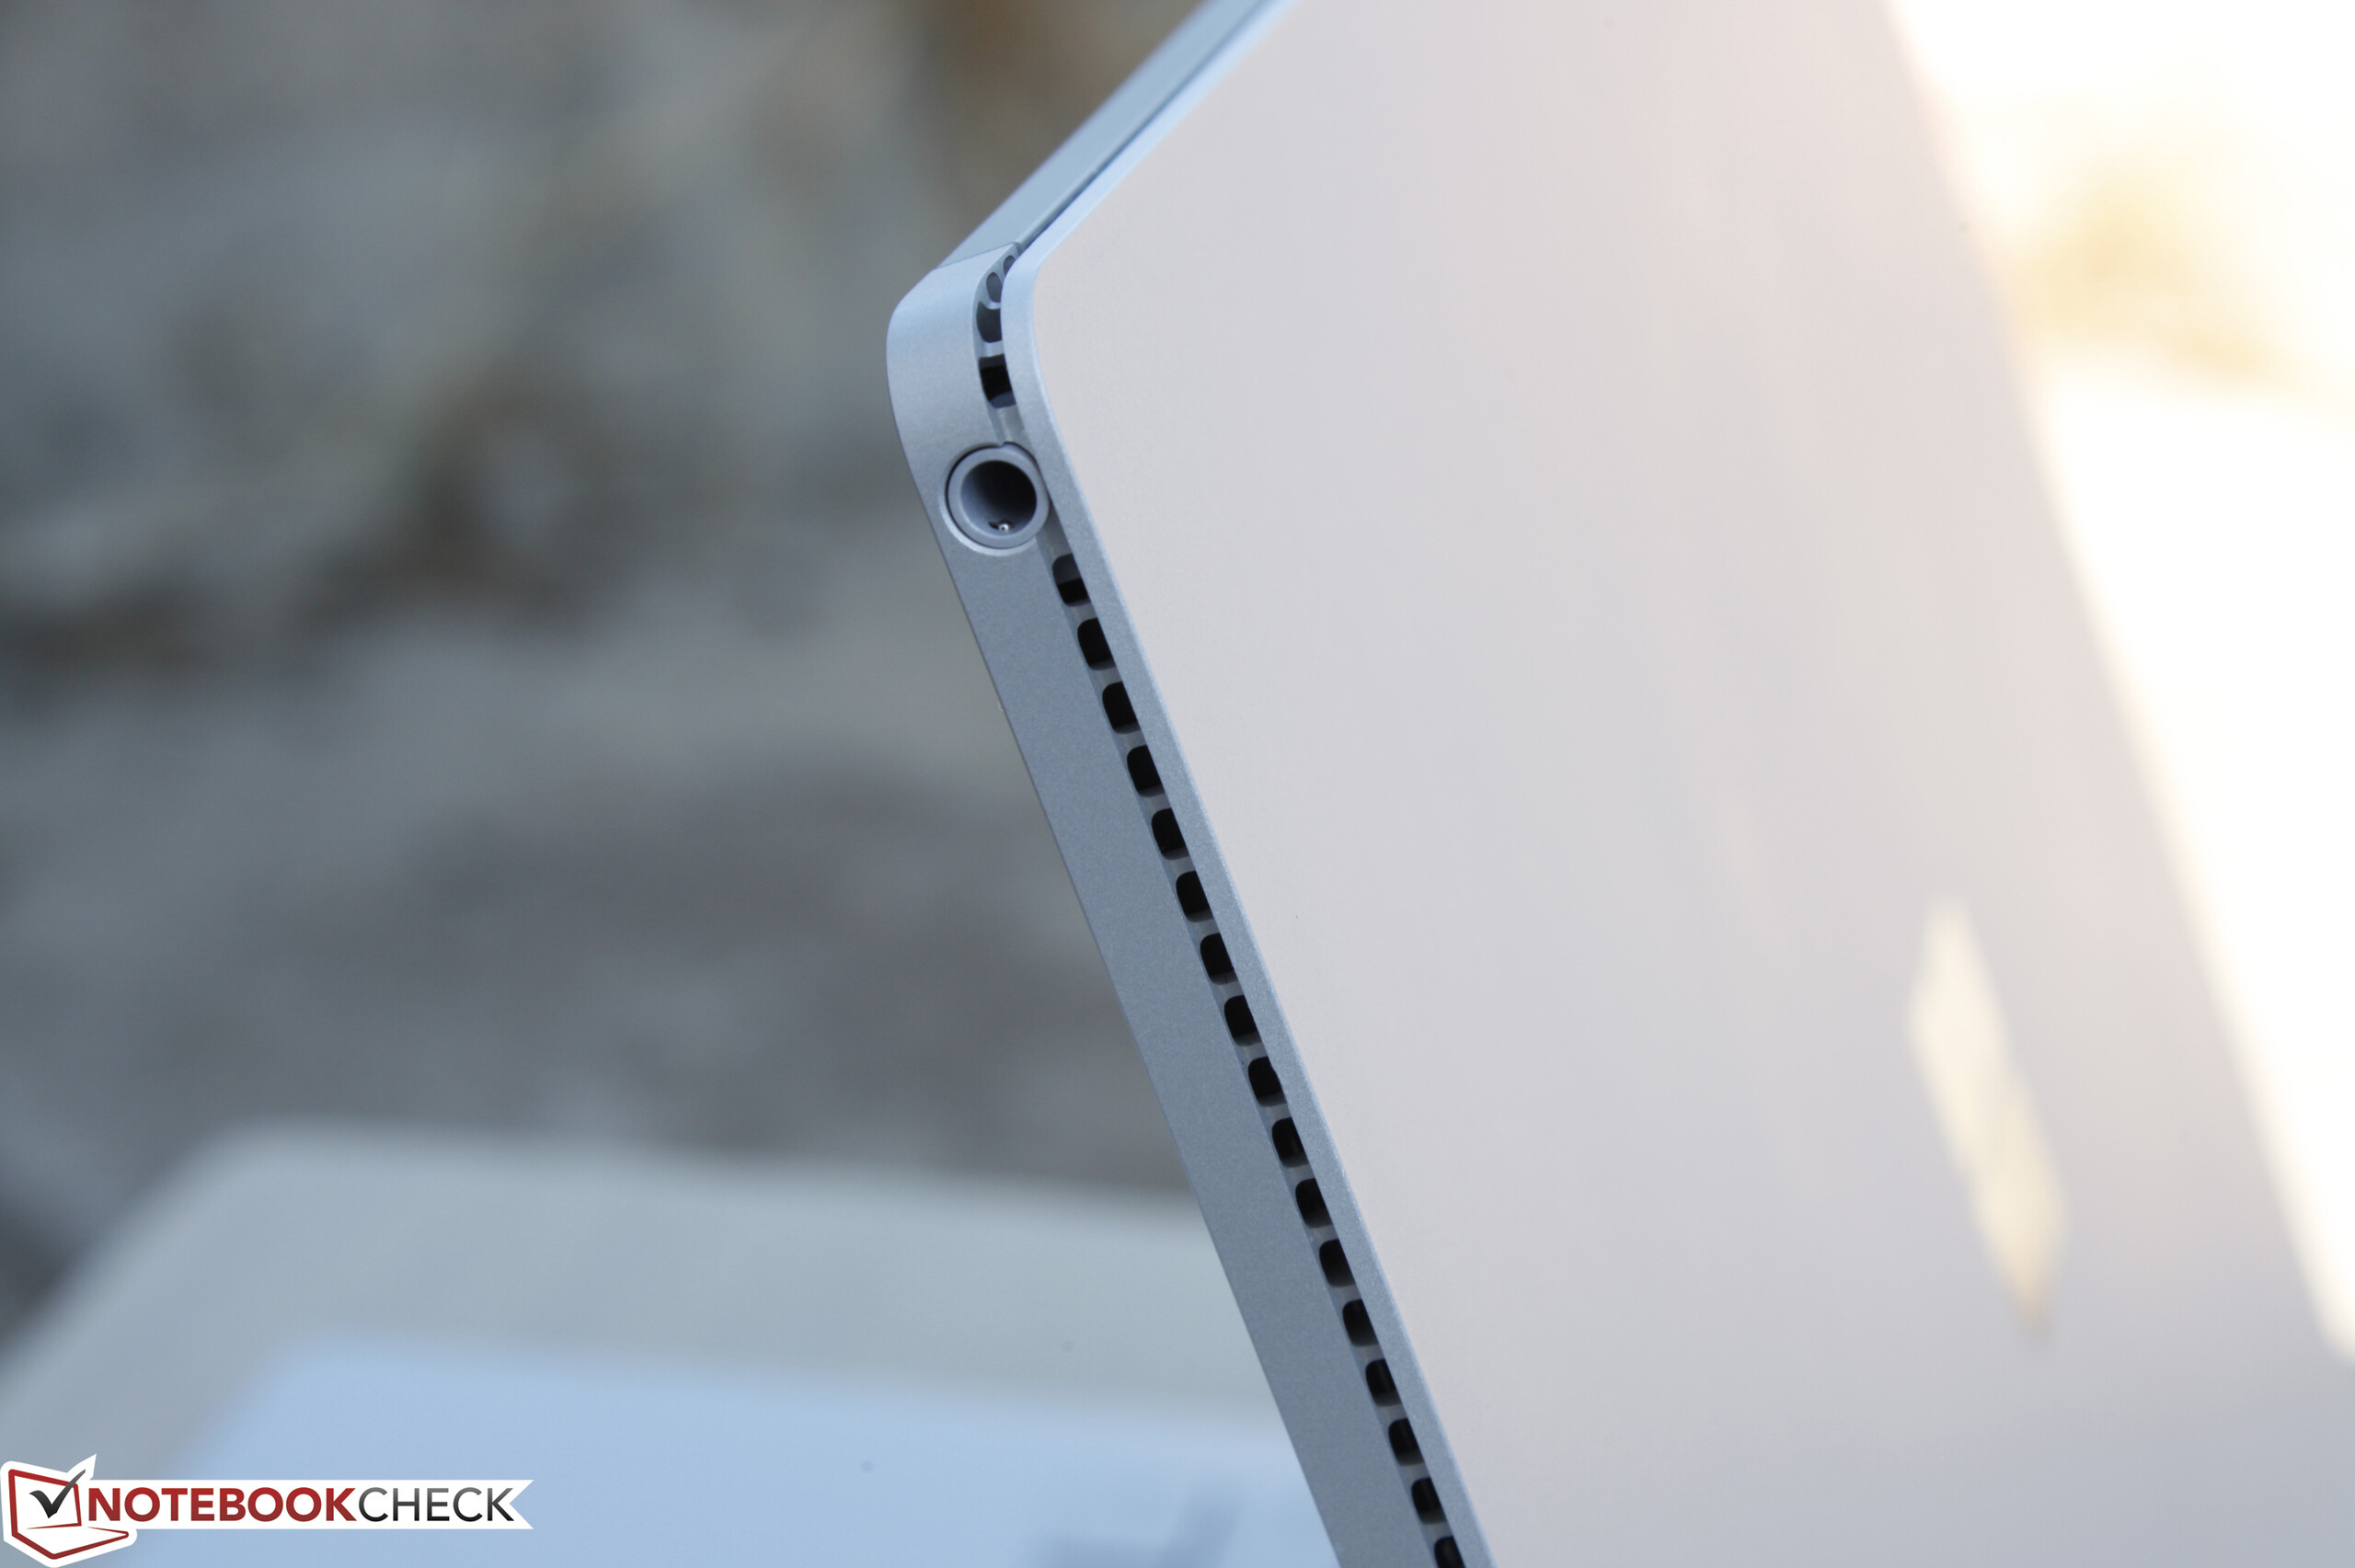
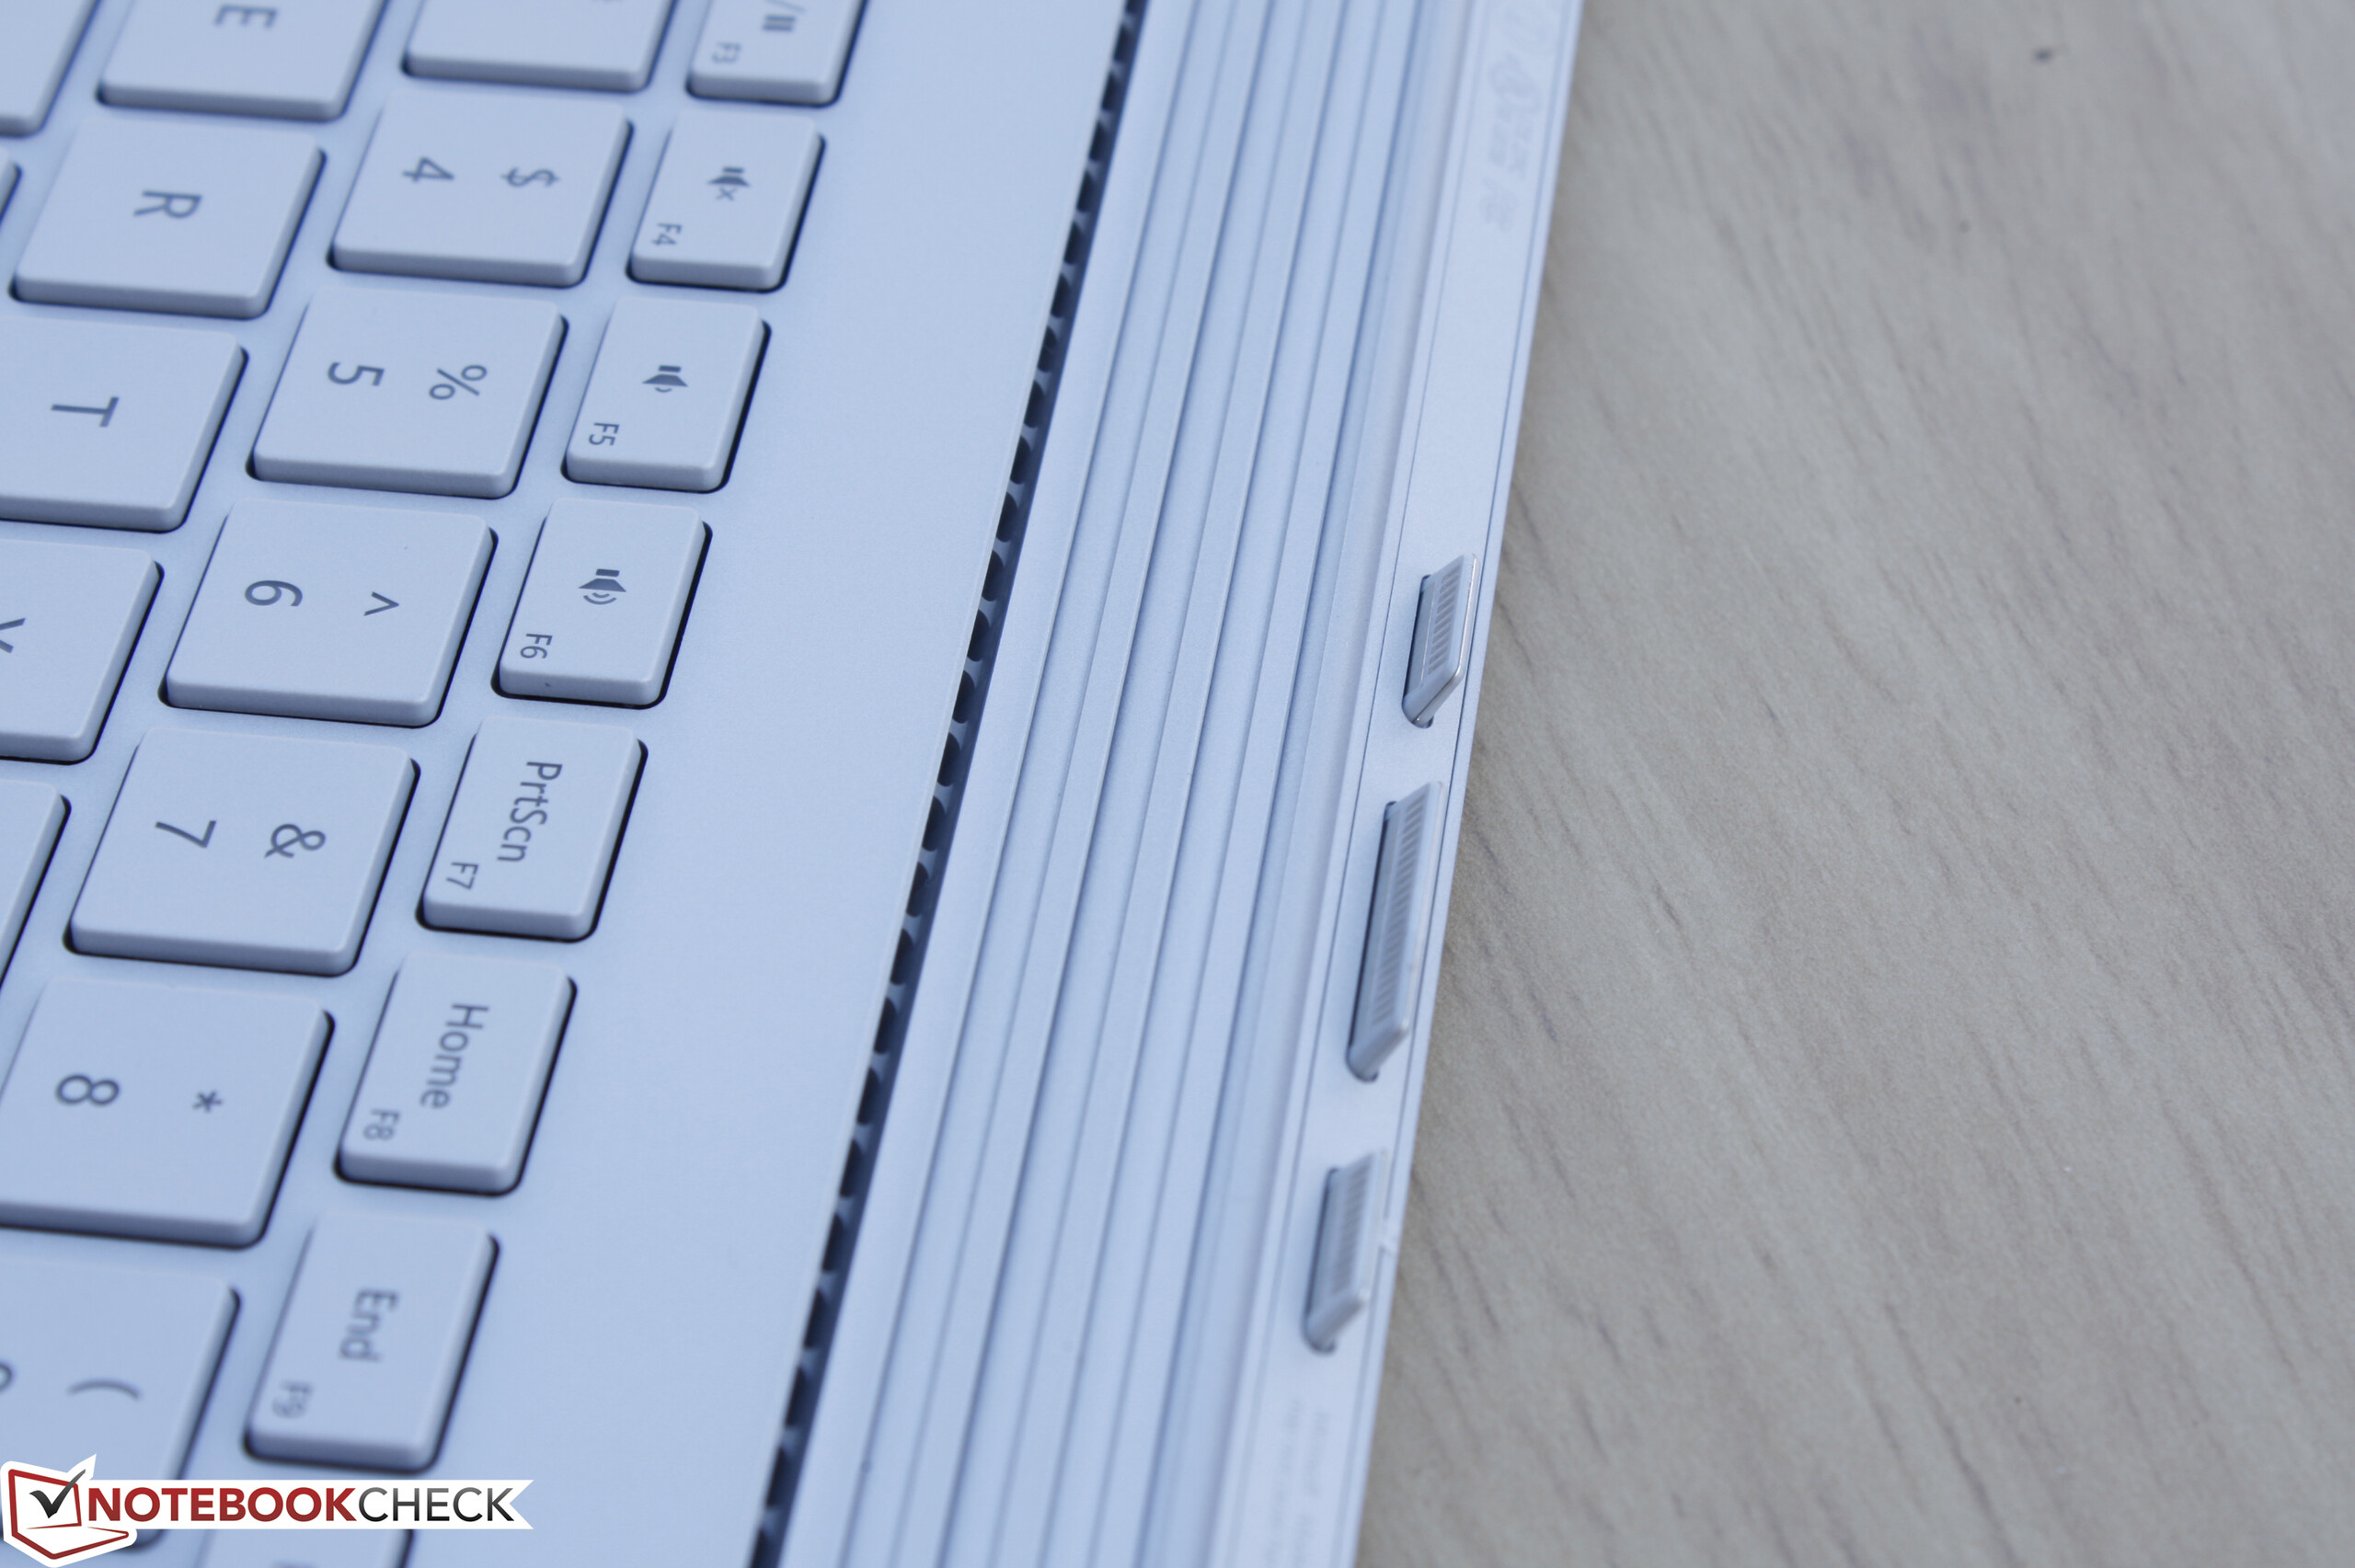
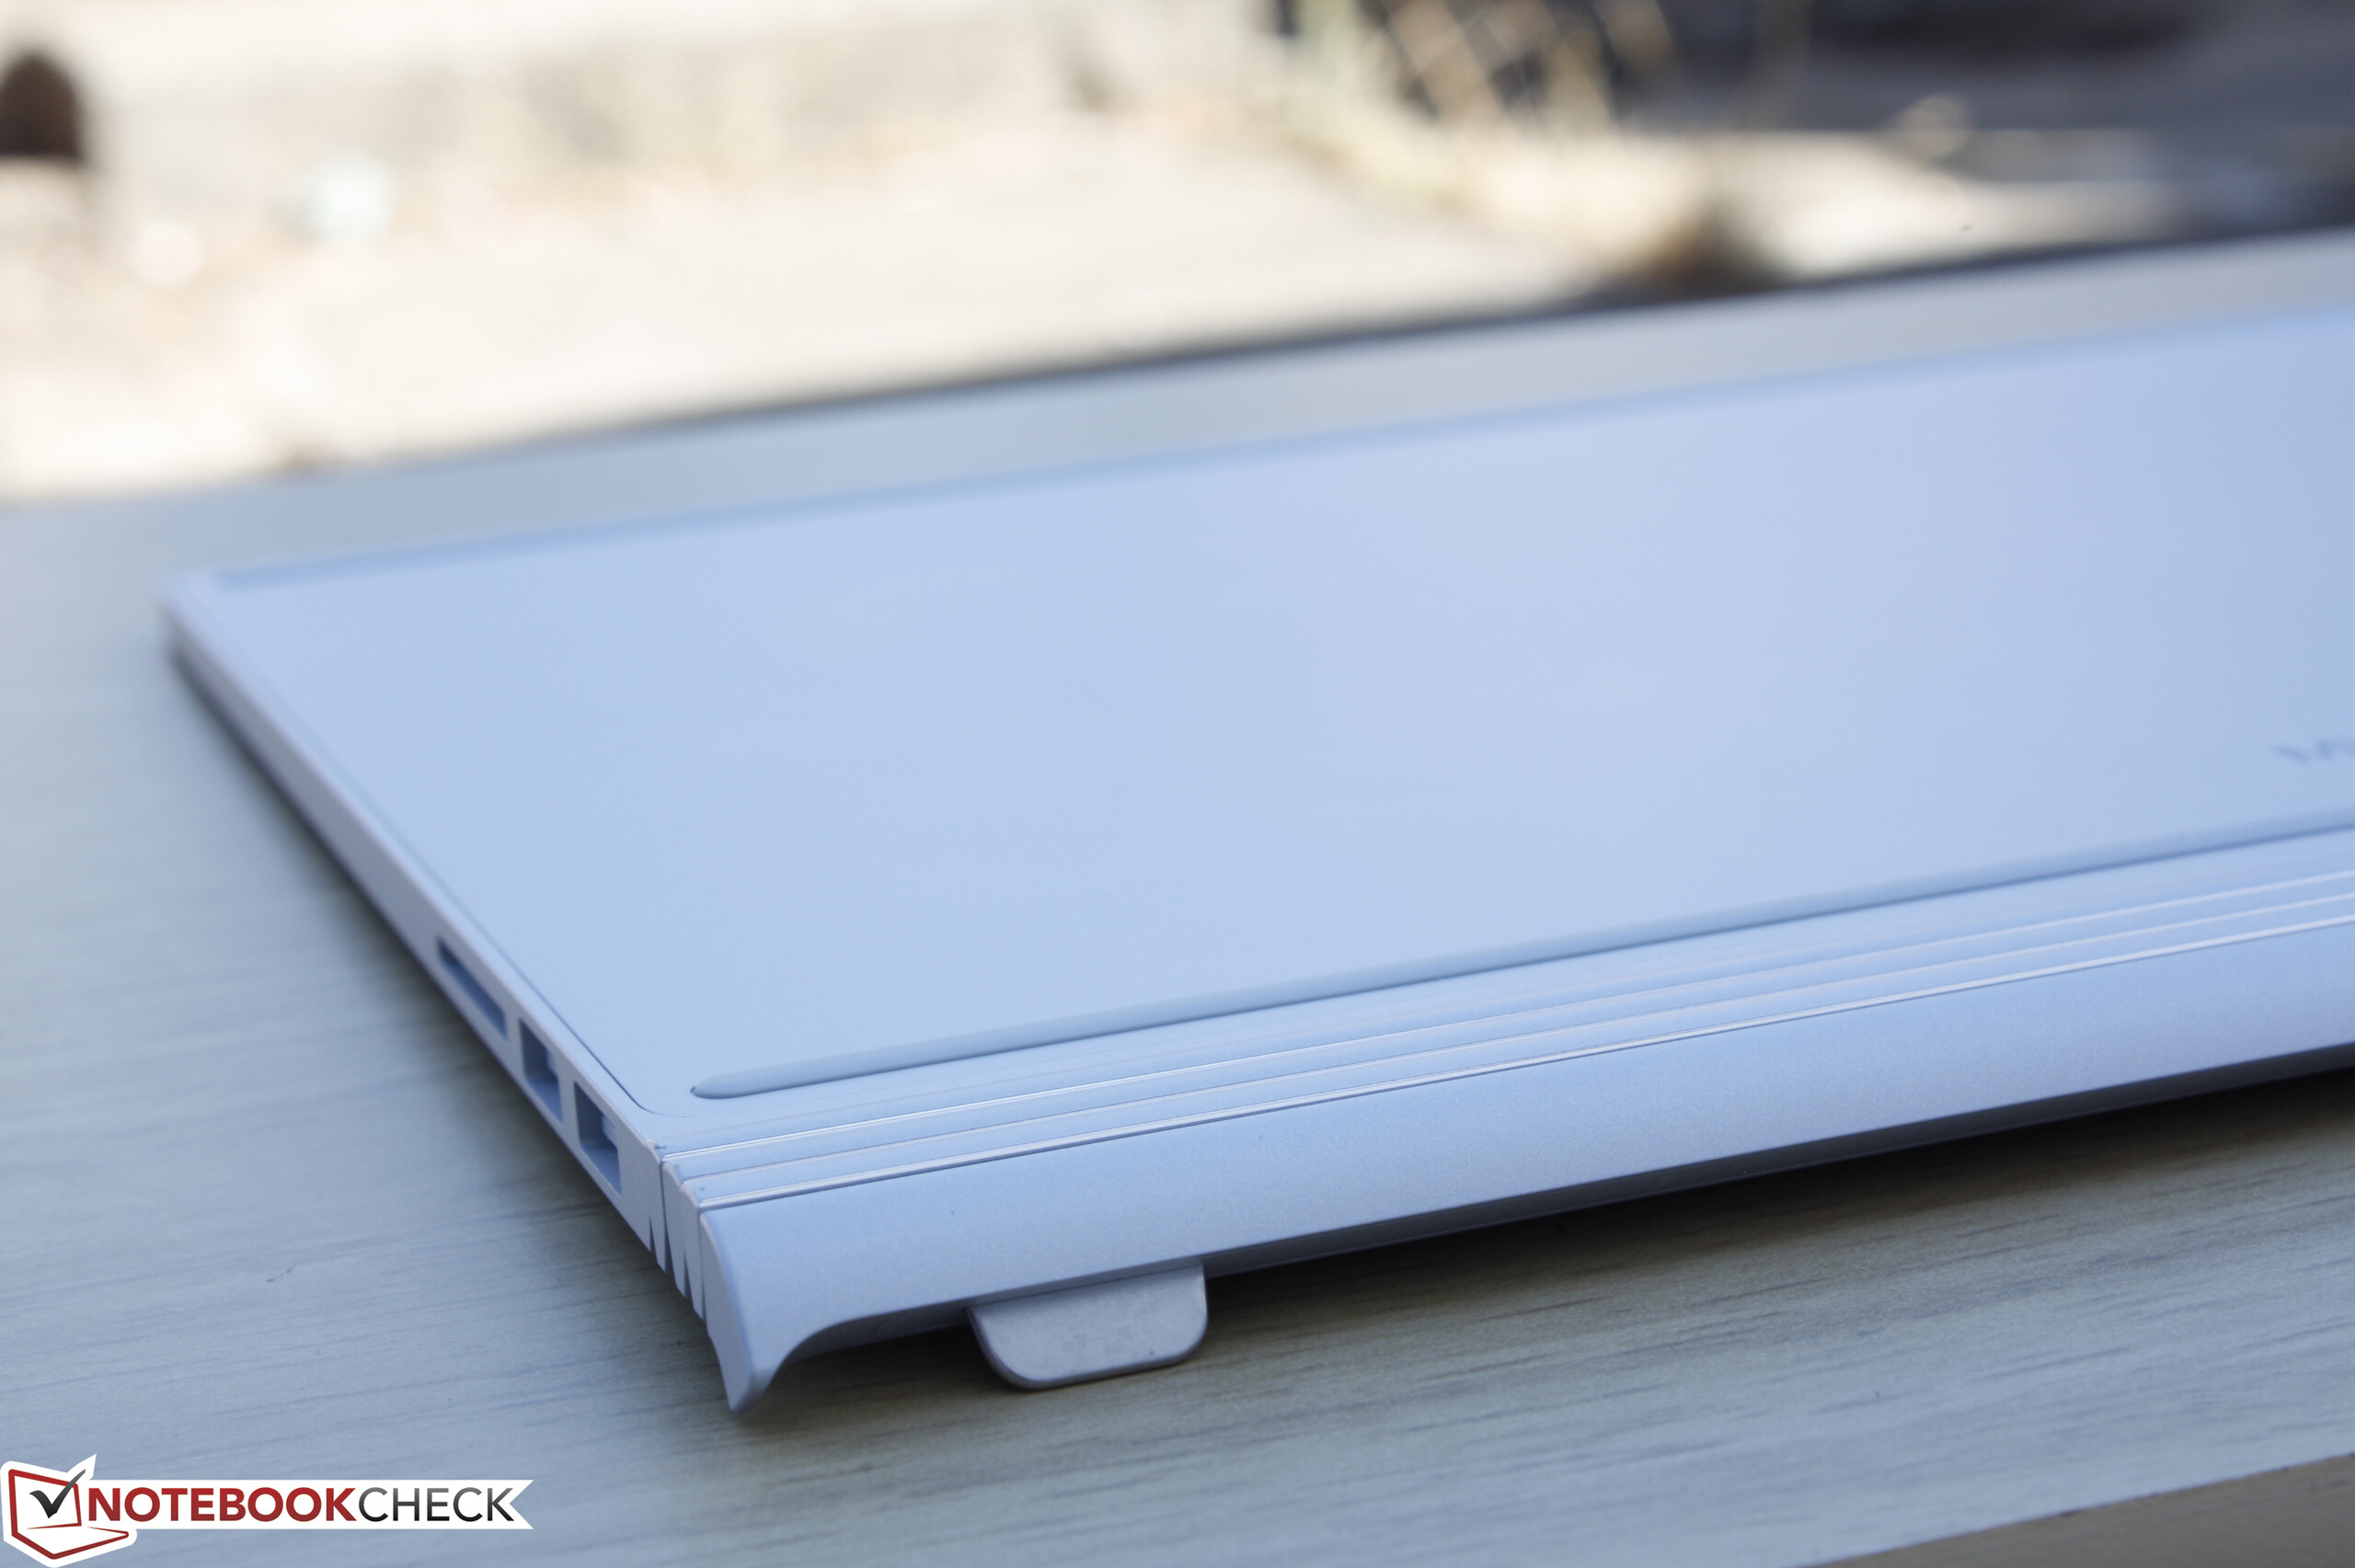
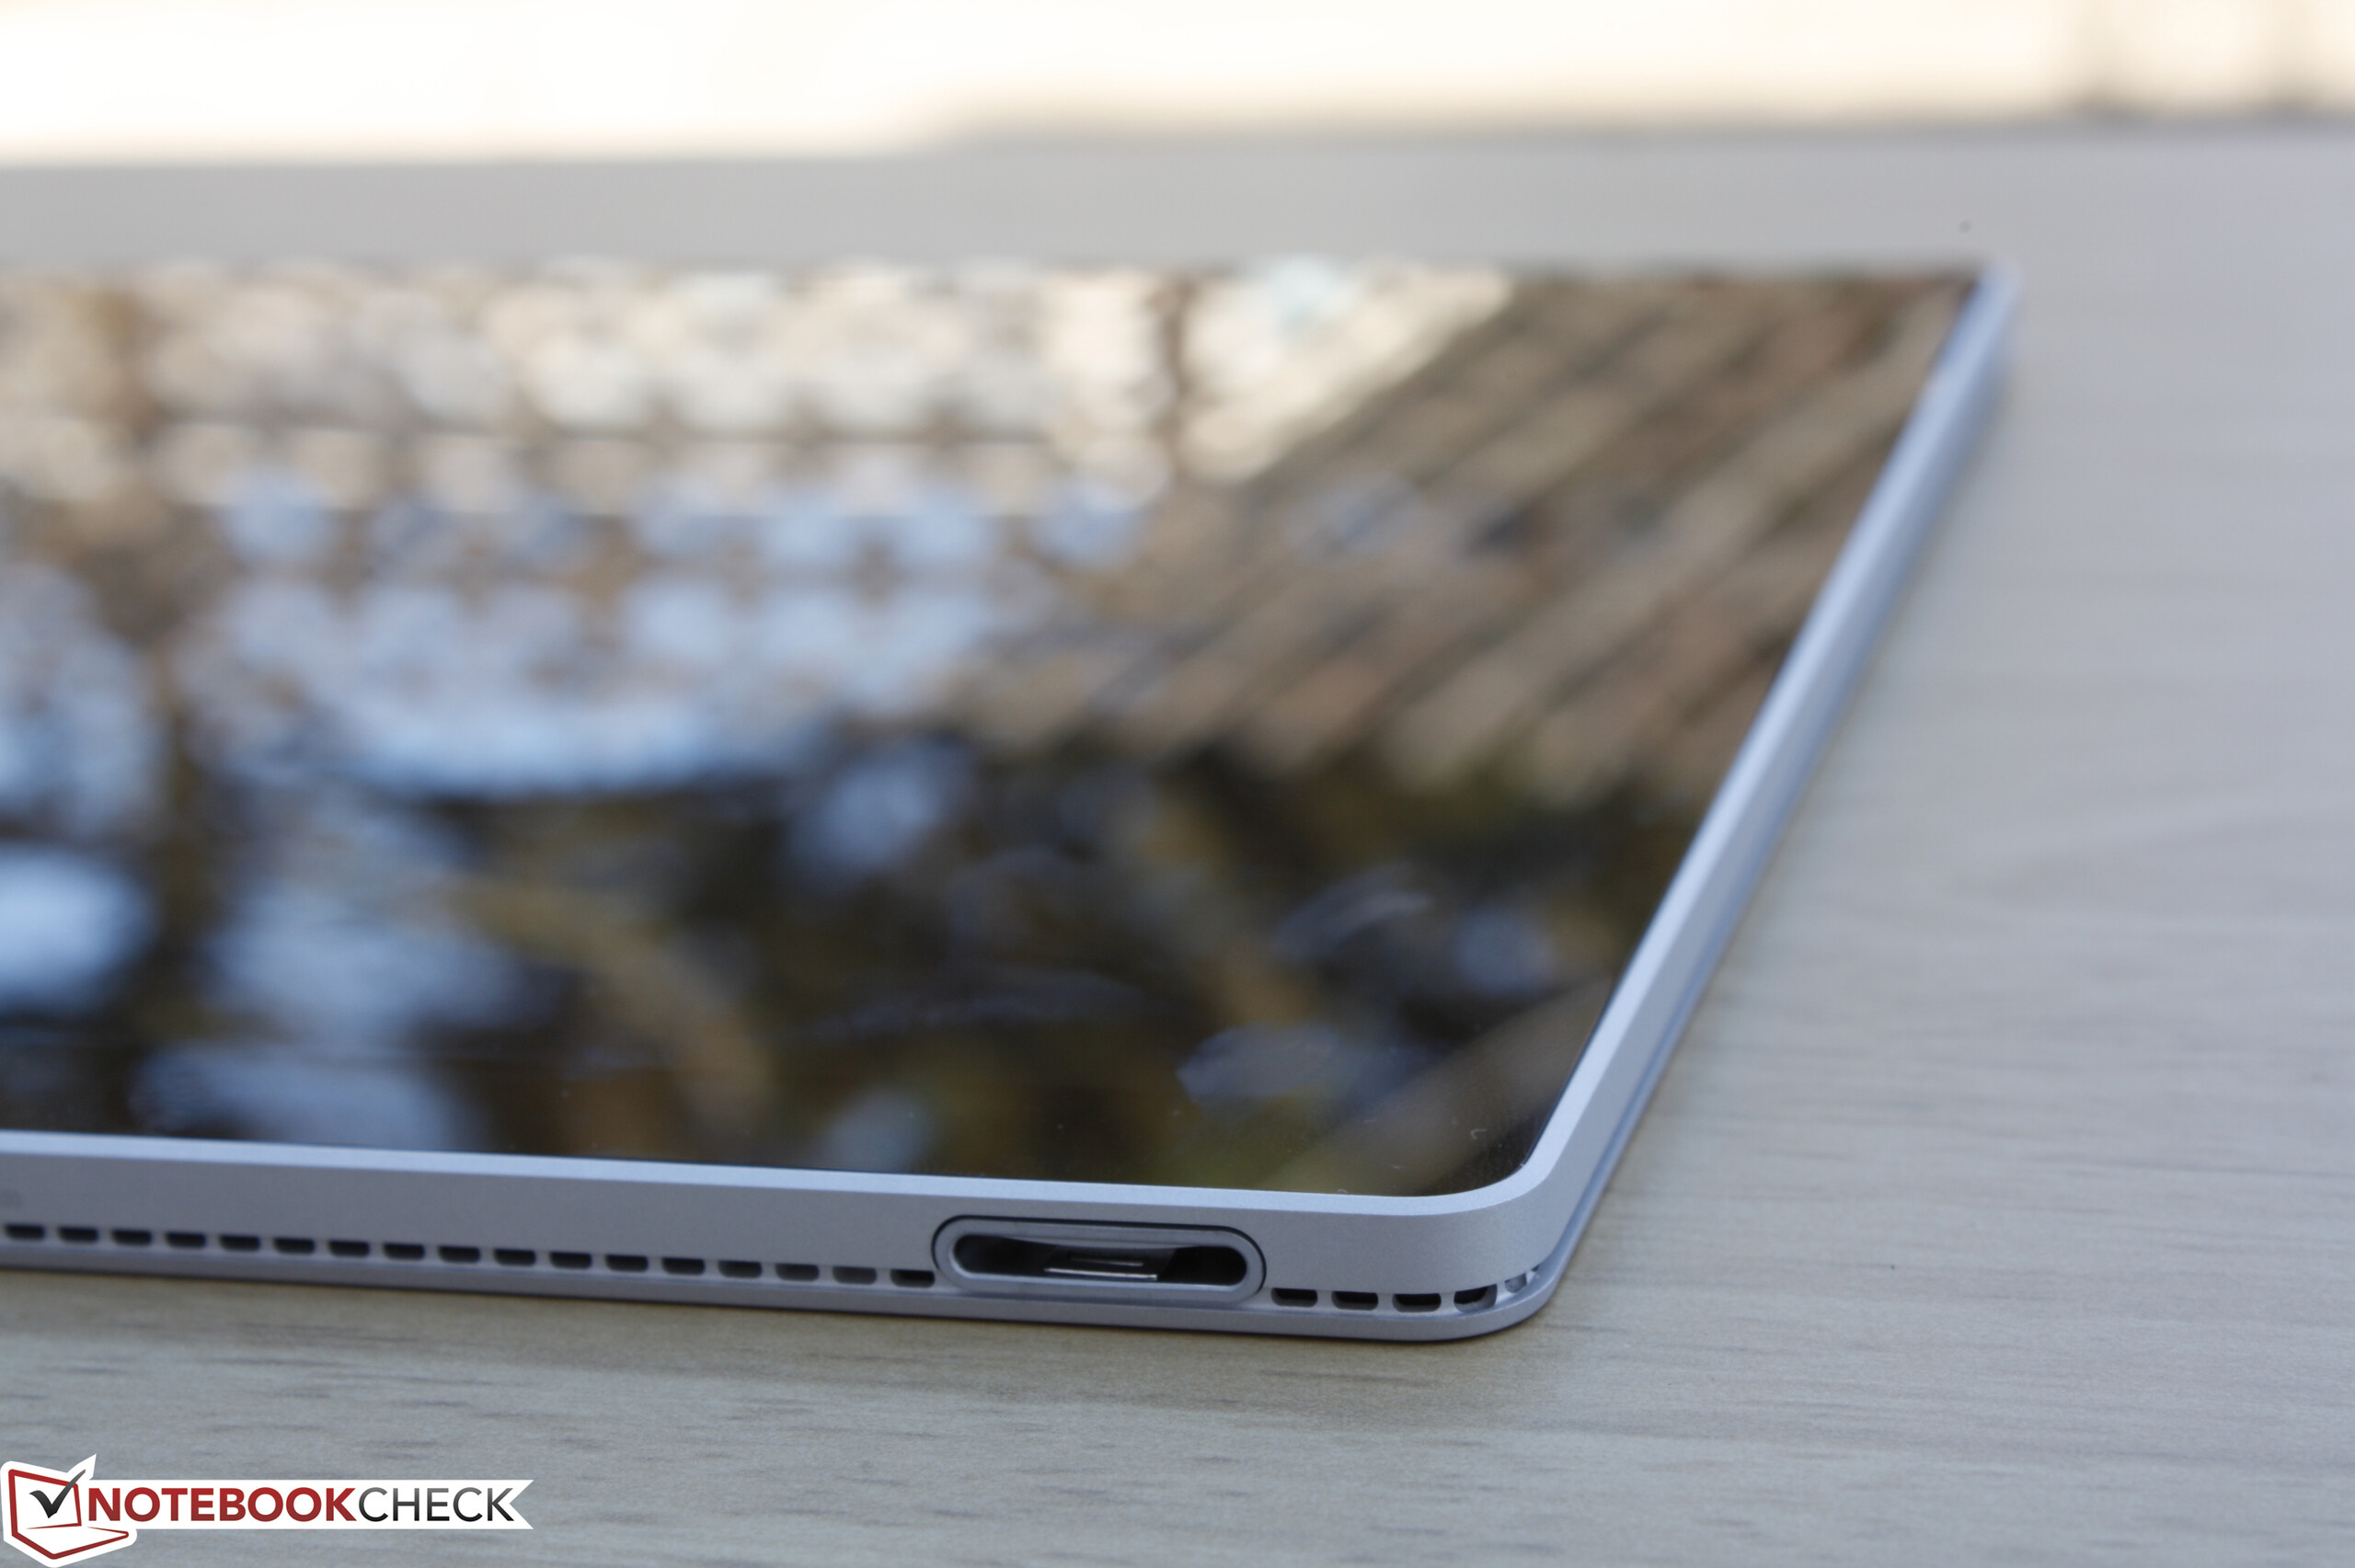
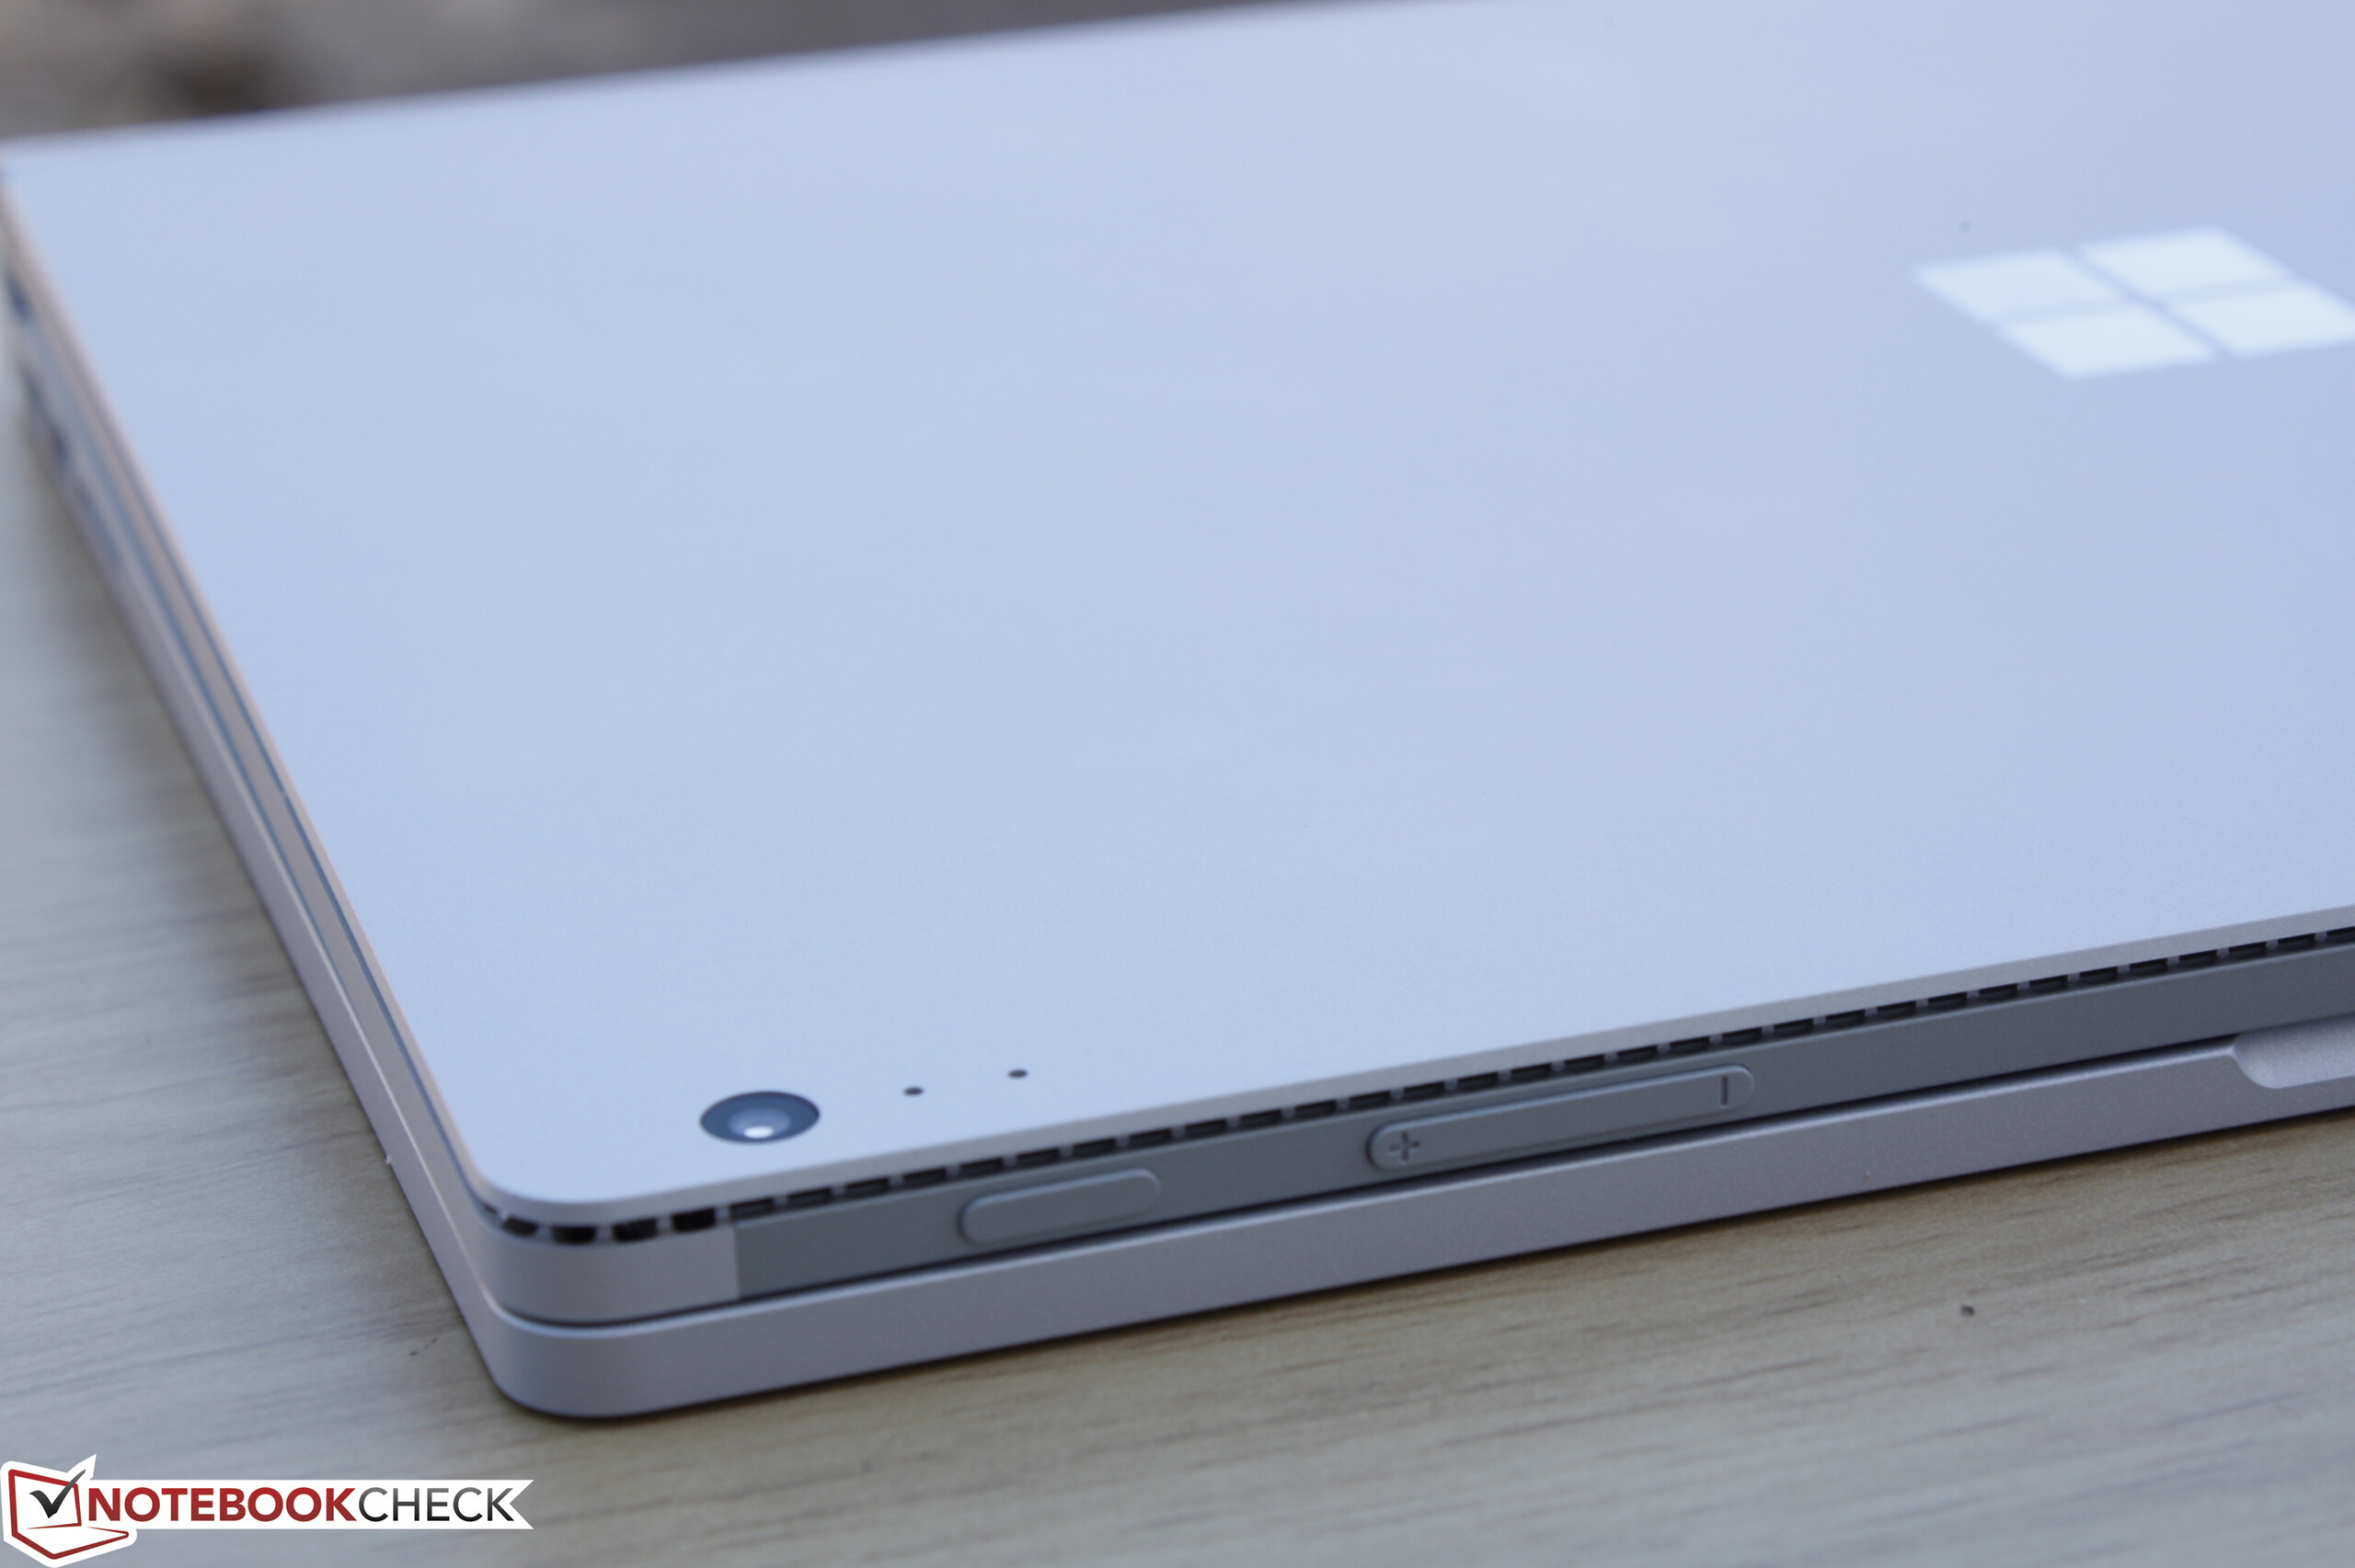
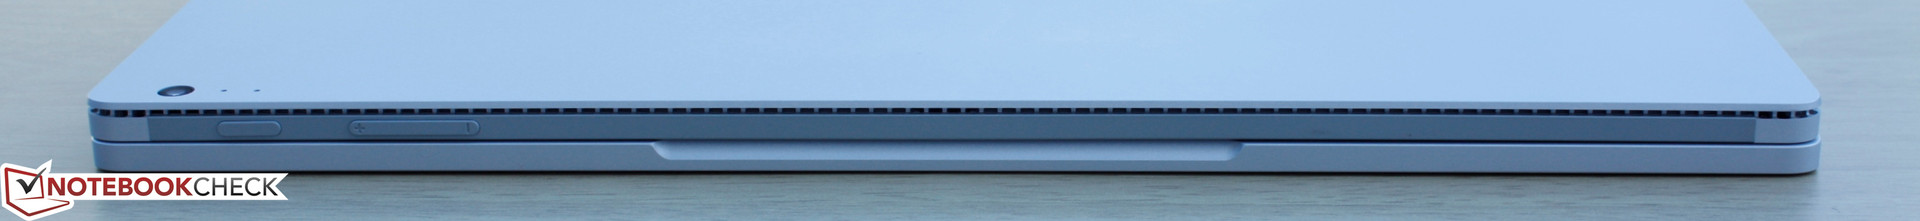
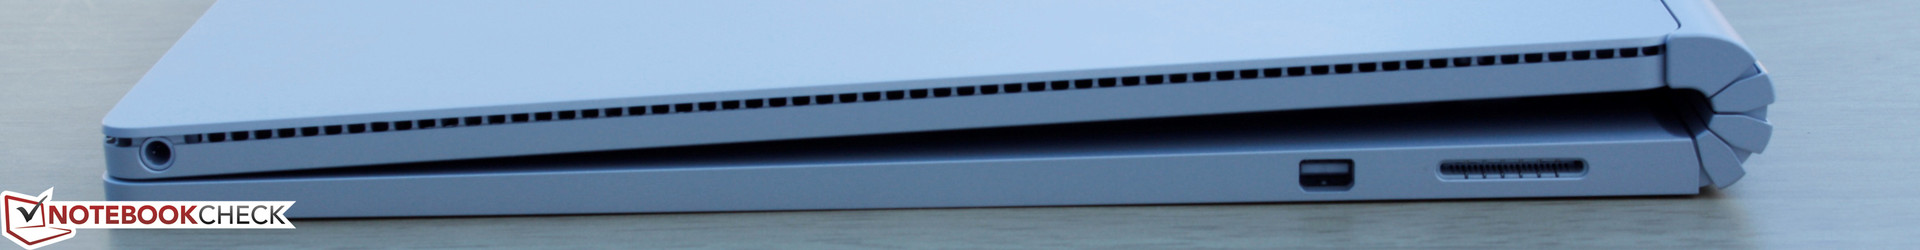
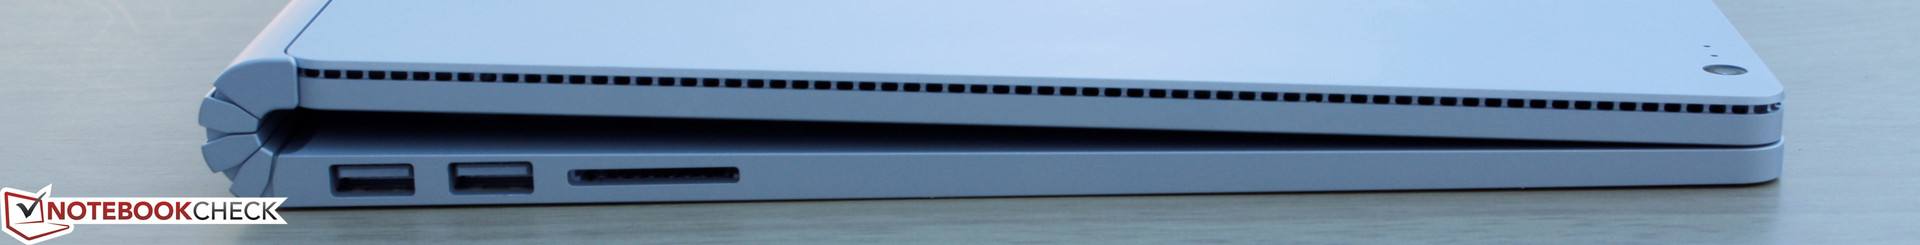
Surface Book中我们不喜欢的地方是它缺少了很多功能。它简洁的设计让人感觉少了些什么,比如HDMI接口和手机网络,后者在超便携设备中十分常见。与Surface Pro系列可以独立工作不同的是,Surface Book的平板部分除了一个3.5毫米音频接口外没有任何其它的接口。它缺少第二块硬盘的选项,我们希望微软可以在以后的型号中加入底座部分可选的额外传统硬盘或固态硬盘。Surface Book很明显是以笔记本电脑为主平板为辅的设备——这与Surface Pro 3或Surface Pro 4正相反。
相比传统笔记本电脑,我们是否推荐Surface Book呢?对于已经在考虑可分离式设备的用户来说,这款微软的设备十分值得考虑,特别是用来替代旧的超极本。不过,对于独立显卡没有兴趣,主要用电脑来上网、文字处理以及观看视频的用户可以找到更轻更薄,也更实惠的超极本设备,它们也提供了更加丰富的功能。
对于商务用户来说,Thinkpad,EliteBook和Latitude都是更强劲的选择,同时它们有Surface Book所不可或缺的一些功能。对于其他用户来说,它相当于微软为Windows爱好者设计的一台"MacBook"。
注:本文是基于完整评测的缩减版本,阅读完整的英文评测,请点击这里。
Microsoft Surface Book Core i5
- 04/27/2016 v5.1 (old)
Allen Ngo
Price comparison
