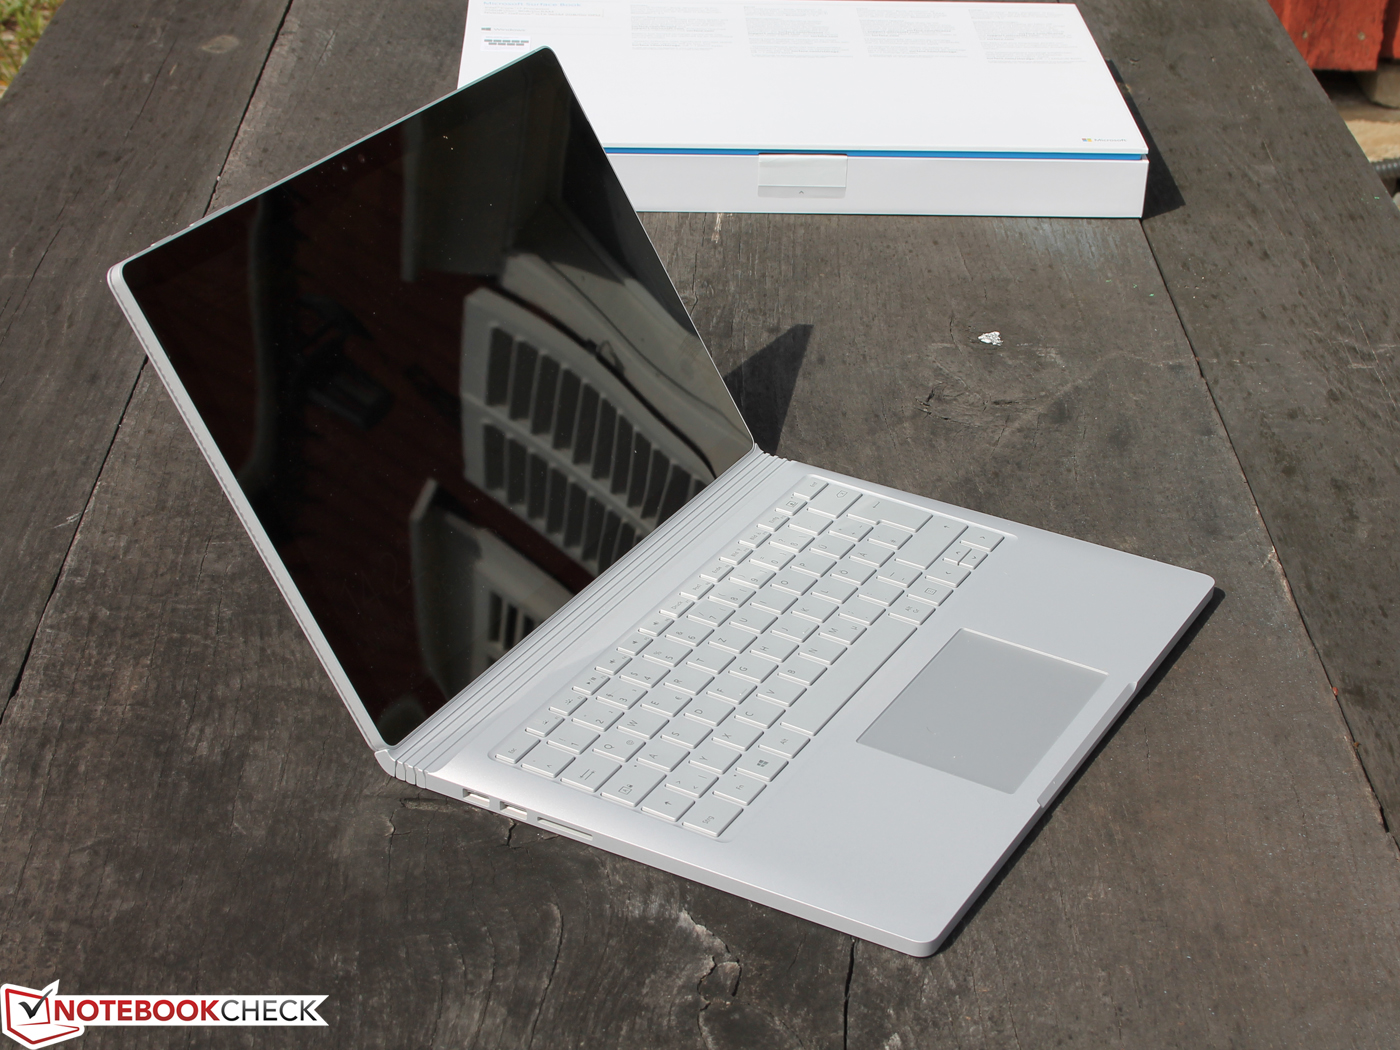
Surface Book 搭配 Performance Base 简短评测 – 1 TB 固态硬盘机型更新
Microsoft Surface Book with Performance Base (Surface Series)
Processor
Intel Core i7-6600U 2c/4t 2 x 2.6 - 3.4 GHz, Skylake
Graphics adapter
NVIDIA GeForce GTX 965M - 2048 MB VRAM, Core: 1150 MHz, RAM: 1253 MHz, GDDR5, ForceWare 376.67, Nvidia Optimus Intel HD Graphics 520
Memory
16 GB
, DDR3-1866 10-10-10-28 双通道
Display
13.50 inch 3:2, 3000 x 2000 pixel 267 PPI, 10点触控, native pen support, Panasonic MEI96A2, IPS, 屏幕型号: VVX14P048M00 100 percent sRGB color, glossy: yes, detachable screen
Mainboard
Intel Skylake-U Premium PCH
Storage
Samsung MZFLW1T0HMLH, M.2 2280, M.2/M-Key, PCIe 3.1 x4, 913 GB free
Weight
1.658 kg, Power Supply: 378 g
Price
2600 Euro
Note: The manufacturer may use components from different suppliers including display panels, drives or memory sticks with similar specifications.
| Microsoft Surface Book with Performance Base GeForce GTX 965M, 6600U, Samsung MZFLW1T0HMLH | Microsoft Surface Book with Performance Base GeForce GTX 965M, 6600U, Toshiba NVMe THNSN5256GPU7 | Eurocom Tornado F5 GeForce GTX 1070 Mobile, i7-7700K, Samsung SSD 960 Pro 512 GB m.2 | Samsung 960 Evo 250GB Titan X Pascal, E5-2680 v4, Samsung SSD 960 Evo 250GB m.2 NVMe | Apple MacBook Pro 15 2016 (2.9 GHz, 460) Radeon Pro 460, 6920HQ, Apple SSD SM1024L | |
|---|---|---|---|---|---|
| CrystalDiskMark 3.0 | 1% | 67% | 44% | 26% | |
| Write 4k QD32 (MB/s) | 376.4 | 347.1 -8% | 634 68% | 410.2 9% | 562 49% |
| Read 4k QD32 (MB/s) | 379.5 | 326.9 -14% | 744 96% | 480.8 27% | 679 79% |
| Write 4k (MB/s) | 120.4 | 108.6 -10% | 180.6 50% | 77.4 -36% | 10.9 -91% |
| Read 4k (MB/s) | 41.79 | 40.91 -2% | 55.9 34% | 34.36 -18% | 9.786 -77% |
| Write 512 (MB/s) | 776 | 698 -10% | 967 25% | 1246 61% | 1058 36% |
| Read 512 (MB/s) | 425.8 | 687 61% | 715 68% | 1088 156% | 914 115% |
| Write Seq (MB/s) | 988 | 861 -13% | 1724 74% | 1563 58% | 1440 46% |
| Read Seq (MB/s) | 990 | 1017 3% | 2145 117% | 1920 94% | 1458 47% |
| AS SSD | -51% | 575% | 401% | 354% | |
| Copy Game MB/s (MB/s) | 721 | 1310 82% | 833 16% | ||
| Copy Program MB/s (MB/s) | 344 | 635 85% | 355.8 3% | ||
| Copy ISO MB/s (MB/s) | 1002 | 1614 61% | 1198 20% | 1478 48% | |
| Score Total (Points) | 2004 | 352 -82% | 3943 97% | 3614 80% | 3320 66% |
| Score Write (Points) | 65 | 14 -78% | 1689 2498% | 1195 1738% | 750 1054% |
| Score Read (Points) | 1318 | 247 -81% | 1512 15% | 1637 24% | 1718 30% |
| Access Time Write * (ms) | 4 | 2.506 37% | 0.024 99% | 0.052 99% | |
| Access Time Read * (ms) | 0.082 | 0.03 | 0.076 | 0.313 | |
| 4K-64 Write (MB/s) | 45 | 2.05 -95% | 1334 2864% | 971 2058% | 551 1124% |
| 4K-64 Read (MB/s) | 1152 | 104.5 -91% | 1179 2% | 1352 17% | 1494 30% |
| 4K Write (MB/s) | 1.63 | 150.5 | 71.4 | 12.93 | |
| 4K Read (MB/s) | 34 | 34.95 3% | 51 50% | 30.59 -10% | 10.53 -69% |
| Seq Write (MB/s) | 198 | 98.6 -50% | 2046 933% | 1522 669% | 1866 842% |
| Seq Read (MB/s) | 1310 | 1072 -18% | 2819 115% | 2549 95% | 2133 63% |
| Total Average (Program / Settings) | -25% /
-26% | 321% /
372% | 223% /
258% | 190% /
200% |
* ... smaller is better
| Microsoft Surface Book with Performance Base GeForce GTX 965M, 6600U, Samsung MZFLW1T0HMLH | Microsoft Surface Book with Performance Base GeForce GTX 965M, 6600U, Toshiba NVMe THNSN5256GPU7 | Apple MacBook Pro 15 2016 (2.9 GHz, 460) Radeon Pro 460, 6920HQ, Apple SSD SM1024L | Microsoft Surface Pro 4 Core i7 Iris Graphics 540, 6650U, Samsung MZFLV256 NVMe | |
|---|---|---|---|---|
| Cinebench R15 | -4% | 57% | -6% | |
| CPU Single 64Bit (Points) | 140 | 139 -1% | 163 16% 156 11% | 132 -6% |
| CPU Multi 64Bit (Points) | 310.3 | 324 4% | 740 138% 729 135% | 342 10% |
| Ref. Match 64Bit (%) | 99.6 | 99.6 0% | 98 -2% | 97.8 -2% |
| OpenGL 64Bit (fps) | 79.2 | 64.9 -18% | 114.7 45% | 60.1 -24% |
| PCMark 8 | -6% | 12% | -1% | |
| Storage Score v2 (Points) | 4988 | 4927 -1% | 5061 1% | |
| Storage Score (Points) | 4662 | |||
| Work Score Accelerated v2 (Points) | 3964 | 3949 0% | 4755 20% | 4052 2% |
| Creative Score Accelerated v2 (Points) | 5033 | 4136 -18% | 4984 -1% | 4431 -12% |
| Home Score Accelerated v2 (Points) | 3188 | 3040 -5% | 4066 28% | 3394 6% |
| Total Average (Program / Settings) | -5% /
-5% | 35% /
39% | -4% /
-4% |
| Microsoft Surface Book with Performance Base GeForce GTX 965M, 6600U, Samsung MZFLW1T0HMLH | Microsoft Surface Book with Performance Base GeForce GTX 965M, 6600U, Toshiba NVMe THNSN5256GPU7 | Apple MacBook Pro 15 2016 (2.9 GHz, 460) Radeon Pro 460, 6920HQ, Apple SSD SM1024L | Microsoft Surface Pro 4 Core i7 Iris Graphics 540, 6650U, Samsung MZFLV256 NVMe | |
|---|---|---|---|---|
| Cinebench R15 | 2% | 75% | 2% | |
| CPU Single 64Bit (Points) | 140 | 139 -1% | 163 16% 156 11% | 132 -6% |
| CPU Multi 64Bit (Points) | 310.3 | 324 4% | 740 138% 729 135% | 342 10% |
| PCMark 8 | -8% | 16% | -1% | |
| Work Score Accelerated v2 (Points) | 3964 | 3949 0% | 4755 20% | 4052 2% |
| Creative Score Accelerated v2 (Points) | 5033 | 4136 -18% | 4984 -1% | 4431 -12% |
| Home Score Accelerated v2 (Points) | 3188 | 3040 -5% | 4066 28% | 3394 6% |
| Total Average (Program / Settings) | -3% /
-4% | 46% /
50% | 1% /
0% |
The top model of the Surface Book with Performance Base offers more storage capacity and twice as much RAM compared to the entry-level model. The performance of the SSD is on par with the base 256 GB model from Toshiba, so no gains in this respect. We can, however, notice the upgrade to 16 GB RAM in two out of three PCMark 8 tests. Still, this does not justify the hefty additional price of $1100. You should only get the high-end SKU if you really need 1 TB of storage capacity.
Please see our in-depth review for more information about the Microsoft Surface Book.
