联想 Yoga 710-14IKB 80V4002HGE 变形本简短评测
| SD Card Reader | |
| average JPG Copy Test (av. of 3 runs) | |
| Lenovo Yoga 710-14ISK | |
| Lenovo Yoga 710-14IKB 80V4002HGE | |
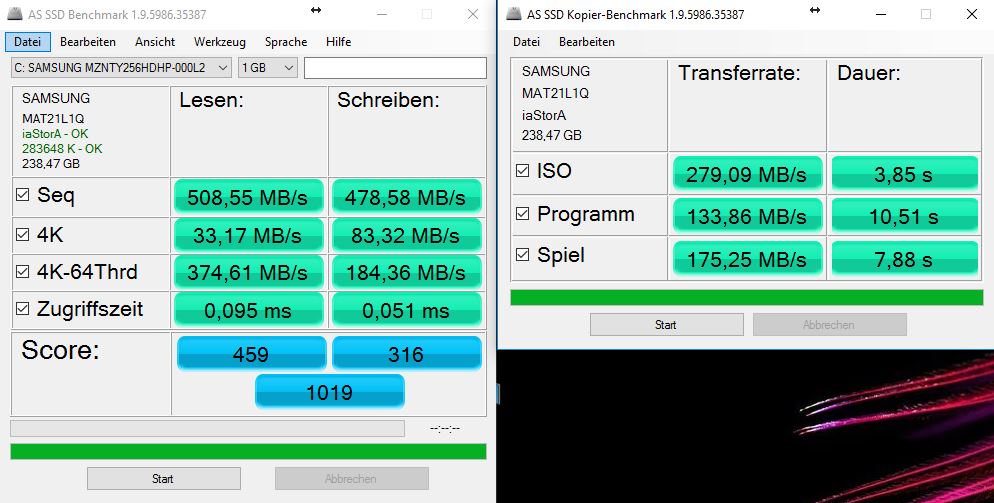
| maximum AS SSD Seq Read Test (1GB) | |
| Lenovo Yoga 710-14ISK | |
| Lenovo Yoga 710-14IKB 80V4002HGE | |
| Networking | |
| iperf Server (receive) TCP 1 m | |
| Lenovo Yoga 710-14IKB 80V4002HGE (jseb) | |
| Lenovo Miix 510 Pro 80U10006GE (jseb) | |
| Apple MacBook 12 (Early 2016) 1.1 GHz | |
| iperf Client (transmit) TCP 1 m | |
| Lenovo Yoga 710-14IKB 80V4002HGE (jseb) | |
| Lenovo Miix 510 Pro 80U10006GE (jseb) | |
| Apple MacBook 12 (Early 2016) 1.1 GHz | |
| |||||||||||||||||||||||||
Brightness Distribution: 77 %
Center on Battery: 340 cd/m²
Contrast: 1097:1 (Black: 0.31 cd/m²)
ΔE ColorChecker Calman: 6.75 | ∀{0.5-29.43 Ø4.71}
ΔE Greyscale Calman: 8.47 | ∀{0.09-98 Ø4.96}
89% sRGB (Argyll 1.6.3 3D)
58% AdobeRGB 1998 (Argyll 1.6.3 3D)
63.3% AdobeRGB 1998 (Argyll 3D)
89.5% sRGB (Argyll 3D)
62% Display P3 (Argyll 3D)
Gamma: 2.22
CCT: 6557 K
| Lenovo Yoga 710-14IKB 80V4002HGE AU Optronics B140HAN03.0, , 1920x1080, 14" | Lenovo Yoga 710-14ISK AU Optronics B140HAN03.0, , 1920x1080, 14" | HP Spectre x360 13-w023dx Chi Mei CMN1367, , 1920x1080, 13.3" | Lenovo Miix 510 Pro 80U10006GE Unknown, , 1920x1200, 12.2" | Acer Aspire Switch Alpha 12 SA5-271-56HM Panasonic VVX12T041N00, , 2160x1440, 12" | |
|---|---|---|---|---|---|
| Display | 3% | 3% | 6% | ||
| Display P3 Coverage (%) | 62 | 65.4 5% | 64.5 4% | 65.5 6% | |
| sRGB Coverage (%) | 89.5 | 90.4 1% | 92 3% | 96.1 7% | |
| AdobeRGB 1998 Coverage (%) | 63.3 | 65.8 4% | 65.5 3% | 66.9 6% | |
| Response Times | 20% | 26% | 34% | 30% | |
| Response Time Grey 50% / Grey 80% * (ms) | 53 ? | 35 ? 34% | 33.2 ? 37% | 33 ? 38% | 20 ? 62% |
| Response Time Black / White * (ms) | 33 ? | 31 ? 6% | 28 ? 15% | 23 ? 30% | 34 ? -3% |
| PWM Frequency (Hz) | 50 ? | 50 ? | 125 ? | 1000 ? | |
| Screen | 3% | 3% | -4% | 3% | |
| Brightness middle (cd/m²) | 340 | 325 -4% | 334.6 -2% | 327 -4% | 345 1% |
| Brightness (cd/m²) | 302 | 298 -1% | 319 6% | 324 7% | 328 9% |
| Brightness Distribution (%) | 77 | 88 14% | 90 17% | 88 14% | 91 18% |
| Black Level * (cd/m²) | 0.31 | 0.35 -13% | 0.336 -8% | 0.35 -13% | 0.38 -23% |
| Contrast (:1) | 1097 | 929 -15% | 996 -9% | 934 -15% | 908 -17% |
| Colorchecker dE 2000 * | 6.75 | 6.2 8% | 6.21 8% | 6.54 3% | 8.4 -24% |
| Colorchecker dE 2000 max. * | 12.4 | 10.82 13% | 12 3% | 15.59 -26% | 11.9 4% |
| Greyscale dE 2000 * | 8.47 | 6.32 25% | 7.71 9% | 9.52 -12% | 4.3 49% |
| Gamma | 2.22 99% | 2.3 96% | 2.36 93% | 2.35 94% | 2.63 84% |
| CCT | 6557 99% | 6926 94% | 6458 101% | 8802 74% | 7368 88% |
| Color Space (Percent of AdobeRGB 1998) (%) | 58 | 58 0% | 58.6 1% | 59 2% | 62 7% |
| Color Space (Percent of sRGB) (%) | 89 | 90 1% | 90 1% | 92 3% | |
| Total Average (Program / Settings) | 12% /
6% | 11% /
6% | 11% /
2% | 13% /
7% |
* ... smaller is better
Display Response Times
| ↔ Response Time Black to White | ||
|---|---|---|
| 33 ms ... rise ↗ and fall ↘ combined | ↗ 7 ms rise | 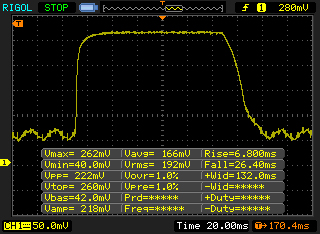 |
| ↘ 26 ms fall | ||
| The screen shows slow response rates in our tests and will be unsatisfactory for gamers. In comparison, all tested devices range from 0.1 (minimum) to 240 (maximum) ms. » 89 % of all devices are better. This means that the measured response time is worse than the average of all tested devices (19.8 ms). | ||
| ↔ Response Time 50% Grey to 80% Grey | ||
| 53 ms ... rise ↗ and fall ↘ combined | ↗ 17 ms rise | 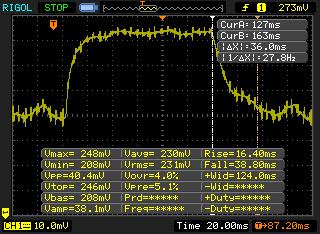 |
| ↘ 36 ms fall | ||
| The screen shows slow response rates in our tests and will be unsatisfactory for gamers. In comparison, all tested devices range from 0.165 (minimum) to 636 (maximum) ms. » 90 % of all devices are better. This means that the measured response time is worse than the average of all tested devices (31 ms). | ||
Screen Flickering / PWM (Pulse-Width Modulation)
| Screen flickering / PWM detected | 50 Hz | ≤ 10 % brightness setting | 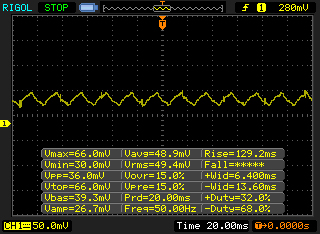 |
The display backlight flickers at 50 Hz (worst case, e.g., utilizing PWM) Flickering detected at a brightness setting of 10 % and below. There should be no flickering or PWM above this brightness setting. The frequency of 50 Hz is very low, so the flickering may cause eyestrain and headaches after extended use. In comparison: 52 % of all tested devices do not use PWM to dim the display. If PWM was detected, an average of 7754 (minimum: 5 - maximum: 343500) Hz was measured. | |||
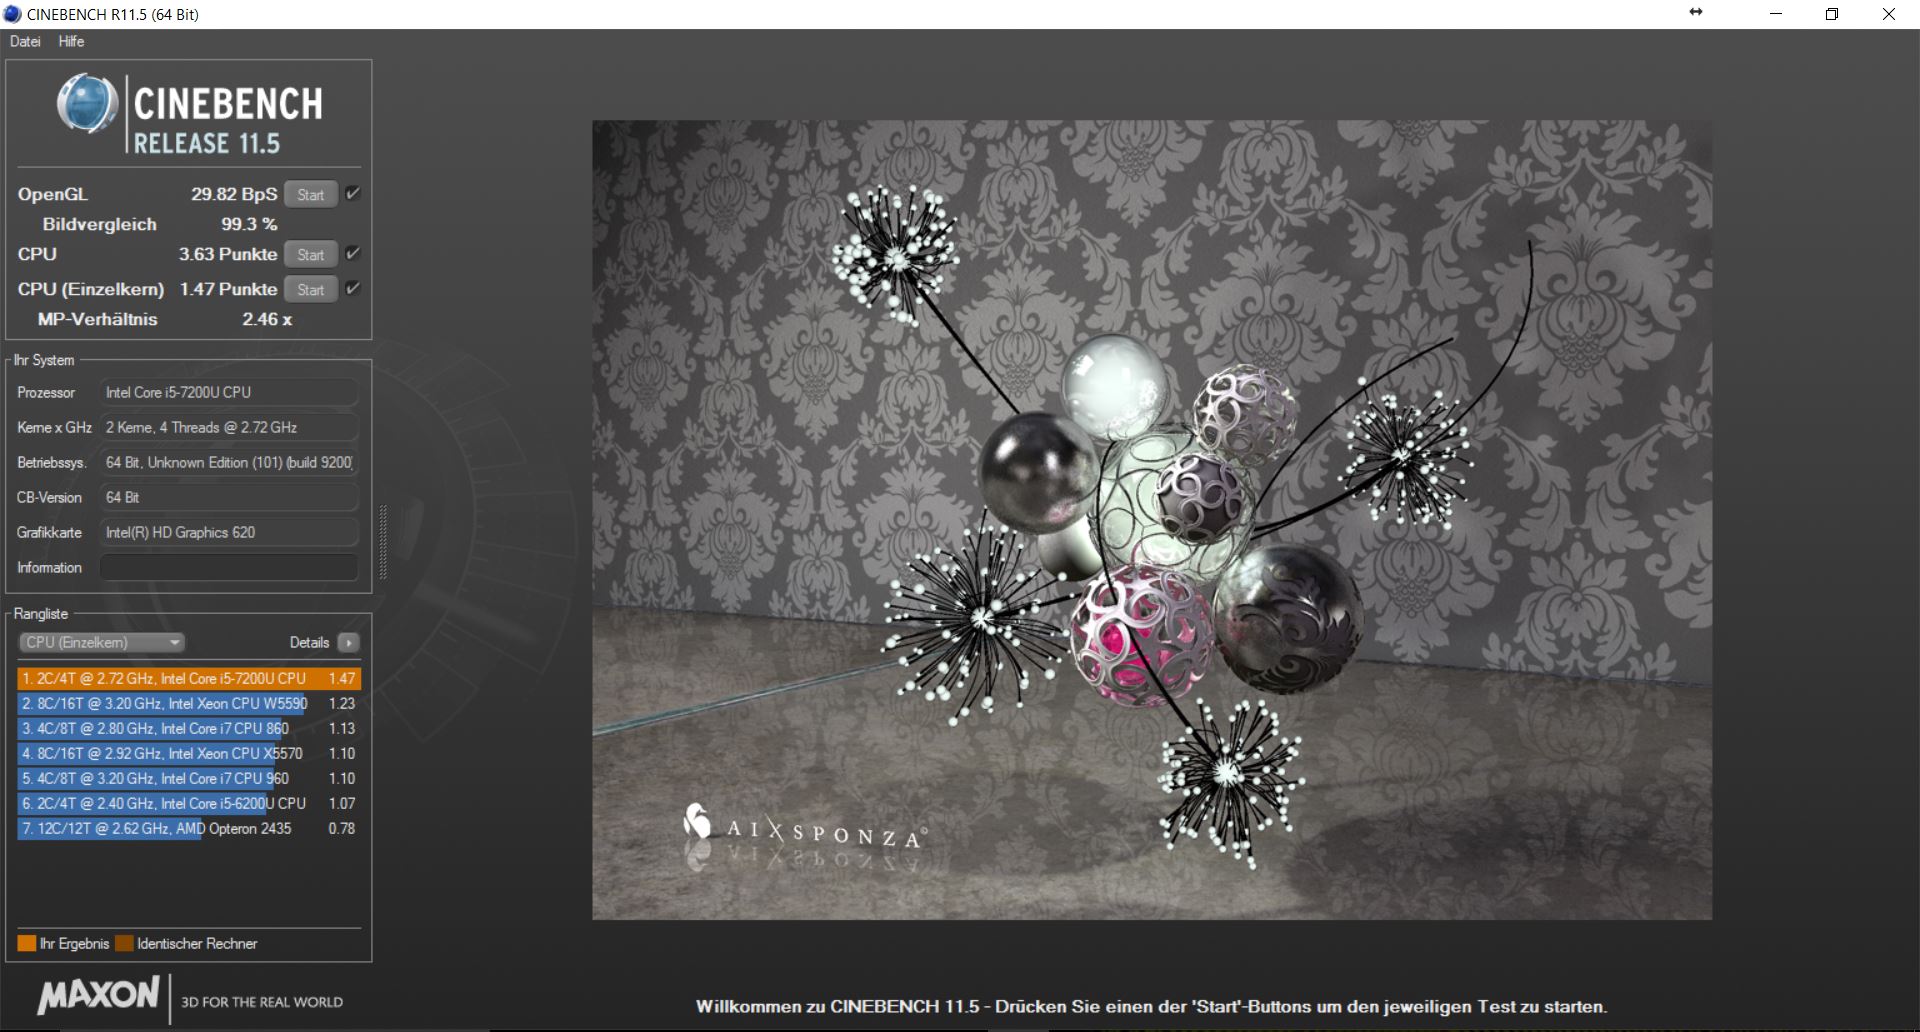
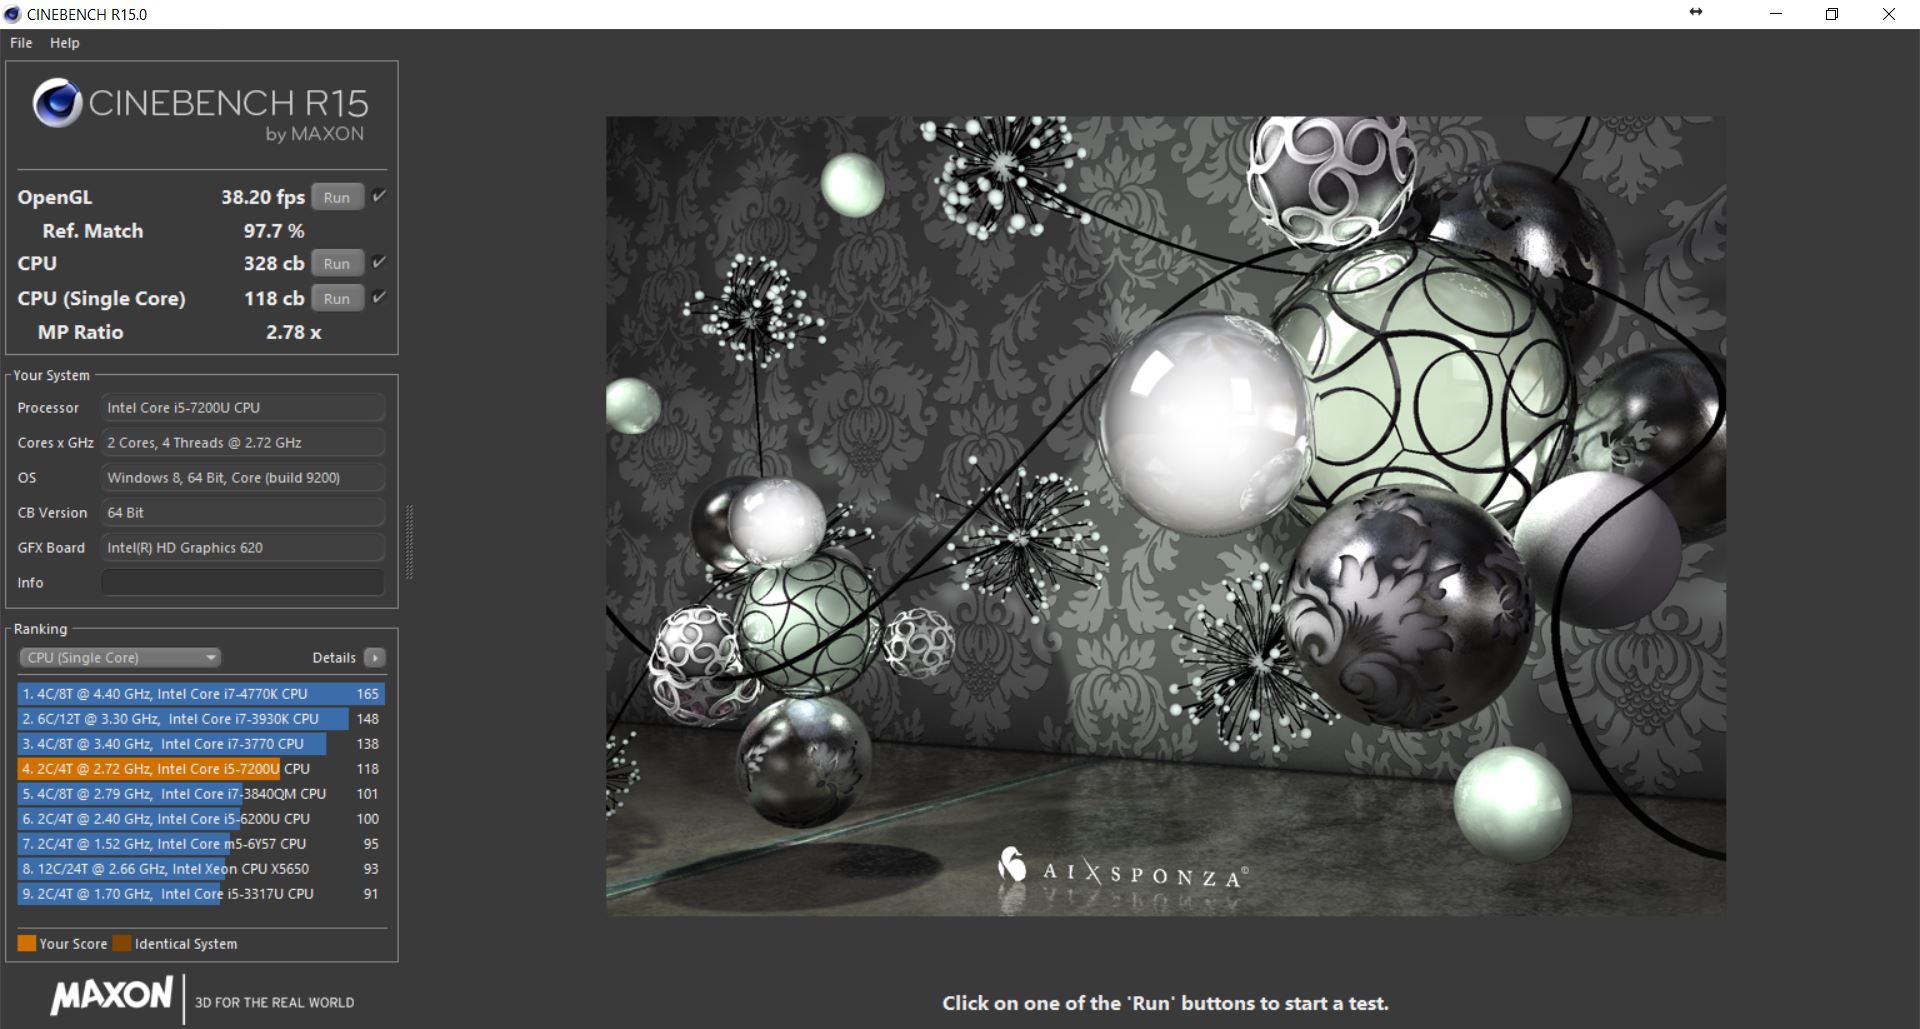
| Cinebench R11.5 | |
| CPU Single 64Bit | |
| HP Spectre x360 13-w023dx | |
| Lenovo Yoga 710-14IKB 80V4002HGE | |
| Lenovo Yoga 710-14ISK | |
| CPU Multi 64Bit | |
| Lenovo Yoga 710-14IKB 80V4002HGE | |
| HP Spectre x360 13-w023dx | |
| Lenovo Yoga 710-14ISK | |
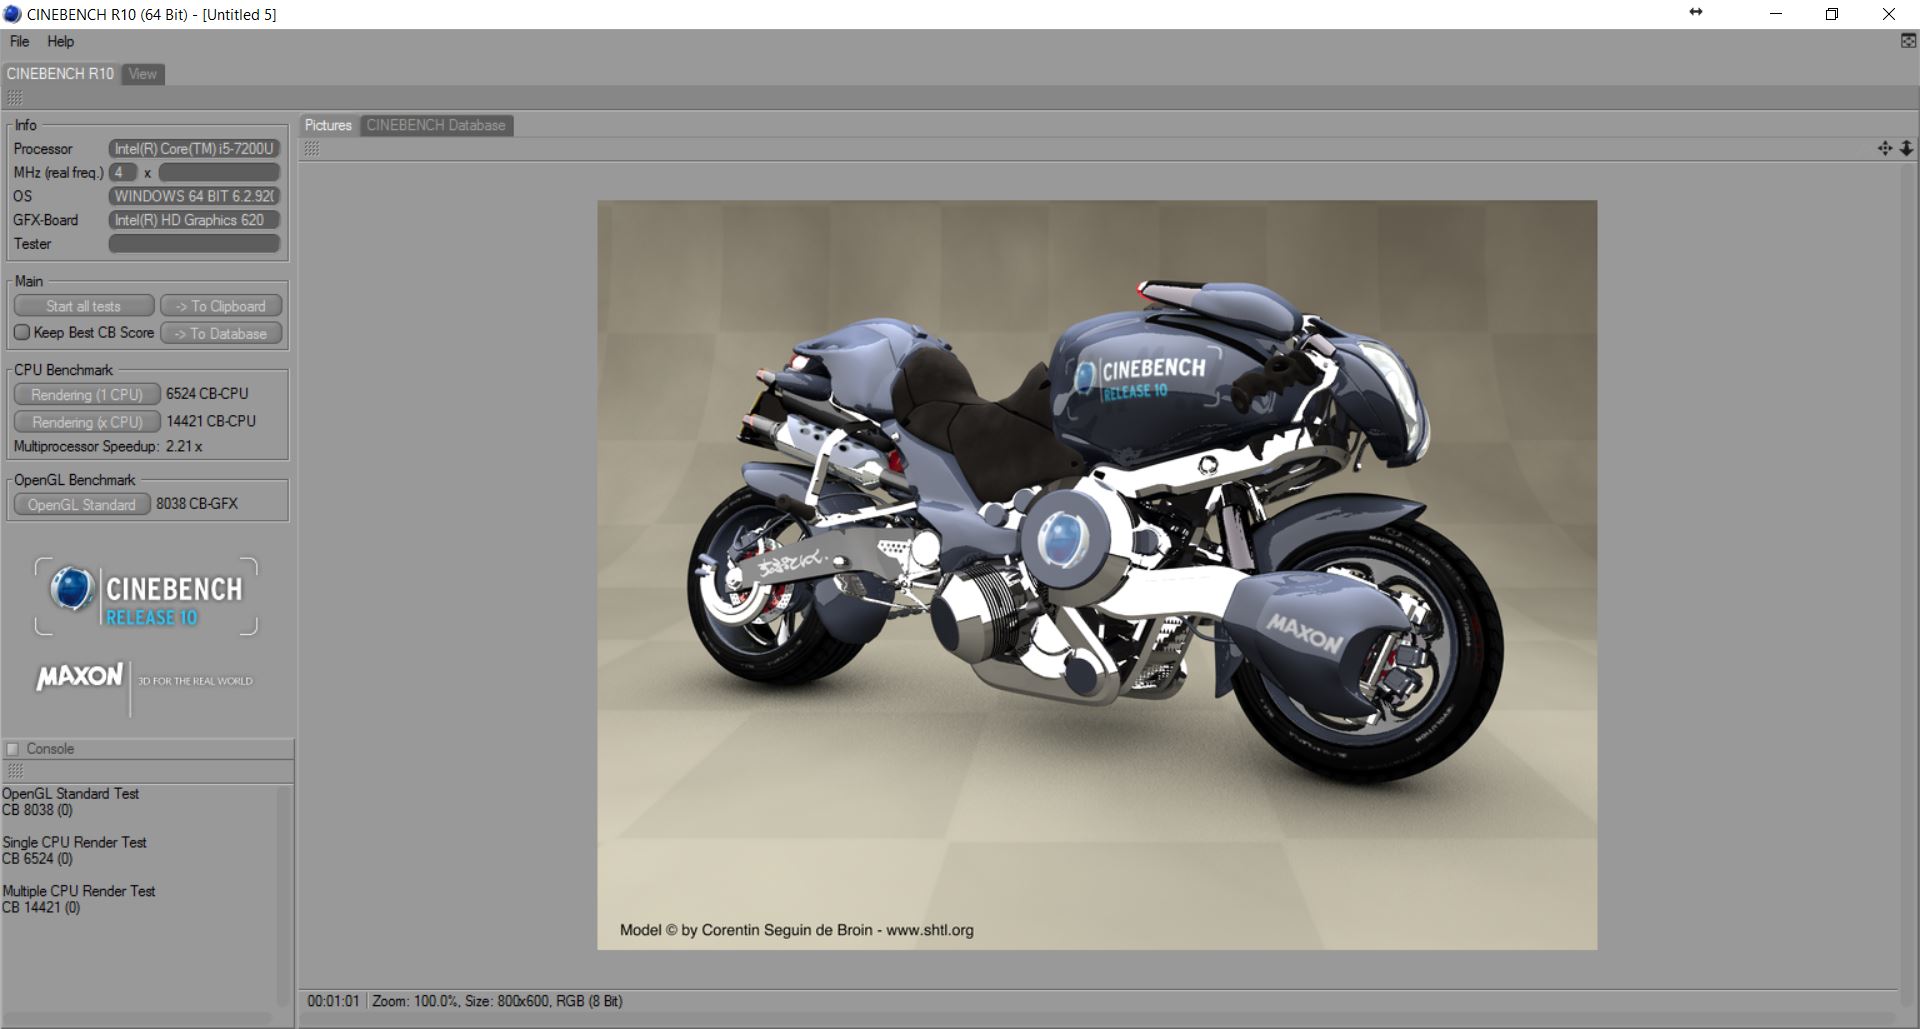
| Cinebench R10 | |
| Rendering Single CPUs 64Bit | |
| Lenovo Yoga 710-14IKB 80V4002HGE | |
| Lenovo Yoga 710-14ISK | |
| Rendering Multiple CPUs 64Bit | |
| Lenovo Yoga 710-14IKB 80V4002HGE | |
| Lenovo Yoga 710-14ISK | |
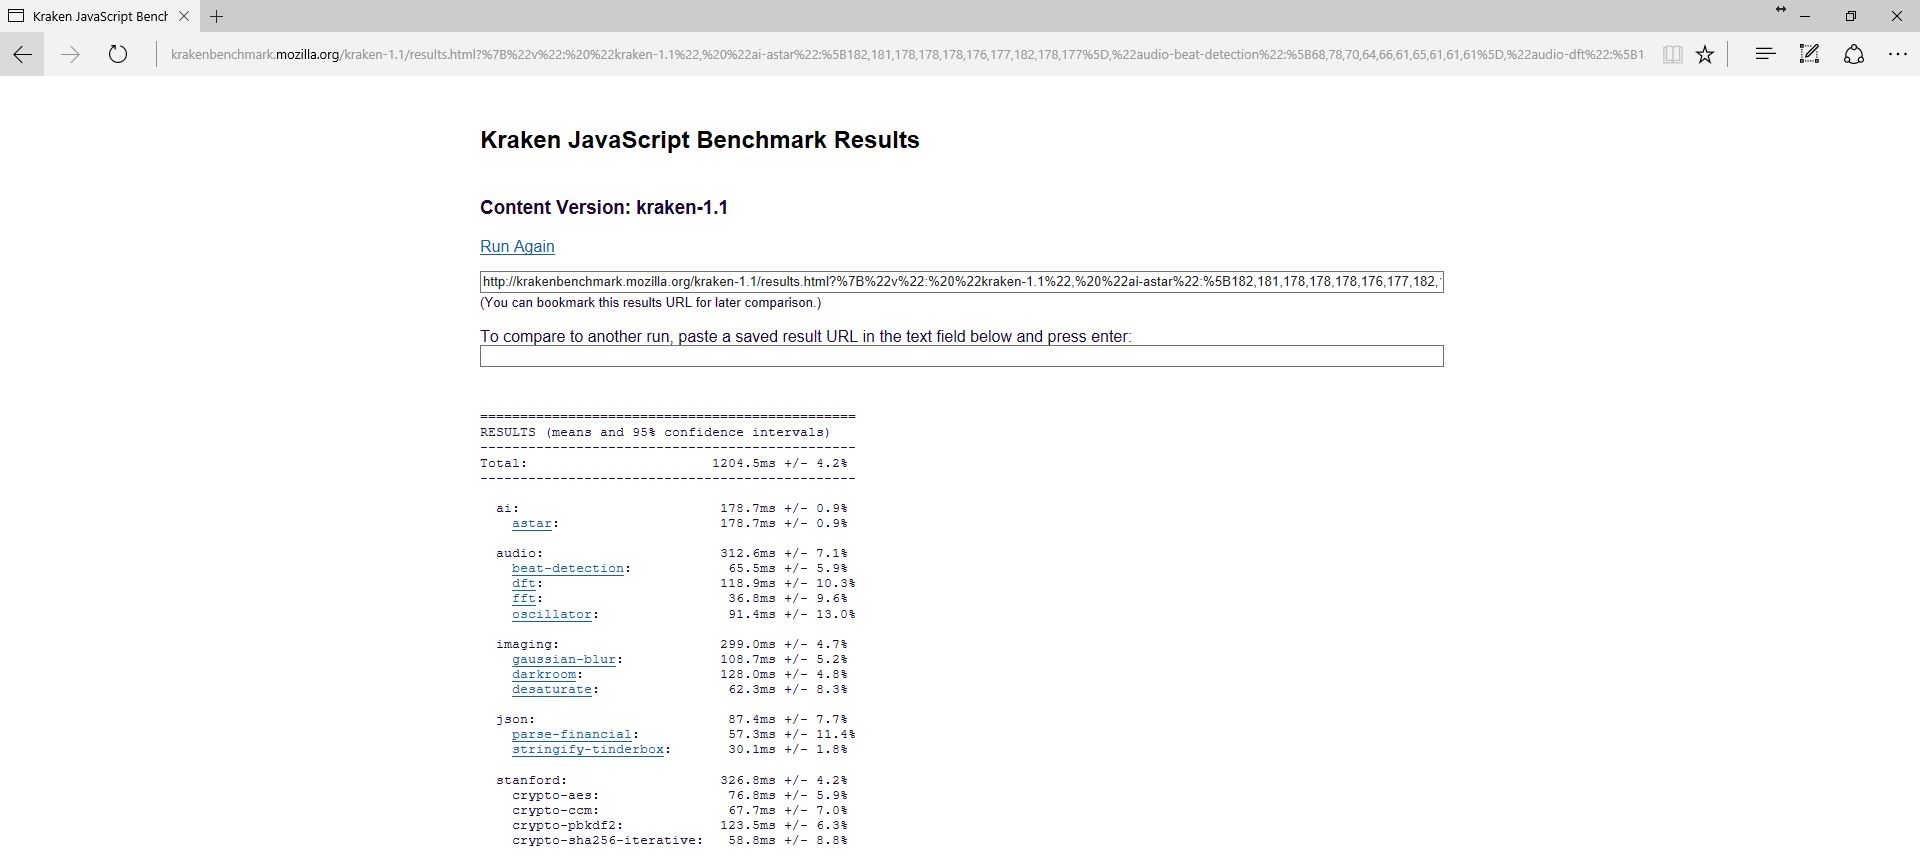
| Mozilla Kraken 1.1 - Total | |
| Acer Aspire Switch Alpha 12 SA5-271-56HM | |
| Lenovo Yoga 710-14ISK | |
| Lenovo Miix 510 Pro 80U10006GE | |
| Lenovo Yoga 710-14IKB 80V4002HGE | |
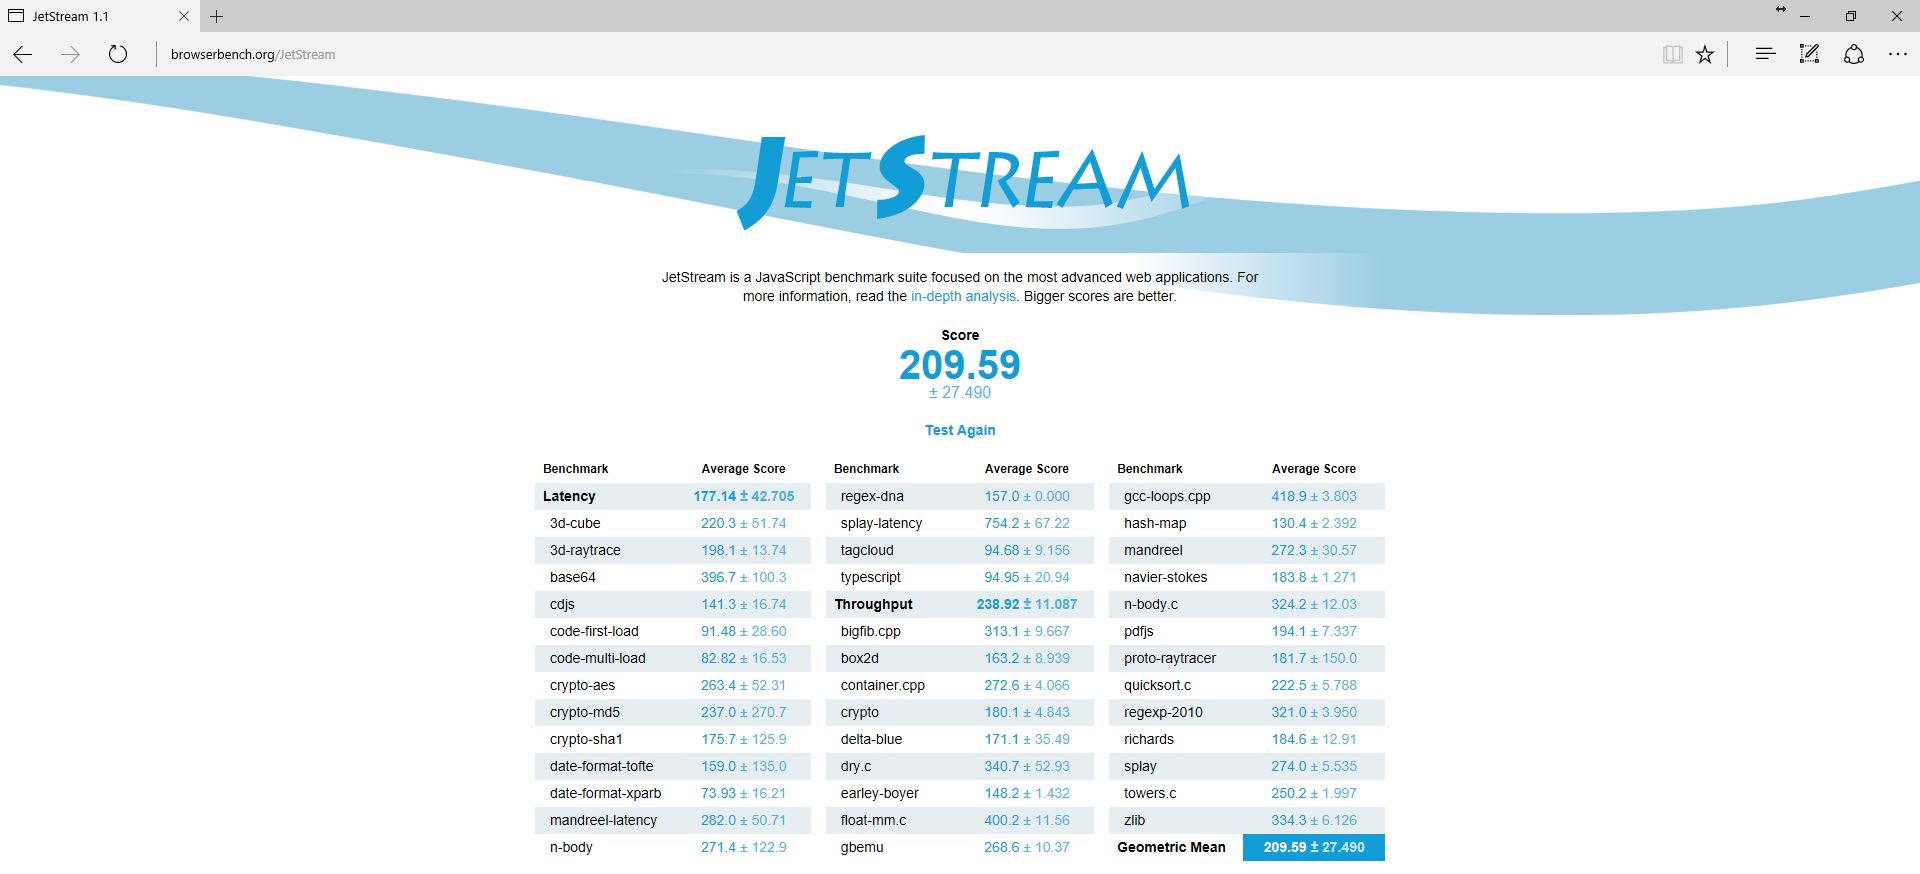
| JetStream 1.1 - 1.1 Total | |
| Lenovo Yoga 710-14IKB 80V4002HGE | |
| Lenovo Miix 510 Pro 80U10006GE | |
| Lenovo Yoga 710-14ISK | |
| Acer Aspire Switch Alpha 12 SA5-271-56HM | |
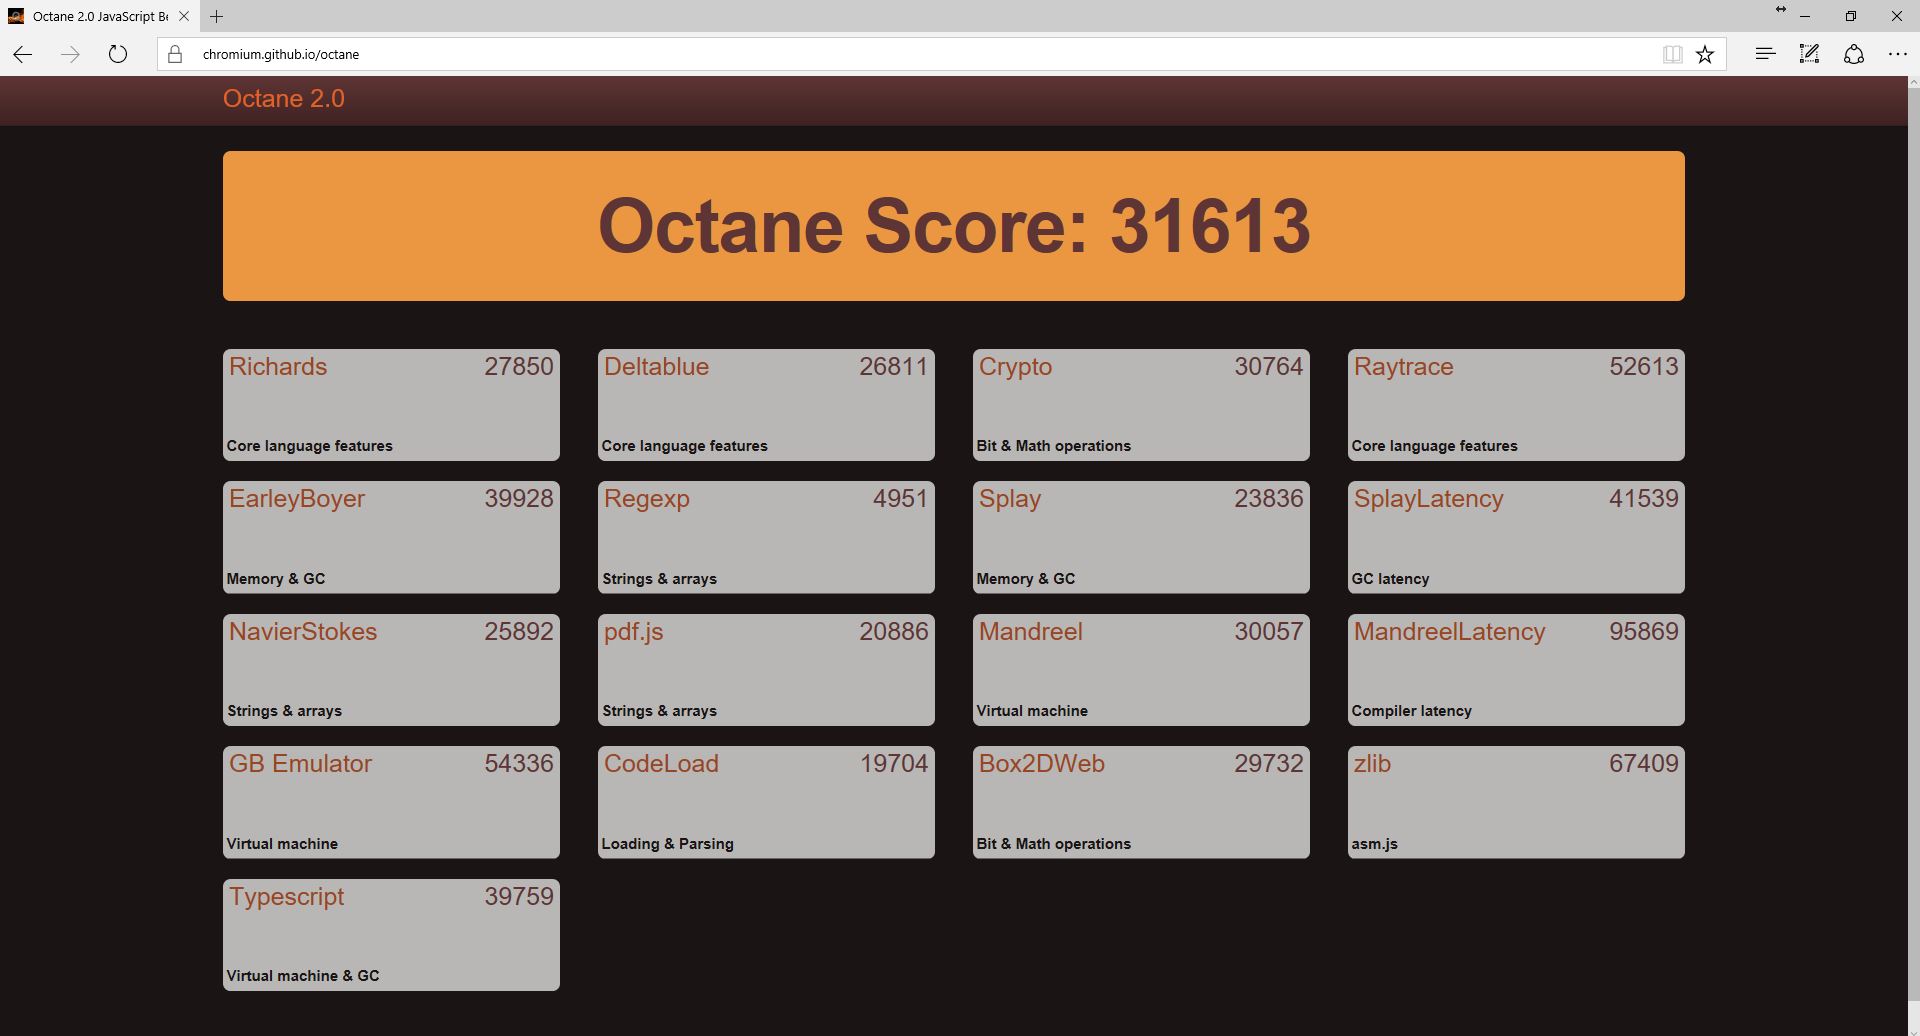
| Octane V2 - Total Score | |
| Lenovo Yoga 710-14IKB 80V4002HGE | |
| Lenovo Miix 510 Pro 80U10006GE | |
| Lenovo Yoga 710-14ISK | |
| Acer Aspire Switch Alpha 12 SA5-271-56HM | |
* ... smaller is better
| PCMark 7 | |
| Score | |
| Lenovo Yoga 710-14IKB 80V4002HGE | |
| Lenovo Yoga 710-14ISK | |
| Productivity | |
| Lenovo Yoga 710-14IKB 80V4002HGE | |
| Lenovo Yoga 710-14ISK | |
| PCMark Vantage Result | 15755 points | |
| PCMark 7 Score | 5239 points | |
| PCMark 8 Home Score Accelerated v2 | 3268 points | |
| PCMark 8 Creative Score Accelerated v2 | 3859 points | |
Help | ||
| Lenovo Yoga 710-14IKB 80V4002HGE Samsung MZYTY256HDHP | Lenovo Yoga 710-14ISK Samsung SSD PM871 MZNLN256HCHP | HP Spectre x360 13-w023dx Samsung PM951 NVMe MZVLV512 | Lenovo Miix 510 Pro 80U10006GE Samsung PM951 NVMe MZVLV256 | Acer Aspire Switch Alpha 12 SA5-271-56HM Kingston RBU-SNS8152S3256GG2 | |
|---|---|---|---|---|---|
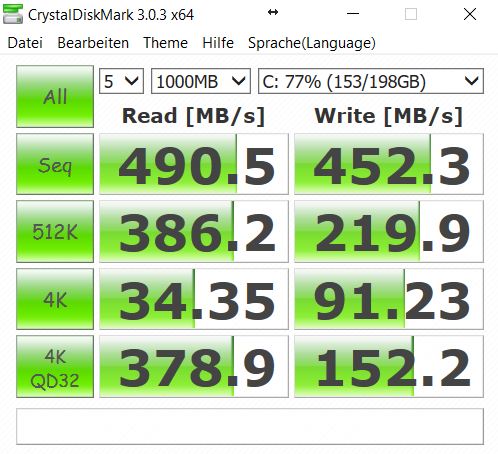
| CrystalDiskMark 3.0 | 13% | 87% | 50% | -11% | |
| Read Seq (MB/s) | 490.5 | 508 4% | 1376 181% | 1271 159% | 518 6% |
| Write Seq (MB/s) | 452.3 | 302.7 -33% | 571 26% | 305.4 -32% | 199.9 -56% |
| Read 512 (MB/s) | 386.2 | 419.9 9% | 679 76% | 651 69% | 374.9 -3% |
| Write 512 (MB/s) | 219.9 | 302.6 38% | 571 160% | 305.2 39% | 201 -9% |
| Read 4k (MB/s) | 34.35 | 33.3 -3% | 42.66 24% | 41.07 20% | 29.3 -15% |
| Write 4k (MB/s) | 91.2 | 85.8 -6% | 137.9 51% | 122.7 35% | 76.8 -16% |
| Read 4k QD32 (MB/s) | 378.9 | 395.8 4% | 535 41% | 411.2 9% | 272 -28% |
| Write 4k QD32 (MB/s) | 152.2 | 294.3 93% | 361.2 137% | 305.1 100% | 197.1 30% |

| 3DMark | |
| 1280x720 Cloud Gate Standard Graphics | |
| Lenovo Yoga 710-14ISK | |
| HP Spectre x360 13-w023dx | |
| Acer Aspire Switch Alpha 12 SA5-271-56HM | |
| Lenovo Yoga 710-14IKB 80V4002HGE | |
| Lenovo Miix 510 Pro 80U10006GE | |
| 1920x1080 Fire Strike Graphics | |
| Lenovo Yoga 710-14ISK | |
| HP Spectre x360 13-w023dx | |
| Lenovo Yoga 710-14IKB 80V4002HGE | |
| 1280x720 Ice Storm Standard Graphics | |
| HP Spectre x360 13-w023dx | |
| Lenovo Yoga 710-14IKB 80V4002HGE | |
| Lenovo Yoga 710-14ISK | |
| 3DMark 06 - 1280x1024 Standard Score AA:0x AF:0x | |
| Lenovo Yoga 710-14ISK | |
| Lenovo Yoga 710-14IKB 80V4002HGE | |
| 3DMark 03 Standard | 16812 points | |
| 3DMark 05 Standard | 12195 points | |
| 3DMark 06 Standard Score | 7923 points | |
| 3DMark Vantage P Result | 5195 points | |
| 3DMark 11 Performance | 1515 points | |
| 3DMark Ice Storm Standard Score | 48491 points | |
| 3DMark Cloud Gate Standard Score | 5429 points | |
| 3DMark Fire Strike Score | 731 points | |
| 3DMark Fire Strike Extreme Score | 324 points | |
Help | ||
| low | med. | high | ultra | |
|---|---|---|---|---|
| BioShock Infinite (2013) | 43.4 | 23.5 | 20.5 | 6.5 |
| Battlefield 4 (2013) | 42.6 | 21.9 | 19.7 | |
| Rise of the Tomb Raider (2016) | 18 | 10 | 7 | |
| Farming Simulator 17 (2016) | 56.2 | 44.3 | 17.5 | 9 |
Noise level
| Idle |
| 30.16 / 30.16 / 30.5 dB(A) |
| HDD |
| 0 dB(A) |
| Load |
| 37.2 / 37 dB(A) |
 | ||
30 dB silent 40 dB(A) audible 50 dB(A) loud |
||
min: | ||
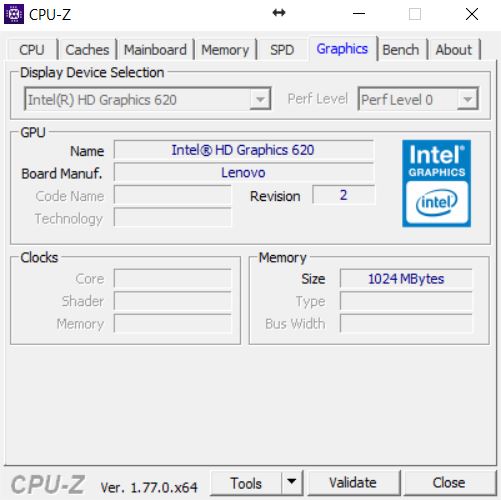
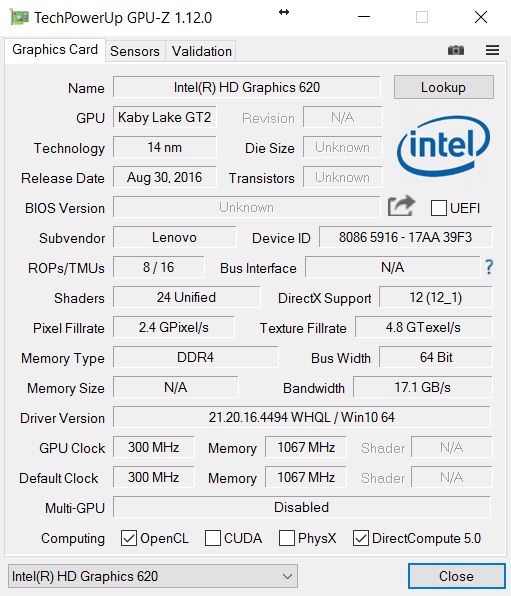
| Lenovo Yoga 710-14IKB 80V4002HGE Intel Core i5-7200U, HD Graphics 620 | Lenovo Yoga 710-14ISK Intel Core i5-6200U, GeForce 940MX | HP Spectre x360 13-w023dx Intel Core i7-7500U, HD Graphics 620 | Lenovo Miix 510 Pro 80U10006GE Intel Core i5-6200U, HD Graphics 520 | |
|---|---|---|---|---|
| Noise | -9% | 1% | 1% | |
| off / environment * (dB) | 30.16 | 32.2 -7% | 29.1 4% | 30.15 -0% |
| Idle Minimum * (dB) | 30.16 | 32.5 -8% | 29.1 4% | 30.15 -0% |
| Idle Average * (dB) | 30.16 | 34.6 -15% | 29.1 4% | 30.8 -2% |
| Idle Maximum * (dB) | 30.5 | 34.6 -13% | 31.2 -2% | 31 -2% |
| Load Average * (dB) | 37.2 | 38.7 -4% | 37.3 -0% | 36.8 1% |
| Load Maximum * (dB) | 37 | 39.9 -8% | 39.6 -7% | 33.8 9% |
* ... smaller is better
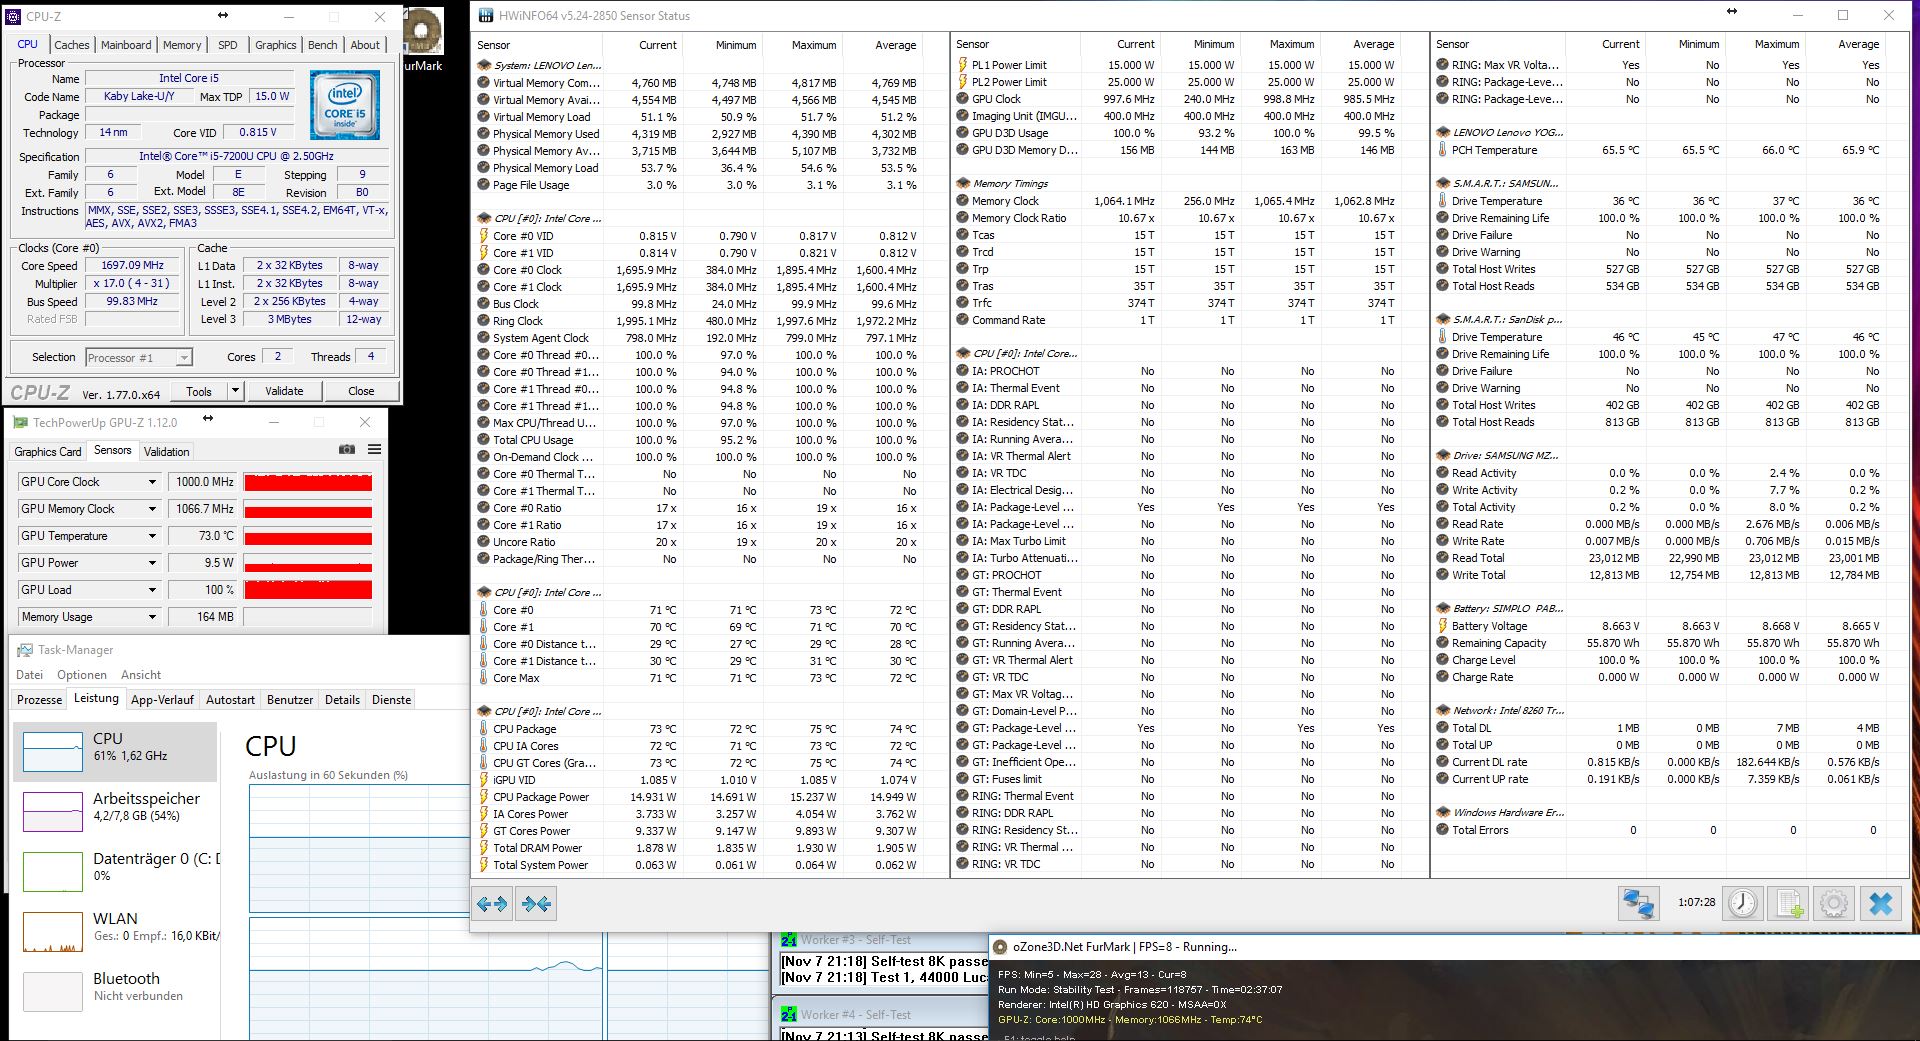
(+) The maximum temperature on the upper side is 36.4 °C / 98 F, compared to the average of 35.4 °C / 96 F, ranging from 19.6 to 60 °C for the class Convertible.
(+) The bottom heats up to a maximum of 35.1 °C / 95 F, compared to the average of 36.9 °C / 98 F
(+) In idle usage, the average temperature for the upper side is 26.4 °C / 80 F, compared to the device average of 30.3 °C / 87 F.
(+) The palmrests and touchpad are cooler than skin temperature with a maximum of 29.9 °C / 85.8 F and are therefore cool to the touch.
(±) The average temperature of the palmrest area of similar devices was 28 °C / 82.4 F (-1.9 °C / -3.4 F).
| Lenovo Yoga 710-14IKB 80V4002HGE Intel Core i5-7200U, HD Graphics 620 | Lenovo Yoga 710-14ISK Intel Core i5-6200U, GeForce 940MX | HP Spectre x360 13-w023dx Intel Core i7-7500U, HD Graphics 620 | Lenovo Miix 510 Pro 80U10006GE Intel Core i5-6200U, HD Graphics 520 | Acer Aspire Switch Alpha 12 SA5-271-56HM Intel Core i5-6200U, HD Graphics 520 | |
|---|---|---|---|---|---|
| Heat | -11% | -8% | -13% | -20% | |
| Maximum Upper Side * (°C) | 36.4 | 43.4 -19% | 48.2 -32% | 41.4 -14% | 46.7 -28% |
| Maximum Bottom * (°C) | 35.1 | 43.2 -23% | 46 -31% | 39.5 -13% | 51 -45% |
| Idle Upper Side * (°C) | 28 | 28 -0% | 24.6 12% | 36.8 -31% | 29.5 -5% |
| Idle Bottom * (°C) | 28.2 | 28.2 -0% | 23.2 18% | 26.2 7% | 28.6 -1% |
* ... smaller is better
Lenovo Yoga 710-14IKB 80V4002HGE audio analysis
(-) | not very loud speakers (68 dB)
Bass 100 - 315 Hz
(-) | nearly no bass - on average 17.3% lower than median
(±) | linearity of bass is average (12.2% delta to prev. frequency)
Mids 400 - 2000 Hz
(+) | balanced mids - only 2.7% away from median
(±) | linearity of mids is average (7.8% delta to prev. frequency)
Highs 2 - 16 kHz
(+) | balanced highs - only 1.9% away from median
(+) | highs are linear (6.7% delta to prev. frequency)
Overall 100 - 16.000 Hz
(±) | linearity of overall sound is average (17.2% difference to median)
Compared to same class
» 33% of all tested devices in this class were better, 8% similar, 59% worse
» The best had a delta of 6%, average was 20%, worst was 57%
Compared to all devices tested
» 32% of all tested devices were better, 8% similar, 60% worse
» The best had a delta of 4%, average was 23%, worst was 134%
Apple MacBook 12 (Early 2016) 1.1 GHz audio analysis
(+) | speakers can play relatively loud (83.6 dB)
Bass 100 - 315 Hz
(±) | reduced bass - on average 11.3% lower than median
(±) | linearity of bass is average (14.2% delta to prev. frequency)
Mids 400 - 2000 Hz
(+) | balanced mids - only 2.4% away from median
(+) | mids are linear (5.5% delta to prev. frequency)
Highs 2 - 16 kHz
(+) | balanced highs - only 2% away from median
(+) | highs are linear (4.5% delta to prev. frequency)
Overall 100 - 16.000 Hz
(+) | overall sound is linear (10.2% difference to median)
Compared to same class
» 7% of all tested devices in this class were better, 2% similar, 90% worse
» The best had a delta of 5%, average was 18%, worst was 53%
Compared to all devices tested
» 5% of all tested devices were better, 1% similar, 94% worse
» The best had a delta of 4%, average was 23%, worst was 134%
| Off / Standby | |
| Idle | |
| Load |
|
Key:
min: | |
| Lenovo Yoga 710-14IKB 80V4002HGE i5-7200U, HD Graphics 620, Samsung MZYTY256HDHP, a-Si WLED TFT, IPS, 1920x1080, 14" | Lenovo Yoga 710-14ISK 6200U, GeForce 940MX, Samsung SSD PM871 MZNLN256HCHP, a-Si WLED TFT, IPS, 1920x1080, 14" | HP Spectre x360 13-w023dx i7-7500U, HD Graphics 620, Samsung PM951 NVMe MZVLV512, IPS, 1920x1080, 13.3" | Lenovo Miix 510 Pro 80U10006GE 6200U, HD Graphics 520, Samsung PM951 NVMe MZVLV256, IPS, 1920x1200, 12.2" | Acer Aspire Switch Alpha 12 SA5-271-56HM 6200U, HD Graphics 520, Kingston RBU-SNS8152S3256GG2, IPS, 2160x1440, 12" | |
|---|---|---|---|---|---|
| Power Consumption | -40% | -11% | -22% | -28% | |
| Idle Minimum * (Watt) | 3.7 | 4.9 -32% | 5.5 -49% | 4.2 -14% | 7.3 -97% |
| Idle Average * (Watt) | 7.16 | 9.4 -31% | 6.7 6% | 11.5 -61% | 10 -40% |
| Idle Maximum * (Watt) | 8.3 | 10.7 -29% | 7.1 14% | 11.7 -41% | 10.15 -22% |
| Load Average * (Watt) | 30.4 | 46 -51% | 33.1 -9% | 31 -2% | 25.2 17% |
| Load Maximum * (Watt) | 30.3 | 47.2 -56% | 35.2 -16% | 27.4 10% | 29.3 3% |
* ... smaller is better
| Lenovo Yoga 710-14IKB 80V4002HGE i5-7200U, HD Graphics 620, 53 Wh | Lenovo Yoga 710-14ISK 6200U, GeForce 940MX, 53 Wh | HP Spectre x360 13-w023dx i7-7500U, HD Graphics 620, 57.8 Wh | Lenovo Miix 510 Pro 80U10006GE 6200U, HD Graphics 520, 50 Wh | Acer Aspire Switch Alpha 12 SA5-271-56HM 6200U, HD Graphics 520, 37 Wh | |
|---|---|---|---|---|---|
| Battery runtime | -6% | 8% | -27% | -24% | |
| Reader / Idle (h) | 16 | 16 0% | 20.6 29% | 11.6 -27% | 10.7 -33% |
| H.264 (h) | 8.7 | 7.1 -18% | 7.8 -10% | ||
| WiFi v1.3 (h) | 9.4 | 7.2 -23% | 9.3 -1% | 5.4 -43% | 5.4 -43% |
| Load (h) | 2.1 | 2.5 19% | 2 -5% | 1.9 -10% | 1.9 -10% |
Pros
Cons
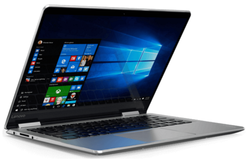
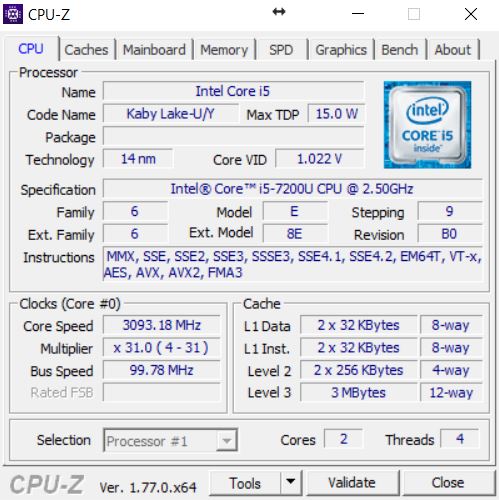
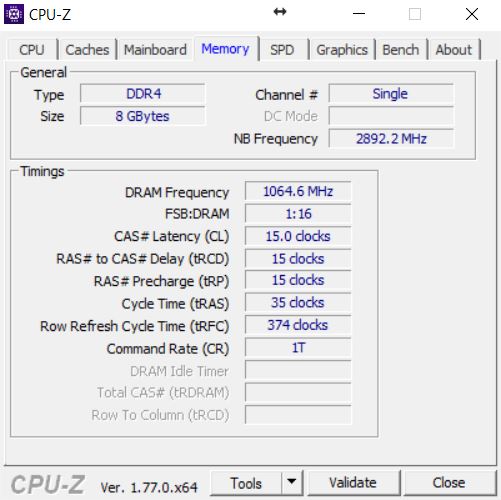
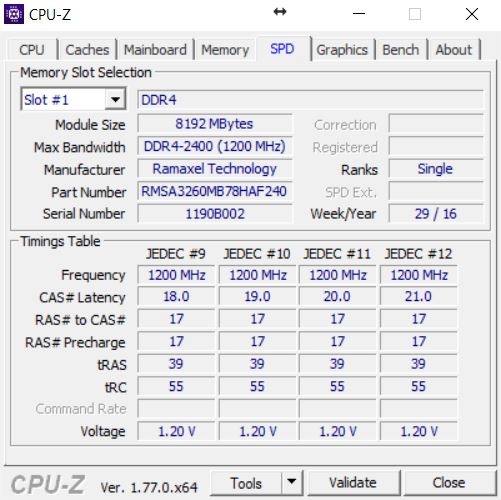
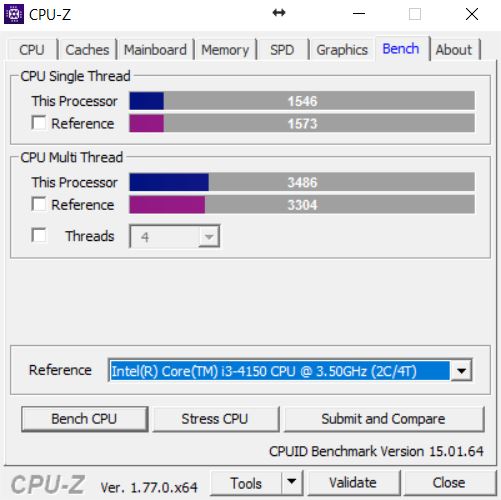
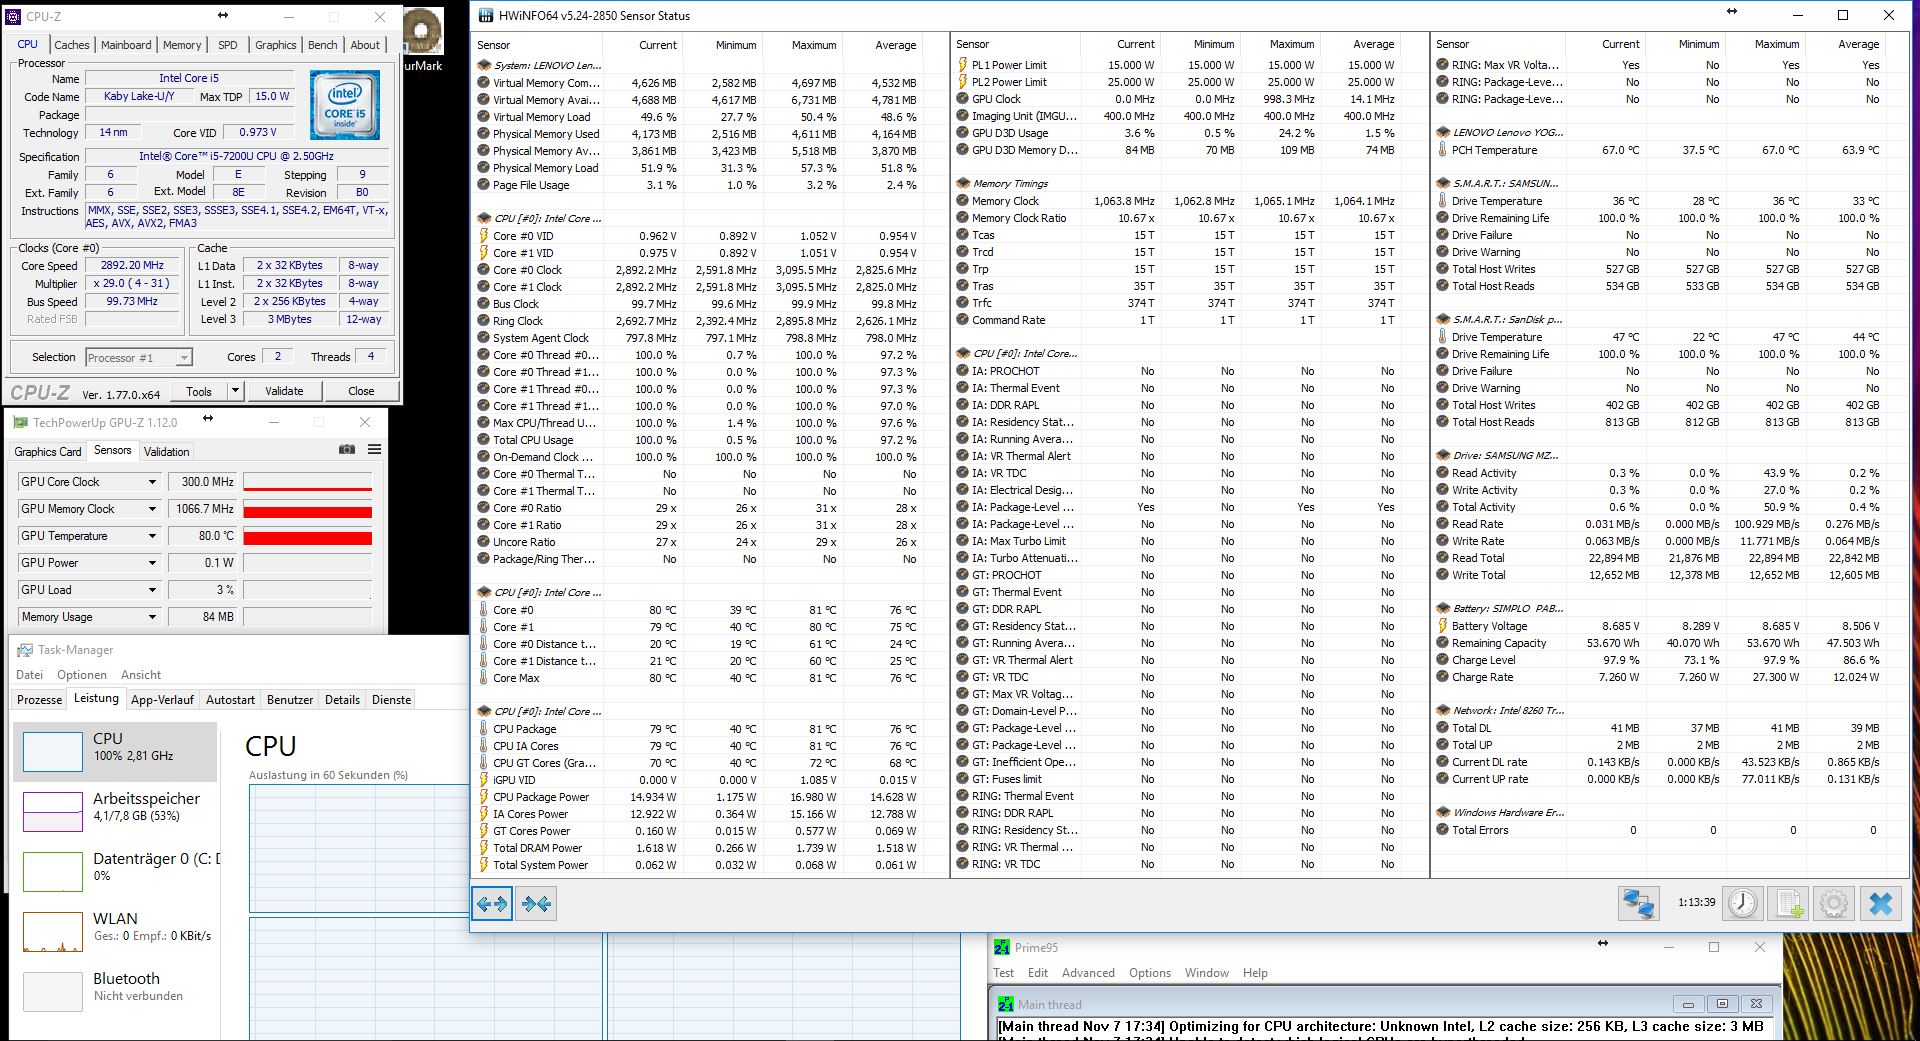
联想Yoga 710-14IKB只是一个常规硬件更新。这台耐力很强的变形本现在得到了Kaby Lake处理器,在同样功耗下可以提供10%到15%的性能提升。我们的测试机型搭配了英特尔酷睿 i5-7200U处理器和8GB DDR4内存以及256GB固态硬盘。Yoga 710-14IKB的低功耗和长电池续航是它的最大优势。
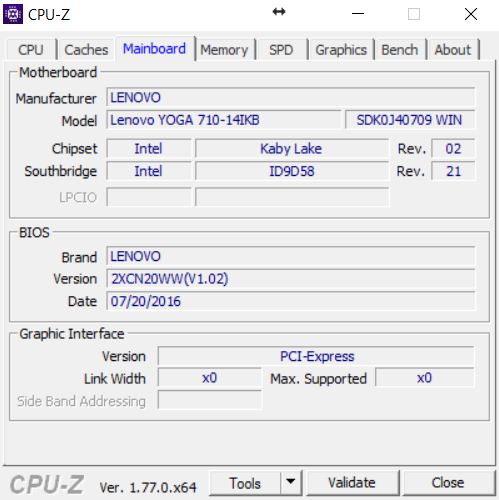
得到Kaby Lake更新的联想710-14IKB依然延续了前代机型的美观机身设计。新机型的性能略有提升,而由于电池续航优秀,这台可靠的联想变形本十分适合长时间旅行使用。
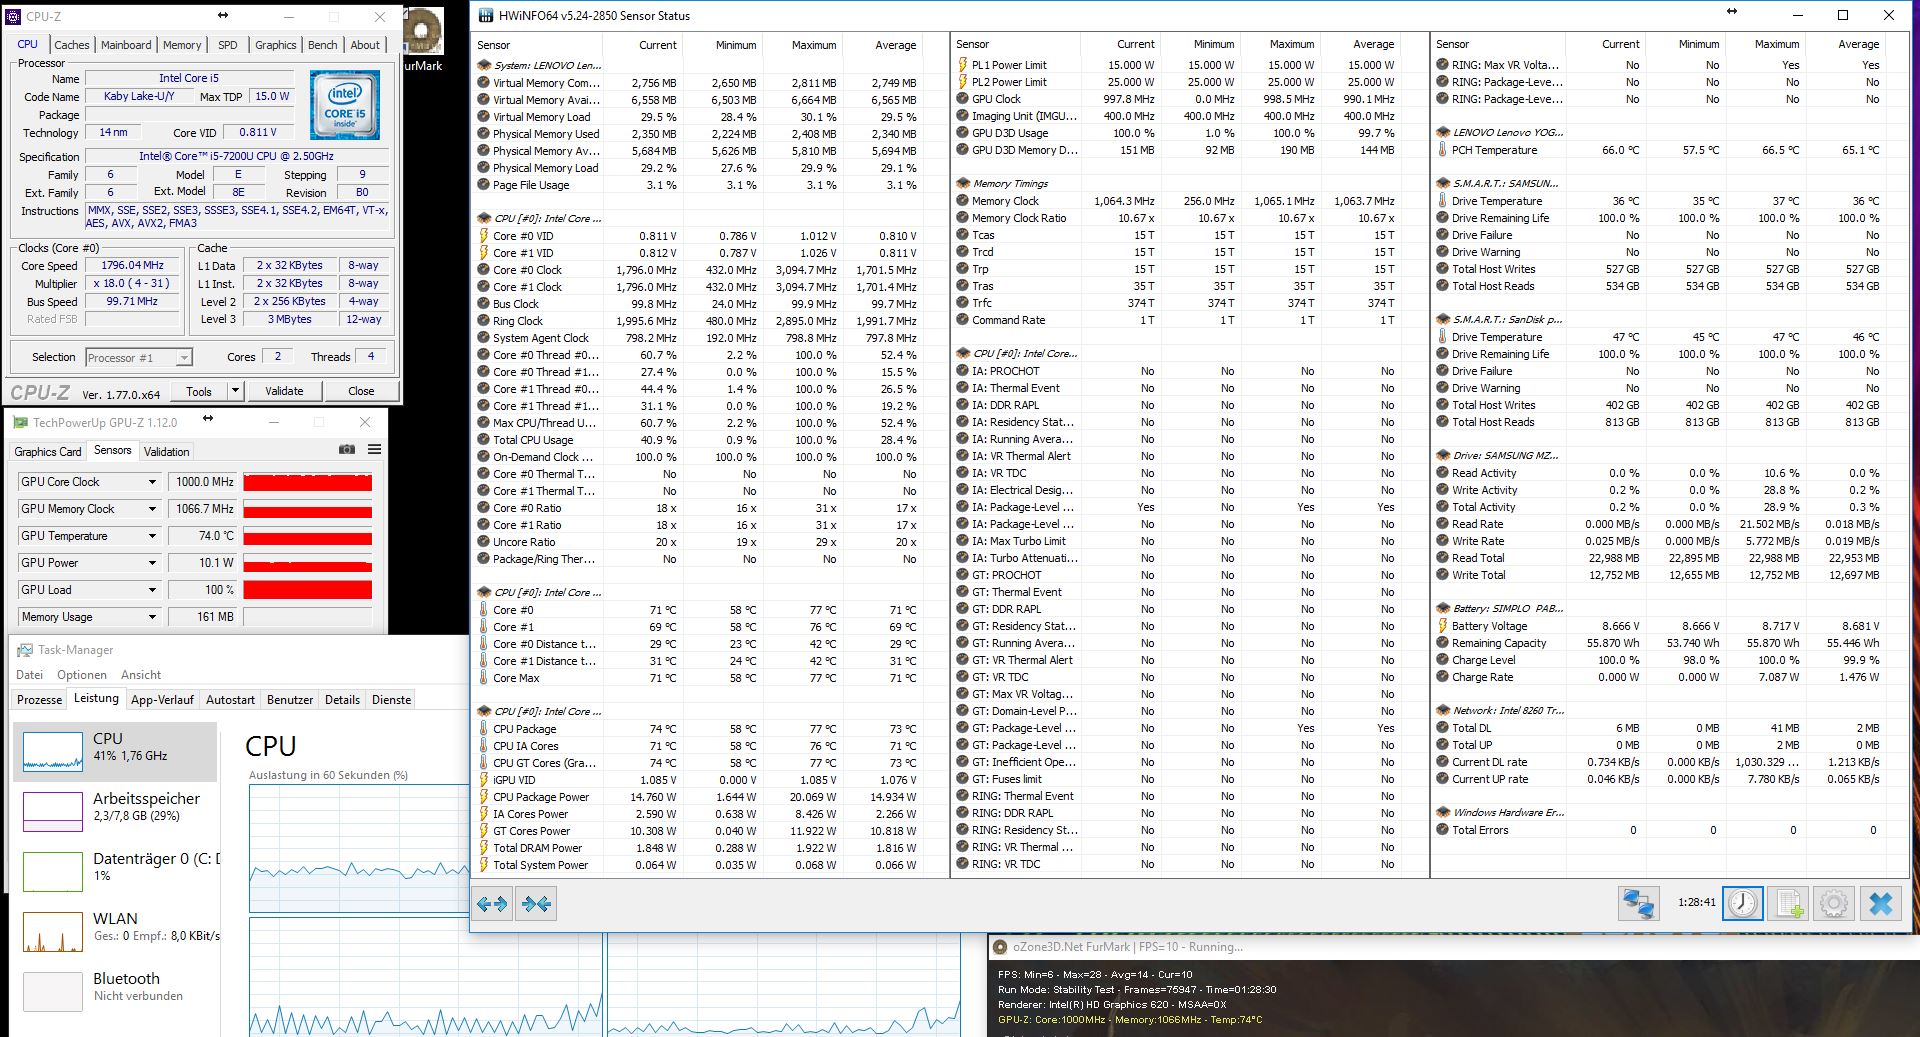
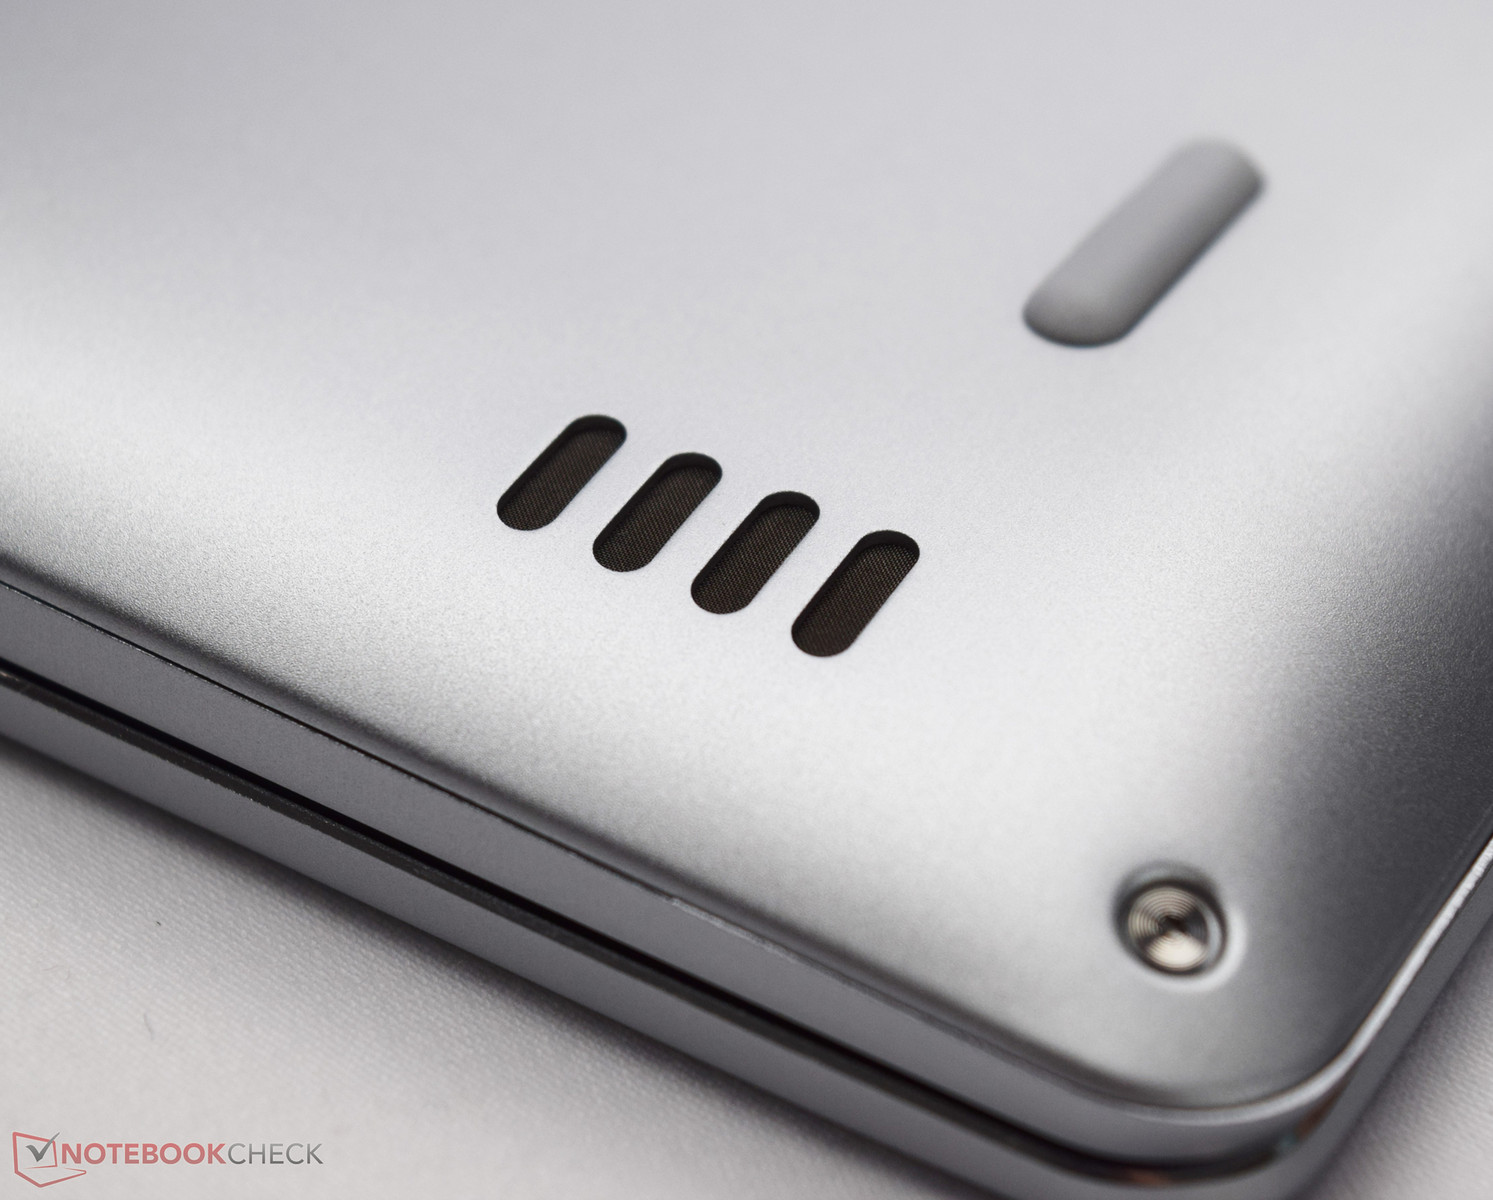
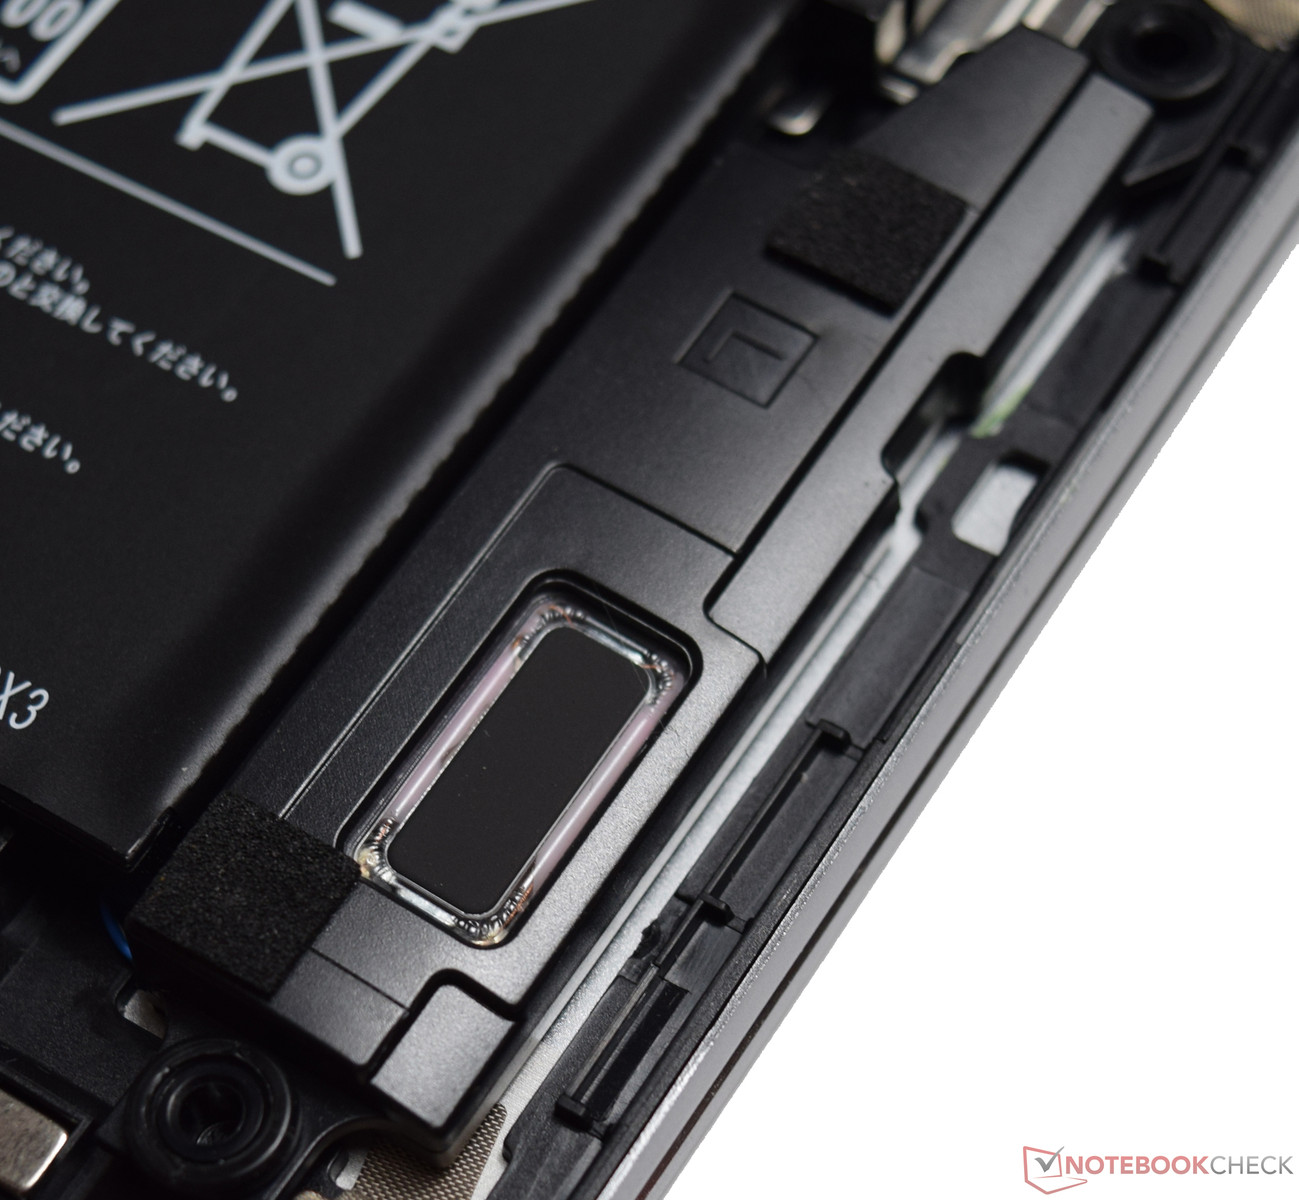
由于生产商没有改变前代机型的设计,我们仍然发现了相似的问题。它的麦克风位置很接近散热风扇口,这在视频通话中会带来不小的不便,因为另一方会一直听到风扇声。整体上,这台变形本表现十分细腻而全面。我们很喜欢它的机身材质,而性能表现也可以满足大部分日常需要。
注:本文是基于完整评测的缩减版本,阅读完整的英文评测,请点击这里。
Lenovo Yoga 710-14IKB 80V4002HGE
- 11/13/2016 v5.1 (old)
Sebastian Bade
Price comparison
