Notebookcheck Logo

华硕 TUF GamingGeForce RTX 4070 Ti 超级评测:AD103 中端游戏机,挑战 RX 7900 XT 并取代 RTX 3090 Ti,售价低 300 美元

AD103 块上的芯片。 华硕 TUF GamingGeForce RTX 4070 Ti Super 现在获得了 AD103 的支持,CUDA 核心数增加了 10%,256 位 16 GB GDDR6X VRAM 也得到了大幅提升。华硕最新推出的入门级 RTX 4070 Ti Super SKU 不仅拥有 TUF GPU 的所有优势,还能以相对较低的 799 美元售价与 Radeon RX 7900 XT 和 RTX 3090 Ti 相媲美。
Nvidia Geforce GPU Desktop Gaming
华硕 TUF GamingGeForce RTX 4070 Ti 超级版评测

英伟达 推出RTX 4070 Ti Super 的同时,还推出了 RTX 4070 超级RTX 4080 超级版早在 2024 年的 CES 展会上就同时推出了 RTX 4070 Ti Super 和 RTX 4080 Super。此次更新后,RTX 4070 Ti Super 现在已成为 AD103 GPU,除了 CUDA 内核数的惯常增加外,还带来了内存子系统的大幅升级。

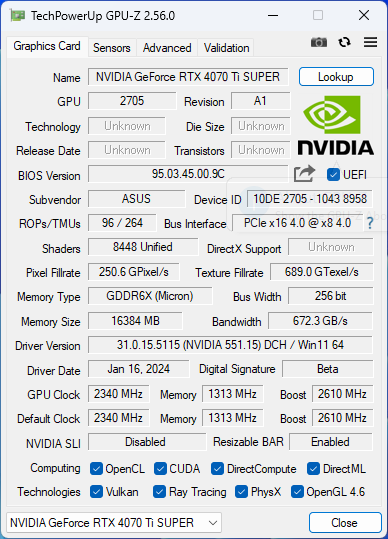
RTX 4070 Ti Super 现在拥有 8448 个 CUDA 内核,比原来 RTX 4070 Ti 的 7680 个着色器增加了 10%。由于采用了 AD103 硅芯片,该显卡拥有 16 GB GDDR6X 256 位内存总线,可提供 672 GB/s 的带宽。

Nvidia 再次选择不为 RTX 4070 Ti Super 提供 Founders Edition,但在附加板(AiB)合作伙伴提供的产品中有很多选择。大多数 AiB 的显卡都以 799 美元的 MSRP 为目标,同时还提供加价的附加功能 SKU。

与此相对应,我们现在有了新的华硕 TUF GamingGeForce RTX 4070 Ti Super。这款显卡在印度的售价为 799 美元或 9.5 万英镑,并提供三年保修。华硕还推出了该显卡的 OC 变体,完全取代了原来的 TUF GamingGeForce RTX 4070 Ti OC的 OC 版。

在这篇评测中,我们将对华硕 TUF GamingGeForce RTX 4070 Ti Super 进行测试,看看这些硬件改进是否会在合成基准测试和游戏中带来任何实际收益。

华硕 TUF Gaming RTX 4070 Ti Super 与其他 Nvidia GPU 的比较

规格 RTX 4090 FE RTX 4080 Super FE RTX 4080 FE 华硕 TUF RTX 4070 Ti Super 华硕 TUFRTX 4070 Ti RTX 4070 Super ZotacRTX 4070 AMP Airo KFA2 RTX4060 Ti EX RTX 3090 Ti FE RTX 3090 FE RTX 3080TiFE RTX 3070 Ti FE RTX 3070 FE TitanRTX
芯片 AD102 AD103 AD103 AD103 AD104 AD104 AD104 AD106 GA102 GA102 GA102 GA104 GA104 TU102
FinFET 工艺 定制 4N 定制 4N 定制 4N 定制 4N 定制 4N 定制 4N 定制 4N 定制 4N 8 nm 8 nm 8 nm 8 nm 8 nm 12 nm
CUDA 内核 16,384 10,240 9,728 8,448 7,680 7,168 5,888 4,352 10,752 10,496 10,240 6,144 5,888 4,608
纹理单元 512 320 304 264 240 224 184 136 336 328 320 192 184 288
张量核 512 第 4 代 320 第 4 代 304 第 4 代 264第 4 代 240 第 4 代 224 第 4 代 184 第 4 代 136 第 4 代 336 第 3 代 328 第 3 代 320 第 3 代 192 第 3 代 184 第 3 代 576 第 2 代
RT 内核 128 第 3 代 80 第 3 代 76 第 3 代 66第 3 代 60 第 3 代 56 第 3 代 46 第 3 代 34 第 3 代 84 第 2 代 82 第 2 代 80 第 2 代 48 第 2 代 46 第 2 代 72
GPU 基本时钟 2,235 MHz 2,295 MHz 2,205 MHz 2,340MHz 2,310 MHz 1,980 MHz 1,920 MHz 2,310 MHz 1,560 MHz 1,395 MHz 1,365 MHz 1,575 MHz 1,500 MHz 1,350 MHz
GPU 提升时钟 2,520 MHz 2,550 MHz 2,505 MHz 2,610MHz 2,760 MHz 2,565 MHz 2,535 MHz 2,535 MHz 1,860 MHz 1,695 MHz 1,665 MHz 1,770 MHz 1,750 MHz 1,770 MHz
内存总线 384 位 256 位 256 位 256 位 192 位 192 位 192 位 128 位 384 位 384 位 384 位 256 位 256 位 384 位
内存带宽 1,008 GB/s 736.3 GB/s 716.8 GB/s 672 GB/s 504 GB/s 504 GB/s 504 GB/s 288 GB/s 1,008 GB/s 936 GB/s 912 GB/s 608 GB/s 448 GB/s 672 GB/s
显存 24 GB GDDR6X 16 GB GDDR6X 16 GB GDDR6X 16GB GDDR6X 12 GB GDDR6X 12 GB GDDR6X 12 GB GDDR6X 8 GB GDDR6X 24 GB GDDR6X 24 GB GDDR6X 12 GB GDDR6X 8 GB GDDR6X 8 GB GDDR6 24 GB GDDR6
功耗 450 W 320 W 320 W 285W 285 W 220 W 215 W 160 W 450 W 350 W 350 W 290 W 220 W 280 W

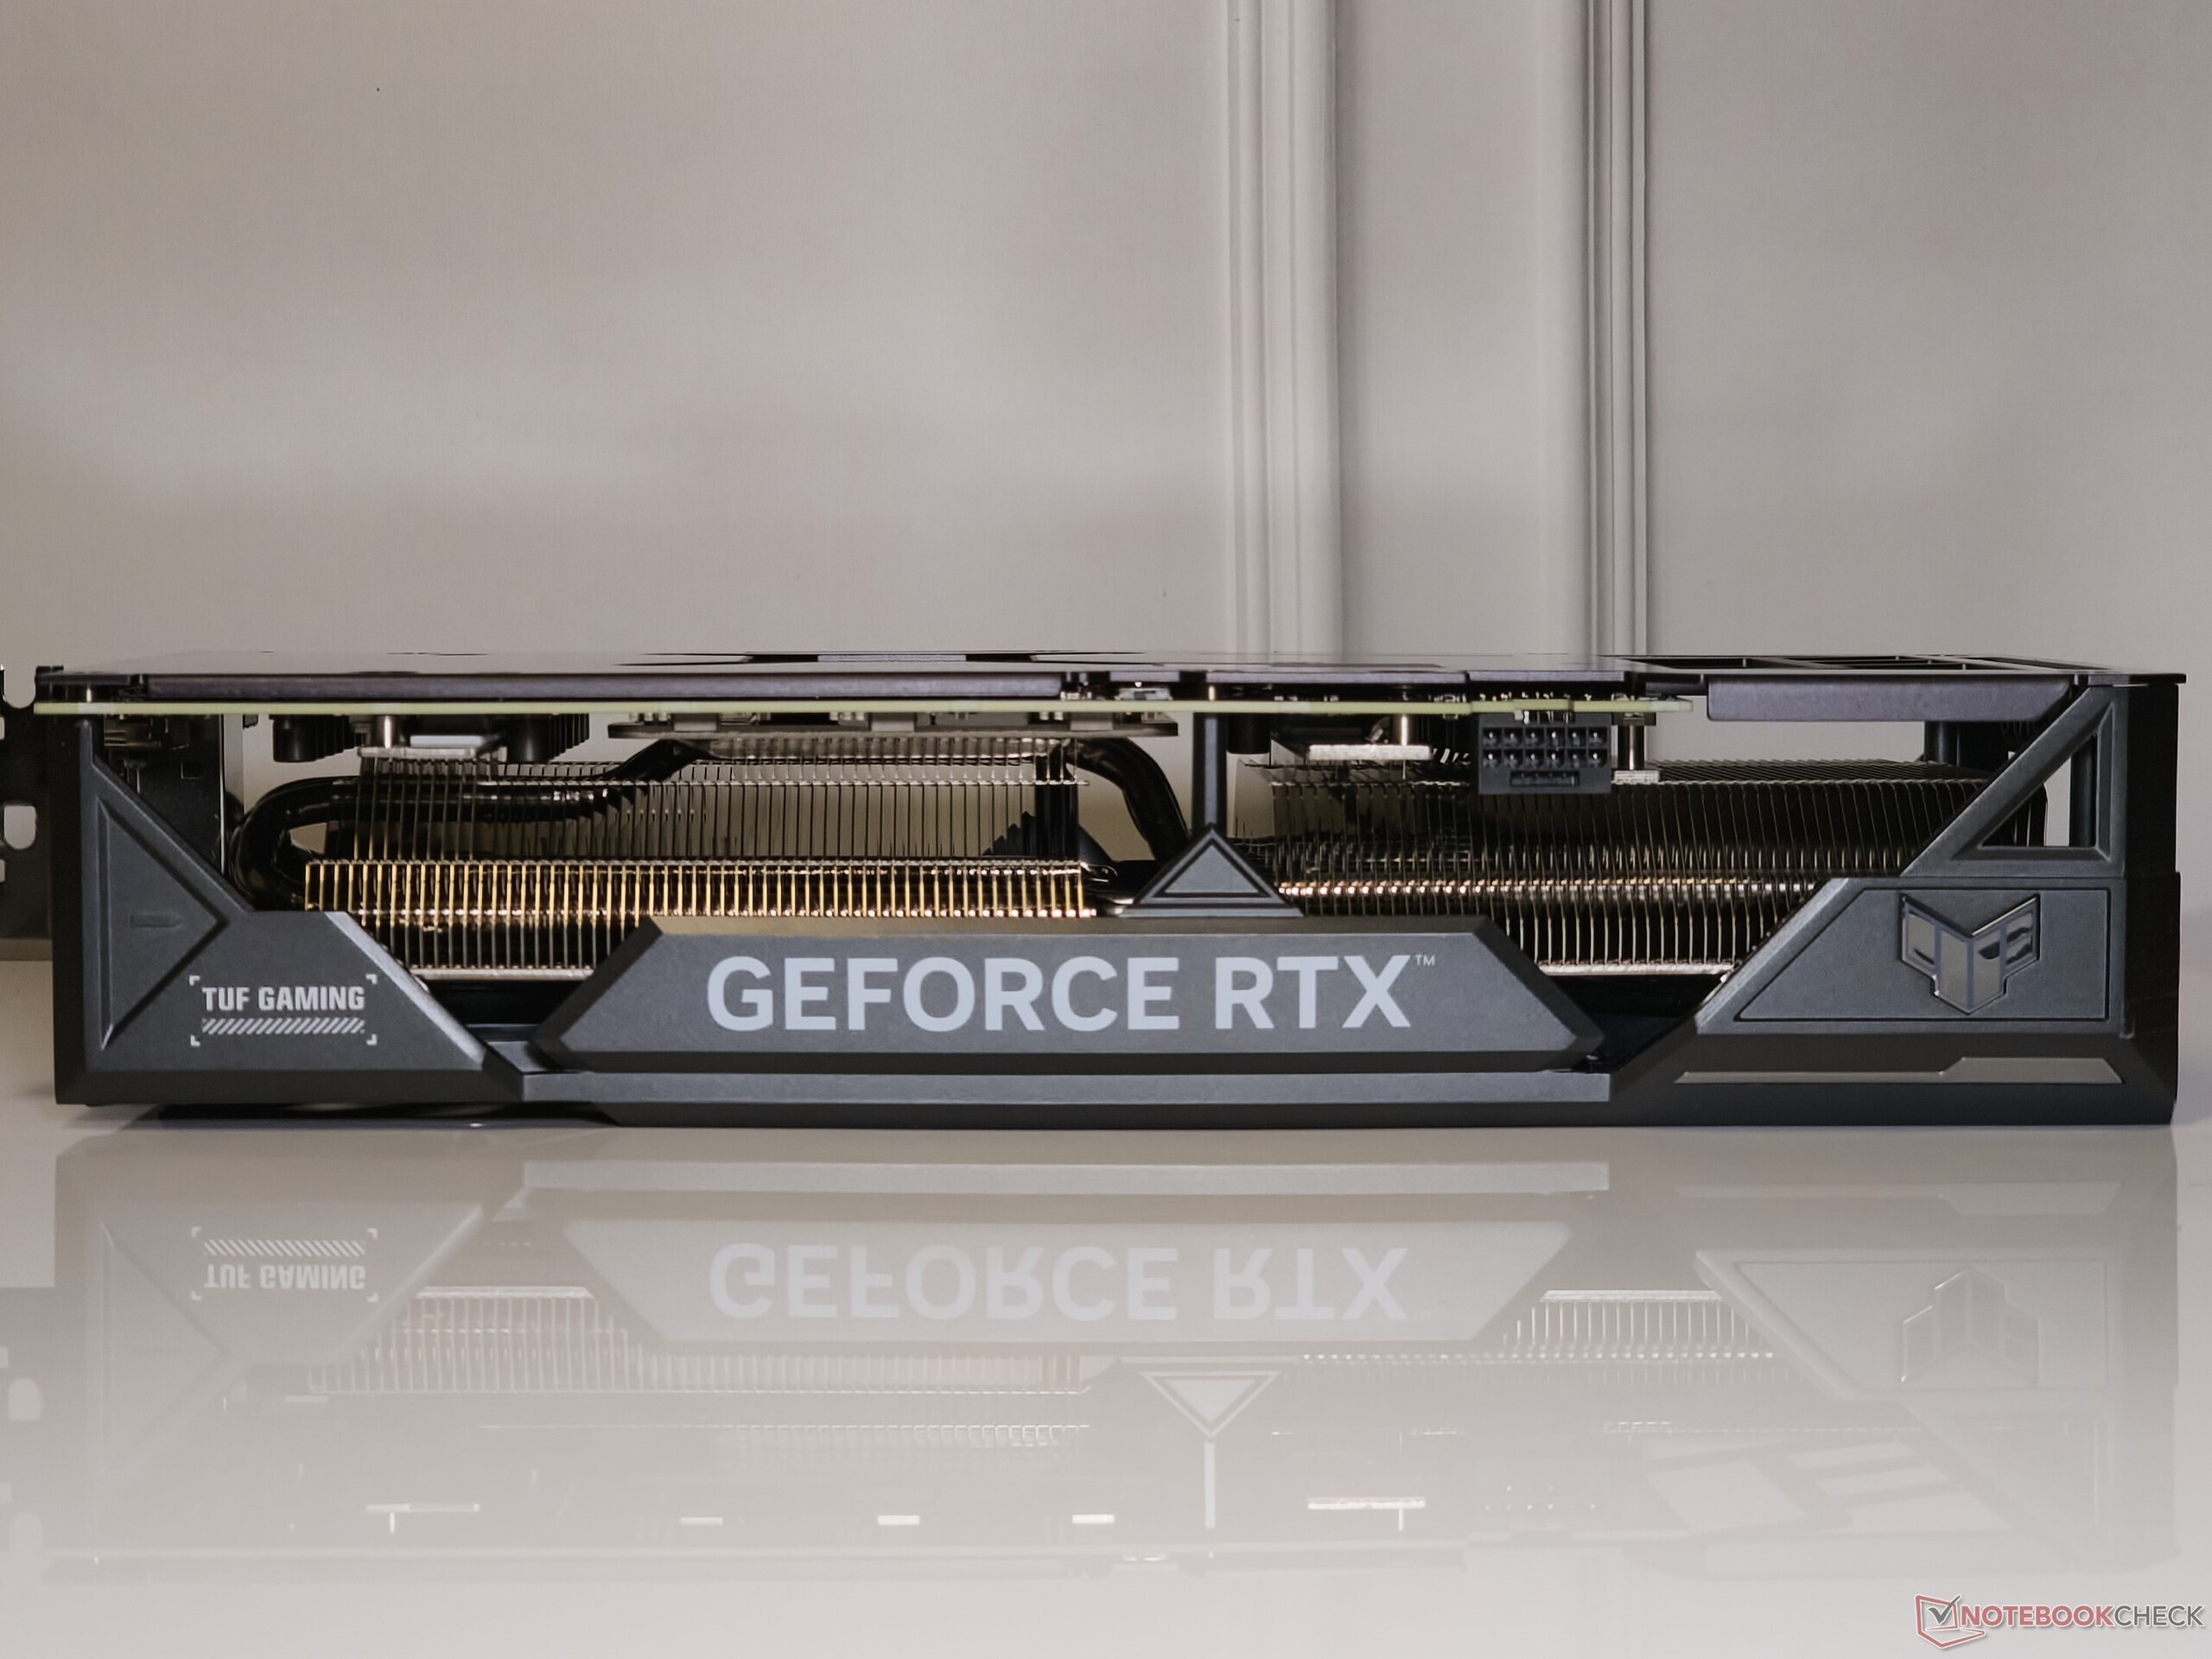
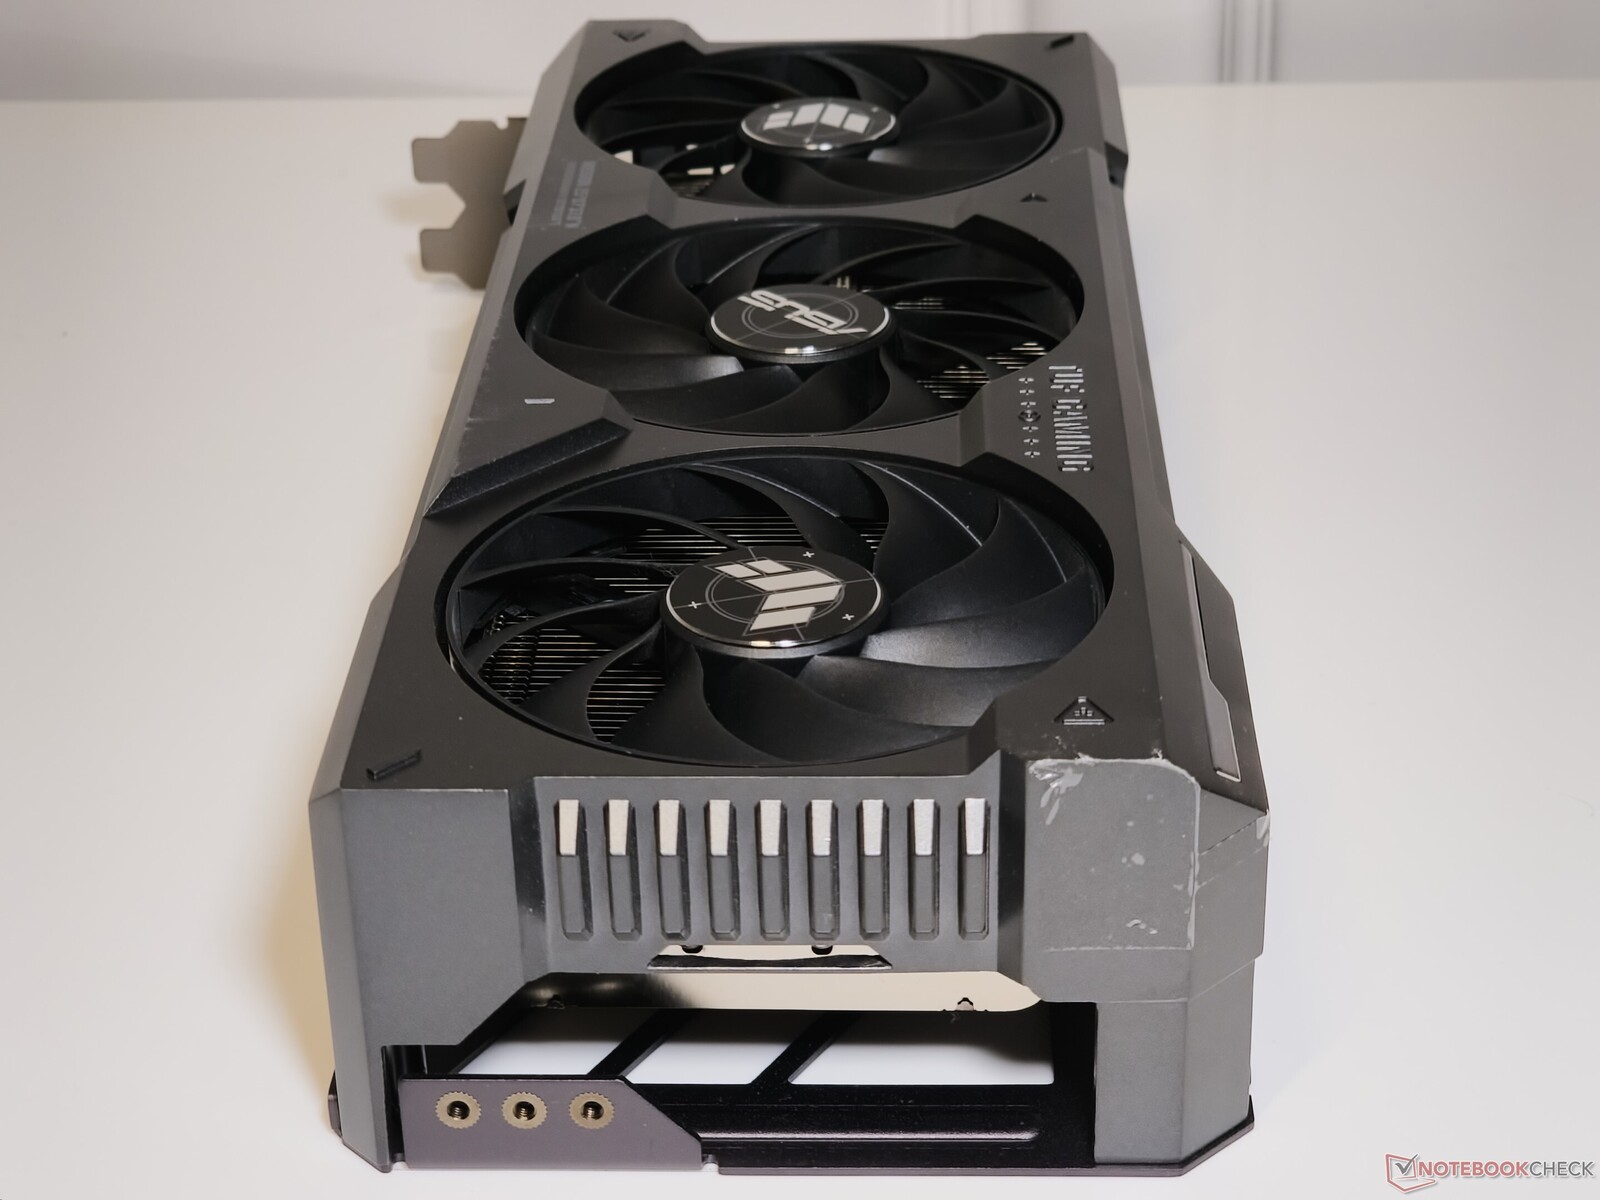
华硕 TUF GamingGeForce RTX 4070 Ti 超级版近距离观看

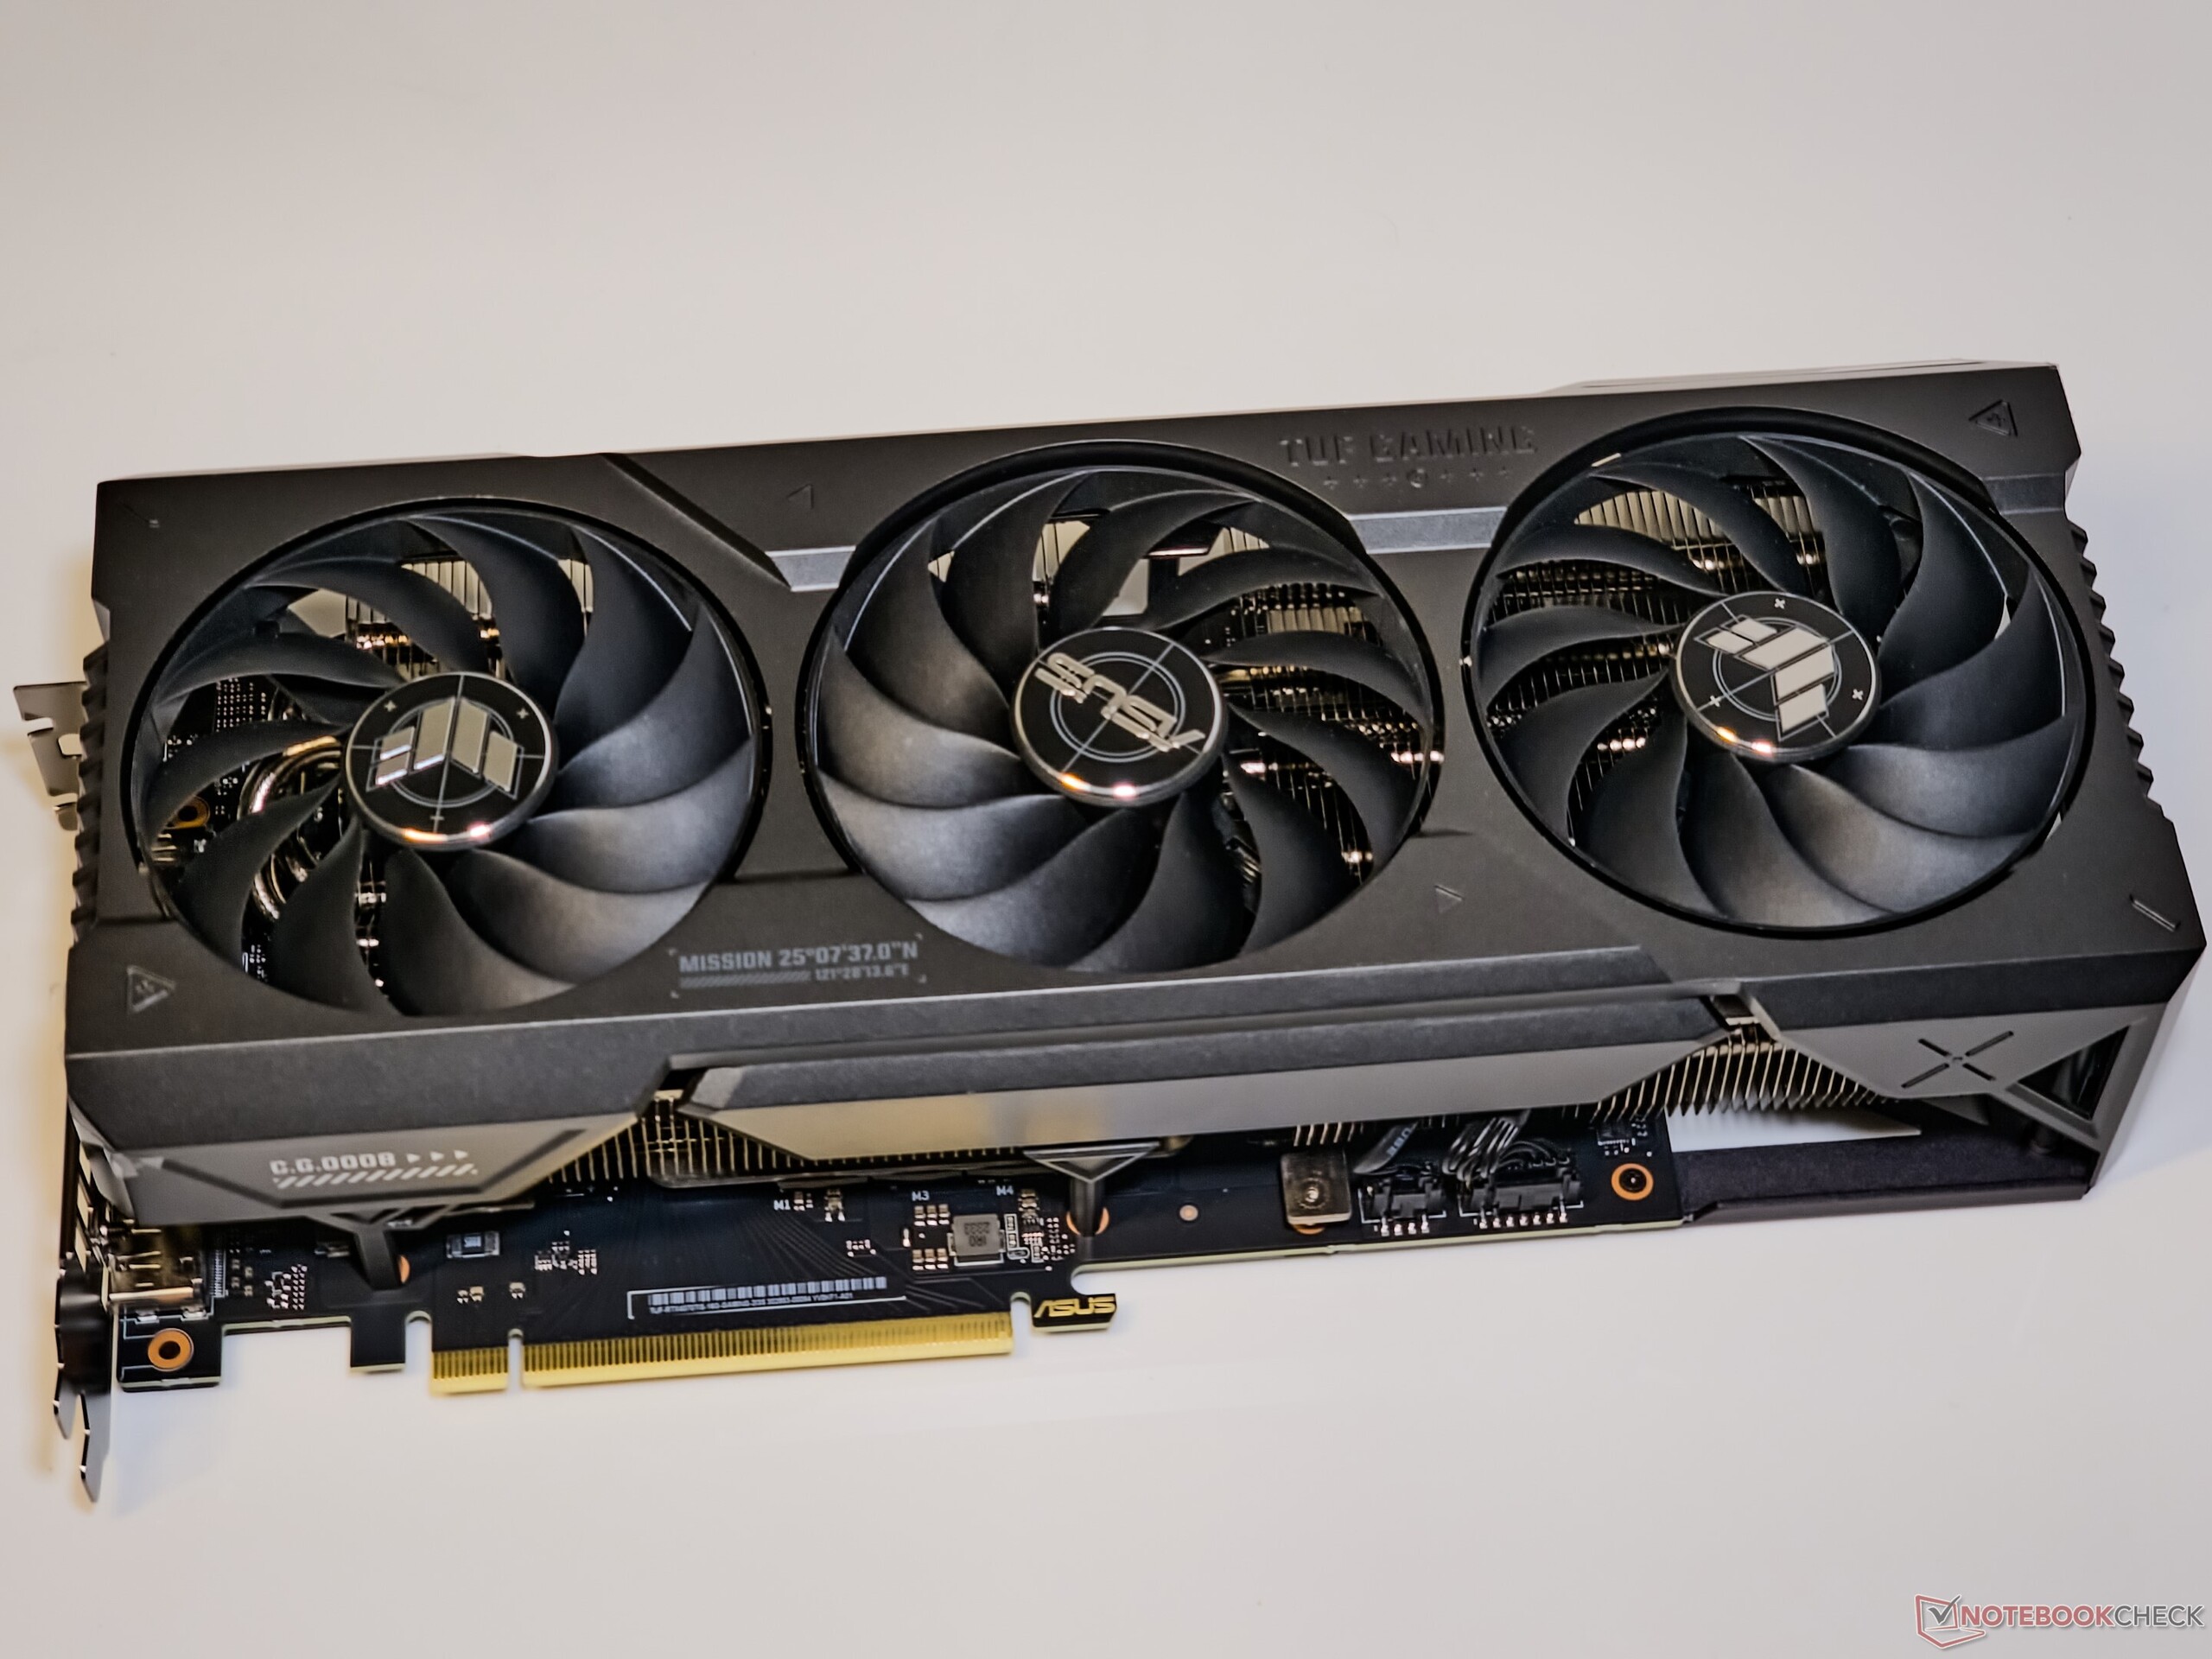
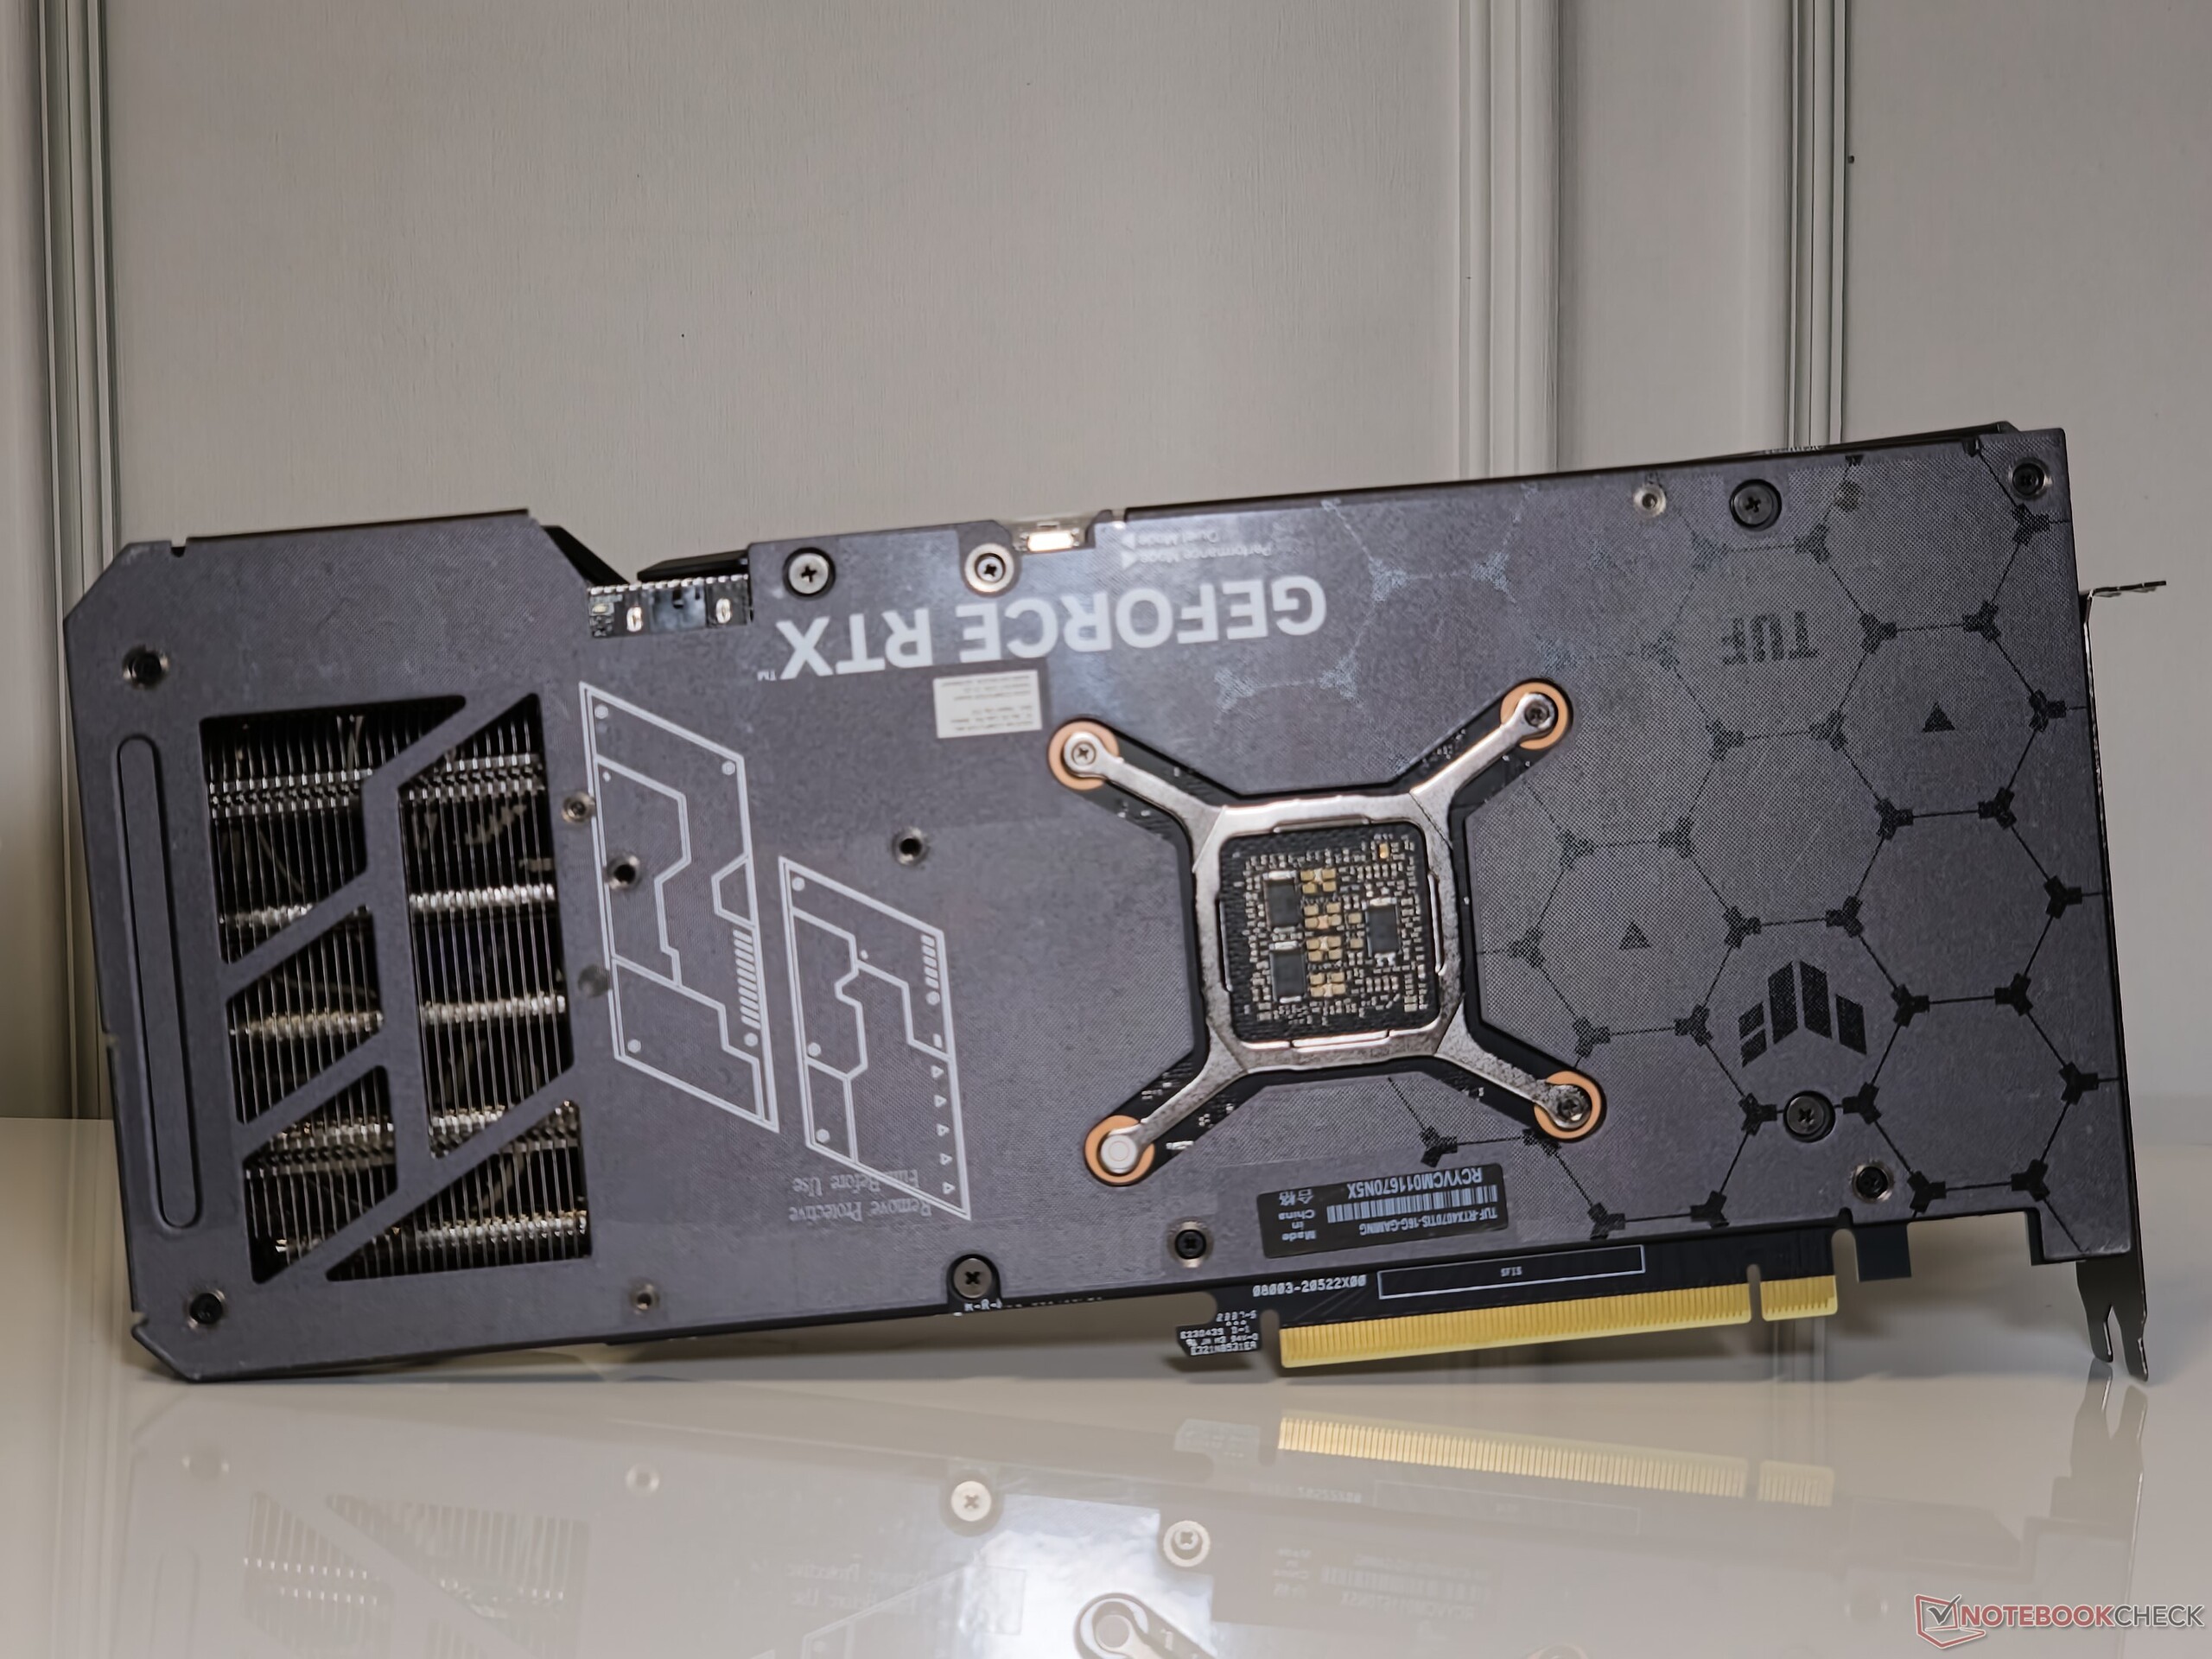
TUF 显卡可能是华硕 RTX 4070 Ti 超级显卡的入门级产品,但它的构造却像一辆坦克。该显卡采用金属护罩,这在非高级产品中十分罕见。金属背板增加了令人放心的厚重感,并设有通风孔。

TUF GamingGeForce RTX 4070 Ti Super 的尺寸为 305 x 138 x 65 毫米,毫不吝啬地占据了主板上近 3.5 个插槽。如果您打算添加其他扩展卡,并且您的板子是 ATX 或更小的板子,PCIe 插槽间距很近,那么这一点一定要牢记。

华硕 TUF GamingGeForce RTX 4070 Ti Super:正面
华硕 TUF GamingGeForce RTX 4070 Ti Super
华硕 TUF GamingGeForce RTX 4070 Ti Super:后部
华硕 TUF GamingGeForce RTX 4070 Ti Super
端口3x DisplayPort 1.4 输出,2x HDMI 2.1a 输出

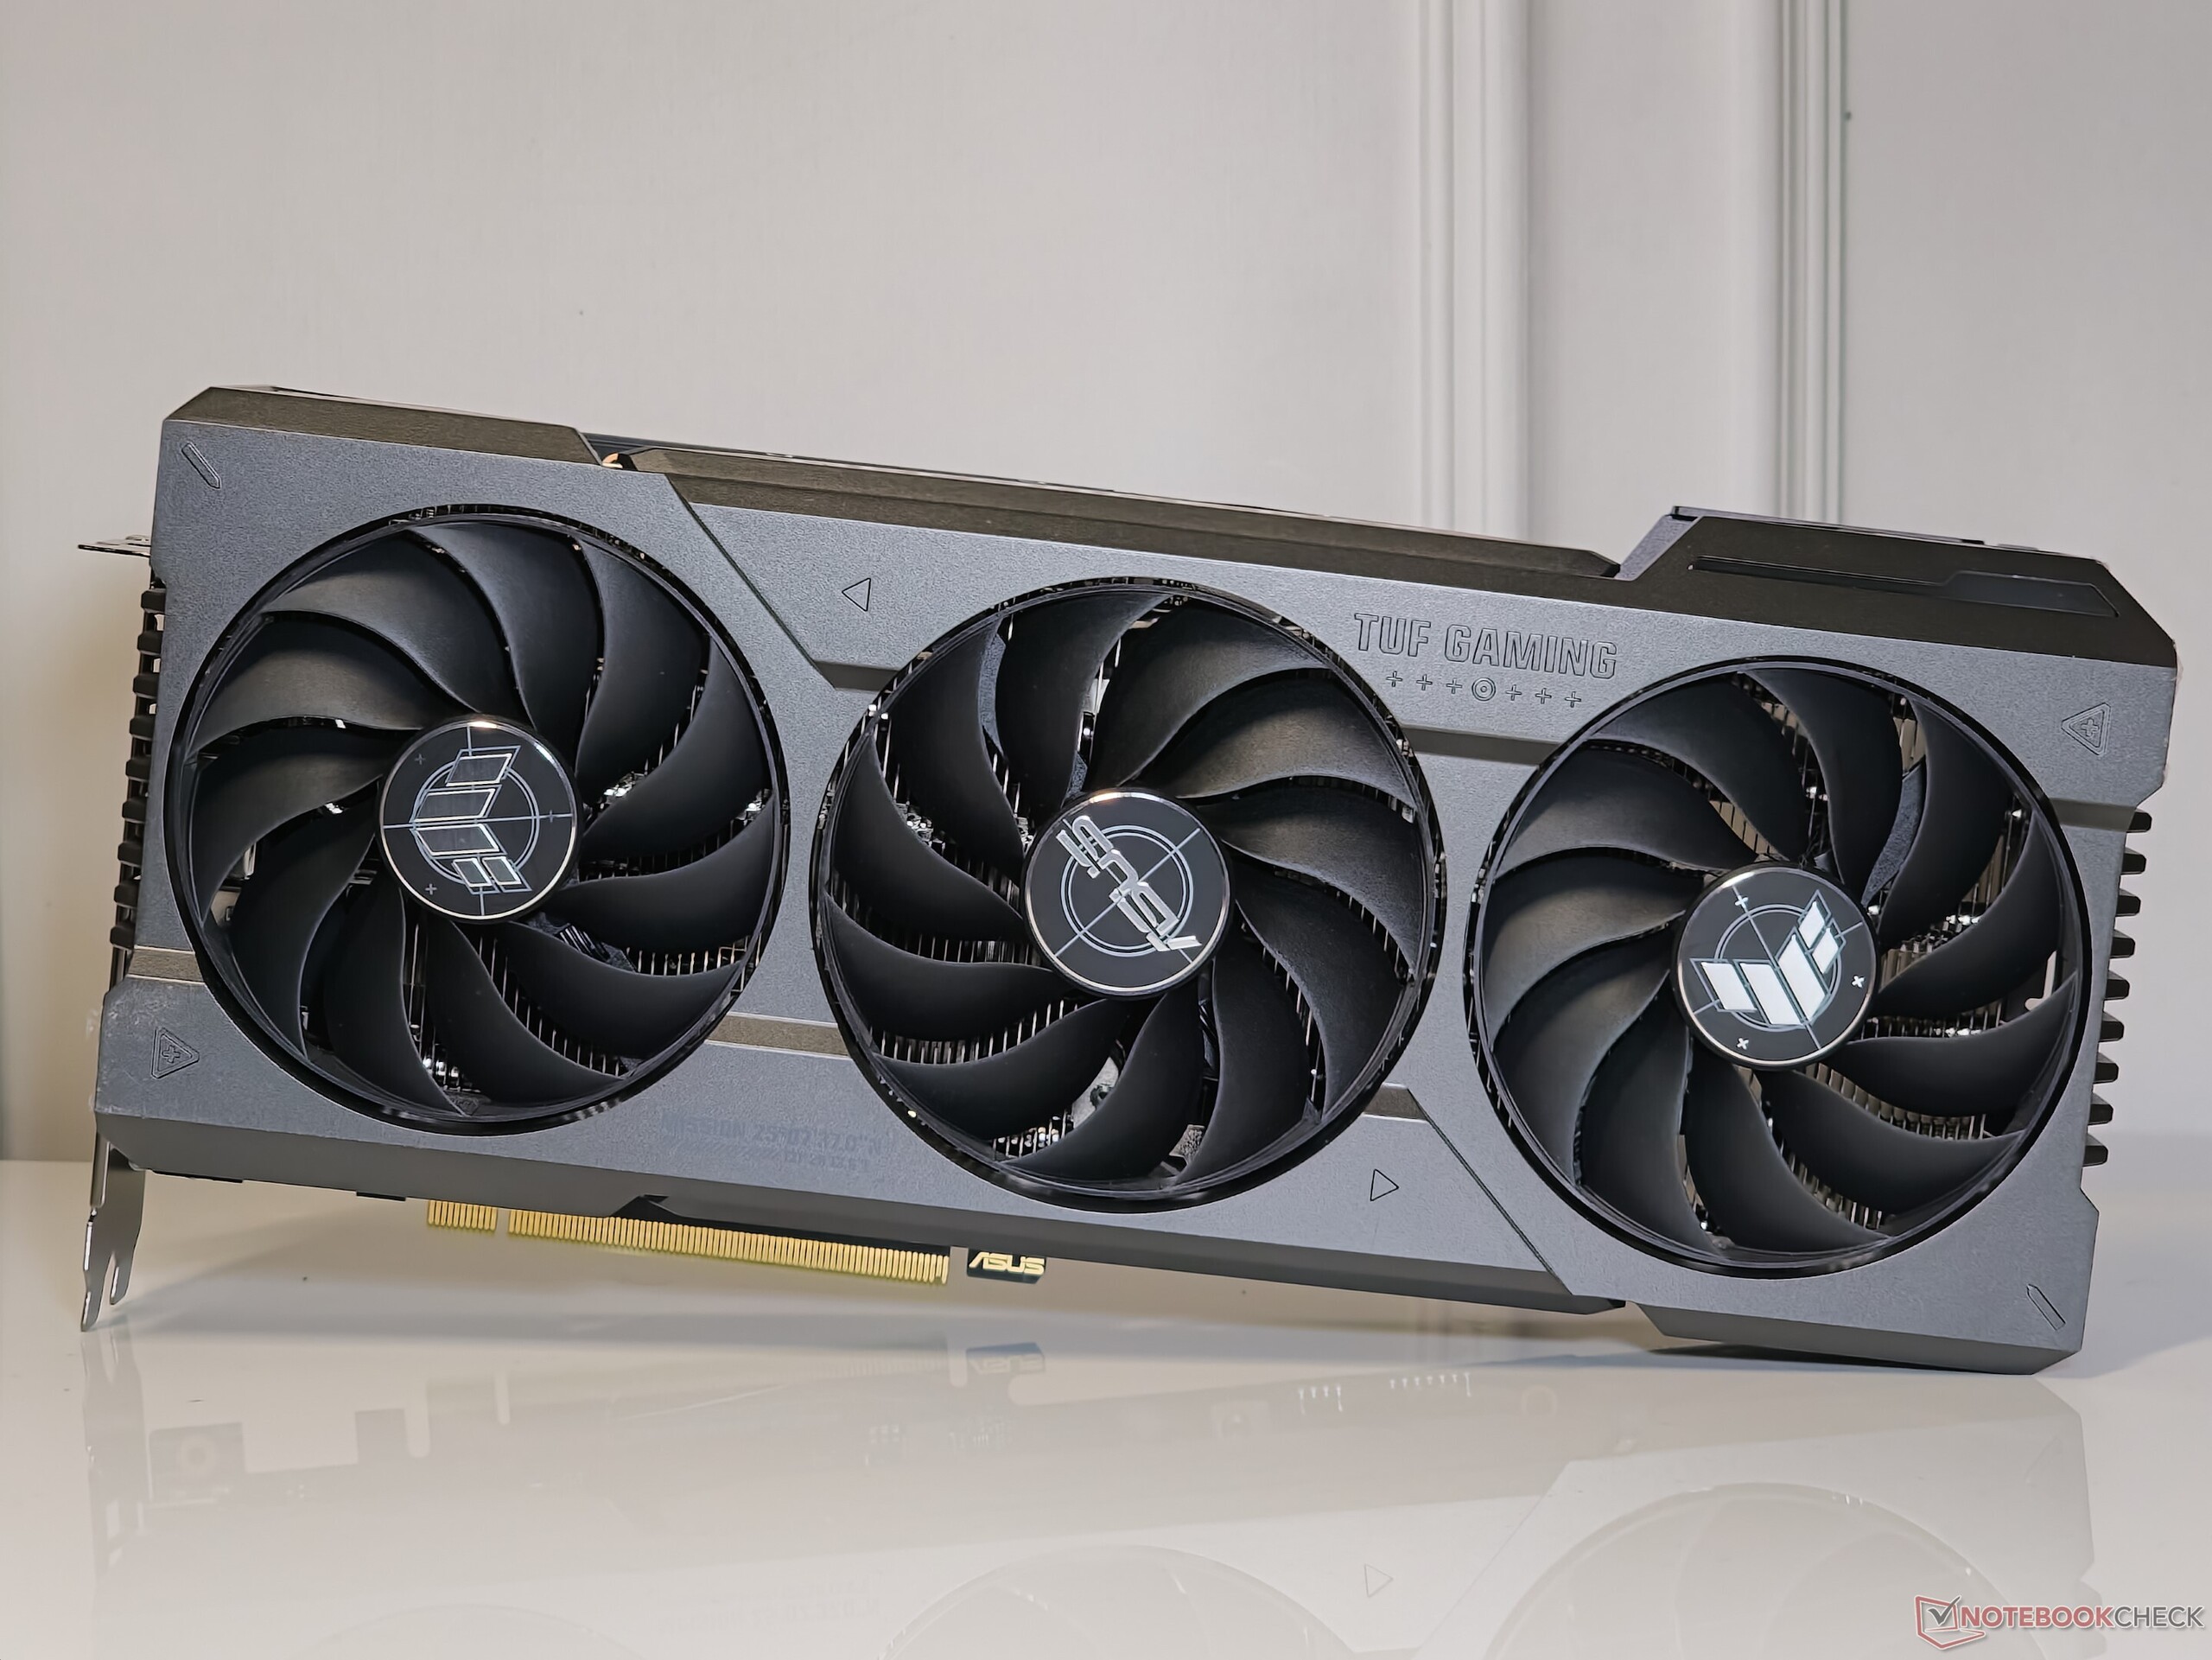
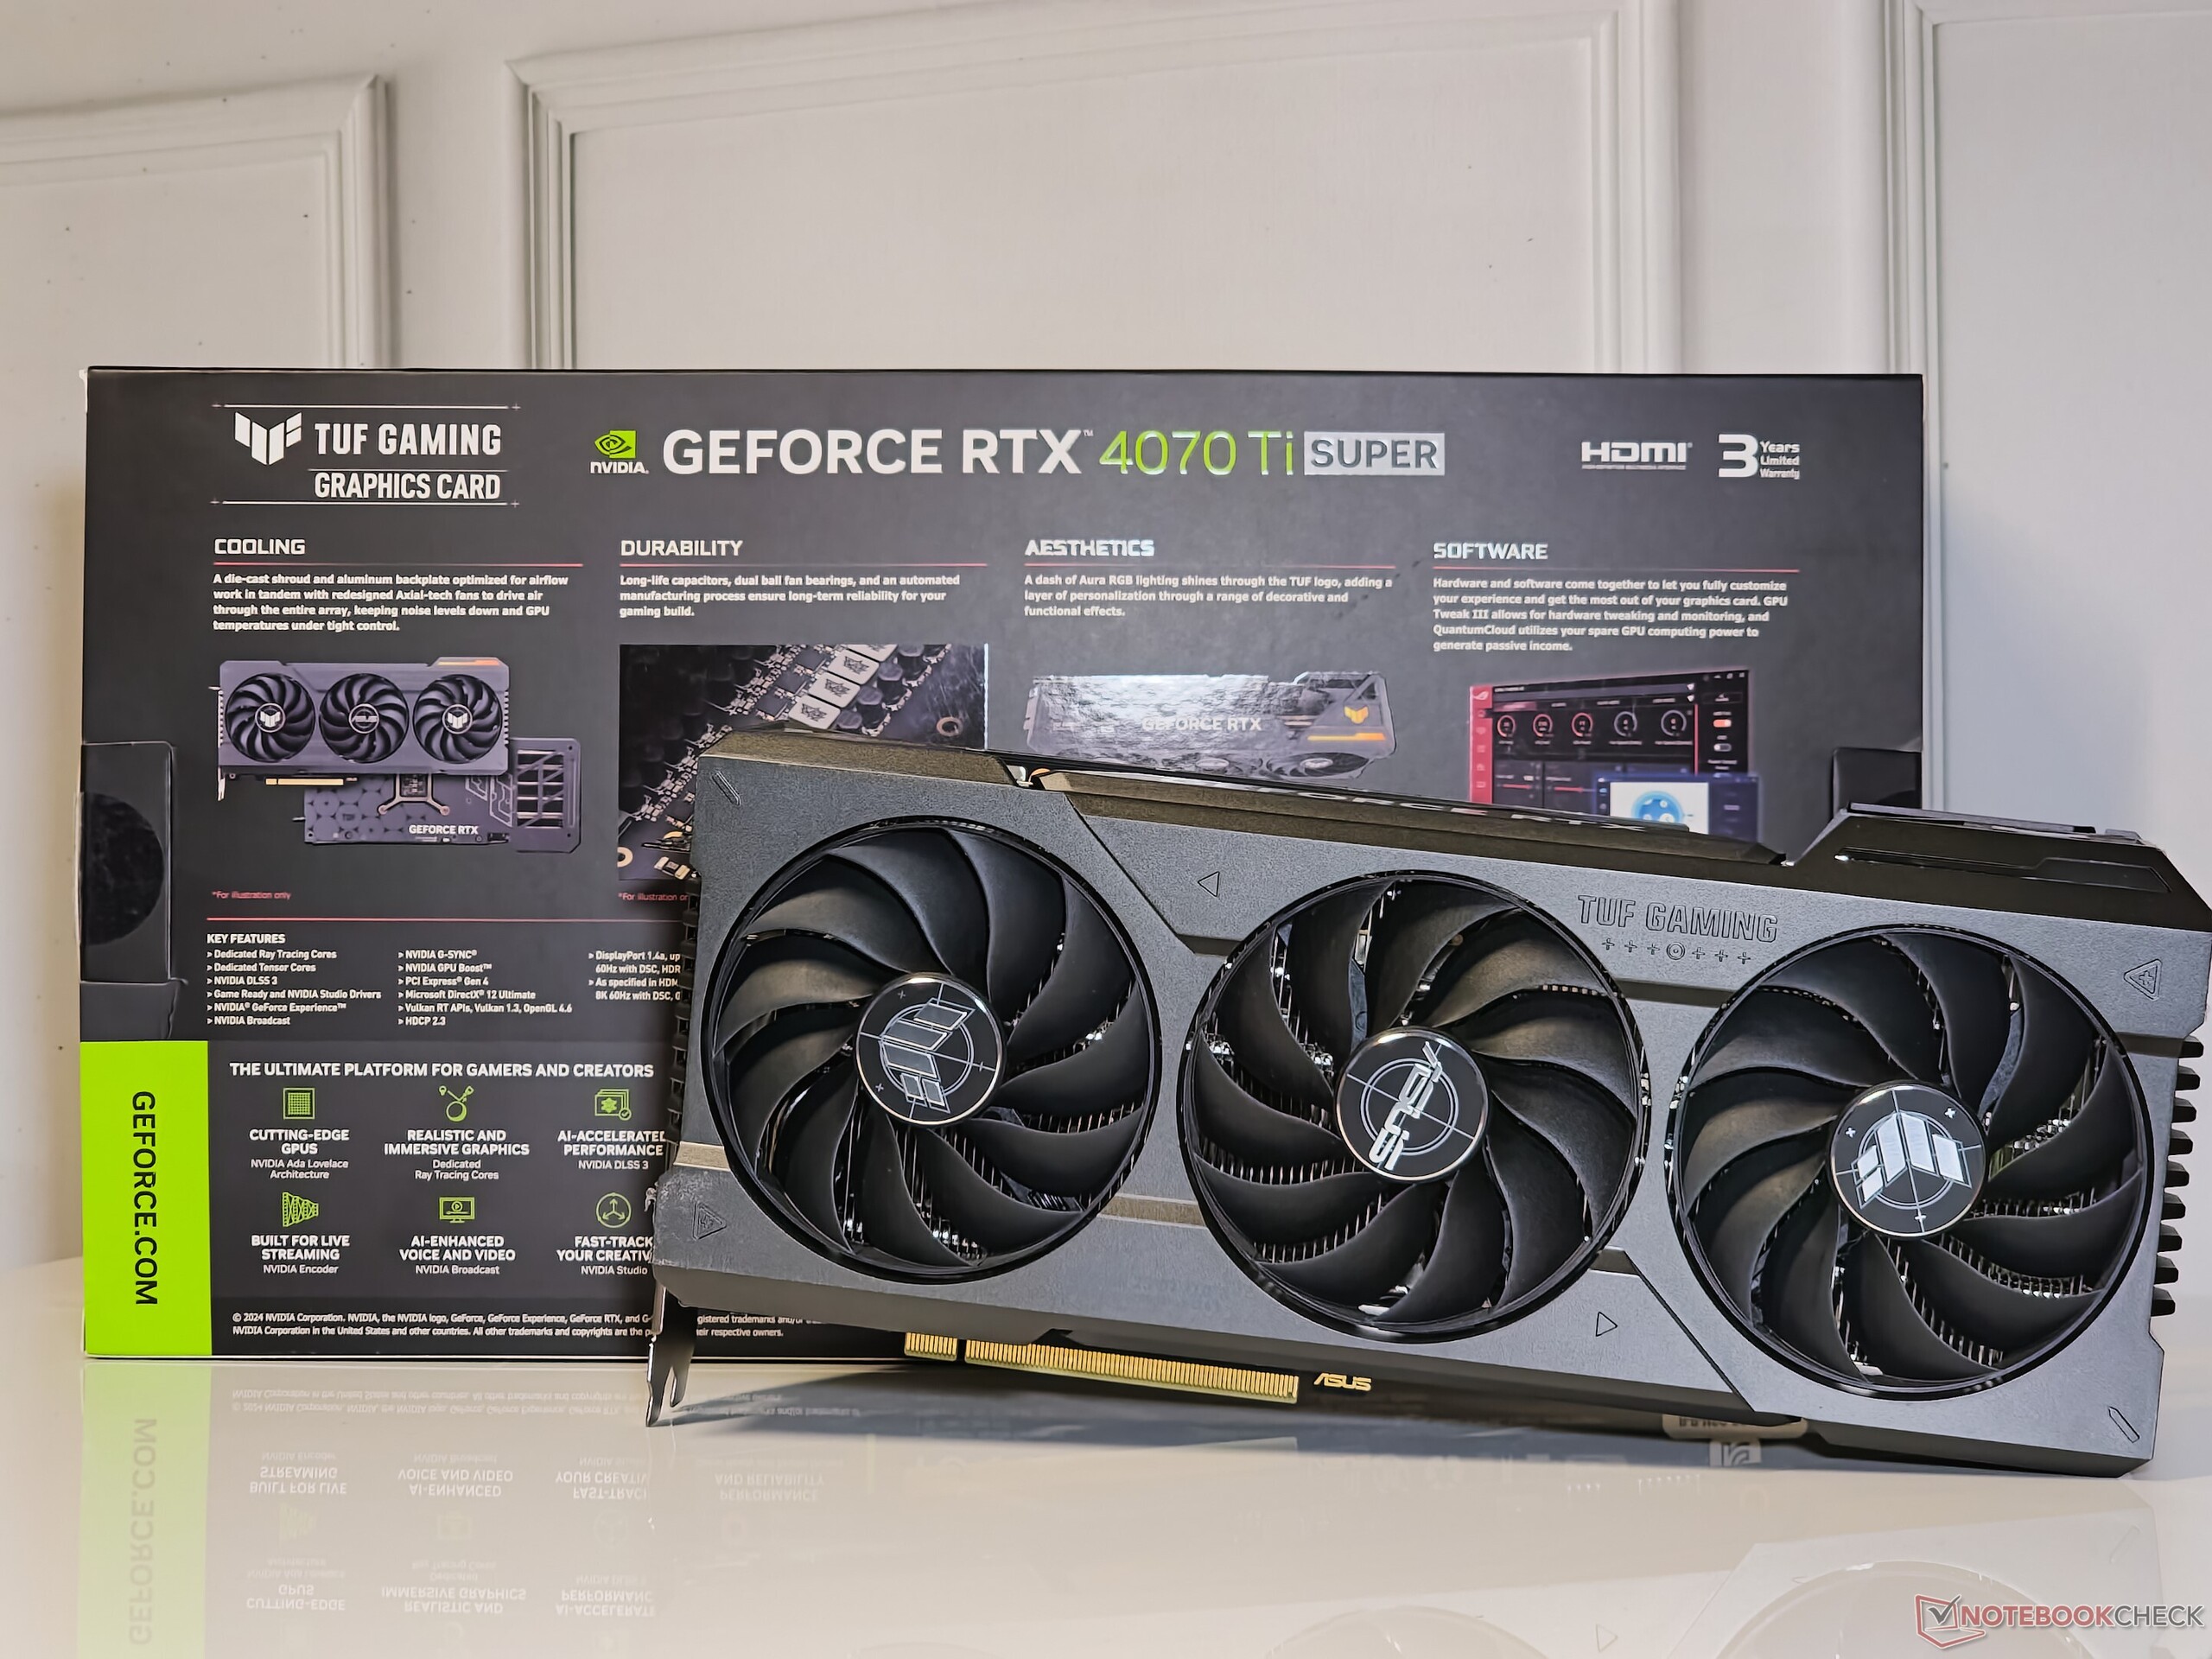
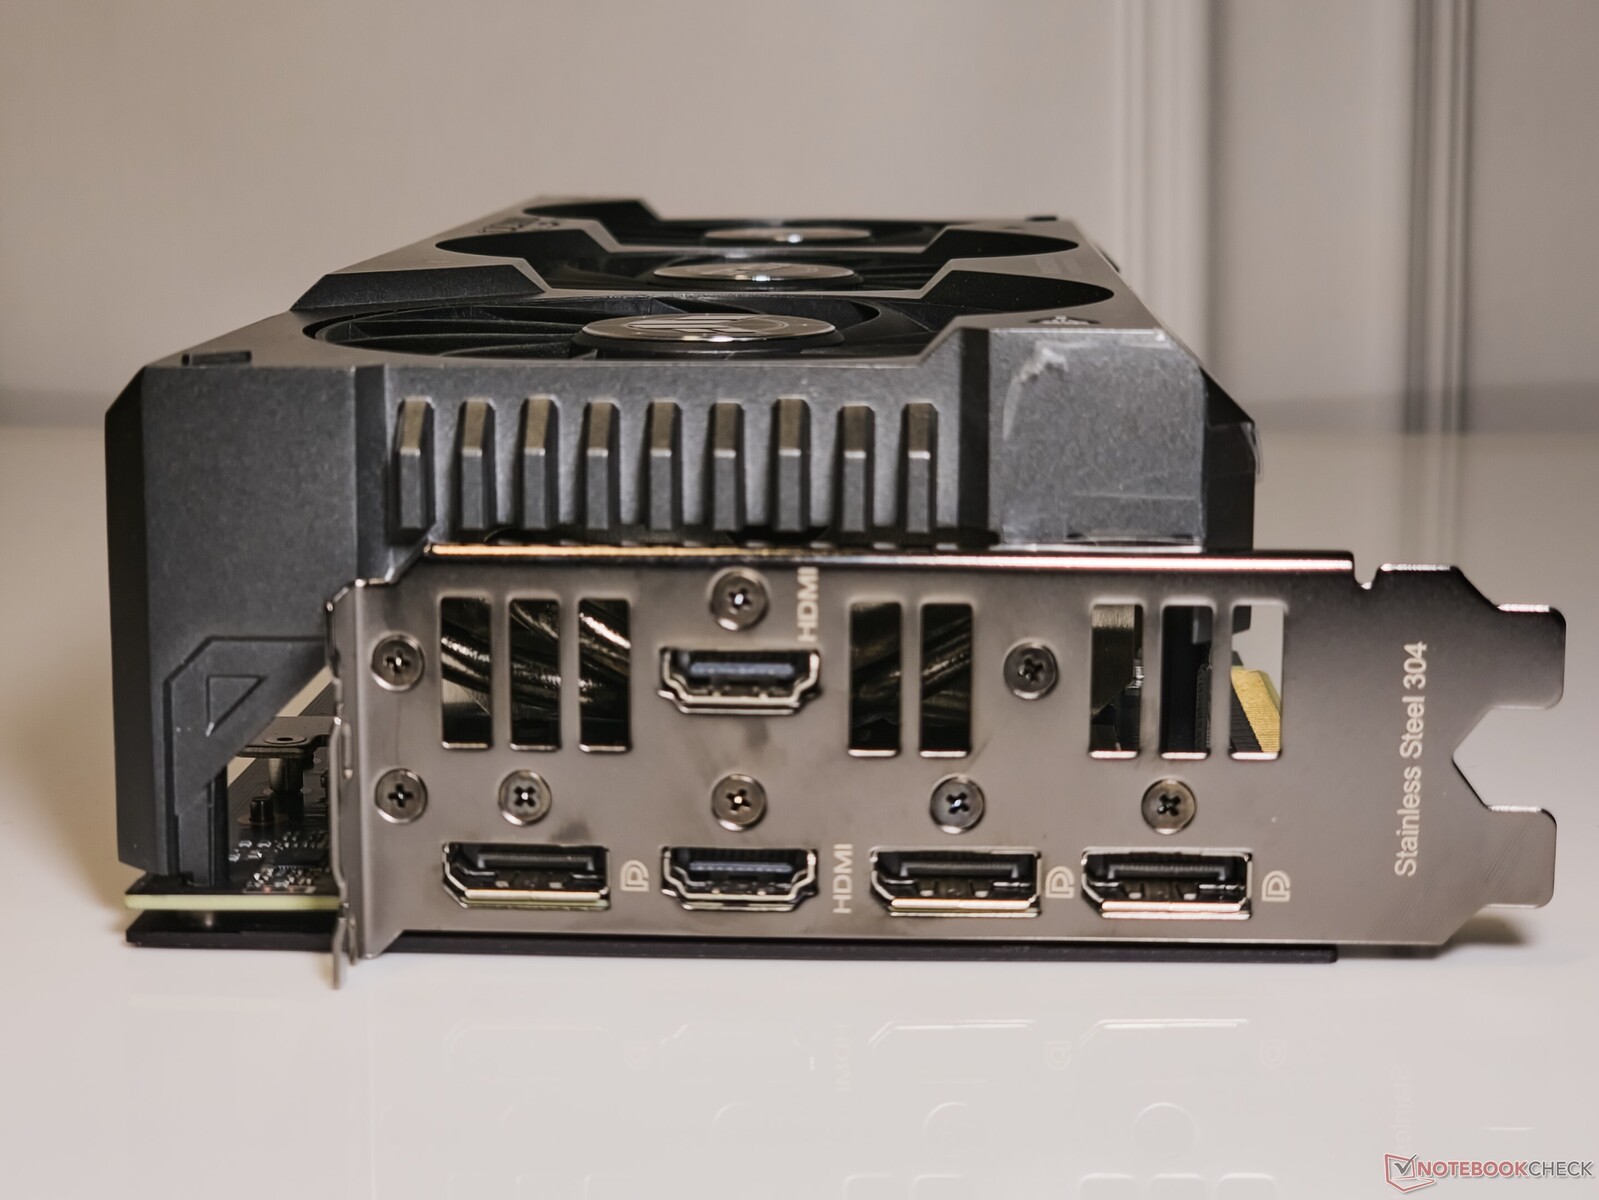
与大多数其他华硕显卡一样,TUF GamingGeForce RTX 4070 Ti Super 也配备了五个端口,这在绝大多数显卡中并不多见。

除了常见的 3x DisplayPort-1.4 输出端口和 HDMI 2.1a 输出端口外,华硕还提供了一个额外的 HDMI 2.1a 输出端口,可以在连接电视或不带 DisplayPort 的显示器时派上用场。

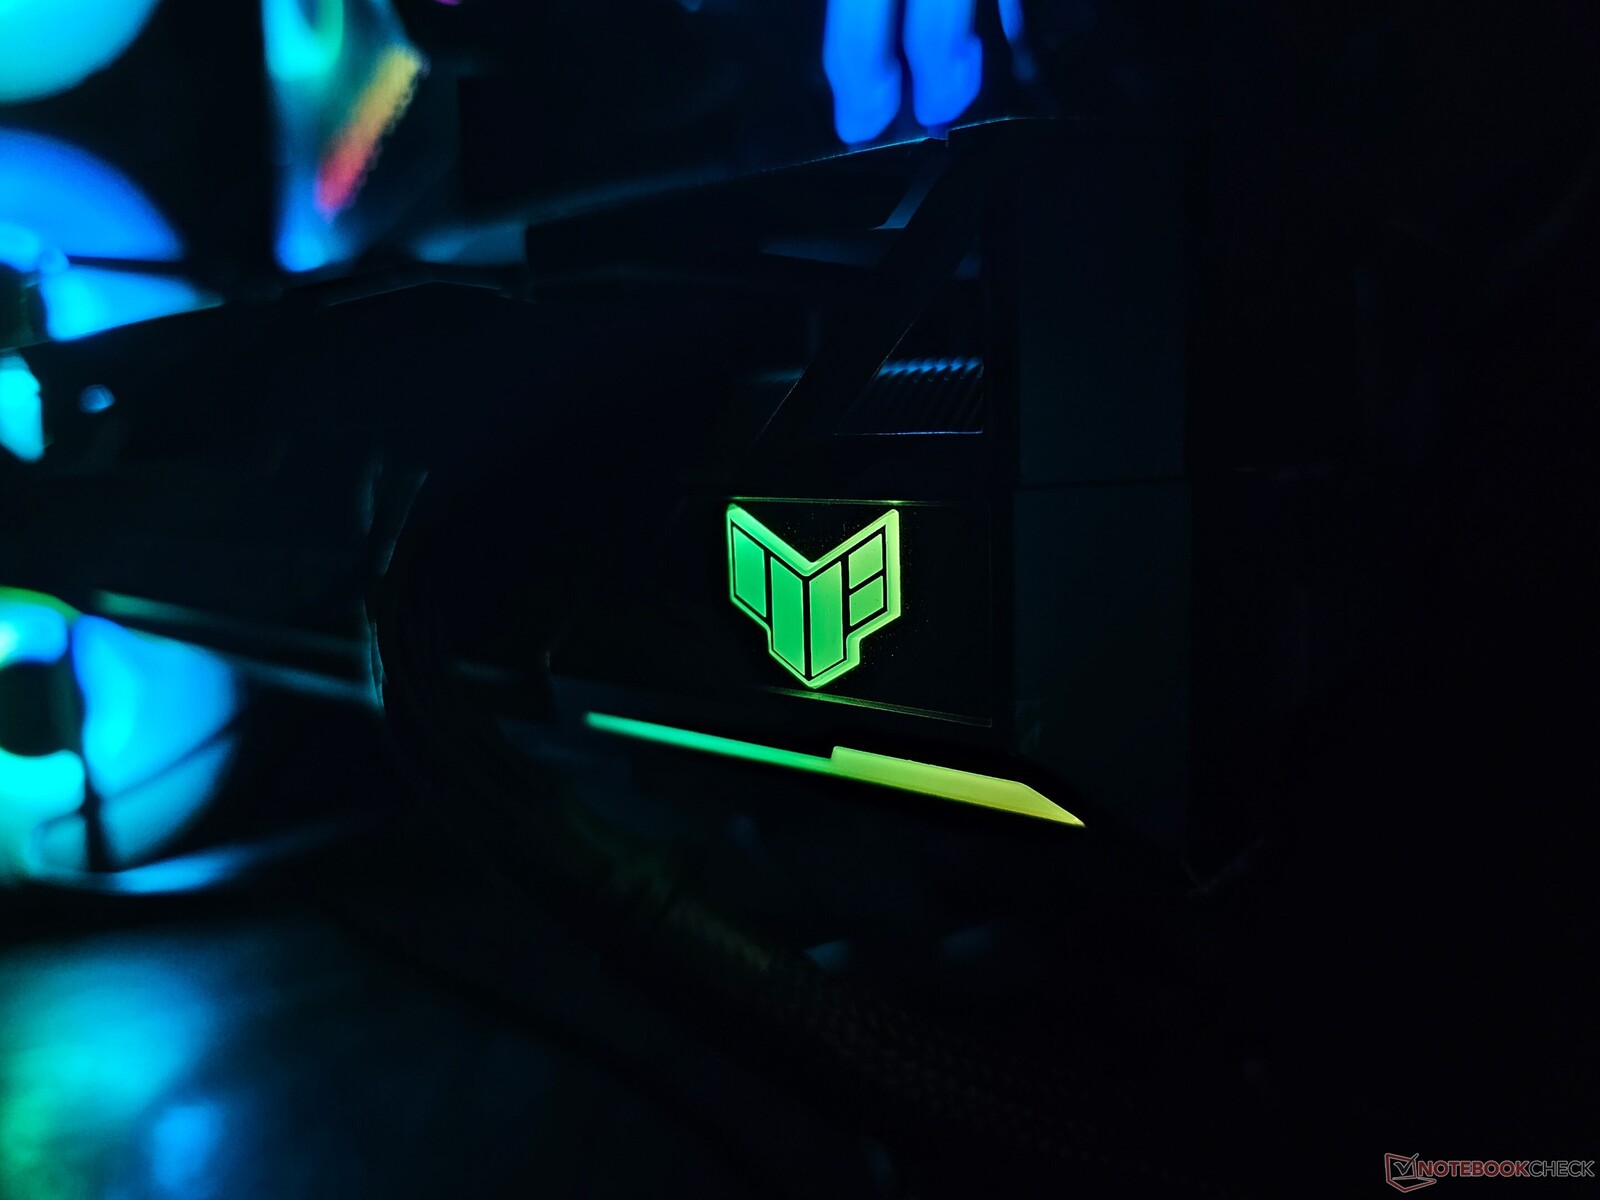
与 Strix 显卡不同,TUF 显卡的 RGB 灯光更加柔和。唯一亮起的区域是 TUF 徽标和徽标下方的短光条。尽管如此,这些灯光还是很有效,而且可以通过华硕的 GPU Tweak III 软件或任何与 Aura Sync 兼容的实用程序进行自定义。

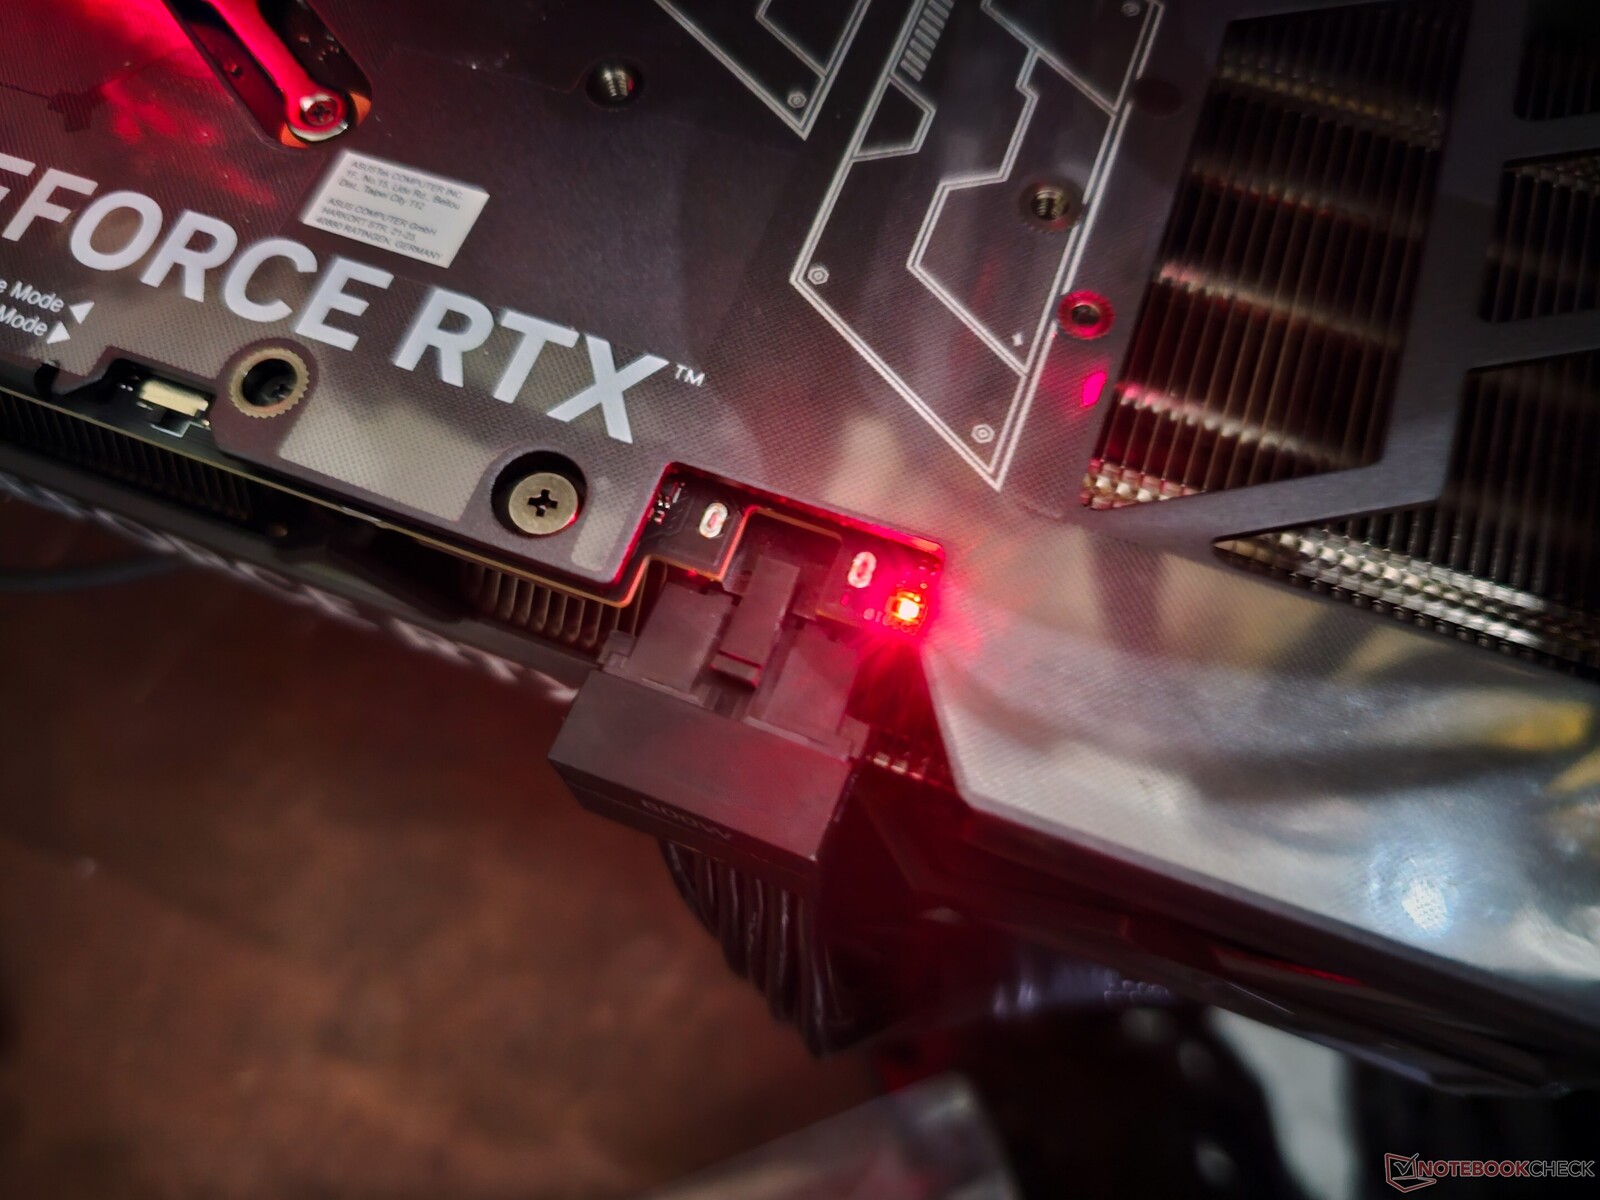
电源由标准的 12VHPWR 接口提供。华硕在包装盒中提供了一个 12VHPWR 转 2x 8 针适配器,可与连接器紧密配合。

电源接口上还有一个有用的红色 LED 指示灯,在连接不当或电源不足时会发光。遗憾的是,该指示灯即使在系统关机时也会发光,这可能会让用户感到困惑。

华硕提供双 BIOS 系统,可在性能模式和静音模式之间切换。我们在性能模式下进行了所有测试,并使用静音模式比较了风扇噪音水平。

TUF 徽标的 RGB 效果
TUF 徽标的 RGB 效果
12VHPWR LED 指示灯
12VHPWR LED 指示灯
华硕 TUF GamingGeForce RTX 4070 Ti Super:收纳盒配件。(图片来源:华硕)

TUF 卡还配有一套不错的配件,其中包括

  • TUF 收集卡
  • 12VHPWR 至 2x 8 针电源适配器
  • 感谢卡
  • TUF 游戏证书
  • 快速入门指南
  • 保修信息
  • TUF 魔术贴钩环
  • 内置螺丝刀的 TUF GPU 支架

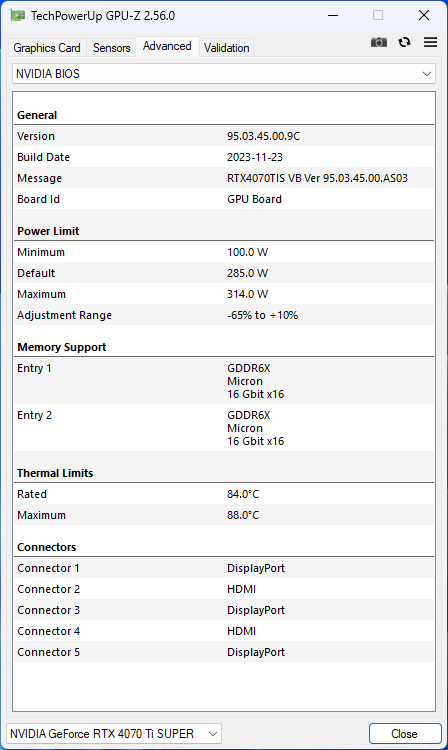
TUF GamingGeForce RTX 4070 Ti Super 的额定提升频率高达 2,610 MHz,这是 Nvidia 对这款 GPU 的参考规格。这比原来的 RTX 4070 Ti 非超级版低了 150 MHz,但基本时钟现在增加了 30 MHz,达到 2,340 MHz。

尽管内存带宽和着色器数量有所增加,但 TUF GamingGeForce RTX 4070 Ti Super 的 TGP 为 285 W,与 RTX 4070 Ti 相似。

将功率利用率提高 10%,将 TGP 提高到 314 W 的潜力有限。

GPU-Z:华硕 TUF GamingGeForce RTX 4070 Ti Super

测试台:RTX 4070 Ti Super 与酷睿 i9-13900K 完美搭配

我们的测试系统基于英特尔酷睿 i9-13900K 和 Z790 平台。其中包括以下组件:

  • Cooler MasterFrame 700 测试台
  • 英特尔酷睿 i9-13900K使用 PL1=PL2
  • 技嘉 Z790 Aorus Master 主板
  • 技嘉 Aorus Gen4 2 TB NVMe 固态硬盘
  • Sabrent Rocket 4 Plus Gen4 2 TB NVMe SSD
  • 2x 16 GB 金士顿 Fury Renegade DDR5-6400 内存,时序 32-39-39-80,电压 1.40 V
  • 技嘉 M28U 4K 144 Hz 显示器
  • 技嘉 Aorus Waterforce X II 360AiO 散热器
  • Cooler Master MVE Gold V2 1250 ATX 3.0 全模块化 PSU

使用带有最新补丁的 Windows 11 23H2,以及 551.15 版 Nvidia Game Ready 驱动程序。

我们感谢 Cooler Master 提供测试台和 PSU,技嘉提供主板、CPU、SSD、AiO 散热器和显示器,Sabrent 提供 SSD,金士顿提供内存。

合成基准测试:与 RTX 3090 Ti 相比,优势更加明显

在累积的合成测试中,我们发现 TUF GamingGeForce RTX 4070 Ti Super 的整体性能仅比 RTX 4070 Ti Super 提升了 3%。 RTX 4070 Ti相比提高了 3%,而与 RTX 4070 超级 Founders Edition.

就单项而言,在更高分辨率下的基准测试中获得的提升最大。例如,3DMarkFire Strike Ultra 与 RTX 4070 Ti 的平均值相比提高了 4%,而 Unigine Superposition 4K 和 8K 优化测试则将这一差距提高到 11%。

RTX 4070 Ti Super 进一步领先于安培旗舰产品 RTX 3090 Ti5%,而落后于 AMD Radeon RX 7900 XT以同样的幅度落后于 AMD Radeon RX 7900 XT。

Performance Rating
NVIDIA GeForce RTX 4090 Founders Edition
Intel Core i9-13900K, NVIDIA GeForce RTX 4090
99.8 pt
AMD Radeon RX 7900 XTX
AMD Ryzen 9 7950X, AMD Radeon RX 7900 XTX
83 pt
NVIDIA GeForce RTX 4080 Founders Edition
Intel Core i9-13900K, NVIDIA GeForce RTX 4080
81.4 pt
AMD Radeon RX 7900 XT
AMD Ryzen 9 7950X, AMD Radeon RX 7900 XT
73.4 pt
Asus TUF Gaming GeForce RTX 4070 Ti Super
Intel Core i9-13900K, NVIDIA GeForce RTX 4070 Ti SUPER
69.5 pt
Gigabyte Aorus GeForce RTX 4070 Ti Master
Intel Core i9-13900K, NVIDIA GeForce RTX 4070 Ti
68 pt
Asus TUF Gaming GeForce RTX 4070 Ti
Intel Core i9-13900K, NVIDIA GeForce RTX 4070 Ti
67.9 pt
Average NVIDIA GeForce RTX 4070 Ti
 
67.2 pt
Zotac Gaming GeForce RTX 3090 Ti AMP Extreme Holo
AMD Ryzen 7 5800X3D, NVIDIA GeForce RTX 3090 Ti
66.5 pt
Sapphire AMD Radeon RX 6950 XT Nitro+ Pure
AMD Ryzen 9 5900X, AMD Radeon RX 6950 XT
62.8 pt
Gigabyte GeForce RTX 4070 Super Gaming OC 12G
Intel Core i9-13900K, NVIDIA GeForce RTX 4070 SUPER
62.7 pt
Average NVIDIA GeForce RTX 3080 Ti
 
62.1 pt
NVIDIA GeForce RTX 4070 Super Founders Edition
Intel Core i9-13900K, NVIDIA GeForce RTX 4070 SUPER
61.9 pt
Average NVIDIA GeForce RTX 3090
 
61.9 pt
AMD Radeon RX 7800 XT
AMD Ryzen 9 7950X, AMD Radeon RX 7800 XT
57.7 pt
AMD Radeon RX 6900 XT
AMD Ryzen 9 5950X, AMD Radeon RX 6900 XT
56.5 pt
Zotac Gaming GeForce RTX 4070 AMP Airo
Intel Core i9-13900K, NVIDIA GeForce RTX 4070
55 pt
AMD Radeon RX 6800 XT
AMD Ryzen 9 5950X, AMD Radeon RX 6800 XT
53.5 pt
Average NVIDIA GeForce RTX 3080
 
51.7 pt
KFA2 GeForce RTX 3070 Ti SG
AMD Ryzen 9 7950X, NVIDIA GeForce RTX 3070 Ti
50.7 pt
Sapphire Pulse Radeon RX 7700 XT
AMD Ryzen 9 7950X, AMD Radeon RX 7700 XT
49.5 pt
Average of class Desktop
 
49.2 pt
Average NVIDIA Titan RTX
 
48.4 pt
Average NVIDIA GeForce RTX 3070
 
42.2 pt
Average NVIDIA GeForce RTX 4060 Ti 8G
 
41.6 pt
KFA2 GeForce RTX 4060 Ti EX, 16GB GDDR6
AMD Ryzen 9 7950X, NVIDIA GeForce RTX 4060 Ti 16G
40.1 pt
XFX Speedster QICK 308 Radeon RX 7600 Black Edition
AMD Ryzen 9 7950X, AMD Radeon RX 7600
36.4 pt
KFA2 GeForce RTX 4060 1-Click-OC 2X
AMD Ryzen 9 7950X, NVIDIA GeForce RTX 4060
35.4 pt
3DMark 11 / Performance GPU
NVIDIA GeForce RTX 4090 Founders Edition
Intel Core i9-13900K, NVIDIA GeForce RTX 4090
99834 Points +33%
NVIDIA GeForce RTX 4080 Founders Edition
Intel Core i9-13900K, NVIDIA GeForce RTX 4080
86838 Points +16%
AMD Radeon RX 7900 XTX
AMD Ryzen 9 7950X, AMD Radeon RX 7900 XTX
83322 Points +11%
AMD Radeon RX 7900 XT
AMD Ryzen 9 7950X, AMD Radeon RX 7900 XT
77784 Points +4%
Gigabyte Aorus GeForce RTX 4070 Ti Master
Intel Core i9-13900K, NVIDIA GeForce RTX 4070 Ti
76483 Points +2%
Asus TUF Gaming GeForce RTX 4070 Ti
Intel Core i9-13900K, NVIDIA GeForce RTX 4070 Ti
75990 Points +2%
Asus TUF Gaming GeForce RTX 4070 Ti
Intel Core i9-13900K, NVIDIA GeForce RTX 4070 Ti (Quiet BIOS)
75612 Points +1%
Average NVIDIA GeForce RTX 4070 Ti
  (74228 - 76483, n=5)
75509 Points +1%
Asus TUF Gaming GeForce RTX 4070 Ti Super
Intel Core i9-13900K, NVIDIA GeForce RTX 4070 Ti SUPER
74834 Points
Sapphire AMD Radeon RX 6950 XT Nitro+ Pure
AMD Ryzen 9 5900X, AMD Radeon RX 6950 XT
70480 Points -6%
Zotac Gaming GeForce RTX 3090 Ti AMP Extreme Holo
AMD Ryzen 7 5800X3D, NVIDIA GeForce RTX 3090 Ti
69481 Points -7%
Gigabyte GeForce RTX 4070 Super Gaming OC 12G
Intel Core i9-13900K, NVIDIA GeForce RTX 4070 SUPER
68894 Points -8%
NVIDIA GeForce RTX 4070 Super Founders Edition
Intel Core i9-13900K, NVIDIA GeForce RTX 4070 SUPER
67852 Points -9%
AMD Radeon RX 7800 XT
AMD Ryzen 9 7950X, AMD Radeon RX 7800 XT
63292 Points -15%
Average NVIDIA GeForce RTX 3080 Ti
  (59799 - 62189, n=4)
60987 Points -19%
Average NVIDIA GeForce RTX 3090
  (55144 - 66934, n=17)
60853 Points -19%
Zotac Gaming GeForce RTX 4070 AMP Airo
Intel Core i9-13900K, NVIDIA GeForce RTX 4070
59510 Points -20%
AMD Radeon RX 6900 XT
AMD Ryzen 9 5950X, AMD Radeon RX 6900 XT
59119 Points -21%
Sapphire Pulse Radeon RX 7700 XT
AMD Ryzen 9 7950X, AMD Radeon RX 7700 XT
57340 Points -23%
Average NVIDIA GeForce RTX 3080
  (47287 - 57662, n=4)
53094 Points -29%
AMD Radeon RX 6800 XT
AMD Ryzen 9 5950X, AMD Radeon RX 6800 XT
52046 Points -30%
KFA2 GeForce RTX 3070 Ti SG
AMD Ryzen 9 7950X, NVIDIA GeForce RTX 3070 Ti
49760 Points -34%
Average of class Desktop
  (650 - 104464, n=36, last 2 years)
49254 Points -34%
Average NVIDIA Titan RTX
  (43461 - 51863, n=30)
49062 Points -34%
Average NVIDIA GeForce RTX 4060 Ti 8G
  (47481 - 48363, n=3)
47882 Points -36%
XFX Speedster QICK 308 Radeon RX 7600 Black Edition
AMD Ryzen 9 7950X, AMD Radeon RX 7600
43430 Points -42%
KFA2 GeForce RTX 4060 Ti EX, 16GB GDDR6
AMD Ryzen 9 7950X, NVIDIA GeForce RTX 4060 Ti 16G
43112 Points -42%
Average NVIDIA GeForce RTX 3070
  (26812 - 46878, n=9)
40835 Points -45%
KFA2 GeForce RTX 4060 1-Click-OC 2X
AMD Ryzen 9 7950X, NVIDIA GeForce RTX 4060
38191 Points -49%
3DMark / Fire Strike Graphics
AMD Radeon RX 7900 XTX
AMD Ryzen 9 7950X, AMD Radeon RX 7900 XTX
66967 Points +27%
NVIDIA GeForce RTX 4090 Founders Edition
Intel Core i9-13900K, NVIDIA GeForce RTX 4090
65879 Points +25%
AMD Radeon RX 7900 XT
AMD Ryzen 9 7950X, AMD Radeon RX 7900 XT
63712 Points +21%
Sapphire AMD Radeon RX 6950 XT Nitro+ Pure
AMD Ryzen 9 5900X, AMD Radeon RX 6950 XT
60092 Points +14%
NVIDIA GeForce RTX 4080 Founders Edition
Intel Core i9-13900K, NVIDIA GeForce RTX 4080
58893 Points +12%
Asus TUF Gaming GeForce RTX 4070 Ti
Intel Core i9-13900K, NVIDIA GeForce RTX 4070 Ti
53729 Points +2%
Asus TUF Gaming GeForce RTX 4070 Ti
Intel Core i9-13900K, NVIDIA GeForce RTX 4070 Ti (Quiet BIOS)
52903 Points 0%
Average NVIDIA GeForce RTX 4070 Ti
  (52769 - 53736, n=5)
53299 Points +1%
Zotac Gaming GeForce RTX 3090 Ti AMP Extreme Holo
AMD Ryzen 7 5800X3D, NVIDIA GeForce RTX 3090 Ti
53110 Points +1%
Gigabyte Aorus GeForce RTX 4070 Ti Master
Intel Core i9-13900K, NVIDIA GeForce RTX 4070 Ti
52769 Points 0%
Asus TUF Gaming GeForce RTX 4070 Ti Super
Intel Core i9-13900K, NVIDIA GeForce RTX 4070 Ti SUPER
52738 Points
AMD Radeon RX 6900 XT
AMD Ryzen 9 5950X, AMD Radeon RX 6900 XT
50587 Points -4%
AMD Radeon RX 7800 XT
AMD Ryzen 9 7950X, AMD Radeon RX 7800 XT
50181 Points -5%
AMD Radeon RX 6800 XT
AMD Ryzen 9 5950X, AMD Radeon RX 6800 XT
49735 Points -6%
Gigabyte GeForce RTX 4070 Super Gaming OC 12G
Intel Core i9-13900K, NVIDIA GeForce RTX 4070 SUPER
49709 Points -6%
NVIDIA GeForce RTX 4070 Super Founders Edition
Intel Core i9-13900K, NVIDIA GeForce RTX 4070 SUPER
48043 Points -9%
Average NVIDIA GeForce RTX 3080 Ti
  (45785 - 48709, n=4)
47180 Points -11%
Average NVIDIA GeForce RTX 3090
  (41298 - 49282, n=17)
46856 Points -11%
Zotac Gaming GeForce RTX 4070 AMP Airo
Intel Core i9-13900K, NVIDIA GeForce RTX 4070
43583 Points -17%
Sapphire Pulse Radeon RX 7700 XT
AMD Ryzen 9 7950X, AMD Radeon RX 7700 XT
42801 Points -19%
Average NVIDIA GeForce RTX 3080
  (37604 - 40910, n=2)
39257 Points -26%
KFA2 GeForce RTX 3070 Ti SG
AMD Ryzen 9 7950X, NVIDIA GeForce RTX 3070 Ti
37663 Points -29%
Average NVIDIA Titan RTX
  (33377 - 40910, n=30)
36062 Points -32%
Average NVIDIA GeForce RTX 4060 Ti 8G
  (33762 - 34547, n=3)
34185 Points -35%
XFX Speedster QICK 308 Radeon RX 7600 Black Edition
AMD Ryzen 9 7950X, AMD Radeon RX 7600
32404 Points -39%
KFA2 GeForce RTX 4060 Ti EX, 16GB GDDR6
AMD Ryzen 9 7950X, NVIDIA GeForce RTX 4060 Ti 16G
32275 Points -39%
Average of class Desktop
  (523 - 70246, n=34, last 2 years)
31665 Points -40%
Average NVIDIA GeForce RTX 3070
  (20357 - 33270, n=7)
28949 Points -45%
KFA2 GeForce RTX 4060 1-Click-OC 2X
AMD Ryzen 9 7950X, NVIDIA GeForce RTX 4060
28111 Points -47%
3DMark / Fire Strike Ultra Graphics
NVIDIA GeForce RTX 4090 Founders Edition
Intel Core i9-13900K, NVIDIA GeForce RTX 4090
24276 Points +73%
AMD Radeon RX 7900 XTX
AMD Ryzen 9 7950X, AMD Radeon RX 7900 XTX
20214 Points +44%
NVIDIA GeForce RTX 4080 Founders Edition
Intel Core i9-13900K, NVIDIA GeForce RTX 4080
17122 Points +22%
AMD Radeon RX 7900 XT
AMD Ryzen 9 7950X, AMD Radeon RX 7900 XT
17078 Points +22%
Sapphire AMD Radeon RX 6950 XT Nitro+ Pure
AMD Ryzen 9 5900X, AMD Radeon RX 6950 XT
14978 Points +7%
Zotac Gaming GeForce RTX 3090 Ti AMP Extreme Holo
AMD Ryzen 7 5800X3D, NVIDIA GeForce RTX 3090 Ti
14026 Points 0%
Asus TUF Gaming GeForce RTX 4070 Ti Super
Intel Core i9-13900K, NVIDIA GeForce RTX 4070 Ti SUPER
13998 Points
Gigabyte Aorus GeForce RTX 4070 Ti Master
Intel Core i9-13900K, NVIDIA GeForce RTX 4070 Ti
13616 Points -3%
Asus TUF Gaming GeForce RTX 4070 Ti
Intel Core i9-13900K, NVIDIA GeForce RTX 4070 Ti
13546 Points -3%
Asus TUF Gaming GeForce RTX 4070 Ti
Intel Core i9-13900K, NVIDIA GeForce RTX 4070 Ti (Quiet BIOS)
13487 Points -4%
Average NVIDIA GeForce RTX 4070 Ti
  (13112 - 13616, n=5)
13390 Points -4%
AMD Radeon RX 6900 XT
AMD Ryzen 9 5950X, AMD Radeon RX 6900 XT
13370 Points -4%
AMD Radeon RX 6800 XT
AMD Ryzen 9 5950X, AMD Radeon RX 6800 XT
12626 Points -10%
AMD Radeon RX 7800 XT
AMD Ryzen 9 7950X, AMD Radeon RX 7800 XT
12529 Points -10%
Gigabyte GeForce RTX 4070 Super Gaming OC 12G
Intel Core i9-13900K, NVIDIA GeForce RTX 4070 SUPER
12389 Points -11%
Average NVIDIA GeForce RTX 3090
  (11613 - 12587, n=14)
12289 Points -12%
Average NVIDIA GeForce RTX 3080 Ti
  (12050 - 12341, n=4)
12173 Points -13%
NVIDIA GeForce RTX 4070 Super Founders Edition
Intel Core i9-13900K, NVIDIA GeForce RTX 4070 SUPER
12086 Points -14%
Average NVIDIA GeForce RTX 3080
  (10645 - 10793, n=2)
10719 Points -23%
Sapphire Pulse Radeon RX 7700 XT
AMD Ryzen 9 7950X, AMD Radeon RX 7700 XT
10596 Points -24%
Average of class Desktop
  (141 - 24650, n=24, last 2 years)
10444 Points -25%
Zotac Gaming GeForce RTX 4070 AMP Airo
Intel Core i9-13900K, NVIDIA GeForce RTX 4070
10103 Points -28%
KFA2 GeForce RTX 3070 Ti SG
AMD Ryzen 9 7950X, NVIDIA GeForce RTX 3070 Ti
9301 Points -34%
Average NVIDIA Titan RTX
  (8461 - 10793, n=29)
8868 Points -37%
Average NVIDIA GeForce RTX 3070
  (8043 - 8483, n=5)
8250 Points -41%
XFX Speedster QICK 308 Radeon RX 7600 Black Edition
AMD Ryzen 9 7950X, AMD Radeon RX 7600
7305 Points -48%
Average NVIDIA GeForce RTX 4060 Ti 8G
  (7152 - 7298, n=3)
7223 Points -48%
KFA2 GeForce RTX 4060 Ti EX, 16GB GDDR6
AMD Ryzen 9 7950X, NVIDIA GeForce RTX 4060 Ti 16G
7058 Points -50%
KFA2 GeForce RTX 4060 1-Click-OC 2X
AMD Ryzen 9 7950X, NVIDIA GeForce RTX 4060
5668 Points -60%
3DMark / Fire Strike Extreme Graphics
NVIDIA GeForce RTX 4090 Founders Edition
Intel Core i9-13900K, NVIDIA GeForce RTX 4090
44295 Points +58%
AMD Radeon RX 7900 XTX
AMD Ryzen 9 7950X, AMD Radeon RX 7900 XTX
39570 Points +41%
AMD Radeon RX 7900 XT
AMD Ryzen 9 7950X, AMD Radeon RX 7900 XT
33747 Points +21%
NVIDIA GeForce RTX 4080 Founders Edition
Intel Core i9-13900K, NVIDIA GeForce RTX 4080
33475 Points +20%
Sapphire AMD Radeon RX 6950 XT Nitro+ Pure
AMD Ryzen 9 5900X, AMD Radeon RX 6950 XT
29704 Points +6%
Asus TUF Gaming GeForce RTX 4070 Ti Super
Intel Core i9-13900K, NVIDIA GeForce RTX 4070 Ti SUPER
27984 Points
Gigabyte Aorus GeForce RTX 4070 Ti Master
Intel Core i9-13900K, NVIDIA GeForce RTX 4070 Ti
27167 Points -3%
Asus TUF Gaming GeForce RTX 4070 Ti
Intel Core i9-13900K, NVIDIA GeForce RTX 4070 Ti
26970 Points -4%
Asus TUF Gaming GeForce RTX 4070 Ti
Intel Core i9-13900K, NVIDIA GeForce RTX 4070 Ti (Quiet BIOS)
26925 Points -4%
Average NVIDIA GeForce RTX 4070 Ti
  (26470 - 27167, n=5)
26845 Points -4%
Zotac Gaming GeForce RTX 3090 Ti AMP Extreme Holo
AMD Ryzen 7 5800X3D, NVIDIA GeForce RTX 3090 Ti
26797 Points -4%
AMD Radeon RX 6900 XT
AMD Ryzen 9 5950X, AMD Radeon RX 6900 XT
26650 Points -5%
AMD Radeon RX 7800 XT
AMD Ryzen 9 7950X, AMD Radeon RX 7800 XT
25279 Points -10%
AMD Radeon RX 6800 XT
AMD Ryzen 9 5950X, AMD Radeon RX 6800 XT
25015 Points -11%
Gigabyte GeForce RTX 4070 Super Gaming OC 12G
Intel Core i9-13900K, NVIDIA GeForce RTX 4070 SUPER
24874 Points -11%
NVIDIA GeForce RTX 4070 Super Founders Edition
Intel Core i9-13900K, NVIDIA GeForce RTX 4070 SUPER
24154 Points -14%
Average NVIDIA GeForce RTX 3090
  (22075 - 24730, n=14)
23806 Points -15%
Average NVIDIA GeForce RTX 3080 Ti
  (23127 - 24250, n=4)
23668 Points -15%
Zotac Gaming GeForce RTX 4070 AMP Airo
Intel Core i9-13900K, NVIDIA GeForce RTX 4070
21053 Points -25%
Sapphire Pulse Radeon RX 7700 XT
AMD Ryzen 9 7950X, AMD Radeon RX 7700 XT
21006 Points -25%
Average NVIDIA GeForce RTX 3080
  (20007 - 20861, n=2)
20434 Points -27%
Average of class Desktop
  (1053 - 44549, n=24, last 2 years)
20318 Points -27%
KFA2 GeForce RTX 3070 Ti SG
AMD Ryzen 9 7950X, NVIDIA GeForce RTX 3070 Ti
18417 Points -34%
Average NVIDIA Titan RTX
  (16484 - 20861, n=29)
17649 Points -37%
Average NVIDIA GeForce RTX 4060 Ti 8G
  (15846 - 16250, n=3)
16051 Points -43%
Average NVIDIA GeForce RTX 3070
  (15503 - 16276, n=5)
15859 Points -43%
KFA2 GeForce RTX 4060 Ti EX, 16GB GDDR6
AMD Ryzen 9 7950X, NVIDIA GeForce RTX 4060 Ti 16G
15511 Points -45%
XFX Speedster QICK 308 Radeon RX 7600 Black Edition
AMD Ryzen 9 7950X, AMD Radeon RX 7600
14966 Points -47%
KFA2 GeForce RTX 4060 1-Click-OC 2X
AMD Ryzen 9 7950X, NVIDIA GeForce RTX 4060
13086 Points -53%
3DMark / Time Spy Graphics
NVIDIA GeForce RTX 4090 Founders Edition
Intel Core i9-13900K, NVIDIA GeForce RTX 4090
36101 Points +52%
AMD Radeon RX 7900 XTX
AMD Ryzen 9 7950X, AMD Radeon RX 7900 XTX
29699 Points +25%
NVIDIA GeForce RTX 4080 Founders Edition
Intel Core i9-13900K, NVIDIA GeForce RTX 4080
28133 Points +19%
AMD Radeon RX 7900 XT
AMD Ryzen 9 7950X, AMD Radeon RX 7900 XT
25874 Points +9%
Asus TUF Gaming GeForce RTX 4070 Ti Super
Intel Core i9-13900K, NVIDIA GeForce RTX 4070 Ti SUPER
23695 Points
Gigabyte Aorus GeForce RTX 4070 Ti Master
Intel Core i9-13900K, NVIDIA GeForce RTX 4070 Ti
23136 Points -2%
Asus TUF Gaming GeForce RTX 4070 Ti
Intel Core i9-13900K, NVIDIA GeForce RTX 4070 Ti
22982 Points -3%
Asus TUF Gaming GeForce RTX 4070 Ti
Intel Core i9-13900K, NVIDIA GeForce RTX 4070 Ti (Quiet BIOS)
22949 Points -3%
Average NVIDIA GeForce RTX 4070 Ti
  (22304 - 23136, n=5)
22791 Points -4%
Sapphire AMD Radeon RX 6950 XT Nitro+ Pure
AMD Ryzen 9 5900X, AMD Radeon RX 6950 XT
21719 Points -8%
Zotac Gaming GeForce RTX 3090 Ti AMP Extreme Holo
AMD Ryzen 7 5800X3D, NVIDIA GeForce RTX 3090 Ti
21645 Points -9%
Gigabyte GeForce RTX 4070 Super Gaming OC 12G
Intel Core i9-13900K, NVIDIA GeForce RTX 4070 SUPER
21117 Points -11%
NVIDIA GeForce RTX 4070 Super Founders Edition
Intel Core i9-13900K, NVIDIA GeForce RTX 4070 SUPER
20867 Points -12%
AMD Radeon RX 7800 XT
AMD Ryzen 9 7950X, AMD Radeon RX 7800 XT
19369 Points -18%
Average NVIDIA GeForce RTX 3090
  (18685 - 20433, n=17)
19266 Points -19%
Average NVIDIA GeForce RTX 3080 Ti
  (19041 - 19460, n=4)
19237 Points -19%
AMD Radeon RX 6900 XT
AMD Ryzen 9 5950X, AMD Radeon RX 6900 XT
18210 Points -23%
Zotac Gaming GeForce RTX 4070 AMP Airo
Intel Core i9-13900K, NVIDIA GeForce RTX 4070
17847 Points -25%
AMD Radeon RX 6800 XT
AMD Ryzen 9 5950X, AMD Radeon RX 6800 XT
17603 Points -26%
Average NVIDIA GeForce RTX 3080
  (17467 - 17604, n=2)
17536 Points -26%
Average of class Desktop
  (173 - 37589, n=33, last 2 years)
17279 Points -27%
Sapphire Pulse Radeon RX 7700 XT
AMD Ryzen 9 7950X, AMD Radeon RX 7700 XT
16777 Points -29%
Average NVIDIA Titan RTX
  (14216 - 15283, n=29)
14884 Points -37%
KFA2 GeForce RTX 3070 Ti SG
AMD Ryzen 9 7950X, NVIDIA GeForce RTX 3070 Ti
14783 Points -38%
Average NVIDIA GeForce RTX 4060 Ti 8G
  (13293 - 13549, n=3)
13423 Points -43%
KFA2 GeForce RTX 4060 Ti EX, 16GB GDDR6
AMD Ryzen 9 7950X, NVIDIA GeForce RTX 4060 Ti 16G
13359 Points -44%
Average NVIDIA GeForce RTX 3070
  (11043 - 13579, n=7)
12616 Points -47%
XFX Speedster QICK 308 Radeon RX 7600 Black Edition
AMD Ryzen 9 7950X, AMD Radeon RX 7600
11062 Points -53%
KFA2 GeForce RTX 4060 1-Click-OC 2X
AMD Ryzen 9 7950X, NVIDIA GeForce RTX 4060
10494 Points -56%
Unigine Heaven 4.0 / Extreme Preset DX11
NVIDIA GeForce RTX 4090 Founders Edition
Intel Core i9-13900K, NVIDIA GeForce RTX 4090
466 (11min - 1031max) fps +49%
NVIDIA GeForce RTX 4080 Founders Edition
Intel Core i9-13900K, NVIDIA GeForce RTX 4080
389.4 (11.3min - 813.1max) fps +25%
AMD Radeon RX 7900 XTX
AMD Ryzen 9 7950X, AMD Radeon RX 7900 XTX
357.6 fps +15%
AMD Radeon RX 7900 XT
AMD Ryzen 9 7950X, AMD Radeon RX 7900 XT
319.7 fps +3%
Gigabyte Aorus GeForce RTX 4070 Ti Master
Intel Core i9-13900K, NVIDIA GeForce RTX 4070 Ti
317.9 (52.3min - 701.6max) fps +2%
Asus TUF Gaming GeForce RTX 4070 Ti
Intel Core i9-13900K, NVIDIA GeForce RTX 4070 Ti
317.6 (57.8min - 692.1max) fps +2%
Average NVIDIA GeForce RTX 4070 Ti
  (312 - 319, n=4)
317 fps +2%
Asus TUF Gaming GeForce RTX 4070 Ti Super
Intel Core i9-13900K, NVIDIA GeForce RTX 4070 Ti SUPER
311.9 (47.1min - 651.4max) fps
Zotac Gaming GeForce RTX 3090 Ti AMP Extreme Holo
AMD Ryzen 7 5800X3D, NVIDIA GeForce RTX 3090 Ti
308.5 (9.7min - 627.1max) fps -1%
Average NVIDIA GeForce RTX 3090
  (272 - 315, n=11)
300 fps -4%
Average NVIDIA GeForce RTX 3080 Ti
  (290 - 312, n=4)
300 fps -4%
Sapphire AMD Radeon RX 6950 XT Nitro+ Pure
AMD Ryzen 9 5900X, AMD Radeon RX 6950 XT
293.8 fps -6%
Gigabyte GeForce RTX 4070 Super Gaming OC 12G
Intel Core i9-13900K, NVIDIA GeForce RTX 4070 SUPER
280.8 (51.7min - 649.1max) fps -10%
NVIDIA GeForce RTX 4070 Super Founders Edition
Intel Core i9-13900K, NVIDIA GeForce RTX 4070 SUPER
276.1 (50.9min - 603max) fps -11%
AMD Radeon RX 6900 XT
AMD Ryzen 9 5950X, AMD Radeon RX 6900 XT
259.5 (49.3min - 537.2max) fps -17%
Zotac Gaming GeForce RTX 4070 AMP Airo
Intel Core i9-13900K, NVIDIA GeForce RTX 4070
248 (11min - 572.3max) fps -20%
AMD Radeon RX 6800 XT
AMD Ryzen 9 5950X, AMD Radeon RX 6800 XT
247.9 fps -21%
KFA2 GeForce RTX 3070 Ti SG
AMD Ryzen 9 7950X, NVIDIA GeForce RTX 3070 Ti
244.2 fps -22%
Average NVIDIA GeForce RTX 3080
  (233 - 253, n=2)
243 fps -22%
AMD Radeon RX 7800 XT
AMD Ryzen 9 7950X, AMD Radeon RX 7800 XT
242.7 fps -22%
Average NVIDIA Titan RTX
  (207 - 248, n=12)
236 fps -24%
Average of class Desktop
  (4.5 - 472, n=24, last 2 years)
220 fps -29%
Sapphire Pulse Radeon RX 7700 XT
AMD Ryzen 9 7950X, AMD Radeon RX 7700 XT
211.7 fps -32%
Average NVIDIA GeForce RTX 3070
  (196.4 - 214, n=5)
206 fps -34%
Average NVIDIA GeForce RTX 4060 Ti 8G
  (178.9 - 181.6, n=3)
180.6 fps -42%
KFA2 GeForce RTX 4060 Ti EX, 16GB GDDR6
AMD Ryzen 9 7950X, NVIDIA GeForce RTX 4060 Ti 16G
174.8 fps -44%
KFA2 GeForce RTX 4060 1-Click-OC 2X
AMD Ryzen 9 7950X, NVIDIA GeForce RTX 4060
153.7 fps -51%
XFX Speedster QICK 308 Radeon RX 7600 Black Edition
AMD Ryzen 9 7950X, AMD Radeon RX 7600
148.1 fps -53%
Unigine Heaven 4.0 / Extreme Preset OpenGL
NVIDIA GeForce RTX 4090 Founders Edition
Intel Core i9-13900K, NVIDIA GeForce RTX 4090
443 (15min - 902max) fps +43%
AMD Radeon RX 7900 XTX
AMD Ryzen 9 7950X, AMD Radeon RX 7900 XTX
370.2 fps +19%
NVIDIA GeForce RTX 4080 Founders Edition
Intel Core i9-13900K, NVIDIA GeForce RTX 4080
364.2 (15min - 770.5max) fps +17%
AMD Radeon RX 7900 XT
AMD Ryzen 9 7950X, AMD Radeon RX 7900 XT
330.2 fps +6%
Asus TUF Gaming GeForce RTX 4070 Ti Super
Intel Core i9-13900K, NVIDIA GeForce RTX 4070 Ti SUPER
310.3 (14.5min - 698.3max) fps
Gigabyte Aorus GeForce RTX 4070 Ti Master
Intel Core i9-13900K, NVIDIA GeForce RTX 4070 Ti
295.5 (50.3min - 602max) fps -5%
Average NVIDIA GeForce RTX 4070 Ti
  (291 - 297, n=4)
294 fps -5%
Asus TUF Gaming GeForce RTX 4070 Ti
Intel Core i9-13900K, NVIDIA GeForce RTX 4070 Ti
292.6 (15.2min - 600.3max) fps -6%
Zotac Gaming GeForce RTX 3090 Ti AMP Extreme Holo
AMD Ryzen 7 5800X3D, NVIDIA GeForce RTX 3090 Ti
292.5 (11.4min - 577.9max) fps -6%
Gigabyte GeForce RTX 4070 Super Gaming OC 12G
Intel Core i9-13900K, NVIDIA GeForce RTX 4070 SUPER
279.9 (14.2min - 655.5max) fps -10%
NVIDIA GeForce RTX 4070 Super Founders Edition
Intel Core i9-13900K, NVIDIA GeForce RTX 4070 SUPER
276.1 (57.7min - 579max) fps -11%
Average NVIDIA GeForce RTX 3080 Ti
  (264 - 282, n=4)
274 fps -12%
Average NVIDIA GeForce RTX 3090
  (188.2 - 284, n=10)
270 fps -13%
AMD Radeon RX 7800 XT
AMD Ryzen 9 7950X, AMD Radeon RX 7800 XT
257.9 fps -17%
Average NVIDIA GeForce RTX 3080
  (232 - 243, n=2)
238 fps -23%
Zotac Gaming GeForce RTX 4070 AMP Airo
Intel Core i9-13900K, NVIDIA GeForce RTX 4070
230.2 (14.6min - 500.6max) fps -26%
Average NVIDIA Titan RTX
  (203 - 299, n=12)
223 fps -28%
Sapphire AMD Radeon RX 6950 XT Nitro+ Pure
AMD Ryzen 9 5900X, AMD Radeon RX 6950 XT
222.7 fps -28%
KFA2 GeForce RTX 3070 Ti SG
AMD Ryzen 9 7950X, NVIDIA GeForce RTX 3070 Ti
218.8 fps -29%
Sapphire Pulse Radeon RX 7700 XT
AMD Ryzen 9 7950X, AMD Radeon RX 7700 XT
213.2 fps -31%
Average of class Desktop
  (4 - 450, n=24, last 2 years)
209 fps -33%
AMD Radeon RX 6900 XT
AMD Ryzen 9 5950X, AMD Radeon RX 6900 XT
206.5 (8.2min - 453.7max) fps -33%
AMD Radeon RX 6800 XT
AMD Ryzen 9 5950X, AMD Radeon RX 6800 XT
204 fps -34%
Average NVIDIA GeForce RTX 3070
  (187.5 - 196.1, n=4)
192.5 fps -38%
Average NVIDIA GeForce RTX 4060 Ti 8G
  (173 - 176, n=3)
174.7 fps -44%
KFA2 GeForce RTX 4060 Ti EX, 16GB GDDR6
AMD Ryzen 9 7950X, NVIDIA GeForce RTX 4060 Ti 16G
170.3 fps -45%
XFX Speedster QICK 308 Radeon RX 7600 Black Edition
AMD Ryzen 9 7950X, AMD Radeon RX 7600
147.2 fps -53%
KFA2 GeForce RTX 4060 1-Click-OC 2X
AMD Ryzen 9 7950X, NVIDIA GeForce RTX 4060
147 fps -53%
Unigine Valley 1.0 / Extreme HD DirectX
NVIDIA GeForce RTX 4090 Founders Edition
Intel Core i9-13900K, NVIDIA GeForce RTX 4090
283 (80min - 527max) fps +17%
NVIDIA GeForce RTX 4080 Founders Edition
Intel Core i9-13900K, NVIDIA GeForce RTX 4080
277.5 (71.7min - 487.9max) fps +14%
AMD Radeon RX 7900 XTX
AMD Ryzen 9 7950X, AMD Radeon RX 7900 XTX
264.5 fps +9%
AMD Radeon RX 7900 XT
AMD Ryzen 9 7950X, AMD Radeon RX 7900 XT
243.3 fps 0%
Asus TUF Gaming GeForce RTX 4070 Ti Super
Intel Core i9-13900K, NVIDIA GeForce RTX 4070 Ti SUPER
242.6 (75.4min - 480.6max) fps
Asus TUF Gaming GeForce RTX 4070 Ti
Intel Core i9-13900K, NVIDIA GeForce RTX 4070 Ti
230.3 (78.9min - 451.1max) fps -5%
Average NVIDIA GeForce RTX 3080 Ti
  (206 - 240, n=4)
228 fps -6%
Average NVIDIA GeForce RTX 3090
  (184.2 - 247, n=11)
225 fps -7%
Average NVIDIA GeForce RTX 4070 Ti
  (208 - 230, n=4)
218 fps -10%
Gigabyte GeForce RTX 4070 Super Gaming OC 12G
Intel Core i9-13900K, NVIDIA GeForce RTX 4070 SUPER
215.3 (73.3min - 409.2max) fps -11%
NVIDIA GeForce RTX 4070 Super Founders Edition
Intel Core i9-13900K, NVIDIA GeForce RTX 4070 SUPER
213.8 (75min - 414.5max) fps -12%
Sapphire AMD Radeon RX 6950 XT Nitro+ Pure
AMD Ryzen 9 5900X, AMD Radeon RX 6950 XT
209.2 fps -14%
Gigabyte Aorus GeForce RTX 4070 Ti Master
Intel Core i9-13900K, NVIDIA GeForce RTX 4070 Ti
207.5 (75.3min - 371.2max) fps -14%
Zotac Gaming GeForce RTX 3090 Ti AMP Extreme Holo
AMD Ryzen 7 5800X3D, NVIDIA GeForce RTX 3090 Ti
201.7 (48.5min - 338.7max) fps -17%
AMD Radeon RX 6900 XT
AMD Ryzen 9 5950X, AMD Radeon RX 6900 XT
200.8 (53.4min - 359.1max) fps -17%
Zotac Gaming GeForce RTX 4070 AMP Airo
Intel Core i9-13900K, NVIDIA GeForce RTX 4070
195.2 (57.6min - 374.2max) fps -20%
KFA2 GeForce RTX 3070 Ti SG
AMD Ryzen 9 7950X, NVIDIA GeForce RTX 3070 Ti
193.2 fps -20%
AMD Radeon RX 7800 XT
AMD Ryzen 9 7950X, AMD Radeon RX 7800 XT
191.3 fps -21%
AMD Radeon RX 6800 XT
AMD Ryzen 9 5950X, AMD Radeon RX 6800 XT
190.6 fps -21%
Average NVIDIA GeForce RTX 3080
  (176.2 - 181.8, n=2)
179 fps -26%
Average NVIDIA Titan RTX
  (135 - 191.4, n=12)
173.3 fps -29%
Average NVIDIA GeForce RTX 3070
  (155.1 - 168.5, n=5)
161.2 fps -34%
Sapphire Pulse Radeon RX 7700 XT
AMD Ryzen 9 7950X, AMD Radeon RX 7700 XT
160.1 fps -34%
Average of class Desktop
  (3.7 - 292, n=24, last 2 years)
158.9 fps -35%
Average NVIDIA GeForce RTX 4060 Ti 8G
  (128.3 - 131.2, n=3)
129.8 fps -46%
KFA2 GeForce RTX 4060 Ti EX, 16GB GDDR6
AMD Ryzen 9 7950X, NVIDIA GeForce RTX 4060 Ti 16G
127.8 fps -47%
KFA2 GeForce RTX 4060 1-Click-OC 2X
AMD Ryzen 9 7950X, NVIDIA GeForce RTX 4060
115.3 fps -52%
XFX Speedster QICK 308 Radeon RX 7600 Black Edition
AMD Ryzen 9 7950X, AMD Radeon RX 7600
107.5 fps -56%
Unigine Valley 1.0 / Extreme HD Preset OpenGL
NVIDIA GeForce RTX 4090 Founders Edition
Intel Core i9-13900K, NVIDIA GeForce RTX 4090
315 (64min - 559max) fps +36%
NVIDIA GeForce RTX 4080 Founders Edition
Intel Core i9-13900K, NVIDIA GeForce RTX 4080
257 (79.3min - 462.8max) fps +11%
AMD Radeon RX 7900 XTX
AMD Ryzen 9 7950X, AMD Radeon RX 7900 XTX
254.2 fps +10%
Asus TUF Gaming GeForce RTX 4070 Ti Super
Intel Core i9-13900K, NVIDIA GeForce RTX 4070 Ti SUPER
232.1 (62.3min - 435.4max) fps
Gigabyte Aorus GeForce RTX 4070 Ti Master
Intel Core i9-13900K, NVIDIA GeForce RTX 4070 Ti
230.9 (56.3min - 480.2max) fps -1%
AMD Radeon RX 7900 XT
AMD Ryzen 9 7950X, AMD Radeon RX 7900 XT
225.9 fps -3%
Zotac Gaming GeForce RTX 3090 Ti AMP Extreme Holo
AMD Ryzen 7 5800X3D, NVIDIA GeForce RTX 3090 Ti
208.4 (49.3min - 353max) fps -10%
Average NVIDIA GeForce RTX 4070 Ti
  (197.4 - 231, n=4)
208 fps -10%
Asus TUF Gaming GeForce RTX 4070 Ti
Intel Core i9-13900K, NVIDIA GeForce RTX 4070 Ti
206.8 (64.6min - 374.1max) fps -11%
Average NVIDIA GeForce RTX 3080 Ti
  (195.1 - 210, n=4)
204 fps -12%
Average NVIDIA GeForce RTX 3090
  (158.8 - 226, n=10)
203 fps -13%
NVIDIA GeForce RTX 4070 Super Founders Edition
Intel Core i9-13900K, NVIDIA GeForce RTX 4070 SUPER
200.4 (62.1min - 392.1max) fps -14%
Gigabyte GeForce RTX 4070 Super Gaming OC 12G
Intel Core i9-13900K, NVIDIA GeForce RTX 4070 SUPER
200 (63.6min - 393.8max) fps -14%
AMD Radeon RX 7800 XT
AMD Ryzen 9 7950X, AMD Radeon RX 7800 XT
182 fps -22%
Sapphire AMD Radeon RX 6950 XT Nitro+ Pure
AMD Ryzen 9 5900X, AMD Radeon RX 6950 XT
176.9 fps -24%
Zotac Gaming GeForce RTX 4070 AMP Airo
Intel Core i9-13900K, NVIDIA GeForce RTX 4070
171.8 (61.5min - 301.3max) fps -26%
Average NVIDIA GeForce RTX 3080
  (163.8 - 172, n=2)
167.9 fps -28%
AMD Radeon RX 6900 XT
AMD Ryzen 9 5950X, AMD Radeon RX 6900 XT
167.4 (56.7min - 375.7max) fps -28%
KFA2 GeForce RTX 3070 Ti SG
AMD Ryzen 9 7950X, NVIDIA GeForce RTX 3070 Ti
165.2 fps -29%
AMD Radeon RX 6800 XT
AMD Ryzen 9 5950X, AMD Radeon RX 6800 XT
158.2 fps -32%
Average NVIDIA Titan RTX
  (139.2 - 181.2, n=12)
158.1 fps -32%
Average of class Desktop
  (3.4 - 315, n=24, last 2 years)
151.3 fps -35%
Sapphire Pulse Radeon RX 7700 XT
AMD Ryzen 9 7950X, AMD Radeon RX 7700 XT
143 fps -38%
Average NVIDIA GeForce RTX 3070
  (140.2 - 144.9, n=4)
142.7 fps -39%
Average NVIDIA GeForce RTX 4060 Ti 8G
  (116.5 - 118.8, n=3)
117.8 fps -49%
KFA2 GeForce RTX 4060 Ti EX, 16GB GDDR6
AMD Ryzen 9 7950X, NVIDIA GeForce RTX 4060 Ti 16G
114.9 fps -50%
KFA2 GeForce RTX 4060 1-Click-OC 2X
AMD Ryzen 9 7950X, NVIDIA GeForce RTX 4060
104.5 fps -55%
XFX Speedster QICK 308 Radeon RX 7600 Black Edition
AMD Ryzen 9 7950X, AMD Radeon RX 7600
94.8 fps -59%
Unigine Superposition / 720p Low
Asus TUF Gaming GeForce RTX 4070 Ti
Intel Core i9-13900K, NVIDIA GeForce RTX 4070 Ti
56132 Points +12%
NVIDIA GeForce RTX 4090 Founders Edition
Intel Core i9-13900K, NVIDIA GeForce RTX 4090
55915 Points +11%
NVIDIA GeForce RTX 4080 Founders Edition
Intel Core i9-13900K, NVIDIA GeForce RTX 4080
55670 Points +11%
Gigabyte Aorus GeForce RTX 4070 Ti Master
Intel Core i9-13900K, NVIDIA GeForce RTX 4070 Ti
55232 Points +10%
Average NVIDIA GeForce RTX 4070 Ti
  (48835 - 56396, n=4)
54149 Points +8%
Zotac Gaming GeForce RTX 4070 AMP Airo
Intel Core i9-13900K, NVIDIA GeForce RTX 4070
52713 Points +5%
NVIDIA GeForce RTX 4070 Super Founders Edition
Intel Core i9-13900K, NVIDIA GeForce RTX 4070 SUPER
50724 Points +1%
Gigabyte GeForce RTX 4070 Super Gaming OC 12G
Intel Core i9-13900K, NVIDIA GeForce RTX 4070 SUPER
50629 Points +1%
Asus TUF Gaming GeForce RTX 4070 Ti Super
Intel Core i9-13900K, NVIDIA GeForce RTX 4070 Ti SUPER
50322 Points
KFA2 GeForce RTX 3070 Ti SG
AMD Ryzen 9 7950X, NVIDIA GeForce RTX 3070 Ti
48391 Points -4%
Average NVIDIA GeForce RTX 3080 Ti
  (43163 - 50738, n=4)
47400 Points -6%
Average NVIDIA GeForce RTX 4060 Ti 8G
  (46504 - 47695, n=3)
47288 Points -6%
AMD Radeon RX 7900 XTX
AMD Ryzen 9 7950X, AMD Radeon RX 7900 XTX
47274 Points -6%
Average NVIDIA GeForce RTX 3090
  (33329 - 54879, n=10)
46049 Points -8%
AMD Radeon RX 7900 XT
AMD Ryzen 9 7950X, AMD Radeon RX 7900 XT
45904 Points -9%
KFA2 GeForce RTX 4060 1-Click-OC 2X
AMD Ryzen 9 7950X, NVIDIA GeForce RTX 4060
45864 Points -9%
AMD Radeon RX 7800 XT
AMD Ryzen 9 7950X, AMD Radeon RX 7800 XT
45745 Points -9%
Zotac Gaming GeForce RTX 3090 Ti AMP Extreme Holo
AMD Ryzen 7 5800X3D, NVIDIA GeForce RTX 3090 Ti
45444 Points -10%
Sapphire Pulse Radeon RX 7700 XT
AMD Ryzen 9 7950X, AMD Radeon RX 7700 XT
45299 Points -10%
KFA2 GeForce RTX 4060 Ti EX, 16GB GDDR6
AMD Ryzen 9 7950X, NVIDIA GeForce RTX 4060 Ti 16G
43851 Points -13%
XFX Speedster QICK 308 Radeon RX 7600 Black Edition
AMD Ryzen 9 7950X, AMD Radeon RX 7600
42477 Points -16%
Average NVIDIA Titan RTX
  (25622 - 50876, n=9)
40891 Points -19%
Average of class Desktop
  (2704 - 56132, n=22, last 2 years)
38418 Points -24%
AMD Radeon RX 6900 XT
AMD Ryzen 9 5950X, AMD Radeon RX 6900 XT
37023 Points -26%
AMD Radeon RX 6800 XT
AMD Ryzen 9 5950X, AMD Radeon RX 6800 XT
36452 Points -28%
Average NVIDIA GeForce RTX 3070
  (27330 - 40007, n=5)
34576 Points -31%
Sapphire AMD Radeon RX 6950 XT Nitro+ Pure
AMD Ryzen 9 5900X, AMD Radeon RX 6950 XT
33955 Points -33%
Average NVIDIA GeForce RTX 3080
  (30851 - 32183, n=2)
31517 Points -37%
Unigine Superposition / 1080p Extreme
NVIDIA GeForce RTX 4090 Founders Edition
Intel Core i9-13900K, NVIDIA GeForce RTX 4090
20729 Points +56%
AMD Radeon RX 7900 XTX
AMD Ryzen 9 7950X, AMD Radeon RX 7900 XTX
17264 Points +30%
NVIDIA GeForce RTX 4080 Founders Edition
Intel Core i9-13900K, NVIDIA GeForce RTX 4080
16623 Points +25%
AMD Radeon RX 7900 XT
AMD Ryzen 9 7950X, AMD Radeon RX 7900 XT
14181 Points +7%
Zotac Gaming GeForce RTX 3090 Ti AMP Extreme Holo
AMD Ryzen 7 5800X3D, NVIDIA GeForce RTX 3090 Ti
13803 Points +4%
Gigabyte Aorus GeForce RTX 4070 Ti Master
Intel Core i9-13900K, NVIDIA GeForce RTX 4070 Ti
13448 Points +1%
Asus TUF Gaming GeForce RTX 4070 Ti Super
Intel Core i9-13900K, NVIDIA GeForce RTX 4070 Ti SUPER
13312 Points
Asus TUF Gaming GeForce RTX 4070 Ti
Intel Core i9-13900K, NVIDIA GeForce RTX 4070 Ti
13266 Points 0%
Average NVIDIA GeForce RTX 4070 Ti
  (12837 - 13448, n=4)
13168 Points -1%
Average NVIDIA GeForce RTX 3090
  (11806 - 12694, n=11)
12209 Points -8%
Gigabyte GeForce RTX 4070 Super Gaming OC 12G
Intel Core i9-13900K, NVIDIA GeForce RTX 4070 SUPER
12163 Points -9%
Average NVIDIA GeForce RTX 3080 Ti
  (12038 - 12347, n=4)
12139 Points -9%
Sapphire AMD Radeon RX 6950 XT Nitro+ Pure
AMD Ryzen 9 5900X, AMD Radeon RX 6950 XT
12079 Points -9%
NVIDIA GeForce RTX 4070 Super Founders Edition
Intel Core i9-13900K, NVIDIA GeForce RTX 4070 SUPER
12019 Points -10%
Average NVIDIA GeForce RTX 3080
  (10572 - 10822, n=2)
10697 Points -20%
AMD Radeon RX 6900 XT
AMD Ryzen 9 5950X, AMD Radeon RX 6900 XT
10683 Points -20%
AMD Radeon RX 7800 XT
AMD Ryzen 9 7950X, AMD Radeon RX 7800 XT
10145 Points -24%
Average of class Desktop
  (286 - 21332, n=22, last 2 years)
10122 Points -24%
AMD Radeon RX 6800 XT
AMD Ryzen 9 5950X, AMD Radeon RX 6800 XT
10046 Points -25%
Zotac Gaming GeForce RTX 4070 AMP Airo
Intel Core i9-13900K, NVIDIA GeForce RTX 4070
9764 Points -27%
KFA2 GeForce RTX 3070 Ti SG
AMD Ryzen 9 7950X, NVIDIA GeForce RTX 3070 Ti
9272 Points -30%
Average NVIDIA Titan RTX
  (8916 - 9285, n=9)
9051 Points -32%
Sapphire Pulse Radeon RX 7700 XT
AMD Ryzen 9 7950X, AMD Radeon RX 7700 XT
8732 Points -34%
Average NVIDIA GeForce RTX 3070
  (8276 - 8507, n=5)
8354 Points -37%
KFA2 GeForce RTX 4060 Ti EX, 16GB GDDR6
AMD Ryzen 9 7950X, NVIDIA GeForce RTX 4060 Ti 16G
7712 Points -42%
Average NVIDIA GeForce RTX 4060 Ti 8G
  (7085 - 7833, n=3)
7438 Points -44%
XFX Speedster QICK 308 Radeon RX 7600 Black Edition
AMD Ryzen 9 7950X, AMD Radeon RX 7600
6419 Points -52%
KFA2 GeForce RTX 4060 1-Click-OC 2X
AMD Ryzen 9 7950X, NVIDIA GeForce RTX 4060
5974 Points -55%
Unigine Superposition / 4k Optimized
NVIDIA GeForce RTX 4090 Founders Edition
Intel Core i9-13900K, NVIDIA GeForce RTX 4090
32977 Points +75%
AMD Radeon RX 7900 XTX
AMD Ryzen 9 7950X, AMD Radeon RX 7900 XTX
23174 Points +23%
NVIDIA GeForce RTX 4080 Founders Edition
Intel Core i9-13900K, NVIDIA GeForce RTX 4080
22343 Points +19%
Asus TUF Gaming GeForce RTX 4070 Ti Super
Intel Core i9-13900K, NVIDIA GeForce RTX 4070 Ti SUPER
18817 Points
AMD Radeon RX 7900 XT
AMD Ryzen 9 7950X, AMD Radeon RX 7900 XT
18806 Points 0%
Zotac Gaming GeForce RTX 3090 Ti AMP Extreme Holo
AMD Ryzen 7 5800X3D, NVIDIA GeForce RTX 3090 Ti
18426 Points -2%
Sapphire AMD Radeon RX 6950 XT Nitro+ Pure
AMD Ryzen 9 5900X, AMD Radeon RX 6950 XT
17725 Points -6%
Gigabyte Aorus GeForce RTX 4070 Ti Master
Intel Core i9-13900K, NVIDIA GeForce RTX 4070 Ti
17290 Points -8%
Asus TUF Gaming GeForce RTX 4070 Ti
Intel Core i9-13900K, NVIDIA GeForce RTX 4070 Ti
17184 Points -9%
Average NVIDIA GeForce RTX 4070 Ti
  (16889 - 17290, n=4)
17118 Points -9%
Average NVIDIA GeForce RTX 3090
  (15794 - 16868, n=11)
16326 Points -13%
Average NVIDIA GeForce RTX 3080 Ti
  (16108 - 16412, n=4)
16199 Points -14%
Gigabyte GeForce RTX 4070 Super Gaming OC 12G
Intel Core i9-13900K, NVIDIA GeForce RTX 4070 SUPER
15913 Points -15%
NVIDIA GeForce RTX 4070 Super Founders Edition
Intel Core i9-13900K, NVIDIA GeForce RTX 4070 SUPER
15803 Points -16%
AMD Radeon RX 6900 XT
AMD Ryzen 9 5950X, AMD Radeon RX 6900 XT
14955 Points -21%
Average of class Desktop
  (559 - 33488, n=21, last 2 years)
14724 Points -22%
Average NVIDIA GeForce RTX 3080
  (13984 - 14243, n=2)
14114 Points -25%
AMD Radeon RX 7800 XT
AMD Ryzen 9 7950X, AMD Radeon RX 7800 XT
13776 Points -27%
Zotac Gaming GeForce RTX 4070 AMP Airo
Intel Core i9-13900K, NVIDIA GeForce RTX 4070
13715 Points -27%
AMD Radeon RX 6800 XT
AMD Ryzen 9 5950X, AMD Radeon RX 6800 XT
13471 Points -28%
Average NVIDIA Titan RTX
  (11937 - 12644, n=9)
12203 Points -35%
KFA2 GeForce RTX 3070 Ti SG
AMD Ryzen 9 7950X, NVIDIA GeForce RTX 3070 Ti
12171 Points -35%
Sapphire Pulse Radeon RX 7700 XT
AMD Ryzen 9 7950X, AMD Radeon RX 7700 XT
11256 Points -40%
Average NVIDIA GeForce RTX 3070
  (10544 - 10755, n=5)
10667 Points -43%
Average NVIDIA GeForce RTX 4060 Ti 8G
  (9579 - 9722, n=3)
9651 Points -49%
KFA2 GeForce RTX 4060 Ti EX, 16GB GDDR6
AMD Ryzen 9 7950X, NVIDIA GeForce RTX 4060 Ti 16G
9516 Points -49%
KFA2 GeForce RTX 4060 1-Click-OC 2X
AMD Ryzen 9 7950X, NVIDIA GeForce RTX 4060
7959 Points -58%
XFX Speedster QICK 308 Radeon RX 7600 Black Edition
AMD Ryzen 9 7950X, AMD Radeon RX 7600
7817 Points -58%
Unigine Superposition / 8k Optimized
NVIDIA GeForce RTX 4090 Founders Edition
Intel Core i9-13900K, NVIDIA GeForce RTX 4090
12826 Points +80%
AMD Radeon RX 7900 XTX
AMD Ryzen 9 7950X, AMD Radeon RX 7900 XTX
8751 Points +23%
NVIDIA GeForce RTX 4080 Founders Edition
Intel Core i9-13900K, NVIDIA GeForce RTX 4080
8556 Points +20%
Zotac Gaming GeForce RTX 3090 Ti AMP Extreme Holo
AMD Ryzen 7 5800X3D, NVIDIA GeForce RTX 3090 Ti
8213 Points +15%
Average NVIDIA GeForce RTX 3090
  (6969 - 7521, n=11)
7144 Points 0%
Asus TUF Gaming GeForce RTX 4070 Ti Super
Intel Core i9-13900K, NVIDIA GeForce RTX 4070 Ti SUPER
7121 Points
Average NVIDIA GeForce RTX 3080 Ti
  (6920 - 7161, n=4)
7070 Points -1%
AMD Radeon RX 7900 XT
AMD Ryzen 9 7950X, AMD Radeon RX 7900 XT
7034 Points -1%
Sapphire AMD Radeon RX 6950 XT Nitro+ Pure
AMD Ryzen 9 5900X, AMD Radeon RX 6950 XT
6645 Points -7%
Gigabyte Aorus GeForce RTX 4070 Ti Master
Intel Core i9-13900K, NVIDIA GeForce RTX 4070 Ti
6454 Points -9%
Asus TUF Gaming GeForce RTX 4070 Ti
Intel Core i9-13900K, NVIDIA GeForce RTX 4070 Ti
6427 Points -10%
Average NVIDIA GeForce RTX 4070 Ti
  (6380 - 6454, n=4)
6425 Points -10%
Average NVIDIA GeForce RTX 3080
  (6243 - 6346, n=2)
6295 Points -12%
Gigabyte GeForce RTX 4070 Super Gaming OC 12G
Intel Core i9-13900K, NVIDIA GeForce RTX 4070 SUPER
5892 Points -17%
NVIDIA GeForce RTX 4070 Super Founders Edition
Intel Core i9-13900K, NVIDIA GeForce RTX 4070 SUPER
5844 Points -18%
Average of class Desktop
  (237 - 13008, n=21, last 2 years)
5826 Points -18%
AMD Radeon RX 6900 XT
AMD Ryzen 9 5950X, AMD Radeon RX 6900 XT
5764 Points -19%
Average NVIDIA Titan RTX
  (5255 - 5571, n=9)
5393 Points -24%
KFA2 GeForce RTX 3070 Ti SG
AMD Ryzen 9 7950X, NVIDIA GeForce RTX 3070 Ti
5309 Points -25%
AMD Radeon RX 7800 XT
AMD Ryzen 9 7950X, AMD Radeon RX 7800 XT
5307 Points -25%
AMD Radeon RX 6800 XT
AMD Ryzen 9 5950X, AMD Radeon RX 6800 XT
5256 Points -26%
Zotac Gaming GeForce RTX 4070 AMP Airo
Intel Core i9-13900K, NVIDIA GeForce RTX 4070
5253 Points -26%
Average NVIDIA GeForce RTX 3070
  (4587 - 4695, n=5)
4624 Points -35%
Sapphire Pulse Radeon RX 7700 XT
AMD Ryzen 9 7950X, AMD Radeon RX 7700 XT
4085 Points -43%
Average NVIDIA GeForce RTX 4060 Ti 8G
  (3520 - 3571, n=3)
3546 Points -50%
KFA2 GeForce RTX 4060 Ti EX, 16GB GDDR6
AMD Ryzen 9 7950X, NVIDIA GeForce RTX 4060 Ti 16G
3517 Points -51%
KFA2 GeForce RTX 4060 1-Click-OC 2X
AMD Ryzen 9 7950X, NVIDIA GeForce RTX 4060
3066 Points -57%
XFX Speedster QICK 308 Radeon RX 7600 Black Edition
AMD Ryzen 9 7950X, AMD Radeon RX 7600
2964 Points -58%
3DMark 11 Performance
54278 points
3DMark Ice Storm Standard Score
287297 points
3DMark Cloud Gate Standard Score
79438 points
3DMark Fire Strike Score
42631 points
3DMark Fire Strike Extreme Score
27105 points
3DMark Time Spy Score
23540 points
Help

计算性能:随着 CUDA 内核数量的增加而扩展

在 V-Ray 和 Blender 等计算测试中,CUDA 核心数增加的影响更为明显。在 V-Ray 5 中,TUF GamingGeForce RTX 4070 Ti Super 在 CUDA 和 RTX 基准测试中分别领先 RTX 4070 Ti 平均值 11% 和 14%,令人印象深刻。AMD 显卡在这些测试中明显处于劣势。

不过,在 LuxMark Sala GPU 测试中,AMD 显卡大放异彩,即使是RX 6950 XT 也比RTX 4090 Founders Edition 显示出良好的领先优势。尽管如此,在 LuxMark Room GPU 测试中,RTX 4070 Ti Super 比 TUF GamingGeForce RTX 4070 Ti OC 和AorusGeForce RTX 4070 Ti Master 都提升了 11%。

TUF GamingGeForce RTX 4070 Ti Super 还能比 RTX 4070 Ti 平均快 1.5 秒完成 Blender 3.3 Classroom CUDA 和 Optix 渲染。

V-Ray 5 Benchmark / GPU CUDA
NVIDIA GeForce RTX 4090 Founders Edition
Intel Core i9-13900K, NVIDIA GeForce RTX 4090 (5.0.1)
4224 mpaths +64%
NVIDIA GeForce RTX 4080 Founders Edition
Intel Core i9-13900K, NVIDIA GeForce RTX 4080 (5.0.1)
3067 mpaths +19%
Asus TUF Gaming GeForce RTX 4070 Ti Super
Intel Core i9-13900K, NVIDIA GeForce RTX 4070 Ti SUPER (5.0.1)
2578 mpaths
Gigabyte Aorus GeForce RTX 4070 Ti Master
Intel Core i9-13900K, NVIDIA GeForce RTX 4070 Ti (5.0.1)
2371 mpaths -8%
Asus TUF Gaming GeForce RTX 4070 Ti
Intel Core i9-13900K, NVIDIA GeForce RTX 4070 Ti (5.0.1)
2322 mpaths -10%
Average NVIDIA GeForce RTX 4070 Ti
  (2278 - 2371, n=4)
2318 mpaths -10%
Gigabyte GeForce RTX 4070 Super Gaming OC 12G
Intel Core i9-13900K, NVIDIA GeForce RTX 4070 SUPER (5.0.1)
2254 mpaths -13%
NVIDIA GeForce RTX 4070 Super Founders Edition
Intel Core i9-13900K, NVIDIA GeForce RTX 4070 SUPER (5.0.1)
2238 mpaths -13%
Zotac Gaming GeForce RTX 3090 Ti AMP Extreme Holo
AMD Ryzen 7 5800X3D, NVIDIA GeForce RTX 3090 Ti (5.0.1)
2195 mpaths -15%
Average NVIDIA GeForce RTX 3080 Ti
  (2045 - 2070, n=3)
2057 mpaths -20%
Average NVIDIA GeForce RTX 3090
  (1616 - 2131, n=14)
2019 mpaths -22%
Zotac Gaming GeForce RTX 4070 AMP Airo
Intel Core i9-13900K, NVIDIA GeForce RTX 4070 (5.0.1)
1874 mpaths -27%
Average of class Desktop
  (13 - 4322, n=27, last 2 years)
1808 mpaths -30%
KFA2 GeForce RTX 3070 Ti SG
AMD Ryzen 9 7950X, NVIDIA GeForce RTX 3070 Ti (5.0.1)
1518 mpaths -41%
Average NVIDIA GeForce RTX 4060 Ti 8G
  (1375 - 1400, n=2)
1388 mpaths -46%
KFA2 GeForce RTX 4060 Ti EX, 16GB GDDR6
AMD Ryzen 9 7950X, NVIDIA GeForce RTX 4060 Ti 16G (5.0.1)
1387 mpaths -46%
Average NVIDIA GeForce RTX 3070
  (1109 - 1422, n=2)
1266 mpaths -51%
KFA2 GeForce RTX 4060 1-Click-OC 2X
AMD Ryzen 9 7950X, NVIDIA GeForce RTX 4060 (5.0.1)
1246 mpaths -52%
Average NVIDIA Titan RTX
  (668 - 1052, n=7)
910 mpaths -65%
AMD Radeon RX 7800 XT
AMD Ryzen 9 7950X, AMD Radeon RX 7800 XT (5.0.1)
666 mpaths -74%
Sapphire Pulse Radeon RX 7700 XT
AMD Ryzen 9 7950X, AMD Radeon RX 7700 XT (5.0.1)
663 mpaths -74%
XFX Speedster QICK 308 Radeon RX 7600 Black Edition
AMD Ryzen 9 7950X, AMD Radeon RX 7600 (5.0.1)
662 mpaths -74%
Sapphire AMD Radeon RX 6950 XT Nitro+ Pure
AMD Ryzen 9 5900X, AMD Radeon RX 6950 XT (5.0.1)
383 mpaths -85%
V-Ray 5 Benchmark / GPU RTX
NVIDIA GeForce RTX 4090 Founders Edition
Intel Core i9-13900K, NVIDIA GeForce RTX 4090 (5.0.1)
5935 mpaths +65%
NVIDIA GeForce RTX 4080 Founders Edition
Intel Core i9-13900K, NVIDIA GeForce RTX 4080 (5.0.1)
4193 mpaths +16%
Asus TUF Gaming GeForce RTX 4070 Ti Super
Intel Core i9-13900K, NVIDIA GeForce RTX 4070 Ti SUPER (5.0.1)
3606 mpaths
Average of class Desktop
  (992 - 6019, n=18, last 2 years)
3574 mpaths -1%
Gigabyte Aorus GeForce RTX 4070 Ti Master
Intel Core i9-13900K, NVIDIA GeForce RTX 4070 Ti (5.0.1)
3221 mpaths -11%
Asus TUF Gaming GeForce RTX 4070 Ti
Intel Core i9-13900K, NVIDIA GeForce RTX 4070 Ti (5.0.1)
3180 mpaths -12%
Average NVIDIA GeForce RTX 4070 Ti
  (3054 - 3221, n=4)
3151 mpaths -13%
Gigabyte GeForce RTX 4070 Super Gaming OC 12G
Intel Core i9-13900K, NVIDIA GeForce RTX 4070 SUPER (5.0.1)
3122 mpaths -13%
NVIDIA GeForce RTX 4070 Super Founders Edition
Intel Core i9-13900K, NVIDIA GeForce RTX 4070 SUPER (5.0.1)
3088 mpaths -14%
Zotac Gaming GeForce RTX 3090 Ti AMP Extreme Holo
AMD Ryzen 7 5800X3D, NVIDIA GeForce RTX 3090 Ti (5.0.1)
2880 mpaths -20%
Average NVIDIA GeForce RTX 3090
  (2551 - 2979, n=14)
2813 mpaths -22%
Average NVIDIA GeForce RTX 3080 Ti
  (2727 - 2883, n=3)
2784 mpaths -23%
Zotac Gaming GeForce RTX 4070 AMP Airo
Intel Core i9-13900K, NVIDIA GeForce RTX 4070 (5.0.1)
2660 mpaths -26%
KFA2 GeForce RTX 3070 Ti SG
AMD Ryzen 9 7950X, NVIDIA GeForce RTX 3070 Ti (5.0.1)
2026 mpaths -44%
AMD Radeon RX 7800 XT
AMD Ryzen 9 7950X, AMD Radeon RX 7800 XT (5.0.1)
2024 mpaths -44%
Average NVIDIA GeForce RTX 4060 Ti 8G
  (1974 - 2024, n=2)
1999 mpaths -45%
KFA2 GeForce RTX 4060 Ti EX, 16GB GDDR6
AMD Ryzen 9 7950X, NVIDIA GeForce RTX 4060 Ti 16G (5.0.1)
1967 mpaths -45%
Sapphire Pulse Radeon RX 7700 XT
AMD Ryzen 9 7950X, AMD Radeon RX 7700 XT (5.0.1)
1967 mpaths -45%
KFA2 GeForce RTX 4060 1-Click-OC 2X
AMD Ryzen 9 7950X, NVIDIA GeForce RTX 4060 (5.0.1)
1856 mpaths -49%
Average NVIDIA GeForce RTX 3070
  (1610 - 1756, n=2)
1683 mpaths -53%
Average NVIDIA Titan RTX
  (1246 - 1348, n=7)
1299 mpaths -64%
V-Ray Benchmark Next 4.10 / GPU
NVIDIA GeForce RTX 4090 Founders Edition
Intel Core i9-13900K, NVIDIA GeForce RTX 4090 (v4.10.07 )
1847 mpaths +43%
NVIDIA GeForce RTX 4080 Founders Edition
Intel Core i9-13900K, NVIDIA GeForce RTX 4080 (v4.10.07 )
1455 mpaths +13%
Asus TUF Gaming GeForce RTX 4070 Ti Super
Intel Core i9-13900K, NVIDIA GeForce RTX 4070 Ti SUPER (v4.10.07 )
1290 mpaths
NVIDIA GeForce RTX 4070 Super Founders Edition
Intel Core i9-13900K, NVIDIA GeForce RTX 4070 SUPER (v4.10.07 )
1075 mpaths -17%
Gigabyte GeForce RTX 4070 Super Gaming OC 12G
Intel Core i9-13900K, NVIDIA GeForce RTX 4070 SUPER (v4.10.07 )
1075 mpaths -17%
Average NVIDIA GeForce RTX 4070 Ti
  (1056 - 1076, n=3)
1064 mpaths -18%
Asus TUF Gaming GeForce RTX 4070 Ti
Intel Core i9-13900K, NVIDIA GeForce RTX 4070 Ti (v4.10.07 )
1060 mpaths -18%
Gigabyte Aorus GeForce RTX 4070 Ti Master
Intel Core i9-13900K, NVIDIA GeForce RTX 4070 Ti (v4.10.07 )
1056 mpaths -18%
Zotac Gaming GeForce RTX 4070 AMP Airo
Intel Core i9-13900K, NVIDIA GeForce RTX 4070 (v4.10.07 )
966 mpaths -25%
Zotac Gaming GeForce RTX 3090 Ti AMP Extreme Holo
AMD Ryzen 7 5800X3D, NVIDIA GeForce RTX 3090 Ti (v4.10.07 )
902 mpaths -30%
Average NVIDIA GeForce RTX 3090
  (781 - 877, n=16)
856 mpaths -34%
Average NVIDIA GeForce RTX 3080 Ti
  (854 - 855, n=3)
854 mpaths -34%
Average of class Desktop
  (4 - 1880, n=29, last 2 years)
792 mpaths -39%
Average NVIDIA GeForce RTX 3080
  (636 - 643, n=2)
640 mpaths -50%
Average NVIDIA GeForce RTX 4060 Ti 8G
  (626 - 649, n=2)
638 mpaths -51%
KFA2 GeForce RTX 4060 Ti EX, 16GB GDDR6
AMD Ryzen 9 7950X, NVIDIA GeForce RTX 4060 Ti 16G (v4.10.07 )
620 mpaths -52%
KFA2 GeForce RTX 4060 1-Click-OC 2X
AMD Ryzen 9 7950X, NVIDIA GeForce RTX 4060 (v4.10.07 )
601 mpaths -53%
Average NVIDIA GeForce RTX 3070
  (464 - 508, n=4)
478 mpaths -63%
Average NVIDIA Titan RTX
  (386 - 439, n=16)
400 mpaths -69%
XFX Speedster QICK 308 Radeon RX 7600 Black Edition
AMD Ryzen 9 7950X, AMD Radeon RX 7600 (v4.10.07 )
221 mpaths -83%
AMD Radeon RX 7800 XT
AMD Ryzen 9 7950X, AMD Radeon RX 7800 XT (v4.10.07 )
220 mpaths -83%
Sapphire Pulse Radeon RX 7700 XT
AMD Ryzen 9 7950X, AMD Radeon RX 7700 XT (v4.10.07 )
220 mpaths -83%
AMD Radeon RX 6800 XT
AMD Ryzen 9 5950X, AMD Radeon RX 6800 XT (v4.10.07 )
157 mpaths -88%
Sapphire AMD Radeon RX 6950 XT Nitro+ Pure
AMD Ryzen 9 5900X, AMD Radeon RX 6950 XT (v4.10.07 )
137 mpaths -89%
Blender / v3.3 Classroom CUDA
KFA2 GeForce RTX 4060 1-Click-OC 2X
AMD Ryzen 9 7950X, NVIDIA GeForce RTX 4060 (3.3.3)
40 Seconds * -135%
KFA2 GeForce RTX 3070 Ti SG
AMD Ryzen 9 7950X, NVIDIA GeForce RTX 3070 Ti (3.3.0)
33 Seconds * -94%
Average NVIDIA Titan RTX
  ()
31 Seconds * -82%
Zotac Gaming GeForce RTX 4070 AMP Airo
Intel Core i9-13900K, NVIDIA GeForce RTX 4070 (3.3.3)
23 Seconds * -35%
Average NVIDIA GeForce RTX 3080 Ti
  (21 - 22, n=2)
21.5 Seconds * -26%
Average NVIDIA GeForce RTX 3090
  (20 - 22, n=11)
21.4 Seconds * -26%
NVIDIA GeForce RTX 4070 Super Founders Edition
Intel Core i9-13900K, NVIDIA GeForce RTX 4070 SUPER (3.3.3)
19 Seconds * -12%
Gigabyte GeForce RTX 4070 Super Gaming OC 12G
Intel Core i9-13900K, NVIDIA GeForce RTX 4070 SUPER (3.3.3)
19 Seconds * -12%
Average NVIDIA GeForce RTX 4070 Ti
  (18 - 19, n=2)
18.5 Seconds * -9%
Gigabyte Aorus GeForce RTX 4070 Ti Master
Intel Core i9-13900K, NVIDIA GeForce RTX 4070 Ti (3.3.2)
18 Seconds * -6%
Asus TUF Gaming GeForce RTX 4070 Ti Super
Intel Core i9-13900K, NVIDIA GeForce RTX 4070 Ti SUPER (3.3.3)
17 Seconds *
Average of class Desktop
  (10 - 23, n=15, last 2 years)
16.2 Seconds * +5%
Blender / v3.3 Classroom OPTIX/RTX
KFA2 GeForce RTX 4060 1-Click-OC 2X
AMD Ryzen 9 7950X, NVIDIA GeForce RTX 4060 (3.3.3)
21 Seconds * -110%
Average NVIDIA Titan RTX
  ()
21 Seconds * -110%
KFA2 GeForce RTX 3070 Ti SG
AMD Ryzen 9 7950X, NVIDIA GeForce RTX 3070 Ti (3.3.0)
20 Seconds * -100%
KFA2 GeForce RTX 4060 Ti EX, 16GB GDDR6
AMD Ryzen 9 7950X, NVIDIA GeForce RTX 4060 Ti 16G (3.3.3)
18 Seconds * -80%
Average NVIDIA GeForce RTX 4060 Ti 8G
  (18 - 18, n=2)
18 Seconds * -80%
Average NVIDIA GeForce RTX 3080 Ti
  (14 - 15, n=2)
14.5 Seconds * -45%
Zotac Gaming GeForce RTX 4070 AMP Airo
Intel Core i9-13900K, NVIDIA GeForce RTX 4070 (3.3.3)
14 Seconds * -40%
Average NVIDIA GeForce RTX 3090
  (13 - 14, n=11)
13.4 Seconds * -34%
Asus TUF Gaming GeForce RTX 4070 Ti
Intel Core i9-13900K, NVIDIA GeForce RTX 4070 Ti (3.3.2)
12 Seconds * -20%
Average NVIDIA GeForce RTX 4070 Ti
  (11 - 12, n=4)
11.5 Seconds * -15%
Gigabyte Aorus GeForce RTX 4070 Ti Master
Intel Core i9-13900K, NVIDIA GeForce RTX 4070 Ti (3.3.2)
11 Seconds * -10%
NVIDIA GeForce RTX 4070 Super Founders Edition
Intel Core i9-13900K, NVIDIA GeForce RTX 4070 SUPER (3.3.3)
11 Seconds * -10%
Gigabyte GeForce RTX 4070 Super Gaming OC 12G
Intel Core i9-13900K, NVIDIA GeForce RTX 4070 SUPER (3.3.3)
11 Seconds * -10%
Average of class Desktop
  (7 - 15, n=17, last 2 years)
10.6 Seconds * -6%
NVIDIA GeForce RTX 4080 Founders Edition
Intel Core i9-13900K, NVIDIA GeForce RTX 4080 (3.3.0)
10 Seconds * -0%
Asus TUF Gaming GeForce RTX 4070 Ti Super
Intel Core i9-13900K, NVIDIA GeForce RTX 4070 Ti SUPER (3.3.3)
10 Seconds *
NVIDIA GeForce RTX 4090 Founders Edition
Intel Core i9-13900K, NVIDIA GeForce RTX 4090 (3.3.0)
8 Seconds * +20%
LuxMark v2.0 64Bit / Room GPUs-only
NVIDIA GeForce RTX 4090 Founders Edition
Intel Core i9-13900K, NVIDIA GeForce RTX 4090
12730 Samples/s +36%
NVIDIA GeForce RTX 4080 Founders Edition
Intel Core i9-13900K, NVIDIA GeForce RTX 4080
10491 Samples/s +12%
Asus TUF Gaming GeForce RTX 4070 Ti Super
Intel Core i9-13900K, NVIDIA GeForce RTX 4070 Ti SUPER
9355 Samples/s
Gigabyte Aorus GeForce RTX 4070 Ti Master
Intel Core i9-13900K, NVIDIA GeForce RTX 4070 Ti
8436 Samples/s -10%
Asus TUF Gaming GeForce RTX 4070 Ti
Intel Core i9-13900K, NVIDIA GeForce RTX 4070 Ti
8413 Samples/s -10%
NVIDIA GeForce RTX 4070 Super Founders Edition
Intel Core i9-13900K, NVIDIA GeForce RTX 4070 SUPER
8262 Samples/s -12%
Gigabyte GeForce RTX 4070 Super Gaming OC 12G
Intel Core i9-13900K, NVIDIA GeForce RTX 4070 SUPER
8257 Samples/s -12%
Average NVIDIA GeForce RTX 4070 Ti
  (7625 - 8436, n=4)
8065 Samples/s -14%
Zotac Gaming GeForce RTX 4070 AMP Airo
Intel Core i9-13900K, NVIDIA GeForce RTX 4070
7402 Samples/s -21%
Zotac Gaming GeForce RTX 3090 Ti AMP Extreme Holo
AMD Ryzen 7 5800X3D, NVIDIA GeForce RTX 3090 Ti
6221 Samples/s -34%
Average NVIDIA GeForce RTX 3080 Ti
  (5772 - 6464, n=4)
6138 Samples/s -34%
Average NVIDIA GeForce RTX 3090
  (5727 - 5985, n=9)
5893 Samples/s -37%
Average of class Desktop
  (81 - 12730, n=23, last 2 years)
5398 Samples/s -42%
AMD Radeon RX 7900 XTX
AMD Ryzen 9 7950X, AMD Radeon RX 7900 XTX
5161 Samples/s -45%
Average NVIDIA GeForce RTX 3080
  (5112 - 5198, n=2)
5155 Samples/s -45%
Sapphire AMD Radeon RX 6950 XT Nitro+ Pure
AMD Ryzen 9 5900X, AMD Radeon RX 6950 XT
5097 Samples/s -46%
AMD Radeon RX 6900 XT
AMD Ryzen 9 5950X, AMD Radeon RX 6900 XT
5084 Samples/s -46%
AMD Radeon RX 6800 XT
AMD Ryzen 9 5950X, AMD Radeon RX 6800 XT
5057 Samples/s -46%
Average NVIDIA Titan RTX
  (4643 - 4703, n=2)
4673 Samples/s -50%
Average NVIDIA GeForce RTX 4060 Ti 8G
  (4558 - 4790, n=3)
4641 Samples/s -50%
KFA2 GeForce RTX 4060 Ti EX, 16GB GDDR6
AMD Ryzen 9 7950X, NVIDIA GeForce RTX 4060 Ti 16G
4570 Samples/s -51%
KFA2 GeForce RTX 3070 Ti SG
AMD Ryzen 9 7950X, NVIDIA GeForce RTX 3070 Ti
4481 Samples/s -52%
AMD Radeon RX 7900 XT
AMD Ryzen 9 7950X, AMD Radeon RX 7900 XT
4451 Samples/s -52%
KFA2 GeForce RTX 4060 1-Click-OC 2X
AMD Ryzen 9 7950X, NVIDIA GeForce RTX 4060
4063 Samples/s -57%
Average NVIDIA GeForce RTX 3070
  (2187 - 4293, n=3)
3588 Samples/s -62%
AMD Radeon RX 7800 XT
AMD Ryzen 9 7950X, AMD Radeon RX 7800 XT
3446 Samples/s -63%
Sapphire Pulse Radeon RX 7700 XT
AMD Ryzen 9 7950X, AMD Radeon RX 7700 XT
3258 Samples/s -65%
XFX Speedster QICK 308 Radeon RX 7600 Black Edition
AMD Ryzen 9 7950X, AMD Radeon RX 7600
2227 Samples/s -76%
LuxMark v2.0 64Bit / Sala GPUs-only
Sapphire AMD Radeon RX 6950 XT Nitro+ Pure
AMD Ryzen 9 5900X, AMD Radeon RX 6950 XT
31954 Samples/s +63%
AMD Radeon RX 6900 XT
AMD Ryzen 9 5950X, AMD Radeon RX 6900 XT
31400 Samples/s +60%
AMD Radeon RX 6800 XT
AMD Ryzen 9 5950X, AMD Radeon RX 6800 XT
28023 Samples/s +43%
NVIDIA GeForce RTX 4090 Founders Edition
Intel Core i9-13900K, NVIDIA GeForce RTX 4090
27828 Samples/s +42%
NVIDIA GeForce RTX 4080 Founders Edition
Intel Core i9-13900K, NVIDIA GeForce RTX 4080
24835 Samples/s +27%
Gigabyte Aorus GeForce RTX 4070 Ti Master
Intel Core i9-13900K, NVIDIA GeForce RTX 4070 Ti
20305 Samples/s +3%
Asus TUF Gaming GeForce RTX 4070 Ti
Intel Core i9-13900K, NVIDIA GeForce RTX 4070 Ti
20171 Samples/s +3%
Asus TUF Gaming GeForce RTX 4070 Ti Super
Intel Core i9-13900K, NVIDIA GeForce RTX 4070 Ti SUPER
19620 Samples/s
Average NVIDIA GeForce RTX 4070 Ti
  (17719 - 20305, n=4)
19151 Samples/s -2%
Gigabyte GeForce RTX 4070 Super Gaming OC 12G
Intel Core i9-13900K, NVIDIA GeForce RTX 4070 SUPER
19131 Samples/s -2%
NVIDIA GeForce RTX 4070 Super Founders Edition
Intel Core i9-13900K, NVIDIA GeForce RTX 4070 SUPER
19072 Samples/s -3%
Zotac Gaming GeForce RTX 3090 Ti AMP Extreme Holo
AMD Ryzen 7 5800X3D, NVIDIA GeForce RTX 3090 Ti
16046 Samples/s -18%
Average NVIDIA GeForce RTX 3080 Ti
  (14871 - 16438, n=4)
15612 Samples/s -20%
Zotac Gaming GeForce RTX 4070 AMP Airo
Intel Core i9-13900K, NVIDIA GeForce RTX 4070
15100 Samples/s -23%
AMD Radeon RX 7900 XTX
AMD Ryzen 9 7950X, AMD Radeon RX 7900 XTX
15019 Samples/s -23%
Average NVIDIA GeForce RTX 3090
  (14590 - 15242, n=9)
14945 Samples/s -24%
AMD Radeon RX 7900 XT
AMD Ryzen 9 7950X, AMD Radeon RX 7900 XT
13489 Samples/s -31%
Average NVIDIA GeForce RTX 3080
  (12797 - 12980, n=2)
12889 Samples/s -34%
Average of class Desktop
  (147 - 27828, n=23, last 2 years)
12288 Samples/s -37%
Average NVIDIA GeForce RTX 4060 Ti 8G
  (11159 - 11281, n=3)
11235 Samples/s -43%
KFA2 GeForce RTX 4060 Ti EX, 16GB GDDR6
AMD Ryzen 9 7950X, NVIDIA GeForce RTX 4060 Ti 16G
11226 Samples/s -43%
KFA2 GeForce RTX 3070 Ti SG
AMD Ryzen 9 7950X, NVIDIA GeForce RTX 3070 Ti
11083 Samples/s -44%
Average NVIDIA Titan RTX
  (10799 - 10996, n=2)
10898 Samples/s -44%
AMD Radeon RX 7800 XT
AMD Ryzen 9 7950X, AMD Radeon RX 7800 XT
10158 Samples/s -48%
Average NVIDIA GeForce RTX 3070
  (10096 - 10115, n=3)
10107 Samples/s -48%
KFA2 GeForce RTX 4060 1-Click-OC 2X
AMD Ryzen 9 7950X, NVIDIA GeForce RTX 4060
8991 Samples/s -54%
Sapphire Pulse Radeon RX 7700 XT
AMD Ryzen 9 7950X, AMD Radeon RX 7700 XT
8614 Samples/s -56%
XFX Speedster QICK 308 Radeon RX 7600 Black Edition
AMD Ryzen 9 7950X, AMD Radeon RX 7600
5583 Samples/s -72%
ComputeMark v2.1 / Normal, Score
NVIDIA GeForce RTX 4090 Founders Edition
Intel Core i9-13900K, NVIDIA GeForce RTX 4090
86583 Points +58%
AMD Radeon RX 7900 XTX
AMD Ryzen 9 7950X, AMD Radeon RX 7900 XTX
62963 Points +15%
NVIDIA GeForce RTX 4080 Founders Edition
Intel Core i9-13900K, NVIDIA GeForce RTX 4080
62720 Points +15%
AMD Radeon RX 7900 XT
AMD Ryzen 9 7950X, AMD Radeon RX 7900 XT
57570 Points +5%
Asus TUF Gaming GeForce RTX 4070 Ti Super
Intel Core i9-13900K, NVIDIA GeForce RTX 4070 Ti SUPER
54675 Points
Zotac Gaming GeForce RTX 3090 Ti AMP Extreme Holo
AMD Ryzen 7 5800X3D, NVIDIA GeForce RTX 3090 Ti
52258 Points -4%
Gigabyte Aorus GeForce RTX 4070 Ti Master
Intel Core i9-13900K, NVIDIA GeForce RTX 4070 Ti
52251 Points -4%
Average NVIDIA GeForce RTX 4070 Ti
  (51287 - 52251, n=4)
51747 Points -5%
Asus TUF Gaming GeForce RTX 4070 Ti
Intel Core i9-13900K, NVIDIA GeForce RTX 4070 Ti
51616 Points -6%
Average NVIDIA GeForce RTX 3080 Ti
  (47377 - 48892, n=4)
48266 Points -12%
Gigabyte GeForce RTX 4070 Super Gaming OC 12G
Intel Core i9-13900K, NVIDIA GeForce RTX 4070 SUPER
48163 Points -12%
NVIDIA GeForce RTX 4070 Super Founders Edition
Intel Core i9-13900K, NVIDIA GeForce RTX 4070 SUPER
47808 Points -13%
Average NVIDIA GeForce RTX 3090
  (44948 - 49118, n=9)
47804 Points -13%
Sapphire AMD Radeon RX 6950 XT Nitro+ Pure
AMD Ryzen 9 5900X, AMD Radeon RX 6950 XT
44959 Points -18%
AMD Radeon RX 7800 XT
AMD Ryzen 9 7950X, AMD Radeon RX 7800 XT
43852 Points -20%
Zotac Gaming GeForce RTX 4070 AMP Airo
Intel Core i9-13900K, NVIDIA GeForce RTX 4070
41933 Points -23%
AMD Radeon RX 6900 XT
AMD Ryzen 9 5950X, AMD Radeon RX 6900 XT
40857 Points -25%
Average NVIDIA GeForce RTX 3080
  (39924 - 41594, n=2)
40759 Points -25%
AMD Radeon RX 6800 XT
AMD Ryzen 9 5950X, AMD Radeon RX 6800 XT
38823 Points -29%
Sapphire Pulse Radeon RX 7700 XT
AMD Ryzen 9 7950X, AMD Radeon RX 7700 XT
38363 Points -30%
Average of class Desktop
  (476 - 90920, n=24, last 2 years)
35064 Points -36%
KFA2 GeForce RTX 3070 Ti SG
AMD Ryzen 9 7950X, NVIDIA GeForce RTX 3070 Ti
34007 Points -38%
KFA2 GeForce RTX 4060 Ti EX, 16GB GDDR6
AMD Ryzen 9 7950X, NVIDIA GeForce RTX 4060 Ti 16G
32285 Points -41%
Average NVIDIA GeForce RTX 4060 Ti 8G
  (31884 - 32410, n=3)
32125 Points -41%
Average NVIDIA GeForce RTX 3070
  (29330 - 30581, n=3)
30004 Points -45%
Average NVIDIA Titan RTX
  (27907 - 29830, n=3)
28802 Points -47%
XFX Speedster QICK 308 Radeon RX 7600 Black Edition
AMD Ryzen 9 7950X, AMD Radeon RX 7600
25119 Points -54%
KFA2 GeForce RTX 4060 1-Click-OC 2X
AMD Ryzen 9 7950X, NVIDIA GeForce RTX 4060
23841 Points -56%
ComputeMark v2.1 / Normal, QJuliaRayTrace
NVIDIA GeForce RTX 4090 Founders Edition
Intel Core i9-13900K, NVIDIA GeForce RTX 4090
31780 Points +49%
NVIDIA GeForce RTX 4080 Founders Edition
Intel Core i9-13900K, NVIDIA GeForce RTX 4080
24307 Points +14%
Gigabyte Aorus GeForce RTX 4070 Ti Master
Intel Core i9-13900K, NVIDIA GeForce RTX 4070 Ti
21619 Points +1%
Asus TUF Gaming GeForce RTX 4070 Ti Super
Intel Core i9-13900K, NVIDIA GeForce RTX 4070 Ti SUPER
21382 Points
Average NVIDIA GeForce RTX 4070 Ti
  (21107 - 21619, n=4)
21333 Points 0%
Asus TUF Gaming GeForce RTX 4070 Ti
Intel Core i9-13900K, NVIDIA GeForce RTX 4070 Ti
21276 Points 0%
Gigabyte GeForce RTX 4070 Super Gaming OC 12G
Intel Core i9-13900K, NVIDIA GeForce RTX 4070 SUPER
19861 Points -7%
NVIDIA GeForce RTX 4070 Super Founders Edition
Intel Core i9-13900K, NVIDIA GeForce RTX 4070 SUPER
19738 Points -8%
Zotac Gaming GeForce RTX 3090 Ti AMP Extreme Holo
AMD Ryzen 7 5800X3D, NVIDIA GeForce RTX 3090 Ti
18550 Points -13%
AMD Radeon RX 7900 XTX
AMD Ryzen 9 7950X, AMD Radeon RX 7900 XTX
17915 Points -16%
Average NVIDIA GeForce RTX 3080 Ti
  (17050 - 17749, n=4)
17475 Points -18%
Average NVIDIA GeForce RTX 3090
  (16403 - 18223, n=10)
17454 Points -18%
Zotac Gaming GeForce RTX 4070 AMP Airo
Intel Core i9-13900K, NVIDIA GeForce RTX 4070
17091 Points -20%
AMD Radeon RX 7900 XT
AMD Ryzen 9 7950X, AMD Radeon RX 7900 XT
16990 Points -21%
Average NVIDIA GeForce RTX 3080
  (14718 - 15508, n=2)
15113 Points -29%
KFA2 GeForce RTX 4060 Ti EX, 16GB GDDR6
AMD Ryzen 9 7950X, NVIDIA GeForce RTX 4060 Ti 16G
13856 Points -35%
Average NVIDIA GeForce RTX 4060 Ti 8G
  (13563 - 13822, n=3)
13702 Points -36%
Sapphire AMD Radeon RX 6950 XT Nitro+ Pure
AMD Ryzen 9 5900X, AMD Radeon RX 6950 XT
13580 Points -36%
AMD Radeon RX 7800 XT
AMD Ryzen 9 7950X, AMD Radeon RX 7800 XT
13454 Points -37%
Average of class Desktop
  (159 - 33698, n=24, last 2 years)
13343 Points -38%
Sapphire Pulse Radeon RX 7700 XT
AMD Ryzen 9 7950X, AMD Radeon RX 7700 XT
12925 Points -40%
KFA2 GeForce RTX 3070 Ti SG
AMD Ryzen 9 7950X, NVIDIA GeForce RTX 3070 Ti
12517 Points -41%
AMD Radeon RX 6900 XT
AMD Ryzen 9 5950X, AMD Radeon RX 6900 XT
12255 Points -43%
Average NVIDIA GeForce RTX 3070
  (11510 - 11816, n=3)
11665 Points -45%
AMD Radeon RX 6800 XT
AMD Ryzen 9 5950X, AMD Radeon RX 6800 XT
11304 Points -47%
KFA2 GeForce RTX 4060 1-Click-OC 2X
AMD Ryzen 9 7950X, NVIDIA GeForce RTX 4060
9916 Points -54%
Average NVIDIA Titan RTX
  (9418 - 10129, n=3)
9748 Points -54%
XFX Speedster QICK 308 Radeon RX 7600 Black Edition
AMD Ryzen 9 7950X, AMD Radeon RX 7600
8897 Points -58%
ComputeMark v2.1 / Normal, Mandel Scalar
NVIDIA GeForce RTX 4090 Founders Edition
Intel Core i9-13900K, NVIDIA GeForce RTX 4090
21571 Points +71%
AMD Radeon RX 7900 XTX
AMD Ryzen 9 7950X, AMD Radeon RX 7900 XTX
15458 Points +23%
NVIDIA GeForce RTX 4080 Founders Edition
Intel Core i9-13900K, NVIDIA GeForce RTX 4080
14733 Points +17%
AMD Radeon RX 7900 XT
AMD Ryzen 9 7950X, AMD Radeon RX 7900 XT
13989 Points +11%
Asus TUF Gaming GeForce RTX 4070 Ti Super
Intel Core i9-13900K, NVIDIA GeForce RTX 4070 Ti SUPER
12599 Points
Gigabyte Aorus GeForce RTX 4070 Ti Master
Intel Core i9-13900K, NVIDIA GeForce RTX 4070 Ti
12449 Points -1%
Zotac Gaming GeForce RTX 3090 Ti AMP Extreme Holo
AMD Ryzen 7 5800X3D, NVIDIA GeForce RTX 3090 Ti
12406 Points -2%
Asus TUF Gaming GeForce RTX 4070 Ti
Intel Core i9-13900K, NVIDIA GeForce RTX 4070 Ti
12320 Points -2%
Average NVIDIA GeForce RTX 4070 Ti
  (12126 - 12449, n=4)
12302 Points -2%
Sapphire AMD Radeon RX 6950 XT Nitro+ Pure
AMD Ryzen 9 5900X, AMD Radeon RX 6950 XT
11854 Points -6%
Gigabyte GeForce RTX 4070 Super Gaming OC 12G
Intel Core i9-13900K, NVIDIA GeForce RTX 4070 SUPER
11317 Points -10%
AMD Radeon RX 7800 XT
AMD Ryzen 9 7950X, AMD Radeon RX 7800 XT
11209 Points -11%
Average NVIDIA GeForce RTX 3080 Ti
  (11049 - 11318, n=4)
11196 Points -11%
Average NVIDIA GeForce RTX 3090
  (10650 - 11564, n=10)
11162 Points -11%
NVIDIA GeForce RTX 4070 Super Founders Edition
Intel Core i9-13900K, NVIDIA GeForce RTX 4070 SUPER
11149 Points -12%
AMD Radeon RX 6900 XT
AMD Ryzen 9 5950X, AMD Radeon RX 6900 XT
10834 Points -14%
Sapphire Pulse Radeon RX 7700 XT
AMD Ryzen 9 7950X, AMD Radeon RX 7700 XT
10601 Points -16%
AMD Radeon RX 6800 XT
AMD Ryzen 9 5950X, AMD Radeon RX 6800 XT
10018 Points -20%
Average NVIDIA GeForce RTX 3080
  (9554 - 9938, n=2)
9746 Points -23%
Zotac Gaming GeForce RTX 4070 AMP Airo
Intel Core i9-13900K, NVIDIA GeForce RTX 4070
9578 Points -24%
Average of class Desktop
  (75 - 22731, n=24, last 2 years)
8325 Points -34%
KFA2 GeForce RTX 3070 Ti SG
AMD Ryzen 9 7950X, NVIDIA GeForce RTX 3070 Ti
7702 Points -39%
KFA2 GeForce RTX 4060 Ti EX, 16GB GDDR6
AMD Ryzen 9 7950X, NVIDIA GeForce RTX 4060 Ti 16G
7454 Points -41%
Average NVIDIA GeForce RTX 4060 Ti 8G
  (7374 - 7511, n=3)
7431 Points -41%
Average NVIDIA GeForce RTX 3070
  (7042 - 7314, n=3)
7169 Points -43%
XFX Speedster QICK 308 Radeon RX 7600 Black Edition
AMD Ryzen 9 7950X, AMD Radeon RX 7600
6746 Points -46%
Average NVIDIA Titan RTX
  (5977 - 6406, n=3)
6184 Points -51%
KFA2 GeForce RTX 4060 1-Click-OC 2X
AMD Ryzen 9 7950X, NVIDIA GeForce RTX 4060
5153 Points -59%
ComputeMark v2.1 / Normal, Mandel Vector
NVIDIA GeForce RTX 4090 Founders Edition
Intel Core i9-13900K, NVIDIA GeForce RTX 4090
16199 Points +49%
AMD Radeon RX 7900 XTX
AMD Ryzen 9 7950X, AMD Radeon RX 7900 XTX
13737 Points +26%
AMD Radeon RX 7900 XT
AMD Ryzen 9 7950X, AMD Radeon RX 7900 XT
13022 Points +20%
NVIDIA GeForce RTX 4080 Founders Edition
Intel Core i9-13900K, NVIDIA GeForce RTX 4080
11772 Points +8%
Gigabyte Aorus GeForce RTX 4070 Ti Master
Intel Core i9-13900K, NVIDIA GeForce RTX 4070 Ti
10888 Points 0%
Asus TUF Gaming GeForce RTX 4070 Ti Super
Intel Core i9-13900K, NVIDIA GeForce RTX 4070 Ti SUPER
10883 Points
Asus TUF Gaming GeForce RTX 4070 Ti
Intel Core i9-13900K, NVIDIA GeForce RTX 4070 Ti
10771 Points -1%
Average NVIDIA GeForce RTX 4070 Ti
  (10541 - 10888, n=4)
10728 Points -1%
Zotac Gaming GeForce RTX 3090 Ti AMP Extreme Holo
AMD Ryzen 7 5800X3D, NVIDIA GeForce RTX 3090 Ti
10652 Points -2%
AMD Radeon RX 7800 XT
AMD Ryzen 9 7950X, AMD Radeon RX 7800 XT
9963 Points -8%
Gigabyte GeForce RTX 4070 Super Gaming OC 12G
Intel Core i9-13900K, NVIDIA GeForce RTX 4070 SUPER
9748 Points -10%
Average NVIDIA GeForce RTX 3080 Ti
  (9513 - 9860, n=4)
9730 Points -11%
NVIDIA GeForce RTX 4070 Super Founders Edition
Intel Core i9-13900K, NVIDIA GeForce RTX 4070 SUPER
9629 Points -12%
Sapphire Pulse Radeon RX 7700 XT
AMD Ryzen 9 7950X, AMD Radeon RX 7700 XT
9568 Points -12%
Sapphire AMD Radeon RX 6950 XT Nitro+ Pure
AMD Ryzen 9 5900X, AMD Radeon RX 6950 XT
9555 Points -12%
Average NVIDIA GeForce RTX 3090
  (8038 - 10097, n=10)
9467 Points -13%
AMD Radeon RX 6900 XT
AMD Ryzen 9 5950X, AMD Radeon RX 6900 XT
8690 Points -20%
Zotac Gaming GeForce RTX 4070 AMP Airo
Intel Core i9-13900K, NVIDIA GeForce RTX 4070
8421 Points -23%
AMD Radeon RX 6800 XT
AMD Ryzen 9 5950X, AMD Radeon RX 6800 XT
8399 Points -23%
Average NVIDIA GeForce RTX 3080
  (7148 - 7540, n=2)
7344 Points -33%
Average of class Desktop
  (97 - 16942, n=24, last 2 years)
6936 Points -36%
Average NVIDIA GeForce RTX 4060 Ti 8G
  (6815 - 6929, n=3)
6854 Points -37%
KFA2 GeForce RTX 4060 Ti EX, 16GB GDDR6
AMD Ryzen 9 7950X, NVIDIA GeForce RTX 4060 Ti 16G
6852 Points -37%
KFA2 GeForce RTX 3070 Ti SG
AMD Ryzen 9 7950X, NVIDIA GeForce RTX 3070 Ti
6762 Points -38%
XFX Speedster QICK 308 Radeon RX 7600 Black Edition
AMD Ryzen 9 7950X, AMD Radeon RX 7600
5764 Points -47%
Average NVIDIA GeForce RTX 3070
  (5364 - 6266, n=3)
5707 Points -48%
Average NVIDIA Titan RTX
  (4944 - 5440, n=3)
5158 Points -53%
KFA2 GeForce RTX 4060 1-Click-OC 2X
AMD Ryzen 9 7950X, NVIDIA GeForce RTX 4060
4916 Points -55%
ComputeMark v2.1 / Normal, Fluid 2DTexArr
AMD Radeon RX 7900 XTX
AMD Ryzen 9 7950X, AMD Radeon RX 7900 XTX
7315 Points +50%
NVIDIA GeForce RTX 4090 Founders Edition
Intel Core i9-13900K, NVIDIA GeForce RTX 4090
6567 Points +35%
AMD Radeon RX 7900 XT
AMD Ryzen 9 7950X, AMD Radeon RX 7900 XT
6460 Points +32%
NVIDIA GeForce RTX 4080 Founders Edition
Intel Core i9-13900K, NVIDIA GeForce RTX 4080
5523 Points +13%
Zotac Gaming GeForce RTX 3090 Ti AMP Extreme Holo
AMD Ryzen 7 5800X3D, NVIDIA GeForce RTX 3090 Ti
4886 Points 0%
Asus TUF Gaming GeForce RTX 4070 Ti Super
Intel Core i9-13900K, NVIDIA GeForce RTX 4070 Ti SUPER
4876 Points
Average NVIDIA GeForce RTX 3080 Ti
  (4453 - 4546, n=4)
4498 Points -8%
Average NVIDIA GeForce RTX 3090
  (4344 - 4608, n=10)
4492 Points -8%
AMD Radeon RX 7800 XT
AMD Ryzen 9 7950X, AMD Radeon RX 7800 XT
4489 Points -8%
Sapphire AMD Radeon RX 6950 XT Nitro+ Pure
AMD Ryzen 9 5900X, AMD Radeon RX 6950 XT
4455 Points -9%
Average NVIDIA GeForce RTX 3080
  (4087 - 4159, n=2)
4123 Points -15%
AMD Radeon RX 6800 XT
AMD Ryzen 9 5950X, AMD Radeon RX 6800 XT
3947 Points -19%
AMD Radeon RX 6900 XT
AMD Ryzen 9 5950X, AMD Radeon RX 6900 XT
3924 Points -20%
Average NVIDIA Titan RTX
  (3691 - 3828, n=3)
3757 Points -23%
Average NVIDIA GeForce RTX 4070 Ti
  (3566 - 3724, n=4)
3647 Points -25%
Gigabyte GeForce RTX 4070 Super Gaming OC 12G
Intel Core i9-13900K, NVIDIA GeForce RTX 4070 SUPER
3599 Points -26%
NVIDIA GeForce RTX 4070 Super Founders Edition
Intel Core i9-13900K, NVIDIA GeForce RTX 4070 SUPER
3592 Points -26%
Gigabyte Aorus GeForce RTX 4070 Ti Master
Intel Core i9-13900K, NVIDIA GeForce RTX 4070 Ti
3590 Points -26%
Asus TUF Gaming GeForce RTX 4070 Ti
Intel Core i9-13900K, NVIDIA GeForce RTX 4070 Ti
3566 Points -27%
KFA2 GeForce RTX 3070 Ti SG
AMD Ryzen 9 7950X, NVIDIA GeForce RTX 3070 Ti
3457 Points -29%
Zotac Gaming GeForce RTX 4070 AMP Airo
Intel Core i9-13900K, NVIDIA GeForce RTX 4070
3404 Points -30%
Average of class Desktop
  (60 - 6800, n=24, last 2 years)
2929 Points -40%
Average NVIDIA GeForce RTX 3070
  (2666 - 2706, n=3)
2692 Points -45%
Sapphire Pulse Radeon RX 7700 XT
AMD Ryzen 9 7950X, AMD Radeon RX 7700 XT
2666 Points -45%
Average NVIDIA GeForce RTX 4060 Ti 8G
  (2044 - 2060, n=3)
2049 Points -58%
KFA2 GeForce RTX 4060 Ti EX, 16GB GDDR6
AMD Ryzen 9 7950X, NVIDIA GeForce RTX 4060 Ti 16G
2039 Points -58%
KFA2 GeForce RTX 4060 1-Click-OC 2X
AMD Ryzen 9 7950X, NVIDIA GeForce RTX 4060
1912 Points -61%
XFX Speedster QICK 308 Radeon RX 7600 Black Edition
AMD Ryzen 9 7950X, AMD Radeon RX 7600
1878 Points -61%
ComputeMark v2.1 / Normal, Fluid 3DTex
NVIDIA GeForce RTX 4090 Founders Edition
Intel Core i9-13900K, NVIDIA GeForce RTX 4090
10465 Points +112%
AMD Radeon RX 7900 XTX
AMD Ryzen 9 7950X, AMD Radeon RX 7900 XTX
8537 Points +73%
AMD Radeon RX 7900 XT
AMD Ryzen 9 7950X, AMD Radeon RX 7900 XT
7109 Points +44%
NVIDIA GeForce RTX 4080 Founders Edition
Intel Core i9-13900K, NVIDIA GeForce RTX 4080
6385 Points +29%
Zotac Gaming GeForce RTX 3090 Ti AMP Extreme Holo
AMD Ryzen 7 5800X3D, NVIDIA GeForce RTX 3090 Ti
5764 Points +17%
Sapphire AMD Radeon RX 6950 XT Nitro+ Pure
AMD Ryzen 9 5900X, AMD Radeon RX 6950 XT
5515 Points +12%
Average NVIDIA GeForce RTX 3090
  (5246 - 5520, n=10)
5448 Points +10%
Average NVIDIA GeForce RTX 3080 Ti
  (5312 - 5422, n=4)
5368 Points +9%
AMD Radeon RX 6800 XT
AMD Ryzen 9 5950X, AMD Radeon RX 6800 XT
5154 Points +4%
AMD Radeon RX 6900 XT
AMD Ryzen 9 5950X, AMD Radeon RX 6900 XT
5154 Points +4%
Asus TUF Gaming GeForce RTX 4070 Ti Super
Intel Core i9-13900K, NVIDIA GeForce RTX 4070 Ti SUPER
4935 Points
AMD Radeon RX 7800 XT
AMD Ryzen 9 7950X, AMD Radeon RX 7800 XT
4736 Points -4%
Average NVIDIA GeForce RTX 3080
  (4417 - 4450, n=2)
4434 Points -10%
Average NVIDIA Titan RTX
  (3877 - 4027, n=3)
3955 Points -20%
Average NVIDIA GeForce RTX 4070 Ti
  (3683 - 3789, n=4)
3738 Points -24%
Gigabyte Aorus GeForce RTX 4070 Ti Master
Intel Core i9-13900K, NVIDIA GeForce RTX 4070 Ti
3705 Points -25%
NVIDIA GeForce RTX 4070 Super Founders Edition
Intel Core i9-13900K, NVIDIA GeForce RTX 4070 SUPER
3701 Points -25%
Asus TUF Gaming GeForce RTX 4070 Ti
Intel Core i9-13900K, NVIDIA GeForce RTX 4070 Ti
3683 Points -25%
Gigabyte GeForce RTX 4070 Super Gaming OC 12G
Intel Core i9-13900K, NVIDIA GeForce RTX 4070 SUPER
3638 Points -26%
KFA2 GeForce RTX 3070 Ti SG
AMD Ryzen 9 7950X, NVIDIA GeForce RTX 3070 Ti
3569 Points -28%
Average of class Desktop
  (65 - 10749, n=24, last 2 years)
3532 Points -28%
Zotac Gaming GeForce RTX 4070 AMP Airo
Intel Core i9-13900K, NVIDIA GeForce RTX 4070
3438 Points -30%
Average NVIDIA GeForce RTX 3070
  (2749 - 2791, n=3)
2772 Points -44%
Sapphire Pulse Radeon RX 7700 XT
AMD Ryzen 9 7950X, AMD Radeon RX 7700 XT
2603 Points -47%
Average NVIDIA GeForce RTX 4060 Ti 8G
  (2088 - 2090, n=3)
2089 Points -58%
KFA2 GeForce RTX 4060 Ti EX, 16GB GDDR6
AMD Ryzen 9 7950X, NVIDIA GeForce RTX 4060 Ti 16G
2085 Points -58%
KFA2 GeForce RTX 4060 1-Click-OC 2X
AMD Ryzen 9 7950X, NVIDIA GeForce RTX 4060
1943 Points -61%
XFX Speedster QICK 308 Radeon RX 7600 Black Edition
AMD Ryzen 9 7950X, AMD Radeon RX 7600
1835 Points -63%

* ... smaller is better

游戏性能与 RTX 3090 Ti 和 RX 7900 XT 的 QHD 和 4K 超高清性能相当

与合成测试不同,并非所有游戏都能随着着色器数量的增加而扩展。因此,我们看到在累积 QHD 和 4K 游戏性能方面,平均 RTX 4070 Ti 非超级显卡仅提升了 4%。

TheWitcher 3 Shadowofthe Tomb Raider等游戏显示,RTX 4070 Ti Super 的 4K Ultra 性能比 RTX 4070 Ti non-Super 的平均性能最多提升 5%。Borderlands3的脱差扩大到 8%,Final Fantasy XV在 4K Ultra 下的脱差高达 11%。

这使得 RTX 4070 Ti Super 在游戏方面与 RTX 3090 Ti 和 Radeon RX 7900 XT 处于同一水平,尤其是在 QHD 和 4K Ultra 设置下。

与 RTX 4070 Super 一样,Nvidia 继续将 RTX 4070 Ti Super 推向 QHD 游戏玩家。虽然这款显卡肯定会让那些使用高刷新率 QHD 显示器的玩家受益匪浅,但 RTX 4070 Ti Super 可以在 4K 60 或更高的分辨率下舒适地运行大量现代和稍老的 AAA 游戏。

不过,一些纹理特别厚重的游戏,如《赛博朋克 2077 魅影自由》(Cyberpunk 2077 Phantom Liberty,《艾伦-威克 2》(Alan Wake 2,《阿凡达:潘多拉边境》(Avatar: Frontiers of Pandora等,在 4K 超高清下需要一些升频辅助才能获得更流畅的游戏体验。

Performance Rating - Percent
NVIDIA GeForce RTX 4090 Founders Edition
Intel Core i9-13900K, NVIDIA GeForce RTX 4090
100 pt
NVIDIA GeForce RTX 4080 Founders Edition
Intel Core i9-13900K, NVIDIA GeForce RTX 4080
80.8 pt
AMD Radeon RX 7900 XTX
AMD Ryzen 9 7950X, AMD Radeon RX 7900 XTX
78 pt
AMD Radeon RX 7900 XT
AMD Ryzen 9 7950X, AMD Radeon RX 7900 XT
67 pt
Asus TUF Gaming GeForce RTX 4070 Ti Super
Intel Core i9-13900K, NVIDIA GeForce RTX 4070 Ti SUPER
66.5 pt
Zotac Gaming GeForce RTX 3090 Ti AMP Extreme Holo
AMD Ryzen 7 5800X3D, NVIDIA GeForce RTX 3090 Ti
66.4 pt
Gigabyte Aorus GeForce RTX 4070 Ti Master
Intel Core i9-13900K, NVIDIA GeForce RTX 4070 Ti
65.1 pt
Asus TUF Gaming GeForce RTX 4070 Ti
Intel Core i9-13900K, NVIDIA GeForce RTX 4070 Ti
65 pt
Average NVIDIA GeForce RTX 4070 Ti
 
63.8 pt
Average of class Desktop
 
63 pt
Gigabyte GeForce RTX 4070 Super Gaming OC 12G
Intel Core i9-13900K, NVIDIA GeForce RTX 4070 SUPER
59.4 pt
Sapphire AMD Radeon RX 6950 XT Nitro+ Pure
AMD Ryzen 9 5900X, AMD Radeon RX 6950 XT
59.1 pt
Average NVIDIA GeForce RTX 3080 Ti
 
58.9 pt
Average NVIDIA GeForce RTX 3090
 
58.8 pt
NVIDIA GeForce RTX 4070 Super Founders Edition
Intel Core i9-13900K, NVIDIA GeForce RTX 4070 SUPER
57 pt
AMD Radeon RX 7800 XT
AMD Ryzen 9 7950X, AMD Radeon RX 7800 XT
52 pt
Zotac Gaming GeForce RTX 4070 AMP Airo
Intel Core i9-13900K, NVIDIA GeForce RTX 4070
51.4 pt
AMD Radeon RX 6900 XT -2!
AMD Ryzen 9 5950X, AMD Radeon RX 6900 XT
51.3 pt
Average NVIDIA GeForce RTX 3080
 
50 pt
AMD Radeon RX 6800 XT -1!
AMD Ryzen 9 5950X, AMD Radeon RX 6800 XT
47.7 pt
KFA2 GeForce RTX 3070 Ti SG -2!
AMD Ryzen 9 7950X, NVIDIA GeForce RTX 3070 Ti
45 pt
Sapphire Pulse Radeon RX 7700 XT
AMD Ryzen 9 7950X, AMD Radeon RX 7700 XT
42.9 pt
Average NVIDIA Titan RTX
 
42.4 pt
Average NVIDIA GeForce RTX 3070
 
38.3 pt
Average NVIDIA GeForce RTX 4060 Ti 8G
 
37.5 pt
KFA2 GeForce RTX 4060 Ti EX, 16GB GDDR6
AMD Ryzen 9 7950X, NVIDIA GeForce RTX 4060 Ti 16G
36.9 pt
KFA2 GeForce RTX 4060 1-Click-OC 2X
AMD Ryzen 9 7950X, NVIDIA GeForce RTX 4060
29.9 pt
XFX Speedster QICK 308 Radeon RX 7600 Black Edition
AMD Ryzen 9 7950X, AMD Radeon RX 7600
29.7 pt
The Witcher 3 - 3840x2160 Ultra Graphics & Postprocessing (HBAO+)
NVIDIA GeForce RTX 4090 Founders Edition
Intel Core i9-13900K, NVIDIA GeForce RTX 4090
170.7 (154min, 154.59P1) fps +71%
NVIDIA GeForce RTX 4080 Founders Edition
Intel Core i9-13900K, NVIDIA GeForce RTX 4080
128 (113min, 114.12P1) fps +28%
AMD Radeon RX 7900 XTX
AMD Ryzen 9 7950X, AMD Radeon RX 7900 XTX
125.8 (9.5min, 66.1P0.1, 94.8P1) fps +26%
Average of class Desktop
  (55.9 - 178.6, n=20, last 2 years)
114.9 fps +15%
AMD Radeon RX 7900 XT
AMD Ryzen 9 7950X, AMD Radeon RX 7900 XT
109.4 (57.5min, 60.1P0.1, 86.2P1) fps +10%
Zotac Gaming GeForce RTX 3090 Ti AMP Extreme Holo
AMD Ryzen 7 5800X3D, NVIDIA GeForce RTX 3090 Ti
107.5 (97min, 97.56P1) fps +8%
Asus TUF Gaming GeForce RTX 4070 Ti Super
Intel Core i9-13900K, NVIDIA GeForce RTX 4070 Ti SUPER
99.7 (91min, 91.3P1) fps
Asus TUF Gaming GeForce RTX 4070 Ti
Intel Core i9-13900K, NVIDIA GeForce RTX 4070 Ti
98.3 (88min, 88.56P1) fps -1%
Average NVIDIA GeForce RTX 4070 Ti
  (92.4 - 98.3, n=4)
95.2 fps -5%
Average NVIDIA GeForce RTX 3080 Ti
  (93.1 - 96.4, n=4)
94.7 fps -5%
Gigabyte Aorus GeForce RTX 4070 Ti Master
Intel Core i9-13900K, NVIDIA GeForce RTX 4070 Ti
94.4 (86min, 86.46P1) fps -5%
Average NVIDIA GeForce RTX 3090
  (85.4 - 98.5, n=8)
93.4 fps -6%
Sapphire AMD Radeon RX 6950 XT Nitro+ Pure
AMD Ryzen 9 5900X, AMD Radeon RX 6950 XT
92.3 (10.8min, 48.8P0.1, 54.2P1) fps -7%
Gigabyte GeForce RTX 4070 Super Gaming OC 12G
Intel Core i9-13900K, NVIDIA GeForce RTX 4070 SUPER
89.1 (81min, 81.6P1) fps -11%
NVIDIA GeForce RTX 4070 Super Founders Edition
Intel Core i9-13900K, NVIDIA GeForce RTX 4070 SUPER
84.5 (77min, 77P1) fps -15%
Average NVIDIA GeForce RTX 3080
  (78 - 85.7, n=2)
81.9 fps -18%
AMD Radeon RX 7800 XT
AMD Ryzen 9 7950X, AMD Radeon RX 7800 XT
80.4 fps -19%
Zotac Gaming GeForce RTX 4070 AMP Airo
Intel Core i9-13900K, NVIDIA GeForce RTX 4070
77.1 (69min, 69P1) fps -23%
AMD Radeon RX 6900 XT
AMD Ryzen 9 5950X, AMD Radeon RX 6900 XT
76.6 (70min, 70P1) fps -23%
KFA2 GeForce RTX 3070 Ti SG
AMD Ryzen 9 7950X, NVIDIA GeForce RTX 3070 Ti
72.2 (41.4min, 52.7P0.1, 63.4P1) fps -28%
Average NVIDIA Titan RTX
  ()
71.8 fps -28%
Sapphire Pulse Radeon RX 7700 XT
AMD Ryzen 9 7950X, AMD Radeon RX 7700 XT
64.4 (33min, 33.3P0.1, 56.3P1) fps -35%
Average NVIDIA GeForce RTX 3070
  (59 - 60.3, n=2)
59.7 fps -40%
Average NVIDIA GeForce RTX 4060 Ti 8G
  (53.9 - 54.3, n=3)
54.1 fps -46%
KFA2 GeForce RTX 4060 Ti EX, 16GB GDDR6
AMD Ryzen 9 7950X, NVIDIA GeForce RTX 4060 Ti 16G
53.1 fps -47%
XFX Speedster QICK 308 Radeon RX 7600 Black Edition
AMD Ryzen 9 7950X, AMD Radeon RX 7600
43.9 fps -56%
KFA2 GeForce RTX 4060 1-Click-OC 2X
AMD Ryzen 9 7950X, NVIDIA GeForce RTX 4060
43.7 fps -56%
Metro Exodus
3840x2160 Ultra Quality AF:16x
NVIDIA GeForce RTX 4090 Founders Edition
Intel Core i9-13900K, NVIDIA GeForce RTX 4090
135 (72.48min) fps +60%
NVIDIA GeForce RTX 4080 Founders Edition
Intel Core i9-13900K, NVIDIA GeForce RTX 4080
105.7 (67.17min) fps +25%
AMD Radeon RX 7900 XTX
AMD Ryzen 9 7950X, AMD Radeon RX 7900 XTX
103.5 (66.43min) fps +23%
AMD Radeon RX 7900 XT
AMD Ryzen 9 7950X, AMD Radeon RX 7900 XT
86.9 (56.86min) fps +3%
Gigabyte Aorus GeForce RTX 4070 Ti Master
Intel Core i9-13900K, NVIDIA GeForce RTX 4070 Ti
85 (54.63min) fps +1%
Asus TUF Gaming GeForce RTX 4070 Ti
Intel Core i9-13900K, NVIDIA GeForce RTX 4070 Ti
84.5 (55.02min) fps 0%
Asus TUF Gaming GeForce RTX 4070 Ti Super
Intel Core i9-13900K, NVIDIA GeForce RTX 4070 Ti SUPER
84.4 (52.73min) fps
Zotac Gaming GeForce RTX 3090 Ti AMP Extreme Holo
AMD Ryzen 7 5800X3D, NVIDIA GeForce RTX 3090 Ti
84.3 (52.3min) fps 0%
Average of class Desktop
  (8.47 - 138.5, n=23, last 2 years)
83.6 fps -1%
Average NVIDIA GeForce RTX 4070 Ti
  (81.2 - 85, n=4)
83.4 fps -1%
Gigabyte GeForce RTX 4070 Super Gaming OC 12G
Intel Core i9-13900K, NVIDIA GeForce RTX 4070 SUPER
76.1 (49.56min) fps -10%
Average NVIDIA GeForce RTX 3080 Ti
  (74.2 - 77.1, n=4)
75.7 fps -10%
Sapphire AMD Radeon RX 6950 XT Nitro+ Pure
AMD Ryzen 9 5900X, AMD Radeon RX 6950 XT
75 (50.07min) fps -11%
Average NVIDIA GeForce RTX 3090
  (70.6 - 77.3, n=12)
75 fps -11%
NVIDIA GeForce RTX 4070 Super Founders Edition
Intel Core i9-13900K, NVIDIA GeForce RTX 4070 SUPER
72.8 (46.78min) fps -14%
AMD Radeon RX 6900 XT
AMD Ryzen 9 5950X, AMD Radeon RX 6900 XT
66.7 (42.71min) fps -21%
AMD Radeon RX 7800 XT
AMD Ryzen 9 7950X, AMD Radeon RX 7800 XT
66.7 (43.89min) fps -21%
Zotac Gaming GeForce RTX 4070 AMP Airo
Intel Core i9-13900K, NVIDIA GeForce RTX 4070
65 (41.89min) fps -23%
Average NVIDIA GeForce RTX 3080
  (64.1 - 65.9, n=2)
65 fps -23%
Sapphire Pulse Radeon RX 7700 XT
AMD Ryzen 9 7950X, AMD Radeon RX 7700 XT
57 (38.42min) fps -32%
AMD Radeon RX 6800 XT
AMD Ryzen 9 5950X, AMD Radeon RX 6800 XT
56.3 (40.14min) fps -33%
KFA2 GeForce RTX 3070 Ti SG
AMD Ryzen 9 7950X, NVIDIA GeForce RTX 3070 Ti
55.9 (35.4min) fps -34%
Average NVIDIA Titan RTX
  (51.3 - 57.9, n=27)
54.9 fps -35%
Average NVIDIA GeForce RTX 3070
  (48.3 - 49.7, n=5)
48.9 fps -42%
Average NVIDIA GeForce RTX 4060 Ti 8G
  (48.4 - 49.3, n=3)
48.8 fps -42%
KFA2 GeForce RTX 4060 Ti EX, 16GB GDDR6
AMD Ryzen 9 7950X, NVIDIA GeForce RTX 4060 Ti 16G
48.1 (32min) fps -43%
KFA2 GeForce RTX 4060 1-Click-OC 2X
AMD Ryzen 9 7950X, NVIDIA GeForce RTX 4060
38.3 (25.16min) fps -55%
XFX Speedster QICK 308 Radeon RX 7600 Black Edition
AMD Ryzen 9 7950X, AMD Radeon RX 7600
38.1 (25.45min) fps -55%
2560x1440 Ultra Quality AF:16x
NVIDIA GeForce RTX 4090 Founders Edition
Intel Core i9-13900K, NVIDIA GeForce RTX 4090
176 (81.25min) fps +34%
NVIDIA GeForce RTX 4080 Founders Edition
Intel Core i9-13900K, NVIDIA GeForce RTX 4080
155.1 (77.58min) fps +18%
AMD Radeon RX 7900 XTX
AMD Ryzen 9 7950X, AMD Radeon RX 7900 XTX
154.5 (90.83min) fps +18%
AMD Radeon RX 7900 XT
AMD Ryzen 9 7950X, AMD Radeon RX 7900 XT
135 (79.57min) fps +3%
Gigabyte Aorus GeForce RTX 4070 Ti Master
Intel Core i9-13900K, NVIDIA GeForce RTX 4070 Ti
132.3 (73.1min) fps +1%
Asus TUF Gaming GeForce RTX 4070 Ti
Intel Core i9-13900K, NVIDIA GeForce RTX 4070 Ti
132.1 (72.92min) fps +1%
Asus TUF Gaming GeForce RTX 4070 Ti Super
Intel Core i9-13900K, NVIDIA GeForce RTX 4070 Ti SUPER
130.9 (70.75min) fps
Average NVIDIA GeForce RTX 4070 Ti
  (126.7 - 132.3, n=4)
130 fps -1%
Zotac Gaming GeForce RTX 3090 Ti AMP Extreme Holo
AMD Ryzen 7 5800X3D, NVIDIA GeForce RTX 3090 Ti
125.3 (64.48min) fps -4%
Gigabyte GeForce RTX 4070 Super Gaming OC 12G
Intel Core i9-13900K, NVIDIA GeForce RTX 4070 SUPER
120.8 (68.31min) fps -8%
Average of class Desktop
  (14.8 - 181.3, n=23, last 2 years)
120.8 fps -8%
NVIDIA GeForce RTX 4070 Super Founders Edition
Intel Core i9-13900K, NVIDIA GeForce RTX 4070 SUPER
116.1 (66.05min) fps -11%
Sapphire AMD Radeon RX 6950 XT Nitro+ Pure
AMD Ryzen 9 5900X, AMD Radeon RX 6950 XT
115.5 (70.52min) fps -12%
Average NVIDIA GeForce RTX 3080 Ti
  (110 - 118, n=4)
114 fps -13%
Average NVIDIA GeForce RTX 3090
  (102 - 118.2, n=12)
113.2 fps -14%
Zotac Gaming GeForce RTX 4070 AMP Airo
Intel Core i9-13900K, NVIDIA GeForce RTX 4070
103.8 (60.52min) fps -21%
AMD Radeon RX 7800 XT
AMD Ryzen 9 7950X, AMD Radeon RX 7800 XT
102.6 (62.24min) fps -22%
AMD Radeon RX 6900 XT
AMD Ryzen 9 5950X, AMD Radeon RX 6900 XT
102 (59.52min) fps -22%
Average NVIDIA GeForce RTX 3080
  (92.2 - 97.4, n=2)
94.8 fps -28%
AMD Radeon RX 6800 XT
AMD Ryzen 9 5950X, AMD Radeon RX 6800 XT
94.6 (55.44min) fps -28%
Sapphire Pulse Radeon RX 7700 XT
AMD Ryzen 9 7950X, AMD Radeon RX 7700 XT
89.6 (55.65min) fps -32%
KFA2 GeForce RTX 3070 Ti SG
AMD Ryzen 9 7950X, NVIDIA GeForce RTX 3070 Ti
87.9 (48.28min) fps -33%
Average NVIDIA Titan RTX
  (69 - 92.9, n=26)
84 fps -36%
Average NVIDIA GeForce RTX 4060 Ti 8G
  (78.9 - 80.1, n=3)
79.4 fps -39%
KFA2 GeForce RTX 4060 Ti EX, 16GB GDDR6
AMD Ryzen 9 7950X, NVIDIA GeForce RTX 4060 Ti 16G
78.6 (46.09min) fps -40%
Average NVIDIA GeForce RTX 3070
  (74.4 - 78.3, n=5)
75.8 fps -42%
XFX Speedster QICK 308 Radeon RX 7600 Black Edition
AMD Ryzen 9 7950X, AMD Radeon RX 7600
64.9 (40.24min) fps -50%
KFA2 GeForce RTX 4060 1-Click-OC 2X
AMD Ryzen 9 7950X, NVIDIA GeForce RTX 4060
62.9 (36.84min) fps -52%
Control
3840x2160 High Quality Preset (DX11)
NVIDIA GeForce RTX 4090 Founders Edition
Intel Core i9-13900K, NVIDIA GeForce RTX 4090
107.7 (83.4min, 85.3P0.1, 91.1P1) fps +62%
AMD Radeon RX 7900 XTX
AMD Ryzen 9 7950X, AMD Radeon RX 7900 XTX
89.4 (46.8min, 48.3P0.1, 52.1P1) fps +35%
NVIDIA GeForce RTX 4080 Founders Edition
Intel Core i9-13900K, NVIDIA GeForce RTX 4080
82.6 (15.4min, 68.7P0.1, 71.9P1) fps +24%
AMD Radeon RX 7900 XT
AMD Ryzen 9 7950X, AMD Radeon RX 7900 XT
75.8 (40.1min, 41.7P0.1, 43.6P1) fps +14%
Zotac Gaming GeForce RTX 3090 Ti AMP Extreme Holo
AMD Ryzen 7 5800X3D, NVIDIA GeForce RTX 3090 Ti
73.9 (46.2min, 53.2P0.1, 62.6P1) fps +11%
Average of class Desktop
  (30.3 - 114.4, n=15, last 2 years)
66.5 fps 0%
Asus TUF Gaming GeForce RTX 4070 Ti Super
Intel Core i9-13900K, NVIDIA GeForce RTX 4070 Ti SUPER
66.4 (21.2min, 44.4P0.1, 55.9P1) fps
Average NVIDIA GeForce RTX 4070 Ti
  (63.8 - 66.2, n=4)
65 fps -2%
Asus TUF Gaming GeForce RTX 4070 Ti
Intel Core i9-13900K, NVIDIA GeForce RTX 4070 Ti
64.9 (50min, 51.9P0.1, 56.5P1) fps -2%
Gigabyte Aorus GeForce RTX 4070 Ti Master
Intel Core i9-13900K, NVIDIA GeForce RTX 4070 Ti
64.9 (26.4min, 32.6P0.1, 55.9P1) fps -2%
Sapphire AMD Radeon RX 6950 XT Nitro+ Pure
AMD Ryzen 9 5900X, AMD Radeon RX 6950 XT
64.8 (33.1min, 33.6P0.1, 36.3P1) fps -2%
Average NVIDIA GeForce RTX 3080 Ti
  (63.9 - 64.9, n=3)
64.3 fps -3%
Average NVIDIA GeForce RTX 3090
  (61.3 - 66, n=5)
62.9 fps -5%
AMD Radeon RX 7800 XT
AMD Ryzen 9 7950X, AMD Radeon RX 7800 XT
58.2 (30.4min, 30.9P0.1, 32.7P1) fps -12%
Gigabyte GeForce RTX 4070 Super Gaming OC 12G
Intel Core i9-13900K, NVIDIA GeForce RTX 4070 SUPER
58.2 (43.4min, 48.2P0.1, 50.4P1) fps -12%
NVIDIA GeForce RTX 4070 Super Founders Edition
Intel Core i9-13900K, NVIDIA GeForce RTX 4070 SUPER
57.4 (47.8min, 47.9P0.1, 50.2P1) fps -14%
Average NVIDIA GeForce RTX 3080
  (56.2 - 56.7, n=2)
56.5 fps -15%
AMD Radeon RX 6900 XT
AMD Ryzen 9 5950X, AMD Radeon RX 6900 XT
54.7 (39.8min, 41.7P0.1, 44.9P1) fps -18%
AMD Radeon RX 6900 XT
AMD Ryzen 9 5950X, AMD Radeon RX 6900 XT (SAM ENABLED)
53.9 (36.6min, 41.7P0.1, 43.5P1) fps -19%
AMD Radeon RX 6800 XT
AMD Ryzen 9 5950X, AMD Radeon RX 6800 XT
51.6 (46min) fps -22%
Zotac Gaming GeForce RTX 4070 AMP Airo
Intel Core i9-13900K, NVIDIA GeForce RTX 4070
50.2 (29.1min, 30P0.1, 37.6P1) fps -24%
Average NVIDIA Titan RTX
  (45.2 - 47.3, n=3)
46.5 fps -30%
Sapphire Pulse Radeon RX 7700 XT
AMD Ryzen 9 7950X, AMD Radeon RX 7700 XT
46.4 (24.9min, 25.5P0.1, 26.2P1) fps -30%
Average NVIDIA GeForce RTX 3070
  (40.6 - 42.3, n=3)
41.3 fps -38%
KFA2 GeForce RTX 4060 Ti EX, 16GB GDDR6
AMD Ryzen 9 7950X, NVIDIA GeForce RTX 4060 Ti 16G
36 (19.1min, 24.7P0.1, 31.1P1) fps -46%
Average NVIDIA GeForce RTX 4060 Ti 8G
  (34.3 - 37.3, n=3)
35.7 fps -46%
XFX Speedster QICK 308 Radeon RX 7600 Black Edition
AMD Ryzen 9 7950X, AMD Radeon RX 7600
31.3 (17.1min, 17.1P0.1, 17.6P1) fps -53%
KFA2 GeForce RTX 4060 1-Click-OC 2X
AMD Ryzen 9 7950X, NVIDIA GeForce RTX 4060
28.4 (20.2min, 21.3P0.1, 24.9P1) fps -57%
2560x1440 High Quality Preset (DX11)
NVIDIA GeForce RTX 4090 Founders Edition
Intel Core i9-13900K, NVIDIA GeForce RTX 4090
201 (84.1min, 146.6P0.1, 159P1) fps +54%
AMD Radeon RX 7900 XTX
AMD Ryzen 9 7950X, AMD Radeon RX 7900 XTX
184.9 (66.6min, 105.1P0.1, 121.7P1) fps +42%
NVIDIA GeForce RTX 4080 Founders Edition
Intel Core i9-13900K, NVIDIA GeForce RTX 4080
164.2 (59.2min, 121.2P0.1, 135.5P1) fps +26%
AMD Radeon RX 7900 XT
AMD Ryzen 9 7950X, AMD Radeon RX 7900 XT
156.4 (53.3min, 89.4P0.1, 95.9P1) fps +20%
Zotac Gaming GeForce RTX 3090 Ti AMP Extreme Holo
AMD Ryzen 7 5800X3D, NVIDIA GeForce RTX 3090 Ti
142.5 (51.8min, 81.9P0.1, 115.5P1) fps +9%
Sapphire AMD Radeon RX 6950 XT Nitro+ Pure
AMD Ryzen 9 5900X, AMD Radeon RX 6950 XT
133.5 (73.5min, 75.3P0.1, 83.4P1) fps +2%
Asus TUF Gaming GeForce RTX 4070 Ti
Intel Core i9-13900K, NVIDIA GeForce RTX 4070 Ti
130.6 (59min, 74P0.1, 107.3P1) fps 0%
Gigabyte Aorus GeForce RTX 4070 Ti Master
Intel Core i9-13900K, NVIDIA GeForce RTX 4070 Ti
130.6 (24.9min, 47.8P0.1, 108.8P1) fps 0%
Asus TUF Gaming GeForce RTX 4070 Ti Super
Intel Core i9-13900K, NVIDIA GeForce RTX 4070 Ti SUPER
130.3 (60.1min, 82.7P0.1, 108P1) fps
Average of class Desktop
  (60.9 - 232, n=15, last 2 years)
129.4 fps -1%
Average NVIDIA GeForce RTX 3080 Ti
  (122 - 125.5, n=3)
123.8 fps -5%
Average NVIDIA GeForce RTX 4070 Ti
  (100 - 130.6, n=4)
121.9 fps -6%
Average NVIDIA GeForce RTX 3090
  (115.8 - 123.7, n=5)
120.4 fps -8%
AMD Radeon RX 7800 XT
AMD Ryzen 9 7950X, AMD Radeon RX 7800 XT
120.3 (60.2min, 62.9P0.1, 68.1P1) fps -8%
Gigabyte GeForce RTX 4070 Super Gaming OC 12G
Intel Core i9-13900K, NVIDIA GeForce RTX 4070 SUPER
115.5 (64.7min, 91.1P0.1, 96.7P1) fps -11%
AMD Radeon RX 6900 XT
AMD Ryzen 9 5950X, AMD Radeon RX 6900 XT
113 (71.5min, 73.2P0.1, 79.6P1) fps -13%
AMD Radeon RX 6900 XT
AMD Ryzen 9 5950X, AMD Radeon RX 6900 XT (SAM ENABLED)
113 (68min, 71.3P0.1, 81.1P1) fps -13%
NVIDIA GeForce RTX 4070 Super Founders Edition
Intel Core i9-13900K, NVIDIA GeForce RTX 4070 SUPER
112.6 (83.1min, 89.4P0.1, 94.5P1) fps -14%
AMD Radeon RX 6800 XT
AMD Ryzen 9 5950X, AMD Radeon RX 6800 XT
108 (93min) fps -17%
Average NVIDIA GeForce RTX 3080
  (105 - 106, n=2)
105.5 fps -19%
Zotac Gaming GeForce RTX 4070 AMP Airo
Intel Core i9-13900K, NVIDIA GeForce RTX 4070
101.8 (15.7min, 26.9P0.1, 84P1) fps -22%
Sapphire Pulse Radeon RX 7700 XT
AMD Ryzen 9 7950X, AMD Radeon RX 7700 XT
96.1 (51.5min, 52P0.1, 55P1) fps -26%
Average NVIDIA Titan RTX
  (89 - 93.6, n=3)
91.5 fps -30%
Average NVIDIA GeForce RTX 3070
  (79.8 - 82.5, n=3)
81.2 fps -38%
Average NVIDIA GeForce RTX 4060 Ti 8G
  (69.2 - 75.3, n=3)
73.2 fps -44%
KFA2 GeForce RTX 4060 Ti EX, 16GB GDDR6
AMD Ryzen 9 7950X, NVIDIA GeForce RTX 4060 Ti 16G
73.1 (43.1min, 53.6P0.1, 62.7P1) fps -44%
XFX Speedster QICK 308 Radeon RX 7600 Black Edition
AMD Ryzen 9 7950X, AMD Radeon RX 7600
63.6 (33.4min, 34.3P0.1, 36.6P1) fps -51%
KFA2 GeForce RTX 4060 1-Click-OC 2X
AMD Ryzen 9 7950X, NVIDIA GeForce RTX 4060
58.4 (38.3min, 43.3P0.1, 50.2P1) fps -55%
Borderlands 3
3840x2160 Badass Overall Quality (DX11)
NVIDIA GeForce RTX 4090 Founders Edition
Intel Core i9-13900K, NVIDIA GeForce RTX 4090
133.4 fps +68%
NVIDIA GeForce RTX 4080 Founders Edition
Intel Core i9-13900K, NVIDIA GeForce RTX 4080
95.7 fps +21%
AMD Radeon RX 7900 XTX
AMD Ryzen 9 7950X, AMD Radeon RX 7900 XTX
88.4 fps +11%
Zotac Gaming GeForce RTX 3090 Ti AMP Extreme Holo
AMD Ryzen 7 5800X3D, NVIDIA GeForce RTX 3090 Ti
83.8 fps +6%
Asus TUF Gaming GeForce RTX 4070 Ti Super
Intel Core i9-13900K, NVIDIA GeForce RTX 4070 Ti SUPER
79.4 fps
Gigabyte Aorus GeForce RTX 4070 Ti Master
Intel Core i9-13900K, NVIDIA GeForce RTX 4070 Ti
74.9 fps -6%
AMD Radeon RX 7900 XT
AMD Ryzen 9 7950X, AMD Radeon RX 7900 XT
74.6 fps -6%
Average of class Desktop
  (5.54 - 133.4, n=22, last 2 years)
74.4 fps -6%
Asus TUF Gaming GeForce RTX 4070 Ti
Intel Core i9-13900K, NVIDIA GeForce RTX 4070 Ti
74.1 fps -7%
Average NVIDIA GeForce RTX 4070 Ti
  (71.9 - 74.9, n=4)
73.4 fps -8%
Average NVIDIA GeForce RTX 3090
  (68 - 75.3, n=13)
72.8 fps -8%
Average NVIDIA GeForce RTX 3080 Ti
  (71.2 - 74, n=4)
72.8 fps -8%
Gigabyte GeForce RTX 4070 Super Gaming OC 12G
Intel Core i9-13900K, NVIDIA GeForce RTX 4070 SUPER
68.9 fps -13%
NVIDIA GeForce RTX 4070 Super Founders Edition
Intel Core i9-13900K, NVIDIA GeForce RTX 4070 SUPER
66.2 fps -17%
Average NVIDIA GeForce RTX 3080
  (61.5 - 61.9, n=2)
61.7 fps -22%
Sapphire AMD Radeon RX 6950 XT Nitro+ Pure
AMD Ryzen 9 5900X, AMD Radeon RX 6950 XT
59.9 fps -25%
AMD Radeon RX 6900 XT
AMD Ryzen 9 5950X, AMD Radeon RX 6900 XT (SAM ENABLED)
59.8 fps -25%
AMD Radeon RX 6900 XT
AMD Ryzen 9 5950X, AMD Radeon RX 6900 XT
57.1 fps -28%
Zotac Gaming GeForce RTX 4070 AMP Airo
Intel Core i9-13900K, NVIDIA GeForce RTX 4070
58.8 fps -26%
AMD Radeon RX 7800 XT
AMD Ryzen 9 7950X, AMD Radeon RX 7800 XT
57.9 fps -27%
AMD Radeon RX 6800 XT
AMD Ryzen 9 5950X, AMD Radeon RX 6800 XT
53.6 fps -32%
KFA2 GeForce RTX 3070 Ti SG
AMD Ryzen 9 7950X, NVIDIA GeForce RTX 3070 Ti
53 fps -33%
Sapphire Pulse Radeon RX 7700 XT
AMD Ryzen 9 7950X, AMD Radeon RX 7700 XT
48 fps -40%
Average NVIDIA Titan RTX
  (46 - 52.8, n=29)
47.3 fps -40%
Average NVIDIA GeForce RTX 3070
  (42.7 - 46.3, n=5)
44.3 fps -44%
Average NVIDIA GeForce RTX 4060 Ti 8G
  (43.1 - 43.7, n=3)
43.5 fps -45%
KFA2 GeForce RTX 4060 Ti EX, 16GB GDDR6
AMD Ryzen 9 7950X, NVIDIA GeForce RTX 4060 Ti 16G
42.5 fps -46%
XFX Speedster QICK 308 Radeon RX 7600 Black Edition
AMD Ryzen 9 7950X, AMD Radeon RX 7600
34.5 fps -57%
KFA2 GeForce RTX 4060 1-Click-OC 2X
AMD Ryzen 9 7950X, NVIDIA GeForce RTX 4060
33.8 fps -57%
2560x1440 Badass Overall Quality (DX11)
NVIDIA GeForce RTX 4090 Founders Edition
Intel Core i9-13900K, NVIDIA GeForce RTX 4090
190 fps +32%
NVIDIA GeForce RTX 4080 Founders Edition
Intel Core i9-13900K, NVIDIA GeForce RTX 4080
170.5 fps +19%
AMD Radeon RX 7900 XTX
AMD Ryzen 9 7950X, AMD Radeon RX 7900 XTX
152.2 fps +6%
Asus TUF Gaming GeForce RTX 4070 Ti Super
Intel Core i9-13900K, NVIDIA GeForce RTX 4070 Ti SUPER
143.6 fps
Zotac Gaming GeForce RTX 3090 Ti AMP Extreme Holo
AMD Ryzen 7 5800X3D, NVIDIA GeForce RTX 3090 Ti
143.1 fps 0%
Gigabyte Aorus GeForce RTX 4070 Ti Master
Intel Core i9-13900K, NVIDIA GeForce RTX 4070 Ti
142 fps -1%
Asus TUF Gaming GeForce RTX 4070 Ti
Intel Core i9-13900K, NVIDIA GeForce RTX 4070 Ti
140.6 fps -2%
Average NVIDIA GeForce RTX 4070 Ti
  (134.3 - 142, n=4)
138.3 fps -4%
AMD Radeon RX 7900 XT
AMD Ryzen 9 7950X, AMD Radeon RX 7900 XT
135.2 fps -6%
Gigabyte GeForce RTX 4070 Super Gaming OC 12G
Intel Core i9-13900K, NVIDIA GeForce RTX 4070 SUPER
131.2 fps -9%
NVIDIA GeForce RTX 4070 Super Founders Edition
Intel Core i9-13900K, NVIDIA GeForce RTX 4070 SUPER
125.4 fps -13%
Average NVIDIA GeForce RTX 3080 Ti
  (114 - 130.2, n=4)
124.5 fps -13%
Average NVIDIA GeForce RTX 3090
  (105 - 131.6, n=13)
123.8 fps -14%
Average of class Desktop
  (13.4 - 190, n=23, last 2 years)
120.8 fps -16%
Zotac Gaming GeForce RTX 4070 AMP Airo
Intel Core i9-13900K, NVIDIA GeForce RTX 4070
110.8 fps -23%
Sapphire AMD Radeon RX 6950 XT Nitro+ Pure
AMD Ryzen 9 5900X, AMD Radeon RX 6950 XT
110 fps -23%
AMD Radeon RX 6900 XT
AMD Ryzen 9 5950X, AMD Radeon RX 6900 XT (SAM ENABLED)
107 fps -25%
AMD Radeon RX 6900 XT
AMD Ryzen 9 5950X, AMD Radeon RX 6900 XT
105 fps -27%
AMD Radeon RX 7800 XT
AMD Ryzen 9 7950X, AMD Radeon RX 7800 XT
105.5 fps -27%
Average NVIDIA GeForce RTX 3080
  (95.7 - 103, n=2)
99.4 fps -31%
KFA2 GeForce RTX 3070 Ti SG
AMD Ryzen 9 7950X, NVIDIA GeForce RTX 3070 Ti
95.9 fps -33%
AMD Radeon RX 6800 XT
AMD Ryzen 9 5950X, AMD Radeon RX 6800 XT
93.6 fps -35%
Sapphire Pulse Radeon RX 7700 XT
AMD Ryzen 9 7950X, AMD Radeon RX 7700 XT
89.4 fps -38%
Average NVIDIA Titan RTX
  (74 - 93.1, n=29)
84.7 fps -41%
Average NVIDIA GeForce RTX 4060 Ti 8G
  (83.9 - 85.2, n=3)
84.4 fps -41%
KFA2 GeForce RTX 4060 Ti EX, 16GB GDDR6
AMD Ryzen 9 7950X, NVIDIA GeForce RTX 4060 Ti 16G
81.7 fps -43%
Average NVIDIA GeForce RTX 3070
  (75.1 - 82.9, n=5)
77.7 fps -46%
XFX Speedster QICK 308 Radeon RX 7600 Black Edition
AMD Ryzen 9 7950X, AMD Radeon RX 7600
65.7 fps -54%
KFA2 GeForce RTX 4060 1-Click-OC 2X
AMD Ryzen 9 7950X, NVIDIA GeForce RTX 4060
64.8 fps -55%
Shadow of the Tomb Raider
3840x2160 Highest Preset AA:T
NVIDIA GeForce RTX 4090 Founders Edition
Intel Core i9-13900K, NVIDIA GeForce RTX 4090
182 fps +66%
NVIDIA GeForce RTX 4080 Founders Edition
Intel Core i9-13900K, NVIDIA GeForce RTX 4080
134 fps +22%
AMD Radeon RX 7900 XTX
AMD Ryzen 9 7950X, AMD Radeon RX 7900 XTX
130.1 fps +19%
AMD Radeon RX 7900 XT
AMD Ryzen 9 7950X, AMD Radeon RX 7900 XT
109.6 fps 0%
Asus TUF Gaming GeForce RTX 4070 Ti Super
Intel Core i9-13900K, NVIDIA GeForce RTX 4070 Ti SUPER
109.5 fps
Zotac Gaming GeForce RTX 3090 Ti AMP Extreme Holo
AMD Ryzen 7 5800X3D, NVIDIA GeForce RTX 3090 Ti
106 fps -3%
Gigabyte Aorus GeForce RTX 4070 Ti Master
Intel Core i9-13900K, NVIDIA GeForce RTX 4070 Ti
104.9 fps -4%
Asus TUF Gaming GeForce RTX 4070 Ti
Intel Core i9-13900K, NVIDIA GeForce RTX 4070 Ti
104.4 fps -5%
Average NVIDIA GeForce RTX 4070 Ti
  (102.7 - 104.9, n=4)
103.8 fps -5%
Average of class Desktop
  (33 - 186, n=20, last 2 years)
103.4 fps -6%
Sapphire AMD Radeon RX 6950 XT Nitro+ Pure
AMD Ryzen 9 5900X, AMD Radeon RX 6950 XT
97.4 fps -11%
Gigabyte GeForce RTX 4070 Super Gaming OC 12G
Intel Core i9-13900K, NVIDIA GeForce RTX 4070 SUPER
96.7 fps -12%
Average NVIDIA GeForce RTX 3090
  (89.3 - 99.7, n=12)
96.4 fps -12%
Average NVIDIA GeForce RTX 3080 Ti
  (93 - 98.6, n=3)
95.1 fps -13%
NVIDIA GeForce RTX 4070 Super Founders Edition
Intel Core i9-13900K, NVIDIA GeForce RTX 4070 SUPER
91.5 fps -16%
AMD Radeon RX 6900 XT
AMD Ryzen 9 5950X, AMD Radeon RX 6900 XT (SAM ENABLED)
86 fps -21%
AMD Radeon RX 6900 XT
AMD Ryzen 9 5950X, AMD Radeon RX 6900 XT
84 fps -23%
Average NVIDIA GeForce RTX 3080
  (83.9 - 87.9, n=2)
85.9 fps -22%
Zotac Gaming GeForce RTX 4070 AMP Airo
Intel Core i9-13900K, NVIDIA GeForce RTX 4070
83.7 fps -24%
AMD Radeon RX 7800 XT
AMD Ryzen 9 7950X, AMD Radeon RX 7800 XT
82.7 fps -24%
AMD Radeon RX 6800 XT
AMD Ryzen 9 5950X, AMD Radeon RX 6800 XT
79.6 fps -27%
KFA2 GeForce RTX 3070 Ti SG
AMD Ryzen 9 7950X, NVIDIA GeForce RTX 3070 Ti
72.8 fps -34%
Average NVIDIA Titan RTX
  (59 - 71.1, n=24)
66.9 fps -39%
Sapphire Pulse Radeon RX 7700 XT
AMD Ryzen 9 7950X, AMD Radeon RX 7700 XT
65.5 fps -40%
Average NVIDIA GeForce RTX 3070
  (61 - 63.5, n=4)
62.3 fps -43%
KFA2 GeForce RTX 4060 Ti EX, 16GB GDDR6
AMD Ryzen 9 7950X, NVIDIA GeForce RTX 4060 Ti 16G
58.5 fps -47%
Average NVIDIA GeForce RTX 4060 Ti 8G
  (58.1 - 58.7, n=3)
58.5 fps -47%
KFA2 GeForce RTX 4060 1-Click-OC 2X
AMD Ryzen 9 7950X, NVIDIA GeForce RTX 4060
46.4 fps -58%
XFX Speedster QICK 308 Radeon RX 7600 Black Edition
AMD Ryzen 9 7950X, AMD Radeon RX 7600
41.6 fps -62%
2560x1440 Highest Preset AA:T
NVIDIA GeForce RTX 4090 Founders Edition
Intel Core i9-13900K, NVIDIA GeForce RTX 4090
282 fps +38%
NVIDIA GeForce RTX 4080 Founders Edition
Intel Core i9-13900K, NVIDIA GeForce RTX 4080
248 fps +21%
AMD Radeon RX 7900 XTX
AMD Ryzen 9 7950X, AMD Radeon RX 7900 XTX
230 fps +12%
Asus TUF Gaming GeForce RTX 4070 Ti Super
Intel Core i9-13900K, NVIDIA GeForce RTX 4070 Ti SUPER
205 fps
Gigabyte Aorus GeForce RTX 4070 Ti Master
Intel Core i9-13900K, NVIDIA GeForce RTX 4070 Ti
204 fps 0%
AMD Radeon RX 7900 XT
AMD Ryzen 9 7950X, AMD Radeon RX 7900 XT
203 fps -1%
Asus TUF Gaming GeForce RTX 4070 Ti
Intel Core i9-13900K, NVIDIA GeForce RTX 4070 Ti
202 fps -1%
Average NVIDIA GeForce RTX 4070 Ti
  (195.9 - 204, n=4)
199.9 fps -2%
Gigabyte GeForce RTX 4070 Super Gaming OC 12G
Intel Core i9-13900K, NVIDIA GeForce RTX 4070 SUPER
188 fps -8%
Zotac Gaming GeForce RTX 3090 Ti AMP Extreme Holo
AMD Ryzen 7 5800X3D, NVIDIA GeForce RTX 3090 Ti
184 fps -10%
Sapphire AMD Radeon RX 6950 XT Nitro+ Pure
AMD Ryzen 9 5900X, AMD Radeon RX 6950 XT
184 fps -10%
Average of class Desktop
  (61 - 282, n=21, last 2 years)
173.6 fps -15%
Average NVIDIA GeForce RTX 3090
  (137 - 172.3, n=12)
165.6 fps -19%
NVIDIA GeForce RTX 4070 Super Founders Edition
Intel Core i9-13900K, NVIDIA GeForce RTX 4070 SUPER
165.3 fps -19%
Average NVIDIA GeForce RTX 3080 Ti
  (157 - 173.3, n=3)
164.8 fps -20%
AMD Radeon RX 6900 XT
AMD Ryzen 9 5950X, AMD Radeon RX 6900 XT (SAM ENABLED)
163 fps -20%
AMD Radeon RX 6900 XT
AMD Ryzen 9 5950X, AMD Radeon RX 6900 XT
155 fps -24%
Zotac Gaming GeForce RTX 4070 AMP Airo
Intel Core i9-13900K, NVIDIA GeForce RTX 4070
162.6 fps -21%
AMD Radeon RX 7800 XT
AMD Ryzen 9 7950X, AMD Radeon RX 7800 XT
158.1 fps -23%
Average NVIDIA GeForce RTX 3080
  (147 - 152, n=2)
149.5 fps -27%
AMD Radeon RX 6800 XT
AMD Ryzen 9 5950X, AMD Radeon RX 6800 XT
148 fps -28%
KFA2 GeForce RTX 3070 Ti SG
AMD Ryzen 9 7950X, NVIDIA GeForce RTX 3070 Ti
132.5 fps -35%
Sapphire Pulse Radeon RX 7700 XT
AMD Ryzen 9 7950X, AMD Radeon RX 7700 XT
131.9 fps -36%
Average NVIDIA GeForce RTX 4060 Ti 8G
  (119.3 - 121.2, n=3)
120.3 fps -41%
KFA2 GeForce RTX 4060 Ti EX, 16GB GDDR6
AMD Ryzen 9 7950X, NVIDIA GeForce RTX 4060 Ti 16G
119.6 fps -42%
Average NVIDIA Titan RTX
  (98 - 128, n=23)
117.8 fps -43%
Average NVIDIA GeForce RTX 3070
  (108 - 116, n=4)
113.2 fps -45%
KFA2 GeForce RTX 4060 1-Click-OC 2X
AMD Ryzen 9 7950X, NVIDIA GeForce RTX 4060
96 fps -53%
XFX Speedster QICK 308 Radeon RX 7600 Black Edition
AMD Ryzen 9 7950X, AMD Radeon RX 7600
89.3 fps -56%
Final Fantasy XV Benchmark
3840x2160 High Quality
NVIDIA GeForce RTX 4090 Founders Edition
Intel Core i9-13900K, NVIDIA GeForce RTX 4090 (1.3)
151.5 fps +53%
NVIDIA GeForce RTX 4080 Founders Edition
Intel Core i9-13900K, NVIDIA GeForce RTX 4080 (1.3)
115.4 fps +17%
AMD Radeon RX 7900 XTX
AMD Ryzen 9 7950X, AMD Radeon RX 7900 XTX (1.3)
101.6 fps +3%
Asus TUF Gaming GeForce RTX 4070 Ti Super
Intel Core i9-13900K, NVIDIA GeForce RTX 4070 Ti SUPER (1.3)
98.9 fps
Zotac Gaming GeForce RTX 3090 Ti AMP Extreme Holo
AMD Ryzen 7 5800X3D, NVIDIA GeForce RTX 3090 Ti (1.3)
96.3 fps -3%
Average of class Desktop
  (9.98 - 159.2, n=24, last 2 years)
95.3 fps -4%
Gigabyte Aorus GeForce RTX 4070 Ti Master
Intel Core i9-13900K, NVIDIA GeForce RTX 4070 Ti (1.3)
90.9 fps -8%
Asus TUF Gaming GeForce RTX 4070 Ti
Intel Core i9-13900K, NVIDIA GeForce RTX 4070 Ti (1.3)
90.5 fps -8%
Average NVIDIA GeForce RTX 4070 Ti
  (87.1 - 90.9, n=4)
89 fps -10%
Average NVIDIA GeForce RTX 3090
  (81.5 - 92.4, n=15)
87.5 fps -12%
Sapphire AMD Radeon RX 6950 XT Nitro+ Pure
AMD Ryzen 9 5900X, AMD Radeon RX 6950 XT (1.3)
86 fps -13%
Gigabyte GeForce RTX 4070 Super Gaming OC 12G
Intel Core i9-13900K, NVIDIA GeForce RTX 4070 SUPER (1.3)
85.2 fps -14%
AMD Radeon RX 7900 XT
AMD Ryzen 9 7950X, AMD Radeon RX 7900 XT (1.3)
84.9 fps -14%
Average NVIDIA GeForce RTX 3080 Ti
  (84 - 86.4, n=3)
84.9 fps -14%
NVIDIA GeForce RTX 4070 Super Founders Edition
Intel Core i9-13900K, NVIDIA GeForce RTX 4070 SUPER (1.3)
84.8 fps -14%
Zotac Gaming GeForce RTX 4070 AMP Airo
Intel Core i9-13900K, NVIDIA GeForce RTX 4070 (1.3)
74 fps -25%
Average NVIDIA GeForce RTX 3080
  (66 - 76.1, n=2)
71.1 fps -28%
AMD Radeon RX 7800 XT
AMD Ryzen 9 7950X, AMD Radeon RX 7800 XT (1.3)
70.5 fps -29%
AMD Radeon RX 6800 XT
AMD Ryzen 9 5950X, AMD Radeon RX 6800 XT (1.3)
65.2 fps -34%
KFA2 GeForce RTX 3070 Ti SG
AMD Ryzen 9 7950X, NVIDIA GeForce RTX 3070 Ti (1.3)
64.9 fps -34%
Average NVIDIA Titan RTX
  (57.4 - 66.7, n=32)
62.3 fps -37%
Sapphire Pulse Radeon RX 7700 XT
AMD Ryzen 9 7950X, AMD Radeon RX 7700 XT (1.3)
57.4 fps -42%
Average NVIDIA GeForce RTX 3070
  (54.8 - 58.2, n=4)
56.9 fps -42%
Average NVIDIA GeForce RTX 4060 Ti 8G
  (51.5 - 52.7, n=3)
52.2 fps -47%
KFA2 GeForce RTX 4060 Ti EX, 16GB GDDR6
AMD Ryzen 9 7950X, NVIDIA GeForce RTX 4060 Ti 16G (1.3)
51.2 fps -48%
KFA2 GeForce RTX 4060 1-Click-OC 2X
AMD Ryzen 9 7950X, NVIDIA GeForce RTX 4060 (1.3)
43 fps -57%
XFX Speedster QICK 308 Radeon RX 7600 Black Edition
AMD Ryzen 9 7950X, AMD Radeon RX 7600 (1.3)
39.3 fps -60%
2560x1440 High Quality
NVIDIA GeForce RTX 4090 Founders Edition
Intel Core i9-13900K, NVIDIA GeForce RTX 4090 (1.3)
220 fps +30%
NVIDIA GeForce RTX 4080 Founders Edition
Intel Core i9-13900K, NVIDIA GeForce RTX 4080 (1.3)
198.4 fps +18%
AMD Radeon RX 7900 XTX
AMD Ryzen 9 7950X, AMD Radeon RX 7900 XTX (1.3)
172.8 fps +2%
Gigabyte Aorus GeForce RTX 4070 Ti Master
Intel Core i9-13900K, NVIDIA GeForce RTX 4070 Ti (1.3)
169.2 fps 0%
Asus TUF Gaming GeForce RTX 4070 Ti Super
Intel Core i9-13900K, NVIDIA GeForce RTX 4070 Ti SUPER (1.3)
168.8 fps
Asus TUF Gaming GeForce RTX 4070 Ti
Intel Core i9-13900K, NVIDIA GeForce RTX 4070 Ti (1.3)
167 fps -1%
Average NVIDIA GeForce RTX 4070 Ti
  (160.1 - 169.2, n=4)
164.9 fps -2%
Sapphire AMD Radeon RX 6950 XT Nitro+ Pure
AMD Ryzen 9 5900X, AMD Radeon RX 6950 XT (1.3)
153 fps -9%
Zotac Gaming GeForce RTX 3090 Ti AMP Extreme Holo
AMD Ryzen 7 5800X3D, NVIDIA GeForce RTX 3090 Ti (1.3)
151.6 fps -10%
Average of class Desktop
  (17.8 - 237, n=23, last 2 years)
150.9 fps -11%
Gigabyte GeForce RTX 4070 Super Gaming OC 12G
Intel Core i9-13900K, NVIDIA GeForce RTX 4070 SUPER (1.3)
150.5 fps -11%
AMD Radeon RX 7900 XT
AMD Ryzen 9 7950X, AMD Radeon RX 7900 XT (1.3)
149.9 fps -11%
NVIDIA GeForce RTX 4070 Super Founders Edition
Intel Core i9-13900K, NVIDIA GeForce RTX 4070 SUPER (1.3)
148 fps -12%
Average NVIDIA GeForce RTX 3090
  (128 - 153, n=15)
143.1 fps -15%
Average NVIDIA GeForce RTX 3080 Ti
  (136 - 142, n=3)
139.7 fps -17%
Zotac Gaming GeForce RTX 4070 AMP Airo
Intel Core i9-13900K, NVIDIA GeForce RTX 4070 (1.3)
133.7 fps -21%
AMD Radeon RX 7800 XT
AMD Ryzen 9 7950X, AMD Radeon RX 7800 XT (1.3)
124.6 fps -26%
AMD Radeon RX 6800 XT
AMD Ryzen 9 5950X, AMD Radeon RX 6800 XT (1.3)
113 fps -33%
KFA2 GeForce RTX 3070 Ti SG
AMD Ryzen 9 7950X, NVIDIA GeForce RTX 3070 Ti (1.3)
112.7 fps -33%
Average NVIDIA GeForce RTX 3080
  (91 - 124, n=2)
107.5 fps -36%
Average NVIDIA Titan RTX
  (80.6 - 113.3, n=20)
104 fps -38%
Sapphire Pulse Radeon RX 7700 XT
AMD Ryzen 9 7950X, AMD Radeon RX 7700 XT (1.3)
103.1 fps -39%
Average NVIDIA GeForce RTX 4060 Ti 8G
  (95.5 - 96.7, n=3)
96 fps -43%
Average NVIDIA GeForce RTX 3070
  (89.2 - 99.3, n=4)
94.1 fps -44%
KFA2 GeForce RTX 4060 Ti EX, 16GB GDDR6
AMD Ryzen 9 7950X, NVIDIA GeForce RTX 4060 Ti 16G (1.3)
90.5 fps -46%
KFA2 GeForce RTX 4060 1-Click-OC 2X
AMD Ryzen 9 7950X, NVIDIA GeForce RTX 4060 (1.3)
79.3 fps -53%
XFX Speedster QICK 308 Radeon RX 7600 Black Edition
AMD Ryzen 9 7950X, AMD Radeon RX 7600 (1.3)
74.2 fps -56%

原生光线追踪性能

1080p Ultra 的光线追踪性能要么与 RTX 4070 Ti 相当,要么仅略高于 RTX 4070 Ti,其中The Callisto Protocol显示出 9% 的不错提升。

RTX 4070 Ti Super 在 4K 超高清光线追踪方面确实有优势,在《赛博朋克 2077》1.6中提升了 4%,在《控制 中提升了 10%。

与 RTX 4070 超级 Founders Edition 相比,差异更加明显。在这里,RTX 4070 Ti Super 在《 Alan Wake 2》1080p 和《赛博朋克 2077 Phantom Liberty》4K 光线追踪中显示出 22% 的显著优势。

Metro Exodus - 1920x1080 Ultra Quality DXR AF:16x
AMD Radeon RX 7900 XTX
AMD Ryzen 9 7950X, AMD Radeon RX 7900 XTX
141.2 (89.03min) fps +6%
NVIDIA GeForce RTX 4080 Founders Edition
Intel Core i9-13900K, NVIDIA GeForce RTX 4080
137.2 (68.42min) fps +3%
NVIDIA GeForce RTX 4090 Founders Edition
Intel Core i9-13900K, NVIDIA GeForce RTX 4090
135 (73.53min) fps +1%
Asus TUF Gaming GeForce RTX 4070 Ti Super
Intel Core i9-13900K, NVIDIA GeForce RTX 4070 Ti SUPER
133.4 (69.17min) fps
Average NVIDIA GeForce RTX 4070 Ti
  (128.8 - 133.3, n=4)
130.9 fps -2%
Gigabyte Aorus GeForce RTX 4070 Ti Master
Intel Core i9-13900K, NVIDIA GeForce RTX 4070 Ti
129 (64.57min) fps -3%
Asus TUF Gaming GeForce RTX 4070 Ti
Intel Core i9-13900K, NVIDIA GeForce RTX 4070 Ti
128.8 (62.96min) fps -3%
Zotac Gaming GeForce RTX 3090 Ti AMP Extreme Holo
AMD Ryzen 7 5800X3D, NVIDIA GeForce RTX 3090 Ti
128.5 (64.07min) fps -4%
Gigabyte GeForce RTX 4070 Super Gaming OC 12G
Intel Core i9-13900K, NVIDIA GeForce RTX 4070 SUPER
126.3 (69.94min) fps -5%
AMD Radeon RX 7900 XT
AMD Ryzen 9 7950X, AMD Radeon RX 7900 XT
124.3 (78.88min) fps -7%
NVIDIA GeForce RTX 4070 Super Founders Edition
Intel Core i9-13900K, NVIDIA GeForce RTX 4070 SUPER
121.7 (67.66min) fps -9%
Average of class Desktop
  (62.8 - 163.7, n=22, last 2 years)
119.4 fps -10%
Average NVIDIA GeForce RTX 3080 Ti
  (110 - 121.2, n=4)
114.8 fps -14%
Average NVIDIA GeForce RTX 3090
  (68.6 - 122.2, n=12)
111.4 fps -16%
Zotac Gaming GeForce RTX 4070 AMP Airo
Intel Core i9-13900K, NVIDIA GeForce RTX 4070
107.1 (58.82min) fps -20%
AMD Radeon RX 7800 XT
AMD Ryzen 9 7950X, AMD Radeon RX 7800 XT
98.4 (61.39min) fps -26%
Average NVIDIA GeForce RTX 3080
  (91.5 - 102, n=2)
96.8 fps -27%
KFA2 GeForce RTX 3070 Ti SG
AMD Ryzen 9 7950X, NVIDIA GeForce RTX 3070 Ti
92.4 (50.51min) fps -31%
AMD Radeon RX 6900 XT
AMD Ryzen 9 5950X, AMD Radeon RX 6900 XT
90.5 (55.53min) fps -32%
Sapphire Pulse Radeon RX 7700 XT
AMD Ryzen 9 7950X, AMD Radeon RX 7700 XT
88.1 (56.03min) fps -34%
Average NVIDIA Titan RTX
  (69 - 95.5, n=23)
86.1 fps -35%
AMD Radeon RX 6800 XT
AMD Ryzen 9 5950X, AMD Radeon RX 6800 XT
85.5 (52.71min) fps -36%
Average NVIDIA GeForce RTX 4060 Ti 8G
  (84.6 - 86.1, n=3)
85.2 fps -36%
KFA2 GeForce RTX 4060 Ti EX, 16GB GDDR6
AMD Ryzen 9 7950X, NVIDIA GeForce RTX 4060 Ti 16G
84.5 (47.97min) fps -37%
Average NVIDIA GeForce RTX 3070
  (80.4 - 83, n=5)
81.6 fps -39%
KFA2 GeForce RTX 4060 1-Click-OC 2X
AMD Ryzen 9 7950X, NVIDIA GeForce RTX 4060
67.2 (36.94min) fps -50%
XFX Speedster QICK 308 Radeon RX 7600 Black Edition
AMD Ryzen 9 7950X, AMD Radeon RX 7600
62.9 (40.28min) fps -53%
Control
1920x1080 High Quality Preset & High Ray Tracing Preset (DX12)
NVIDIA GeForce RTX 4090 Founders Edition
Intel Core i9-13900K, NVIDIA GeForce RTX 4090
185.1 (103.4min, 132.2P0.1, 140.8P1) fps +43%
NVIDIA GeForce RTX 4080 Founders Edition
Intel Core i9-13900K, NVIDIA GeForce RTX 4080
162.8 (28.9min, 60.8P0.1, 129.4P1) fps +26%
AMD Radeon RX 7900 XTX
AMD Ryzen 9 7950X, AMD Radeon RX 7900 XTX
133.7 (23.2min, 92.6P0.1, 104.6P1) fps +3%
Zotac Gaming GeForce RTX 3090 Ti AMP Extreme Holo
AMD Ryzen 7 5800X3D, NVIDIA GeForce RTX 3090 Ti
130.8 (62.6min, 107.5P0.1, 113.8P1) fps +1%
Asus TUF Gaming GeForce RTX 4070 Ti Super
Intel Core i9-13900K, NVIDIA GeForce RTX 4070 Ti SUPER
129.7 (14.9min, 100.7P0.1, 110.4P1) fps
Gigabyte Aorus GeForce RTX 4070 Ti Master
Intel Core i9-13900K, NVIDIA GeForce RTX 4070 Ti
129.1 (38.7min, 49.1P0.1, 101.2P1) fps 0%
Asus TUF Gaming GeForce RTX 4070 Ti
Intel Core i9-13900K, NVIDIA GeForce RTX 4070 Ti
128.3 (6.22min, 61.8P0.1, 107P1) fps -1%
Average NVIDIA GeForce RTX 4070 Ti
  (123.5 - 129.1, n=4)
126.7 fps -2%
Gigabyte GeForce RTX 4070 Super Gaming OC 12G
Intel Core i9-13900K, NVIDIA GeForce RTX 4070 SUPER
116.7 (28.4min, 92.4P0.1, 101.1P1) fps -10%
Average of class Desktop
  (58.6 - 185.1, n=15, last 2 years)
116.6 fps -10%
AMD Radeon RX 7900 XT
AMD Ryzen 9 7950X, AMD Radeon RX 7900 XT
116.1 (8.47min, 62.1P0.1, 91.4P1) fps -10%
Average NVIDIA GeForce RTX 3080 Ti
  (111 - 120.6, n=3)
115.2 fps -11%
NVIDIA GeForce RTX 4070 Super Founders Edition
Intel Core i9-13900K, NVIDIA GeForce RTX 4070 SUPER
113.8 (66.1min, 87.5P0.1, 97.9P1) fps -12%
Average NVIDIA GeForce RTX 3090
  (91.4 - 122.6, n=5)
111.1 fps -14%
Zotac Gaming GeForce RTX 4070 AMP Airo
Intel Core i9-13900K, NVIDIA GeForce RTX 4070
101.8 (30.1min, 42.5P0.1, 86.1P1) fps -22%
Average NVIDIA GeForce RTX 3080
  (98.1 - 103, n=2)
100.6 fps -22%
Sapphire AMD Radeon RX 6950 XT Nitro+ Pure
AMD Ryzen 9 5900X, AMD Radeon RX 6950 XT
97.7 (7.66min, 62.8P0.1, 73.5P1) fps -25%
AMD Radeon RX 7800 XT
AMD Ryzen 9 7950X, AMD Radeon RX 7800 XT
96.1 (18.2min, 69.2P0.1, 76.4P1) fps -26%
Average NVIDIA Titan RTX
  (63 - 120, n=3)
88.1 fps -32%
Sapphire Pulse Radeon RX 7700 XT
AMD Ryzen 9 7950X, AMD Radeon RX 7700 XT
79.9 (18.5min, 55.7P0.1, 65.6P1) fps -38%
AMD Radeon RX 6900 XT
AMD Ryzen 9 5950X, AMD Radeon RX 6900 XT (SAM ENABLED)
76.2 (38.7min, 43.3P0.1, 62.8P1) fps -41%
AMD Radeon RX 6900 XT
AMD Ryzen 9 5950X, AMD Radeon RX 6900 XT
73.1 (31.6min, 40.9P0.1, 62.6P1) fps -44%
KFA2 GeForce RTX 4060 Ti EX, 16GB GDDR6
AMD Ryzen 9 7950X, NVIDIA GeForce RTX 4060 Ti 16G
73 (15.8min, 59.4P0.1, 63.3P1) fps -44%
Average NVIDIA GeForce RTX 4060 Ti 8G
  (72.5 - 73.6, n=3)
73 fps -44%
Average NVIDIA GeForce RTX 3070
  (57.9 - 75.1, n=3)
68.5 fps -47%
AMD Radeon RX 6800 XT
AMD Ryzen 9 5950X, AMD Radeon RX 6800 XT
66.9 (60min) fps -48%
KFA2 GeForce RTX 4060 1-Click-OC 2X
AMD Ryzen 9 7950X, NVIDIA GeForce RTX 4060
57.5 (14.9min, 44.3P0.1, 50.6P1) fps -56%
XFX Speedster QICK 308 Radeon RX 7600 Black Edition
AMD Ryzen 9 7950X, AMD Radeon RX 7600
51.7 (6.96min, 38.6P0.1, 42P1) fps -60%
3840x2160 High Quality Preset & High Ray Tracing Preset (DX12)
Average of class Desktop
  (30.8 - 72, n=7, last 2 years)
43.4 fps +6%
Asus TUF Gaming GeForce RTX 4070 Ti Super
Intel Core i9-13900K, NVIDIA GeForce RTX 4070 Ti SUPER
41 (4.64min, 6.82P0.1, 35.8P1) fps
Average NVIDIA GeForce RTX 3090
  (40 - 40.3, n=2)
40.2 fps -2%
Average NVIDIA GeForce RTX 4070 Ti
  ()
37.3 fps -9%
Gigabyte GeForce RTX 4070 Super Gaming OC 12G
Intel Core i9-13900K, NVIDIA GeForce RTX 4070 SUPER
35.6 (8.25min, 10.9P0.1, 32.2P1) fps -13%
NVIDIA GeForce RTX 4070 Super Founders Edition
Intel Core i9-13900K, NVIDIA GeForce RTX 4070 SUPER
34.7 (5.84min, 14.2P0.1, 29.9P1) fps -15%
Zotac Gaming GeForce RTX 4070 AMP Airo
Intel Core i9-13900K, NVIDIA GeForce RTX 4070
30.8 (3.8min, 9.57P0.1, 27P1) fps -25%
AMD Radeon RX 7800 XT
AMD Ryzen 9 7950X, AMD Radeon RX 7800 XT
28.9 (19.6min, 24.3P0.1, 25.1P1) fps -30%
Sapphire Pulse Radeon RX 7700 XT
AMD Ryzen 9 7950X, AMD Radeon RX 7700 XT
23.6 (15.1min, 15.3P0.1, 17P1) fps -42%
KFA2 GeForce RTX 4060 Ti EX, 16GB GDDR6
AMD Ryzen 9 7950X, NVIDIA GeForce RTX 4060 Ti 16G
21.6 (19.6min, 19.6P0.1, 20P1) fps -47%
Average NVIDIA GeForce RTX 4060 Ti 8G
  (16.6 - 17.8, n=3)
17.1 fps -58%
KFA2 GeForce RTX 4060 1-Click-OC 2X
AMD Ryzen 9 7950X, NVIDIA GeForce RTX 4060
16.9 (3.97min, 4P0.1, 9.91P1) fps -59%
XFX Speedster QICK 308 Radeon RX 7600 Black Edition
AMD Ryzen 9 7950X, AMD Radeon RX 7600
7.2 (5.79min, 5.82P0.1, 5.95P1) fps -82%
Far Cry 6 - 1920x1080 Ultra Graphics Quality + HD Textures + DXR AA:T
NVIDIA GeForce RTX 4080 Founders Edition
Intel Core i9-13900K, NVIDIA GeForce RTX 4080
154 (125min) fps +7%
AMD Radeon RX 7900 XTX
AMD Ryzen 9 7950X, AMD Radeon RX 7900 XTX
152.1 (75min) fps +6%
NVIDIA GeForce RTX 4090 Founders Edition
Intel Core i9-13900K, NVIDIA GeForce RTX 4090
147 (125min) fps +2%
Asus TUF Gaming GeForce RTX 4070 Ti
Intel Core i9-13900K, NVIDIA GeForce RTX 4070 Ti
146 (122min) fps +1%
Asus TUF Gaming GeForce RTX 4070 Ti Super
Intel Core i9-13900K, NVIDIA GeForce RTX 4070 Ti SUPER
144 (125min) fps
Gigabyte GeForce RTX 4070 Super Gaming OC 12G
Intel Core i9-13900K, NVIDIA GeForce RTX 4070 SUPER
144 (99min) fps 0%
AMD Radeon RX 7900 XT
AMD Ryzen 9 7950X, AMD Radeon RX 7900 XT
143.6 (46min) fps 0%
Gigabyte Aorus GeForce RTX 4070 Ti Master
Intel Core i9-13900K, NVIDIA GeForce RTX 4070 Ti
139.5 (114min) fps -3%
Average NVIDIA GeForce RTX 4070 Ti
  (133.4 - 146, n=4)
138.9 fps -4%
Zotac Gaming GeForce RTX 4070 AMP Airo
Intel Core i9-13900K, NVIDIA GeForce RTX 4070
138 (108min) fps -4%
NVIDIA GeForce RTX 4070 Super Founders Edition
Intel Core i9-13900K, NVIDIA GeForce RTX 4070 SUPER
134 (119min) fps -7%
AMD Radeon RX 7800 XT
AMD Ryzen 9 7950X, AMD Radeon RX 7800 XT
129.4 (36min) fps -10%
Average of class Desktop
  (19.1 - 154, n=17, last 2 years)
125 fps -13%
Zotac Gaming GeForce RTX 3090 Ti AMP Extreme Holo
AMD Ryzen 7 5800X3D, NVIDIA GeForce RTX 3090 Ti
122 (95min) fps -15%
Average NVIDIA GeForce RTX 3080 Ti
  (112 - 128.6, n=2)
120.3 fps -16%
Average NVIDIA GeForce RTX 3090
  (76 - 138.2, n=8)
112.6 fps -22%
KFA2 GeForce RTX 4060 Ti EX, 16GB GDDR6
AMD Ryzen 9 7950X, NVIDIA GeForce RTX 4060 Ti 16G
111.1 (100min) fps -23%
Sapphire Pulse Radeon RX 7700 XT
AMD Ryzen 9 7950X, AMD Radeon RX 7700 XT
104.1 (18min) fps -28%
Average NVIDIA Titan RTX
  (97 - 109.3, n=2)
103.2 fps -28%
Sapphire AMD Radeon RX 6950 XT Nitro+ Pure
AMD Ryzen 9 5900X, AMD Radeon RX 6950 XT
101.6 (24min) fps -29%
Average NVIDIA GeForce RTX 4060 Ti 8G
  (61.9 - 88, n=2)
75 fps -48%
Average NVIDIA GeForce RTX 3080
  ()
73 fps -49%
Average NVIDIA GeForce RTX 3070
  ()
71 fps -51%
XFX Speedster QICK 308 Radeon RX 7600 Black Edition
AMD Ryzen 9 7950X, AMD Radeon RX 7600
63.6 (31min) fps -56%
KFA2 GeForce RTX 3070 Ti SG
AMD Ryzen 9 7950X, NVIDIA GeForce RTX 3070 Ti
55.4 fps -62%
KFA2 GeForce RTX 4060 1-Click-OC 2X
AMD Ryzen 9 7950X, NVIDIA GeForce RTX 4060
34.8 (13min) fps -76%
Cyberpunk 2077 1.6
1920x1080 Ray Tracing Ultra Preset (DLSS off)
NVIDIA GeForce RTX 4090 Founders Edition
Intel Core i9-13900K, NVIDIA GeForce RTX 4090 (1.6)
118.4 (92min) fps +48%
NVIDIA GeForce RTX 4080 Founders Edition
Intel Core i9-13900K, NVIDIA GeForce RTX 4080 (1.6)
100.1 (77.6min) fps +25%
Gigabyte Aorus GeForce RTX 4070 Ti Master
Intel Core i9-13900K, NVIDIA GeForce RTX 4070 Ti (1.61)
82.5 (32.1min) fps +3%
Asus TUF Gaming GeForce RTX 4070 Ti
Intel Core i9-13900K, NVIDIA GeForce RTX 4070 Ti (1.61)
81 (62.6min) fps +1%
Average NVIDIA GeForce RTX 4070 Ti
  (78.9 - 82.5, n=4)
81 fps +1%
Asus TUF Gaming GeForce RTX 4070 Ti Super
Intel Core i9-13900K, NVIDIA GeForce RTX 4070 Ti SUPER (1.63)
79.9 (63.5min) fps
Average of class Desktop
  (23.8 - 130.1, n=20, last 2 years)
77.1 fps -4%
Zotac Gaming GeForce RTX 3090 Ti AMP Extreme Holo
AMD Ryzen 7 5800X3D, NVIDIA GeForce RTX 3090 Ti (1.52)
74.7 (57.7min) fps -7%
Gigabyte GeForce RTX 4070 Super Gaming OC 12G
Intel Core i9-13900K, NVIDIA GeForce RTX 4070 SUPER (1.63)
71.5 (56.7min) fps -11%
Average NVIDIA GeForce RTX 3080 Ti
  ()
69.1 fps -14%
NVIDIA GeForce RTX 4070 Super Founders Edition
Intel Core i9-13900K, NVIDIA GeForce RTX 4070 SUPER (1.63)
68.9 (54.4min) fps -14%
Average NVIDIA GeForce RTX 3090
  (61.3 - 68, n=5)
65.5 fps -18%
AMD Radeon RX 7900 XTX
AMD Ryzen 9 7950X, AMD Radeon RX 7900 XTX (1.61)
64.6 (49.1min) fps -19%
Average NVIDIA GeForce RTX 3080
  ()
61.1 fps -24%
Zotac Gaming GeForce RTX 4070 AMP Airo
Intel Core i9-13900K, NVIDIA GeForce RTX 4070 (1.62)
60 (47.6min) fps -25%
AMD Radeon RX 7900 XT
AMD Ryzen 9 7950X, AMD Radeon RX 7900 XT (1.61)
57.1 (41.7min) fps -29%
KFA2 GeForce RTX 4060 Ti EX, 16GB GDDR6
AMD Ryzen 9 7950X, NVIDIA GeForce RTX 4060 Ti 16G (1.6)
49 (37min) fps -39%
Average NVIDIA GeForce RTX 4060 Ti 8G
  (48 - 49.6, n=3)
48.9 fps -39%
KFA2 GeForce RTX 3070 Ti SG
AMD Ryzen 9 7950X, NVIDIA GeForce RTX 3070 Ti (1.61)
47.6 (6.07min) fps -40%
AMD Radeon RX 7800 XT
AMD Ryzen 9 7950X, AMD Radeon RX 7800 XT (1.6)
46 (33.3min) fps -42%
Average NVIDIA Titan RTX
  ()
43.3 fps -46%
Average NVIDIA GeForce RTX 3070
  (41.6 - 43.9, n=2)
42.8 fps -46%
Sapphire Pulse Radeon RX 7700 XT
AMD Ryzen 9 7950X, AMD Radeon RX 7700 XT (1.6)
39.8 (30min) fps -50%
Sapphire Pulse Radeon RX 7700 XT
AMD Ryzen 9 7950X, AMD Radeon RX 7700 XT (1.6)
39.8 (30min) fps -50%
Sapphire Pulse Radeon RX 7700 XT
AMD Ryzen 9 7950X, AMD Radeon RX 7700 XT (1.6)
39.8 (30min) fps -50%
KFA2 GeForce RTX 4060 1-Click-OC 2X
AMD Ryzen 9 7950X, NVIDIA GeForce RTX 4060 (1.6)
37.1 (27.9min) fps -54%
XFX Speedster QICK 308 Radeon RX 7600 Black Edition
AMD Ryzen 9 7950X, AMD Radeon RX 7600 (1.6)
22.4 (13.9min) fps -72%
3840x2160 Ray Tracing Ultra Preset (DLSS off)
NVIDIA GeForce RTX 4090 Founders Edition
Intel Core i9-13900K, NVIDIA GeForce RTX 4090 (1.6)
42.6 (32min) fps +76%
NVIDIA GeForce RTX 4080 Founders Edition
Intel Core i9-13900K, NVIDIA GeForce RTX 4080 (1.6)
30.7 (23.5min) fps +27%
Average of class Desktop
  (1.4 - 43.8, n=19, last 2 years)
24.4 fps +1%
Zotac Gaming GeForce RTX 3090 Ti AMP Extreme Holo
AMD Ryzen 7 5800X3D, NVIDIA GeForce RTX 3090 Ti (1.52)
24.3 (16.3min) fps 0%
Asus TUF Gaming GeForce RTX 4070 Ti Super
Intel Core i9-13900K, NVIDIA GeForce RTX 4070 Ti SUPER (1.63)
24.2 (19.3min) fps
Gigabyte Aorus GeForce RTX 4070 Ti Master
Intel Core i9-13900K, NVIDIA GeForce RTX 4070 Ti (1.61)
23.9 (18min) fps -1%
Asus TUF Gaming GeForce RTX 4070 Ti
Intel Core i9-13900K, NVIDIA GeForce RTX 4070 Ti (1.61)
23.7 (18.1min) fps -2%
Average NVIDIA GeForce RTX 4070 Ti
  (21.6 - 23.9, n=4)
23.2 fps -4%
Gigabyte GeForce RTX 4070 Super Gaming OC 12G
Intel Core i9-13900K, NVIDIA GeForce RTX 4070 SUPER (1.63)
21.1 (2.68min) fps -13%
Average NVIDIA GeForce RTX 3090
  (19.8 - 22.1, n=5)
21 fps -13%
AMD Radeon RX 7900 XTX
AMD Ryzen 9 7950X, AMD Radeon RX 7900 XTX (1.61)
20.7 (14.4min) fps -14%
NVIDIA GeForce RTX 4070 Super Founders Edition
Intel Core i9-13900K, NVIDIA GeForce RTX 4070 SUPER (1.63)
20 (9.7min) fps -17%
Average NVIDIA GeForce RTX 3080 Ti
  ()
18.6 fps -23%
AMD Radeon RX 7900 XT
AMD Ryzen 9 7950X, AMD Radeon RX 7900 XT (1.61)
17.6 (12min) fps -27%
Zotac Gaming GeForce RTX 4070 AMP Airo
Intel Core i9-13900K, NVIDIA GeForce RTX 4070 (1.62)
15.3 (11.7min) fps -37%
AMD Radeon RX 7800 XT
AMD Ryzen 9 7950X, AMD Radeon RX 7800 XT (1.6)
13.7 (10.2min) fps -43%
Average NVIDIA Titan RTX
  ()
13.4 fps -45%
KFA2 GeForce RTX 4060 Ti EX, 16GB GDDR6
AMD Ryzen 9 7950X, NVIDIA GeForce RTX 4060 Ti 16G (1.6)
13.2 (10min) fps -45%
Average NVIDIA GeForce RTX 3080
  ()
12.1 fps -50%
Sapphire Pulse Radeon RX 7700 XT
AMD Ryzen 9 7950X, AMD Radeon RX 7700 XT (1.6)
11.5 (7.84min) fps -52%
Sapphire Pulse Radeon RX 7700 XT
AMD Ryzen 9 7950X, AMD Radeon RX 7700 XT (1.6)
11.5 (7.84min) fps -52%
Average NVIDIA GeForce RTX 3070
  (5.4 - 6.6, n=2)
6 fps -75%
KFA2 GeForce RTX 3070 Ti SG
AMD Ryzen 9 7950X, NVIDIA GeForce RTX 3070 Ti (1.61)
3.19 (2.21min) fps -87%
Average NVIDIA GeForce RTX 4060 Ti 8G
  (2.2 - 3.2, n=3)
2.6 fps -89%
KFA2 GeForce RTX 4060 1-Click-OC 2X
AMD Ryzen 9 7950X, NVIDIA GeForce RTX 4060 (1.6)
2.19 (1.635min) fps -91%
XFX Speedster QICK 308 Radeon RX 7600 Black Edition
AMD Ryzen 9 7950X, AMD Radeon RX 7600 (1.6)
2.05 (0.904min) fps -92%
Ghostwire Tokyo - 1920x1080 Highest Settings + Maximum Ray Tracing
NVIDIA GeForce RTX 4090 Founders Edition
Intel Core i9-13900K, NVIDIA GeForce RTX 4090
193.7 (38.5min, 66.5P0.1, 142.5P1) fps +36%
NVIDIA GeForce RTX 4080 Founders Edition
Intel Core i9-13900K, NVIDIA GeForce RTX 4080
166.2 (30.4min, 60P0.1, 115.2P1) fps +17%
Asus TUF Gaming GeForce RTX 4070 Ti Super
Intel Core i9-13900K, NVIDIA GeForce RTX 4070 Ti SUPER
142.2 (32.5min, 52.5P0.1, 88.4P1) fps
Asus TUF Gaming GeForce RTX 4070 Ti
Intel Core i9-13900K, NVIDIA GeForce RTX 4070 Ti
139.3 (31.3min, 53.2P0.1, 89.7P1) fps -2%
Gigabyte Aorus GeForce RTX 4070 Ti Master
Intel Core i9-13900K, NVIDIA GeForce RTX 4070 Ti
138.7 (38.5min, 54.6P0.1, 89.8P1) fps -2%
Average NVIDIA GeForce RTX 4070 Ti
  (130.7 - 139.3, n=4)
136.5 fps -4%
AMD Radeon RX 7900 XTX
AMD Ryzen 9 7950X, AMD Radeon RX 7900 XTX
136.3 (39.1min, 76.4P0.1, 95.8P1) fps -4%
Average of class Desktop
  (55.9 - 193.7, n=13, last 2 years)
136.3 fps -4%
Gigabyte GeForce RTX 4070 Super Gaming OC 12G
Intel Core i9-13900K, NVIDIA GeForce RTX 4070 SUPER
132.9 (13.7min, 19.3P0.1, 81.6P1) fps -7%
NVIDIA GeForce RTX 4070 Super Founders Edition
Intel Core i9-13900K, NVIDIA GeForce RTX 4070 SUPER
128.3 (23.1min, 40.3P0.1, 80.7P1) fps -10%
Zotac Gaming GeForce RTX 3090 Ti AMP Extreme Holo
AMD Ryzen 7 5800X3D, NVIDIA GeForce RTX 3090 Ti
120.2 (33.8min, 55.2P0.1, 79.1P1) fps -15%
Average NVIDIA GeForce RTX 3080 Ti
  ()
119.9 fps -16%
AMD Radeon RX 7900 XT
AMD Ryzen 9 7950X, AMD Radeon RX 7900 XT
116.5 (30.3min, 71.6P0.1, 78.1P1) fps -18%
Zotac Gaming GeForce RTX 4070 AMP Airo
Intel Core i9-13900K, NVIDIA GeForce RTX 4070
112.2 (16.9min, 37.9P0.1, 67.5P1) fps -21%
Average NVIDIA GeForce RTX 3090
  (106 - 122, n=3)
111.6 fps -22%
Average NVIDIA GeForce RTX 3080
  ()
97.9 fps -31%
AMD Radeon RX 7800 XT
AMD Ryzen 9 7950X, AMD Radeon RX 7800 XT
95.3 (30.1min, 39.9P0.1, 57.5P1) fps -33%
KFA2 GeForce RTX 4060 Ti EX, 16GB GDDR6
AMD Ryzen 9 7950X, NVIDIA GeForce RTX 4060 Ti 16G
89.1 (34.3min, 49.2P0.1, 52.3P1) fps -37%
Average NVIDIA GeForce RTX 4060 Ti 8G
  (88 - 90.4, n=3)
89.1 fps -37%
Sapphire Pulse Radeon RX 7700 XT
AMD Ryzen 9 7950X, AMD Radeon RX 7700 XT
82.5 (20.2min, 38.6P0.1, 48.8P1) fps -42%
Average NVIDIA Titan RTX
  (74.5 - 79, n=2)
76.8 fps -46%
Average NVIDIA GeForce RTX 3070
  ()
76.3 fps -46%
KFA2 GeForce RTX 4060 1-Click-OC 2X
AMD Ryzen 9 7950X, NVIDIA GeForce RTX 4060
72.3 (38min, 39.5P0.1, 40.8P1) fps -49%
XFX Speedster QICK 308 Radeon RX 7600 Black Edition
AMD Ryzen 9 7950X, AMD Radeon RX 7600
52.8 (26.9min, 27.7P0.1, 28.6P1) fps -63%
The Callisto Protocol - 1920x1080 Ultra Preset (without FSR Upscaling) + Full Ray-Tracing
AMD Radeon RX 7800 XT
AMD Ryzen 9 7950X, AMD Radeon RX 7800 XT
99.3 fps +3%
AMD Radeon RX 7900 XTX
AMD Ryzen 9 7950X, AMD Radeon RX 7900 XTX
98 fps +1%
Gigabyte GeForce RTX 4070 Super Gaming OC 12G
Intel Core i9-13900K, NVIDIA GeForce RTX 4070 SUPER
97.64 fps +1%
Asus TUF Gaming GeForce RTX 4070 Ti Super
Intel Core i9-13900K, NVIDIA GeForce RTX 4070 Ti SUPER
96.75 fps
NVIDIA GeForce RTX 4070 Super Founders Edition
Intel Core i9-13900K, NVIDIA GeForce RTX 4070 SUPER
94.09 fps -3%
Sapphire Pulse Radeon RX 7700 XT
AMD Ryzen 9 7950X, AMD Radeon RX 7700 XT
92.4 fps -4%
AMD Radeon RX 7900 XT
AMD Ryzen 9 7950X, AMD Radeon RX 7900 XT
89 fps -8%
Average NVIDIA GeForce RTX 4070 Ti
  (82.1 - 97.5, n=4)
88.8 fps -8%
Asus TUF Gaming GeForce RTX 4070 Ti
Intel Core i9-13900K, NVIDIA GeForce RTX 4070 Ti
88.58 fps -8%
Gigabyte Aorus GeForce RTX 4070 Ti Master
Intel Core i9-13900K, NVIDIA GeForce RTX 4070 Ti
87 fps -10%
KFA2 GeForce RTX 4060 Ti EX, 16GB GDDR6
AMD Ryzen 9 7950X, NVIDIA GeForce RTX 4060 Ti 16G
86.6 fps -10%
Average of class Desktop
  (50.2 - 97.6, n=7, last 2 years)
86 fps -11%
Zotac Gaming GeForce RTX 4070 AMP Airo
Intel Core i9-13900K, NVIDIA GeForce RTX 4070
82 fps -15%
Average NVIDIA GeForce RTX 4060 Ti 8G
  (66.8 - 90.7, n=3)
81.1 fps -16%
Average NVIDIA GeForce RTX 3080 Ti
  ()
76 fps -21%
Average NVIDIA GeForce RTX 3080
  ()
71.3 fps -26%
XFX Speedster QICK 308 Radeon RX 7600 Black Edition
AMD Ryzen 9 7950X, AMD Radeon RX 7600
65.8 fps -32%
KFA2 GeForce RTX 3070 Ti SG
AMD Ryzen 9 7950X, NVIDIA GeForce RTX 3070 Ti
65.6 fps -32%
Average NVIDIA GeForce RTX 3070
  ()
61.8 fps -36%
Average NVIDIA Titan RTX
  ()
58.7 fps -39%
Alan Wake 2 - 1920x1080 High Preset + High Ray Tracing
Asus TUF Gaming GeForce RTX 4070 Ti Super
Intel Core i9-13900K, NVIDIA GeForce RTX 4070 Ti SUPER
69.8 (45.3min, 48.6P0.1, 57.5P1) fps
Gigabyte GeForce RTX 4070 Super Gaming OC 12G
Intel Core i9-13900K, NVIDIA GeForce RTX 4070 SUPER
61.6 (41.6min, 43.9P0.1, 50.7P1) fps -12%
NVIDIA GeForce RTX 4070 Super Founders Edition
Intel Core i9-13900K, NVIDIA GeForce RTX 4070 SUPER
57.1 (41.5min, 42.9P0.1, 47.1P1) fps -18%
Average of class Desktop
  (4.7 - 77.7, n=6, last 2 years)
56.3 fps -19%
Average NVIDIA GeForce RTX 3090
  (49.8 - 52, n=2)
50.9 fps -27%
Average NVIDIA Titan RTX
  ()
27.9 fps -60%
Sapphire Pulse Radeon RX 7700 XT
AMD Ryzen 9 7950X, AMD Radeon RX 7700 XT
26.7 (18.3min, 18.4P0.1, 20.9P1) fps -62%
XFX Speedster QICK 308 Radeon RX 7600 Black Edition
AMD Ryzen 9 7950X, AMD Radeon RX 7600
4.4 (2.21min, 2.21P0.1, 2.24P1) fps -94%
Cyberpunk 2077 2.0 Phantom Liberty
3840x2160 Ray Tracing Ultra Preset (DLSS off, no Path Tracing)
Average of class Desktop
  (20.5 - 42.5, n=6, last 2 years)
28.3 fps +13%
Asus TUF Gaming GeForce RTX 4070 Ti Super
Intel Core i9-13900K, NVIDIA GeForce RTX 4070 Ti SUPER (2.1)
25 (16.2min) fps
Gigabyte GeForce RTX 4070 Super Gaming OC 12G
Intel Core i9-13900K, NVIDIA GeForce RTX 4070 SUPER (2.11)
21.9 (19.4min) fps -12%
Average NVIDIA GeForce RTX 3090
  (21.1 - 21.8, n=2)
21.5 fps -14%
NVIDIA GeForce RTX 4070 Super Founders Edition
Intel Core i9-13900K, NVIDIA GeForce RTX 4070 SUPER (2.1)
20.5 (15.6min) fps -18%
XFX Speedster QICK 308 Radeon RX 7600 Black Edition
AMD Ryzen 9 7950X, AMD Radeon RX 7600 (2.02)
3.2 (0.817min) fps -87%
1920x1080 Ray Tracing Ultra Preset (DLSS off)
Asus TUF Gaming GeForce RTX 4070 Ti Super
Intel Core i9-13900K, NVIDIA GeForce RTX 4070 Ti SUPER (2.1)
81.8 (63.1min) fps
Average of class Desktop
  (31.6 - 119.8, n=7, last 2 years)
81.6 fps 0%
Gigabyte GeForce RTX 4070 Super Gaming OC 12G
Intel Core i9-13900K, NVIDIA GeForce RTX 4070 SUPER (2.11)
74 (65.2min) fps -10%
NVIDIA GeForce RTX 4070 Super Founders Edition
Intel Core i9-13900K, NVIDIA GeForce RTX 4070 SUPER (2.1)
70.4 (17.1min) fps -14%
Average NVIDIA GeForce RTX 3090
  ()
69.7 fps -15%
Average NVIDIA Titan RTX
  ()
42.7 fps -48%
Sapphire Pulse Radeon RX 7700 XT
AMD Ryzen 9 7950X, AMD Radeon RX 7700 XT (2.02)
37 (29.3min) fps -55%
XFX Speedster QICK 308 Radeon RX 7600 Black Edition
AMD Ryzen 9 7950X, AMD Radeon RX 7600 (2.02)
23.9 (17.8min) fps -71%
low med. high ultraQHD4K DLSS4K
GTA V (2015) 187.6 187.6 187.4 160.1 155.3 182.1
The Witcher 3 (2015) 558 430 210 159.3
Dota 2 Reborn (2015) 245 228 226 202 203
Final Fantasy XV Benchmark (2018) 235 235 209 168.8 98.9
X-Plane 11.11 (2018) 224 196.7 150 127.8
Far Cry 5 (2018) 203 197 188 187 119
Strange Brigade (2018) 568 467 442 407 306 161.9
Shadow of the Tomb Raider (2018) 273 269 256 205 109.5
Metro Exodus (2019) 236 193.5 158.3 130.9 84.4
Control (2019) 226 196.9 130.3 78.9 66.4
Borderlands 3 (2019) 192.1 176.8 169.6 143.6 79.4
Mafia Definitive Edition (2020) 239 231 181 96.6
Watch Dogs Legion (2020) 171.2 159.3 144.2 115.9 68.6
Far Cry 6 (2021) 209 191 169 154 91
Dying Light 2 (2022) 213 162.2 121.5 63.7
Cyberpunk 2077 1.6 (2022) 196.9 195.9 172.3 157.5 103.6 49.7
Ghostwire Tokyo (2022) 278 282 283 217 99.2
F1 22 (2022) 371 384 336 144.9 95.1 48.9
The Callisto Protocol (2022) 210.62 202.94 149.39 114.82 70.04
F1 23 (2023) 385 402 363 138.2 90 77.4 45.1
Baldur's Gate 3 (2023) 246 223 218 157.8 133.9 117.2
Cyberpunk 2077 2.0 Phantom Liberty (2023) 188.5 188.5 170.8 150.3 94.9 42.3
Assassin's Creed Mirage (2023) 221 206 170 136 112 84
Alan Wake 2 (2023) 124.7 114.4 82.5 63.7 44.7
Call of Duty Modern Warfare 3 2023 (2023) 227 184 179 133 112 84
Avatar Frontiers of Pandora (2023) 163 141.8 113.2 76.6 68.9 39.8

排放:风扇噪音低,但负载时表面温度较高

TUF GamingGeForce RTX 4070 Ti Super 配备六个热管

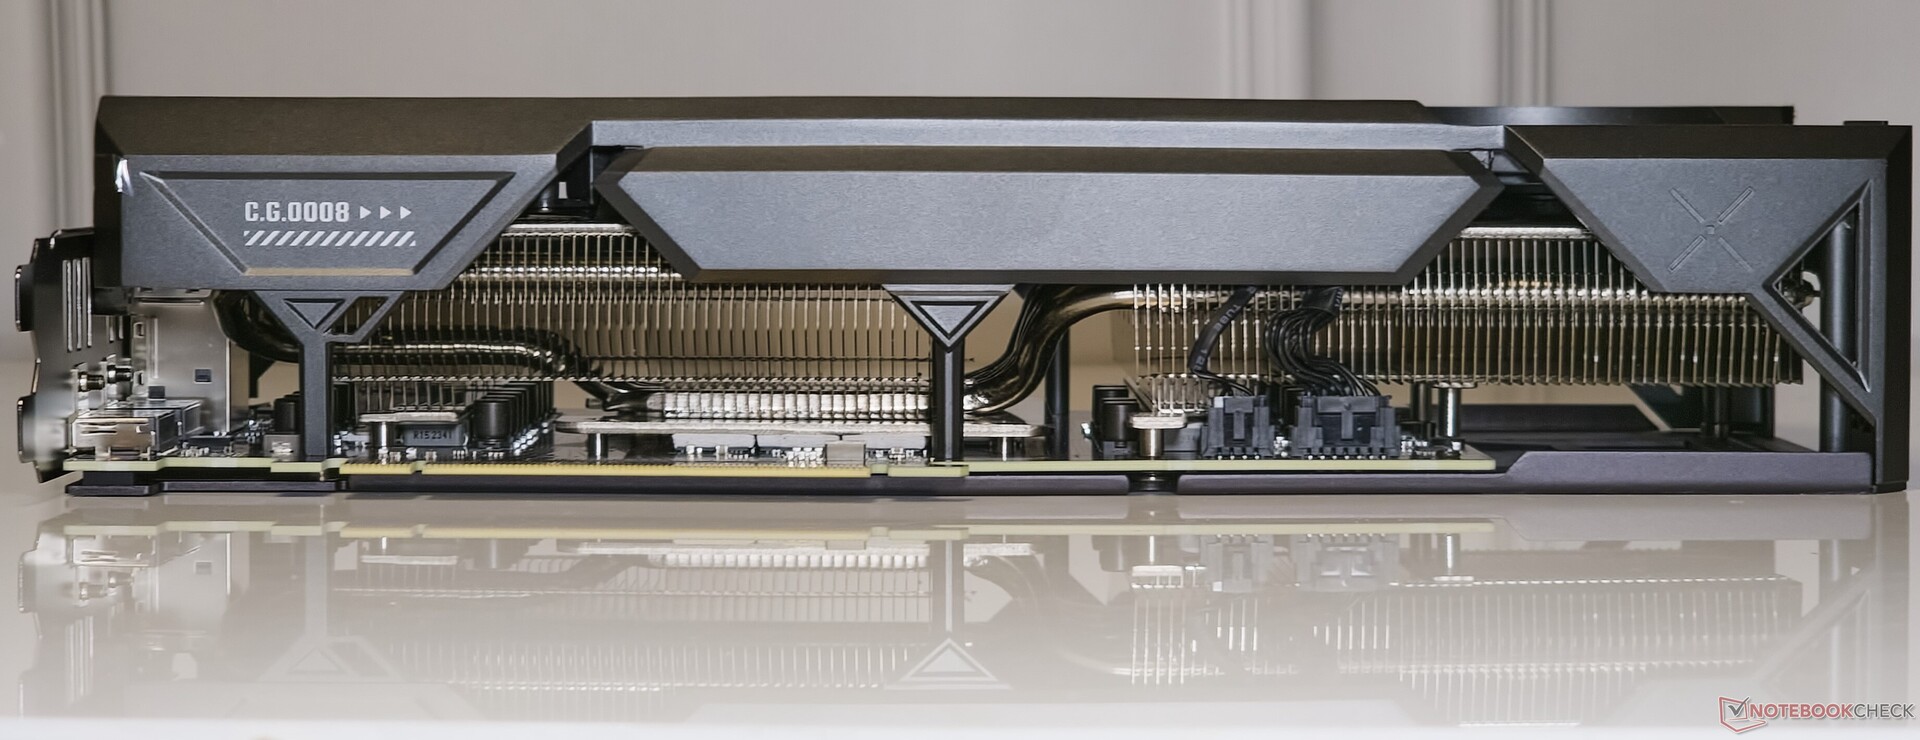
华硕 TUF GamingGeForce RTX 4070 Ti Super 采用了该公司所称的轴向技术风扇,配备双滚珠轴承,可降低噪音并延长使用寿命。

一个很好的功能是,如果需要清洁风扇,可以拆下金属护罩,而无需拆卸显卡本身。

TUF GamingGeForce RTX 4070 Ti Super 共采用了六根热管,用于从 GPU、VRM 和内存进行高效热传导。

压力测试

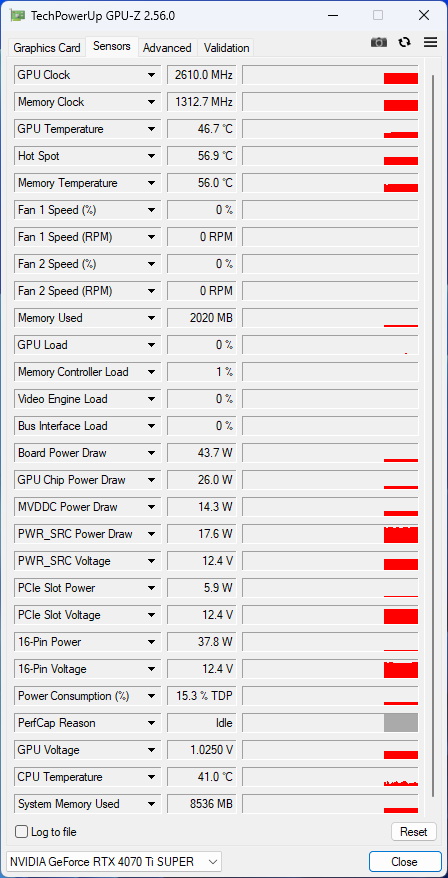
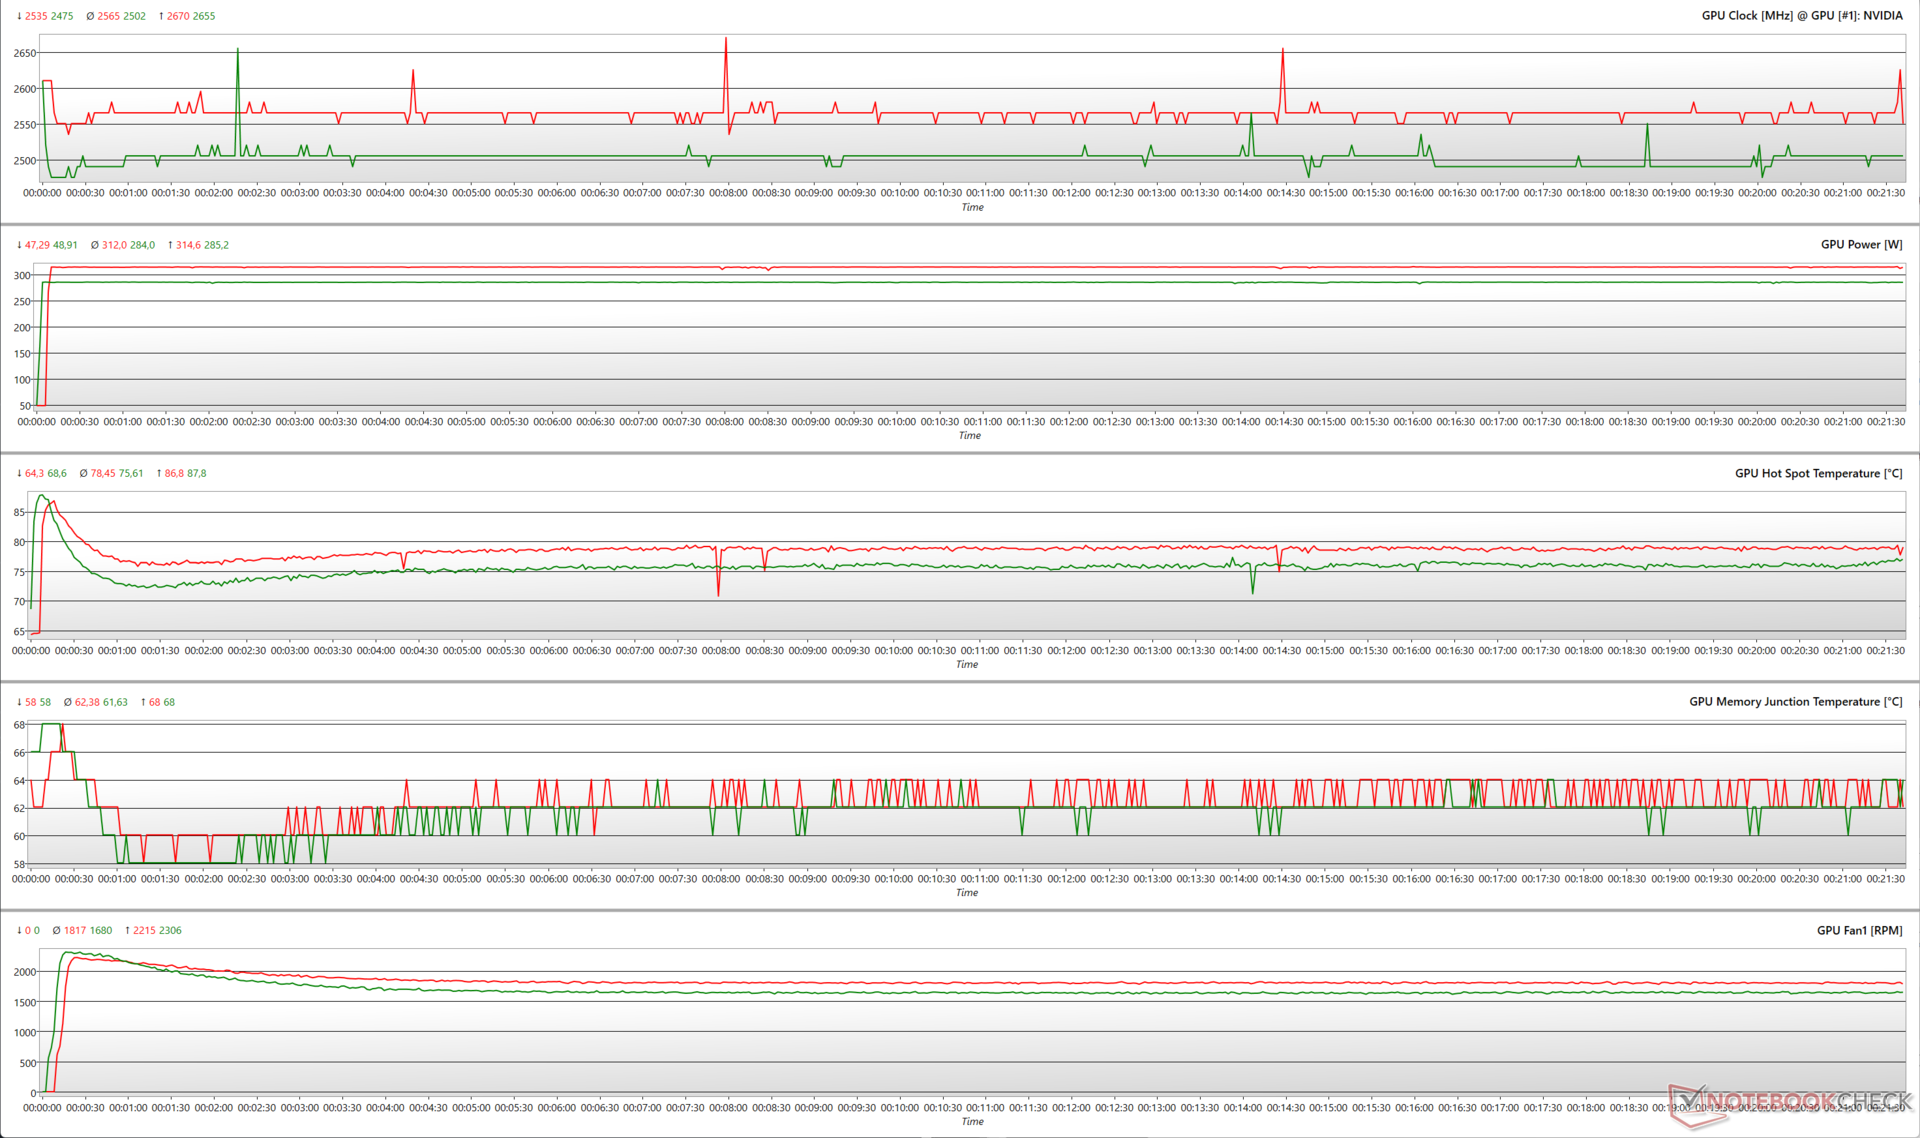
在 100% 功耗目标(PT)下,TUF GamingGeForce RTX 4070 Ti Super 在 1280 x 720、无 AA 的 FurMark 压力测试中可提升至 2,655 MHz,同时使用 285 W TGP。

将功耗目标提高到 110%,显卡的频率可提升至 2,670 MHz,而功耗接近 315 W。这也导致平均热点温度略高,约为 78.5 °C,平均风扇转速更高,为 1,817 RPM。

在 1080p 超高速下使用 Witcher 3时,100% PT 和 110% PT 时的时钟曲线相似,最大提升频率均为 2,715 MHz。RTX 4070 Ti Super 不需要利用所有可用的 315 W 净空来达到这个时钟频率,这与我们迄今为止评测过的其他 Ada GPU 的表现一致。

在 110% PT 时,GPU 平均热点温度和平均风扇速度仅分别增加了 3.8% 和 11%。

FurMark 压力期间的 GPU 参数(绿色 - 100% PT;红色 - 110% PT;性能 BIOS)
Witcher 3 1080p 超高速压力下的 GPU 参数(绿色 - 100% PT;红色 - 110% PT;性能 BIOS)

Witcher 3 FPS 图表

华硕的散热系统似乎很好地帮助 TUF GamingGeForce RTX 4070 Ti Super 在1080pUltra 和 4K Ultra 游戏 Witcher 3 中保持了稳定的帧率。

4K Ultra 最初的帧数从 109 帧下降到 101 帧,但随后该显卡的帧数保持相当稳定。
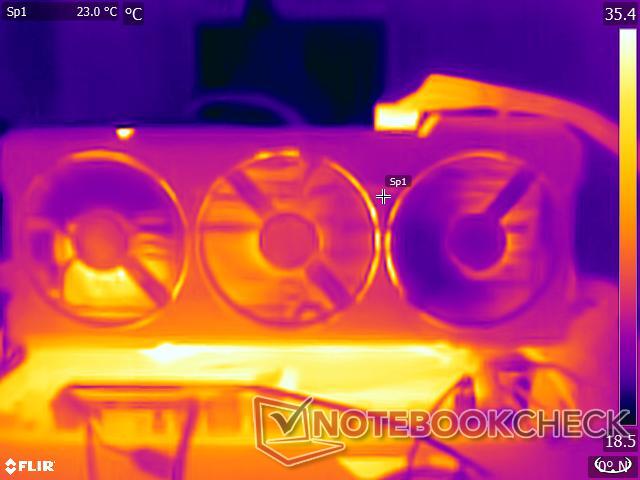
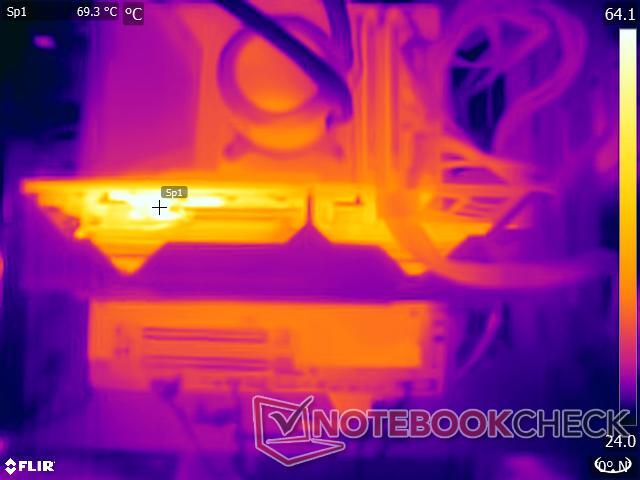
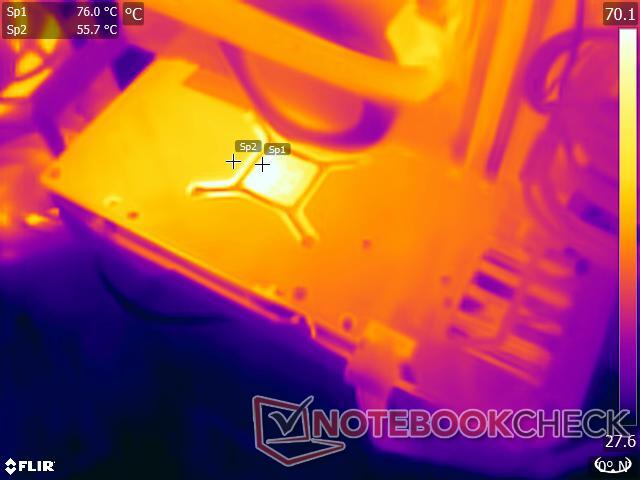
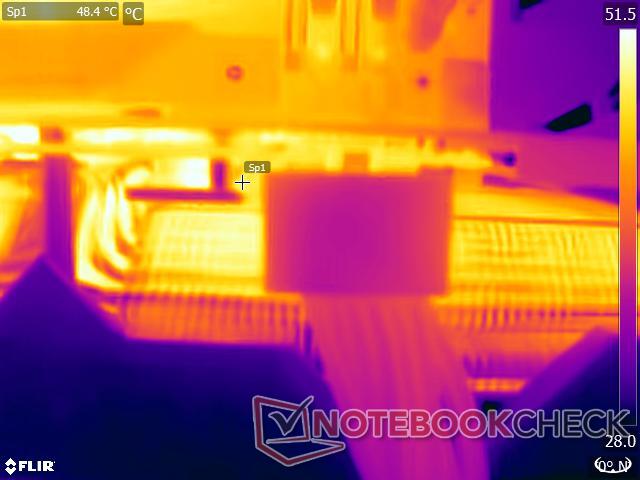
0102030405060708090100110120130140150160170180190Tooltip
Asus TUF Gaming GeForce RTX 4070 Ti Super i9-13900K, NVIDIA GeForce RTX 4070 Ti SUPER; 1920x1080 Ultra Graphics & Postprocessing (HBAO+): Ø196 (192-200)
Asus TUF Gaming GeForce RTX 4070 Ti Super i9-13900K, NVIDIA GeForce RTX 4070 Ti SUPER; 3840x2160 Ultra Graphics & Postprocessing (HBAO+): Ø101.4 (98-109)

表面温度

虽然散热系统能够确保 GPU 本身的无节流性能,但我们发现 TUF GamingGeForce RTX 4070 Ti Super 的表面温度相对较高。

在 22 °C 的环境温度下,金属前护罩的温度并不高,但背板的温度高达约 56 °C,而 GPU 区域的温度可达 76 °C。12VHPWR 接口周围的温度相对较低,为 48.4 °C。

表面温度:前护罩
表面温度:前护罩
地表温度:顶部
地表温度:顶部
表面温度:背板
表面温度:背板
表面温度12VHPWR 电源连接器
表面温度12VHPWR 电源连接器

噪音水平

TUF GamingGeForce RTX 4070 Ti Super 在压力下风扇噪音低

华硕的三风扇实现了一般情况下可以容忍的风扇噪音排放,我们之前在 TUF GamingGeForce RTX 4070 Ti OC也是如此。

在 TUF RTX 4070 Ti Super 的三个风扇中,两个风扇逆时针旋转,而中间的风扇则顺时针旋转。空闲时,华硕会完全停止风扇运转,55 °C是风扇启动前的核心温度阈值。

TUF Gaming RTX 4070 Ti Super 允许在性能和静音 VBIOS 模式之间切换。静音模式允许更紧凑的风扇曲线,所有其他参数不受影响。尽管如此,这两种 VBIOS 模式在实际使用中并无明显区别。

在所有 FurMark 负载下,显卡的噪音都低于 35 分贝(A),在Witcher 31080p Ultra 压力测试中低于 30 分贝(A)。我们在性能 VBIOS 中记录到的最大声压级 (SPL) 为 35.88 dB(A),PT 值为 110%。

与早期的 TUF RTX 4070 Ti OC 相比,这是一个很好的改进,早期的 TUF RTX 4070 Ti OC 在 FurMark 负载下的噪音接近 46 dB(A)。另外请注意,我们的声压级测量是在开放式测试台设置下进行的,这意味着风扇在典型的 ATX 机箱中几乎听不到声音。

Ambient: 19.50 dB(A); System Idle: 24 dB(A)
压力测试 VBIOS模式/功率目标 风扇噪音 dB(A)
FurMark 1280 x 720,无 AA 性能 / 100% 33.71
FurMark 1280 x 720,无 AA 静音 / 100% 33.05
FurMark 1280 x 720,无 AA 性能 / 110% 35.88
FurMark 1280 x 720,无 AA 安静 / 110% 35.55
Witcher 3 1080p Ultra 性能/100% 28.40
Witcher 3 1080p Ultra 安静 / 100% 27.77
Witcher 3 1080p Ultra 性能 / 110% 29.51
Witcher 3 1080p Ultra 安静 / 110% 28.55

能源管理:比 RTX 4070 Ti 更节电

尽管规格有所提升,但 TUF RTX 4070 Ti Super 在功耗方面却相当节俭,在 FurMark 和 Witcher 3 功耗测试中甚至比 RTX 4070 Ti 平均值更经济。在能效方面,TUF RTX 4070 Ti Super 紧随 RTX 4090 Founders Edition 之后。

与 Nvidia Ada Lovelace 显卡的通常情况一样,RTX 4070 Ti Super 在 1080p 超高清Witcher 3,在 100% 和 110% 功耗目标下显示出相似的系统总功耗。这与我们在上述压力测试中的观察结果一致。

Power Consumption: External monitor

0255075100125150175200225250275300325350375400425450Tooltip
Asus TUF Gaming GeForce RTX 4070 Ti Super; 1280x720 FurMark 1.19 GPU Stress Test (external Monitor); 110% PT, Perf. BIOS: Ø426 (419-452)
Asus TUF Gaming GeForce RTX 4070 Ti Super; 1280x720 FurMark 1.19 GPU Stress Test (external Monitor); 100% PT, Perf. BIOS: Ø395 (389-425)
Asus TUF Gaming GeForce RTX 4070 Ti Super; 1920x1080 The Witcher 3 ultra (external Monitor); 110% PT, Perf. BIOS: Ø398 (386-431)
Asus TUF Gaming GeForce RTX 4070 Ti Super; 1920x1080 The Witcher 3 ultra (external Monitor); 100% PT, Perf. BIOS: Ø393 (382-420)
Asus TUF Gaming GeForce RTX 4070 Ti Super; Idle 1min (external Monitor): Ø138.2 (129.5-168.8)
Power Consumption / FurMark 1.19 GPU Stress Test (external Monitor)
NVIDIA GeForce RTX 4090 Founders Edition
Intel Core i9-13900K, NVIDIA GeForce RTX 4090 (133% PT OC, Idle: 81.25 W)
704 (666min, 670P1 - 717max) Watt * -65%
NVIDIA GeForce RTX 4090 Founders Edition
Intel Core i9-13900K, NVIDIA GeForce RTX 4090 (100% PT, Idle: 81.25 W)
558 (551min, 553P1 - 566max) Watt * -31%
Zotac Gaming GeForce RTX 3090 Ti AMP Extreme Holo
AMD Ryzen 7 5800X3D, NVIDIA GeForce RTX 3090 Ti (110% PT, Idle: 102 W)
648 (629min, 637P1 - 658max) Watt * -52%
Zotac Gaming GeForce RTX 3090 Ti AMP Extreme Holo
AMD Ryzen 7 5800X3D, NVIDIA GeForce RTX 3090 Ti (100% PT; Quiet BIOS, Idle: 102 W)
599 (587min, 588P1 - 666max) Watt * -41%
Zotac Gaming GeForce RTX 3090 Ti AMP Extreme Holo
AMD Ryzen 7 5800X3D, NVIDIA GeForce RTX 3090 Ti (100% PT; Amplify BIOS, Idle: 102 W)
598 (584min, 595P1 - 608max) Watt * -40%
Sapphire AMD Radeon RX 6950 XT Nitro+ Pure
AMD Ryzen 9 5900X, AMD Radeon RX 6950 XT
564 (525min, 551P1 - 601max) Watt * -32%
AMD Radeon RX 7900 XTX
AMD Ryzen 9 7950X, AMD Radeon RX 7900 XTX (Idle: 86.5 W)
518 (501min, 502P1 - 525max) Watt * -22%
AMD Radeon RX 7900 XT
AMD Ryzen 9 7950X, AMD Radeon RX 7900 XT (Idle: 84.6 W)
513 (500min, 506P1 - 527max) Watt * -20%
Average NVIDIA GeForce RTX 3080
  (Idle: 492 - 505, n=2 W)
499 Watt * -17%
KFA2 GeForce RTX 3070 Ti SG
AMD Ryzen 9 7950X, NVIDIA GeForce RTX 3070 Ti (Idle: 88.9 W)
472 (464min, 465P1 - 531max) Watt * -11%
Average NVIDIA GeForce RTX 3090
  (Idle: 281 - 551, n=8 W)
469 Watt * -10%
NVIDIA GeForce RTX 4080 Founders Edition
Intel Core i9-13900K, NVIDIA GeForce RTX 4080 (110% PT, Idle: 78.45 W)
466 (461min, 462P1 - 488max) Watt * -9%
NVIDIA GeForce RTX 4080 Founders Edition
Intel Core i9-13900K, NVIDIA GeForce RTX 4080 (100% PT, Idle: 78.45 W)
429 (423min, 424P1 - 436max) Watt * -1%
Average NVIDIA GeForce RTX 3080 Ti
  (Idle: 427 - 513, n=3 W)
464 Watt * -9%
AMD Radeon RX 6900 XT
AMD Ryzen 9 5950X, AMD Radeon RX 6900 XT (Idle: 99.15 W)
456.8 (378.13min - 484.67max) Watt * -7%
AMD Radeon RX 6800 XT
AMD Ryzen 9 5950X, AMD Radeon RX 6800 XT (Idle: 99.5 W)
447.9 (413min - 484max) Watt * -5%
Gigabyte Aorus GeForce RTX 4070 Ti Master
Intel Core i9-13900K, NVIDIA GeForce RTX 4070 Ti (OC BIOS; 128% PT, Idle: 75.5 W)
446 (436min, 437P1 - 452max) Watt * -5%
Gigabyte Aorus GeForce RTX 4070 Ti Master
Intel Core i9-13900K, NVIDIA GeForce RTX 4070 Ti (OC BIOS; 100% PT, Idle: 75.5 W)
405 (397min, 398P1 - 416max) Watt * +5%
Gigabyte Aorus GeForce RTX 4070 Ti Master
Intel Core i9-13900K, NVIDIA GeForce RTX 4070 Ti (Silent BIOS; 100% PT, Idle: 75.5 W)
404 (396min, 398P1 - 417max) Watt * +5%
Asus TUF Gaming GeForce RTX 4070 Ti
Intel Core i9-13900K, NVIDIA GeForce RTX 4070 Ti (Perf BIOS / 110% PT, Idle: 75.4 W)
443 (440min, 440P1 - 465max) Watt * -4%
Asus TUF Gaming GeForce RTX 4070 Ti
Intel Core i9-13900K, NVIDIA GeForce RTX 4070 Ti (Quiet BIOS / 100% PT, Idle: 75.4 W)
410 (408min, 409P1 - 415max) Watt * +4%
Asus TUF Gaming GeForce RTX 4070 Ti
Intel Core i9-13900K, NVIDIA GeForce RTX 4070 Ti (Perf BIOS / 100% PT, Idle: 75.4 W)
406 (401min, 402P1 - 430max) Watt * +5%
Asus TUF Gaming GeForce RTX 4070 Ti Super
Intel Core i9-13900K, NVIDIA GeForce RTX 4070 Ti SUPER (110% PT, Perf. BIOS, Idle: 138 W)
426 (419min, 420P1 - 452max) Watt *
Asus TUF Gaming GeForce RTX 4070 Ti Super
Intel Core i9-13900K, NVIDIA GeForce RTX 4070 Ti SUPER (100% PT, Perf. BIOS, Idle: 138 W)
395 (389min, 389P1 - 425max) Watt * +7%
Average NVIDIA GeForce RTX 4070 Ti
  (Idle: 404 - 451, n=8 W)
422 Watt * +1%
Average NVIDIA Titan RTX
  (Idle:  W)
419 Watt * +2%
Gigabyte GeForce RTX 4070 Super Gaming OC 12G
Intel Core i9-13900K, NVIDIA GeForce RTX 4070 SUPER (145% PT, BIOS OC, Idle: 122.6 W)
413 (403min, 404P1 - 440max) Watt * +3%
Gigabyte GeForce RTX 4070 Super Gaming OC 12G
Intel Core i9-13900K, NVIDIA GeForce RTX 4070 SUPER (100% PT, BIOS OC, Idle: 122.6 W)
335 (330min, 330P1 - 359max) Watt * +21%
AMD Radeon RX 7800 XT
AMD Ryzen 9 7950X, AMD Radeon RX 7800 XT
408 (375min, 380P1 - 434max) Watt * +4%
Sapphire Pulse Radeon RX 7700 XT
AMD Ryzen 9 7950X, AMD Radeon RX 7700 XT
365 (359min, 360P1 - 373max) Watt * +14%
NVIDIA GeForce RTX 4070 Super Founders Edition
Intel Core i9-13900K, NVIDIA GeForce RTX 4070 SUPER (109% PT, Idle: 114.9 W)
355 (344min, 346P1 - 372max) Watt * +17%
NVIDIA GeForce RTX 4070 Super Founders Edition
Intel Core i9-13900K, NVIDIA GeForce RTX 4070 SUPER (100% PT, Idle: 114.9 W)
333 (321min, 323P1 - 351max) Watt * +22%
Zotac Gaming GeForce RTX 4070 AMP Airo
Intel Core i9-13900K, NVIDIA GeForce RTX 4070 (120% PT, Idle: 94.4 W)
351 (344min, 345P1 - 400max) Watt * +18%
Zotac Gaming GeForce RTX 4070 AMP Airo
Intel Core i9-13900K, NVIDIA GeForce RTX 4070 (100% PT, Idle: 94.4 W)
311 (307min, 307P1 - 371max) Watt * +27%
Average NVIDIA GeForce RTX 3070
  (Idle: 281 - 393, n=6 W)
348 Watt * +18%
XFX Speedster QICK 308 Radeon RX 7600 Black Edition
AMD Ryzen 9 7950X, AMD Radeon RX 7600
333 (323min, 325P1 - 352max) Watt * +22%
Average of class Desktop
  (Idle: 11.3 - 704, n=33, last 2 years W)
307 Watt * +28%
KFA2 GeForce RTX 4060 Ti EX, 16GB GDDR6
AMD Ryzen 9 7950X, NVIDIA GeForce RTX 4060 Ti 16G
304 (297min, 298P1 - 311max) Watt * +29%
KFA2 GeForce RTX 4060 1-Click-OC 2X
AMD Ryzen 9 7950X, NVIDIA GeForce RTX 4060
251 (244min, 245P1 - 259max) Watt * +41%
Power Consumption / The Witcher 3 ultra (external Monitor)
Sapphire AMD Radeon RX 6950 XT Nitro+ Pure
AMD Ryzen 9 5900X, AMD Radeon RX 6950 XT
589 (583min, 584P1 - 598max) Watt * -48%
Zotac Gaming GeForce RTX 3090 Ti AMP Extreme Holo
AMD Ryzen 7 5800X3D, NVIDIA GeForce RTX 3090 Ti (110% PT, Idle: 102 W)
569 (555min, 557P1 - 580max) Watt * -43%
Zotac Gaming GeForce RTX 3090 Ti AMP Extreme Holo
AMD Ryzen 7 5800X3D, NVIDIA GeForce RTX 3090 Ti (100% PT, Idle: 102 W)
561 (533min, 542P1 - 582max) Watt * -41%
NVIDIA GeForce RTX 4090 Founders Edition
Intel Core i9-13900K, NVIDIA GeForce RTX 4090 (133% PT OC, Idle: 81.25 W)
552 (541min, 545P1 - 569max) Watt * -39%
NVIDIA GeForce RTX 4090 Founders Edition
Intel Core i9-13900K, NVIDIA GeForce RTX 4090 (100% PT, Idle: 81.25 W)
499 (493min, 494P1 - 519max) Watt * -25%
AMD Radeon RX 7900 XTX
AMD Ryzen 9 7950X, AMD Radeon RX 7900 XTX (Idle: 86.5 W)
540 (527min, 530P1 - 564max) Watt * -36%
Average NVIDIA GeForce RTX 3090
  (Idle: 464 - 597, n=17 W)
524 Watt * -32%
Average NVIDIA GeForce RTX 3080 Ti
  (Idle: 490 - 528, n=3 W)
506 Watt * -27%
AMD Radeon RX 6800 XT
AMD Ryzen 9 5950X, AMD Radeon RX 6800 XT (Idle: 99.5 W)
505 (389min - 543max) Watt * -27%
Average NVIDIA GeForce RTX 3080
  (Idle: 498 - 505, n=2 W)
502 Watt * -26%
AMD Radeon RX 6900 XT
AMD Ryzen 9 5950X, AMD Radeon RX 6900 XT (Idle: 99.15 W)
488.3 (459.99min - 512.79max) Watt * -23%
NVIDIA GeForce RTX 4080 Founders Edition
Intel Core i9-13900K, NVIDIA GeForce RTX 4080 (110% PT, Idle: 78.45 W)
463 (451min, 453P1 - 481max) Watt * -16%
NVIDIA GeForce RTX 4080 Founders Edition
Intel Core i9-13900K, NVIDIA GeForce RTX 4080 (100% PT, Idle: 78.45 W)
420 (410min, 411P1 - 448max) Watt * -6%
AMD Radeon RX 7900 XT
AMD Ryzen 9 7950X, AMD Radeon RX 7900 XT (Idle: 84.6 W)
459 (451min, 453P1 - 488max) Watt * -15%
KFA2 GeForce RTX 3070 Ti SG
AMD Ryzen 9 7950X, NVIDIA GeForce RTX 3070 Ti (Idle: 88.9 W)
453 (447min, 448P1 - 469max) Watt * -14%
AMD Radeon RX 7800 XT
AMD Ryzen 9 7950X, AMD Radeon RX 7800 XT
425 (421min, 422P1 - 429max) Watt * -7%
Asus TUF Gaming GeForce RTX 4070 Ti
Intel Core i9-13900K, NVIDIA GeForce RTX 4070 Ti (Perf BIOS / 110% PT, Idle: 75.4 W)
422 (412min, 413P1 - 452max) Watt * -6%
Asus TUF Gaming GeForce RTX 4070 Ti
Intel Core i9-13900K, NVIDIA GeForce RTX 4070 Ti (Perf BIOS / 100% PT, Idle: 75.4 W)
419 (414min, 415P1 - 438max) Watt * -5%
Asus TUF Gaming GeForce RTX 4070 Ti
Intel Core i9-13900K, NVIDIA GeForce RTX 4070 Ti (Quiet BIOS / 100% PT, Idle: 75.4 W)
418 (411min, 412P1 - 433max) Watt * -5%
Average NVIDIA GeForce RTX 4070 Ti
  (Idle: 404 - 426, n=8 W)
415 Watt * -4%
Gigabyte Aorus GeForce RTX 4070 Ti Master
Intel Core i9-13900K, NVIDIA GeForce RTX 4070 Ti (Silent BIOS; 100% PT, Idle: 75.5 W)
414 (406min, 407P1 - 432max) Watt * -4%
Gigabyte Aorus GeForce RTX 4070 Ti Master
Intel Core i9-13900K, NVIDIA GeForce RTX 4070 Ti (OC BIOS; 128% PT, Idle: 75.5 W)
410 (401min, 403P1 - 435max) Watt * -3%
Gigabyte Aorus GeForce RTX 4070 Ti Master
Intel Core i9-13900K, NVIDIA GeForce RTX 4070 Ti (OC BIOS; 100% PT, Idle: 75.5 W)
404 (397min, 398P1 - 427max) Watt * -2%
Average NVIDIA Titan RTX
  (Idle: 371 - 463, n=27 W)
408 Watt * -3%
Average NVIDIA GeForce RTX 3070
  (Idle: 317 - 550, n=5 W)
401 Watt * -1%
Asus TUF Gaming GeForce RTX 4070 Ti Super
Intel Core i9-13900K, NVIDIA GeForce RTX 4070 Ti SUPER (110% PT, Perf. BIOS, Idle: 138 W)
398 (386min, 387P1 - 431max) Watt *
Asus TUF Gaming GeForce RTX 4070 Ti Super
Intel Core i9-13900K, NVIDIA GeForce RTX 4070 Ti SUPER (100% PT, Perf. BIOS, Idle: 138 W)
393 (382min, 383P1 - 420max) Watt * +1%
Gigabyte GeForce RTX 4070 Super Gaming OC 12G
Intel Core i9-13900K, NVIDIA GeForce RTX 4070 SUPER (100% PT, BIOS OC, Idle: 122.6 W)
388 (373min, 375P1 - 438max) Watt * +3%
Gigabyte GeForce RTX 4070 Super Gaming OC 12G
Intel Core i9-13900K, NVIDIA GeForce RTX 4070 SUPER (145% PT, BIOS OC, Idle: 122.6 W)
388 (377min, 377P1 - 418max) Watt * +3%
Sapphire Pulse Radeon RX 7700 XT
AMD Ryzen 9 7950X, AMD Radeon RX 7700 XT
384 (379min, 380P1 - 391max) Watt * +4%
NVIDIA GeForce RTX 4070 Super Founders Edition
Intel Core i9-13900K, NVIDIA GeForce RTX 4070 SUPER (109% PT, Idle: 114.9 W)
377 (365min, 366P1 - 407max) Watt * +5%
NVIDIA GeForce RTX 4070 Super Founders Edition
Intel Core i9-13900K, NVIDIA GeForce RTX 4070 SUPER (100% PT, Idle: 114.9 W)
372 (359min, 361P1 - 402max) Watt * +7%
Zotac Gaming GeForce RTX 4070 AMP Airo
Intel Core i9-13900K, NVIDIA GeForce RTX 4070 (120% PT, Idle: 94.4 W)
358 (348min, 350P1 - 400max) Watt * +10%
Zotac Gaming GeForce RTX 4070 AMP Airo
Intel Core i9-13900K, NVIDIA GeForce RTX 4070 (100% PT, Idle: 94.4 W)
353 (347min, 348P1 - 440max) Watt * +11%
Average of class Desktop
  (Idle: 19.1 - 569, n=37, last 2 years W)
354 Watt * +11%
XFX Speedster QICK 308 Radeon RX 7600 Black Edition
AMD Ryzen 9 7950X, AMD Radeon RX 7600
346 (340min, 341P1 - 351max) Watt * +13%
KFA2 GeForce RTX 4060 Ti EX, 16GB GDDR6
AMD Ryzen 9 7950X, NVIDIA GeForce RTX 4060 Ti 16G
310 (306min, 307P1 - 336max) Watt * +22%
KFA2 GeForce RTX 4060 1-Click-OC 2X
AMD Ryzen 9 7950X, NVIDIA GeForce RTX 4060
272 (264min, 266P1 - 297max) Watt * +32%
Power Consumption / Witcher 3 ultra Efficiency (external Monitor)
AMD Radeon RX 7900 XT
AMD Ryzen 9 7950X, AMD Radeon RX 7900 XT
0.577 fps per Watt +9%
AMD Radeon RX 7900 XTX
AMD Ryzen 9 7950X, AMD Radeon RX 7900 XTX
0.55 fps per Watt +4%
NVIDIA GeForce RTX 4080 Founders Edition
Intel Core i9-13900K, NVIDIA GeForce RTX 4080
0.549 fps per Watt +4%
Asus TUF Gaming GeForce RTX 4070 Ti
Intel Core i9-13900K, NVIDIA GeForce RTX 4070 Ti
0.545 fps per Watt +3%
Gigabyte GeForce RTX 4070 Super Gaming OC 12G
Intel Core i9-13900K, NVIDIA GeForce RTX 4070 SUPER
0.541 fps per Watt +2%
NVIDIA GeForce RTX 4090 Founders Edition
Intel Core i9-13900K, NVIDIA GeForce RTX 4090
0.538 fps per Watt +2%
Average NVIDIA GeForce RTX 4070 Ti
  (0.509 - 0.548, n=4)
0.533 fps per Watt +1%
Gigabyte Aorus GeForce RTX 4070 Ti Master
Intel Core i9-13900K, NVIDIA GeForce RTX 4070 Ti
0.531 fps per Watt +1%
Asus TUF Gaming GeForce RTX 4070 Ti Super
Intel Core i9-13900K, NVIDIA GeForce RTX 4070 Ti SUPER
0.528 fps per Watt
NVIDIA GeForce RTX 4070 Super Founders Edition
Intel Core i9-13900K, NVIDIA GeForce RTX 4070 SUPER
0.509 fps per Watt -4%
Zotac Gaming GeForce RTX 4070 AMP Airo
Intel Core i9-13900K, NVIDIA GeForce RTX 4070
0.4709 fps per Watt -11%
AMD Radeon RX 7800 XT
AMD Ryzen 9 7950X, AMD Radeon RX 7800 XT
0.4461 fps per Watt -16%
Sapphire Pulse Radeon RX 7700 XT
AMD Ryzen 9 7950X, AMD Radeon RX 7700 XT
0.4383 fps per Watt -17%
Average of class Desktop
  (0.1429 - 0.652, n=26, last 2 years)
0.437 fps per Watt -17%
KFA2 GeForce RTX 4060 Ti EX, 16GB GDDR6
AMD Ryzen 9 7950X, NVIDIA GeForce RTX 4060 Ti 16G
0.4268 fps per Watt -19%
KFA2 GeForce RTX 4060 1-Click-OC 2X
AMD Ryzen 9 7950X, NVIDIA GeForce RTX 4060
0.4103 fps per Watt -22%
Average NVIDIA GeForce RTX 3080 Ti
  (0.3496 - 0.3735, n=3)
0.3607 fps per Watt -32%
XFX Speedster QICK 308 Radeon RX 7600 Black Edition
AMD Ryzen 9 7950X, AMD Radeon RX 7600
0.354 fps per Watt -33%
Sapphire AMD Radeon RX 6950 XT Nitro+ Pure
AMD Ryzen 9 5900X, AMD Radeon RX 6950 XT
0.348 fps per Watt -34%
Zotac Gaming GeForce RTX 3090 Ti AMP Extreme Holo
AMD Ryzen 7 5800X3D, NVIDIA GeForce RTX 3090 Ti
0.345 fps per Watt -35%
Average NVIDIA GeForce RTX 3090
  (0.268 - 0.3954, n=14)
0.3429 fps per Watt -35%
Average NVIDIA Titan RTX
  (0.2926 - 0.385, n=26)
0.3382 fps per Watt -36%
AMD Radeon RX 6900 XT
AMD Ryzen 9 5950X, AMD Radeon RX 6900 XT
0.335 fps per Watt -37%
KFA2 GeForce RTX 3070 Ti SG
AMD Ryzen 9 7950X, NVIDIA GeForce RTX 3070 Ti
0.3241 fps per Watt -39%
Average NVIDIA GeForce RTX 3070
  (0.22 - 0.3911, n=5)
0.3211 fps per Watt -39%
AMD Radeon RX 6800 XT
AMD Ryzen 9 5950X, AMD Radeon RX 6800 XT
0.3168 fps per Watt -40%
Average NVIDIA GeForce RTX 3080
  (0.291 - 0.301, n=2)
0.296 fps per Watt -44%
1280x720 FurMark 1.19 GPU Stress Test (external Monitor)
350.77
1920x1080 The Witcher 3 ultra (external Monitor)
357.59

* ... smaller is better

Pros

+ 坚固耐用的全金属结构,附加 HDMI 2.1a 输出接口
+ AD103 GPU,256 位 16 GB VRAM
+ 性能可与 Radeon RX 7900 XT 和 RTX 3090 Ti 相媲美
+ 风扇噪音低,能效高
+ 建议零售价

Cons

- 与最初的 RTX 4070 Ti 相比没有实质性提升
- 负载情况下表面温度更高
- 性能模式和静音 VBIOS 模式的风扇噪音没有明显差异
- 超频潜力有限

结论最初的 RTX 4070 Ti 本应如此

华硕 TUF GamingGeForce RTX 4070 Ti Super。评测机由华硕印度公司提供。

RTX 4070 Ti Super 取代了原来的 原来的 RTX 4070 Ti以相同的 799 美元建议零售价。与 RTX 4070 Super不同,RTX 4070 Ti Super 的着色器比 RTX 4070 Ti 增加了 21%。 相比,RTX 4070相比,RTX 4070 Ti Super 的 CUDA 内核比 RTX 4070 Ti 增加了 10%,这在实际游戏场景中可能并不总能带来实际收益。

不过,向 AD103 芯片的过渡意味着,RTX 4070 Ti Super 现在是一款更 "完整的中端 GPU",它可以与像 RTX 4080和 RTX 4080 Super 同桌吃饭。一个随之而来的好处是更快的 256 位内存子系统和 AD104 根本无法支持的 16 GB GDDR6X VRAM。

就其本身而言,华硕 TUF GamingGeForce RTX 4070 Ti Super 提供了一流的制造质量、新增的端口以及基于参考规格的出色性能。虽然也有 OC SKU,但经过测试的 799 美元基本 SKU 提供了充分利用最新 AD103 入门产品所需的一切。

基于 AD103 的新款华硕 TUF GamingGeForce RTX 4070 Ti Super 在 1440p 超高帧率游戏中表现出色,同时还提供了不错的 4K 超高清和计算能力,因此 799 美元的售价值得认真考虑。

华硕为 TUF GamingGeForce RTX 4070 Ti Super 配备了强大的散热系统。虽然表面温度似乎偏高,但三风扇六热管散热系统让 AD103 GPU 的性能没有节流问题,风扇噪音水平也在可承受范围内。

RTX 4070 Ti Super 在 1440p 超高清游戏中的表现非常出色,但坦率地说,它在这种分辨率下的表现已经过剩。如果你的主要目标是 1440p 游戏,并且不太涉足计算工作负载,那么选择 RTX 4070 Super 可以节省 200 美元。

AMD Radeon RX 7900 XT松景 Speedster MERC310(亚马逊上售价 740 美元)或华硕 TUF Gaming RX 7900 XT OC(亚马逊上售价 880 美元)等显卡也是可行的选择,尤其是当你只优先考虑光栅性能并对 FSR 升频感到满意时。

尽管如此,TUF Gaming RTX 4070 Ti Super 的光线追踪能力更强,支持 DLSS 3 帧生成和 DLSS 3.5 光线重构,因此整体性能更胜一筹。

有趣的是,考虑到 RTX 3090 Ti的价格是当年 MSRP 的 2.5 倍。

价格和供应情况

华硕 TUF GamingGeForce RTX 4070 Ti Super 在美国百思买的基本款售价为 800 美元,而 OC SKU 售价为 850 美元

在印度,TUF GamingGeForce RTX 4070 Ti Super 的官方售价为 9.5 万英镑,实际价格取决于经销商。印度亚马逊目前提供该显卡的 OC 版,售价为 1,08,499 英镑。

Transparency

The present review sample was made available to the author as a loan by the manufacturer or a shop for the purposes of review. The lender had no influence on this review, nor did the manufacturer receive a copy of this review before publication. There was no obligation to publish this review.

Pricecompare

Please share our article, every link counts!
> Notebookcheck中文版(NBC中国) > 评测 > 华硕 TUF GamingGeForce RTX 4070 Ti 超级评测:AD103 中端游戏机,挑战 RX 7900 XT 并取代 RTX 3090 Ti,售价低 300 美元
Vaidyanathan Subramaniam, 2024-02-25 (Update: 2024-02-25)