华为 P10 智能手机简短评测
| Networking | |
| iperf3 transmit AX12 | |
| Apple iPhone 7 (Klaus I211) | |
| Huawei P10 | |
| Samsung Galaxy S7 | |
| Huawei P9 | |
| iperf3 receive AX12 | |
| Apple iPhone 7 (Klaus I211) | |
| Huawei P10 | |
| Samsung Galaxy S7 | |
| Huawei P9 | |


| |||||||||||||||||||||||||
Brightness Distribution: 86 %
Center on Battery: 547 cd/m²
Contrast: 1272:1 (Black: 0.43 cd/m²)
ΔE ColorChecker Calman: 4.8 | ∀{0.5-29.43 Ø4.73}
ΔE Greyscale Calman: 4.5 | ∀{0.09-98 Ø4.97}
Gamma: 2.39
CCT: 7194 K
| Huawei P10 LTPS, 1920x1080, 5.1" | Huawei P9 IPS-NEO, JDI, 1920x1080, 5.2" | Huawei P8 IPS-NEO, 1920x1080, 5.2" | Samsung Galaxy S7 SAMOLED, 2560x1440, 5.1" | Apple iPhone 7 IPS, 1334x750, 4.7" | Sony Xperia XZ IPS, 1920x1080, 5.2" | HTC 10 Super LCD 5, 2560x1440, 5.2" | |
|---|---|---|---|---|---|---|---|
| Screen | 8% | 3% | 21% | 31% | -8% | 9% | |
| Brightness middle (cd/m²) | 547 | 582 6% | 453 -17% | 350 -36% | 556 2% | 544 -1% | 445 -19% |
| Brightness (cd/m²) | 556 | 563 1% | 439 -21% | 351 -37% | 519 -7% | 521 -6% | 434 -22% |
| Brightness Distribution (%) | 86 | 91 6% | 91 6% | 98 14% | 90 5% | 93 8% | 93 8% |
| Black Level * (cd/m²) | 0.43 | 0.38 12% | 0.28 35% | 0.34 21% | 0.37 14% | 0.36 16% | |
| Contrast (:1) | 1272 | 1532 20% | 1618 27% | 1635 29% | 1470 16% | 1236 -3% | |
| Colorchecker dE 2000 * | 4.8 | 4.4 8% | 4.7 2% | 2.04 57% | 1.3 73% | 5.8 -21% | 2.8 42% |
| Colorchecker dE 2000 max. * | 8.8 | 7.4 16% | 3.25 63% | 2.6 70% | 9.8 -11% | 5.8 34% | |
| Greyscale dE 2000 * | 4.5 | 4.8 -7% | 5.03 -12% | 1.63 64% | 1.9 58% | 7.2 -60% | 3.7 18% |
| Gamma | 2.39 92% | 2.2 100% | 2.27 97% | 2.07 106% | 2.26 97% | 2.18 101% | 2.31 95% |
| CCT | 7194 90% | 6175 105% | 7439 87% | 6391 102% | 6818 95% | 8619 75% | 7164 91% |
| Color Space (Percent of AdobeRGB 1998) (%) | 77.78 | 72.04 | 86.86 | 63.15 | |||
| Color Space (Percent of sRGB) (%) | 99.44 | 99.35 | 99.71 |
* ... smaller is better
Screen Flickering / PWM (Pulse-Width Modulation)
| Screen flickering / PWM not detected | 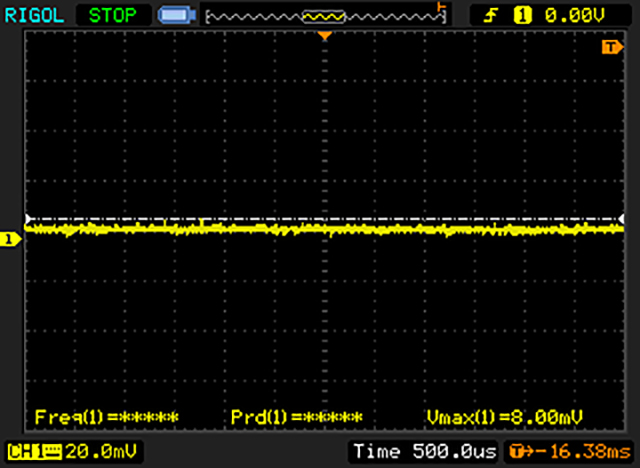 | ||
In comparison: 52 % of all tested devices do not use PWM to dim the display. If PWM was detected, an average of 7798 (minimum: 5 - maximum: 343500) Hz was measured. | |||
Display Response Times
| ↔ Response Time Black to White | ||
|---|---|---|
| 16 ms ... rise ↗ and fall ↘ combined | ↗ 5.2 ms rise | 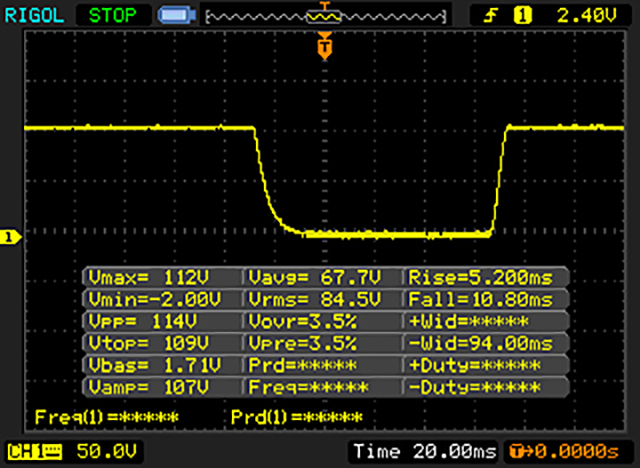 |
| ↘ 10.8 ms fall | ||
| The screen shows good response rates in our tests, but may be too slow for competitive gamers. In comparison, all tested devices range from 0.1 (minimum) to 240 (maximum) ms. » 37 % of all devices are better. This means that the measured response time is better than the average of all tested devices (19.9 ms). | ||
| ↔ Response Time 50% Grey to 80% Grey | ||
| 39.6 ms ... rise ↗ and fall ↘ combined | ↗ 19.6 ms rise | 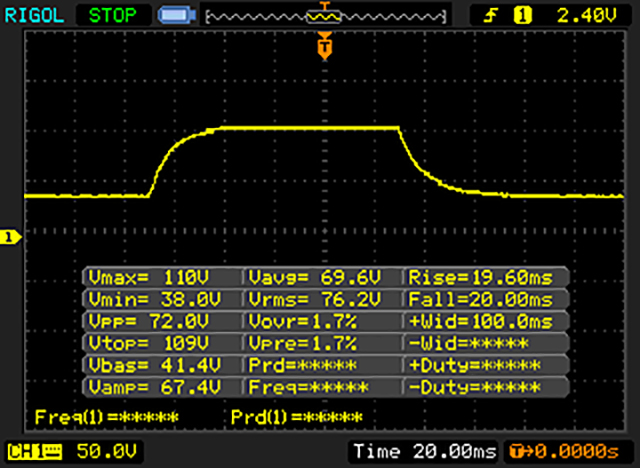 |
| ↘ 20 ms fall | ||
| The screen shows slow response rates in our tests and will be unsatisfactory for gamers. In comparison, all tested devices range from 0.165 (minimum) to 636 (maximum) ms. » 60 % of all devices are better. This means that the measured response time is worse than the average of all tested devices (31.1 ms). | ||
| AnTuTu v6 - Total Score (sort by value) | |
| Huawei P10 | |
| Huawei P9 | |
| Samsung Galaxy S7 Edge | |
| Apple iPhone 7 | |
| Lenovo Moto Z | |
| Sony Xperia XZ | |
| HTC 10 | |
| Huawei Mate 9 | |
| OnePlus 3T | |
| Geekbench 4.0 | |
| 64 Bit Single-Core Score (sort by value) | |
| Huawei P10 | |
| Huawei P9 | |
| Samsung Galaxy S7 Edge | |
| Apple iPhone 7 | |
| Lenovo Moto Z | |
| Sony Xperia XZ | |
| Huawei Mate 9 | |
| OnePlus 3T | |
| 64 Bit Multi-Core Score (sort by value) | |
| Huawei P10 | |
| Huawei P9 | |
| Samsung Galaxy S7 Edge | |
| Apple iPhone 7 | |
| Lenovo Moto Z | |
| Sony Xperia XZ | |
| Huawei Mate 9 | |
| OnePlus 3T | |
| GFXBench (DX / GLBenchmark) 2.7 | |
| T-Rex Onscreen (sort by value) | |
| Huawei P10 | |
| Huawei P9 | |
| Samsung Galaxy S7 Edge | |
| Apple iPhone 7 | |
| Lenovo Moto Z | |
| Sony Xperia XZ | |
| HTC 10 | |
| Huawei Mate 9 | |
| OnePlus 3T | |
| 1920x1080 T-Rex Offscreen (sort by value) | |
| Huawei P10 | |
| Huawei P9 | |
| Samsung Galaxy S7 Edge | |
| Apple iPhone 7 | |
| Lenovo Moto Z | |
| Sony Xperia XZ | |
| HTC 10 | |
| Huawei Mate 9 | |
| OnePlus 3T | |
| GFXBench 3.0 | |
| on screen Manhattan Onscreen OGL (sort by value) | |
| Huawei P10 | |
| Huawei P9 | |
| Samsung Galaxy S7 Edge | |
| Apple iPhone 7 | |
| Lenovo Moto Z | |
| Sony Xperia XZ | |
| HTC 10 | |
| Huawei Mate 9 | |
| OnePlus 3T | |
| 1920x1080 1080p Manhattan Offscreen (sort by value) | |
| Huawei P10 | |
| Huawei P9 | |
| Samsung Galaxy S7 Edge | |
| Apple iPhone 7 | |
| Lenovo Moto Z | |
| Sony Xperia XZ | |
| HTC 10 | |
| Huawei Mate 9 | |
| OnePlus 3T | |
| GFXBench 3.1 | |
| on screen Manhattan ES 3.1 Onscreen (sort by value) | |
| Huawei P10 | |
| Huawei P9 | |
| Samsung Galaxy S7 Edge | |
| Apple iPhone 7 | |
| Lenovo Moto Z | |
| Sony Xperia XZ | |
| HTC 10 | |
| Huawei Mate 9 | |
| OnePlus 3T | |
| 1920x1080 Manhattan ES 3.1 Offscreen (sort by value) | |
| Huawei P10 | |
| Huawei P9 | |
| Samsung Galaxy S7 Edge | |
| Apple iPhone 7 | |
| Lenovo Moto Z | |
| Sony Xperia XZ | |
| HTC 10 | |
| Huawei Mate 9 | |
| OnePlus 3T | |
| PCMark for Android | |
| Work performance score (sort by value) | |
| Huawei P10 | |
| Huawei P9 | |
| Samsung Galaxy S7 Edge | |
| Lenovo Moto Z | |
| Sony Xperia XZ | |
| HTC 10 | |
| Huawei Mate 9 | |
| OnePlus 3T | |
| Work 2.0 performance score (sort by value) | |
| Huawei P10 | |
| Huawei P9 | |
| Sony Xperia XZ | |
| HTC 10 | |
| Huawei Mate 9 | |
| Lightmark - 1920x1080 1080p (sort by value) | |
| Huawei P10 | |
| Huawei P9 | |
| Samsung Galaxy S7 Edge | |
| Lenovo Moto Z | |
| Huawei Mate 9 | |
| Basemark ES 3.1 / Metal - offscreen Overall Score (sort by value) | |
| Huawei P10 | |
| Huawei P9 | |
| Samsung Galaxy S7 Edge | |
| Apple iPhone 7 | |
| Apple iPhone 7 | |
| Lenovo Moto Z | |
| HTC 10 | |
| Huawei Mate 9 | |
| Epic Citadel - Ultra High Quality (sort by value) | |
| Huawei P10 | |
| Huawei P9 | |
| Samsung Galaxy S7 Edge | |
| Lenovo Moto Z | |
| Huawei Mate 9 | |
| WebXPRT 2015 - Overall (sort by value) | |
| Huawei P10 | |
| Huawei P9 | |
| Samsung Galaxy S7 Edge | |
| Apple iPhone 7 | |
| Lenovo Moto Z | |
| Sony Xperia XZ | |
| HTC 10 | |
| Huawei Mate 9 | |
| OnePlus 3T | |
| BaseMark OS II - Web (sort by value) | |
| Huawei P10 | |
| Huawei P9 | |
| Samsung Galaxy S7 Edge | |
| Apple iPhone 7 | |
| Lenovo Moto Z | |
| Sony Xperia XZ | |
| HTC 10 | |
| Huawei Mate 9 | |
| OnePlus 3T | |
| Octane V2 - Total Score (sort by value) | |
| Huawei P10 | |
| Huawei P9 | |
| Samsung Galaxy S7 Edge | |
| Apple iPhone 7 | |
| Lenovo Moto Z | |
| Sony Xperia XZ | |
| HTC 10 | |
| Huawei Mate 9 | |
| OnePlus 3T | |
| Mozilla Kraken 1.1 - Total (sort by value) | |
| Huawei P10 | |
| Huawei P9 | |
| Samsung Galaxy S7 Edge | |
| Apple iPhone 7 | |
| Lenovo Moto Z | |
| Sony Xperia XZ | |
| HTC 10 | |
| Huawei Mate 9 | |
| OnePlus 3T | |
| JetStream 1.1 - 1.1 Total (sort by value) | |
| Huawei P10 | |
| Huawei P9 | |
| Samsung Galaxy S7 Edge | |
| Apple iPhone 7 | |
| Lenovo Moto Z | |
| Sony Xperia XZ | |
| HTC 10 | |
| Huawei Mate 9 | |
| OnePlus 3T | |
| Vellamo 3.x - Browser (sort by value) | |
| Huawei P10 | |
| Huawei P9 | |
| Samsung Galaxy S7 Edge | |
| Lenovo Moto Z | |
| Huawei Mate 9 | |
* ... smaller is better
| Huawei P10 | Huawei P9 | Lenovo Moto Z | Sony Xperia XZ | HTC 10 | Samsung Galaxy S7 | LG G5 | ZTE Axon 7 | |
|---|---|---|---|---|---|---|---|---|
| AndroBench 3-5 | -49% | -8% | -48% | -20% | -16% | -20% | -13% | |
| Sequential Read 256KB (MB/s) | 738 | 281.3 -62% | 439.7 -40% | 281 -62% | 275.1 -63% | 483.8 -34% | 427.6 -42% | 406.5 -45% |
| Sequential Write 256KB (MB/s) | 189.8 | 72.2 -62% | 168.3 -11% | 138 -27% | 115.6 -39% | 145.7 -23% | 141.3 -26% | 150.9 -20% |
| Random Read 4KB (MB/s) | 168.4 | 39 -77% | 117.2 -30% | 71.5 -58% | 29.92 -82% | 85.9 -49% | 89.3 -47% | 121.1 -28% |
| Random Write 4KB (MB/s) | 152.3 | 47.45 -69% | 74.9 -51% | 10.5 -93% | 15.89 -90% | 16.01 -89% | 16.22 -89% | 16.22 -89% |
| Sequential Read 256KB SDCard (MB/s) | 54.2 | 55 1% | 78.5 45% | 33.5 -38% | 83.3 54% | 72.3 33% | 78.5 45% | 78.4 45% |
| Sequential Write 256KB SDCard (MB/s) | 32.19 | 24.83 -23% | 45.64 42% | 29.8 -7% | 65.4 103% | 53.6 67% | 45.53 41% | 51.3 59% |
(±) The maximum temperature on the upper side is 44.6 °C / 112 F, compared to the average of 35.3 °C / 96 F, ranging from 21.9 to 247 °C for the class Smartphone.
(±) The bottom heats up to a maximum of 40.9 °C / 106 F, compared to the average of 34 °C / 93 F
(±) In idle usage, the average temperature for the upper side is 32.1 °C / 90 F, compared to the device average of 32.9 °C / 91 F.
Huawei P10 audio analysis
(+) | speakers can play relatively loud (82.7 dB)
Bass 100 - 315 Hz
(-) | nearly no bass - on average 20.9% lower than median
(±) | linearity of bass is average (12.6% delta to prev. frequency)
Mids 400 - 2000 Hz
(+) | balanced mids - only 4.2% away from median
(+) | mids are linear (6% delta to prev. frequency)
Highs 2 - 16 kHz
(±) | higher highs - on average 5.4% higher than median
(+) | highs are linear (4.9% delta to prev. frequency)
Overall 100 - 16.000 Hz
(±) | linearity of overall sound is average (23.6% difference to median)
Compared to same class
» 54% of all tested devices in this class were better, 8% similar, 38% worse
» The best had a delta of 11%, average was 34%, worst was 134%
Compared to all devices tested
» 71% of all tested devices were better, 6% similar, 23% worse
» The best had a delta of 4%, average was 24%, worst was 134%
Apple iPhone 7 audio analysis
(+) | speakers can play relatively loud (83.1 dB)
Bass 100 - 315 Hz
(-) | nearly no bass - on average 21.8% lower than median
(±) | linearity of bass is average (9.5% delta to prev. frequency)
Mids 400 - 2000 Hz
(+) | balanced mids - only 4.3% away from median
(+) | mids are linear (6% delta to prev. frequency)
Highs 2 - 16 kHz
(±) | higher highs - on average 5.9% higher than median
(±) | linearity of highs is average (8.2% delta to prev. frequency)
Overall 100 - 16.000 Hz
(±) | linearity of overall sound is average (20.9% difference to median)
Compared to same class
» 39% of all tested devices in this class were better, 8% similar, 53% worse
» The best had a delta of 11%, average was 34%, worst was 134%
Compared to all devices tested
» 57% of all tested devices were better, 8% similar, 36% worse
» The best had a delta of 4%, average was 24%, worst was 134%
Samsung Galaxy S7 Edge audio analysis
(+) | speakers can play relatively loud (88.7 dB)
Bass 100 - 315 Hz
(-) | nearly no bass - on average 27.4% lower than median
(±) | linearity of bass is average (8.7% delta to prev. frequency)
Mids 400 - 2000 Hz
(+) | balanced mids - only 4.4% away from median
(+) | mids are linear (4.7% delta to prev. frequency)
Highs 2 - 16 kHz
(±) | higher highs - on average 5.8% higher than median
(+) | highs are linear (6.2% delta to prev. frequency)
Overall 100 - 16.000 Hz
(±) | linearity of overall sound is average (20.6% difference to median)
Compared to same class
» 36% of all tested devices in this class were better, 9% similar, 55% worse
» The best had a delta of 11%, average was 34%, worst was 134%
Compared to all devices tested
» 55% of all tested devices were better, 8% similar, 37% worse
» The best had a delta of 4%, average was 24%, worst was 134%
| Off / Standby | |
| Idle | |
| Load |
|
Key:
min: | |
| Huawei P10 3200 mAh | Huawei P9 3000 mAh | HTC 10 3000 mAh | Samsung Galaxy S7 3000 mAh | Apple iPhone 7 1960 mAh | Lenovo ZUK Z2 3500 mAh | Xiaomi Mi 5s 3200 mAh | |
|---|---|---|---|---|---|---|---|
| Power Consumption | 16% | 8% | 34% | 36% | -1% | 20% | |
| Idle Minimum * (Watt) | 0.83 | 0.77 7% | 0.68 18% | 0.68 18% | 0.54 35% | 1.31 -58% | 0.4 52% |
| Idle Average * (Watt) | 2.1 | 2.36 -12% | 1.49 29% | 1.02 51% | 1.51 28% | 2.03 3% | 1.7 19% |
| Idle Maximum * (Watt) | 2.18 | 2.37 -9% | 1.91 12% | 1.14 48% | 1.54 29% | 2.08 5% | 1.81 17% |
| Load Average * (Watt) | 6.57 | 3.09 53% | 7.4 -13% | 4.73 28% | 3.75 43% | 5.45 17% | 5.84 11% |
| Load Maximum * (Watt) | 9.32 | 5.35 43% | 9.71 -4% | 7.16 23% | 5.01 46% | 6.75 28% | 9.12 2% |
* ... smaller is better
| Huawei P10 3200 mAh | Huawei P9 3000 mAh | Samsung Galaxy S7 3000 mAh | Apple iPhone 7 1960 mAh | HTC 10 3000 mAh | Lenovo ZUK Z2 3500 mAh | Lenovo Moto Z 2600 mAh | |
|---|---|---|---|---|---|---|---|
| Battery runtime | -7% | 14% | -9% | -12% | -43% | 10% | |
| Reader / Idle (h) | 25.7 | 25.2 -2% | 30.2 18% | 29.5 15% | 21.2 -18% | 22.9 -11% | |
| H.264 (h) | 9.7 | 9.5 -2% | 14.9 54% | 12 24% | 10.8 11% | 12.1 25% | |
| WiFi v1.3 (h) | 16.1 | 9.5 -41% | 7.6 -53% | 8.6 -47% | 6.9 -57% | 9.1 -43% | 6.8 -58% |
| Load (h) | 2.9 | 3.4 17% | 4 38% | 2.1 -28% | 3.4 17% | 5.3 83% |
Pros
Cons
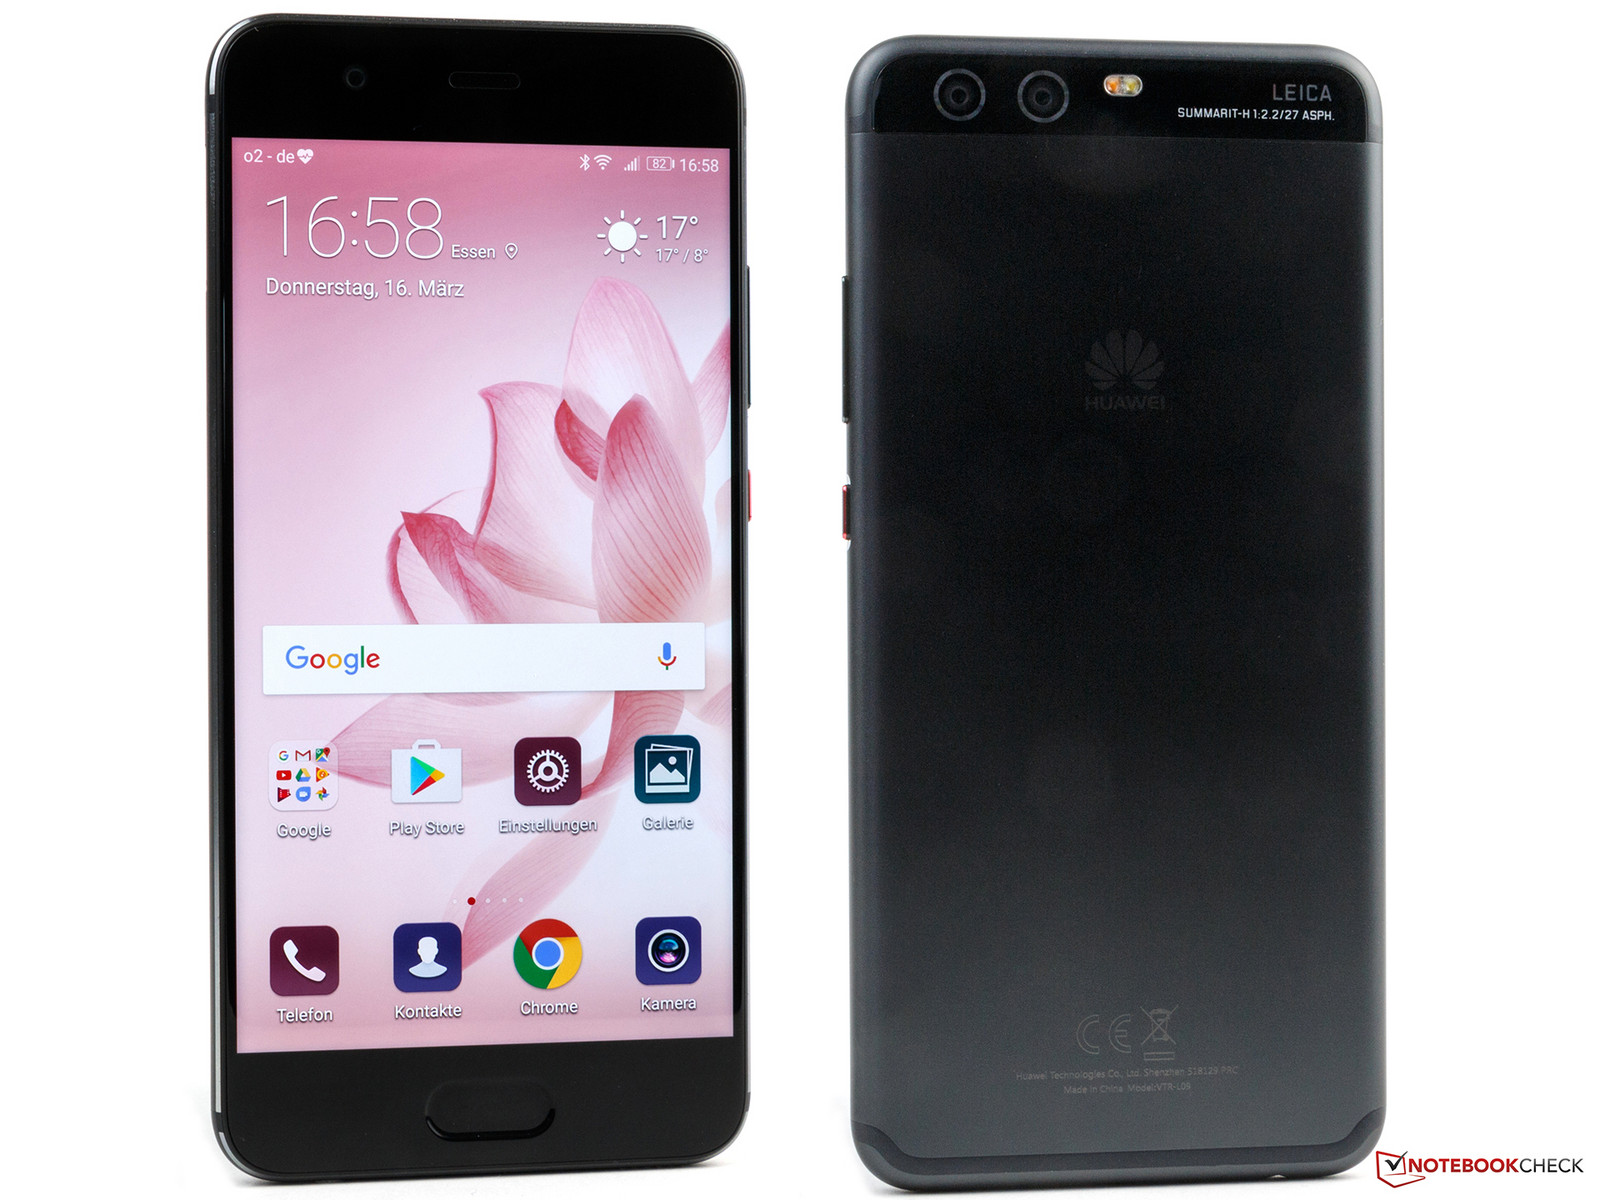
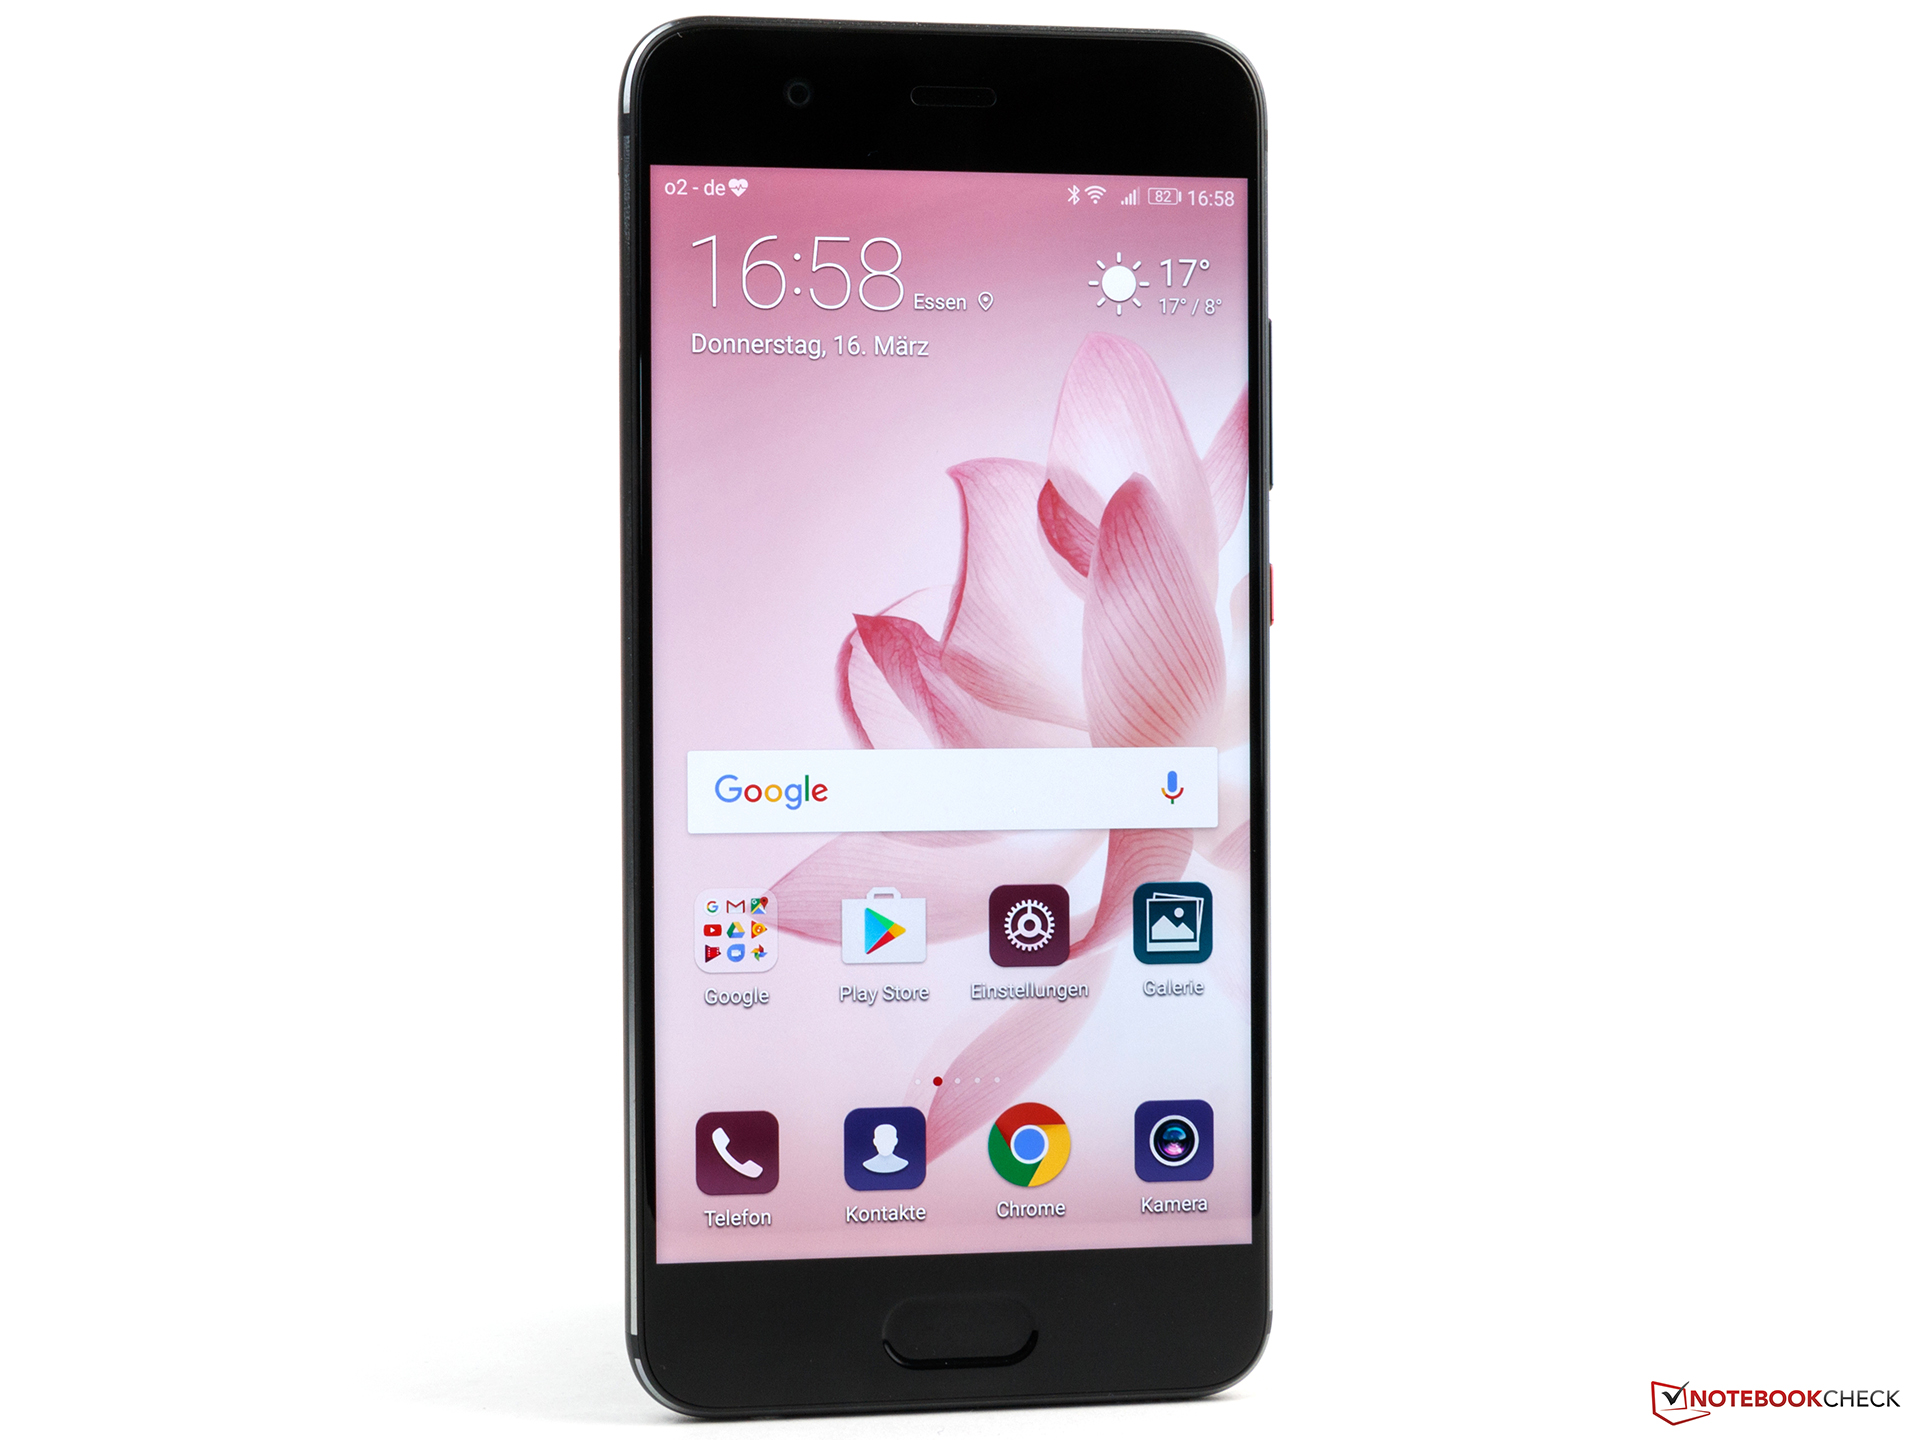
华为再一次带来了一款出色的产品,P10智能手机几乎无懈可击。和它同系列的P10 Plus版本才是真正的旗舰机型。不过,这款尺寸稍小的型号也搭载了一些一流的功能,如UFS 2.1闪存,LTE Cat.12网络模组,和极速Kirin 960处理器,配置相似的设备价位都相对更高。
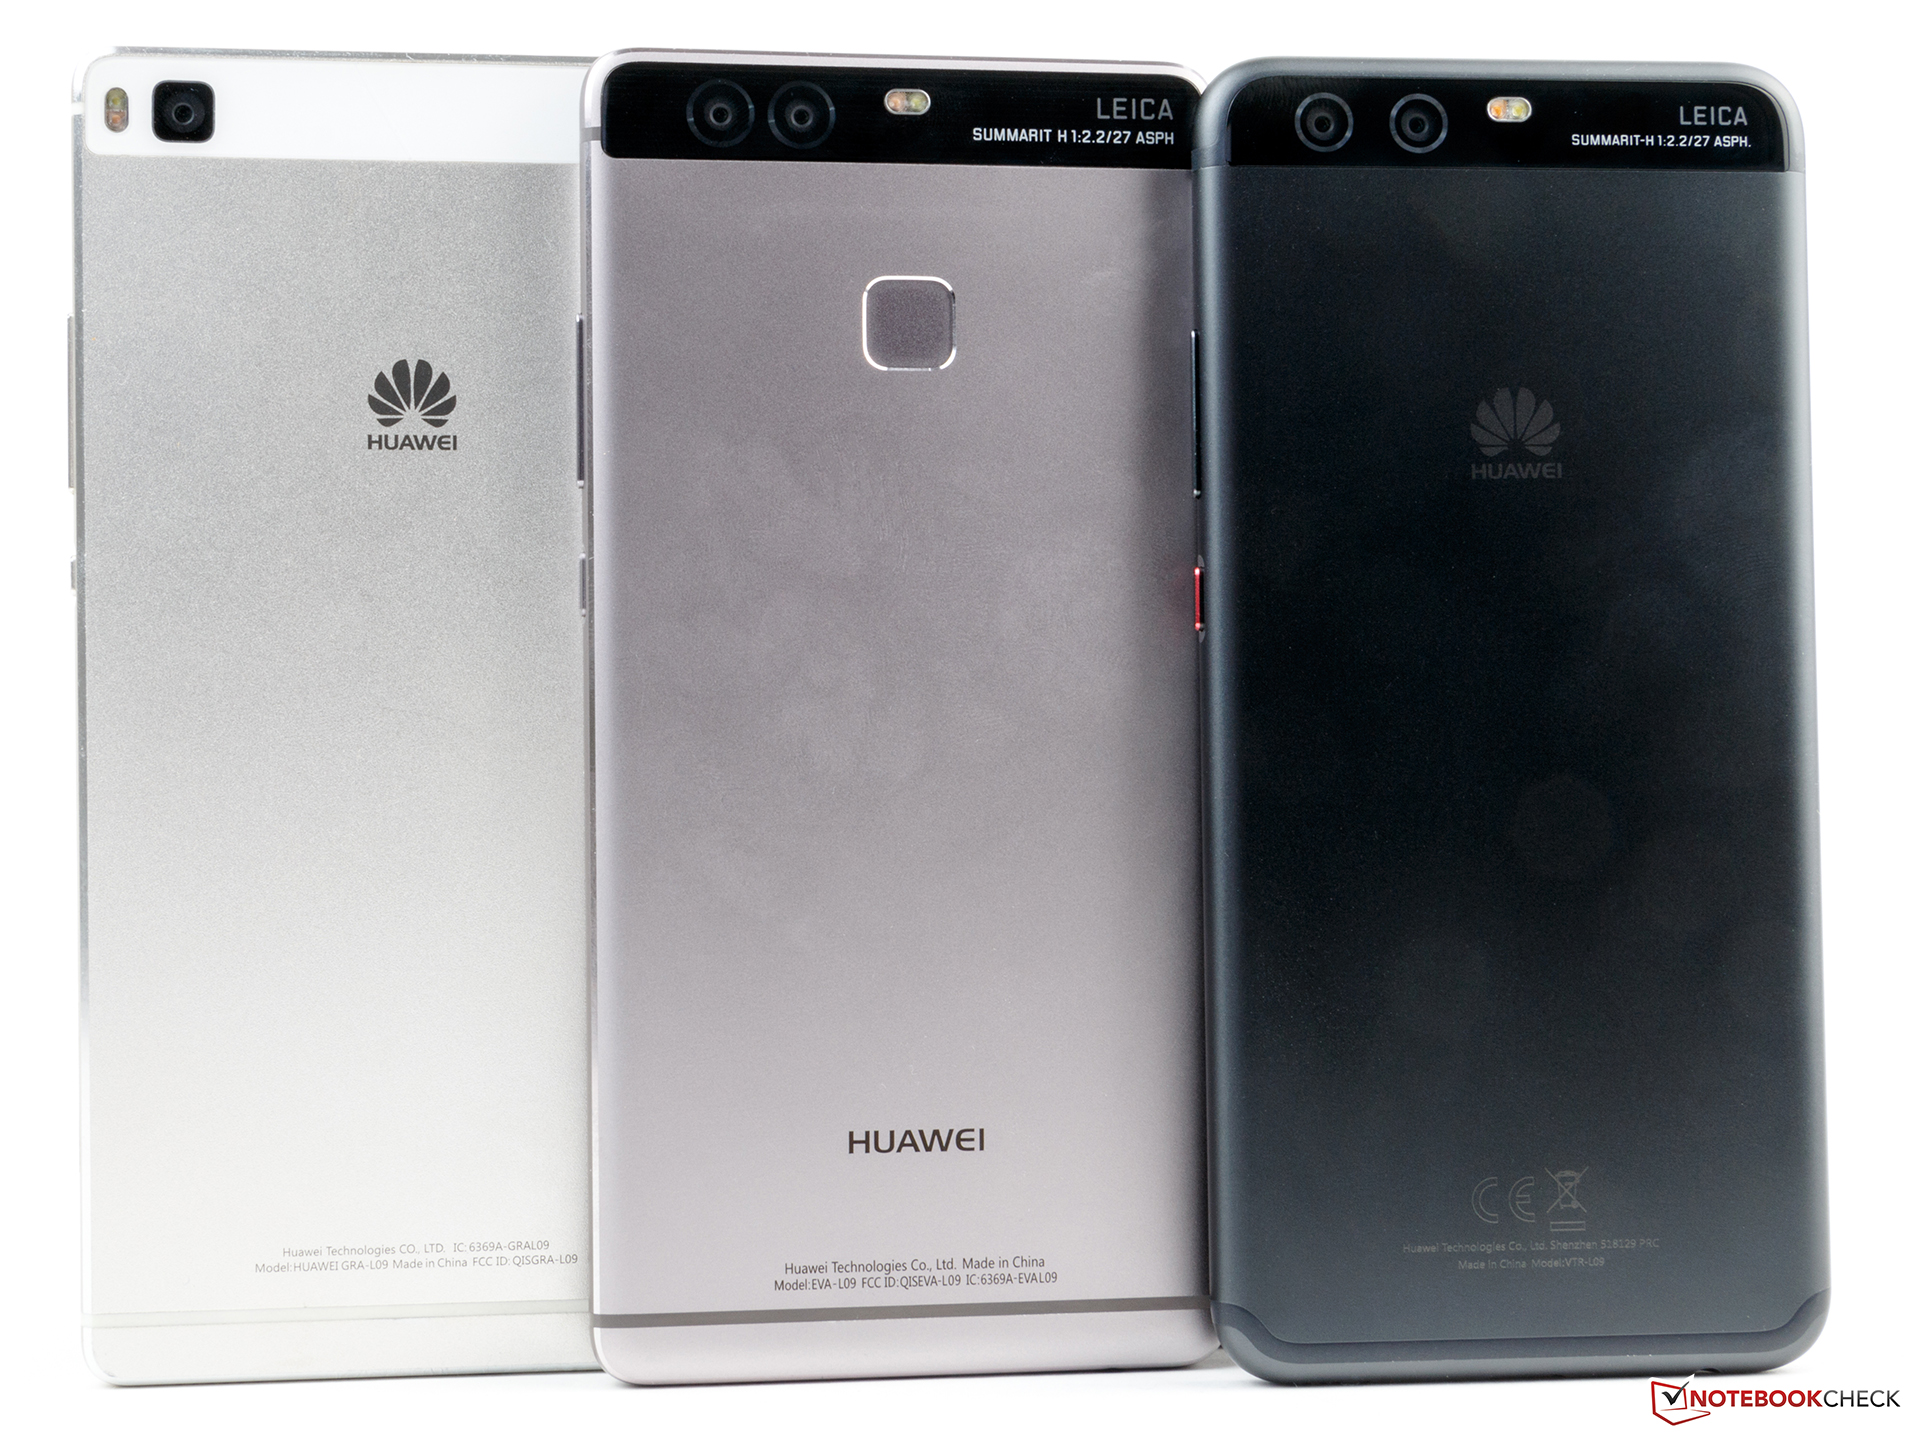
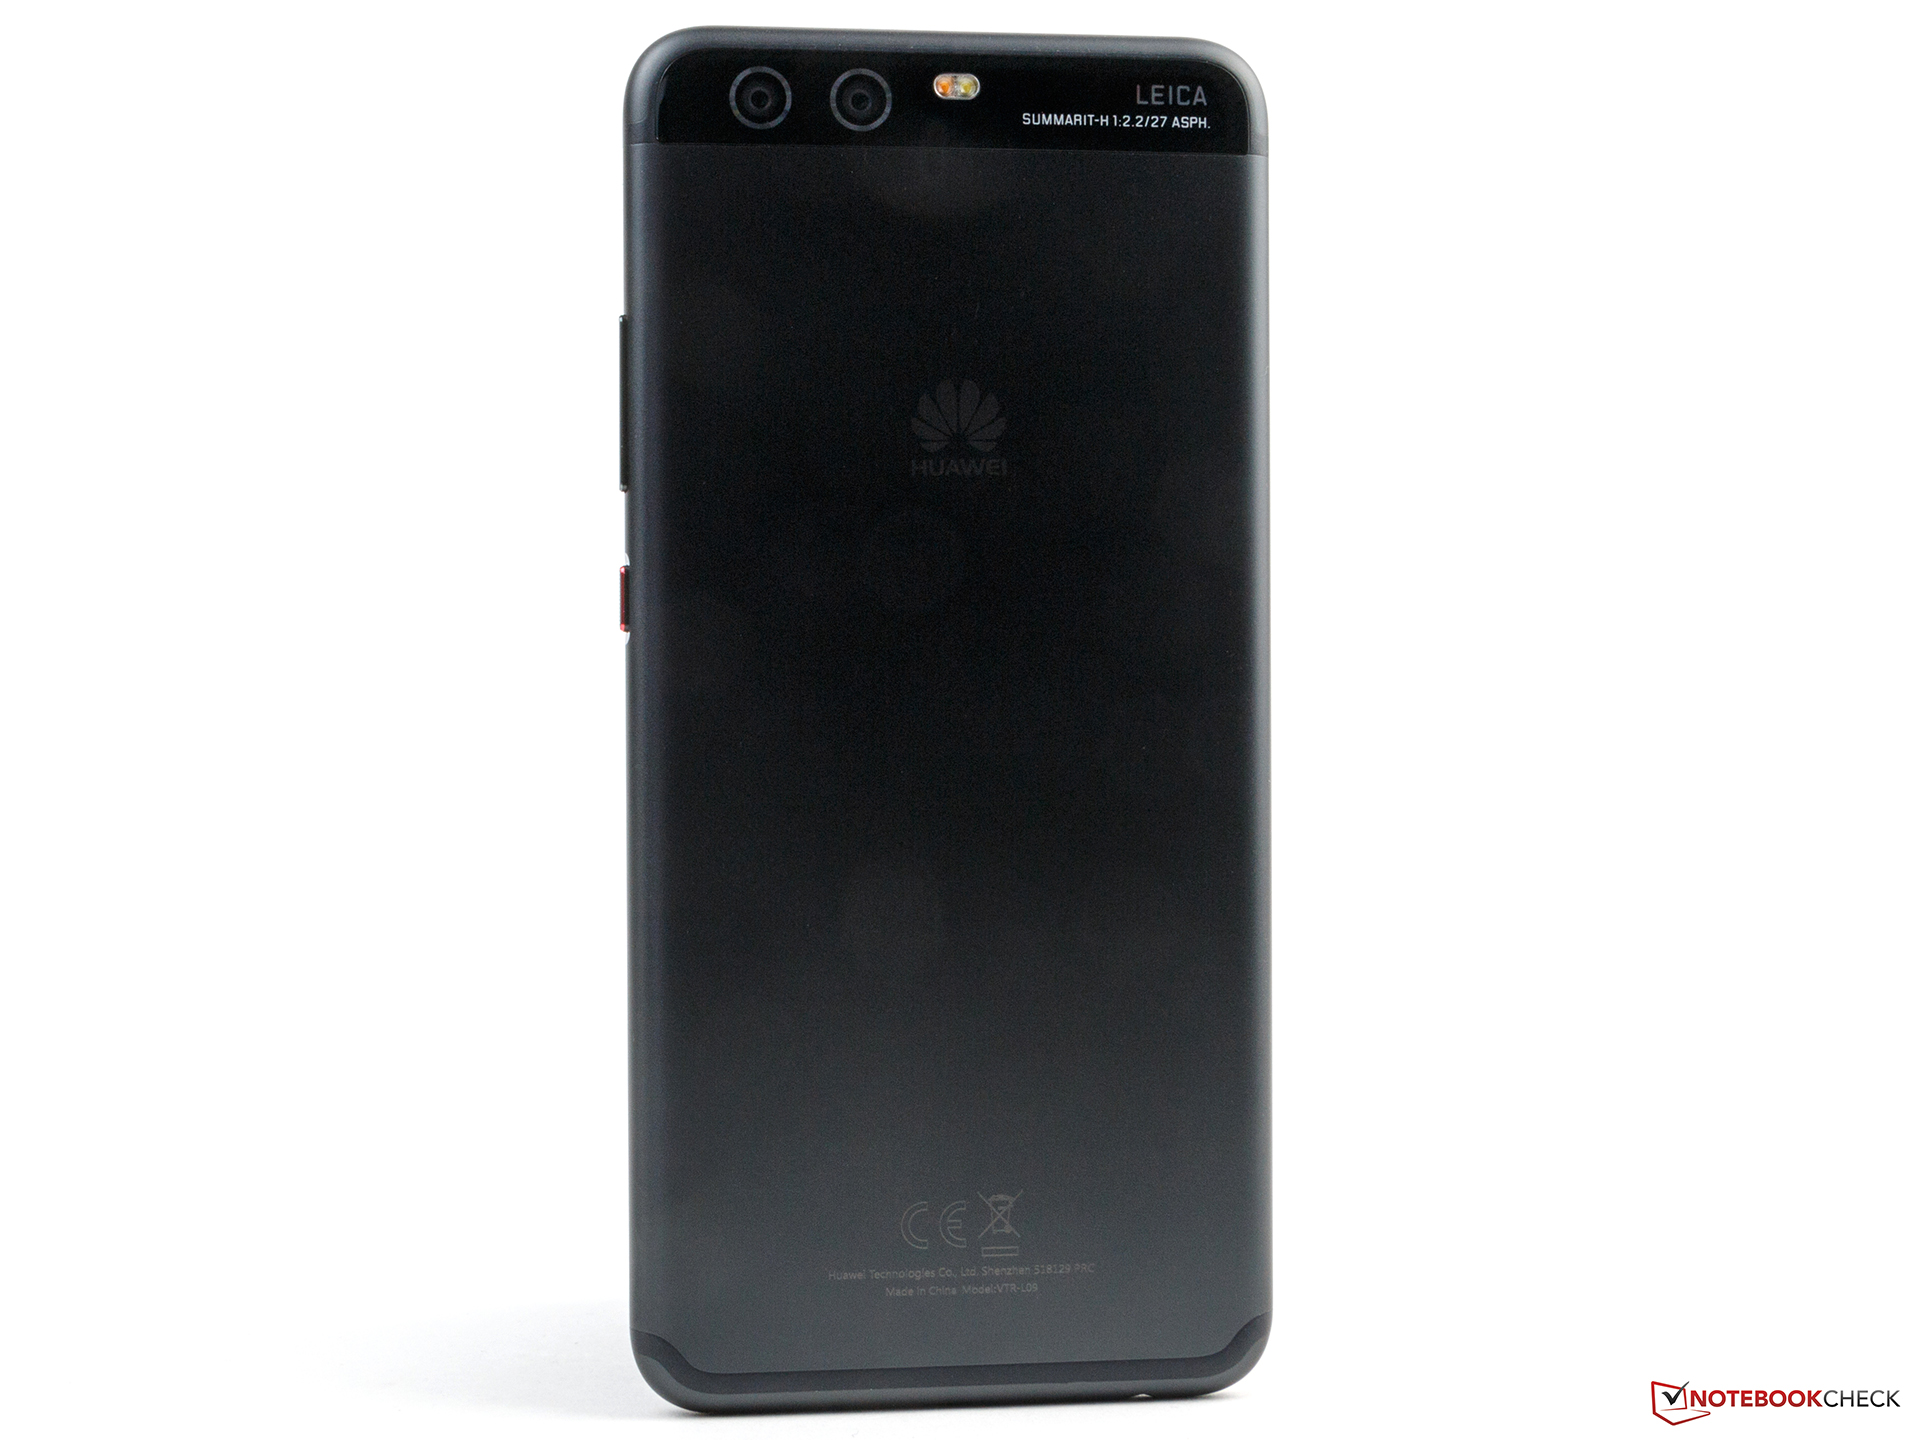
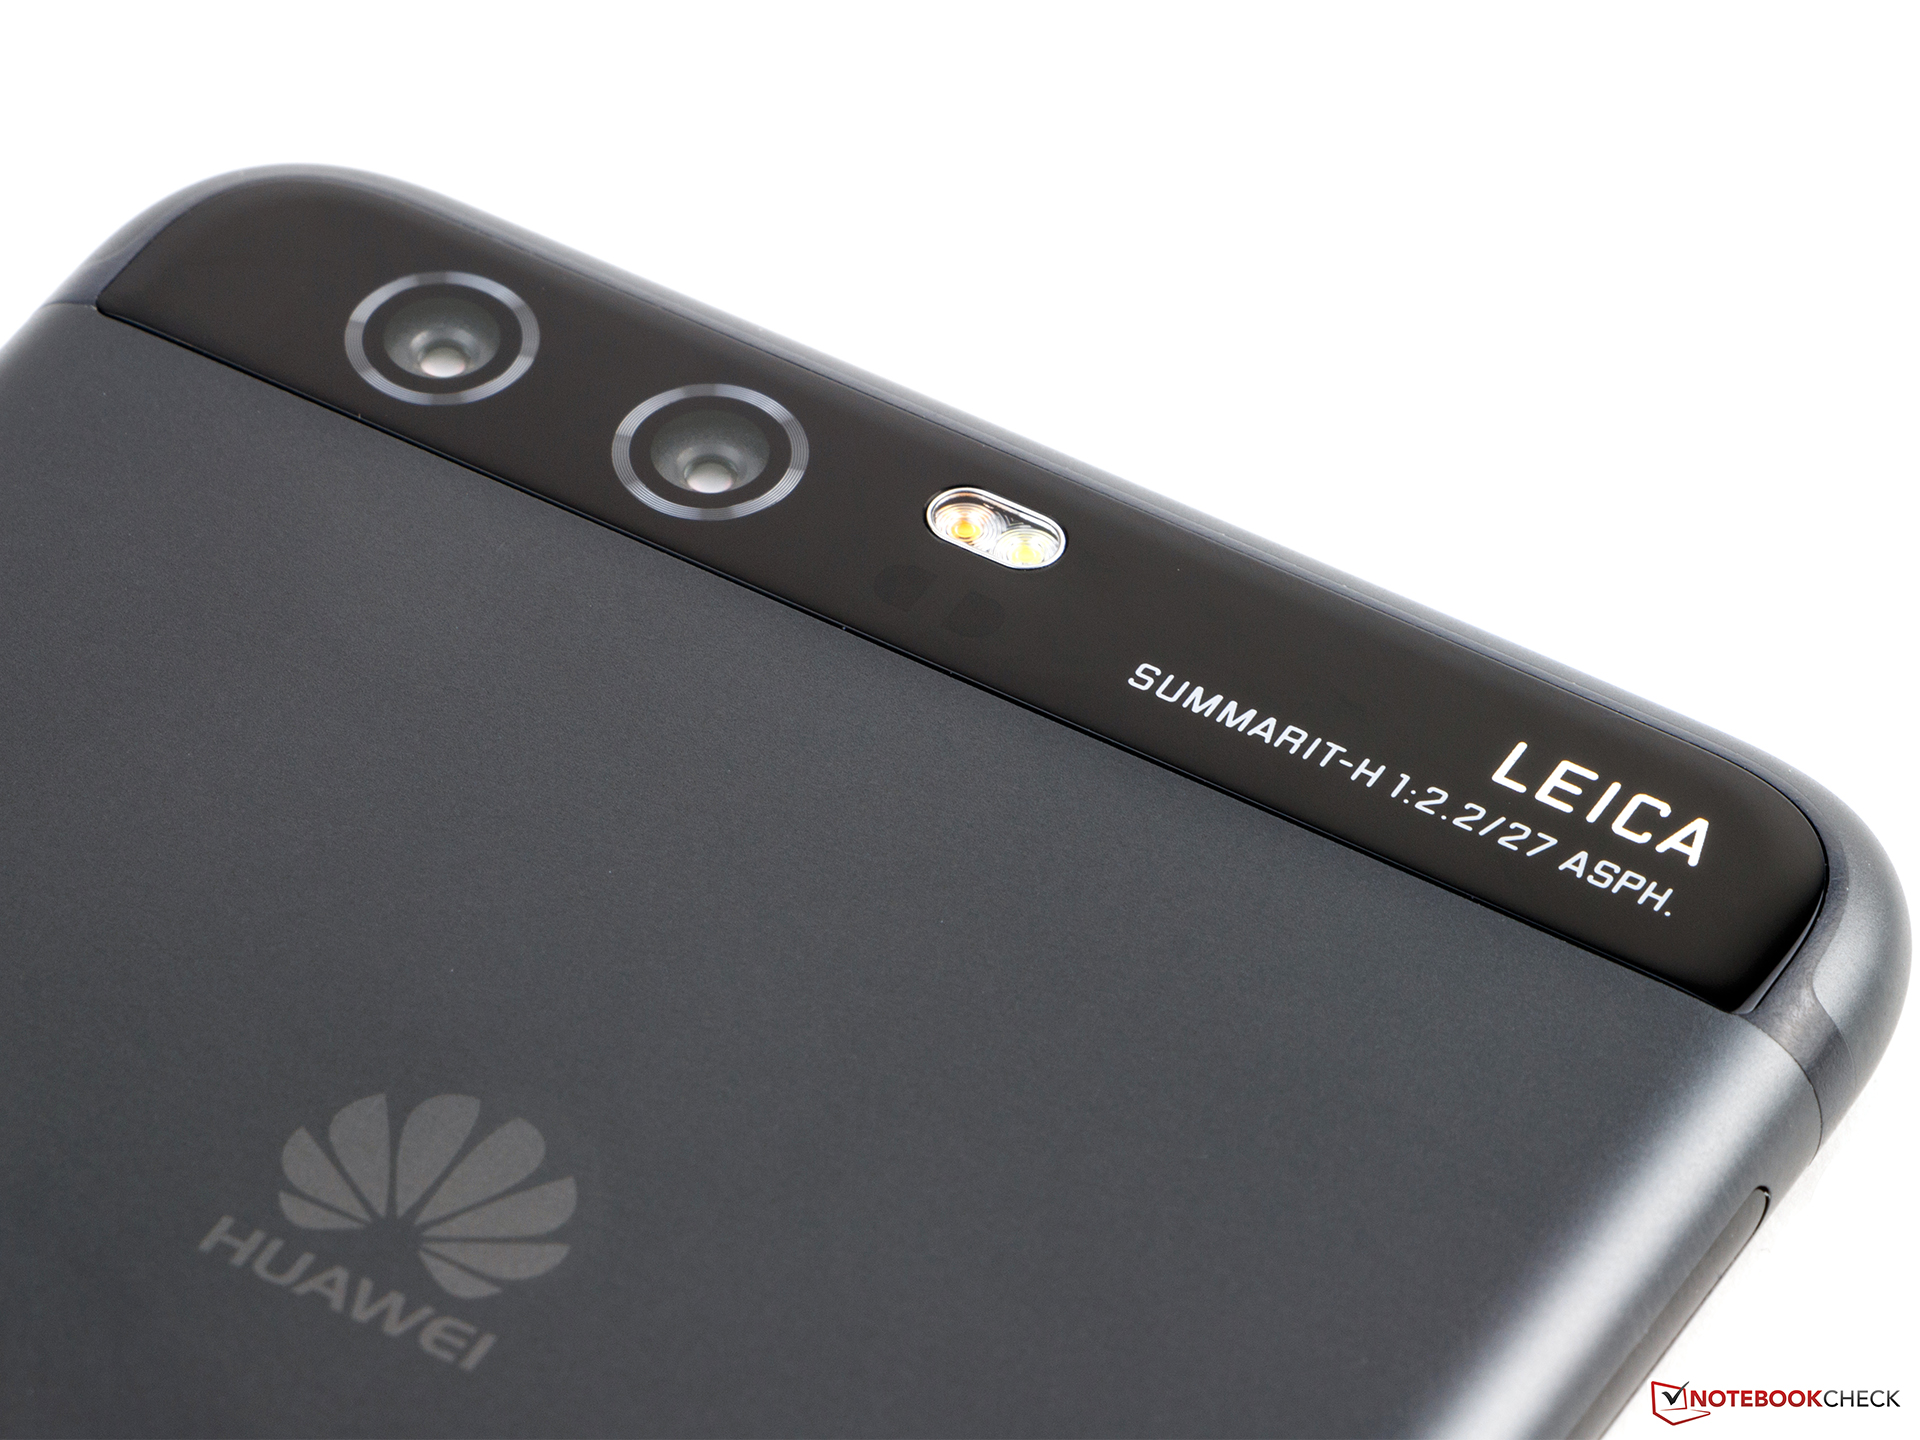
我们也十分喜欢它的徕卡双镜头相机,尽管在技术上它还有改进的空间,不过已经可以拍摄品质超高的照片。内置的人像模式十分优秀,可以提供独特的景深效果。它的电池续航也得到了改进。
华为P10是一台成功的更新,优秀的相机和改进的电池续航都可以让人心服口服。
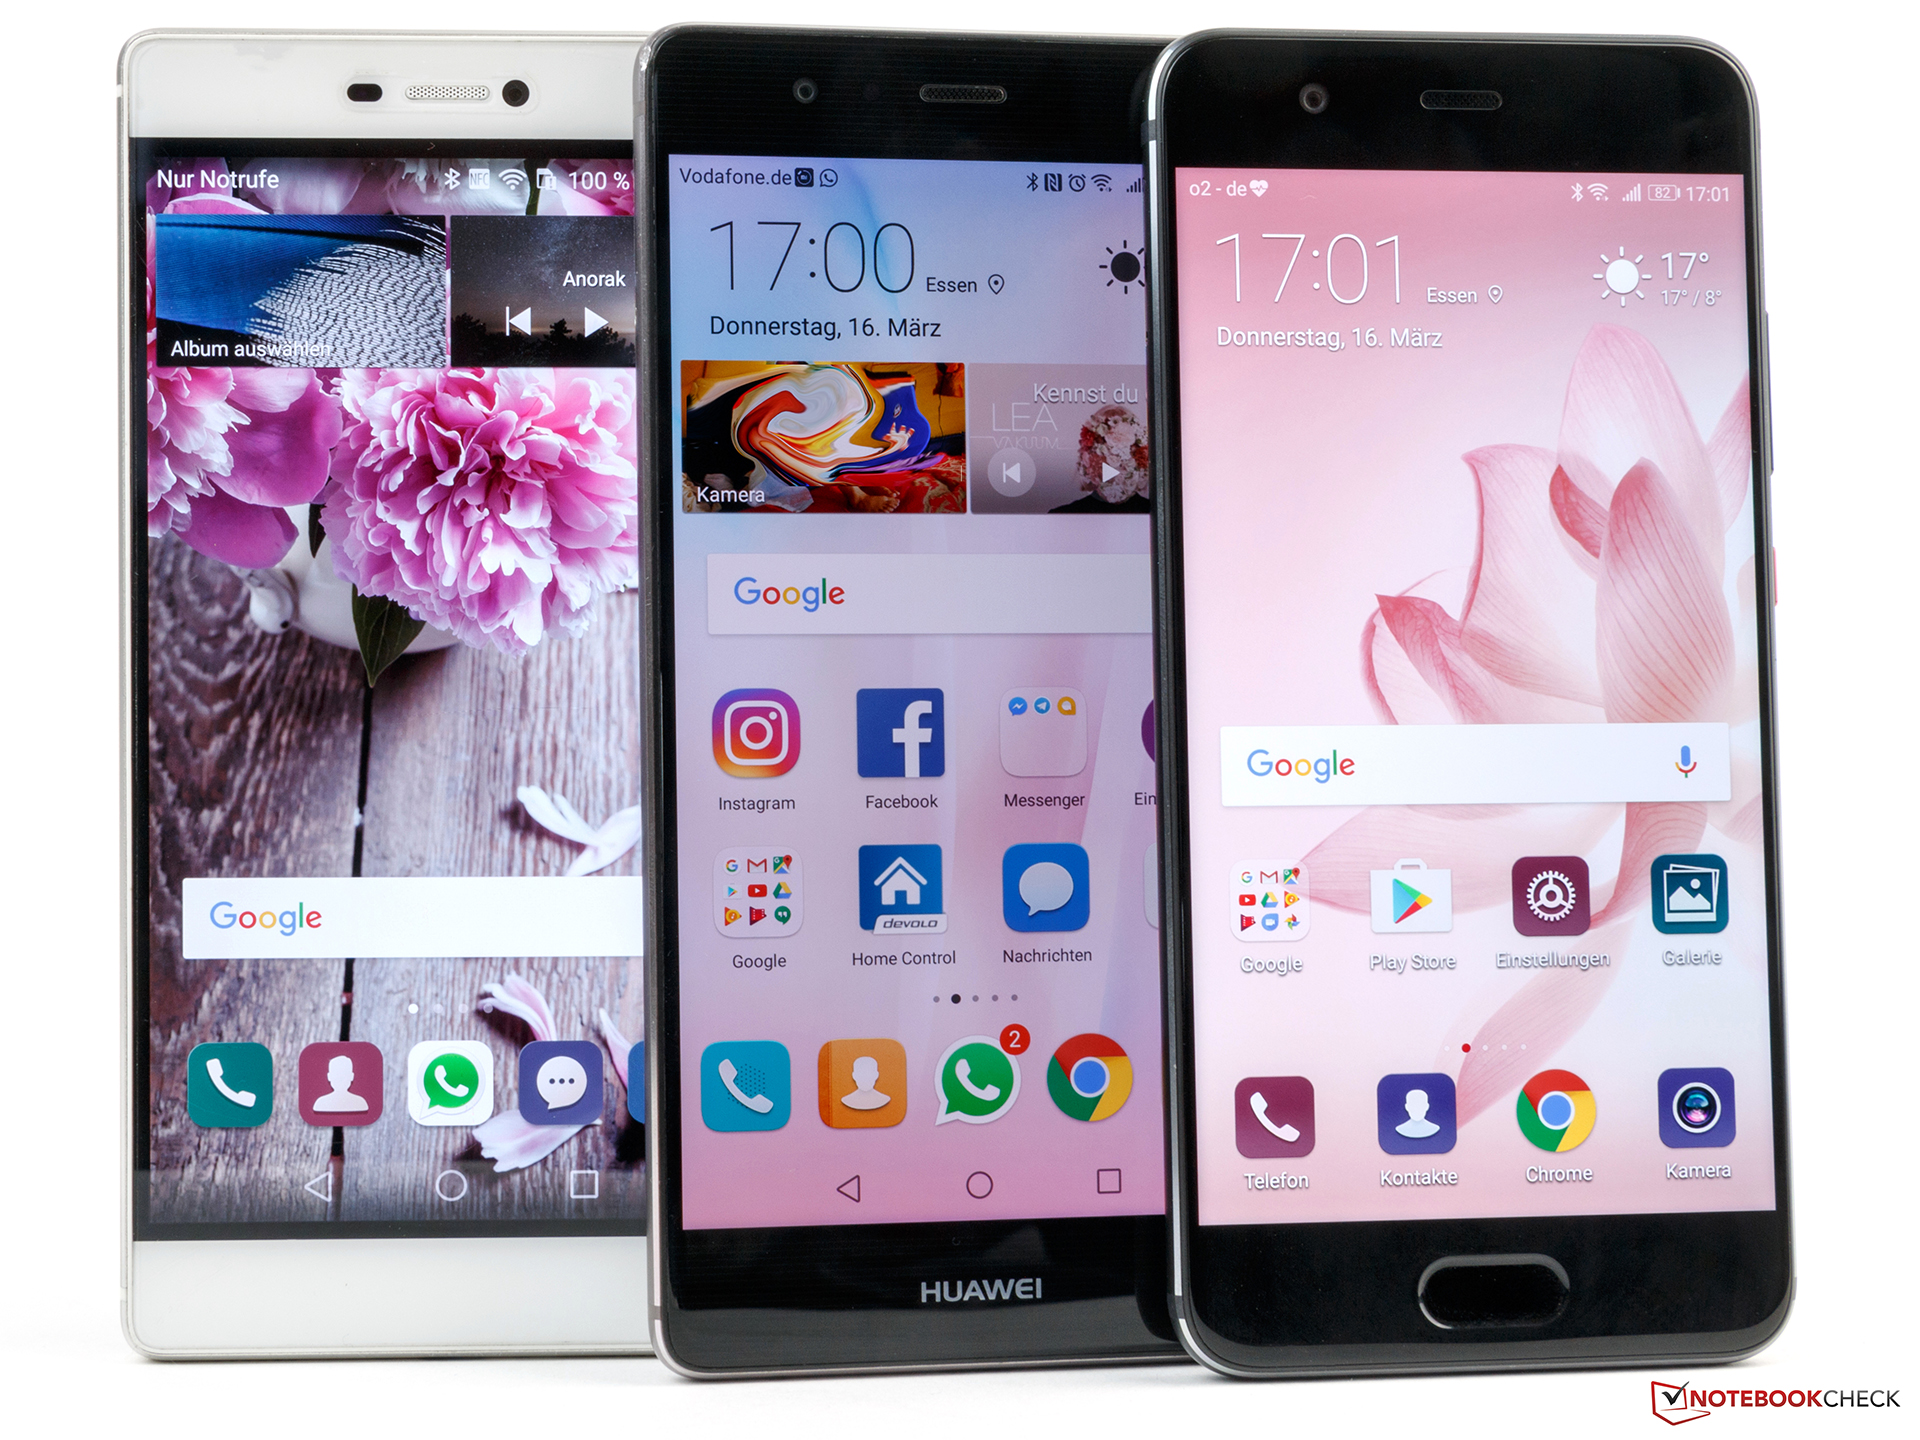
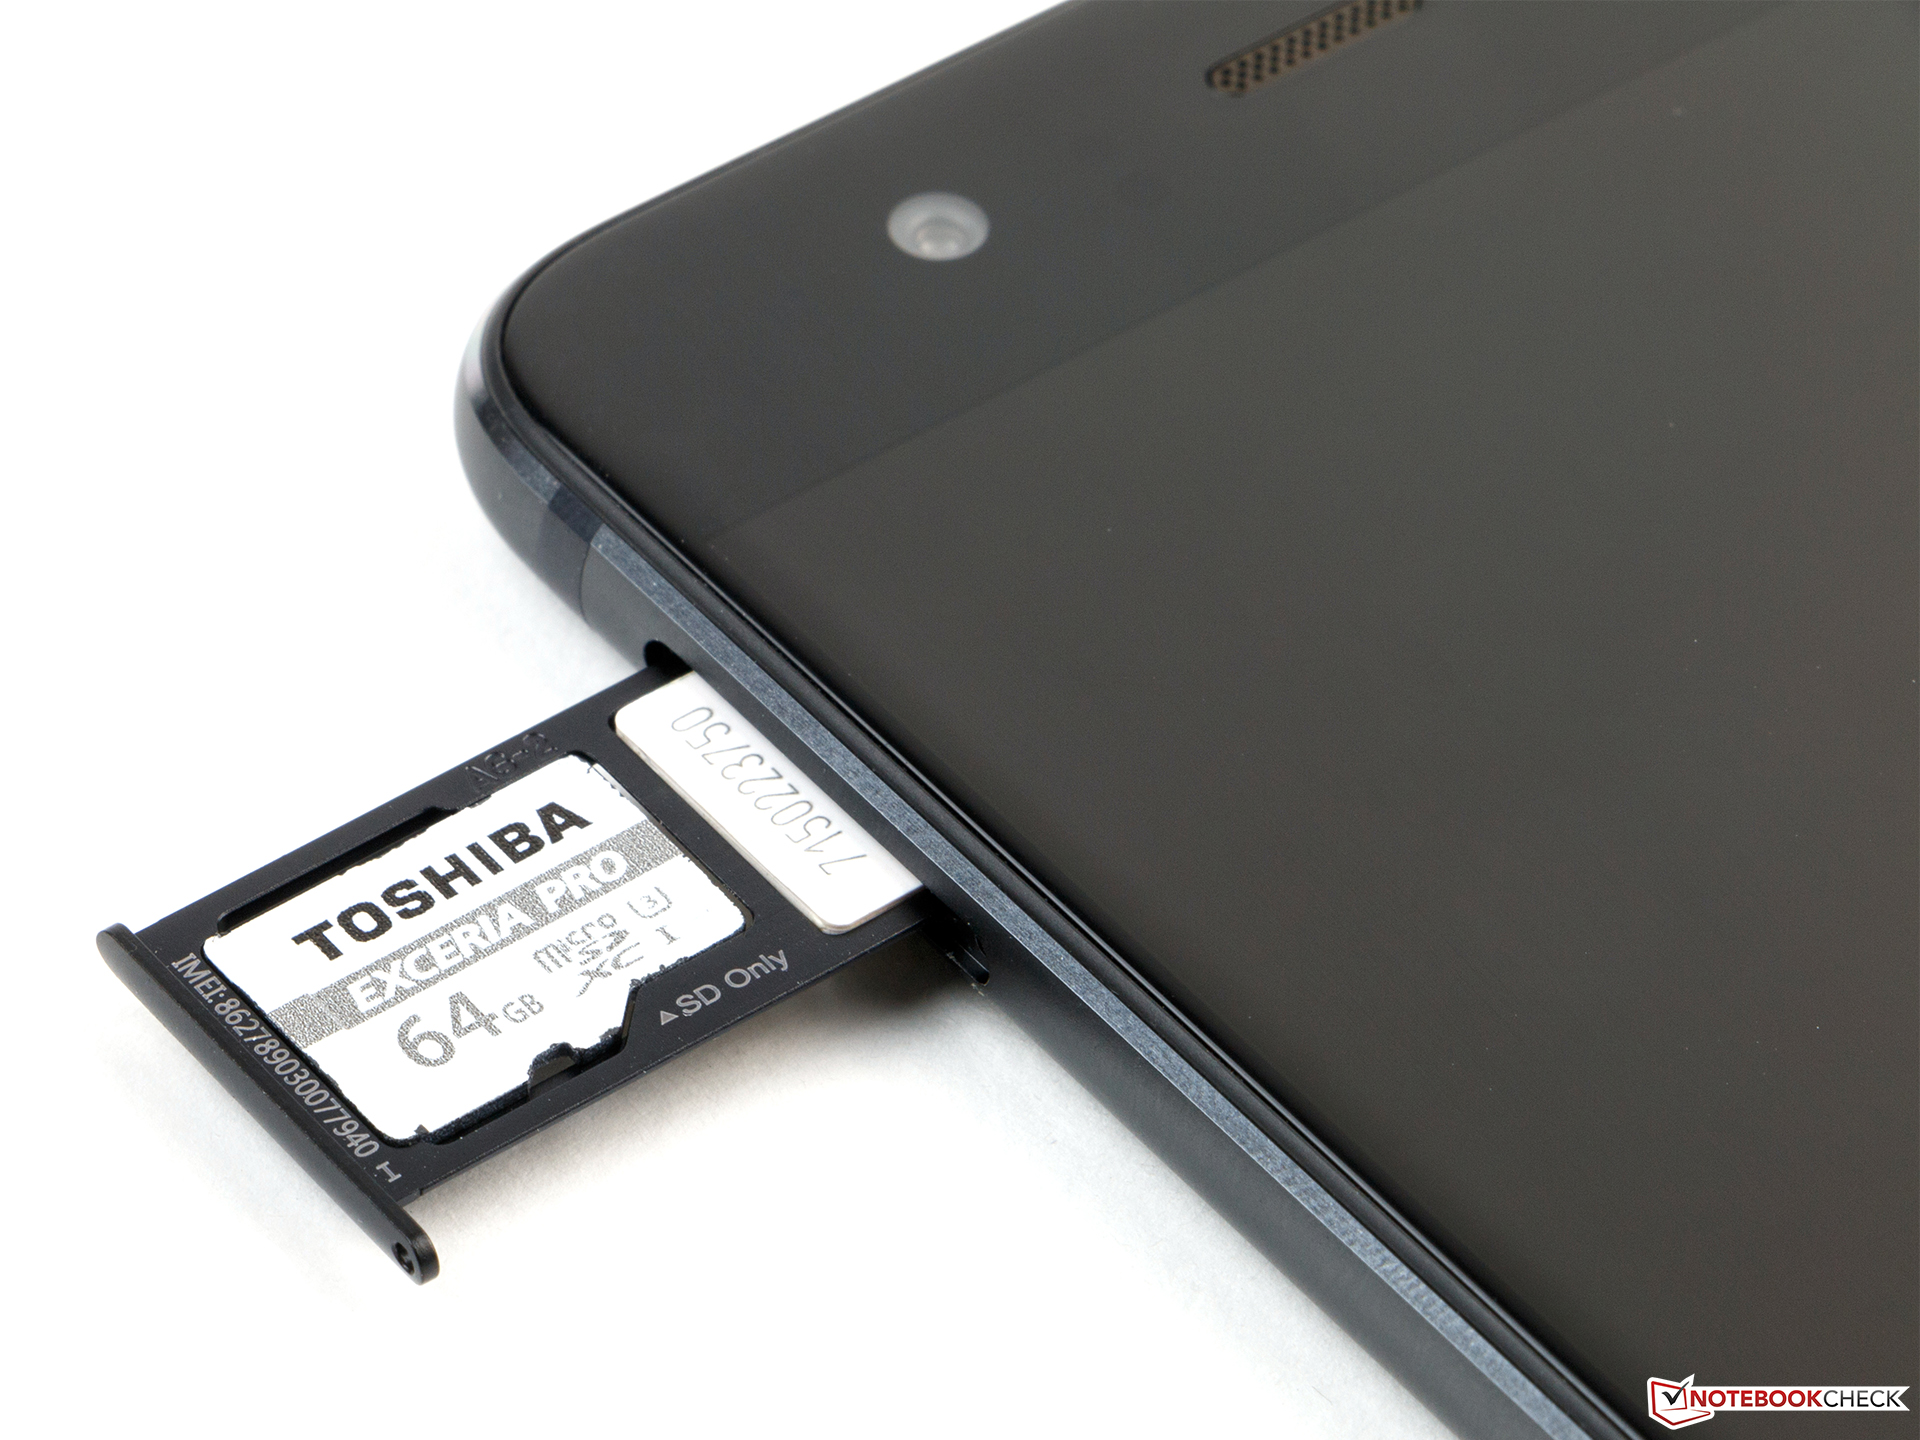
不过,考虑到它是一台高端设备,华为P10还有一些技术上的小瑕疵。相对较弱的无线网络模组,缓慢的microSD读卡器和仅全高清的屏幕都不太符合P10的价位。索尼今年已经搭配了超高清屏幕和HDR功能,而LG G6也得到了支持HDR的屏幕。华为需要在下次更新时提供这些功能。
在用户服务方面,华为也做的很好。VIP服务可以将质保延长到三年,这不仅为用户提供了方便,也显示出了华为对自家设备品质的信心。华为再一次带来了一款优势众多的高端智能手机,很好地延续了前代机型的优秀表现。
注:本文是基于完整评测的缩减版本,阅读完整的英文评测,请点击这里。
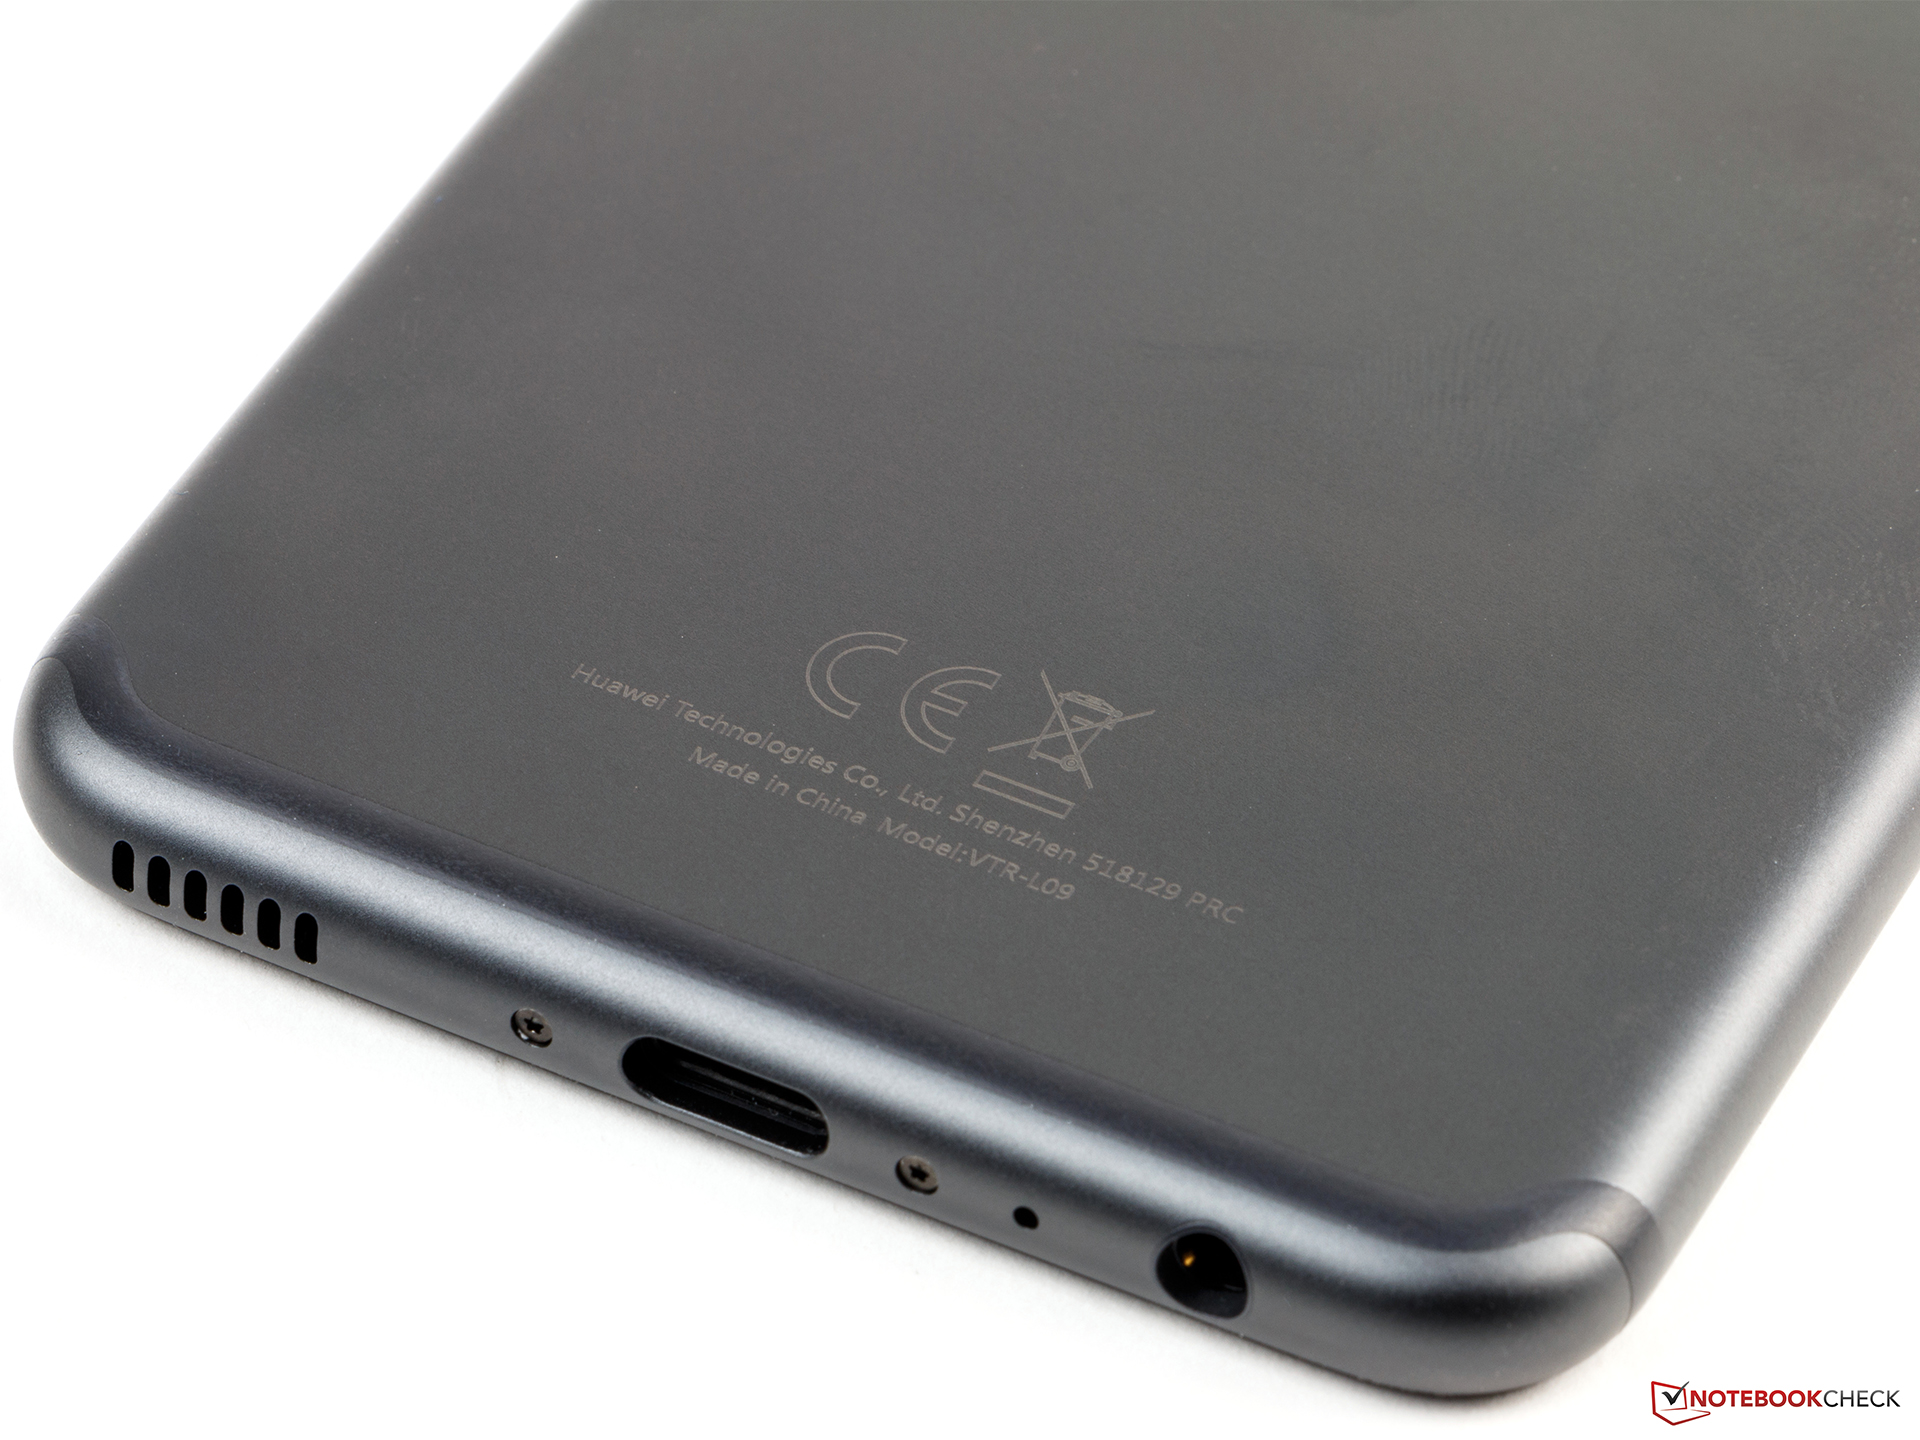
Huawei P10
- 07/11/2017 v6 (old)
Daniel Schmidt