索尼 Xperia XZ 智能手机简短评测
| Networking | |
| iperf Server (receive) TCP 1 m | |
| Apple iPhone 7 | |
| Sony Xperia XZ | |
| OnePlus 3 | |
| iperf Client (transmit) TCP 1 m | |
| Apple iPhone 7 | |
| OnePlus 3 | |
| Sony Xperia XZ | |


| |||||||||||||||||||||||||
Brightness Distribution: 93 %
Center on Battery: 544 cd/m²
Contrast: 1470:1 (Black: 0.37 cd/m²)
ΔE ColorChecker Calman: 5.8 | ∀{0.5-29.43 Ø4.71}
ΔE Greyscale Calman: 7.2 | ∀{0.09-98 Ø4.96}
100% sRGB (Calman 2D)
Gamma: 2.18
CCT: 8619 K
| Sony Xperia XZ IPS, 1920x1080, 5.2" | OnePlus 3 Optic-AMOLED, 1920x1080, 5.5" | Apple iPhone 7 IPS, 1334x750, 4.7" | Samsung Galaxy S7 SAMOLED, 2560x1440, 5.1" | HTC 10 Super LCD 5, 2560x1440, 5.2" | Sony Xperia Z5 Premium IPS, 3840x2160, 5.5" | |
|---|---|---|---|---|---|---|
| Screen | 2% | 30% | 24% | 12% | -25% | |
| Brightness middle (cd/m²) | 544 | 419 -23% | 556 2% | 350 -36% | 445 -18% | 560 3% |
| Brightness (cd/m²) | 521 | 431 -17% | 519 0% | 351 -33% | 434 -17% | 541 4% |
| Brightness Distribution (%) | 93 | 84 -10% | 90 -3% | 98 5% | 93 0% | 85 -9% |
| Black Level * (cd/m²) | 0.37 | 0.34 8% | 0.36 3% | 0.45 -22% | ||
| Contrast (:1) | 1470 | 1635 11% | 1236 -16% | 1244 -15% | ||
| Colorchecker dE 2000 * | 5.8 | 4.1 29% | 1.3 78% | 2.04 65% | 2.8 52% | 9.19 -58% |
| Colorchecker dE 2000 max. * | 9.8 | 12 -22% | 2.6 73% | 3.25 67% | 5.8 41% | 15.01 -53% |
| Greyscale dE 2000 * | 7.2 | 3.3 54% | 1.9 74% | 1.63 77% | 3.7 49% | 10.58 -47% |
| Gamma | 2.18 101% | 2.1 105% | 2.26 97% | 2.07 106% | 2.31 95% | 2.7 81% |
| CCT | 8619 75% | 6550 99% | 6818 95% | 6391 102% | 7164 91% | 9760 67% |
| Color Space (Percent of AdobeRGB 1998) (%) | 89.38 | 63.15 | 86.86 | 73.19 | ||
| Color Space (Percent of sRGB) (%) | 100 | 99.71 | 99.35 |
* ... smaller is better
Display Response Times
| ↔ Response Time Black to White | ||
|---|---|---|
| 60 ms ... rise ↗ and fall ↘ combined | ↗ 21 ms rise | 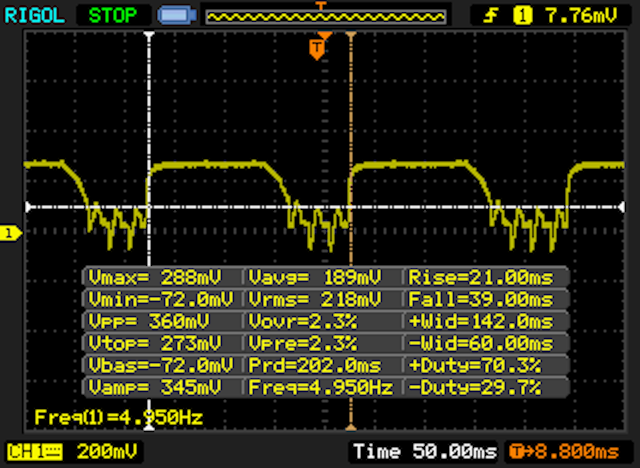 |
| ↘ 39 ms fall | ||
| The screen shows slow response rates in our tests and will be unsatisfactory for gamers. In comparison, all tested devices range from 0.1 (minimum) to 240 (maximum) ms. » 100 % of all devices are better. This means that the measured response time is worse than the average of all tested devices (19.8 ms). | ||
| ↔ Response Time 50% Grey to 80% Grey | ||
| 52 ms ... rise ↗ and fall ↘ combined | ↗ 22 ms rise | 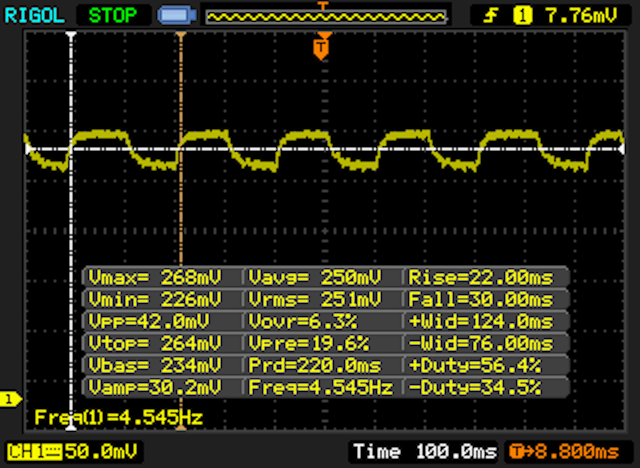 |
| ↘ 30 ms fall | ||
| The screen shows slow response rates in our tests and will be unsatisfactory for gamers. In comparison, all tested devices range from 0.165 (minimum) to 636 (maximum) ms. » 88 % of all devices are better. This means that the measured response time is worse than the average of all tested devices (31 ms). | ||
Screen Flickering / PWM (Pulse-Width Modulation)
| Screen flickering / PWM not detected |  | ||
In comparison: 52 % of all tested devices do not use PWM to dim the display. If PWM was detected, an average of 7754 (minimum: 5 - maximum: 343500) Hz was measured. | |||
| AnTuTu v6 - Total Score (sort by value) | |
| Sony Xperia XZ | |
| OnePlus 3 | |
| Apple iPhone 7 | |
| Samsung Galaxy S7 | |
| HTC 10 | |
| Sony Xperia Z5 Premium | |
| 3DMark | |
| 1280x720 offscreen Ice Storm Unlimited Score (sort by value) | |
| Sony Xperia XZ | |
| OnePlus 3 | |
| Apple iPhone 7 | |
| Samsung Galaxy S7 | |
| HTC 10 | |
| Sony Xperia Z5 Premium | |
| 1280x720 offscreen Ice Storm Unlimited Graphics Score (sort by value) | |
| Sony Xperia XZ | |
| OnePlus 3 | |
| Apple iPhone 7 | |
| Samsung Galaxy S7 | |
| HTC 10 | |
| Sony Xperia Z5 Premium | |
| 1280x720 offscreen Ice Storm Unlimited Physics (sort by value) | |
| Sony Xperia XZ | |
| OnePlus 3 | |
| Apple iPhone 7 | |
| Samsung Galaxy S7 | |
| HTC 10 | |
| Sony Xperia Z5 Premium | |
| 2560x1440 Sling Shot OpenGL ES 3.0 (sort by value) | |
| Sony Xperia XZ | |
| OnePlus 3 | |
| Apple iPhone 7 | |
| Samsung Galaxy S7 | |
| HTC 10 | |
| Sony Xperia Z5 Premium | |
| 2560x1440 Sling Shot OpenGL ES 3.0 Graphics (sort by value) | |
| Sony Xperia XZ | |
| OnePlus 3 | |
| Apple iPhone 7 | |
| Samsung Galaxy S7 | |
| HTC 10 | |
| Sony Xperia Z5 Premium | |
| 2560x1440 Sling Shot OpenGL ES 3.0 Physics (sort by value) | |
| Sony Xperia XZ | |
| OnePlus 3 | |
| Apple iPhone 7 | |
| Samsung Galaxy S7 | |
| HTC 10 | |
| Sony Xperia Z5 Premium | |
| GFXBench (DX / GLBenchmark) 2.7 | |
| T-Rex Onscreen (sort by value) | |
| Sony Xperia XZ | |
| OnePlus 3 | |
| Apple iPhone 7 | |
| Samsung Galaxy S7 | |
| HTC 10 | |
| Sony Xperia Z5 Premium | |
| 1920x1080 T-Rex Offscreen (sort by value) | |
| Sony Xperia XZ | |
| OnePlus 3 | |
| Apple iPhone 7 | |
| Samsung Galaxy S7 | |
| HTC 10 | |
| Sony Xperia Z5 Premium | |
| GFXBench 3.0 | |
| on screen Manhattan Onscreen OGL (sort by value) | |
| Sony Xperia XZ | |
| OnePlus 3 | |
| Apple iPhone 7 | |
| Samsung Galaxy S7 | |
| HTC 10 | |
| Sony Xperia Z5 Premium | |
| 1920x1080 1080p Manhattan Offscreen (sort by value) | |
| Sony Xperia XZ | |
| OnePlus 3 | |
| Apple iPhone 7 | |
| Samsung Galaxy S7 | |
| HTC 10 | |
| Sony Xperia Z5 Premium | |
| GFXBench 3.1 | |
| on screen Manhattan ES 3.1 Onscreen (sort by value) | |
| Sony Xperia XZ | |
| OnePlus 3 | |
| Apple iPhone 7 | |
| Samsung Galaxy S7 | |
| HTC 10 | |
| Sony Xperia Z5 Premium | |
| 1920x1080 Manhattan ES 3.1 Offscreen (sort by value) | |
| Sony Xperia XZ | |
| OnePlus 3 | |
| Apple iPhone 7 | |
| Samsung Galaxy S7 | |
| HTC 10 | |
| Sony Xperia Z5 Premium | |
| PCMark for Android - Work performance score (sort by value) | |
| Sony Xperia XZ | |
| OnePlus 3 | |
| Samsung Galaxy S7 | |
| HTC 10 | |
| Sony Xperia Z5 Premium | |
| Geekbench 4.0 | |
| 64 Bit Single-Core Score (sort by value) | |
| Sony Xperia XZ | |
| OnePlus 3 | |
| Apple iPhone 7 | |
| 64 Bit Multi-Core Score (sort by value) | |
| Sony Xperia XZ | |
| OnePlus 3 | |
| Apple iPhone 7 | |
| Compute RenderScript Score (sort by value) | |
| Sony Xperia XZ | |
| OnePlus 3 | |
| AndroBench 3-5 | |
| Sequential Read 256KB (sort by value) | |
| Sony Xperia XZ | |
| OnePlus 3 | |
| Samsung Galaxy S7 | |
| HTC 10 | |
| Sony Xperia Z5 Premium | |
| Sequential Write 256KB (sort by value) | |
| Sony Xperia XZ | |
| OnePlus 3 | |
| Samsung Galaxy S7 | |
| HTC 10 | |
| Sony Xperia Z5 Premium | |
| Random Read 4KB (sort by value) | |
| Sony Xperia XZ | |
| OnePlus 3 | |
| Samsung Galaxy S7 | |
| HTC 10 | |
| Sony Xperia Z5 Premium | |
| Random Write 4KB (sort by value) | |
| Sony Xperia XZ | |
| OnePlus 3 | |
| Samsung Galaxy S7 | |
| HTC 10 | |
| Sony Xperia Z5 Premium | |
| Sequential Read 256KB SDCard (sort by value) | |
| Sony Xperia XZ | |
| Samsung Galaxy S7 | |
| HTC 10 | |
| Sequential Write 256KB SDCard (sort by value) | |
| Sony Xperia XZ | |
| Samsung Galaxy S7 | |
| HTC 10 | |
| Mozilla Kraken 1.1 - Total (sort by value) | |
| Sony Xperia XZ | |
| OnePlus 3 | |
| Apple iPhone 7 | |
| Samsung Galaxy S7 | |
| HTC 10 | |
| Sony Xperia Z5 Premium | |
| Octane V2 - Total Score (sort by value) | |
| Sony Xperia XZ | |
| OnePlus 3 | |
| Apple iPhone 7 | |
| Samsung Galaxy S7 | |
| HTC 10 | |
| Sony Xperia Z5 Premium | |
| WebXPRT 2015 - Overall (sort by value) | |
| Sony Xperia XZ | |
| OnePlus 3 | |
| Apple iPhone 7 | |
| Samsung Galaxy S7 | |
| HTC 10 | |
| Sony Xperia Z5 Premium | |
| JetStream 1.1 - 1.1 Total (sort by value) | |
| Sony Xperia XZ | |
| OnePlus 3 | |
| Apple iPhone 7 | |
| Samsung Galaxy S7 | |
| HTC 10 | |
| Sony Xperia Z5 Premium | |
* ... smaller is better
| Asphalt 8: Airborne | |||
| Settings | Value | ||
| high | 30 fps | ||
| very low | 30 fps | ||
| Dead Trigger 2 | |||
| Settings | Value | ||
| high | 30 fps | ||
(+) The maximum temperature on the upper side is 38.5 °C / 101 F, compared to the average of 35.3 °C / 96 F, ranging from 21.9 to 247 °C for the class Smartphone.
(+) The bottom heats up to a maximum of 39.7 °C / 103 F, compared to the average of 34 °C / 93 F
(±) In idle usage, the average temperature for the upper side is 33.8 °C / 93 F, compared to the device average of 33 °C / 91 F.
Sony Xperia XZ audio analysis
(±) | speaker loudness is average but good (77 dB)
Bass 100 - 315 Hz
(-) | nearly no bass - on average 21.3% lower than median
(-) | bass is not linear (21.2% delta to prev. frequency)
Mids 400 - 2000 Hz
(±) | higher mids - on average 6.5% higher than median
(±) | linearity of mids is average (7.7% delta to prev. frequency)
Highs 2 - 16 kHz
(±) | higher highs - on average 5.8% higher than median
(±) | linearity of highs is average (8.7% delta to prev. frequency)
Overall 100 - 16.000 Hz
(±) | linearity of overall sound is average (26.6% difference to median)
Compared to same class
» 69% of all tested devices in this class were better, 5% similar, 26% worse
» The best had a delta of 11%, average was 34%, worst was 134%
Compared to all devices tested
» 82% of all tested devices were better, 3% similar, 15% worse
» The best had a delta of 4%, average was 23%, worst was 134%
Apple iPhone 7 audio analysis
(+) | speakers can play relatively loud (83.1 dB)
Bass 100 - 315 Hz
(-) | nearly no bass - on average 21.8% lower than median
(±) | linearity of bass is average (9.5% delta to prev. frequency)
Mids 400 - 2000 Hz
(+) | balanced mids - only 4.3% away from median
(+) | mids are linear (6% delta to prev. frequency)
Highs 2 - 16 kHz
(±) | higher highs - on average 5.9% higher than median
(±) | linearity of highs is average (8.2% delta to prev. frequency)
Overall 100 - 16.000 Hz
(±) | linearity of overall sound is average (20.9% difference to median)
Compared to same class
» 39% of all tested devices in this class were better, 8% similar, 53% worse
» The best had a delta of 11%, average was 34%, worst was 134%
Compared to all devices tested
» 57% of all tested devices were better, 8% similar, 35% worse
» The best had a delta of 4%, average was 23%, worst was 134%
Samsung Galaxy S7 audio analysis
(+) | speakers can play relatively loud (87.4 dB)
Bass 100 - 315 Hz
(-) | nearly no bass - on average 25.2% lower than median
(±) | linearity of bass is average (9.2% delta to prev. frequency)
Mids 400 - 2000 Hz
(+) | balanced mids - only 4.1% away from median
(+) | mids are linear (5% delta to prev. frequency)
Highs 2 - 16 kHz
(±) | higher highs - on average 6.6% higher than median
(+) | highs are linear (6.3% delta to prev. frequency)
Overall 100 - 16.000 Hz
(±) | linearity of overall sound is average (20.9% difference to median)
Compared to same class
» 39% of all tested devices in this class were better, 8% similar, 53% worse
» The best had a delta of 11%, average was 34%, worst was 134%
Compared to all devices tested
» 57% of all tested devices were better, 8% similar, 35% worse
» The best had a delta of 4%, average was 23%, worst was 134%
OnePlus 3 audio analysis
(+) | speakers can play relatively loud (88.6 dB)
Bass 100 - 315 Hz
(-) | nearly no bass - on average 30.9% lower than median
(±) | linearity of bass is average (11.3% delta to prev. frequency)
Mids 400 - 2000 Hz
(+) | balanced mids - only 4.2% away from median
(+) | mids are linear (4.9% delta to prev. frequency)
Highs 2 - 16 kHz
(±) | higher highs - on average 5.6% higher than median
(+) | highs are linear (3.2% delta to prev. frequency)
Overall 100 - 16.000 Hz
(±) | linearity of overall sound is average (21.8% difference to median)
Compared to same class
» 45% of all tested devices in this class were better, 8% similar, 47% worse
» The best had a delta of 11%, average was 34%, worst was 134%
Compared to all devices tested
» 62% of all tested devices were better, 7% similar, 31% worse
» The best had a delta of 4%, average was 23%, worst was 134%
HTC 10 audio analysis
(+) | speakers can play relatively loud (83.1 dB)
Bass 100 - 315 Hz
(-) | nearly no bass - on average 20.4% lower than median
(±) | linearity of bass is average (12.9% delta to prev. frequency)
Mids 400 - 2000 Hz
(±) | higher mids - on average 7.3% higher than median
(±) | linearity of mids is average (8.9% delta to prev. frequency)
Highs 2 - 16 kHz
(±) | higher highs - on average 10.3% higher than median
(+) | highs are linear (6% delta to prev. frequency)
Overall 100 - 16.000 Hz
(±) | linearity of overall sound is average (27.4% difference to median)
Compared to same class
» 71% of all tested devices in this class were better, 5% similar, 23% worse
» The best had a delta of 11%, average was 34%, worst was 134%
Compared to all devices tested
» 84% of all tested devices were better, 4% similar, 13% worse
» The best had a delta of 4%, average was 23%, worst was 134%
LG G5 audio analysis
(+) | speakers can play relatively loud (86.4 dB)
Bass 100 - 315 Hz
(-) | nearly no bass - on average 28.3% lower than median
(±) | linearity of bass is average (12.5% delta to prev. frequency)
Mids 400 - 2000 Hz
(+) | balanced mids - only 3.6% away from median
(+) | mids are linear (4.3% delta to prev. frequency)
Highs 2 - 16 kHz
(+) | balanced highs - only 3.8% away from median
(+) | highs are linear (1.9% delta to prev. frequency)
Overall 100 - 16.000 Hz
(±) | linearity of overall sound is average (18.8% difference to median)
Compared to same class
» 23% of all tested devices in this class were better, 10% similar, 67% worse
» The best had a delta of 11%, average was 34%, worst was 134%
Compared to all devices tested
» 43% of all tested devices were better, 8% similar, 49% worse
» The best had a delta of 4%, average was 23%, worst was 134%
| Off / Standby | |
| Idle | |
| Load |
|
Key:
min: | |
| Sony Xperia XZ 2900 mAh | OnePlus 3 3000 mAh | Apple iPhone 7 1960 mAh | Samsung Galaxy S7 3000 mAh | HTC 10 3000 mAh | Sony Xperia Z5 Premium 3430 mAh | |
|---|---|---|---|---|---|---|
| Power Consumption | 41% | 56% | 52% | 33% | 25% | |
| Idle Minimum * (Watt) | 1.76 | 0.57 68% | 0.54 69% | 0.68 61% | 0.68 61% | 0.83 53% |
| Idle Average * (Watt) | 3.6 | 1.24 66% | 1.51 58% | 1.02 72% | 1.49 59% | 2.36 34% |
| Idle Maximum * (Watt) | 4.06 | 1.36 67% | 1.54 62% | 1.14 72% | 1.91 53% | 2.42 40% |
| Load Average * (Watt) | 7 | 5.92 15% | 3.75 46% | 4.73 32% | 7.4 -6% | 7.27 -4% |
| Load Maximum * (Watt) | 9.52 | 10.53 -11% | 5.01 47% | 7.16 25% | 9.71 -2% | 9.18 4% |
* ... smaller is better
| Sony Xperia XZ 2900 mAh | OnePlus 3 3000 mAh | Apple iPhone 7 1960 mAh | Samsung Galaxy S7 3000 mAh | HTC 10 3000 mAh | Sony Xperia Z5 Premium 3430 mAh | |
|---|---|---|---|---|---|---|
| Battery runtime | 56% | 22% | 43% | 12% | -2% | |
| Reader / Idle (h) | 18.8 | 22.3 19% | 29.5 57% | 30.2 61% | 21.2 13% | 21.3 13% |
| H.264 (h) | 8.4 | 14.1 68% | 12 43% | 14.9 77% | 10.8 29% | 6.9 -18% |
| WiFi v1.3 (h) | 7.3 | 14 92% | 8.6 18% | 7.6 4% | 6.9 -5% | 6.2 -15% |
| Load (h) | 3.1 | 4.5 45% | 2.1 -32% | 4 29% | 3.4 10% | 3.5 13% |
Pros
Cons
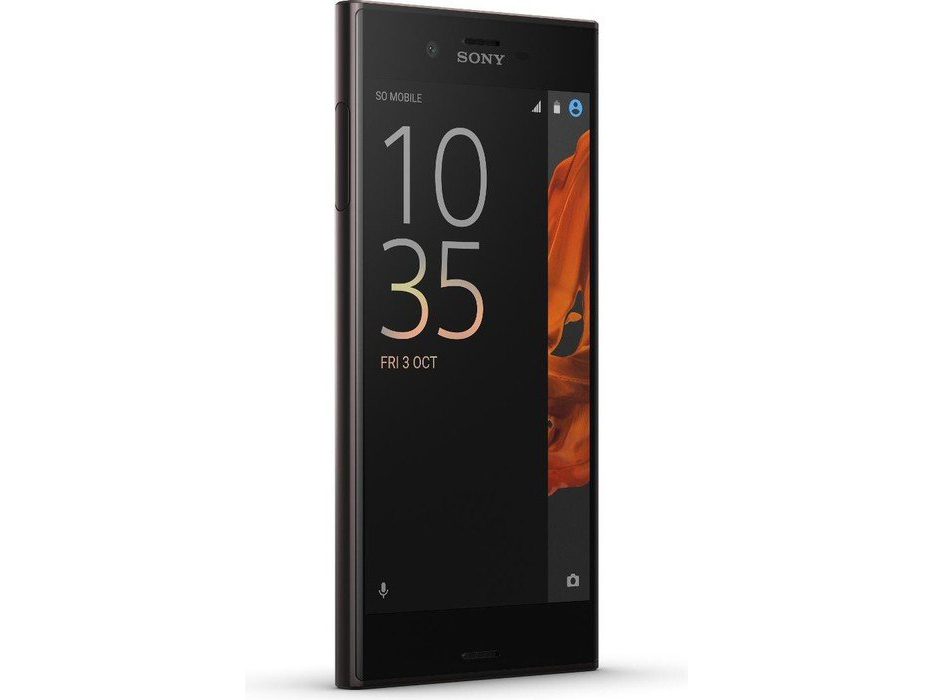
Xperia XZ的创意新颖,但很遗憾没有足够领导变革的能力。在许多方面,这台测试机都十分保守,不愿冒险。我们更倾向于称呼它“可靠”而非“创新”。
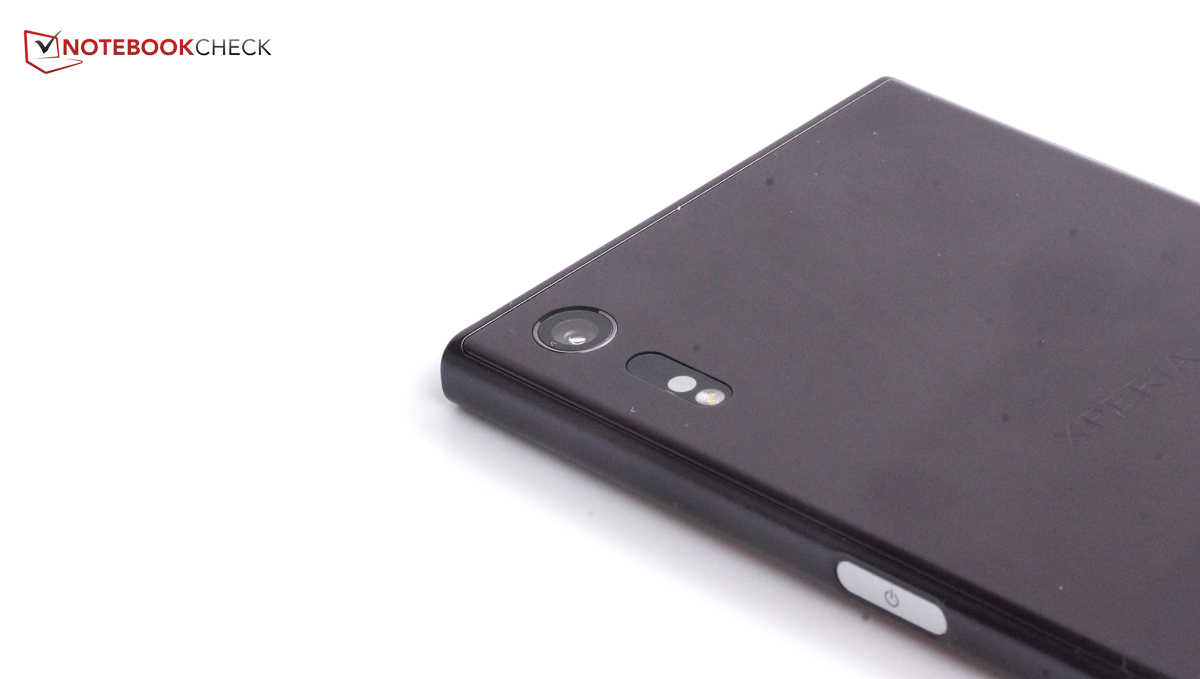
它的相机是广告宣传的核心,它提供了许多优秀的功能,不过相比竞争机型的表现却十分一般。除此之外,这台设备缺少图像防抖技术,它将可以提高在暗光下的拍摄效果。Xperia XZ和大部分竞争对手一样,可以拍摄不错的照片。
在电池续航,屏幕色彩准确度,无线网络模组速度和功耗这几个方面Xperia XZ的表现都不尽人意。我们希望一台售价700欧元(约5175人民币)的设备能够有更好的表现。较慢的闪存速度的负面影响更大,因为这使得游戏的加载速度变得明显很慢。
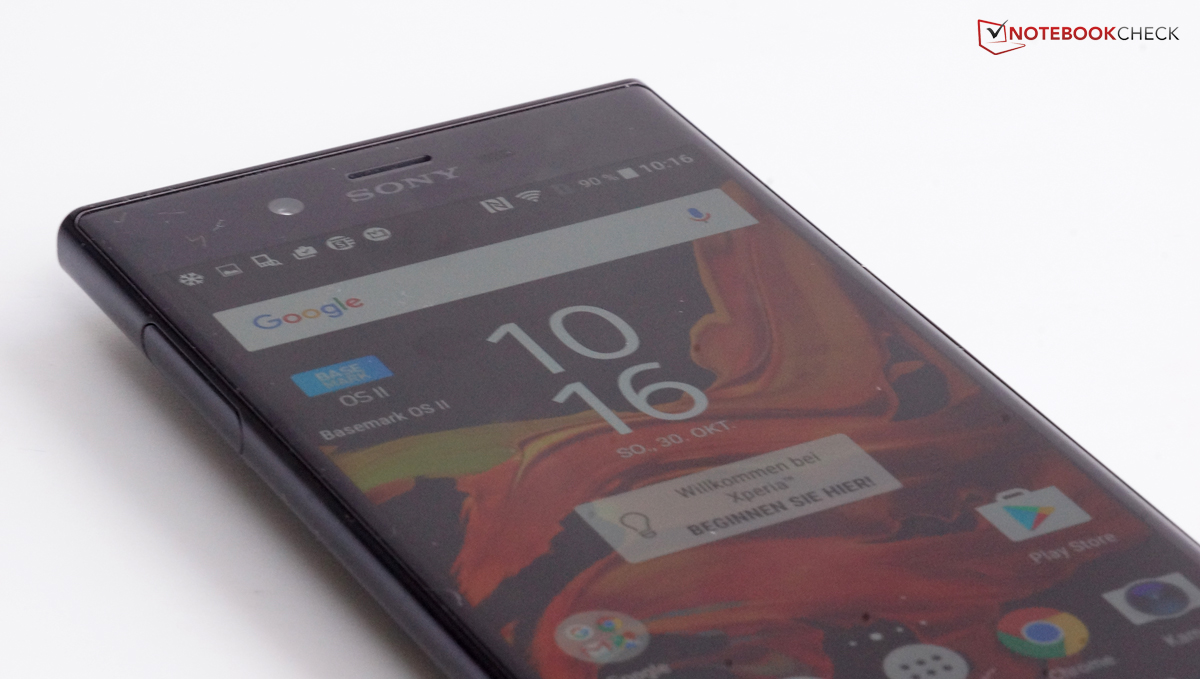
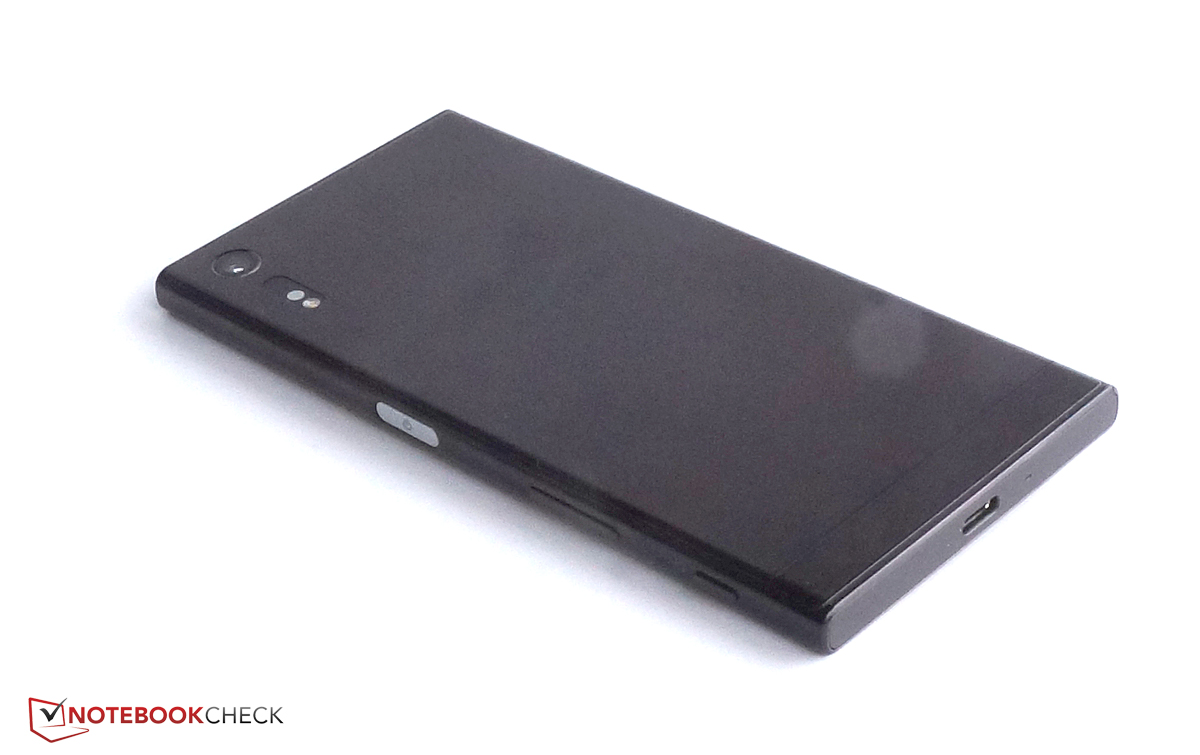
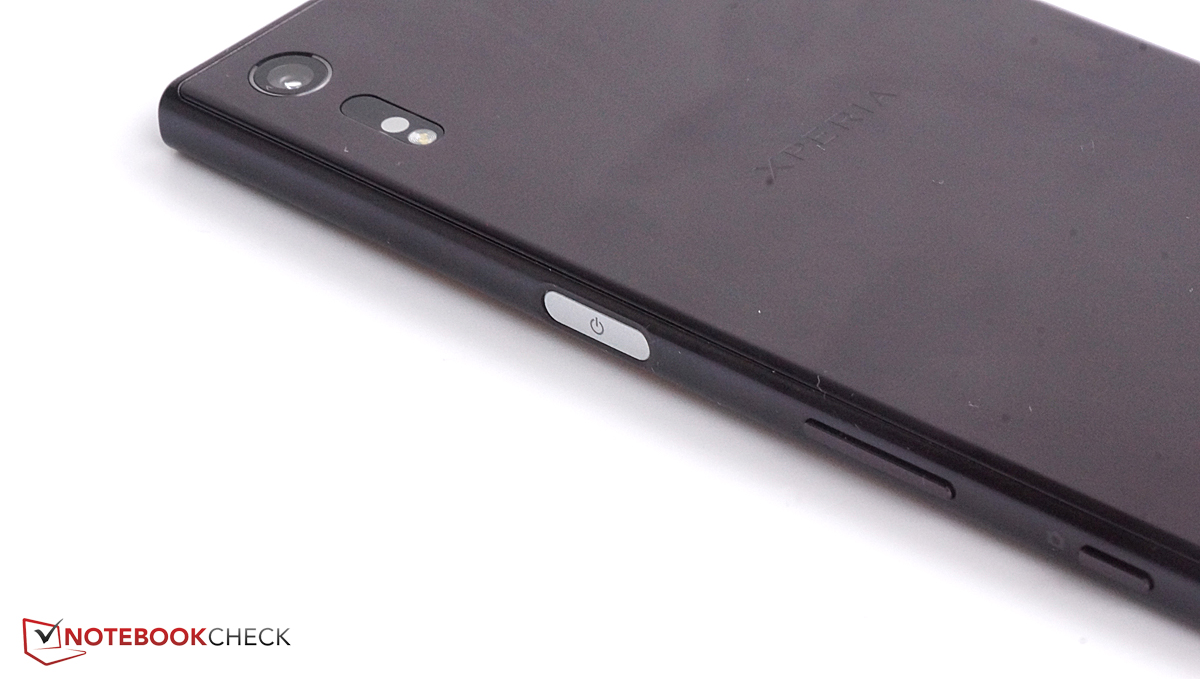
索尼在其他很多方面都做得不错,它的软件系统有很多实用的设定,也提供了可以改进音响效果和屏幕色彩的选项。这台智能手机的时尚设计是一个不可否认的优势。它的扬声器和表面温度也都表现良好。我们特别喜欢它的Xperia Lounge应用的功能。
整体上,Xperia XZ在不少方面都表现平平。因此它很难在高端智能手机中脱颖而出。索尼的这台设备缺少一些实质性的创新,但仍然是一台优秀的智能化手机。
我们都知道索尼具备设计创新智能手机的能力,比如Xperia Z5 Premium和其他小尺寸高端机型都证明了它的创造力。不过,Xperia XZ很难对市场上成熟的智能手机形成威胁。尽管是一台可靠的高端设备,它缺少一些作为700欧元(约5175人民币)价位设备的价值,许多竞争对手,如OnePlus 3,Galaxy S7和iPhone 7整体表现都相对更好。
注:本文是基于完整评测的缩减版本,阅读完整的英文评测,请点击这里。
Sony Xperia XZ
- 11/02/2016 v5.1 (old)
Florian Wimmer