联想 Moto Z 智能手机简短评测


| Networking | |
| iperf Server (receive) TCP 1 m | |
| Lenovo Moto Z | |
| Apple iPhone 7 Plus | |
| LG G5 | |
| Samsung Galaxy S7 Edge | |
| OnePlus 3 | |
| Huawei P9 | |
| iperf Client (transmit) TCP 1 m | |
| Apple iPhone 7 Plus | |
| Lenovo Moto Z | |
| Samsung Galaxy S7 Edge | |
| OnePlus 3 | |
| Huawei P9 | |
| LG G5 | |


| |||||||||||||||||||||||||
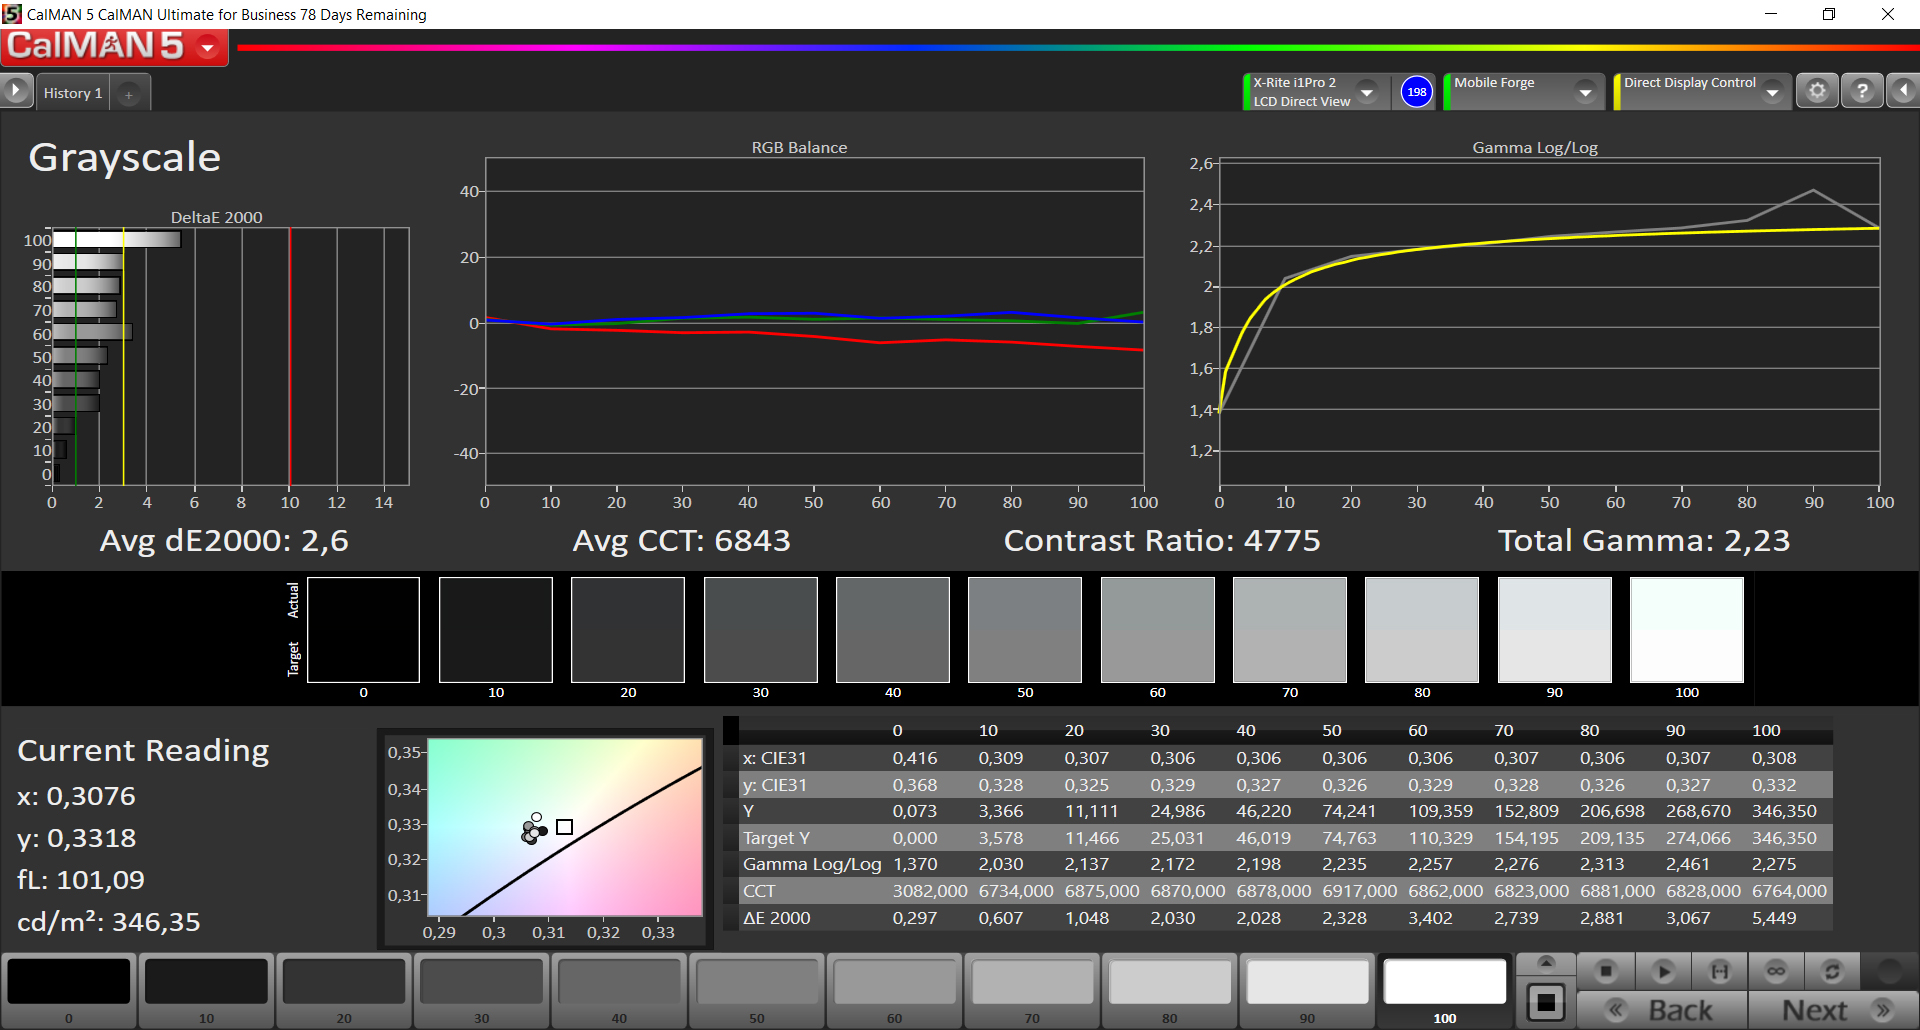
Brightness Distribution: 92 %
Center on Battery: 485 cd/m²
Contrast: ∞:1 (Black: 0 cd/m²)
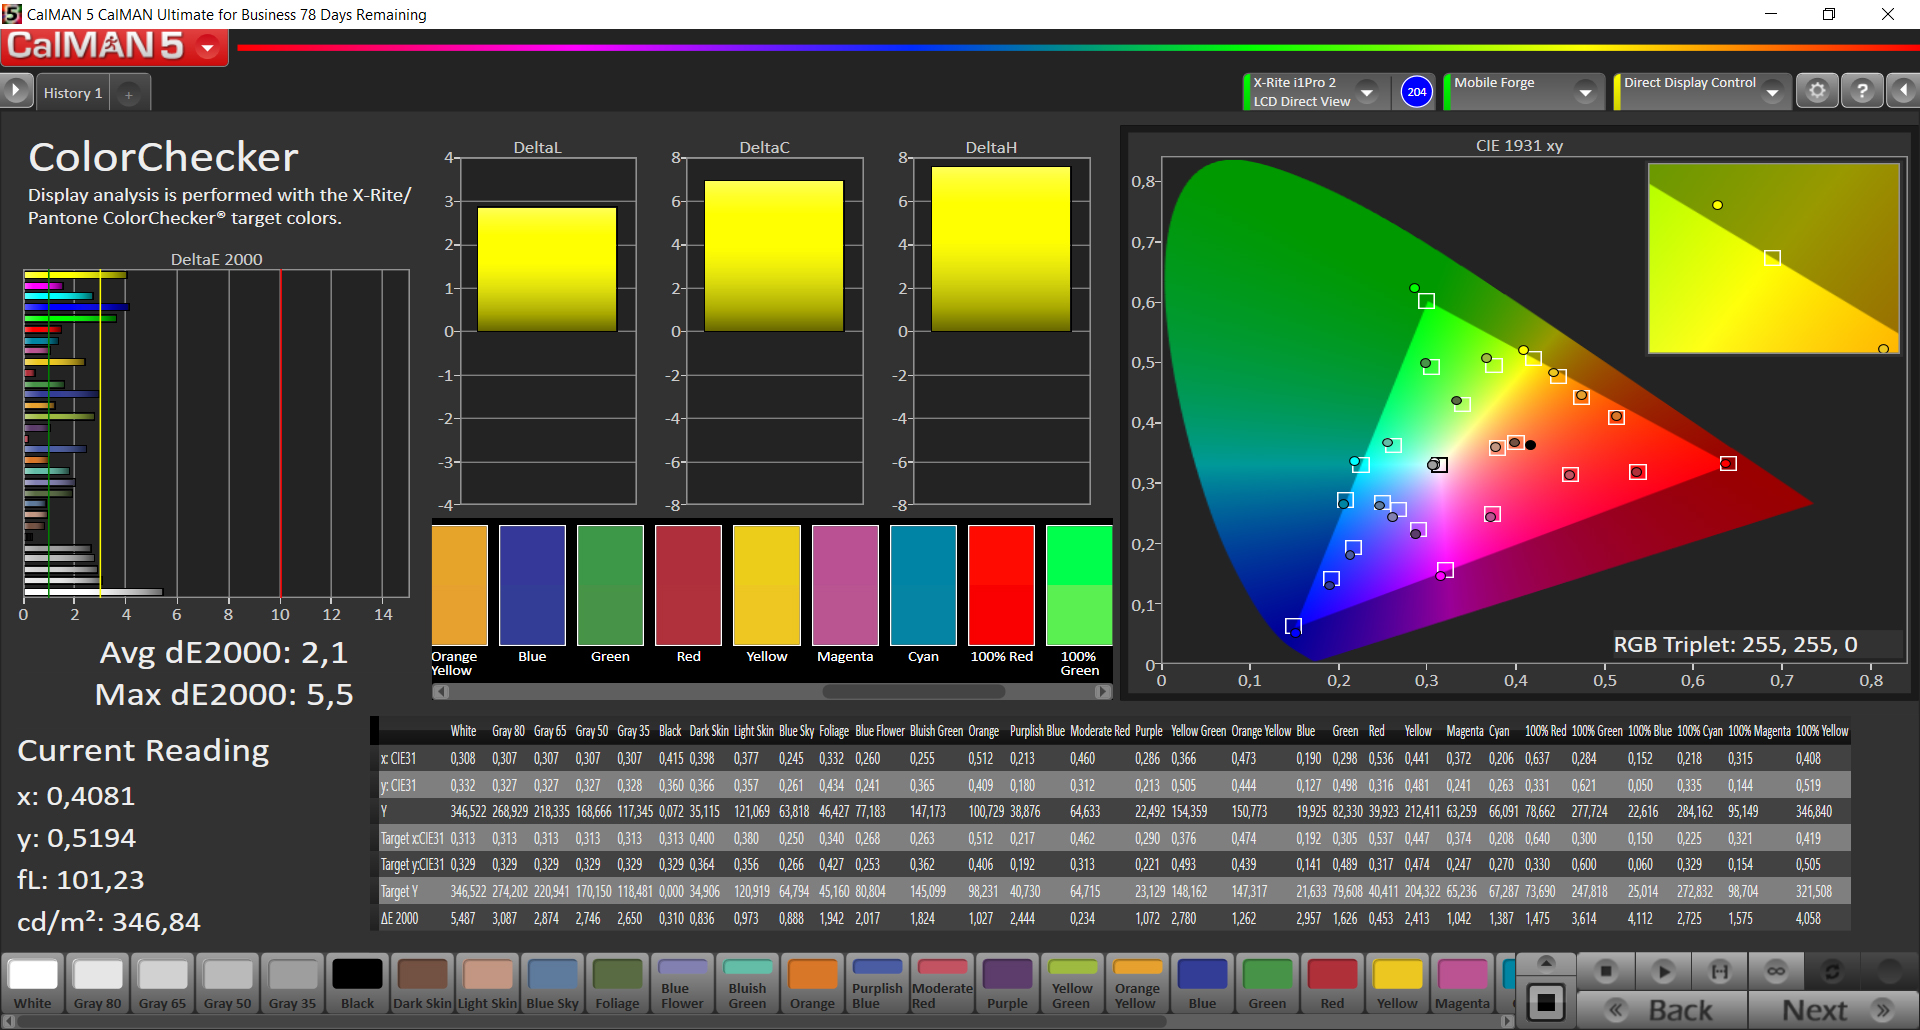
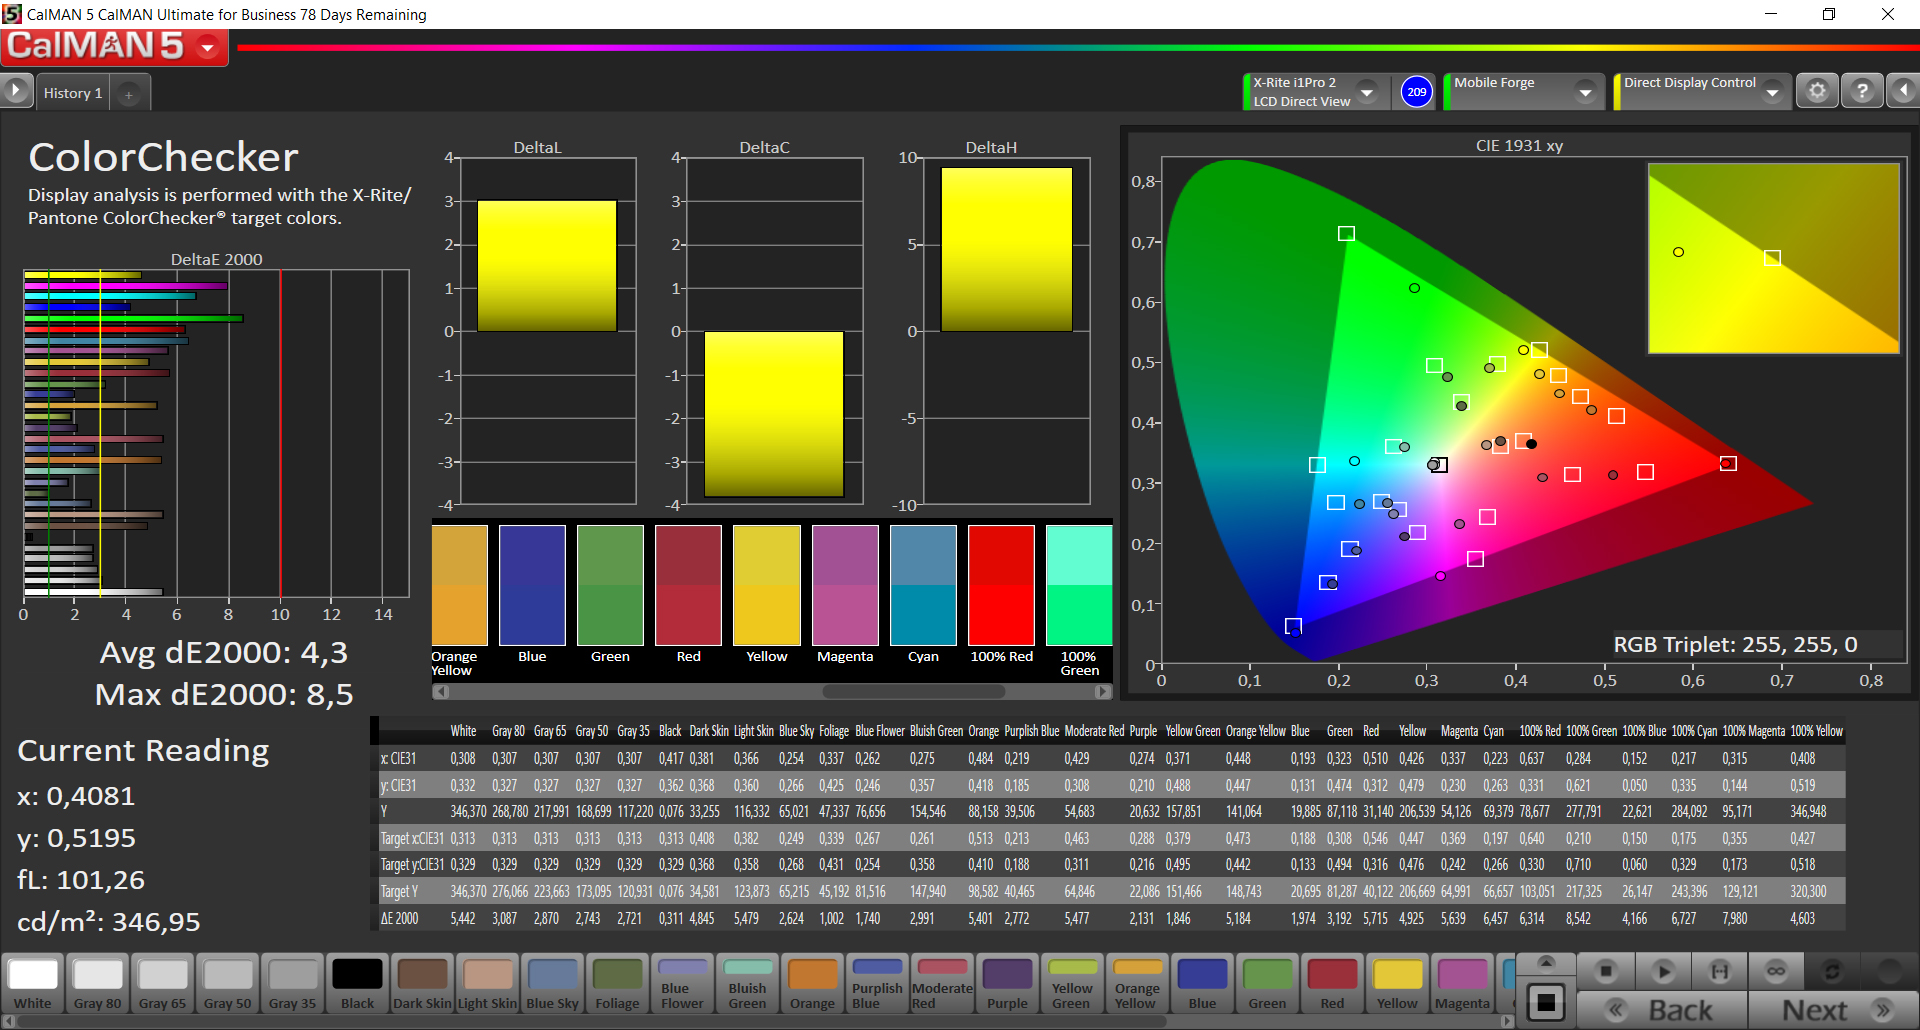
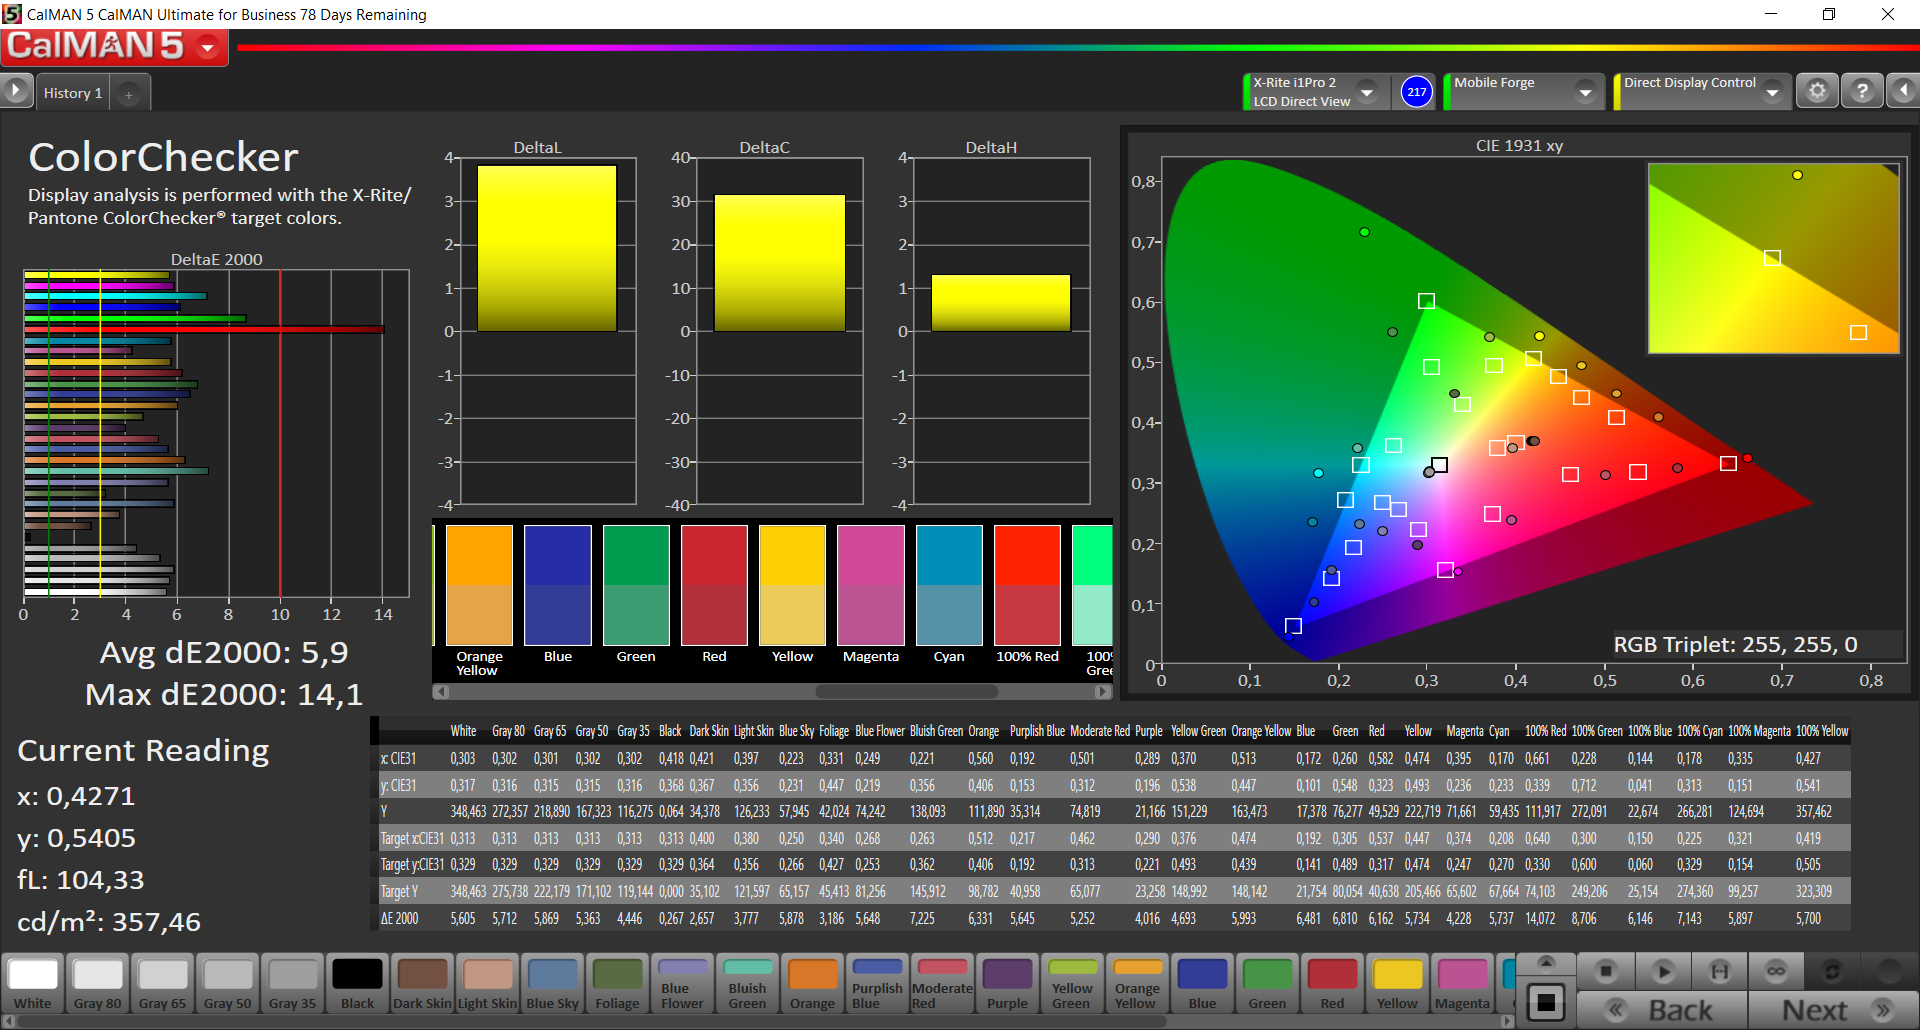
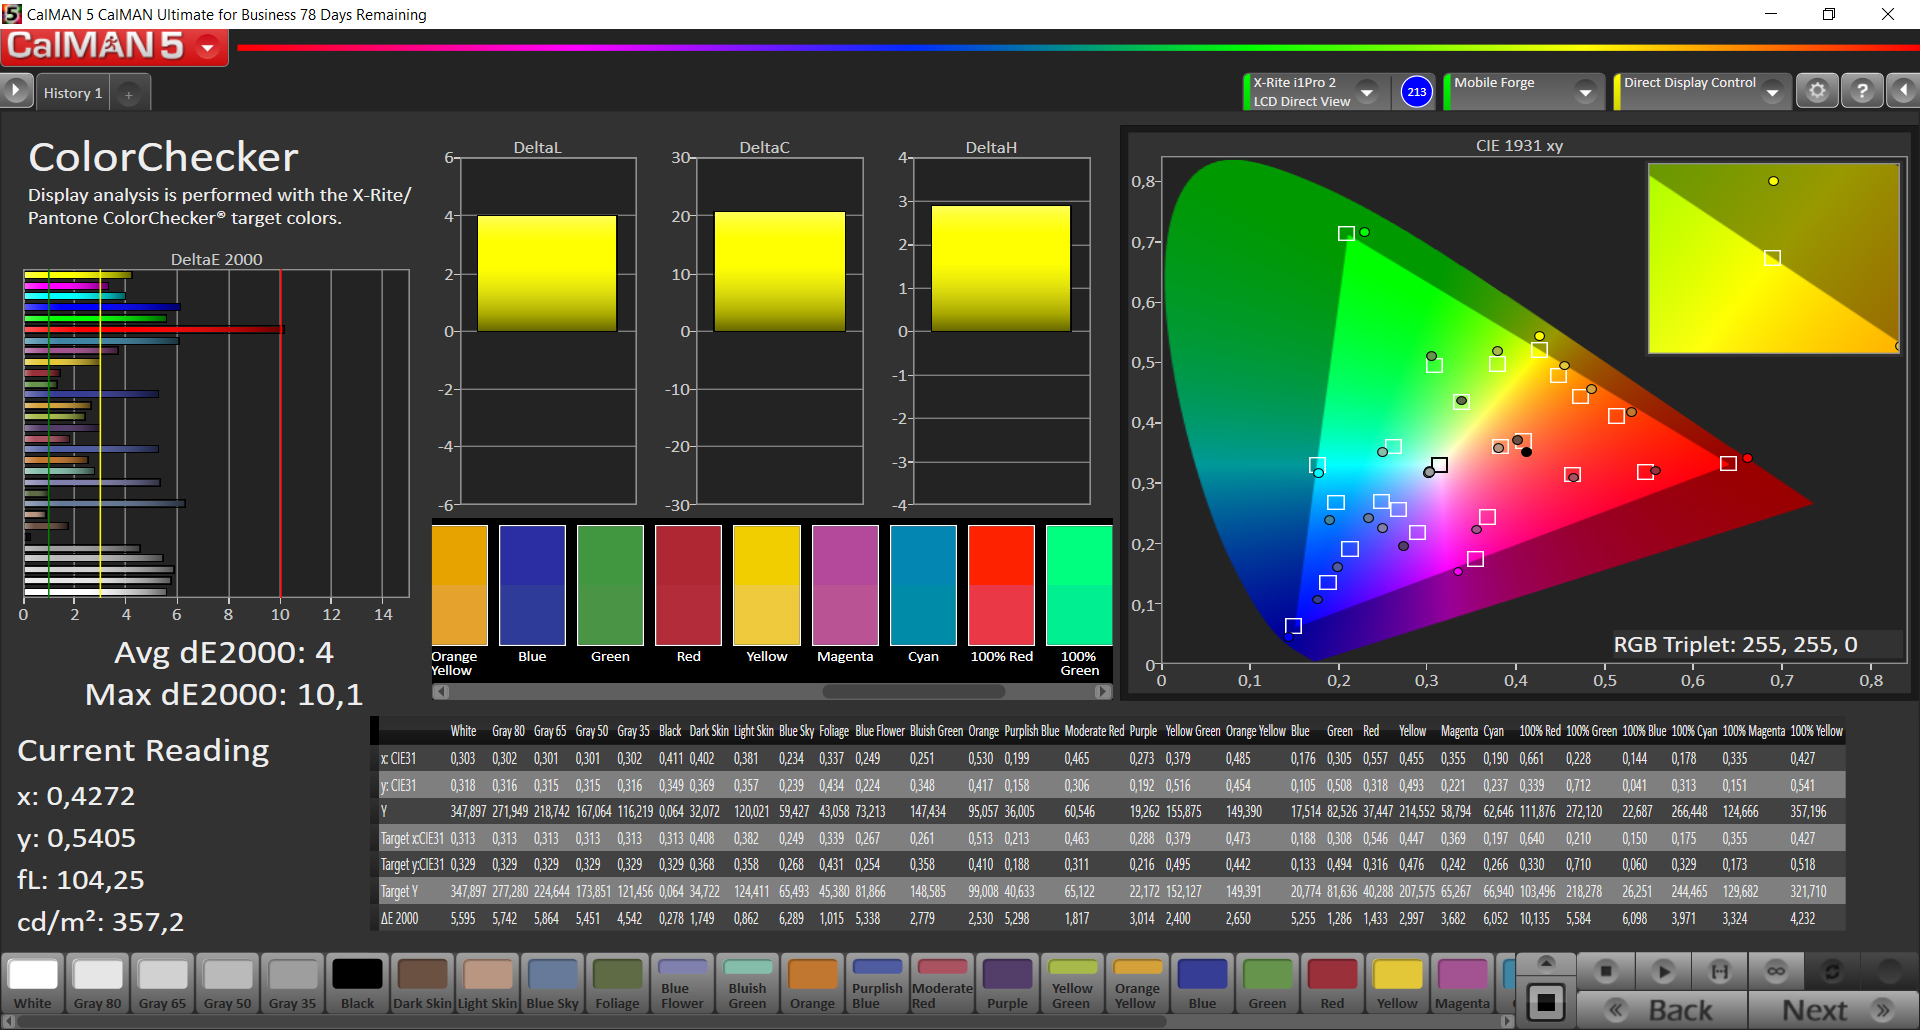
ΔE ColorChecker Calman: 2.1 | ∀{0.5-29.43 Ø4.71}
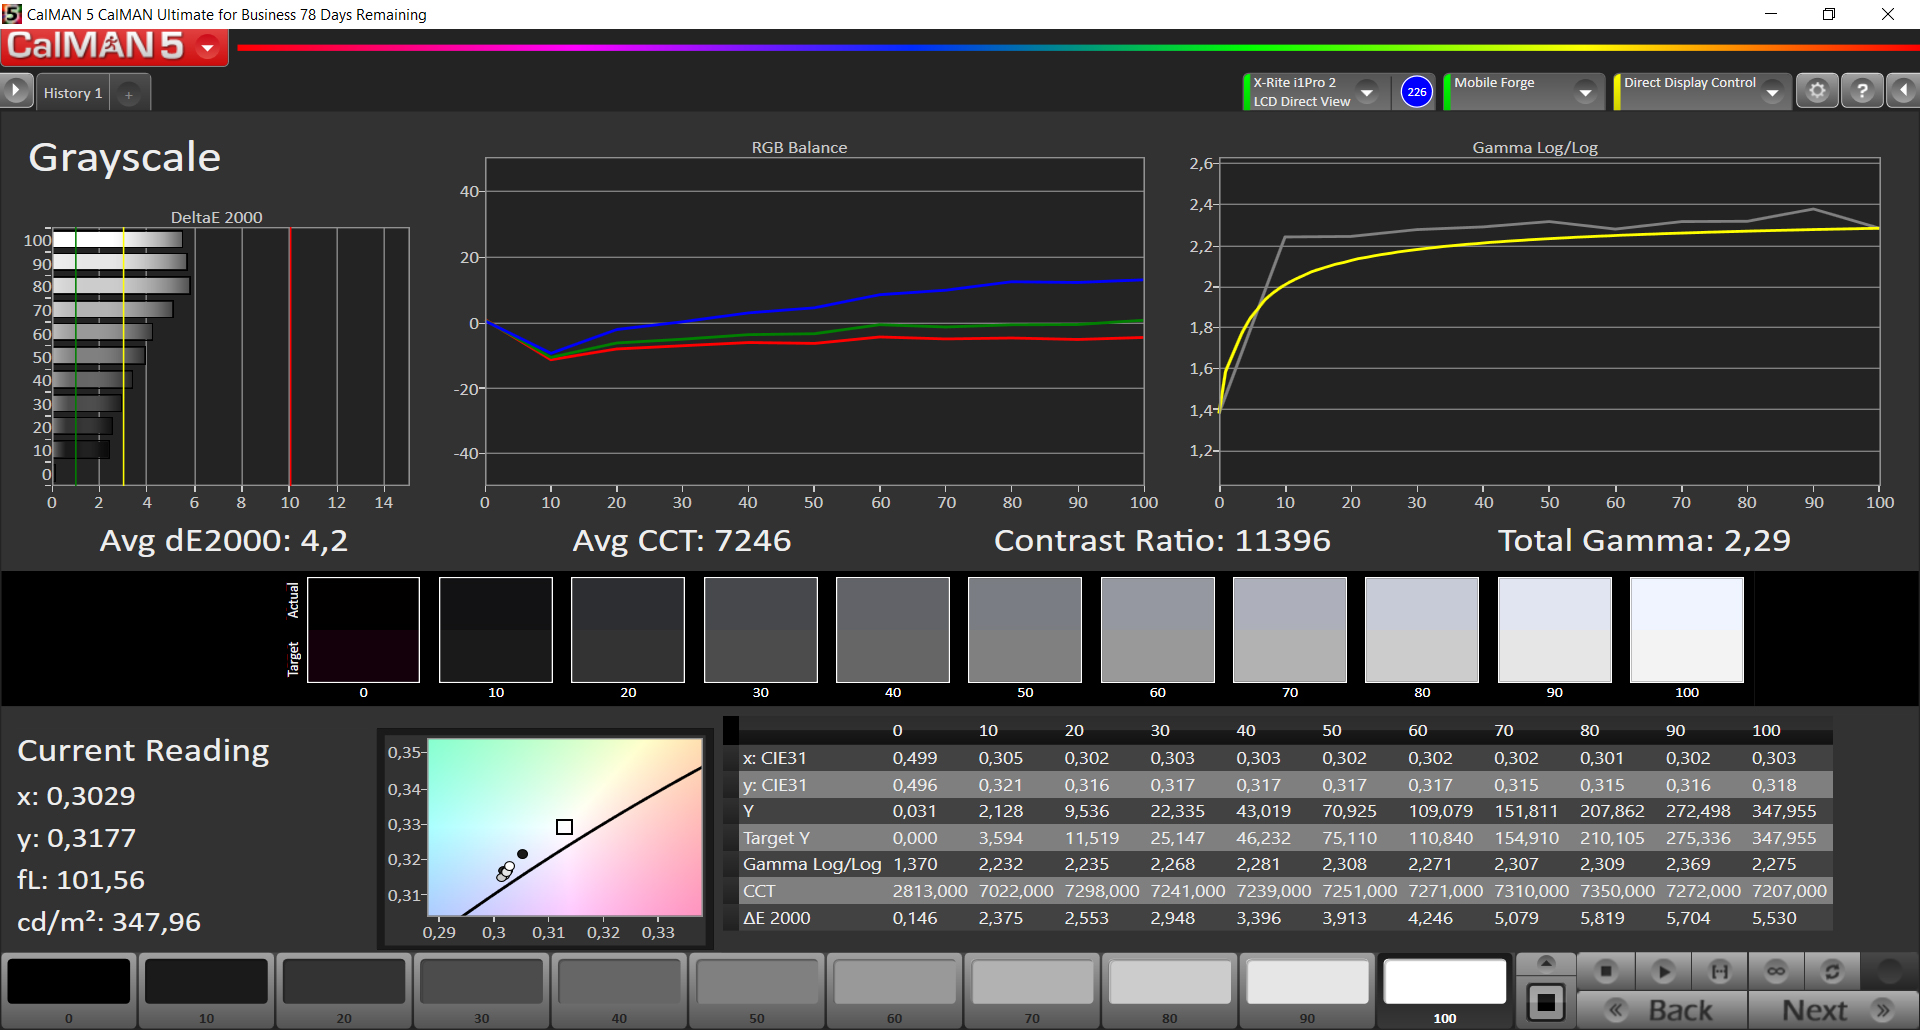
ΔE Greyscale Calman: 2.6 | ∀{0.09-98 Ø4.96}
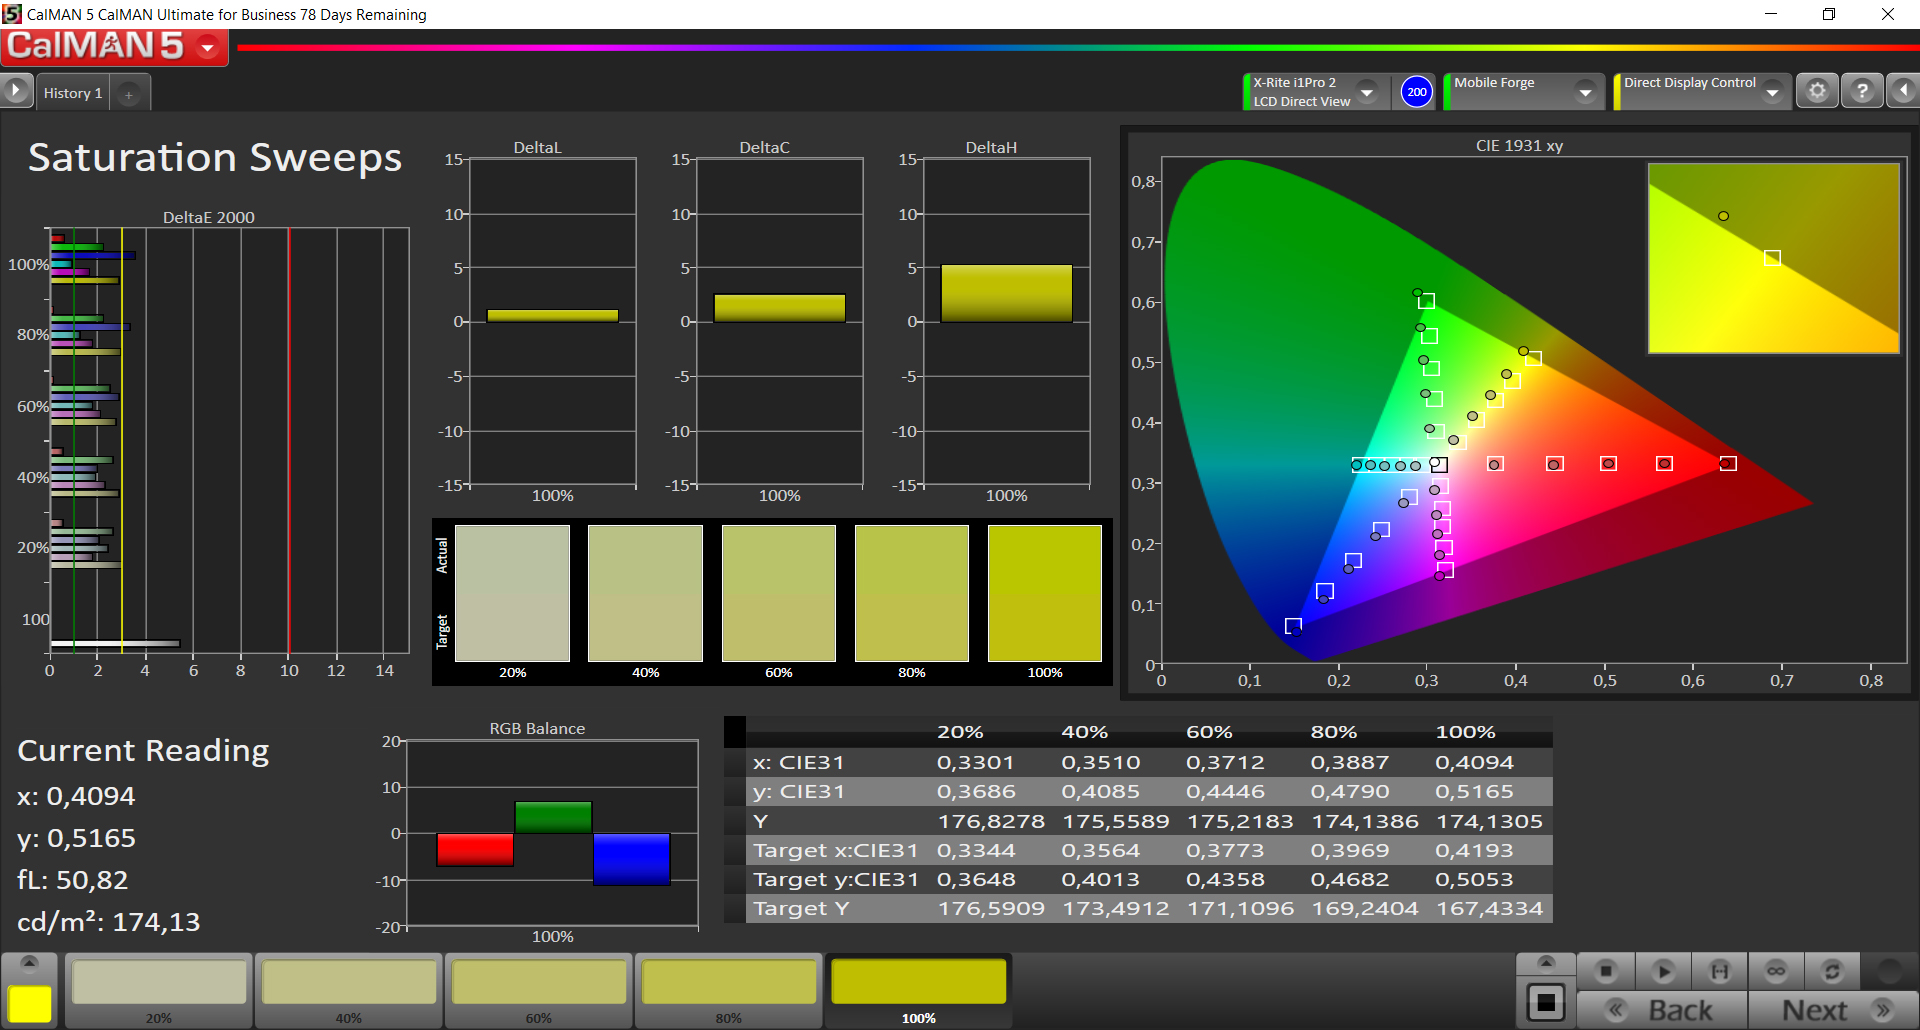
100% sRGB (Argyll 1.6.3 3D)
88.14% AdobeRGB 1998 (Argyll 1.6.3 3D)
99.7% AdobeRGB 1998 (Argyll 3D)
100% sRGB (Argyll 3D)
98.4% Display P3 (Argyll 3D)
Gamma: 2.23
CCT: 6843 K
| Lenovo Moto Z AMOLED, 2560x1440, 5.5" | Samsung Galaxy S7 Edge Super AMOLED, 2560x1440, 5.5" | LG G5 IPS Quantum, 2560x1440, 5.3" | Huawei P9 Plus AMOLED, 1920x1080, 5.5" | OnePlus 3 Optic-AMOLED, 1920x1080, 5.5" | Google Nexus 6P AMOLED, 2560x1440, 5.7" | Microsoft Lumia 950 XL AMOLED, 2560x1440, 5.7" | Apple iPhone 7 Plus IPS, 1920x1080, 5.5" | |
|---|---|---|---|---|---|---|---|---|
| Screen | ||||||||
| Brightness middle (cd/m²) | 485 | 554 14% | 784 62% | 361 -26% | 419 -14% | 363 -25% | 297 -39% | 557 15% |
| Brightness (cd/m²) | 490 | 552 13% | 774 58% | 366 -25% | 431 -12% | 365 -26% | 297 -39% | 553 13% |
| Brightness Distribution (%) | 92 | 96 4% | 91 -1% | 87 -5% | 84 -9% | 90 -2% | 93 1% | 97 5% |
| Black Level * (cd/m²) | 0.43 | 0.35 | ||||||
| Colorchecker dE 2000 * | 2.1 | 1.59 24% | 6.5 -210% | 5.1 -143% | 4.1 -95% | 2.34 -11% | 2.67 -27% | 1.4 33% |
| Colorchecker dE 2000 max. * | 5.5 | 2.56 53% | 11.7 -113% | 10 -82% | 12 -118% | 3.98 28% | 3.1 44% | |
| Greyscale dE 2000 * | 2.6 | 2.01 23% | 8 -208% | 5.5 -112% | 3.3 -27% | 1.03 60% | 2.81 -8% | 1.3 50% |
| Gamma | 2.23 99% | 2.01 109% | 2.22 99% | 2.24 98% | 2.1 105% | 2.23 99% | 2.08 106% | 2.21 100% |
| CCT | 6843 95% | 6321 103% | 8699 75% | 7388 88% | 6550 99% | 6429 101% | 6379 102% | 6667 97% |
| Color Space (Percent of AdobeRGB 1998) (%) | 88.14 | 82.12 -7% | 68.08 -23% | 89.38 1% | 66.31 -25% | 63.1 -28% | ||
| Color Space (Percent of sRGB) (%) | 100 | 99.98 0% | 97.46 -3% | 100 0% | 99.79 0% | 99.83 0% | ||
| Contrast (:1) | 1823 | 1591 |
* ... smaller is better
Screen Flickering / PWM (Pulse-Width Modulation)
| Screen flickering / PWM detected | 250 Hz | ≤ 100 % brightness setting | 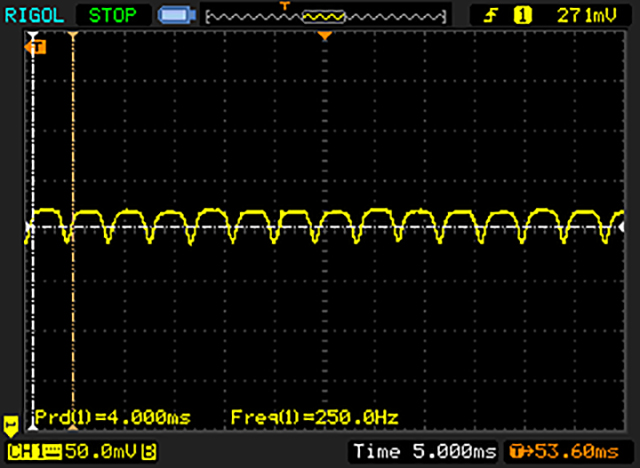 |
The display backlight flickers at 250 Hz (worst case, e.g., utilizing PWM) Flickering detected at a brightness setting of 100 % and below. There should be no flickering or PWM above this brightness setting. The frequency of 250 Hz is relatively low, so sensitive users will likely notice flickering and experience eyestrain at the stated brightness setting and below. In comparison: 52 % of all tested devices do not use PWM to dim the display. If PWM was detected, an average of 7741 (minimum: 5 - maximum: 343500) Hz was measured. | |||
Display Response Times
| ↔ Response Time Black to White | ||
|---|---|---|
| 5.6 ms ... rise ↗ and fall ↘ combined | ↗ 2.8 ms rise | 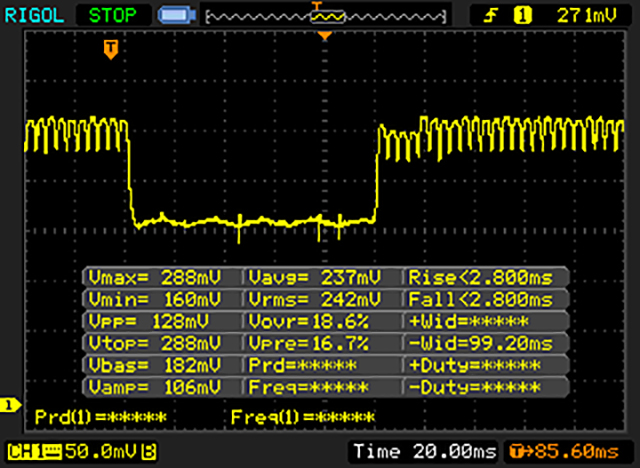 |
| ↘ 2.8 ms fall | ||
| The screen shows very fast response rates in our tests and should be very well suited for fast-paced gaming. In comparison, all tested devices range from 0.1 (minimum) to 240 (maximum) ms. » 18 % of all devices are better. This means that the measured response time is better than the average of all tested devices (19.8 ms). | ||
| ↔ Response Time 50% Grey to 80% Grey | ||
| 10.8 ms ... rise ↗ and fall ↘ combined | ↗ 5.2 ms rise | 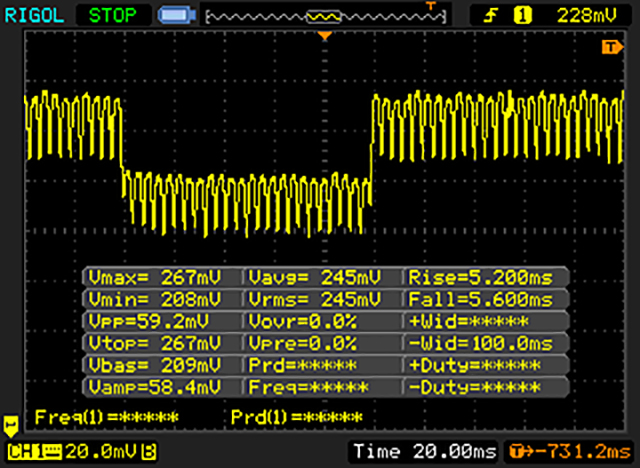 |
| ↘ 5.6 ms fall | ||
| The screen shows good response rates in our tests, but may be too slow for competitive gamers. In comparison, all tested devices range from 0.165 (minimum) to 636 (maximum) ms. » 25 % of all devices are better. This means that the measured response time is better than the average of all tested devices (30.9 ms). | ||
| AnTuTu v6 - Total Score (sort by value) | |
| Lenovo Moto Z | |
| Samsung Galaxy S7 Edge | |
| LG G5 | |
| Huawei P9 Plus | |
| OnePlus 3 | |
| Google Nexus 6P | |
| Microsoft Lumia 950 XL | |
| Apple iPhone 7 Plus | |
| Geekbench 3 | |
| 64 Bit Multi-Core Score (sort by value) | |
| Lenovo Moto Z | |
| Samsung Galaxy S7 Edge | |
| LG G5 | |
| Huawei P9 Plus | |
| OnePlus 3 | |
| Google Nexus 6P | |
| 64 Bit Single-Core Score (sort by value) | |
| Lenovo Moto Z | |
| Samsung Galaxy S7 Edge | |
| LG G5 | |
| Huawei P9 Plus | |
| OnePlus 3 | |
| Google Nexus 6P | |
| Geekbench 4.0 | |
| Compute RenderScript Score (sort by value) | |
| Lenovo Moto Z | |
| Samsung Galaxy S7 Edge | |
| LG G5 | |
| OnePlus 3 | |
| 64 Bit Multi-Core Score (sort by value) | |
| Lenovo Moto Z | |
| Samsung Galaxy S7 Edge | |
| LG G5 | |
| OnePlus 3 | |
| Apple iPhone 7 Plus | |
| 64 Bit Single-Core Score (sort by value) | |
| Lenovo Moto Z | |
| Samsung Galaxy S7 Edge | |
| LG G5 | |
| OnePlus 3 | |
| Apple iPhone 7 Plus | |
| ANDEBench PRO | |
| 3D (sort by value) | |
| Lenovo Moto Z | |
| LG G5 | |
| OnePlus 3 | |
| Platform (sort by value) | |
| Lenovo Moto Z | |
| LG G5 | |
| OnePlus 3 | |
| Storage (sort by value) | |
| Lenovo Moto Z | |
| LG G5 | |
| OnePlus 3 | |
| Memory Latency (sort by value) | |
| Lenovo Moto Z | |
| LG G5 | |
| OnePlus 3 | |
| Memory Bandwidth (sort by value) | |
| Lenovo Moto Z | |
| LG G5 | |
| OnePlus 3 | |
| CoreMark-PRO/HPC (Base) (sort by value) | |
| Lenovo Moto Z | |
| LG G5 | |
| OnePlus 3 | |
| Device Score (sort by value) | |
| Lenovo Moto Z | |
| LG G5 | |
| OnePlus 3 | |
| PCMark for Android - Work performance score (sort by value) | |
| Lenovo Moto Z | |
| Samsung Galaxy S7 Edge | |
| LG G5 | |
| Huawei P9 Plus | |
| OnePlus 3 | |
| Google Nexus 6P | |
| Basemark ES 3.1 / Metal - offscreen Overall Score (sort by value) | |
| Lenovo Moto Z | |
| Samsung Galaxy S7 Edge | |
| LG G5 | |
| OnePlus 3 | |
| Apple iPhone 7 Plus | |
| GFXBench (DX / GLBenchmark) 2.7 | |
| T-Rex Onscreen (sort by value) | |
| Lenovo Moto Z | |
| Samsung Galaxy S7 Edge | |
| LG G5 | |
| Huawei P9 Plus | |
| OnePlus 3 | |
| Google Nexus 6P | |
| Microsoft Lumia 950 XL | |
| Apple iPhone 7 Plus | |
| 1920x1080 T-Rex Offscreen (sort by value) | |
| Lenovo Moto Z | |
| Samsung Galaxy S7 Edge | |
| LG G5 | |
| Huawei P9 Plus | |
| OnePlus 3 | |
| Google Nexus 6P | |
| Microsoft Lumia 950 XL | |
| Apple iPhone 7 Plus | |
| GFXBench 3.0 | |
| 1920x1080 1080p Manhattan Offscreen (sort by value) | |
| Lenovo Moto Z | |
| Samsung Galaxy S7 Edge | |
| LG G5 | |
| Huawei P9 Plus | |
| OnePlus 3 | |
| Google Nexus 6P | |
| Microsoft Lumia 950 XL | |
| Apple iPhone 7 Plus | |
| on screen Manhattan Onscreen OGL (sort by value) | |
| Lenovo Moto Z | |
| Samsung Galaxy S7 Edge | |
| LG G5 | |
| Huawei P9 Plus | |
| OnePlus 3 | |
| Google Nexus 6P | |
| Microsoft Lumia 950 XL | |
| Apple iPhone 7 Plus | |
| GFXBench 3.1 | |
| 1920x1080 Manhattan ES 3.1 Offscreen (sort by value) | |
| Lenovo Moto Z | |
| Samsung Galaxy S7 Edge | |
| LG G5 | |
| Huawei P9 Plus | |
| OnePlus 3 | |
| Google Nexus 6P | |
| Apple iPhone 7 Plus | |
| on screen Manhattan ES 3.1 Onscreen (sort by value) | |
| Lenovo Moto Z | |
| Samsung Galaxy S7 Edge | |
| LG G5 | |
| Huawei P9 Plus | |
| OnePlus 3 | |
| Google Nexus 6P | |
| Apple iPhone 7 Plus | |
| GFXBench | |
| 1920x1080 Car Chase Offscreen (sort by value) | |
| Lenovo Moto Z | |
| Samsung Galaxy S7 Edge | |
| LG G5 | |
| Huawei P9 Plus | |
| OnePlus 3 | |
| on screen Car Chase Onscreen (sort by value) | |
| Lenovo Moto Z | |
| Samsung Galaxy S7 Edge | |
| LG G5 | |
| Huawei P9 Plus | |
| OnePlus 3 | |
| 3DMark | |
| 1280x720 offscreen Ice Storm Unlimited Score (sort by value) | |
| Lenovo Moto Z | |
| Samsung Galaxy S7 Edge | |
| LG G5 | |
| Huawei P9 Plus | |
| OnePlus 3 | |
| Google Nexus 6P | |
| Apple iPhone 7 Plus | |
| 1280x720 offscreen Ice Storm Unlimited Graphics Score (sort by value) | |
| Lenovo Moto Z | |
| Samsung Galaxy S7 Edge | |
| LG G5 | |
| Huawei P9 Plus | |
| OnePlus 3 | |
| Google Nexus 6P | |
| Apple iPhone 7 Plus | |
| 1280x720 offscreen Ice Storm Unlimited Physics (sort by value) | |
| Lenovo Moto Z | |
| Samsung Galaxy S7 Edge | |
| LG G5 | |
| Huawei P9 Plus | |
| OnePlus 3 | |
| Google Nexus 6P | |
| Apple iPhone 7 Plus | |
| 2560x1440 Sling Shot OpenGL ES 3.0 Physics (sort by value) | |
| Lenovo Moto Z | |
| Samsung Galaxy S7 Edge | |
| LG G5 | |
| Huawei P9 Plus | |
| OnePlus 3 | |
| Google Nexus 6P | |
| Apple iPhone 7 Plus | |
| 2560x1440 Sling Shot OpenGL ES 3.0 Graphics (sort by value) | |
| Lenovo Moto Z | |
| Samsung Galaxy S7 Edge | |
| LG G5 | |
| Huawei P9 Plus | |
| OnePlus 3 | |
| Google Nexus 6P | |
| Apple iPhone 7 Plus | |
| 2560x1440 Sling Shot OpenGL ES 3.0 (sort by value) | |
| Lenovo Moto Z | |
| Samsung Galaxy S7 Edge | |
| LG G5 | |
| Huawei P9 Plus | |
| OnePlus 3 | |
| Google Nexus 6P | |
| Apple iPhone 7 Plus | |
| Lightmark - 1920x1080 1080p (sort by value) | |
| Lenovo Moto Z | |
| Samsung Galaxy S7 Edge | |
| LG G5 | |
| OnePlus 3 | |
| Epic Citadel - Ultra High Quality (sort by value) | |
| Lenovo Moto Z | |
| Samsung Galaxy S7 Edge | |
| LG G5 | |
| OnePlus 3 | |
| Basemark X 1.1 | |
| High Quality (sort by value) | |
| Lenovo Moto Z | |
| Samsung Galaxy S7 Edge | |
| LG G5 | |
| OnePlus 3 | |
| Medium Quality (sort by value) | |
| Lenovo Moto Z | |
| Samsung Galaxy S7 Edge | |
| LG G5 | |
| OnePlus 3 | |
| Microsoft Lumia 950 XL | |
| Mozilla Kraken 1.1 - Total (sort by value) | |
| Lenovo Moto Z | |
| Samsung Galaxy S7 Edge | |
| LG G5 | |
| Huawei P9 Plus | |
| OnePlus 3 | |
| Google Nexus 6P | |
| Microsoft Lumia 950 XL | |
| Apple iPhone 7 Plus | |
| Octane V2 - Total Score (sort by value) | |
| Lenovo Moto Z | |
| Samsung Galaxy S7 Edge | |
| LG G5 | |
| Huawei P9 Plus | |
| OnePlus 3 | |
| Google Nexus 6P | |
| Microsoft Lumia 950 XL | |
| Apple iPhone 7 Plus | |
| WebXPRT 2015 - Overall (sort by value) | |
| Lenovo Moto Z | |
| Samsung Galaxy S7 Edge | |
| LG G5 | |
| Huawei P9 Plus | |
| OnePlus 3 | |
| Google Nexus 6P | |
| Microsoft Lumia 950 XL | |
| Apple iPhone 7 Plus | |
| JetStream 1.1 - 1.1 Total (sort by value) | |
| Lenovo Moto Z | |
| Samsung Galaxy S7 Edge | |
| LG G5 | |
| Huawei P9 Plus | |
| OnePlus 3 | |
| Google Nexus 6P | |
| Microsoft Lumia 950 XL | |
| Apple iPhone 7 Plus | |
| Vellamo 3.x - Browser (sort by value) | |
| Lenovo Moto Z | |
| Samsung Galaxy S7 Edge | |
| LG G5 | |
| OnePlus 3 | |
| BaseMark OS II - Web (sort by value) | |
| Lenovo Moto Z | |
| Samsung Galaxy S7 Edge | |
| LG G5 | |
| Huawei P9 Plus | |
| OnePlus 3 | |
| Google Nexus 6P | |
| Microsoft Lumia 950 XL | |
| Apple iPhone 7 Plus | |
* ... smaller is better
| AndroBench 3-5 | |
| Random Read 4KB (sort by value) | |
| Lenovo Moto Z | |
| Samsung Galaxy S7 Edge | |
| LG G5 | |
| Huawei P9 Plus | |
| OnePlus 3 | |
| Google Nexus 6P | |
| Random Write 4KB (sort by value) | |
| Lenovo Moto Z | |
| Samsung Galaxy S7 Edge | |
| LG G5 | |
| Huawei P9 Plus | |
| OnePlus 3 | |
| Google Nexus 6P | |
| Sequential Write 256KB (sort by value) | |
| Lenovo Moto Z | |
| Samsung Galaxy S7 Edge | |
| LG G5 | |
| Huawei P9 Plus | |
| OnePlus 3 | |
| Google Nexus 6P | |
| Sequential Read 256KB (sort by value) | |
| Lenovo Moto Z | |
| Samsung Galaxy S7 Edge | |
| LG G5 | |
| Huawei P9 Plus | |
| OnePlus 3 | |
| Google Nexus 6P | |
| Sequential Write 256KB SDCard (sort by value) | |
| Lenovo Moto Z | |
| Samsung Galaxy S7 Edge | |
| LG G5 | |
| Huawei P9 Plus | |
| Sequential Read 256KB SDCard (sort by value) | |
| Lenovo Moto Z | |
| Samsung Galaxy S7 Edge | |
| LG G5 | |
| Huawei P9 Plus | |
| BaseMark OS II - Memory (sort by value) | |
| Lenovo Moto Z | |
| Samsung Galaxy S7 Edge | |
| LG G5 | |
| Huawei P9 Plus | |
| OnePlus 3 | |
| Google Nexus 6P | |
| Microsoft Lumia 950 XL | |
| Apple iPhone 7 Plus | |
| Asphalt 8: Airborne | |||
| Settings | Value | ||
| high | 29 fps | ||
| very low | 29 fps | ||
| Dead Trigger 2 | |||
| Settings | Value | ||
| high | 60 fps | ||
(±) The maximum temperature on the upper side is 42.4 °C / 108 F, compared to the average of 35.3 °C / 96 F, ranging from 21.9 to 247 °C for the class Smartphone.
(±) The bottom heats up to a maximum of 40.6 °C / 105 F, compared to the average of 34 °C / 93 F
(±) In idle usage, the average temperature for the upper side is 32.8 °C / 91 F, compared to the device average of 33 °C / 91 F.
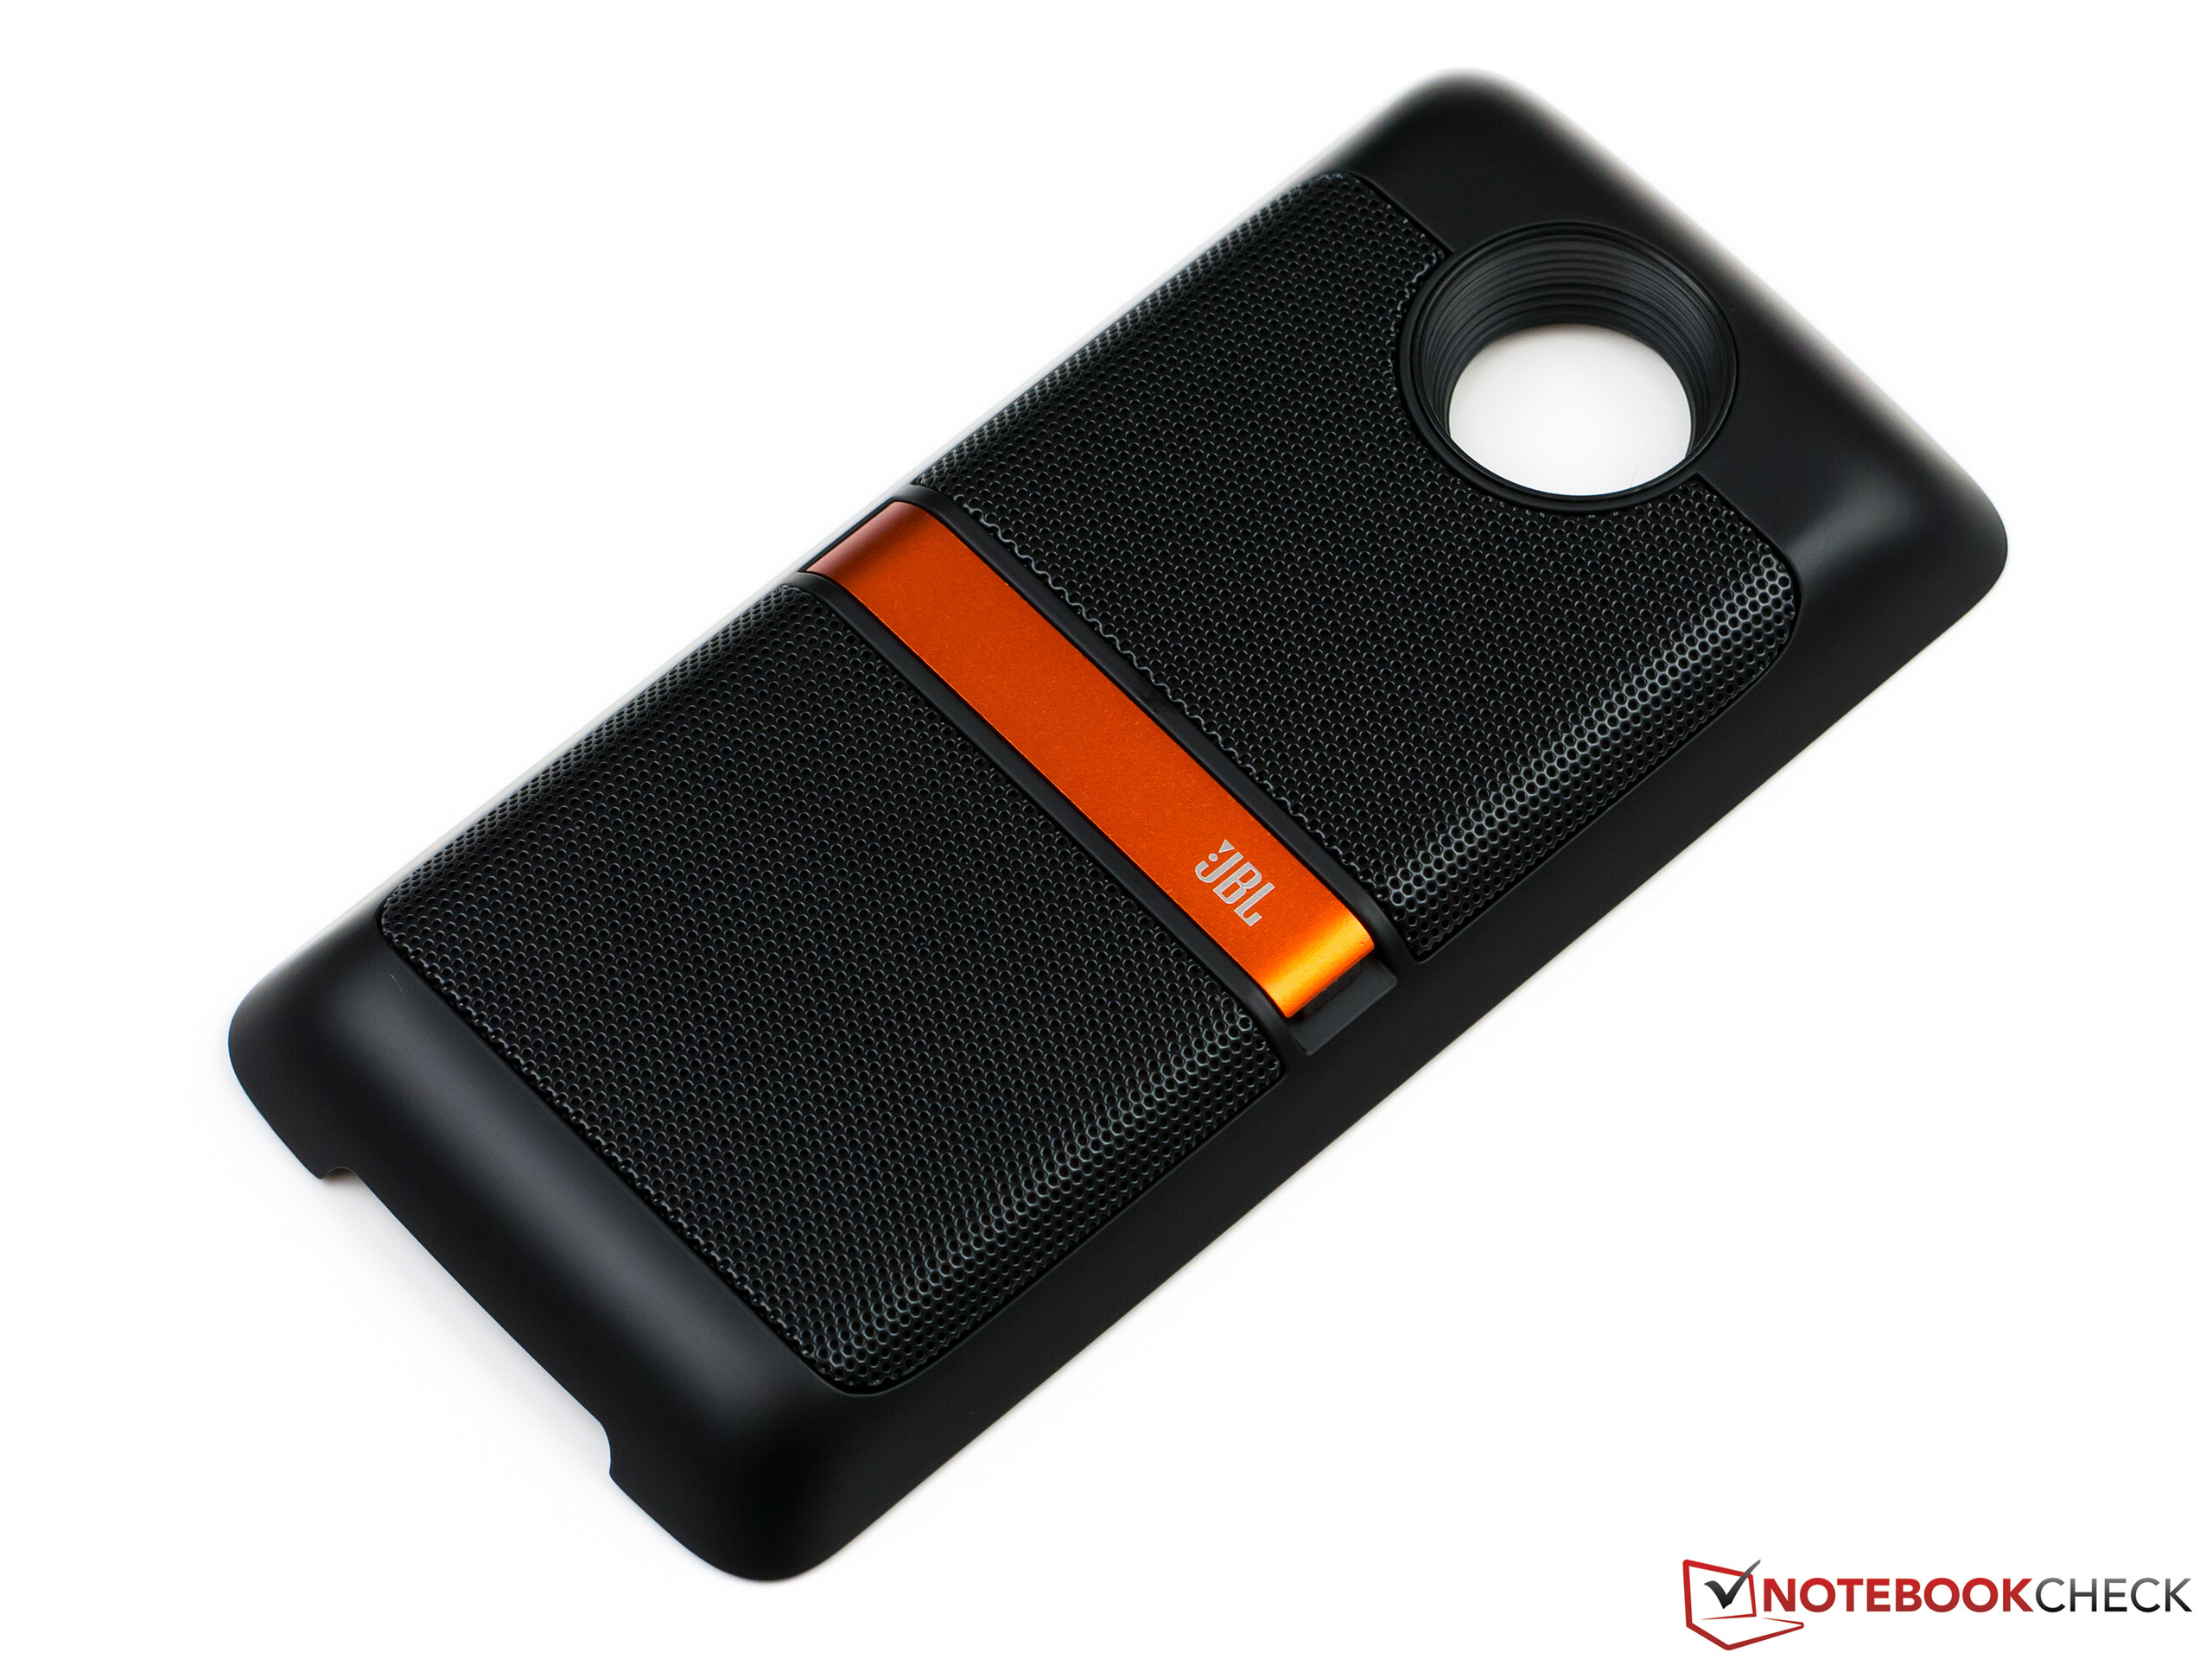
Lenovo Moto Z audio analysis
(+) | speakers can play relatively loud (83.9 dB)
Bass 100 - 315 Hz
(-) | nearly no bass - on average 34.4% lower than median
(±) | linearity of bass is average (8.2% delta to prev. frequency)
Mids 400 - 2000 Hz
(±) | reduced mids - on average 5.4% lower than median
(+) | mids are linear (6% delta to prev. frequency)
Highs 2 - 16 kHz
(+) | balanced highs - only 2.3% away from median
(+) | highs are linear (1.8% delta to prev. frequency)
Overall 100 - 16.000 Hz
(±) | linearity of overall sound is average (23.5% difference to median)
Compared to same class
» 54% of all tested devices in this class were better, 8% similar, 38% worse
» The best had a delta of 11%, average was 34%, worst was 134%
Compared to all devices tested
» 70% of all tested devices were better, 6% similar, 24% worse
» The best had a delta of 4%, average was 23%, worst was 134%
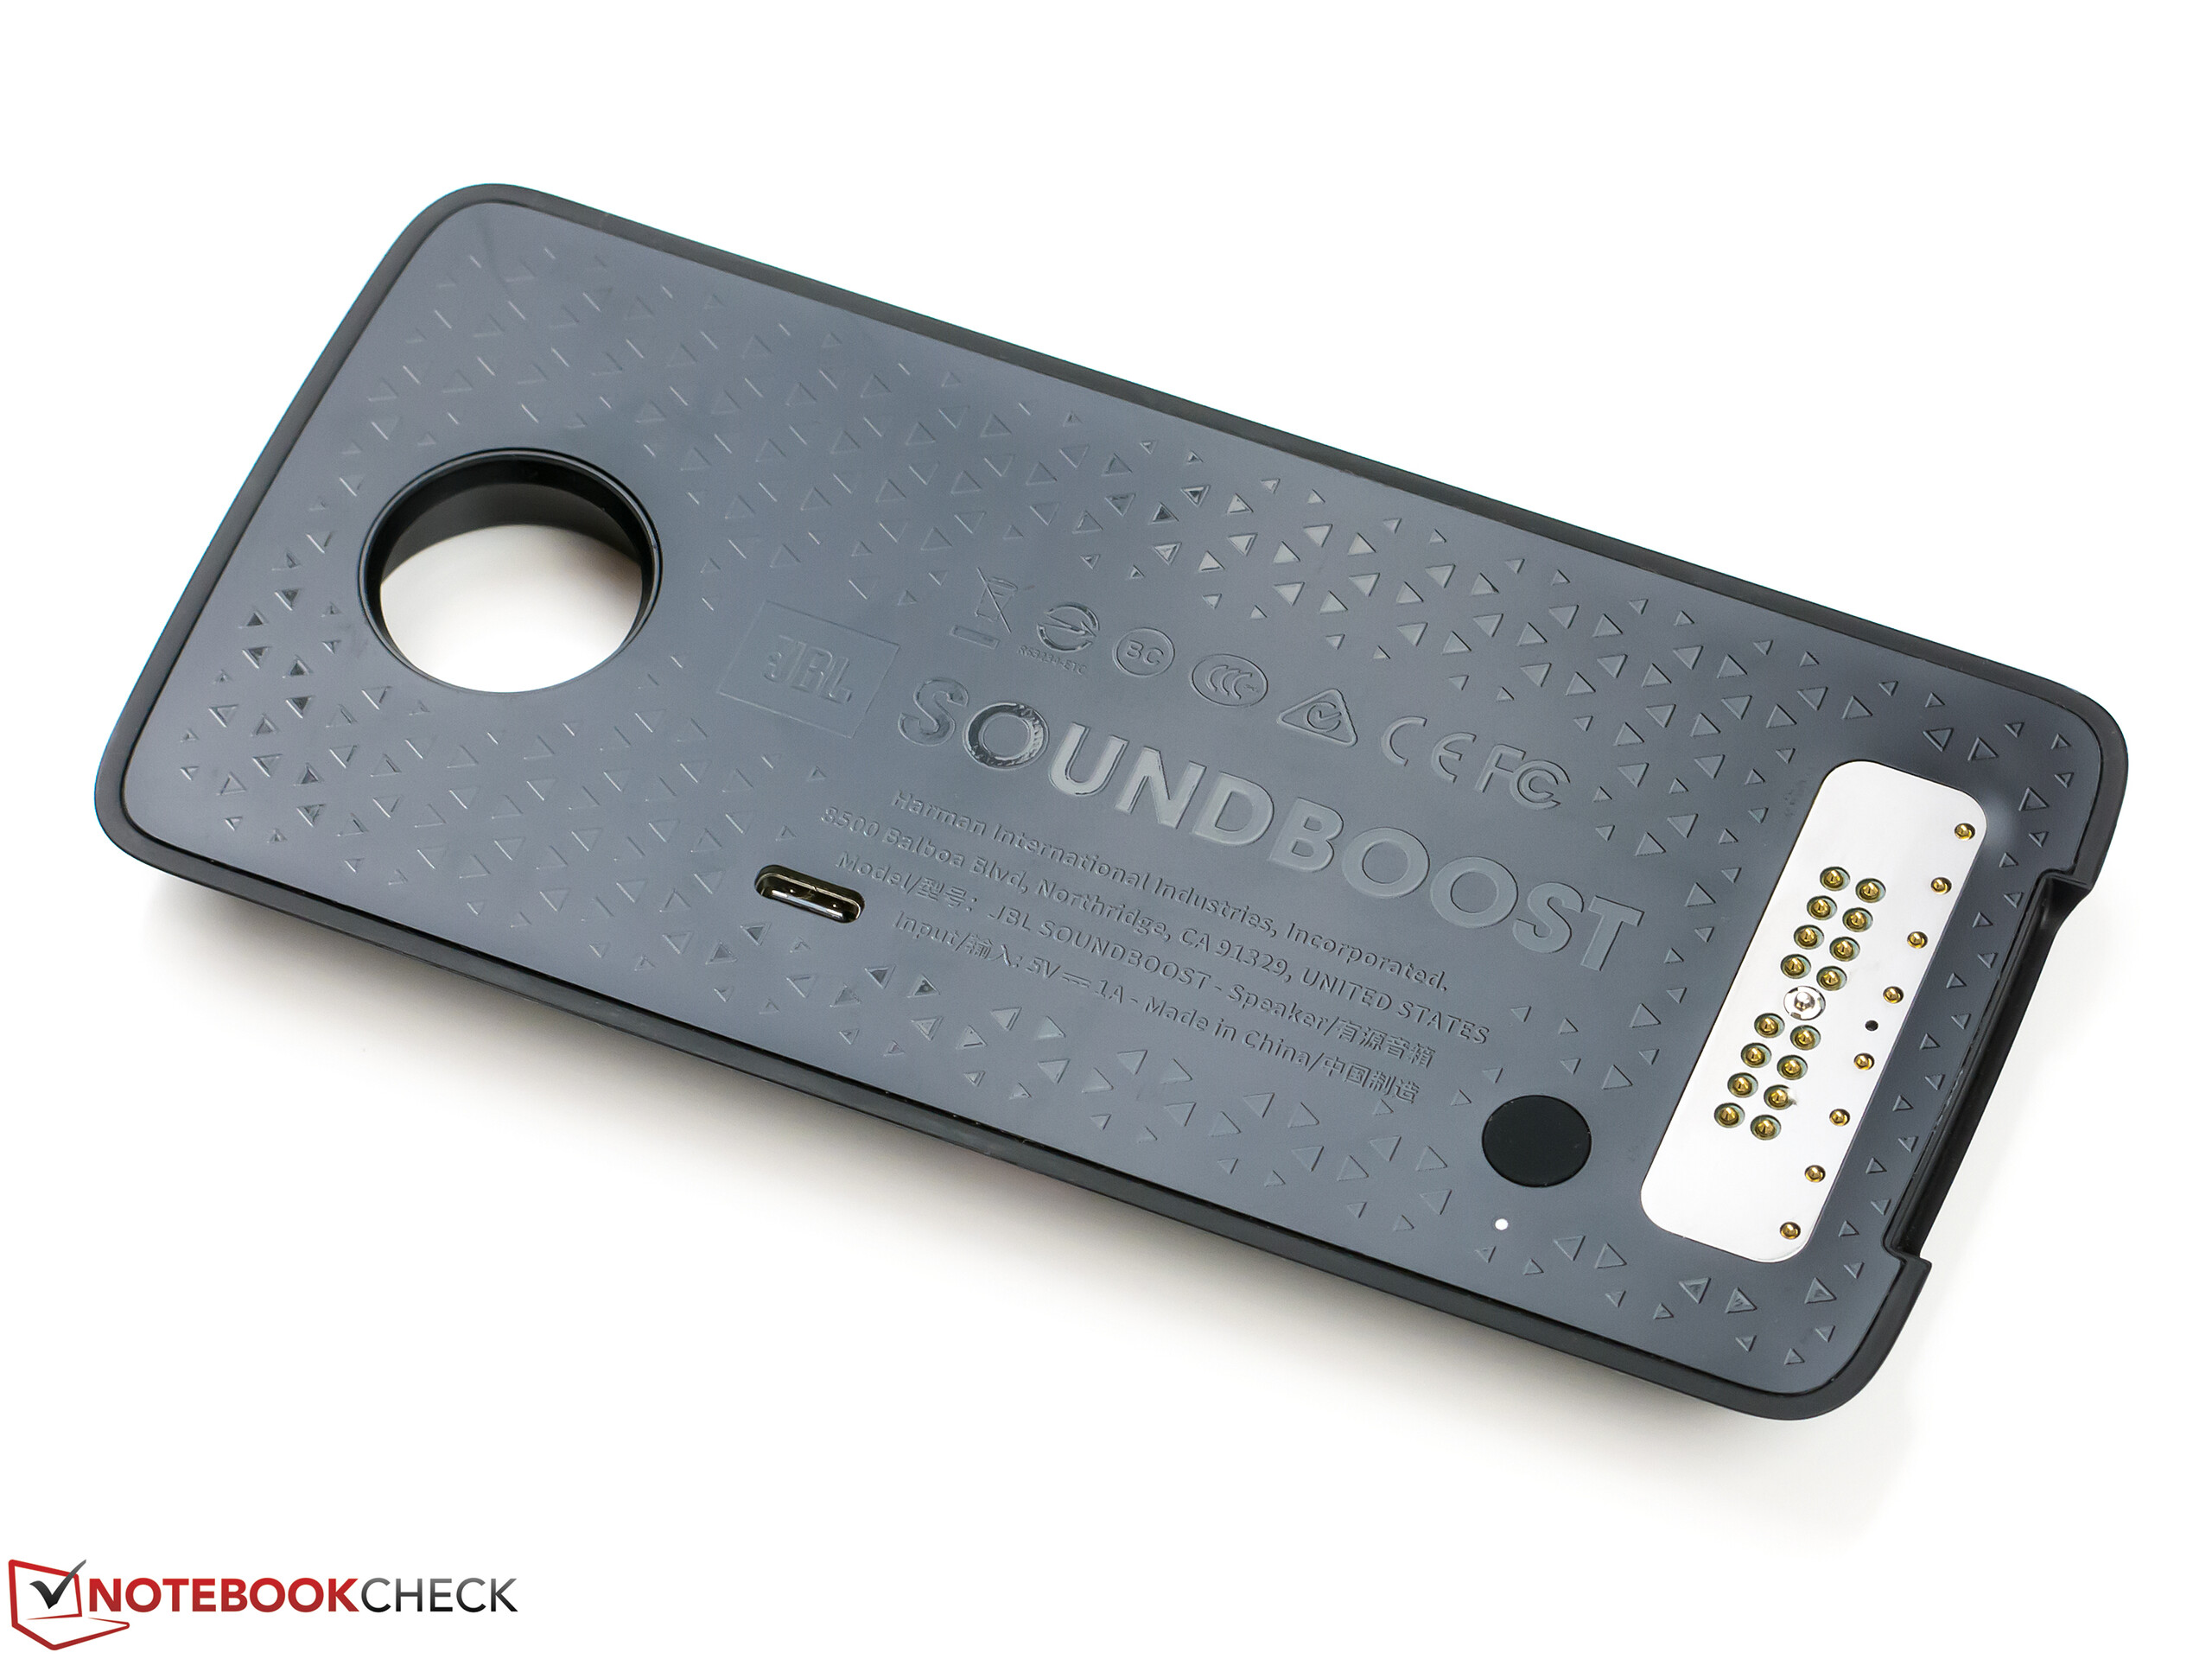
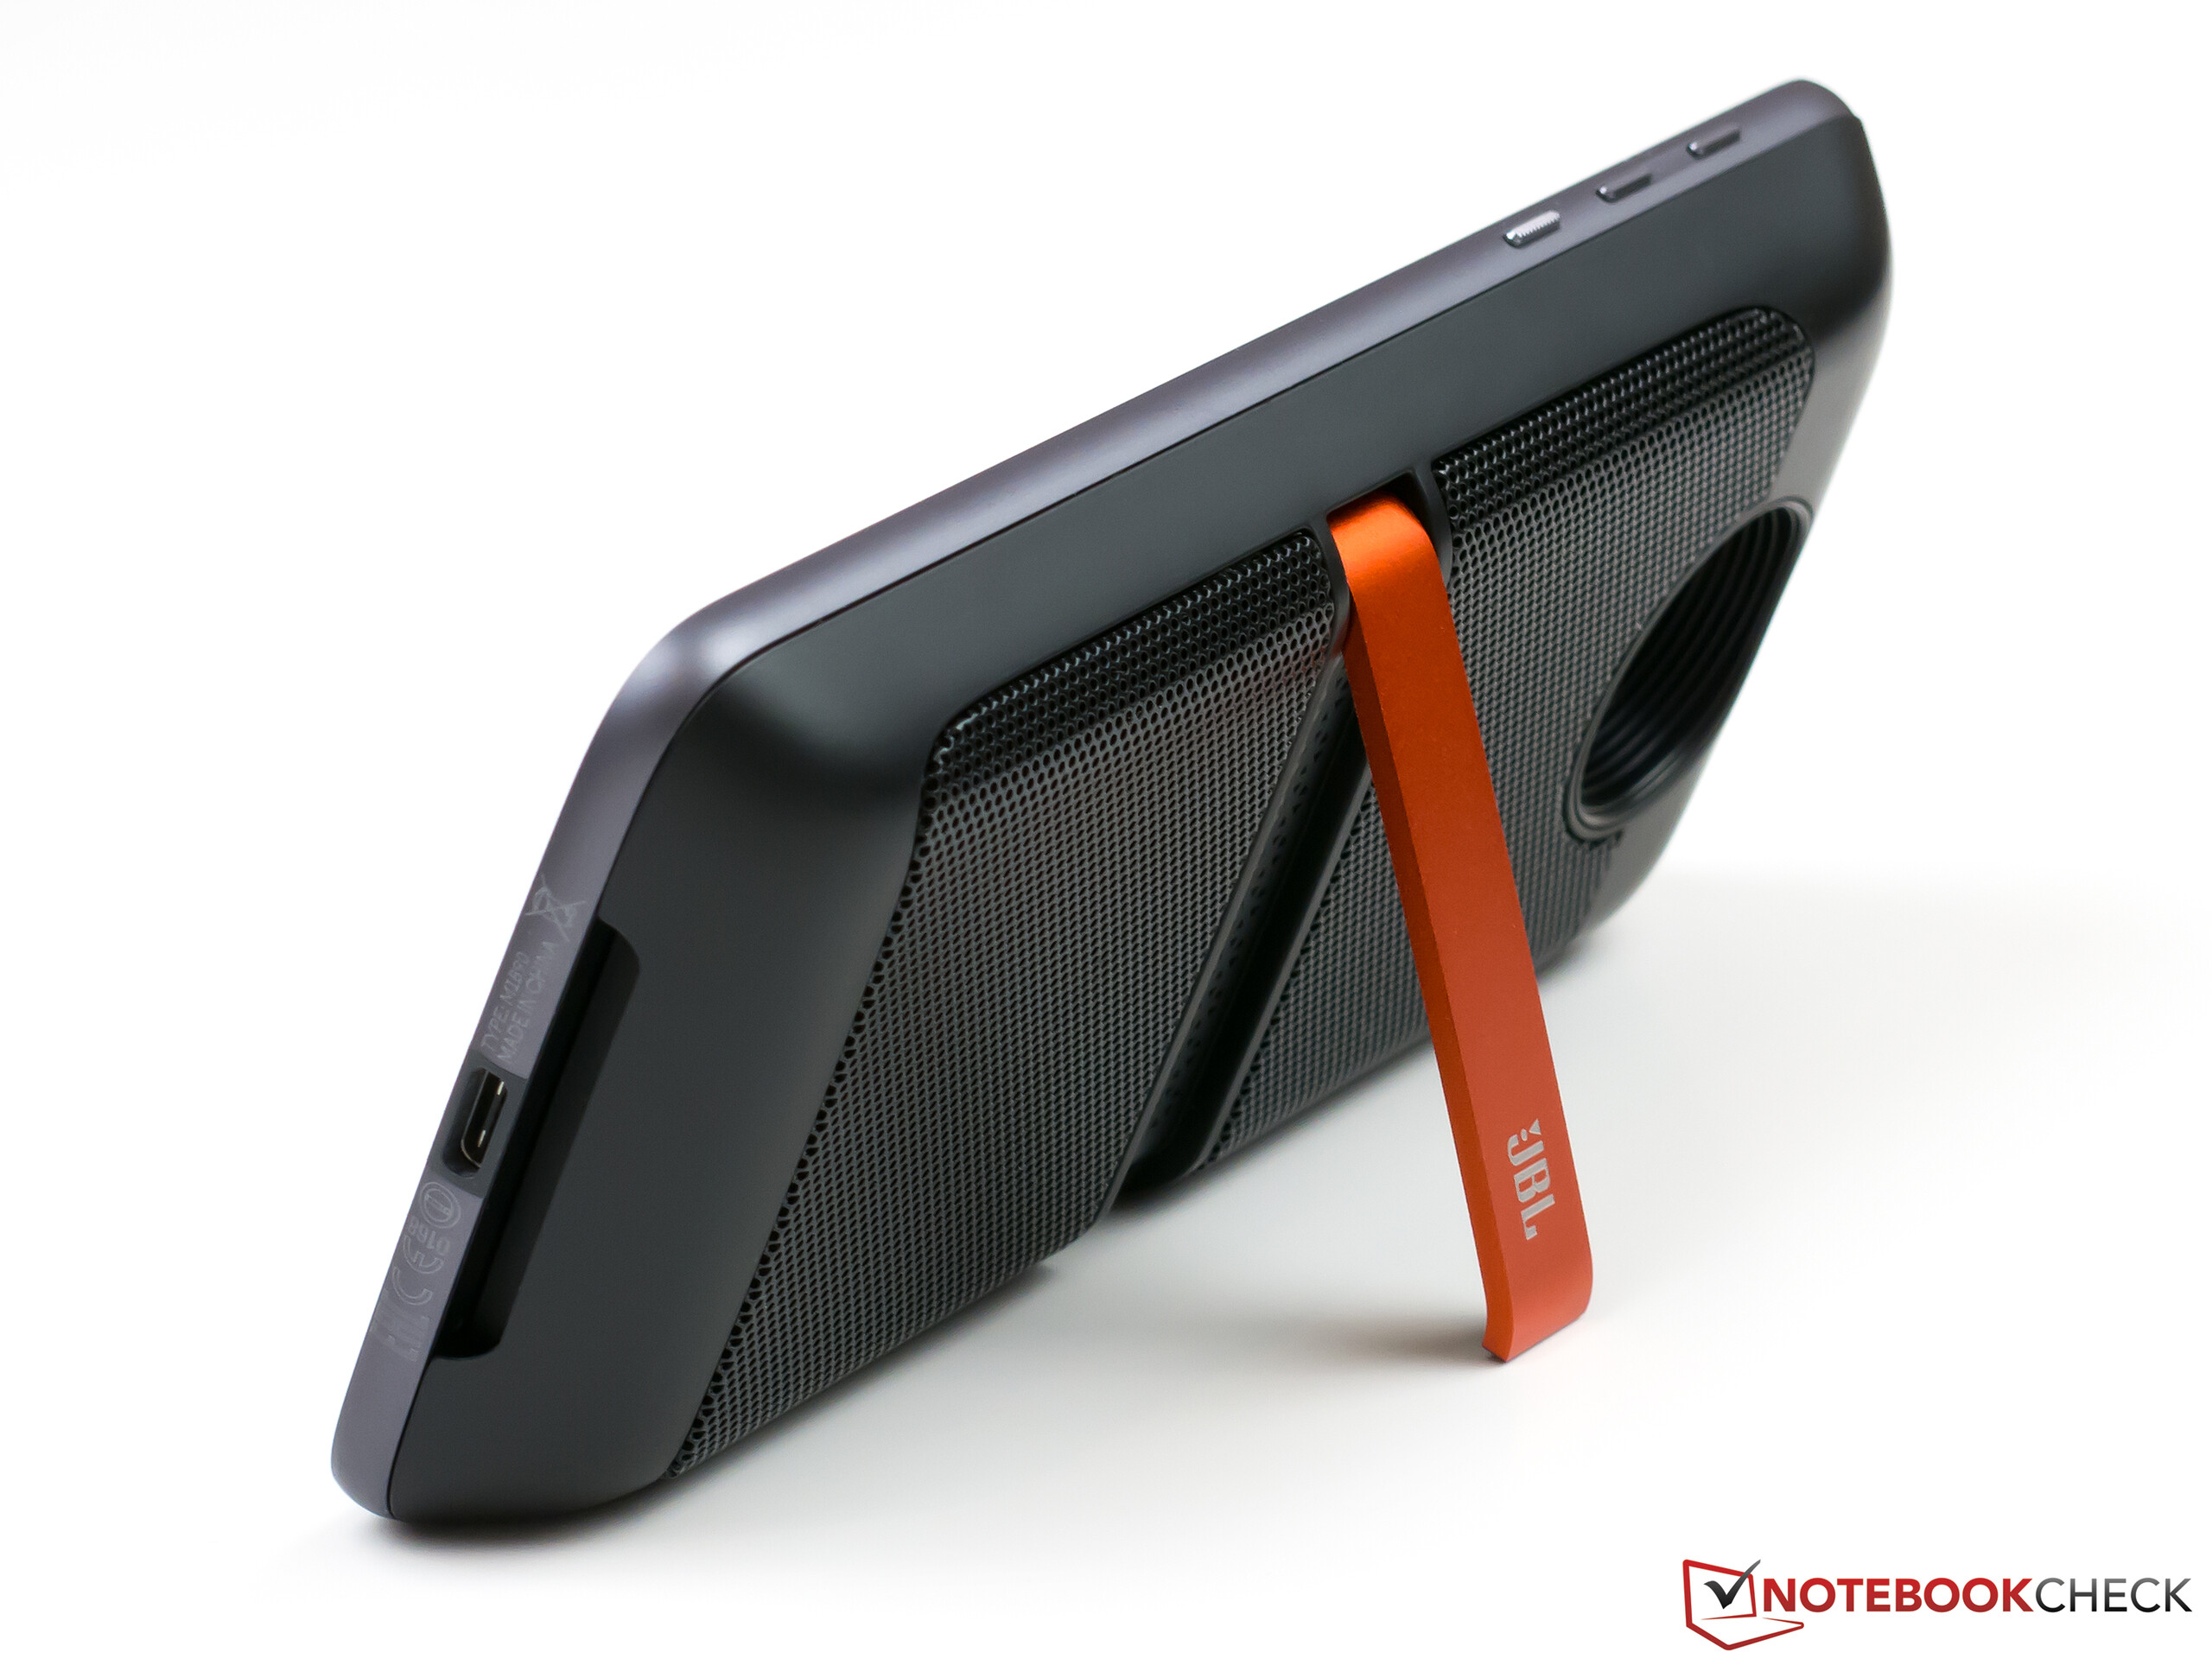
no name audio analysis
(+) | speakers can play relatively loud (95.2 dB)
Bass 100 - 315 Hz
(±) | reduced bass - on average 11.6% lower than median
(±) | linearity of bass is average (7.4% delta to prev. frequency)
Mids 400 - 2000 Hz
(+) | balanced mids - only 2.7% away from median
(+) | mids are linear (2.6% delta to prev. frequency)
Highs 2 - 16 kHz
(+) | balanced highs - only 2.4% away from median
(+) | highs are linear (3.8% delta to prev. frequency)
Overall 100 - 16.000 Hz
(+) | overall sound is linear (10.5% difference to median)
Compared to same class
» 5% of all tested devices in this class were better, 1% similar, 93% worse
» The best had a delta of 4%, average was 23%, worst was 134%
Compared to all devices tested
» 5% of all tested devices were better, 1% similar, 93% worse
» The best had a delta of 4%, average was 23%, worst was 134%
LG G5 audio analysis
(+) | speakers can play relatively loud (86.4 dB)
Bass 100 - 315 Hz
(-) | nearly no bass - on average 28.3% lower than median
(±) | linearity of bass is average (12.5% delta to prev. frequency)
Mids 400 - 2000 Hz
(+) | balanced mids - only 3.6% away from median
(+) | mids are linear (4.3% delta to prev. frequency)
Highs 2 - 16 kHz
(+) | balanced highs - only 3.8% away from median
(+) | highs are linear (1.9% delta to prev. frequency)
Overall 100 - 16.000 Hz
(±) | linearity of overall sound is average (18.8% difference to median)
Compared to same class
» 23% of all tested devices in this class were better, 10% similar, 67% worse
» The best had a delta of 11%, average was 34%, worst was 134%
Compared to all devices tested
» 44% of all tested devices were better, 8% similar, 49% worse
» The best had a delta of 4%, average was 23%, worst was 134%
| Off / Standby | |
| Idle | |
| Load |
|
Key:
min: | |
| Lenovo Moto Z 2600 mAh | Samsung Galaxy S7 Edge 3600 mAh | LG G5 2800 mAh | Huawei P9 Plus 3400 mAh | OnePlus 3 3000 mAh | Google Nexus 6P 3450 mAh | Microsoft Lumia 950 XL 3340 mAh | Apple iPhone 7 Plus 2915 mAh | |
|---|---|---|---|---|---|---|---|---|
| Power Consumption | -15% | -38% | -11% | -22% | -29% | -172% | -49% | |
| Idle Minimum * (Watt) | 0.66 | 0.63 5% | 0.55 17% | 0.87 -32% | 0.57 14% | 0.83 -26% | 2.85 -332% | 0.77 -17% |
| Idle Average * (Watt) | 1.01 | 1.1 -9% | 1.37 -36% | 1.2 -19% | 1.24 -23% | 1.09 -8% | 2.95 -192% | 2.04 -102% |
| Idle Maximum * (Watt) | 1.09 | 1.56 -43% | 2.25 -106% | 1.27 -17% | 1.36 -25% | 1.17 -7% | 3.26 -199% | 2.24 -106% |
| Load Average * (Watt) | 3.97 | 5.95 -50% | 6.24 -57% | 4.69 -18% | 5.92 -49% | 7.49 -89% | 8.92 -125% | 4.69 -18% |
| Load Maximum * (Watt) | 8.34 | 6.7 20% | 9.12 -9% | 5.63 32% | 10.53 -26% | 9.51 -14% | 9.39 -13% | 8.66 -4% |
* ... smaller is better
| Lenovo Moto Z 2600 mAh | Samsung Galaxy S7 Edge 3600 mAh | LG G5 2800 mAh | Huawei P9 Plus 3400 mAh | OnePlus 3 3000 mAh | Google Nexus 6P 3450 mAh | Microsoft Lumia 950 XL 3340 mAh | Apple iPhone 7 Plus 2915 mAh | |
|---|---|---|---|---|---|---|---|---|
| Battery runtime | 37% | -1% | 6% | 26% | -10% | -22% | 16% | |
| Reader / Idle (h) | 22.9 | 27.7 21% | 30.6 34% | 24.1 5% | 22.3 -3% | 24.1 5% | 18 -21% | 30.6 34% |
| H.264 (h) | 12.1 | 15.2 26% | 10 -17% | 12.9 7% | 14.1 17% | 8.9 -26% | 10.2 -16% | 13.6 12% |
| WiFi v1.3 (h) | 6.8 | 12.2 79% | 6.5 -4% | 8.8 29% | 14 106% | 6.3 -7% | 6.2 -9% | 9.8 44% |
| Load (h) | 5.3 | 6.5 23% | 4.5 -15% | 4.4 -17% | 4.5 -15% | 4.7 -11% | 3 -43% | 3.8 -28% |
Pros
Cons

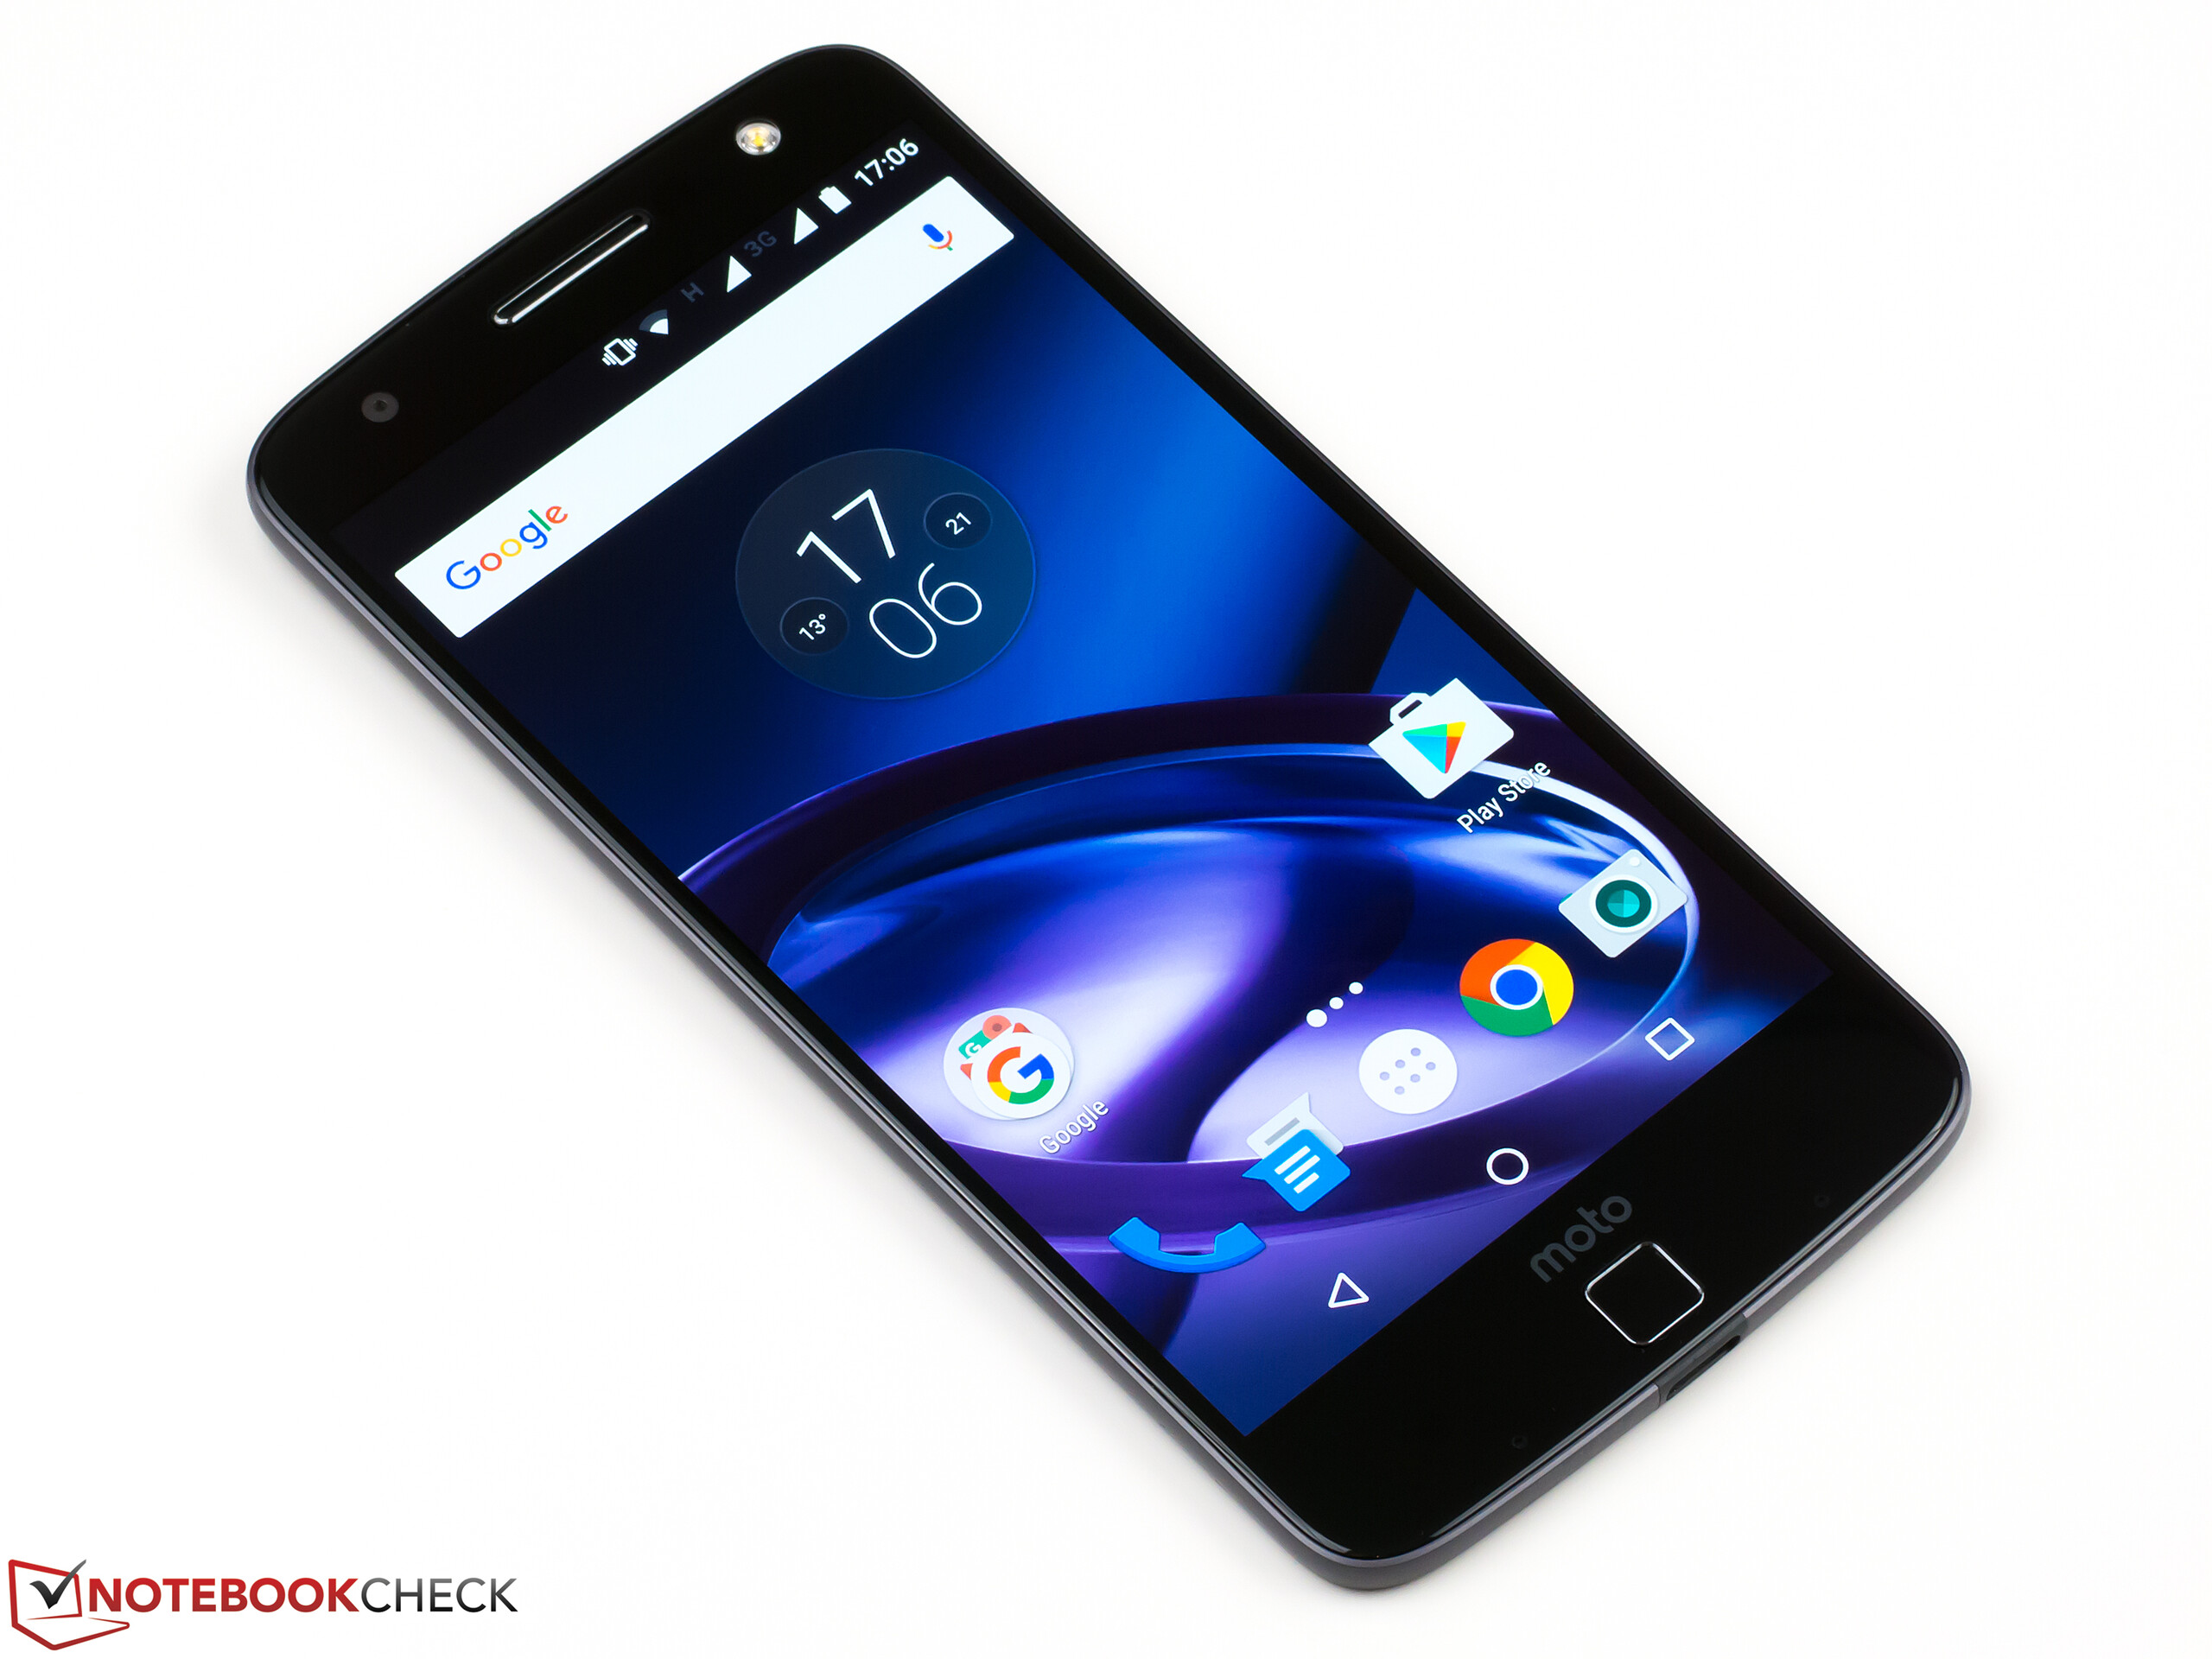
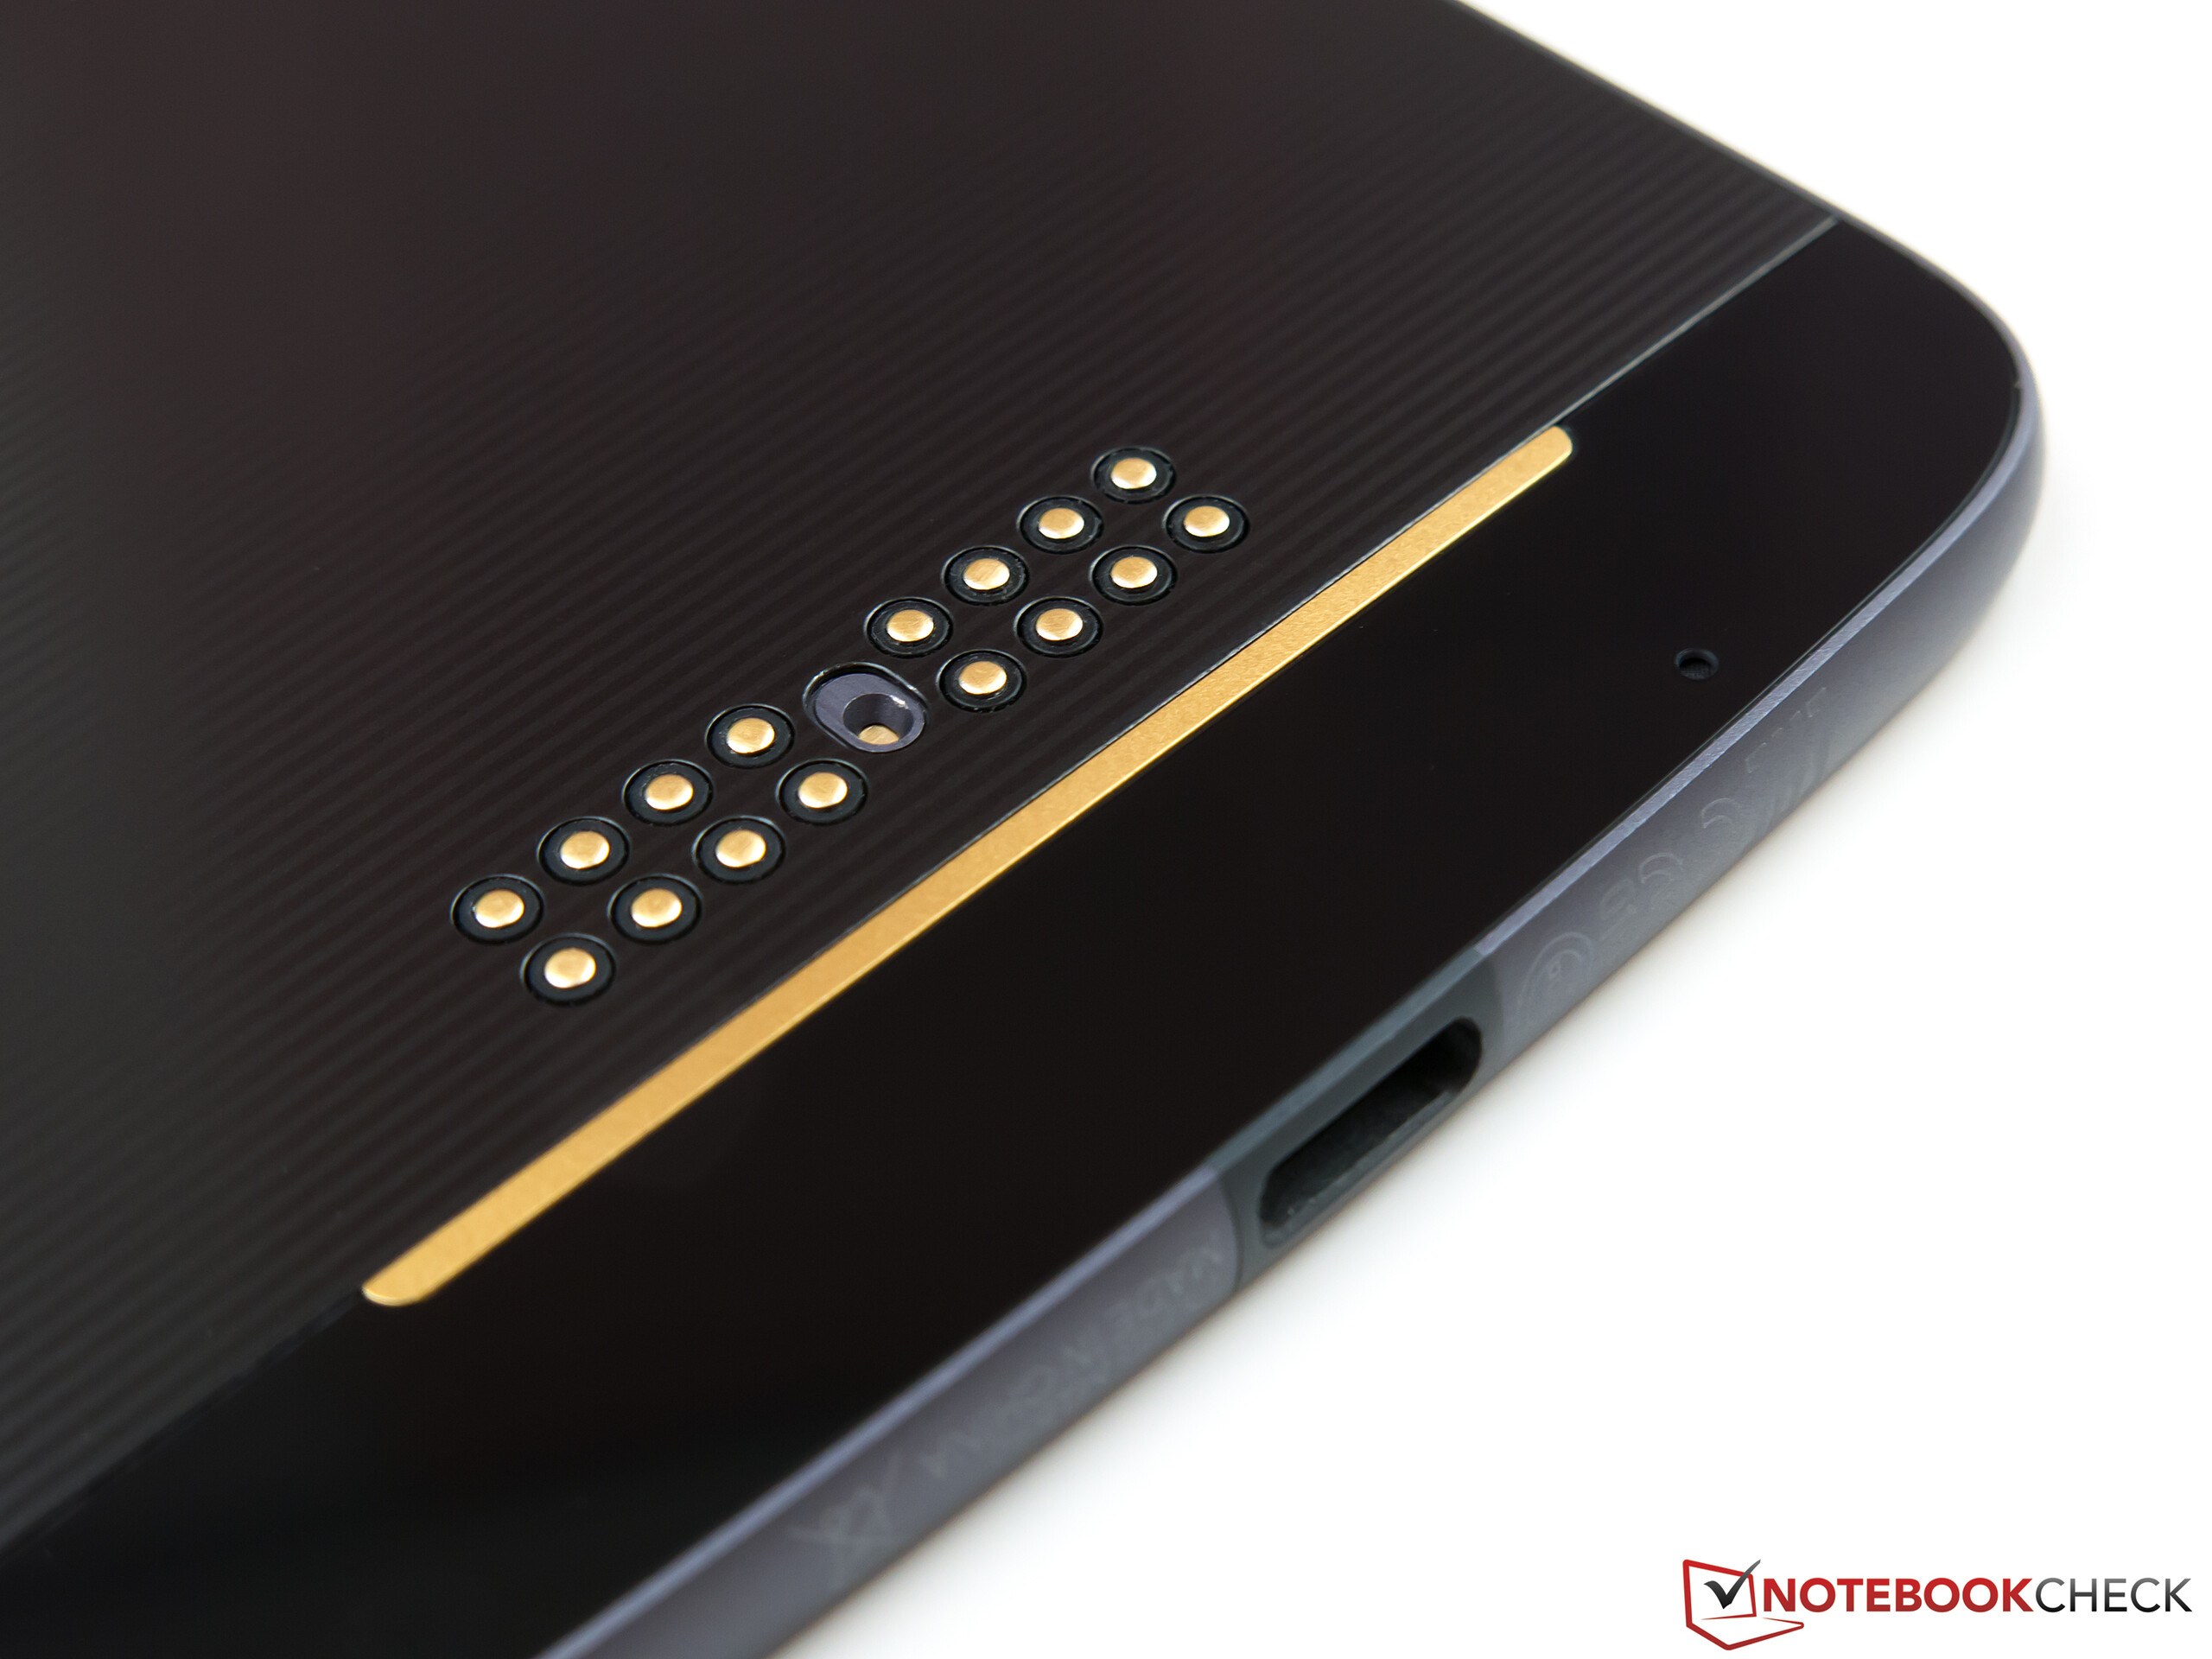
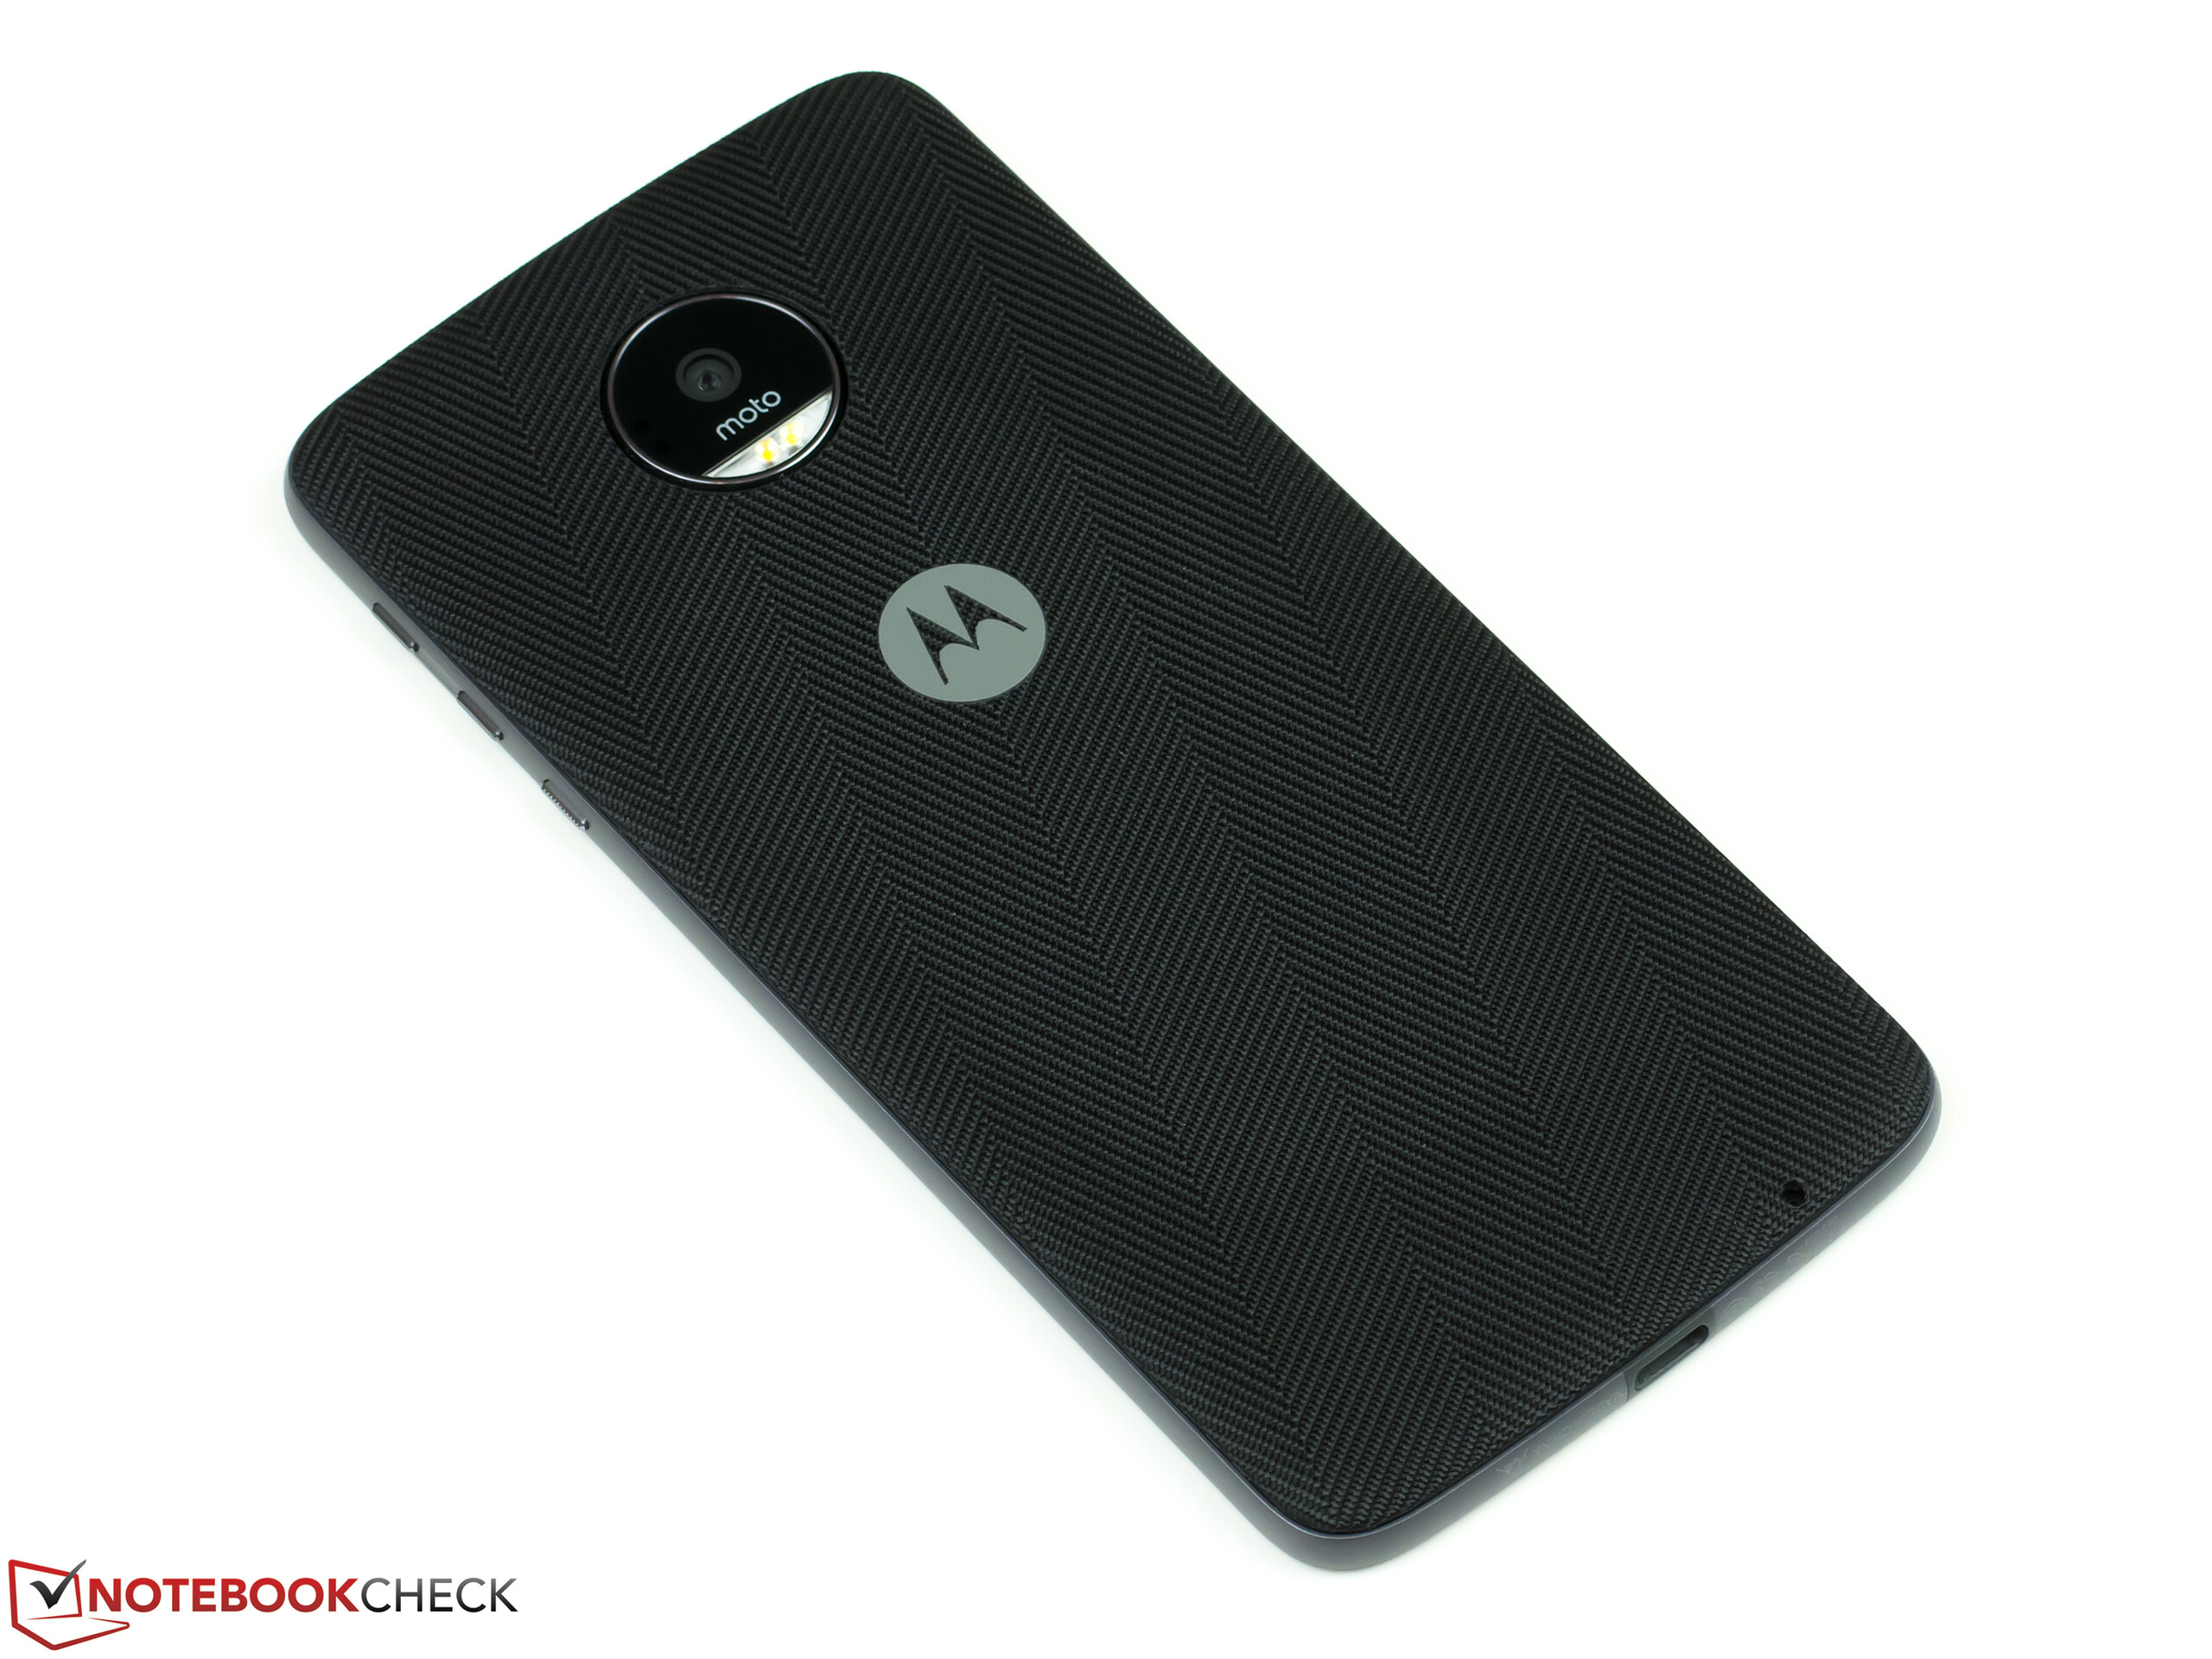
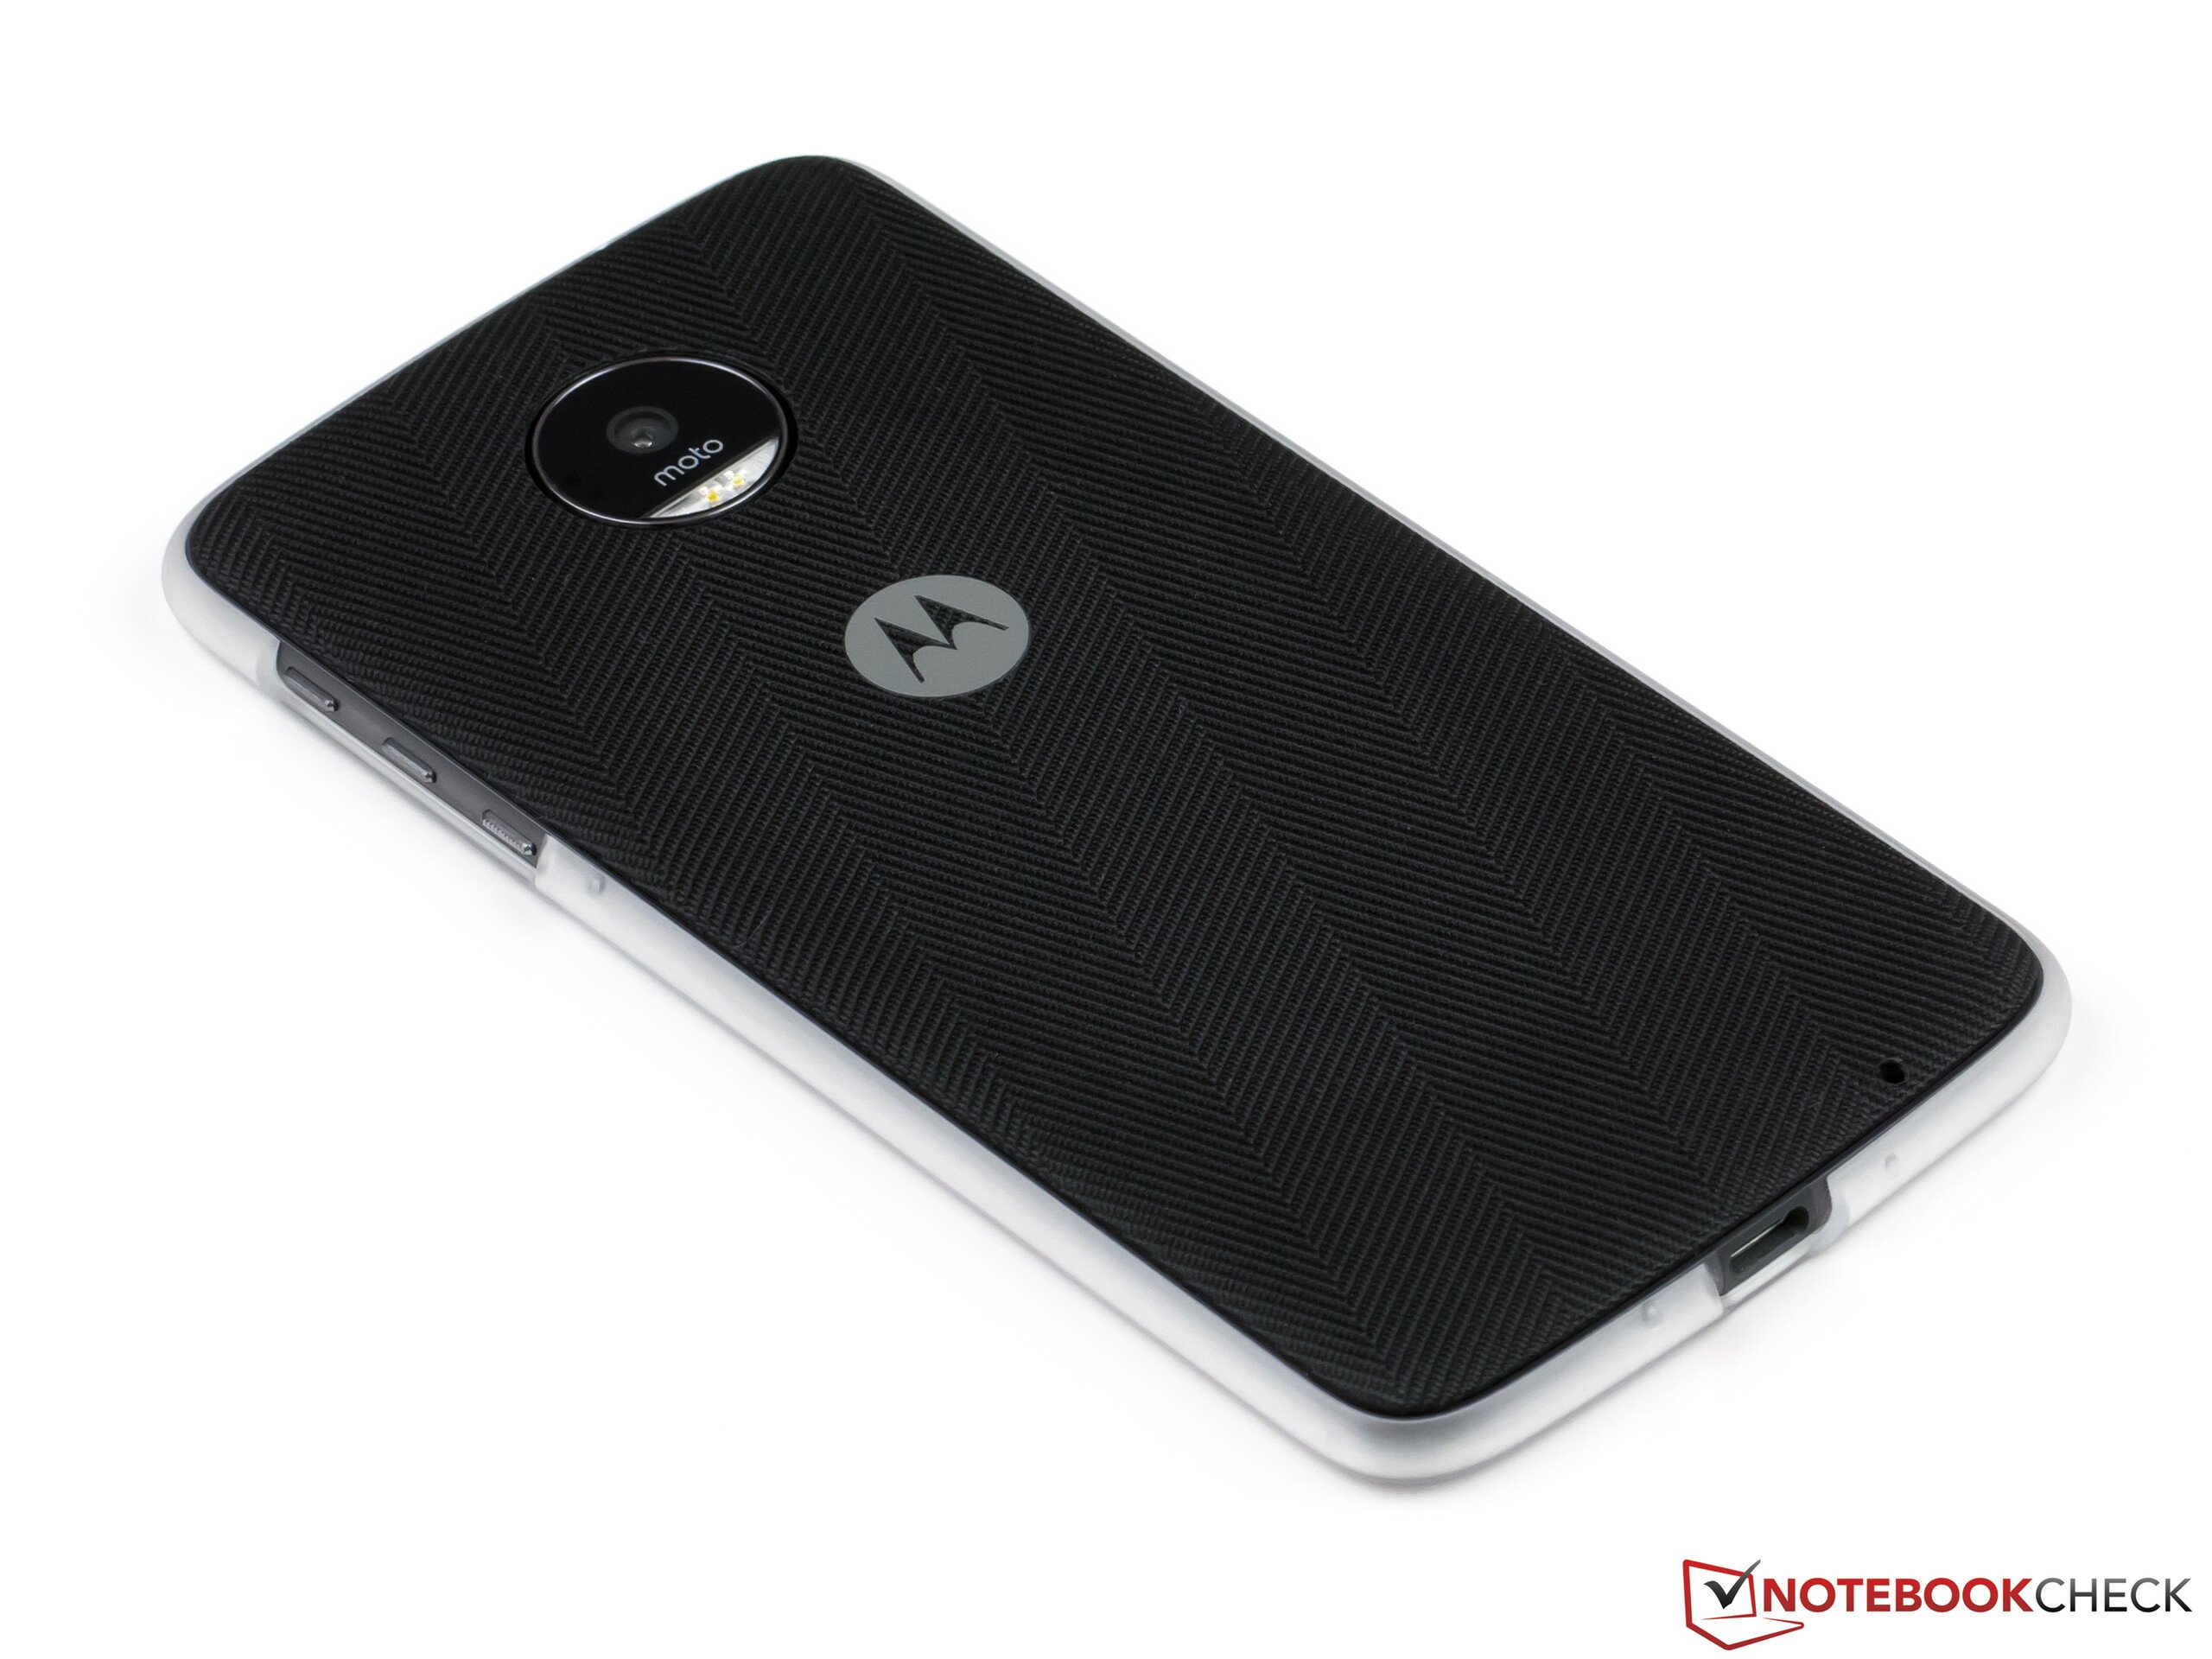
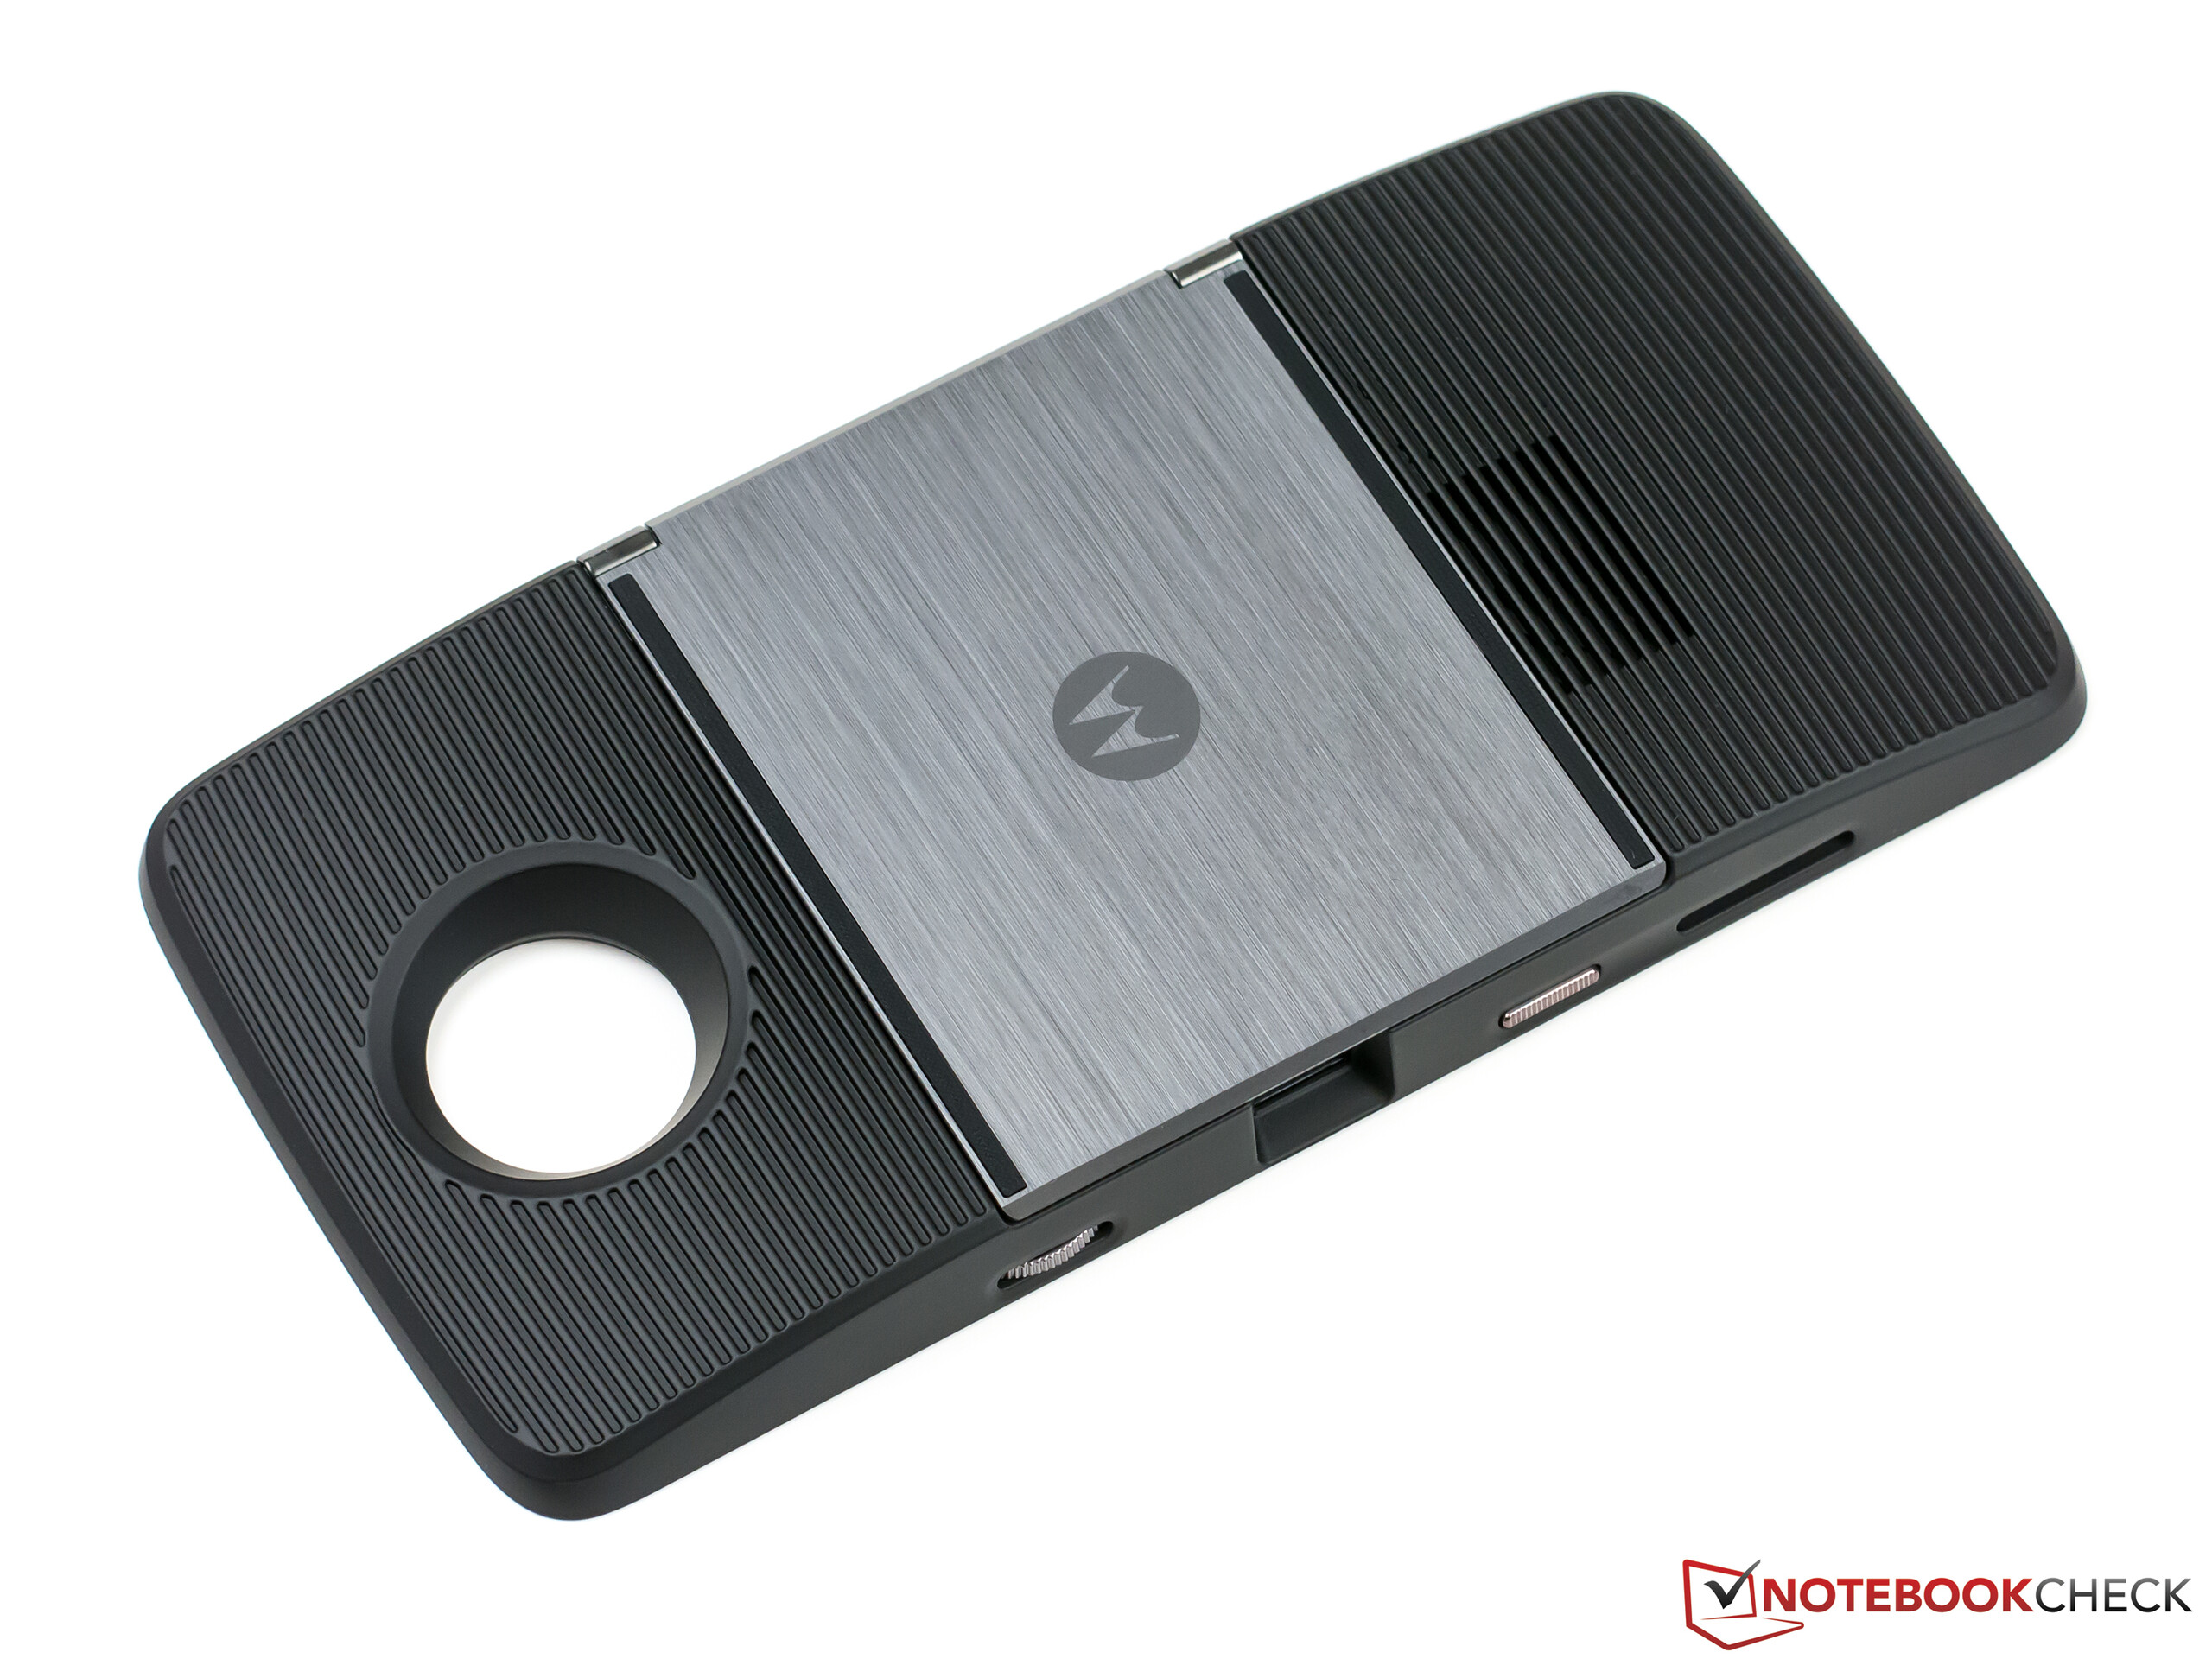
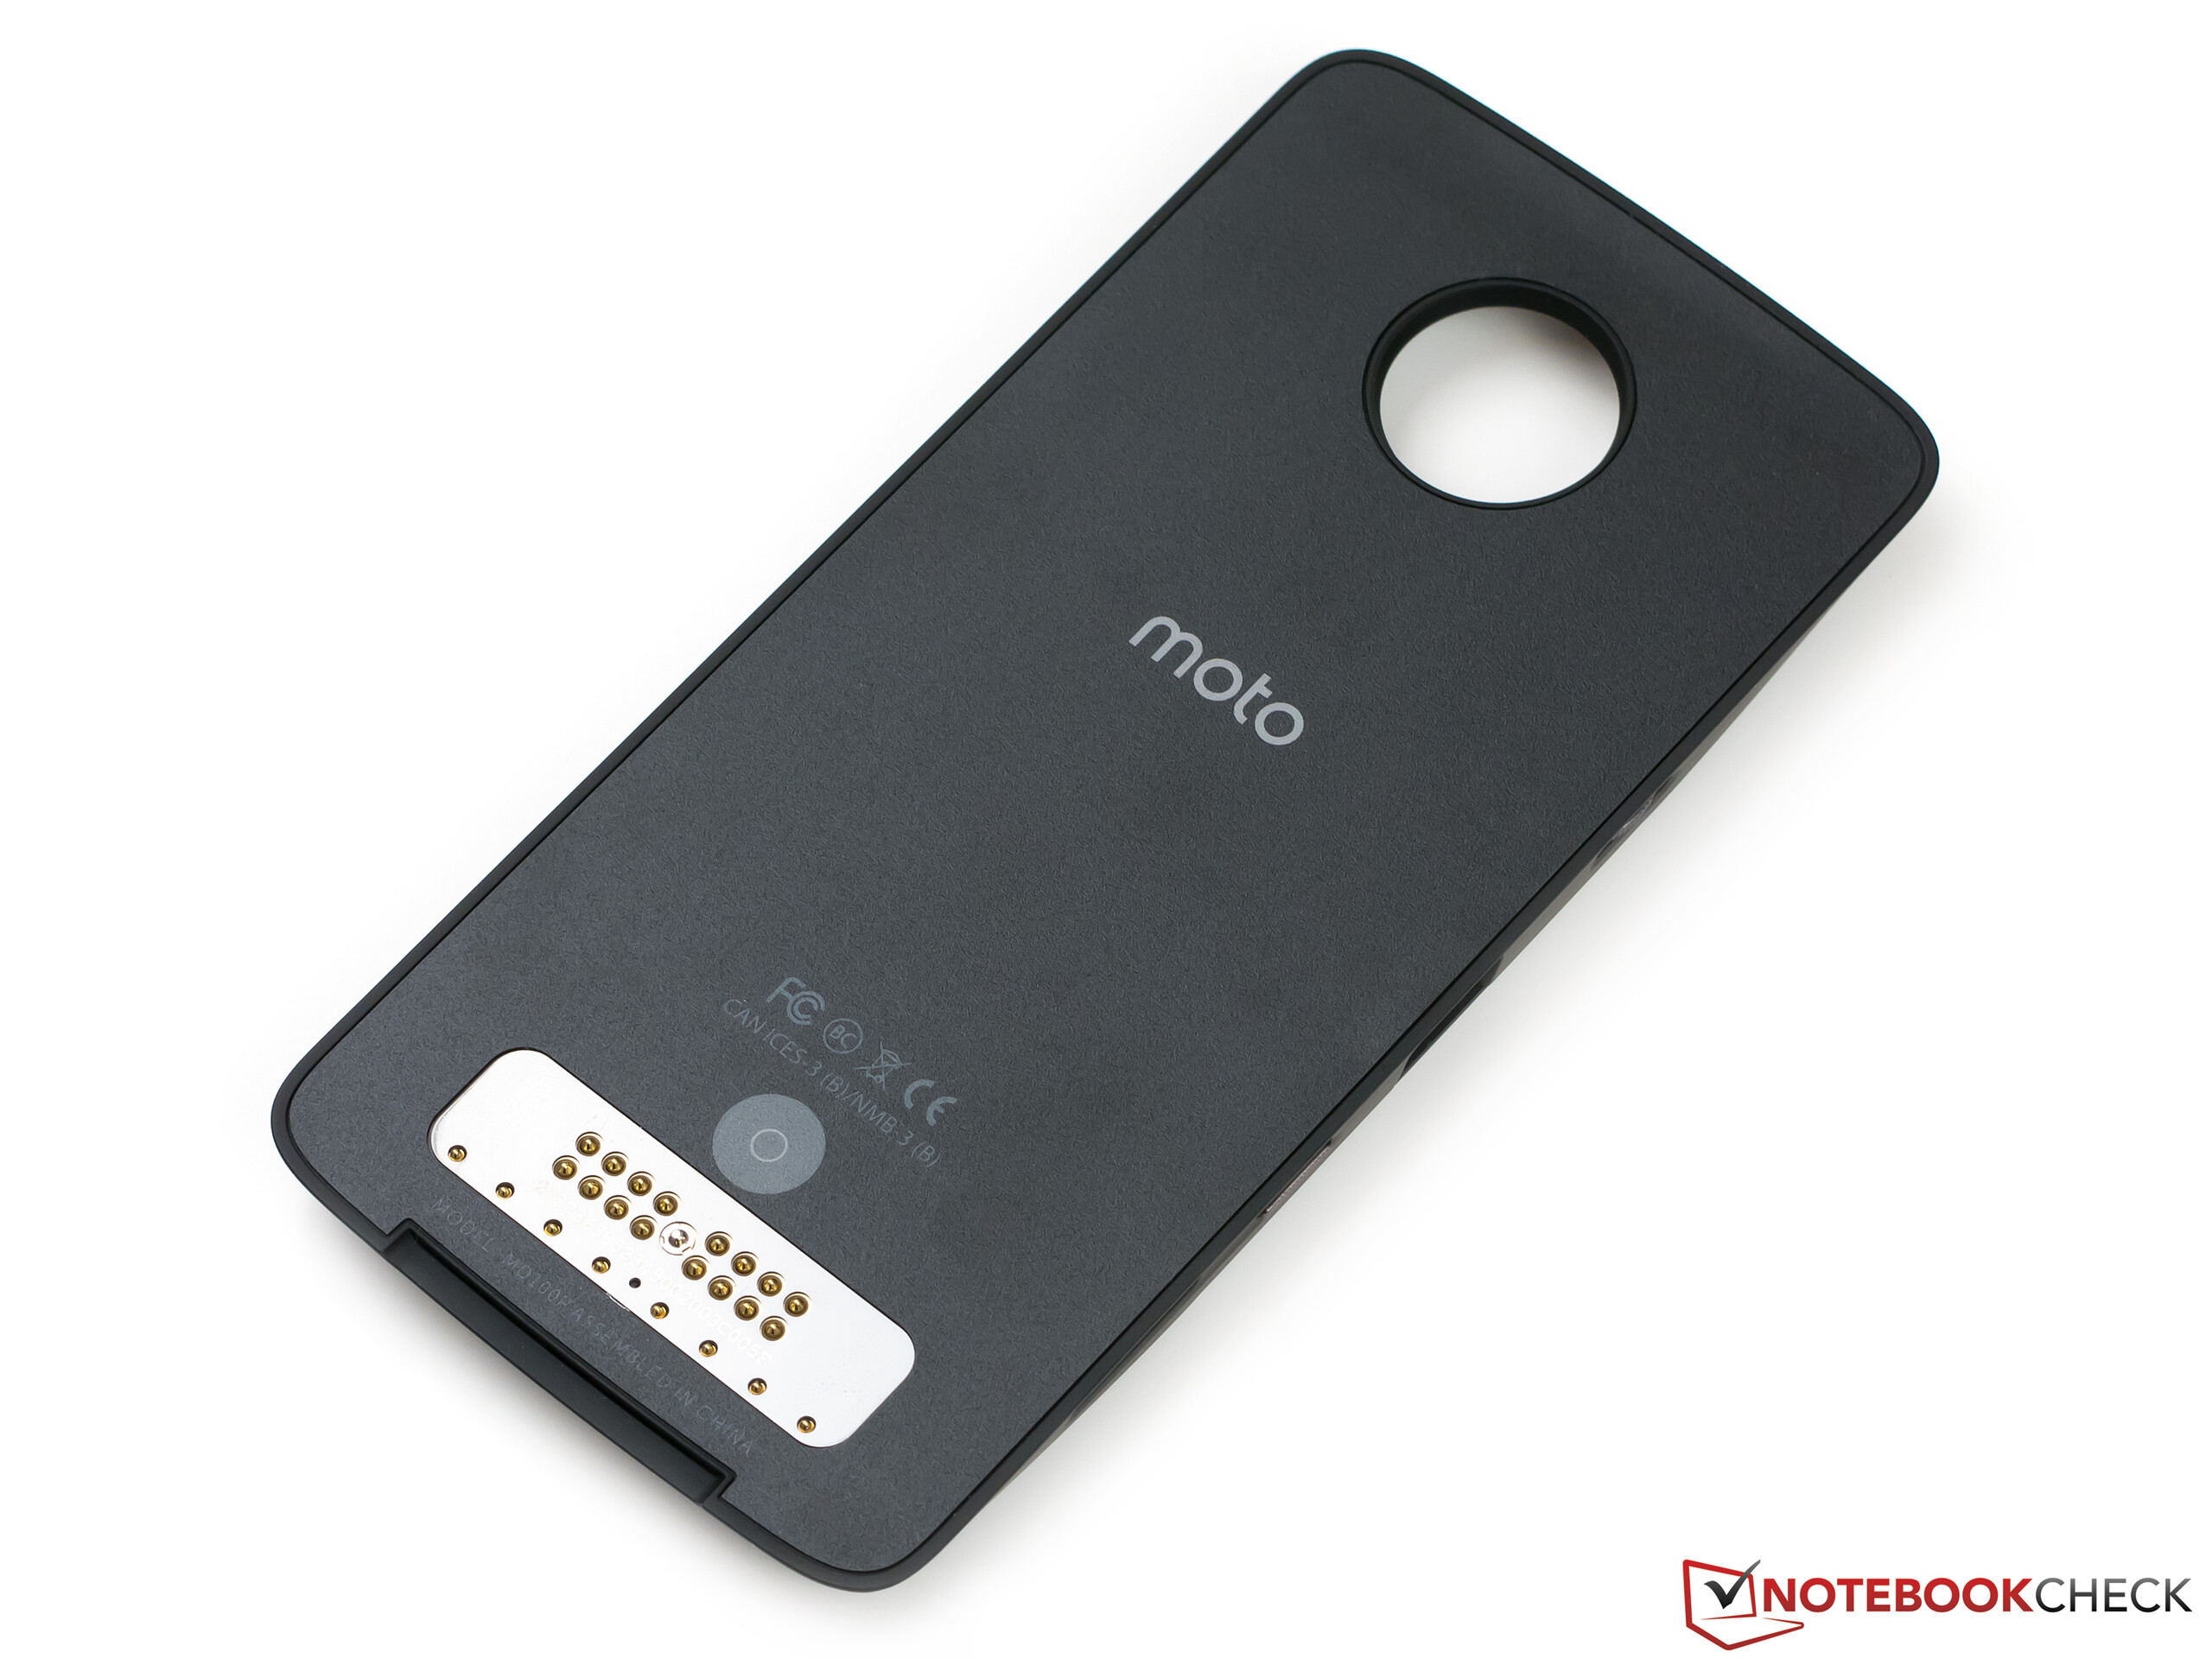
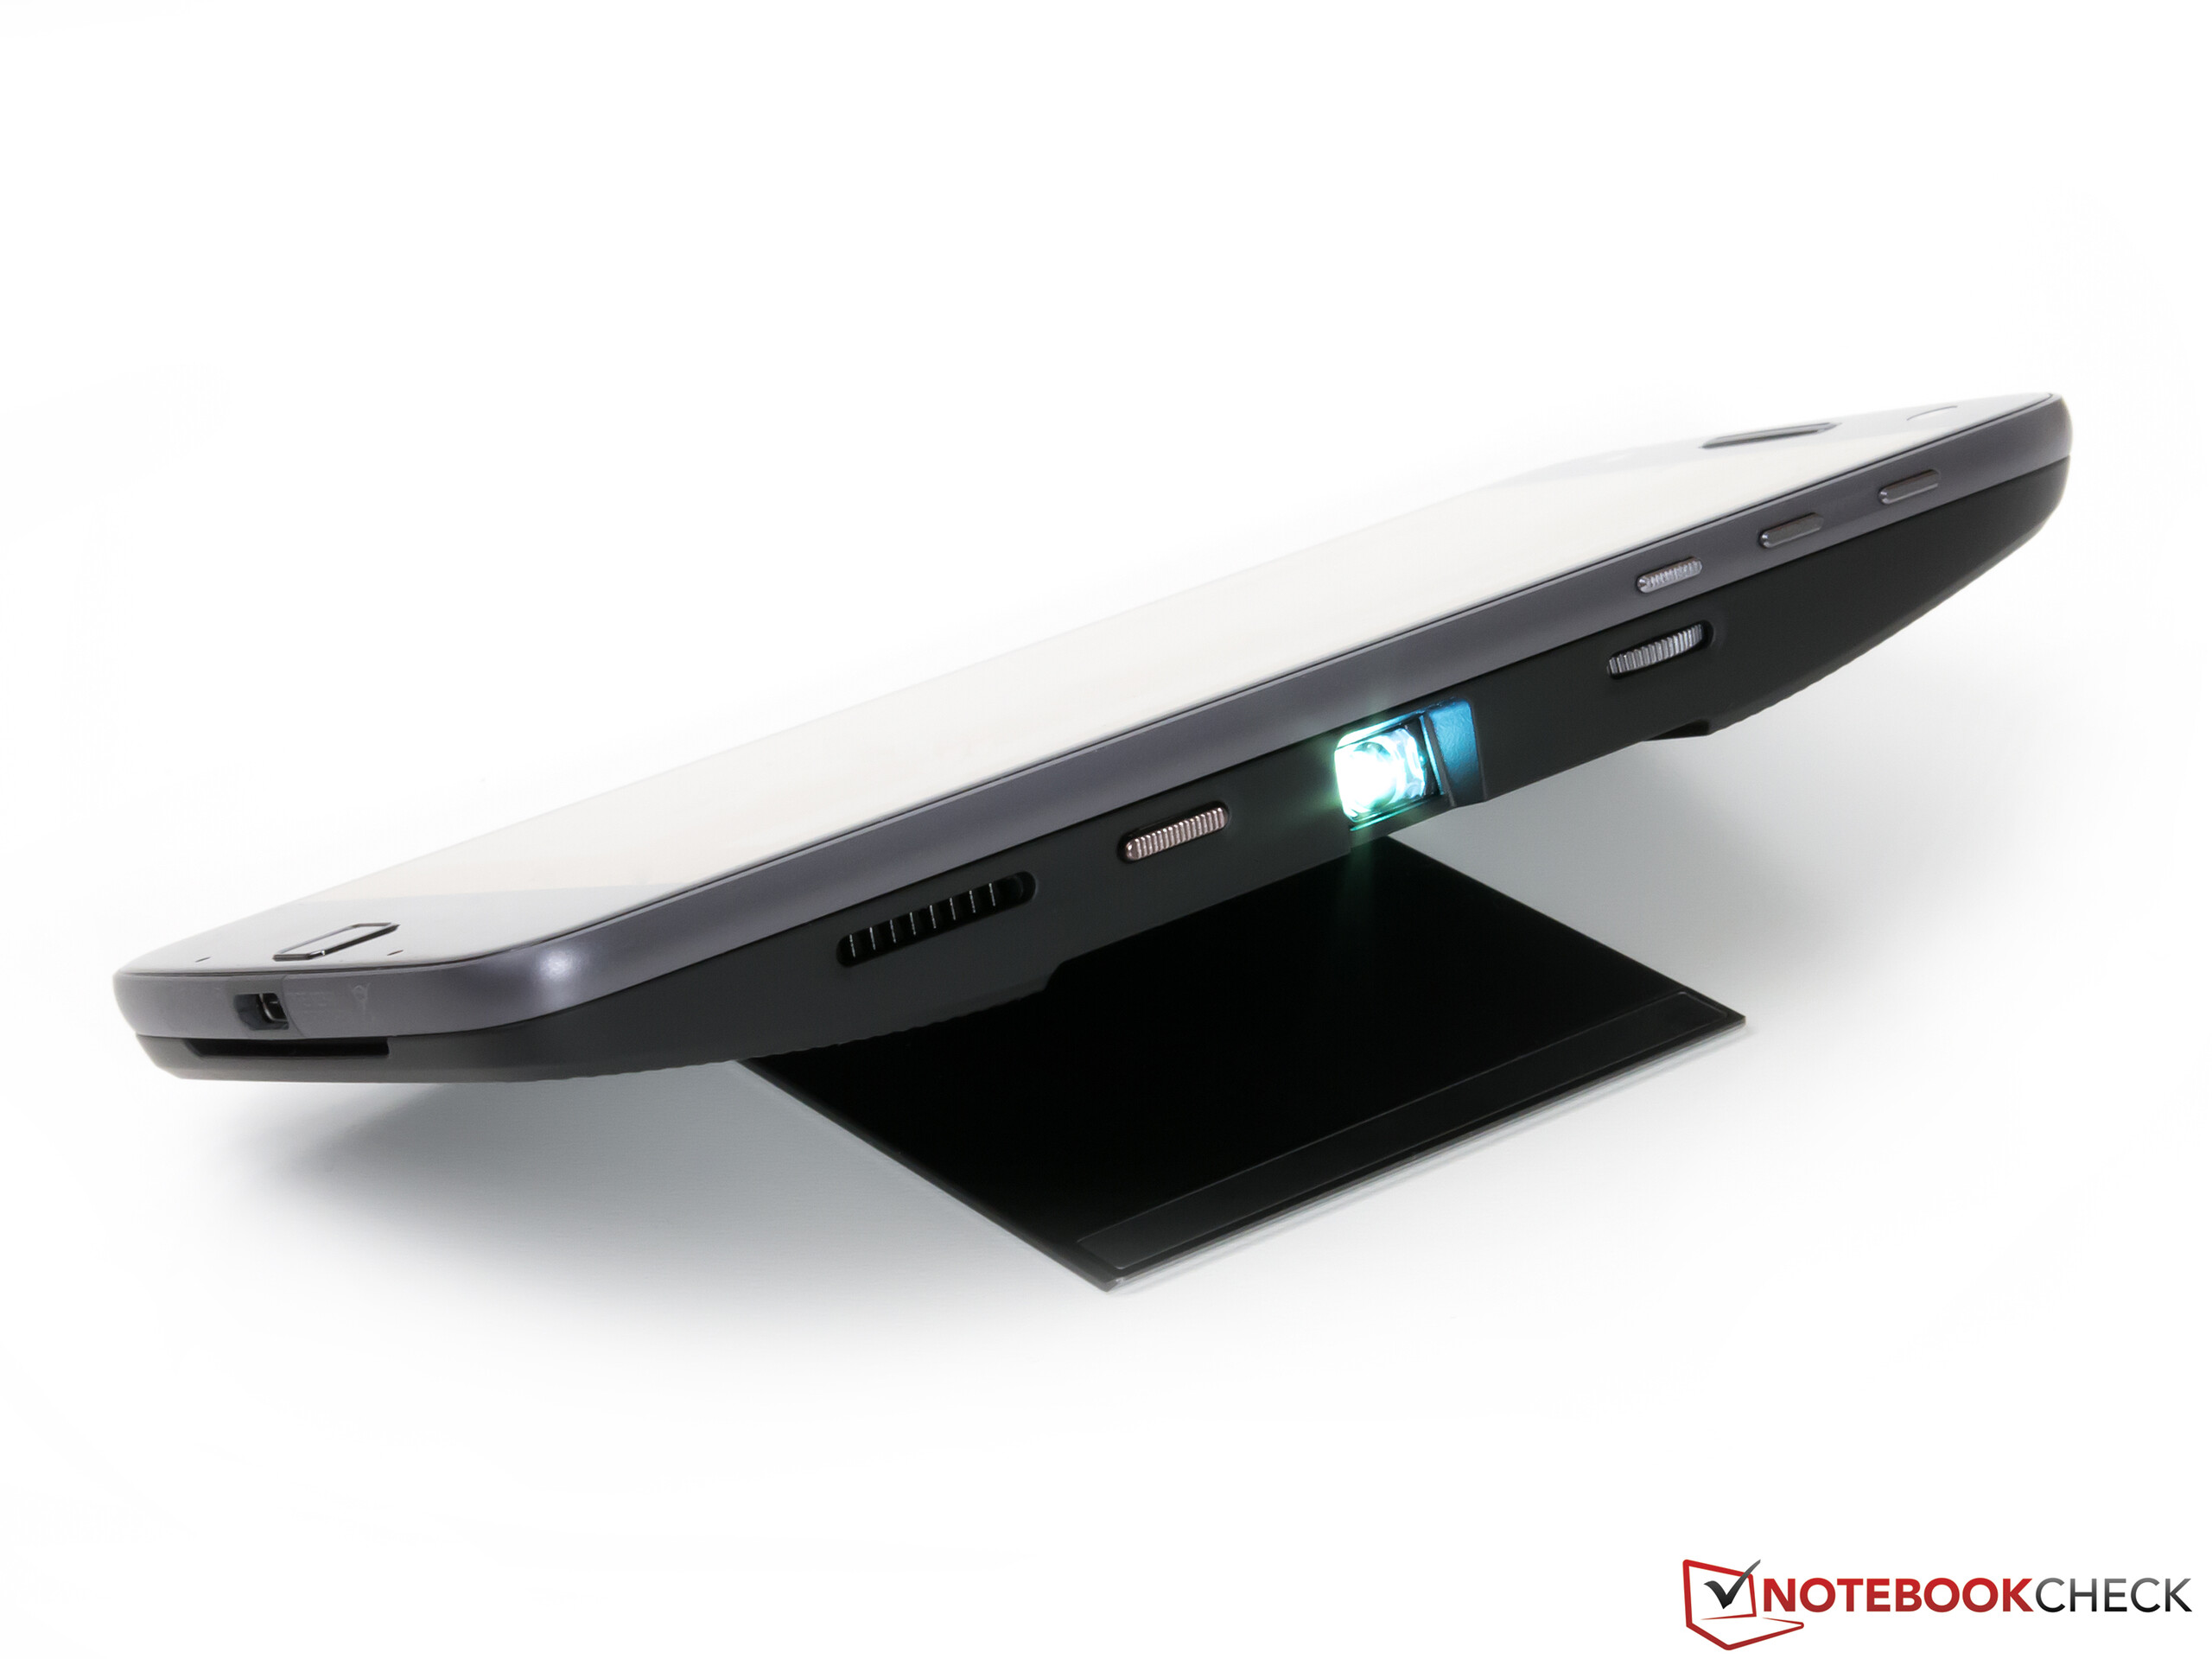
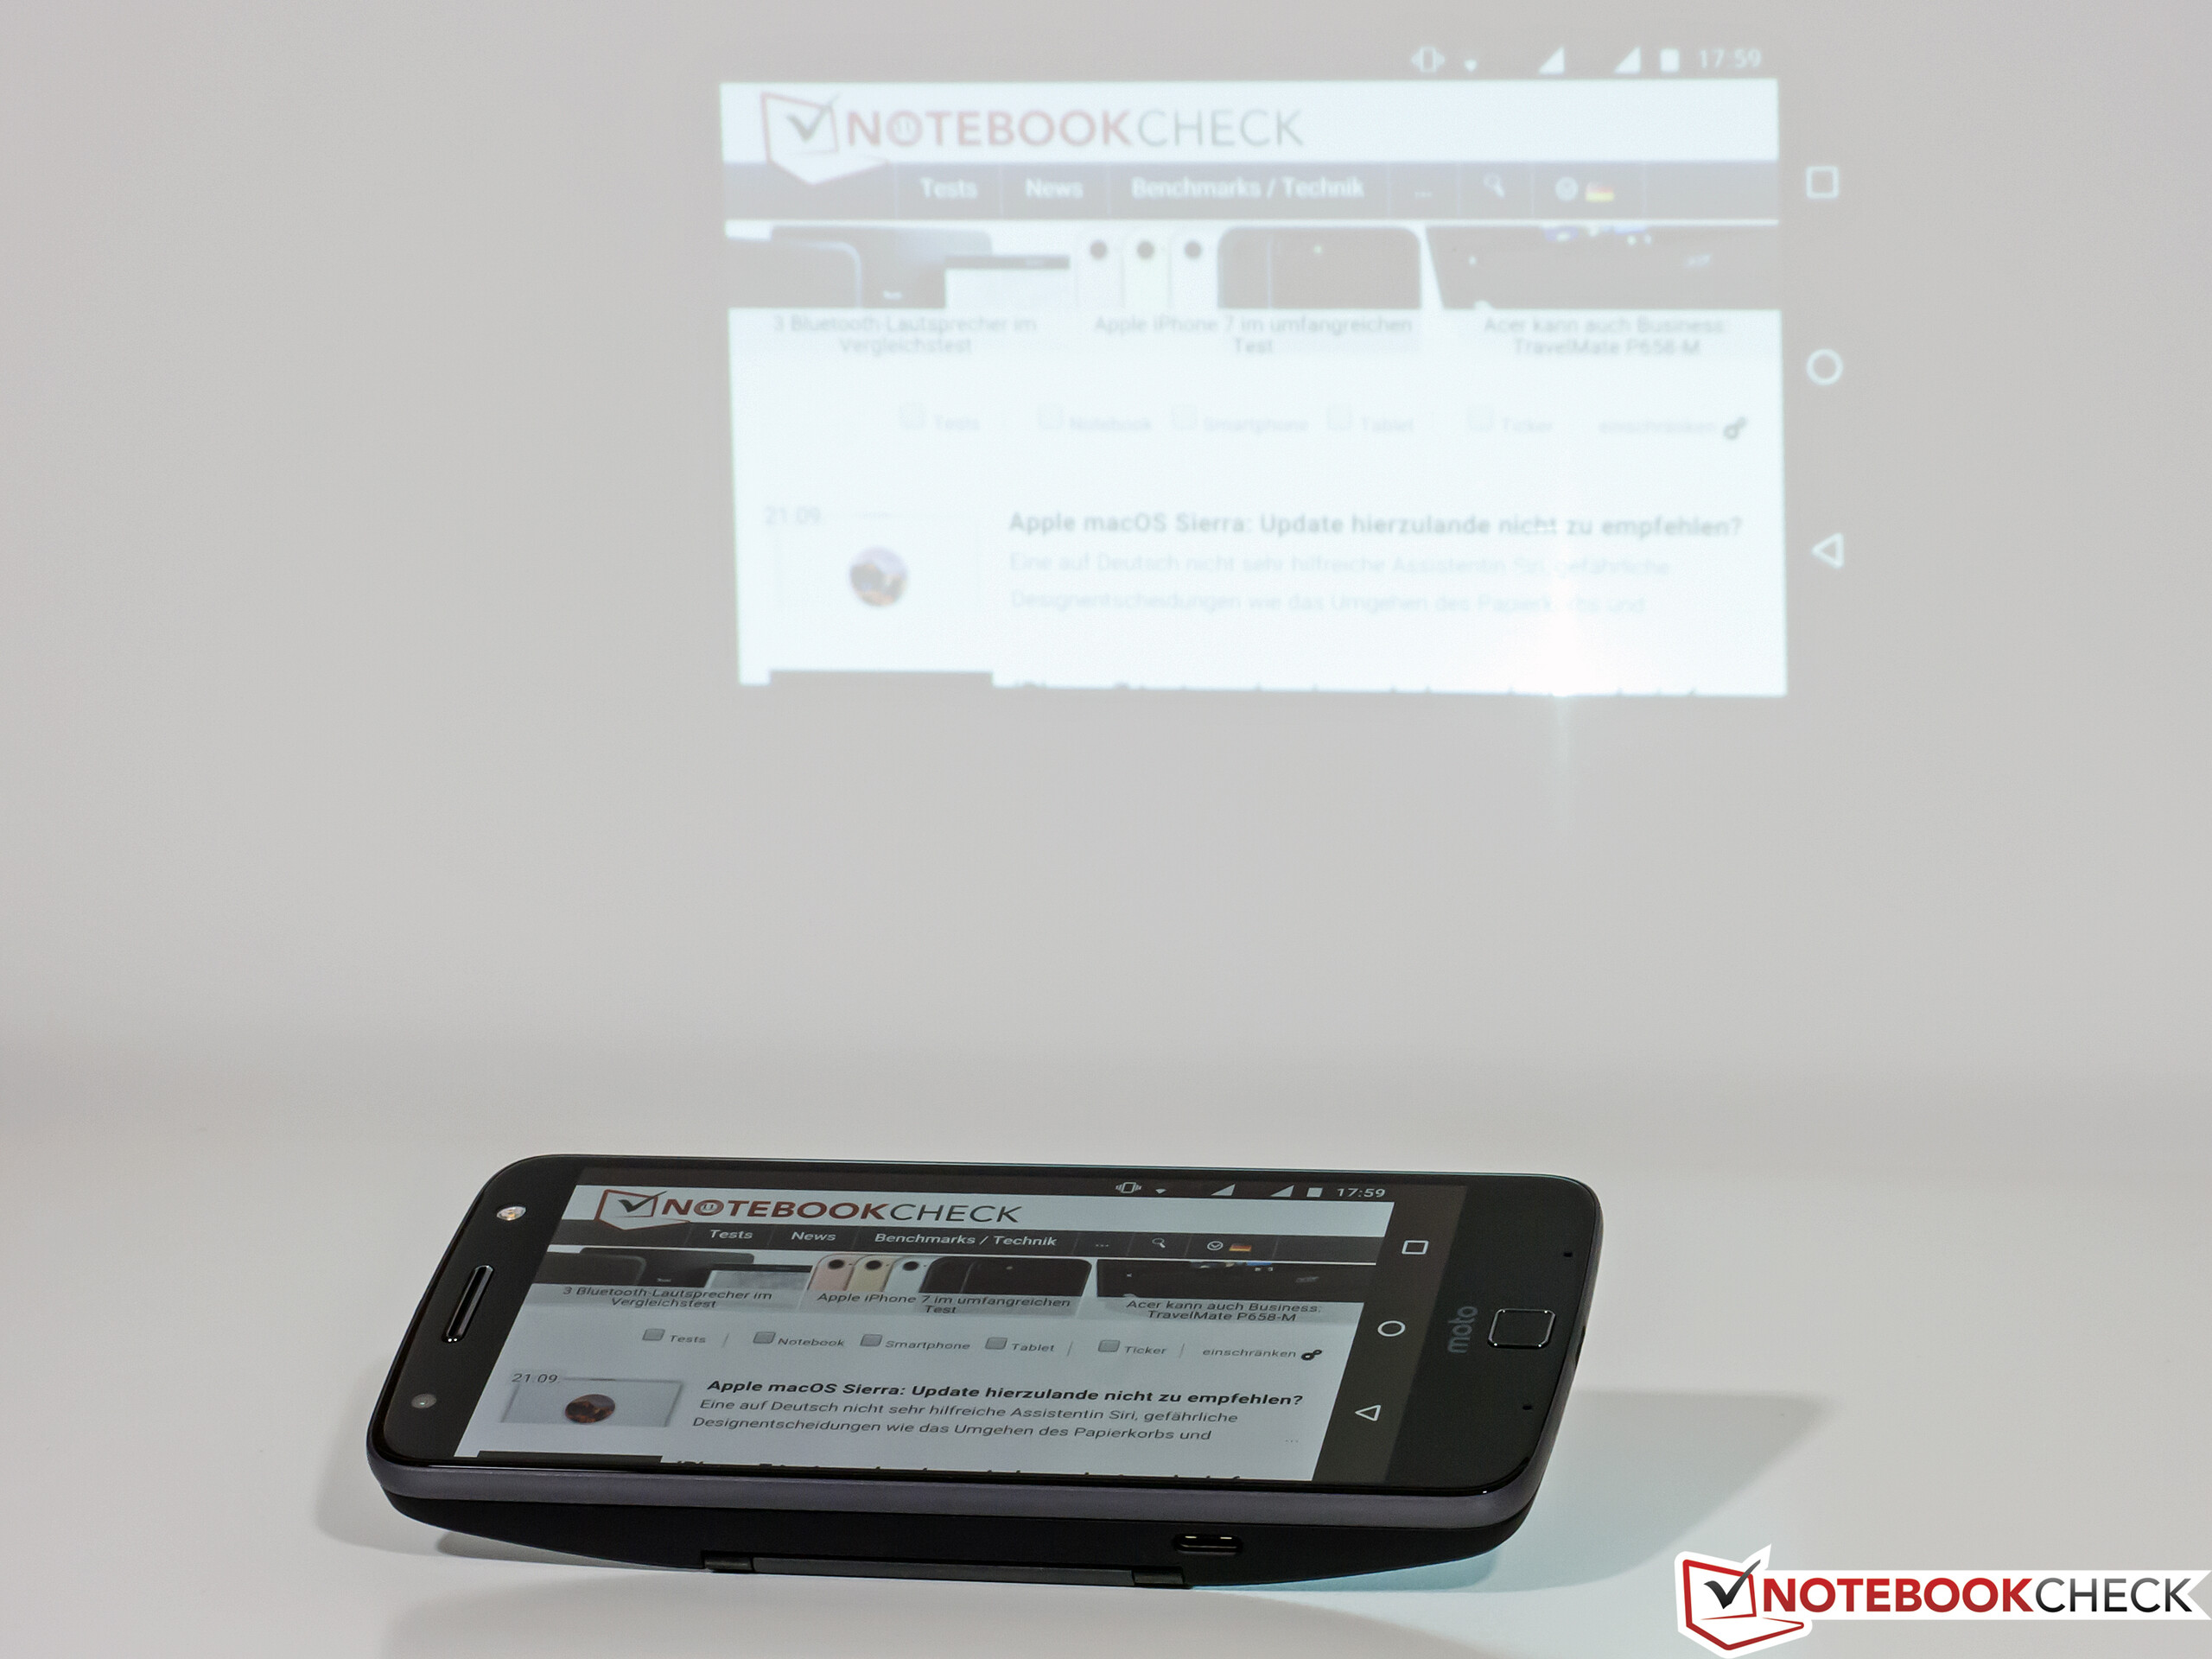
联想的新旗舰智能手机Moto Z在与其他机型比较中最独特之处是模块拓展功能。这些叫做Moto Mods的模块可以带来新功能,它们目前通常都没有在智能手机上得到应用。这项功能的一个劣势可能是特制模块的售价会相对较高,不过联想宣称它们将会至少支持三代机型,这样对功能模块的投资将会有更高的长远价值。
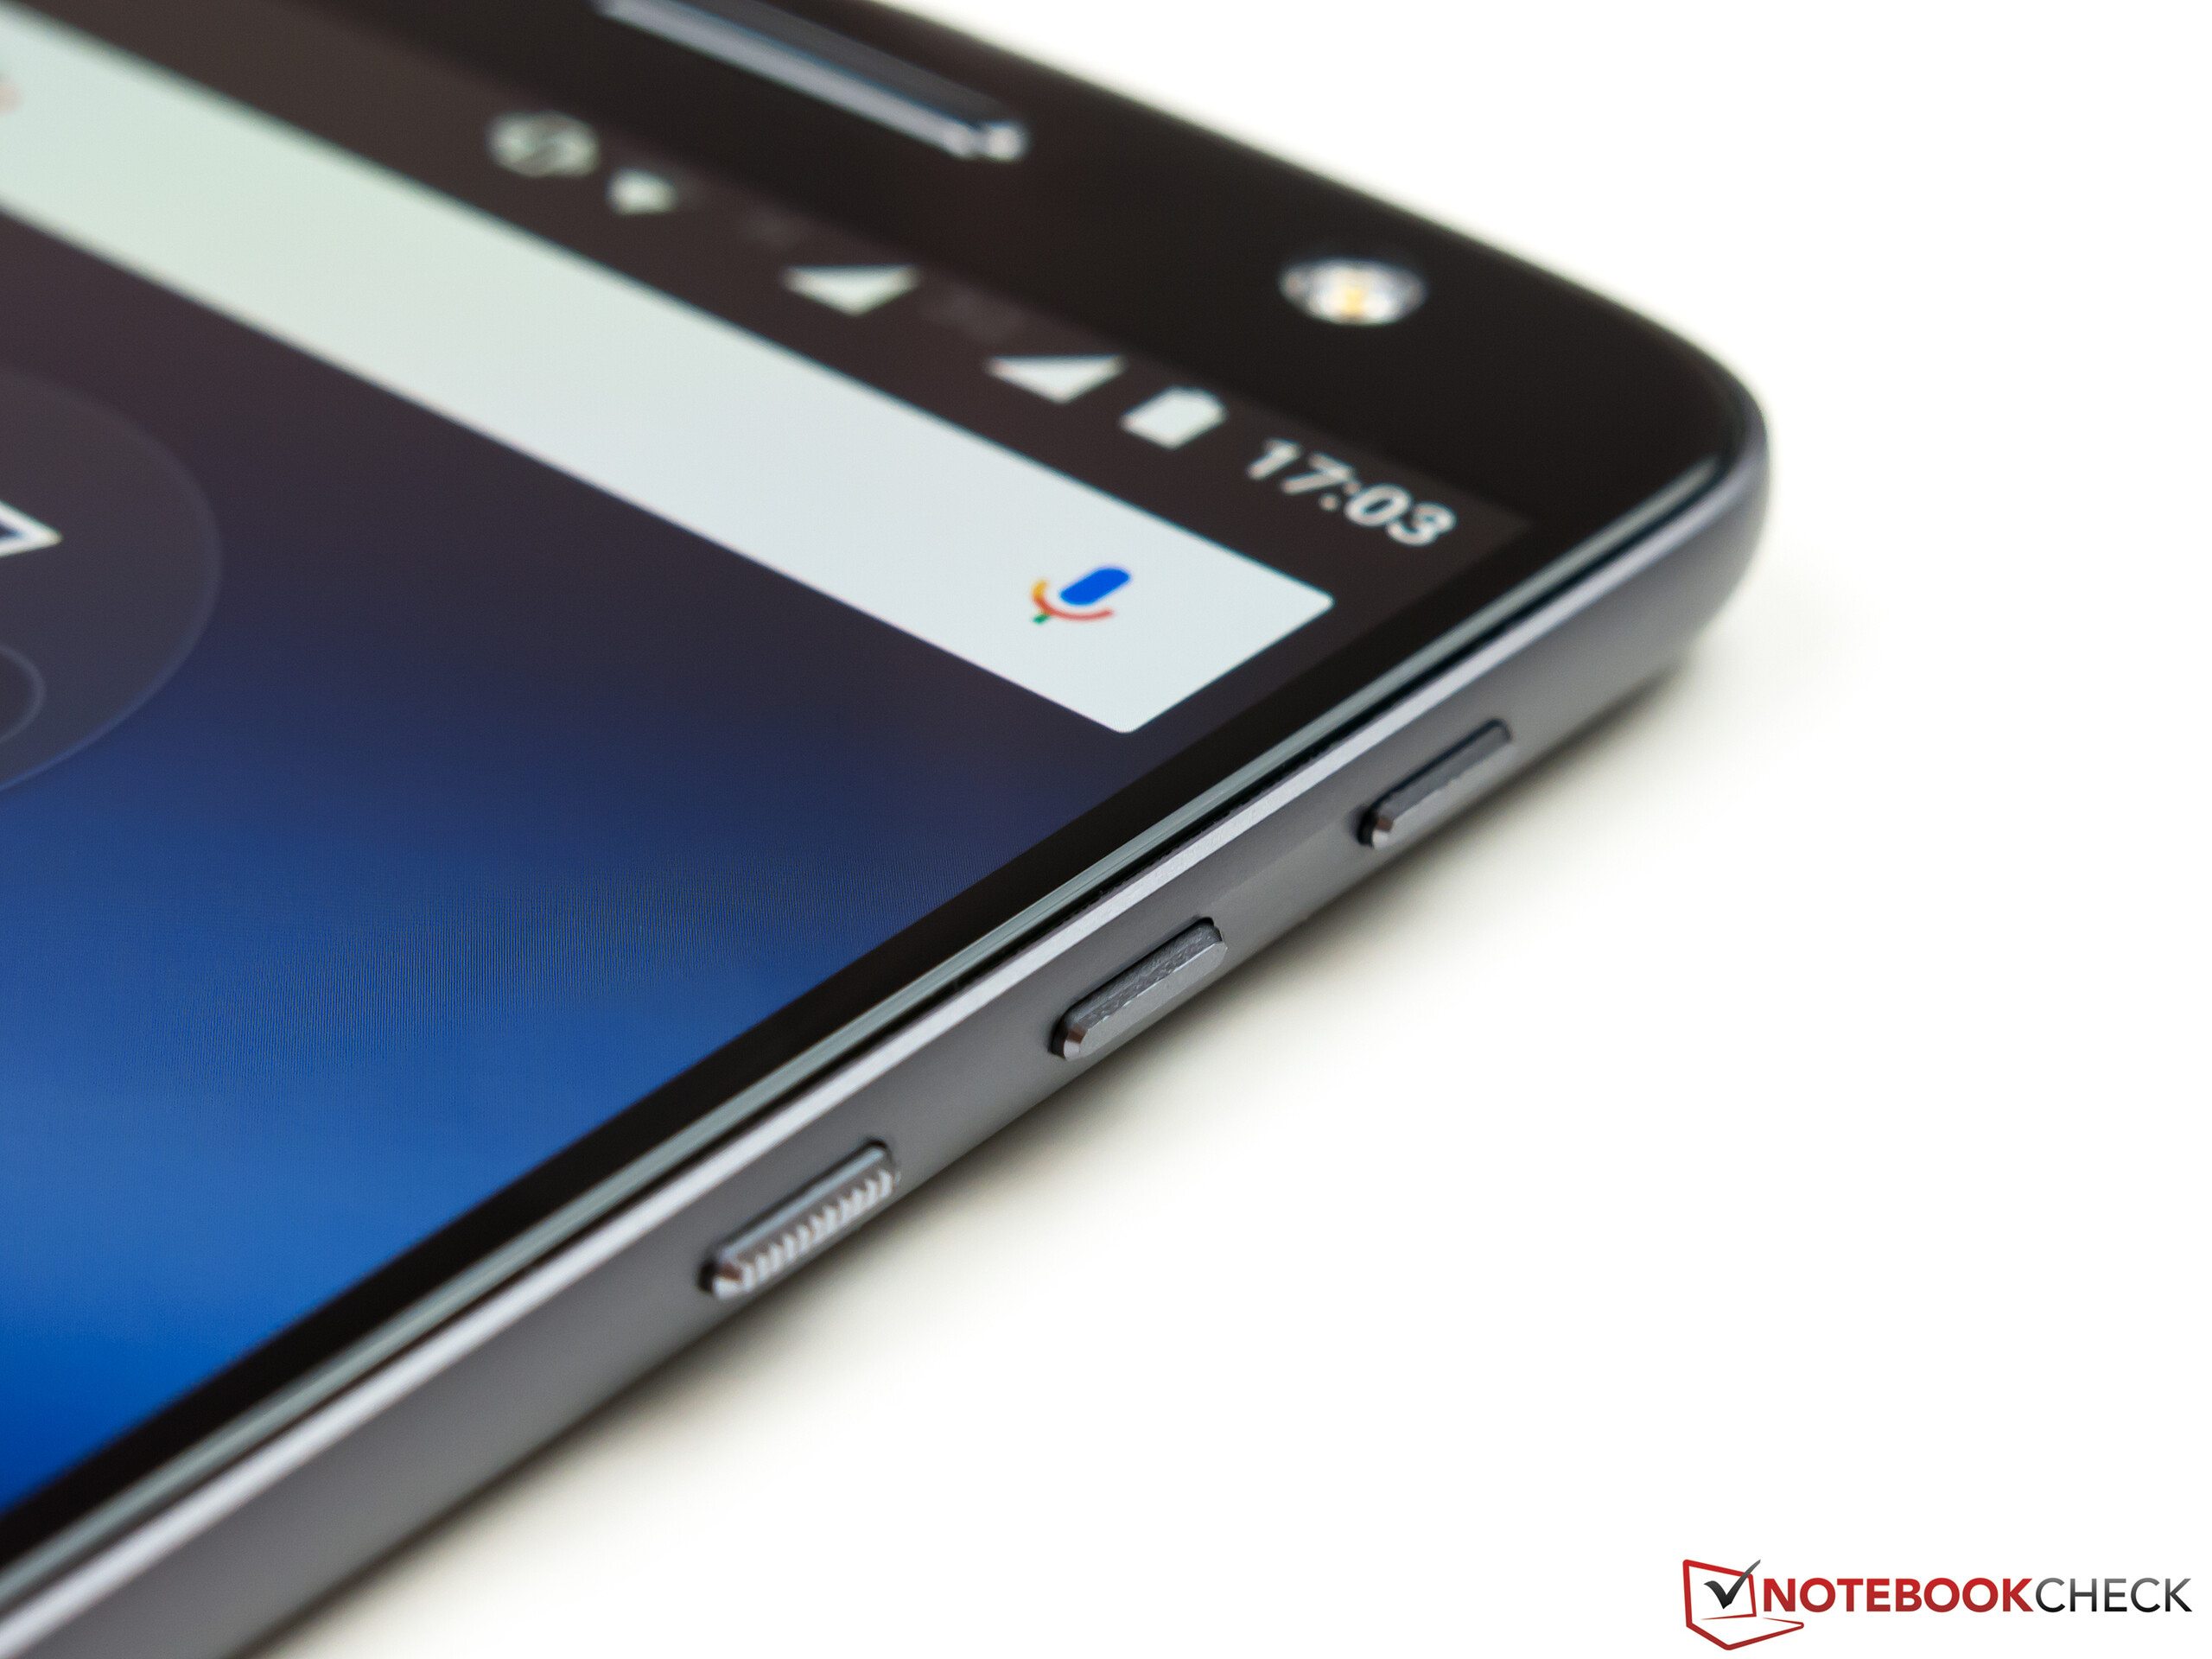
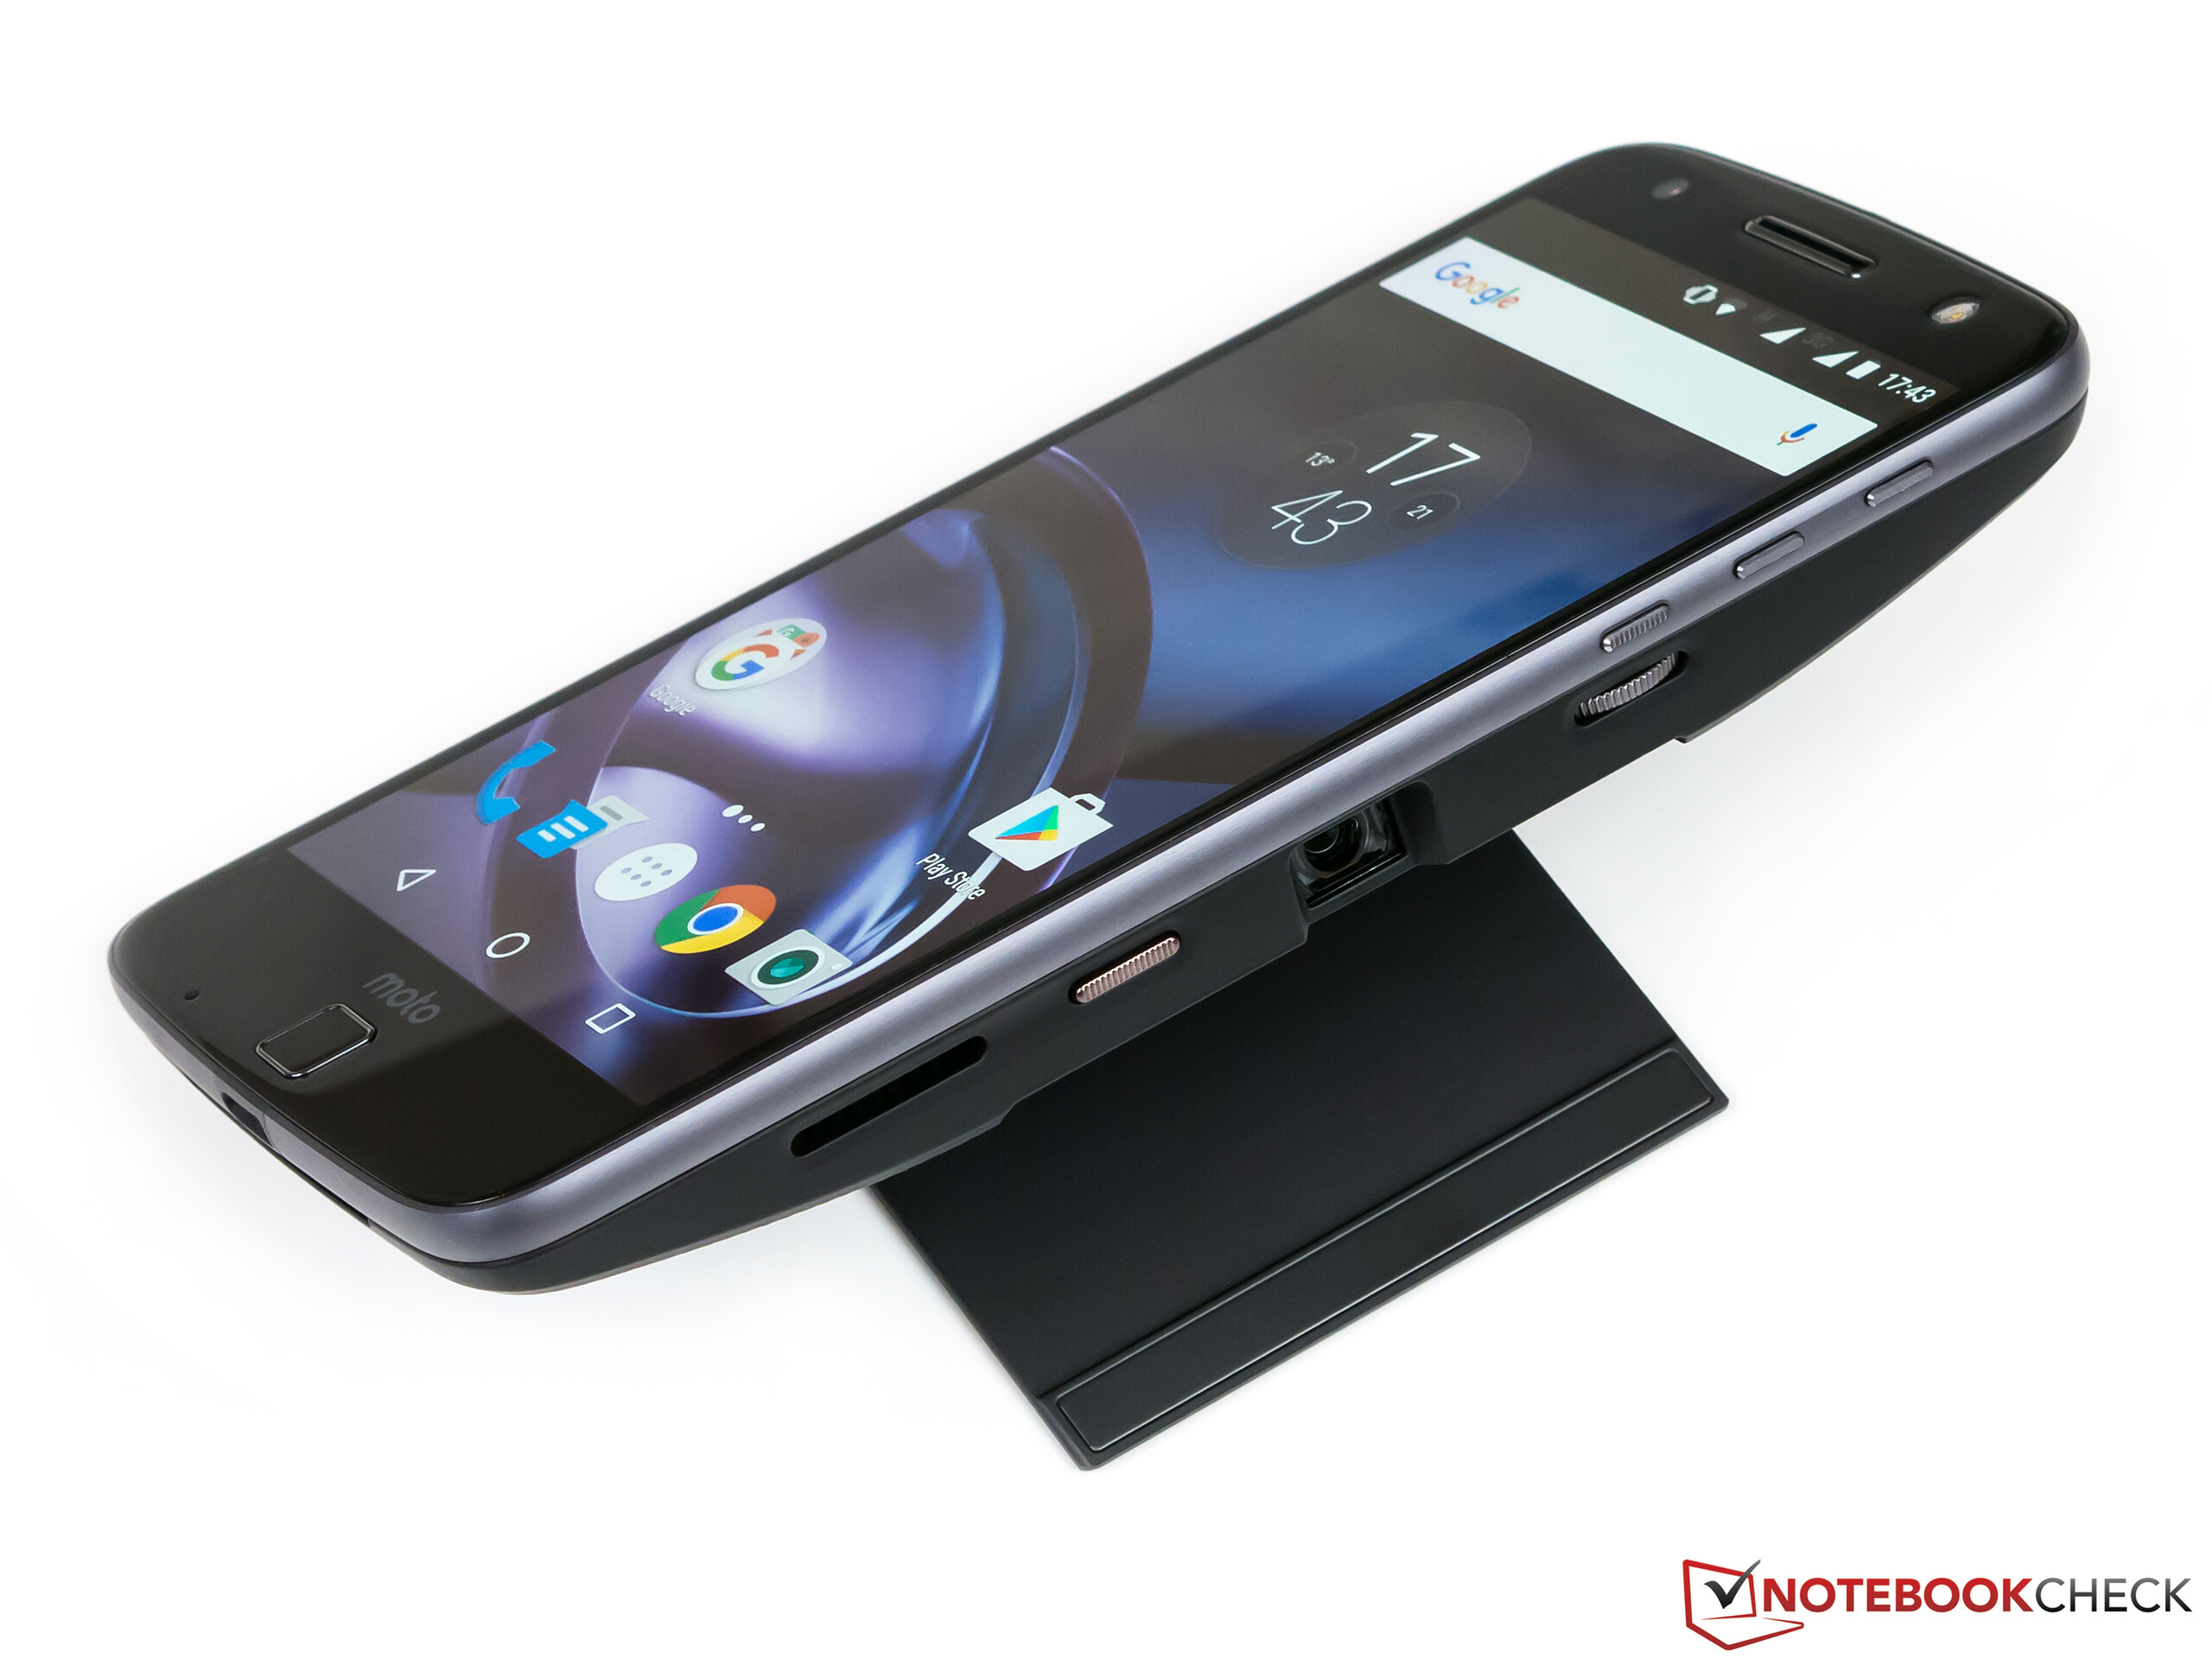
不过Moto Z即使不算上这项功能也仍然是一台成功的智能手机,它在高端市场竞争中将不会有任何障碍:精致而纤薄的机身中搭载了强劲的部件,高价也带来了高品质。接近原生的安卓用户界面也会受到不少用户的偏爱。我们也为它较小容量电池带来的十分优秀续航时间所折服。
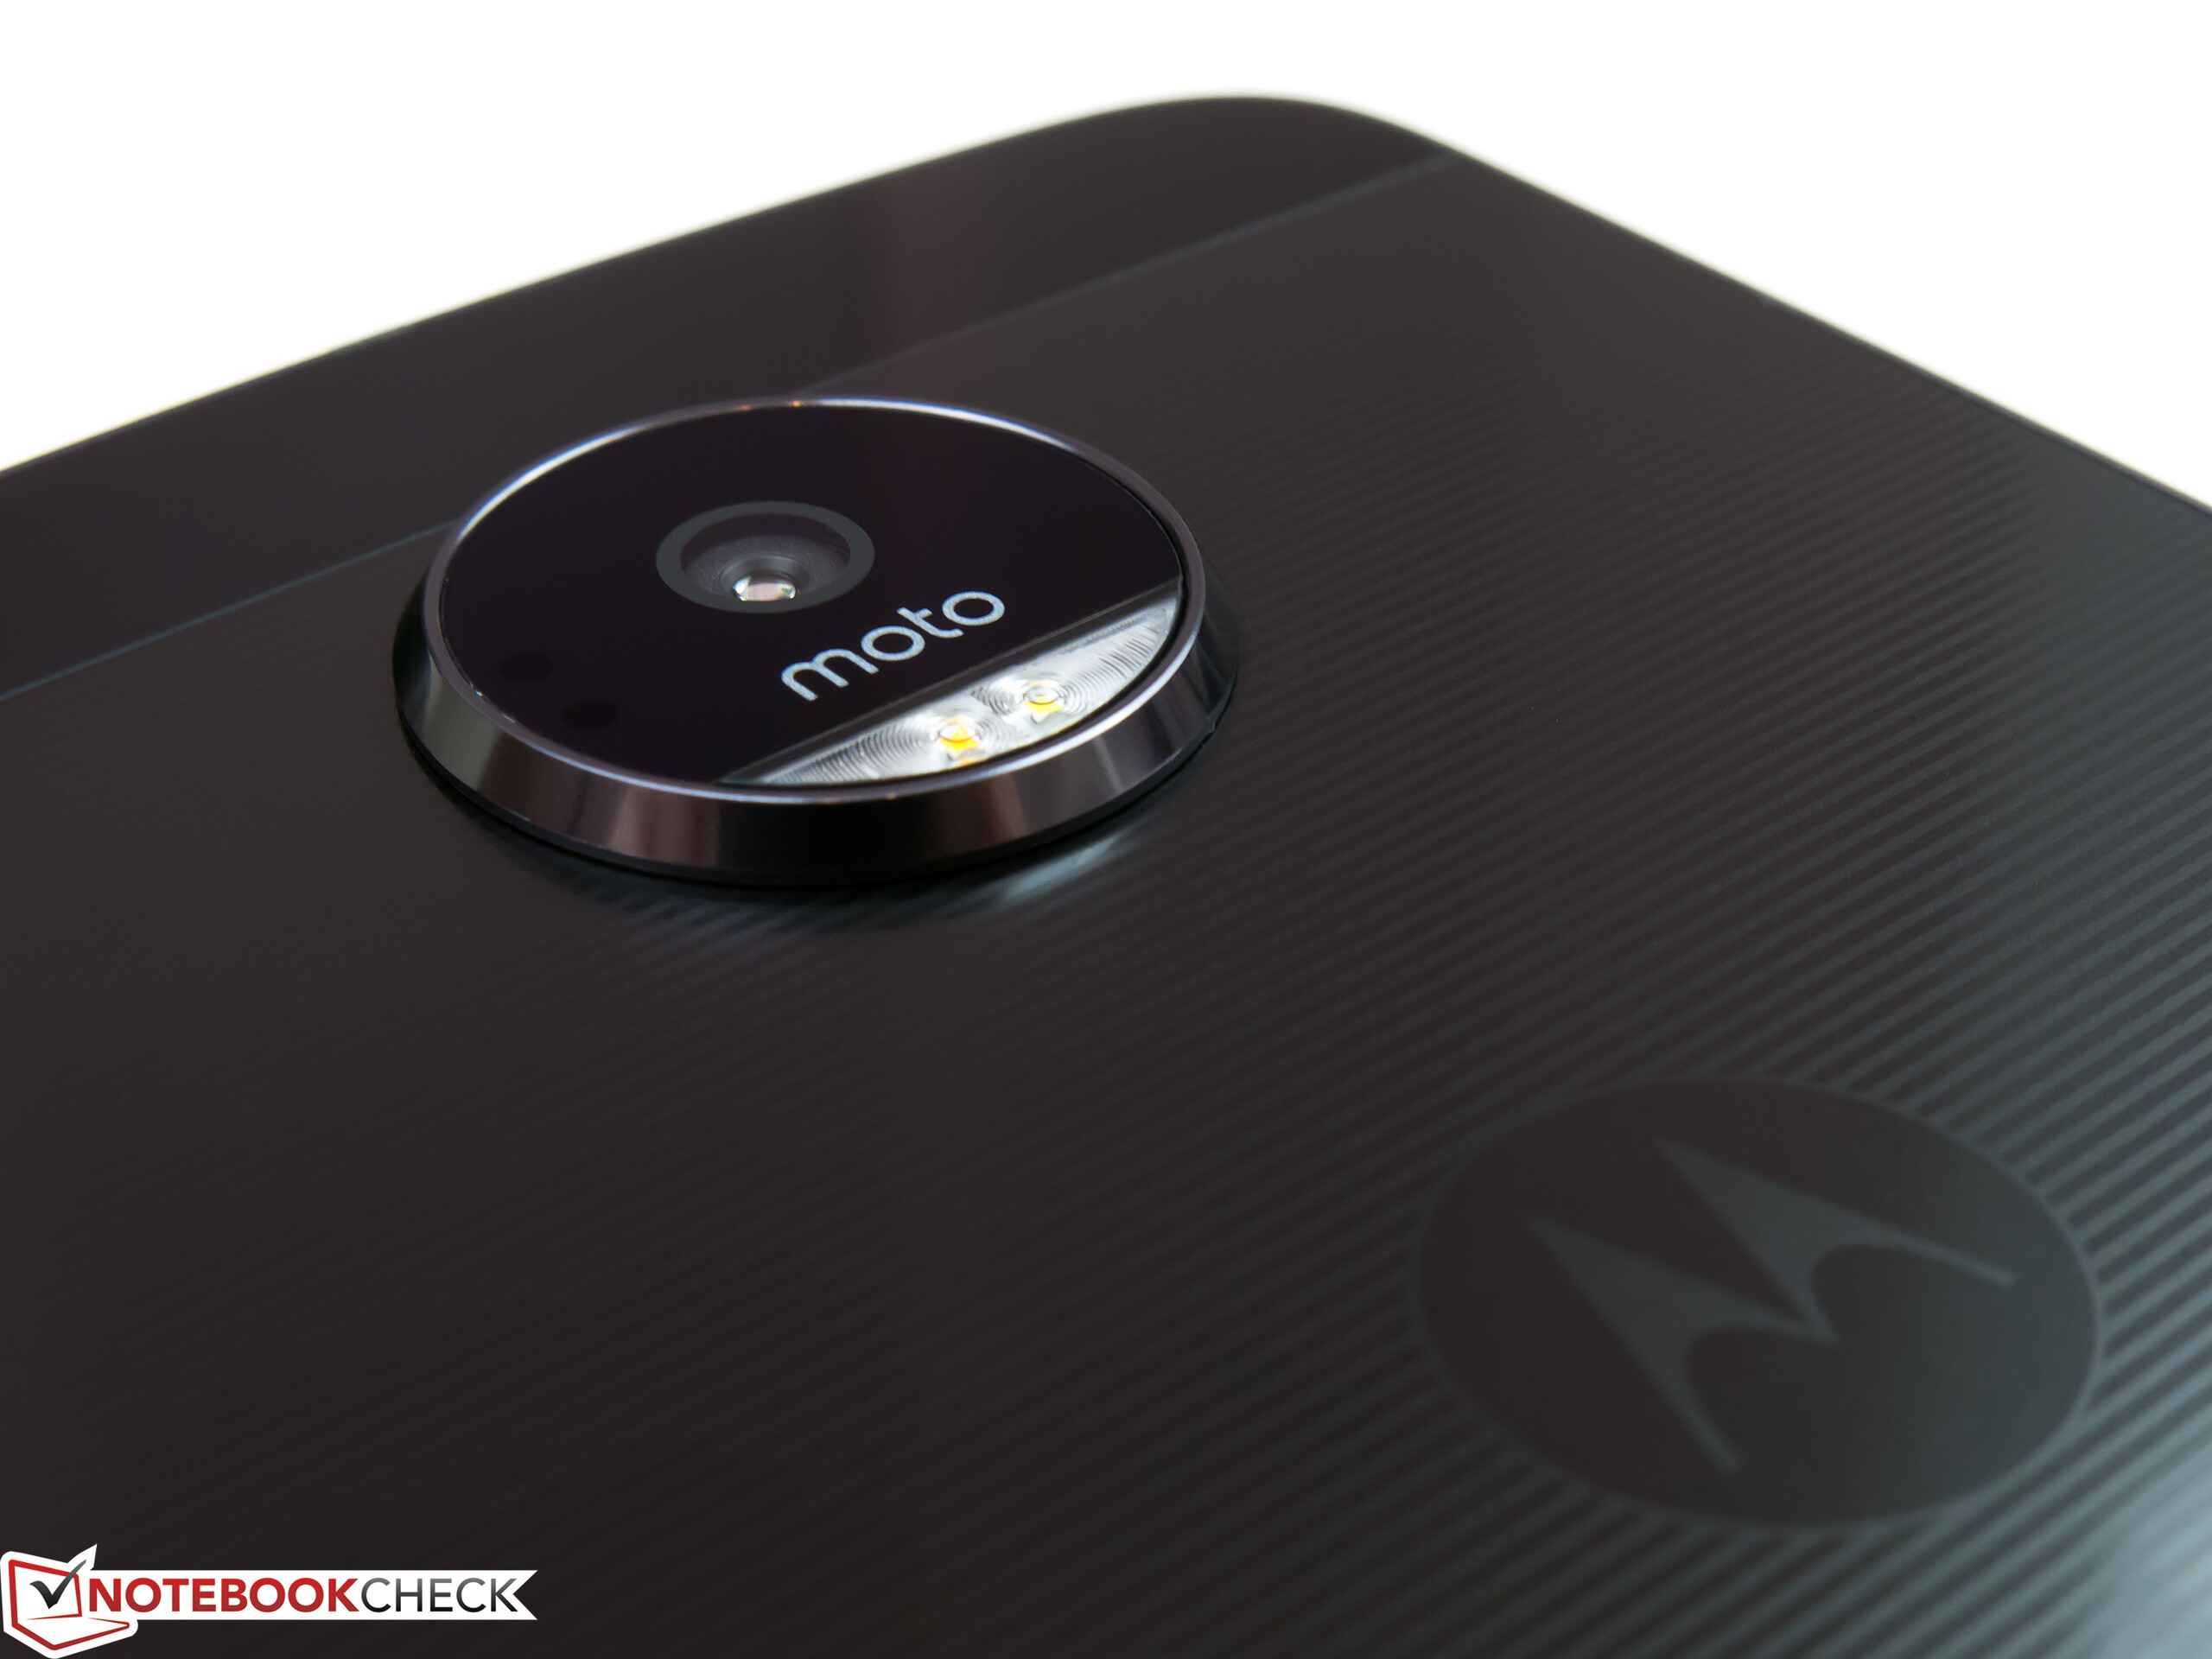
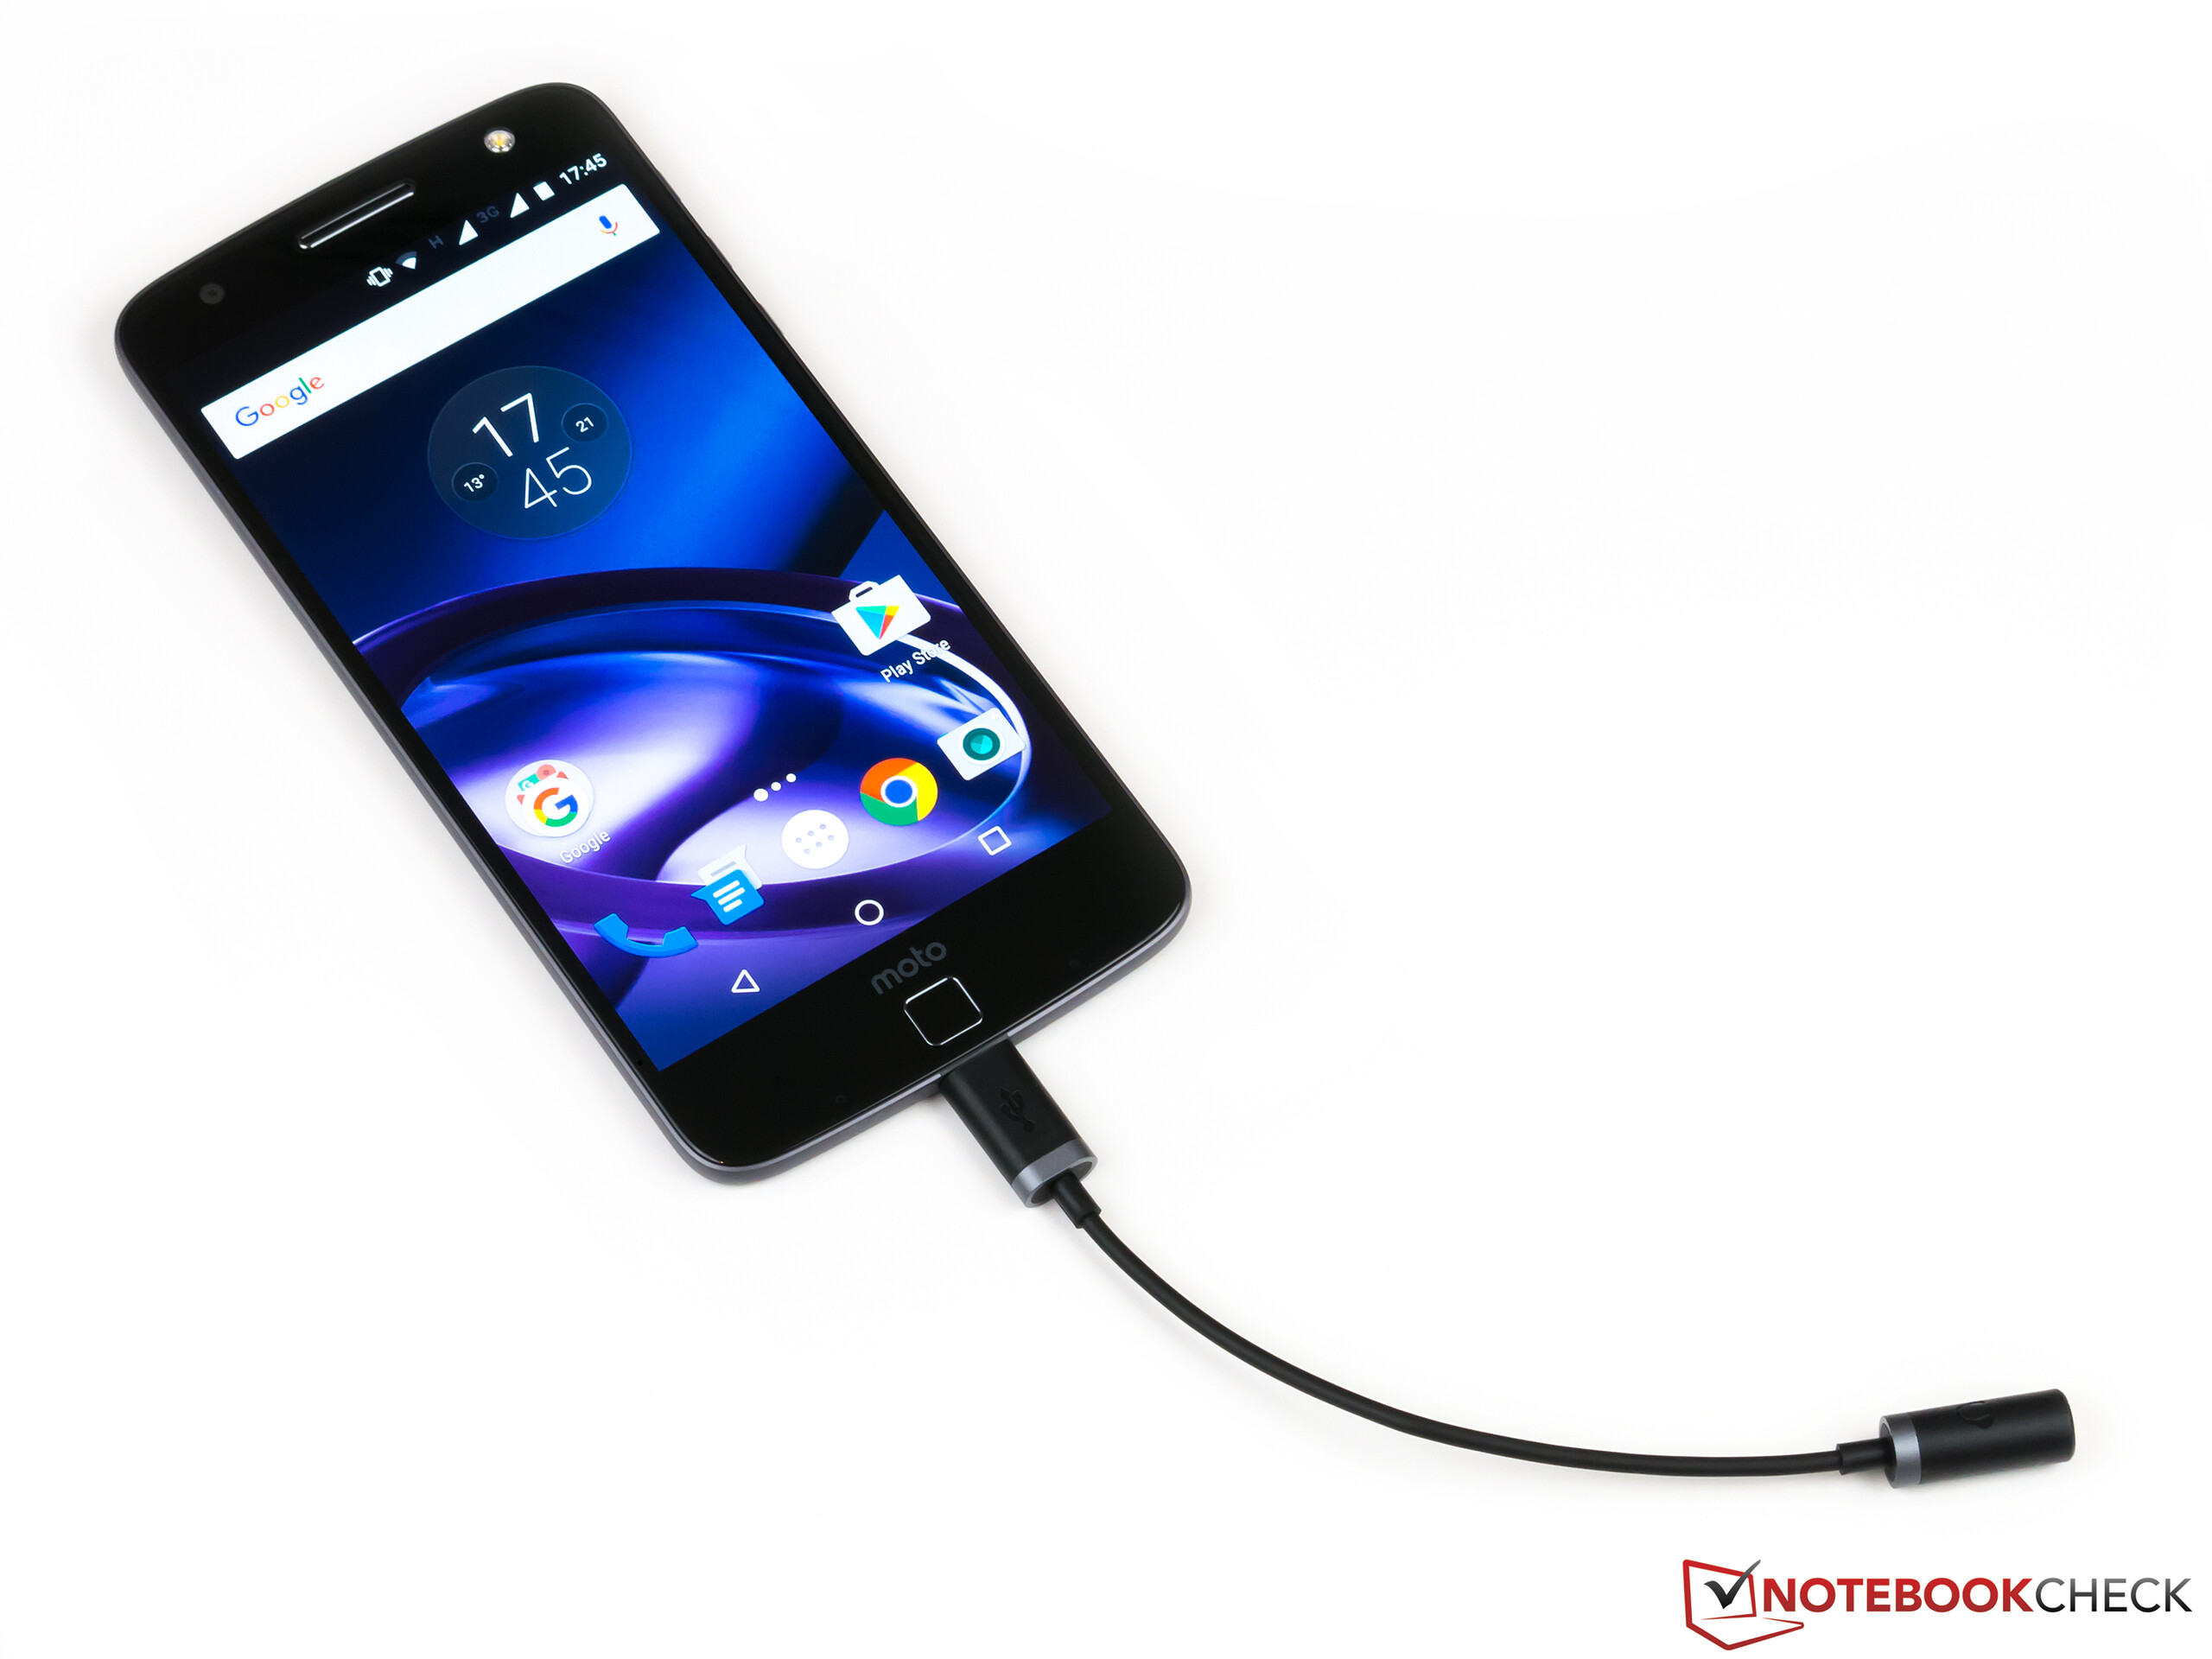
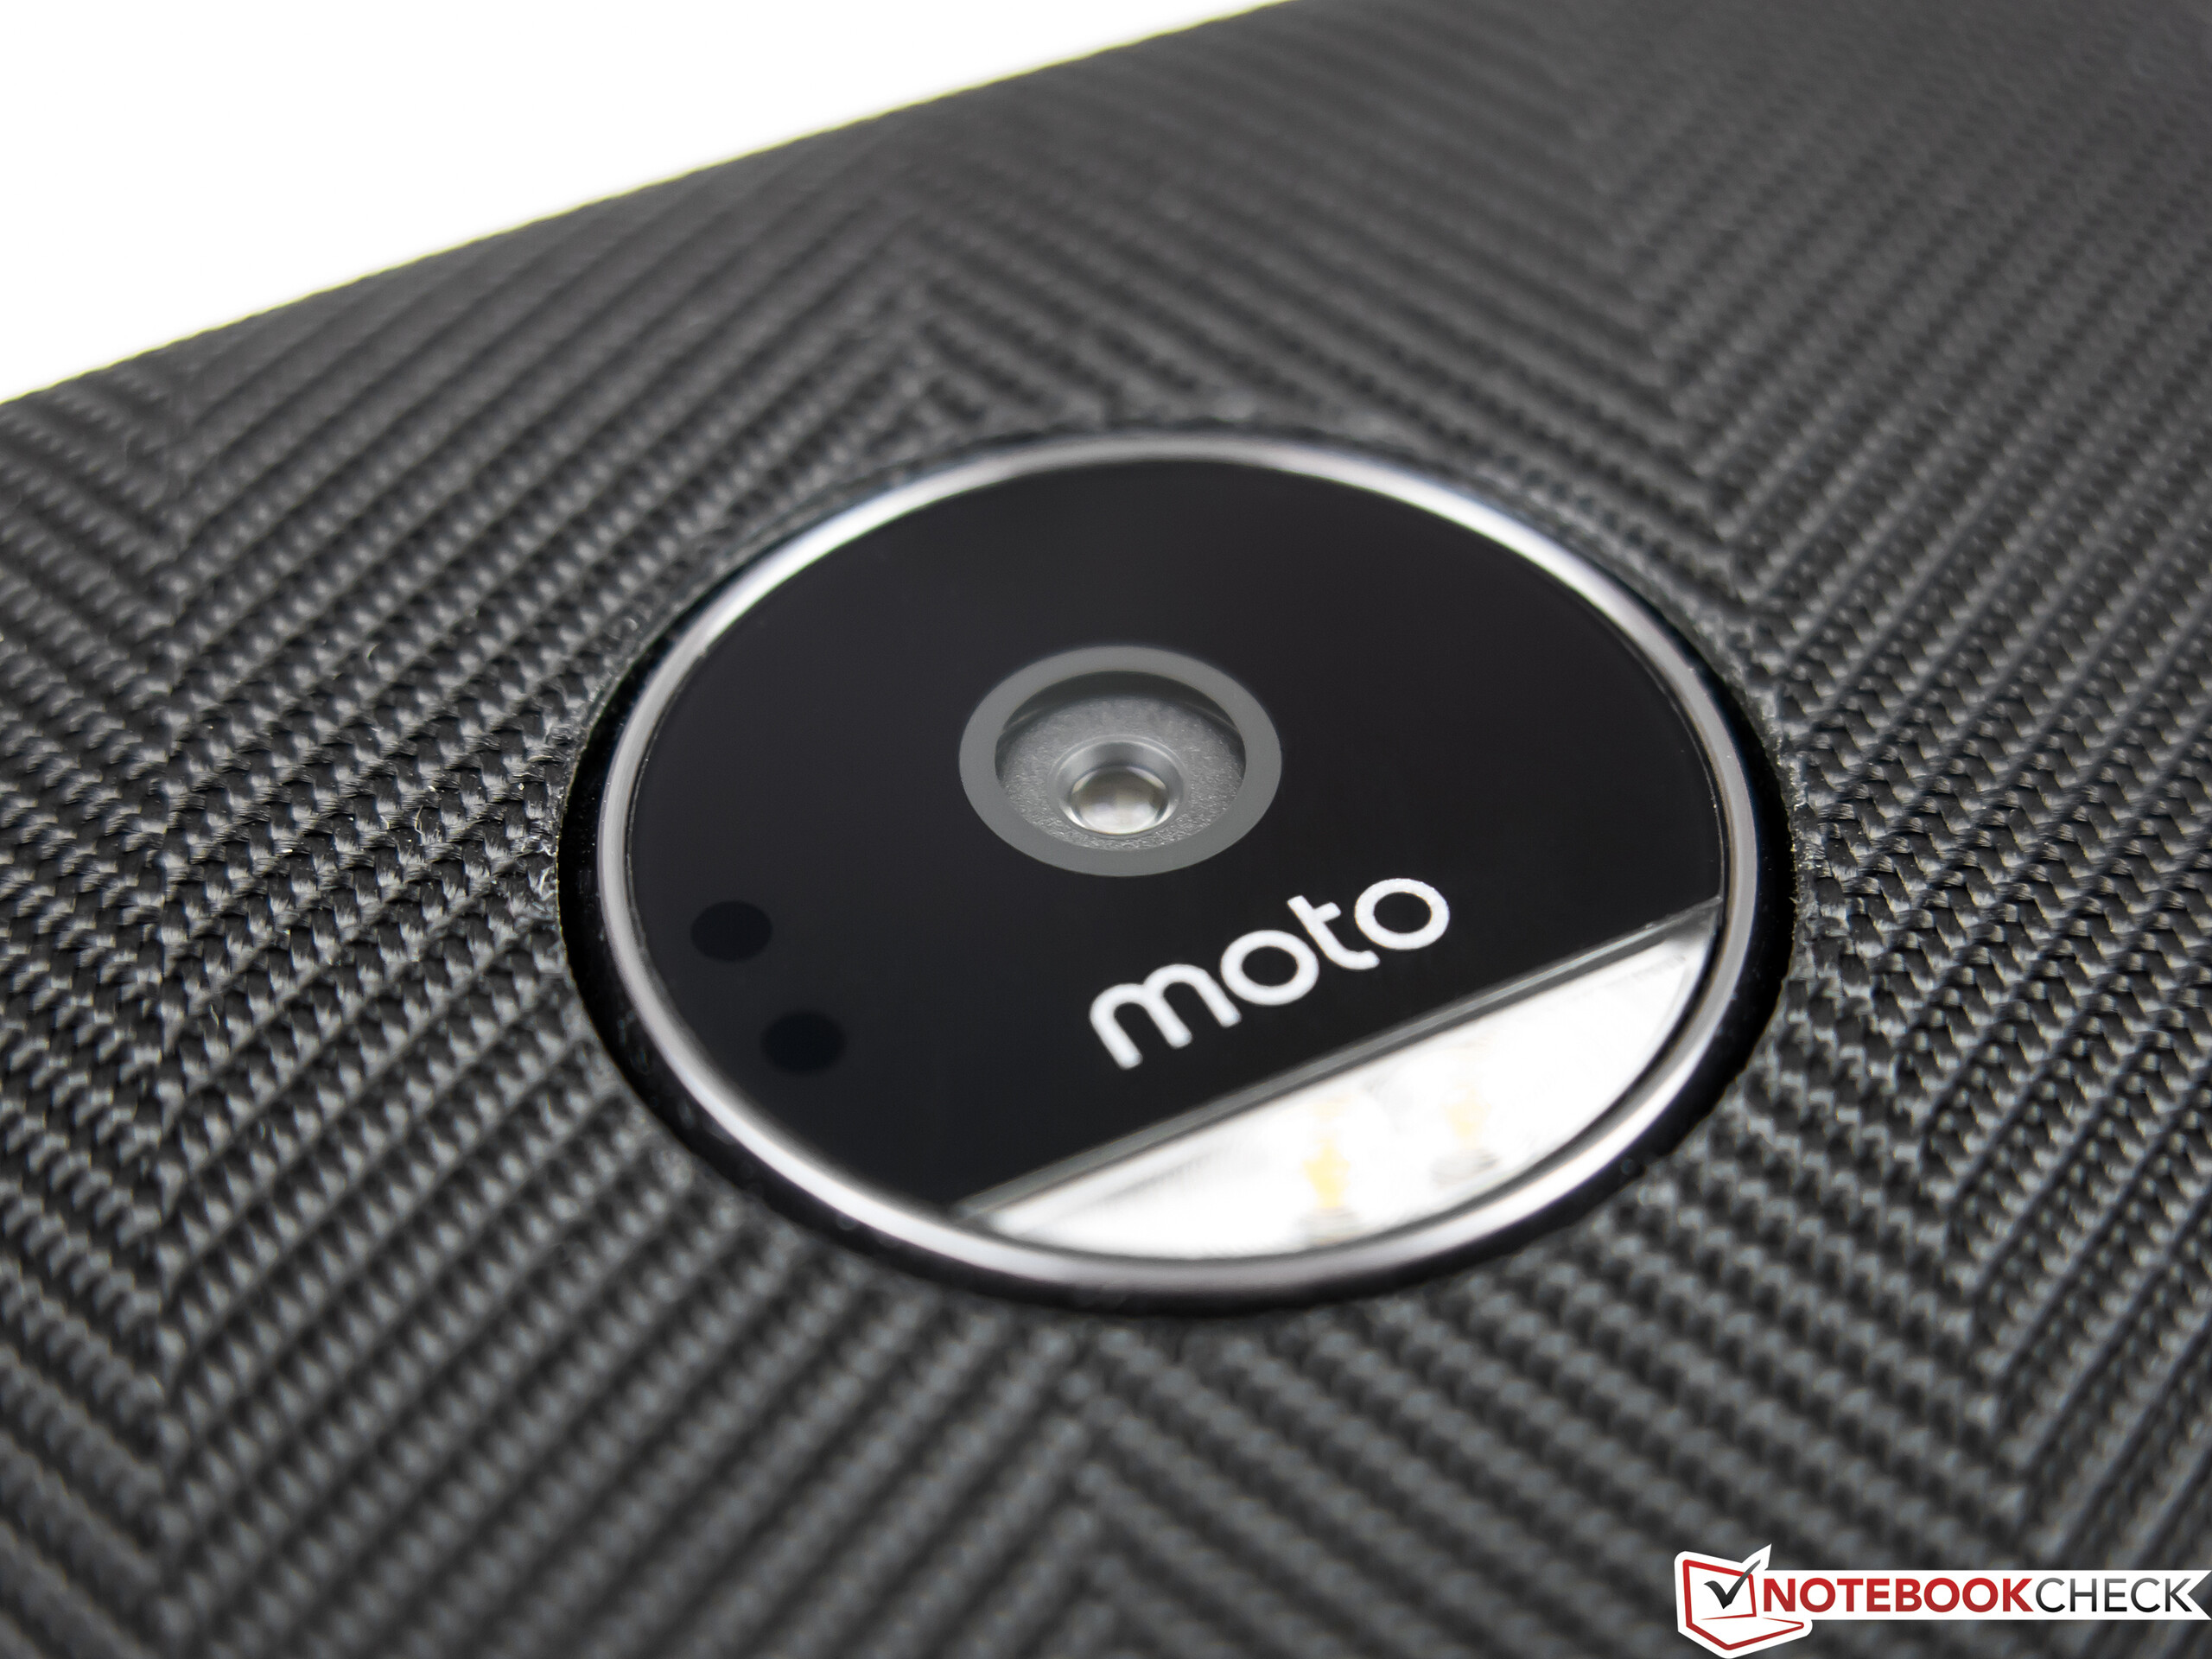
我们不太明白的是为什么联想只为Moto Z搭配了表现一般的相机——即使是采用Moto Z Force的2100万像素的传感器也会让它增色不少。一些潜在用户可能也会怀念3.5毫米耳机接口,尽管它随机附带了转换插头。
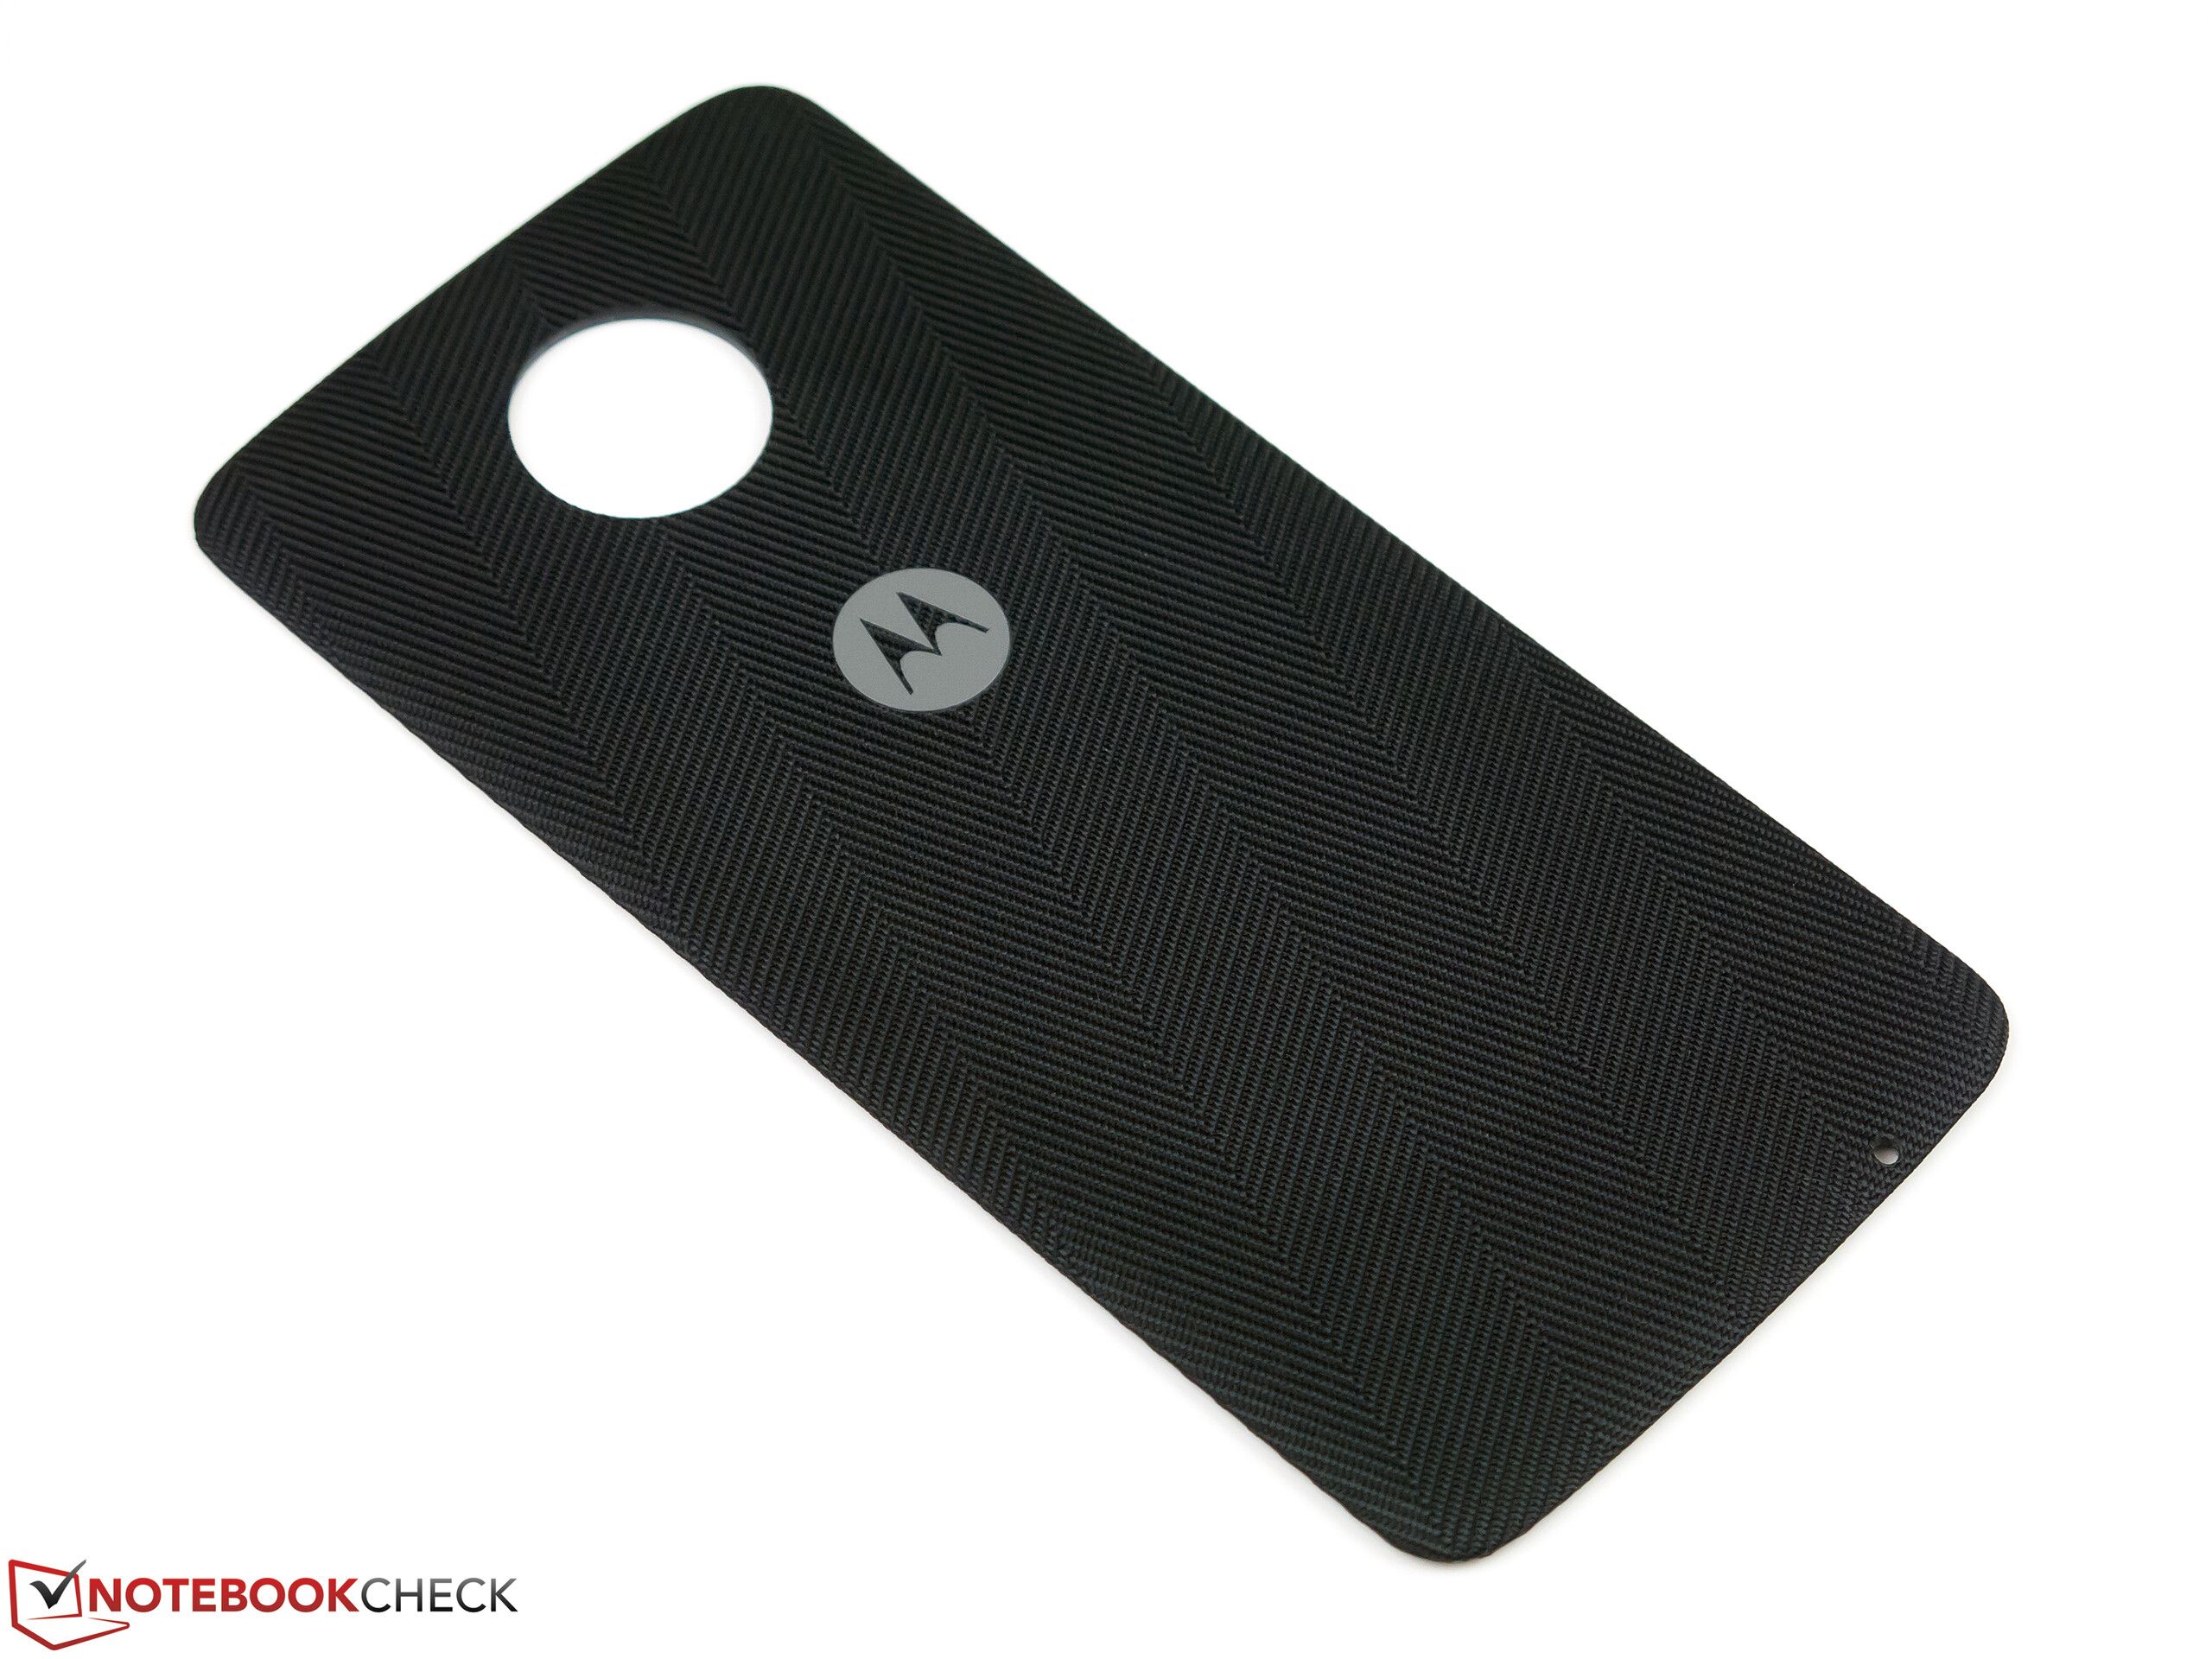
归功于Moto Mod概念设计,它在高端智能手机中独树一帜。不过Moto Z也可以凭借传统智能手机的特质让人满意。只是它主相机的表现有些落后于竞争机型。如果你喜欢模块化智能手机的概念,再购买Moto Z之前也可以考虑一下LG G5。这台LG机型没有太多的拓展空间,质感也稍差,不过搭配高端硬件配置的它售价已经降到了约450欧元(约3374人民币)——这可比我们的测试机便宜了太多。
注:本文是基于完整评测的缩减版本,阅读完整的英文评测,请点击这里。
Lenovo Moto Z
- 09/26/2016 v5.1 (old)
Andreas Kilian
Price comparison
