华为 P10 Lite 智能手机简短评测
| Networking | |
| iperf3 transmit AX12 | |
| Huawei P10 | |
| Huawei P10 Lite | |
| Samsung Galaxy A3 2017 | |
| Honor 6X | |
| Huawei Nova Plus | |
| iperf3 receive AX12 | |
| Huawei P10 | |
| Samsung Galaxy A3 2017 | |
| Huawei P10 Lite | |
| Honor 6X | |
| Huawei Nova Plus | |


| |||||||||||||||||||||||||
Brightness Distribution: 95 %
Center on Battery: 507 cd/m²
Contrast: 1408:1 (Black: 0.36 cd/m²)
ΔE ColorChecker Calman: 5.1 | ∀{0.5-29.43 Ø4.71}
ΔE Greyscale Calman: 6.1 | ∀{0.09-98 Ø4.96}
99.8% sRGB (Calman 2D)
Gamma: 2.28
CCT: 8143 K
| Huawei P10 Lite IPS, 1920x1080, 5.2" | Samsung Galaxy A3 2017 Super AMOLED, 1280x720, 4.7" | Honor 6X IPS, 1920x1080, 5.5" | Huawei Nova Plus IPS, 1920x1080, 5.5" | Lenovo Moto G4 Plus IPS, 1920x1080, 5.5" | Huawei P10 LTPS, 1920x1080, 5.1" | |
|---|---|---|---|---|---|---|
| Screen | 34% | -10% | -4% | 1% | 2% | |
| Brightness middle (cd/m²) | 507 | 574 13% | 547 8% | 485 -4% | 609 20% | 547 8% |
| Brightness (cd/m²) | 509 | 576 13% | 540 6% | 481 -6% | 589 16% | 556 9% |
| Brightness Distribution (%) | 95 | 94 -1% | 94 -1% | 90 -5% | 87 -8% | 86 -9% |
| Black Level * (cd/m²) | 0.36 | 0.57 -58% | 0.5 -39% | 0.63 -75% | 0.43 -19% | |
| Contrast (:1) | 1408 | 960 -32% | 970 -31% | 967 -31% | 1272 -10% | |
| Colorchecker dE 2000 * | 5.1 | 2.4 53% | 5.1 -0% | 4.2 18% | 3.8 25% | 4.8 6% |
| Colorchecker dE 2000 max. * | 9 | 3.8 58% | 9.1 -1% | 7.9 12% | 8.3 8% | 8.8 2% |
| Greyscale dE 2000 * | 6.1 | 1.9 69% | 6.2 -2% | 4.8 21% | 3.1 49% | 4.5 26% |
| Gamma | 2.28 96% | 2.09 105% | 2.09 105% | 2.36 93% | 2.06 107% | 2.39 92% |
| CCT | 8143 80% | 6502 100% | 6546 99% | 7568 86% | 6725 97% | 7194 90% |
* ... smaller is better
Screen Flickering / PWM (Pulse-Width Modulation)
| Screen flickering / PWM not detected | 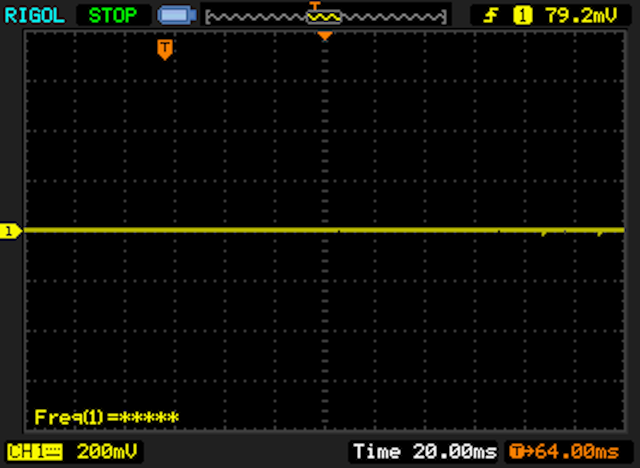 | ||
In comparison: 52 % of all tested devices do not use PWM to dim the display. If PWM was detected, an average of 7754 (minimum: 5 - maximum: 343500) Hz was measured. | |||
Display Response Times
| ↔ Response Time Black to White | ||
|---|---|---|
| 36 ms ... rise ↗ and fall ↘ combined | ↗ 22 ms rise | 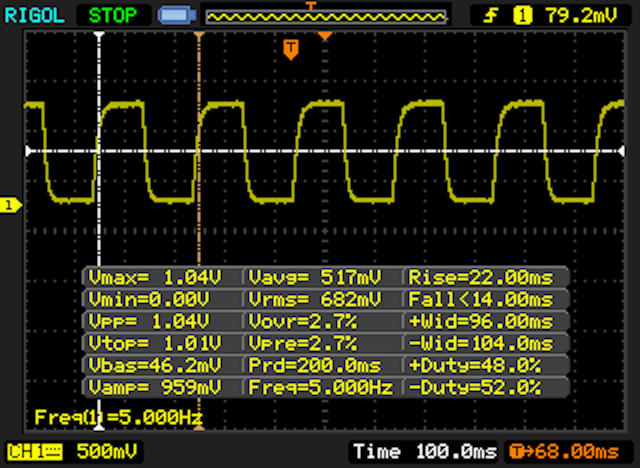 |
| ↘ 14 ms fall | ||
| The screen shows slow response rates in our tests and will be unsatisfactory for gamers. In comparison, all tested devices range from 0.1 (minimum) to 240 (maximum) ms. » 94 % of all devices are better. This means that the measured response time is worse than the average of all tested devices (19.8 ms). | ||
| ↔ Response Time 50% Grey to 80% Grey | ||
| 48 ms ... rise ↗ and fall ↘ combined | ↗ 26 ms rise | 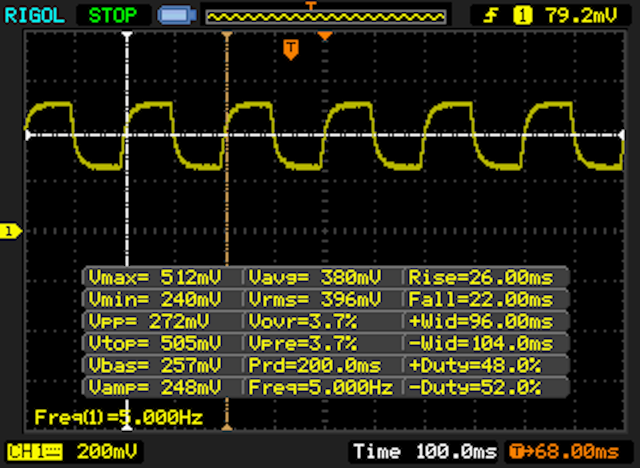 |
| ↘ 22 ms fall | ||
| The screen shows slow response rates in our tests and will be unsatisfactory for gamers. In comparison, all tested devices range from 0.165 (minimum) to 636 (maximum) ms. » 82 % of all devices are better. This means that the measured response time is worse than the average of all tested devices (31 ms). | ||
| AnTuTu v6 - Total Score (sort by value) | |
| Huawei P10 Lite | |
| Samsung Galaxy A3 2017 | |
| Honor 6X | |
| Huawei Nova Plus | |
| Lenovo Moto G4 Plus | |
| Huawei P10 | |
| Geekbench 4.0 | |
| 64 Bit Single-Core Score (sort by value) | |
| Huawei P10 Lite | |
| Samsung Galaxy A3 2017 | |
| Honor 6X | |
| Huawei Nova Plus | |
| Huawei P10 | |
| 64 Bit Multi-Core Score (sort by value) | |
| Huawei P10 Lite | |
| Samsung Galaxy A3 2017 | |
| Honor 6X | |
| Huawei Nova Plus | |
| Huawei P10 | |
| GFXBench (DX / GLBenchmark) 2.7 | |
| T-Rex Onscreen (sort by value) | |
| Huawei P10 Lite | |
| Samsung Galaxy A3 2017 | |
| Honor 6X | |
| Huawei Nova Plus | |
| Lenovo Moto G4 Plus | |
| Huawei P10 | |
| 1920x1080 T-Rex Offscreen (sort by value) | |
| Huawei P10 Lite | |
| Samsung Galaxy A3 2017 | |
| Honor 6X | |
| Huawei Nova Plus | |
| Lenovo Moto G4 Plus | |
| Huawei P10 | |
| GFXBench 3.0 | |
| on screen Manhattan Onscreen OGL (sort by value) | |
| Huawei P10 Lite | |
| Samsung Galaxy A3 2017 | |
| Honor 6X | |
| Huawei Nova Plus | |
| Lenovo Moto G4 Plus | |
| Huawei P10 | |
| 1920x1080 1080p Manhattan Offscreen (sort by value) | |
| Huawei P10 Lite | |
| Samsung Galaxy A3 2017 | |
| Honor 6X | |
| Huawei Nova Plus | |
| Lenovo Moto G4 Plus | |
| Huawei P10 | |
| GFXBench 3.1 | |
| on screen Manhattan ES 3.1 Onscreen (sort by value) | |
| Huawei P10 Lite | |
| Samsung Galaxy A3 2017 | |
| Honor 6X | |
| Huawei Nova Plus | |
| Lenovo Moto G4 Plus | |
| Huawei P10 | |
| 1920x1080 Manhattan ES 3.1 Offscreen (sort by value) | |
| Huawei P10 Lite | |
| Samsung Galaxy A3 2017 | |
| Honor 6X | |
| Huawei Nova Plus | |
| Lenovo Moto G4 Plus | |
| Huawei P10 | |
| PCMark for Android - Work performance score (sort by value) | |
| Huawei P10 Lite | |
| Samsung Galaxy A3 2017 | |
| Honor 6X | |
| Huawei Nova Plus | |
| Lenovo Moto G4 Plus | |
| Huawei P10 | |
| Octane V2 - Total Score (sort by value) | |
| Huawei P10 Lite | |
| Samsung Galaxy A3 2017 | |
| Honor 6X | |
| Huawei Nova Plus | |
| Lenovo Moto G4 Plus | |
| Huawei P10 | |
| Mozilla Kraken 1.1 - Total (sort by value) | |
| Huawei P10 Lite | |
| Samsung Galaxy A3 2017 | |
| Honor 6X | |
| Huawei Nova Plus | |
| Lenovo Moto G4 Plus | |
| Huawei P10 | |
| WebXPRT 2015 - Overall (sort by value) | |
| Huawei P10 Lite | |
| Samsung Galaxy A3 2017 | |
| Honor 6X | |
| Huawei Nova Plus | |
| Lenovo Moto G4 Plus | |
| Huawei P10 | |
| JetStream 1.1 - 1.1 Total (sort by value) | |
| Huawei P10 Lite | |
| Samsung Galaxy A3 2017 | |
| Honor 6X | |
| Huawei Nova Plus | |
| Lenovo Moto G4 Plus | |
| Huawei P10 | |
* ... smaller is better
| Huawei P10 Lite | Samsung Galaxy A3 2017 | Honor 6X | Huawei Nova Plus | Lenovo Moto G4 Plus | Huawei P10 | |
|---|---|---|---|---|---|---|
| AndroBench 3-5 | -19% | 9% | -10% | 9% | 174% | |
| Sequential Read 256KB (MB/s) | 264.3 | 199.7 -24% | 283.4 7% | 241.6 -9% | 271.4 3% | 738 179% |
| Sequential Write 256KB (MB/s) | 129.2 | 45.96 -64% | 73.8 -43% | 82.1 -36% | 43.48 -66% | 189.8 47% |
| Random Read 4KB (MB/s) | 72.5 | 22.32 -69% | 39.55 -45% | 35.64 -51% | 36.32 -50% | 168.4 132% |
| Random Write 4KB (MB/s) | 19.36 | 9.62 -50% | 45.05 133% | 30.12 56% | 35.79 85% | 152.3 687% |
| Sequential Read 256KB SDCard (MB/s) | 53.4 | 75.5 41% | 52 -3% | 41.64 -22% | 74.4 39% | 54.2 1% |
| Sequential Write 256KB SDCard (MB/s) | 32.7 | 50.1 53% | 34.53 6% | 33.32 2% | 46.92 43% | 32.19 -2% |
| Asphalt 8: Airborne | |||
| Settings | Value | ||
| high | 22 fps | ||
| very low | 30 fps | ||
| Dead Trigger 2 | |||
| Settings | Value | ||
| high | 51 fps | ||
(+) The maximum temperature on the upper side is 34.9 °C / 95 F, compared to the average of 35.3 °C / 96 F, ranging from 21.9 to 247 °C for the class Smartphone.
(+) The bottom heats up to a maximum of 35 °C / 95 F, compared to the average of 34 °C / 93 F
(+) In idle usage, the average temperature for the upper side is 31.2 °C / 88 F, compared to the device average of 33 °C / 91 F.
Huawei P10 Lite audio analysis
(+) | speakers can play relatively loud (85 dB)
Bass 100 - 315 Hz
(-) | nearly no bass - on average 27.2% lower than median
(±) | linearity of bass is average (10.3% delta to prev. frequency)
Mids 400 - 2000 Hz
(+) | balanced mids - only 4.6% away from median
(+) | mids are linear (5.1% delta to prev. frequency)
Highs 2 - 16 kHz
(±) | higher highs - on average 6.8% higher than median
(+) | highs are linear (5.2% delta to prev. frequency)
Overall 100 - 16.000 Hz
(±) | linearity of overall sound is average (23.4% difference to median)
Compared to same class
» 53% of all tested devices in this class were better, 8% similar, 39% worse
» The best had a delta of 11%, average was 34%, worst was 134%
Compared to all devices tested
» 70% of all tested devices were better, 6% similar, 24% worse
» The best had a delta of 4%, average was 23%, worst was 134%
Samsung Galaxy A3 2017 audio analysis
(+) | speakers can play relatively loud (82.6 dB)
Bass 100 - 315 Hz
(-) | nearly no bass - on average 19.2% lower than median
(±) | linearity of bass is average (9.7% delta to prev. frequency)
Mids 400 - 2000 Hz
(±) | higher mids - on average 8.7% higher than median
(±) | linearity of mids is average (7.4% delta to prev. frequency)
Highs 2 - 16 kHz
(±) | higher highs - on average 5.6% higher than median
(+) | highs are linear (6.9% delta to prev. frequency)
Overall 100 - 16.000 Hz
(±) | linearity of overall sound is average (26.1% difference to median)
Compared to same class
» 66% of all tested devices in this class were better, 6% similar, 28% worse
» The best had a delta of 11%, average was 34%, worst was 134%
Compared to all devices tested
» 80% of all tested devices were better, 4% similar, 16% worse
» The best had a delta of 4%, average was 23%, worst was 134%
Honor 6X audio analysis
(±) | speaker loudness is average but good (81.9 dB)
Bass 100 - 315 Hz
(-) | nearly no bass - on average 21.7% lower than median
(±) | linearity of bass is average (10.2% delta to prev. frequency)
Mids 400 - 2000 Hz
(±) | higher mids - on average 8.4% higher than median
(±) | linearity of mids is average (7.8% delta to prev. frequency)
Highs 2 - 16 kHz
(±) | higher highs - on average 6.7% higher than median
(+) | highs are linear (5.8% delta to prev. frequency)
Overall 100 - 16.000 Hz
(±) | linearity of overall sound is average (29.1% difference to median)
Compared to same class
» 77% of all tested devices in this class were better, 3% similar, 20% worse
» The best had a delta of 11%, average was 34%, worst was 134%
Compared to all devices tested
» 87% of all tested devices were better, 2% similar, 11% worse
» The best had a delta of 4%, average was 23%, worst was 134%
| Off / Standby | |
| Idle | |
| Load |
|
Key:
min: | |
| Huawei P10 Lite 3000 mAh | Samsung Galaxy A3 2017 2350 mAh | Honor 6X 3340 mAh | Huawei Nova Plus 3340 mAh | Lenovo Moto G4 Plus 3000 mAh | |
|---|---|---|---|---|---|
| Power Consumption | 44% | -23% | 2% | -30% | |
| Idle Minimum * (Watt) | 0.38 | 0.37 3% | 0.82 -116% | 0.49 -29% | 0.63 -66% |
| Idle Average * (Watt) | 1.87 | 0.78 58% | 2 -7% | 1.63 13% | 1.91 -2% |
| Idle Maximum * (Watt) | 1.92 | 0.84 56% | 2.03 -6% | 1.76 8% | 1.96 -2% |
| Load Average * (Watt) | 3.82 | 1.52 60% | 3.34 13% | 2.98 22% | 3.88 -2% |
| Load Maximum * (Watt) | 4.9 | 2.75 44% | 4.92 -0% | 4.99 -2% | 8.74 -78% |
* ... smaller is better
| Huawei P10 Lite 3000 mAh | Samsung Galaxy A3 2017 2350 mAh | Honor 6X 3340 mAh | Huawei Nova Plus 3340 mAh | Lenovo Moto G4 Plus 3000 mAh | Huawei P10 3200 mAh | |
|---|---|---|---|---|---|---|
| Battery runtime | 64% | 47% | 30% | 0% | 3% | |
| Reader / Idle (h) | 23.5 | 47.7 103% | 37.5 60% | 34.1 45% | 20.4 -13% | 25.7 9% |
| H.264 (h) | 9.8 | 16.5 68% | 14.8 51% | 12.2 24% | 12.9 32% | 9.7 -1% |
| WiFi v1.3 (h) | 11.1 | 11.1 0% | 16 44% | 13.7 23% | 12.3 11% | 16.1 45% |
| Load (h) | 4.8 | 8.9 85% | 6.3 31% | 6.1 27% | 3.4 -29% | 2.9 -40% |
Pros
Cons

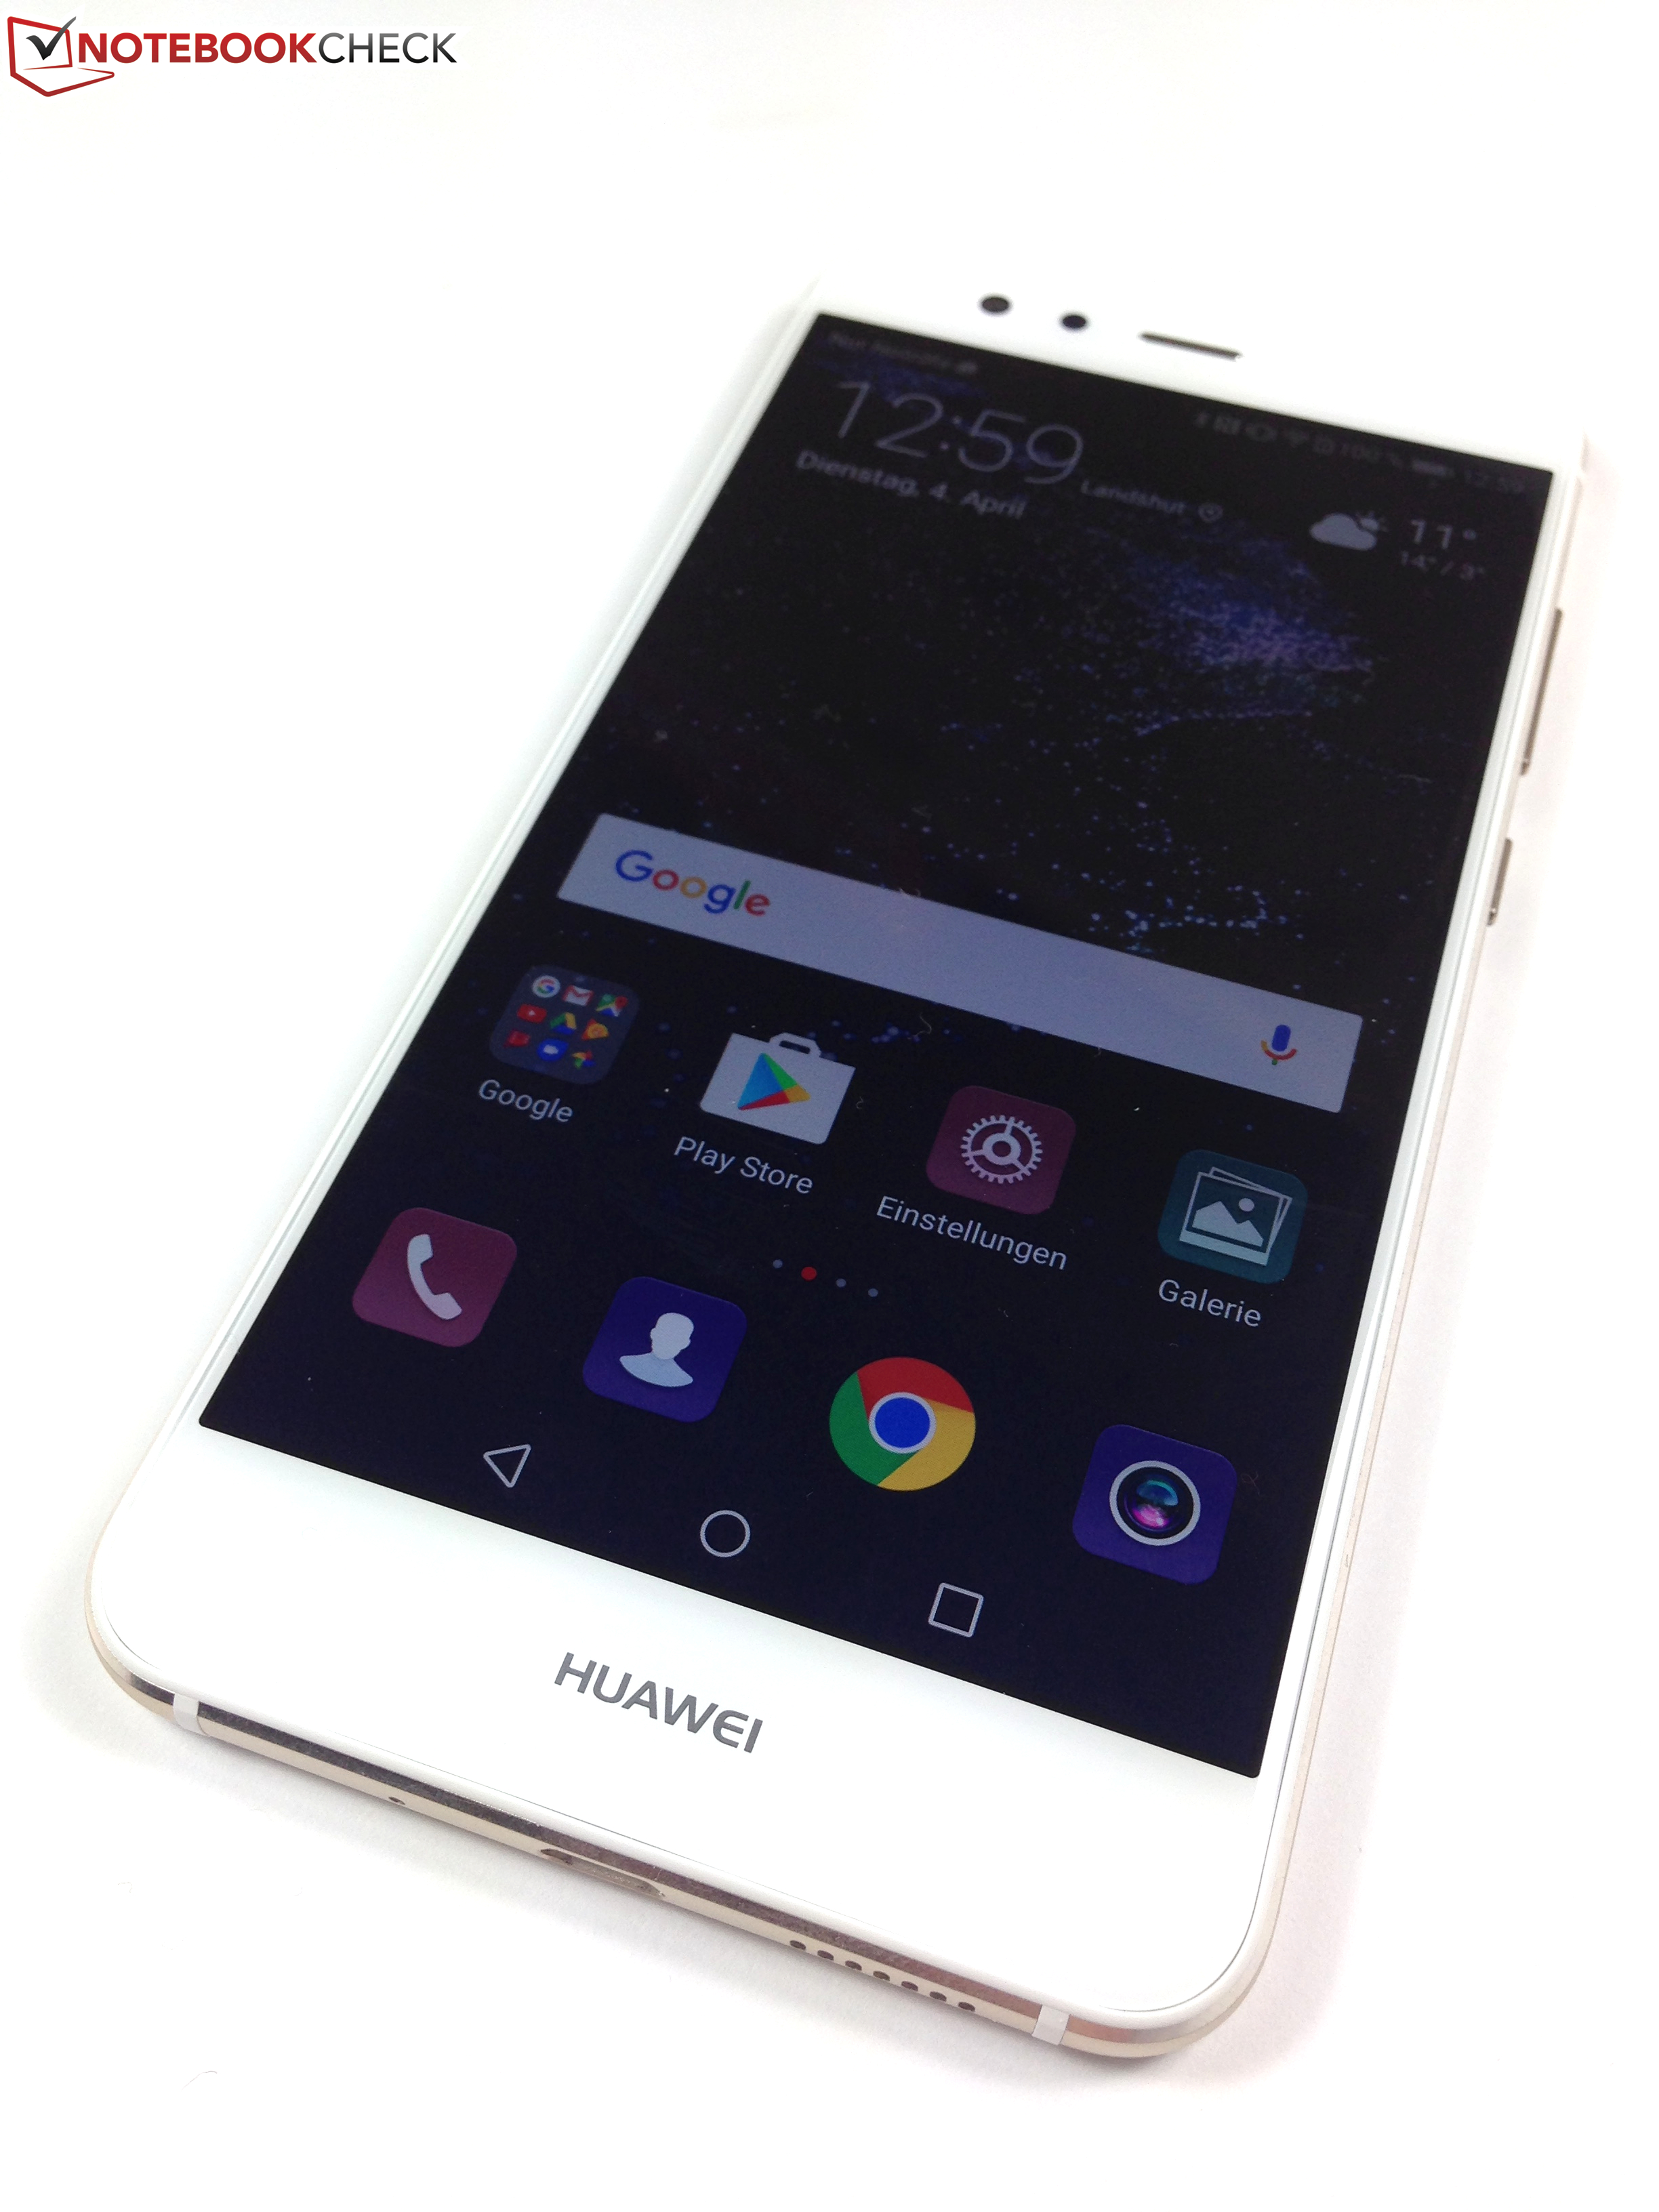
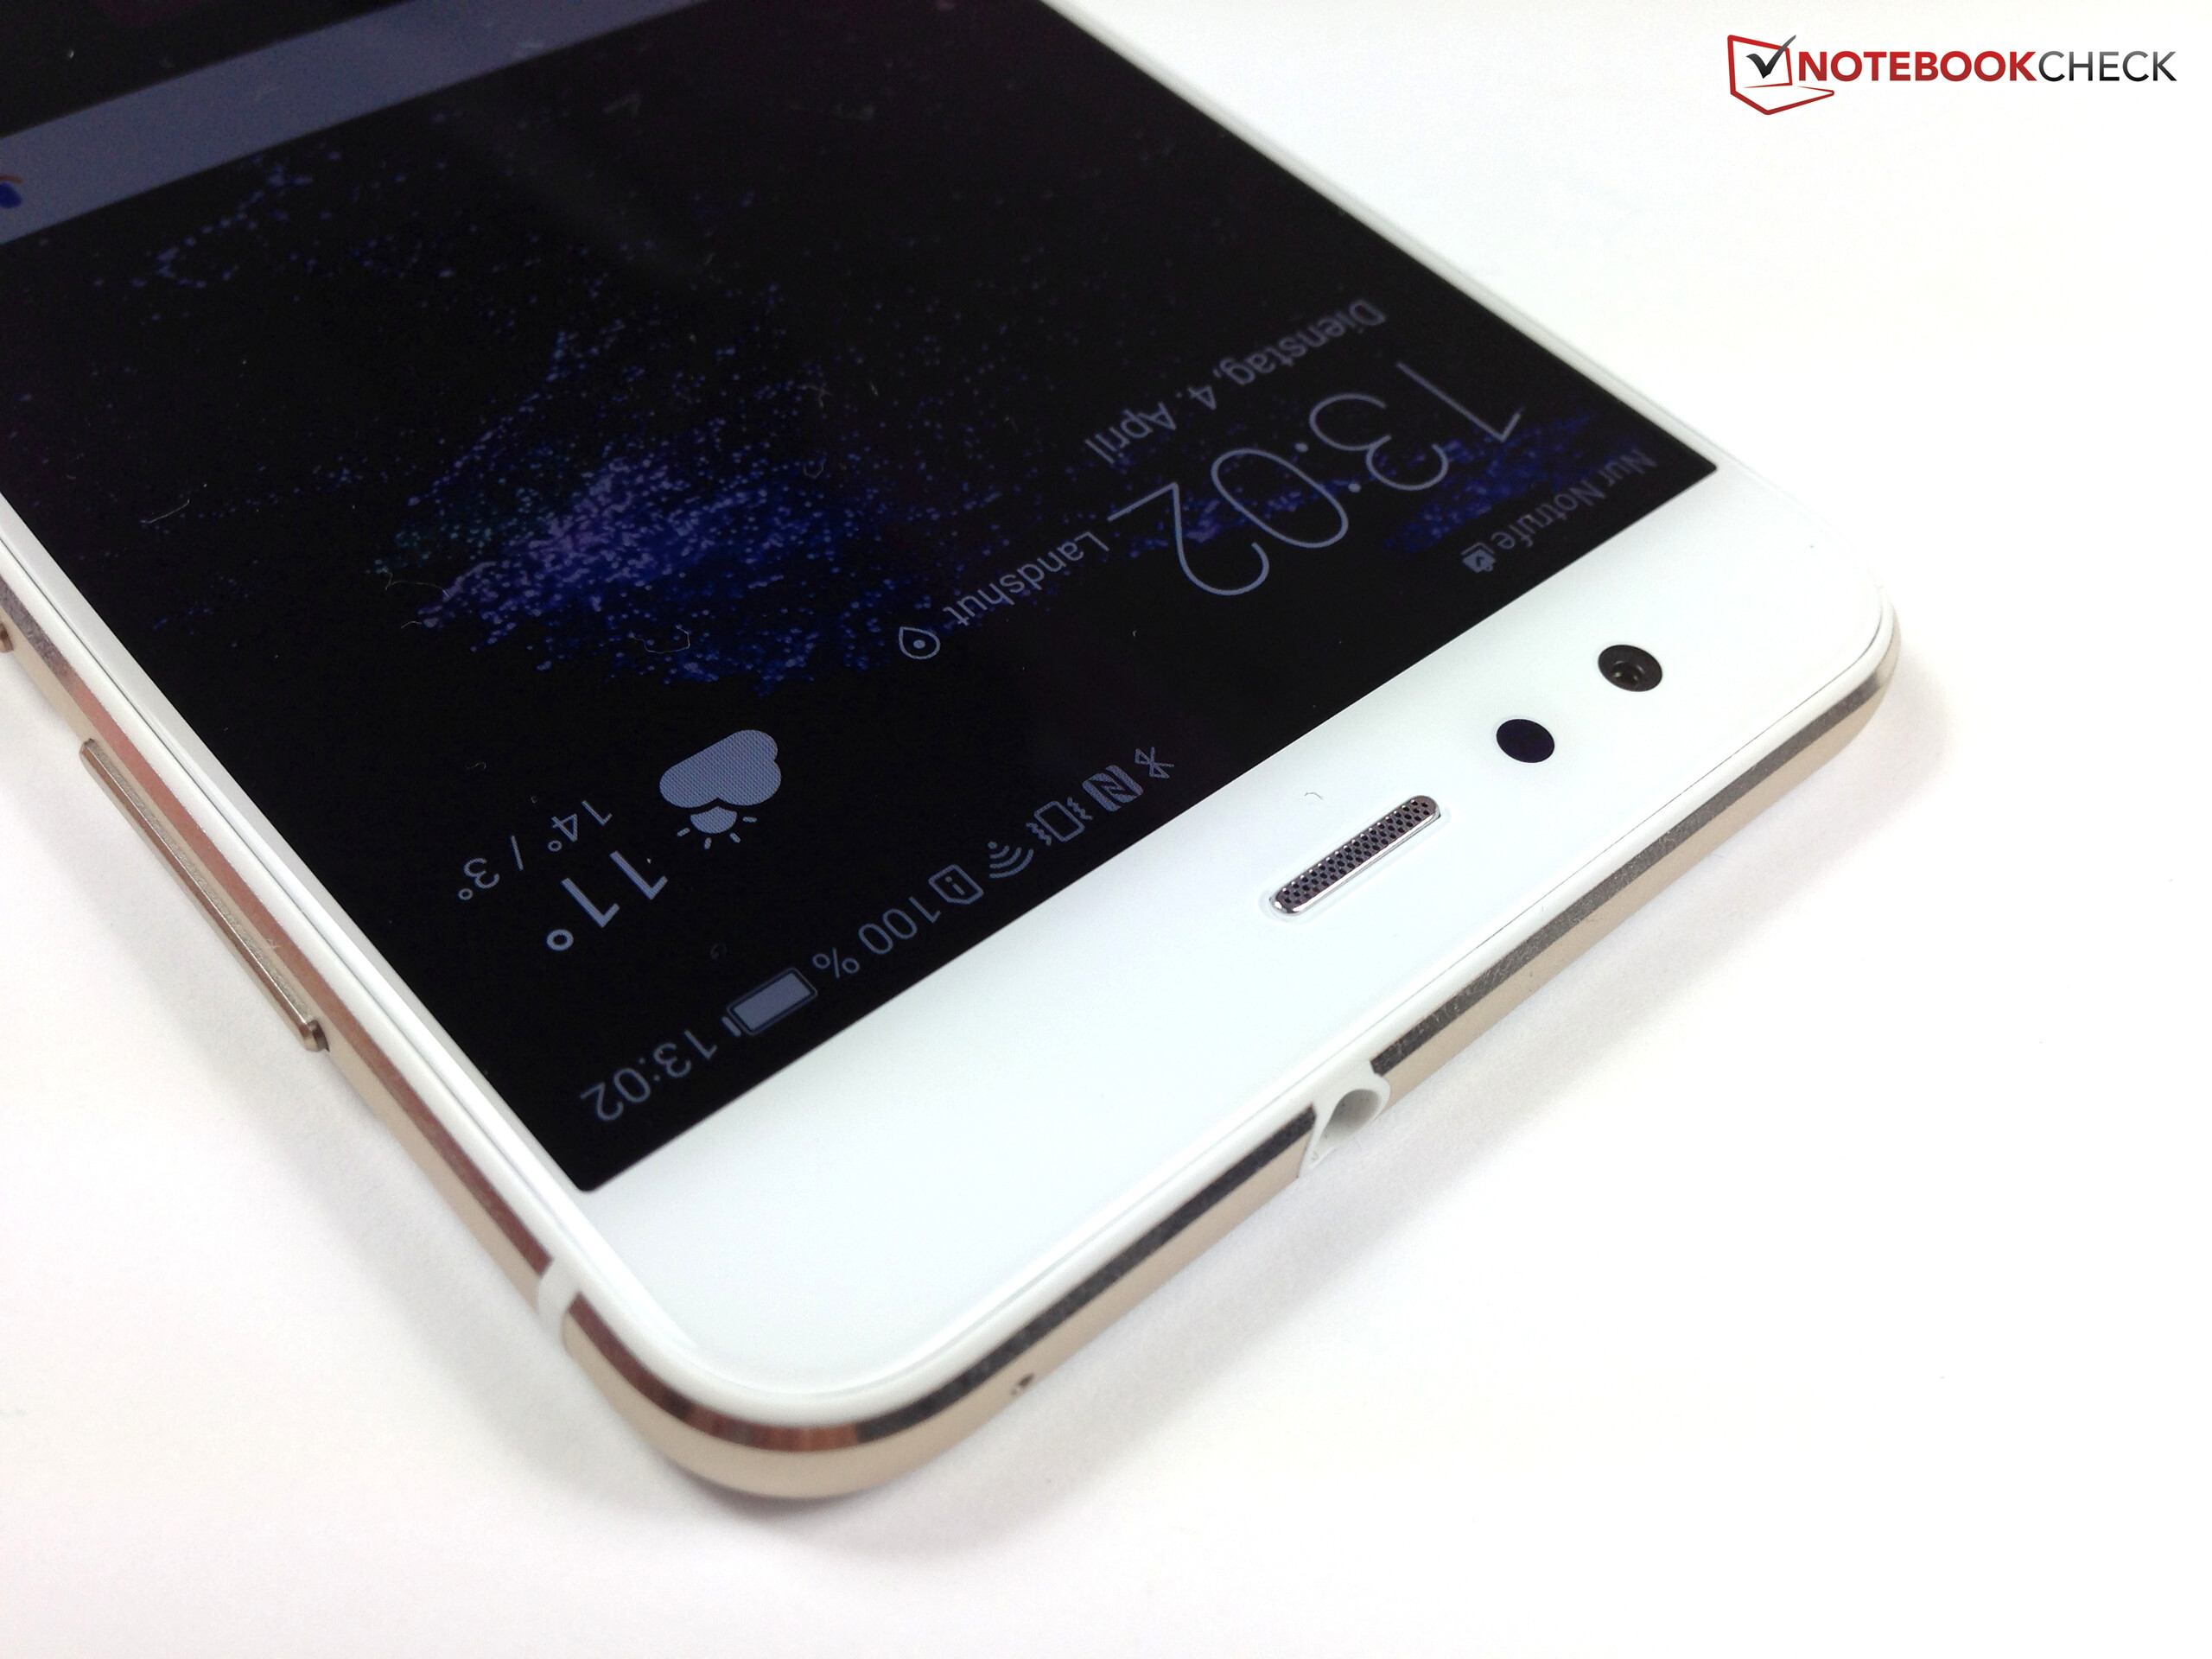
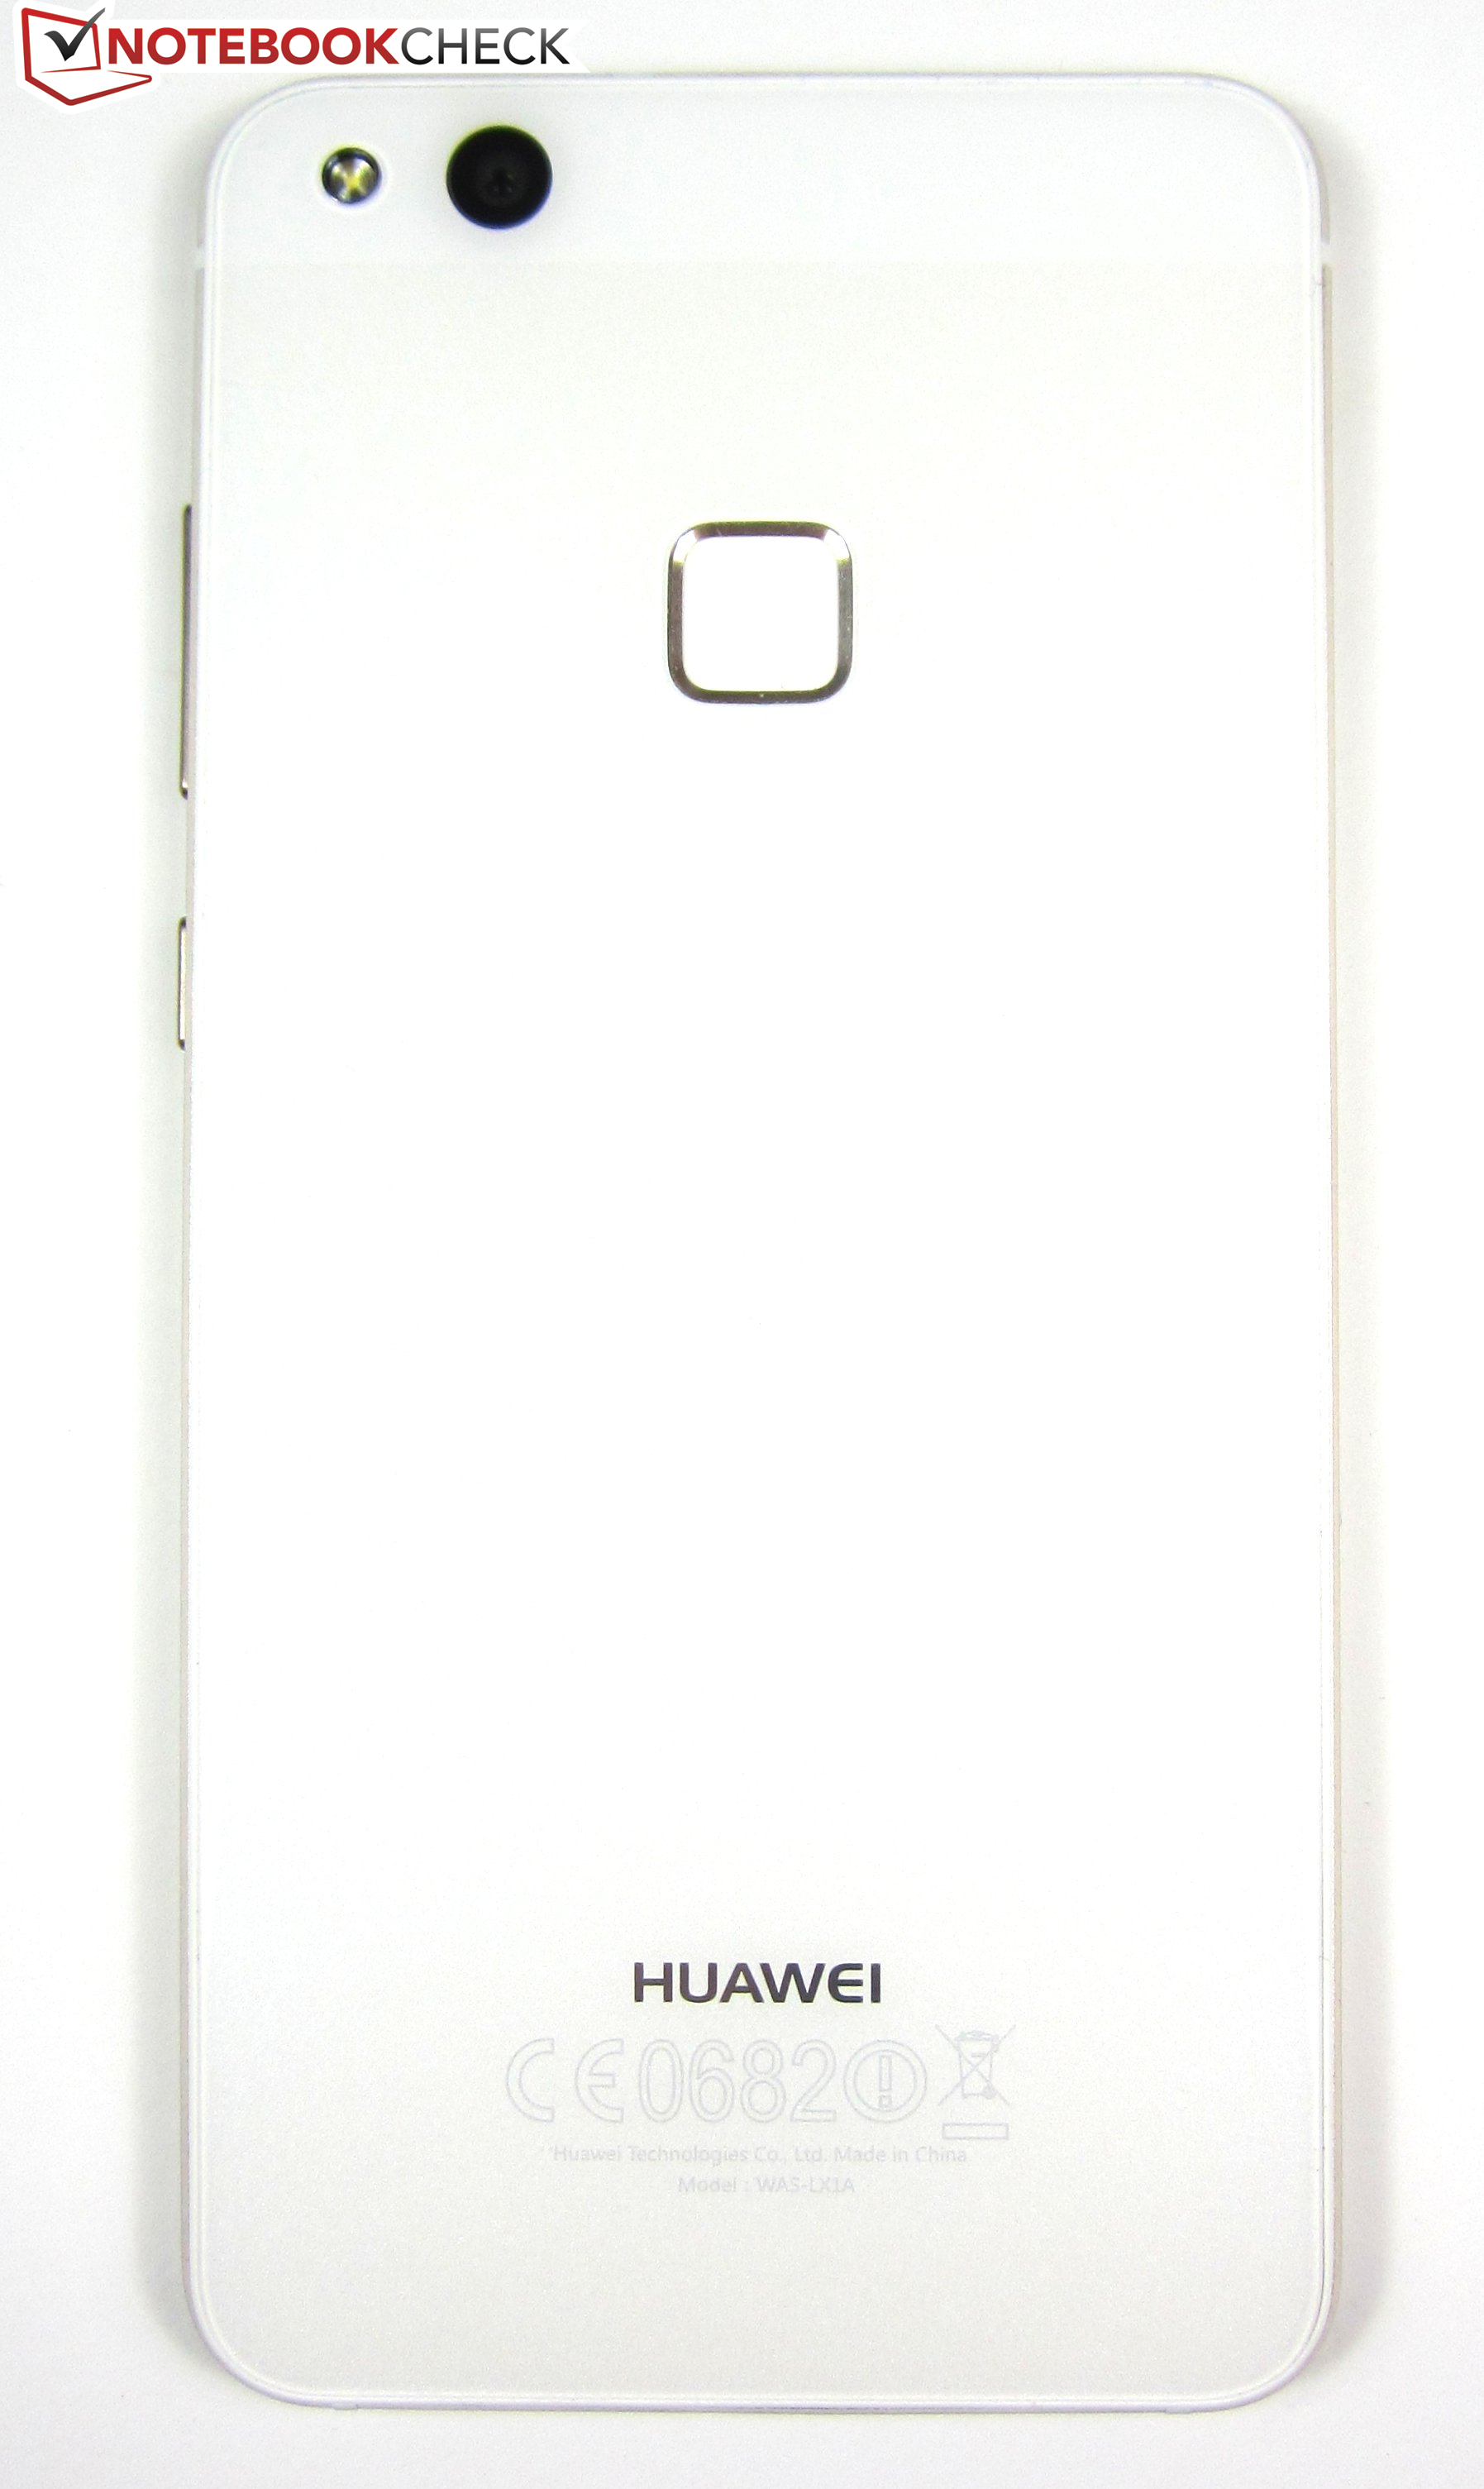
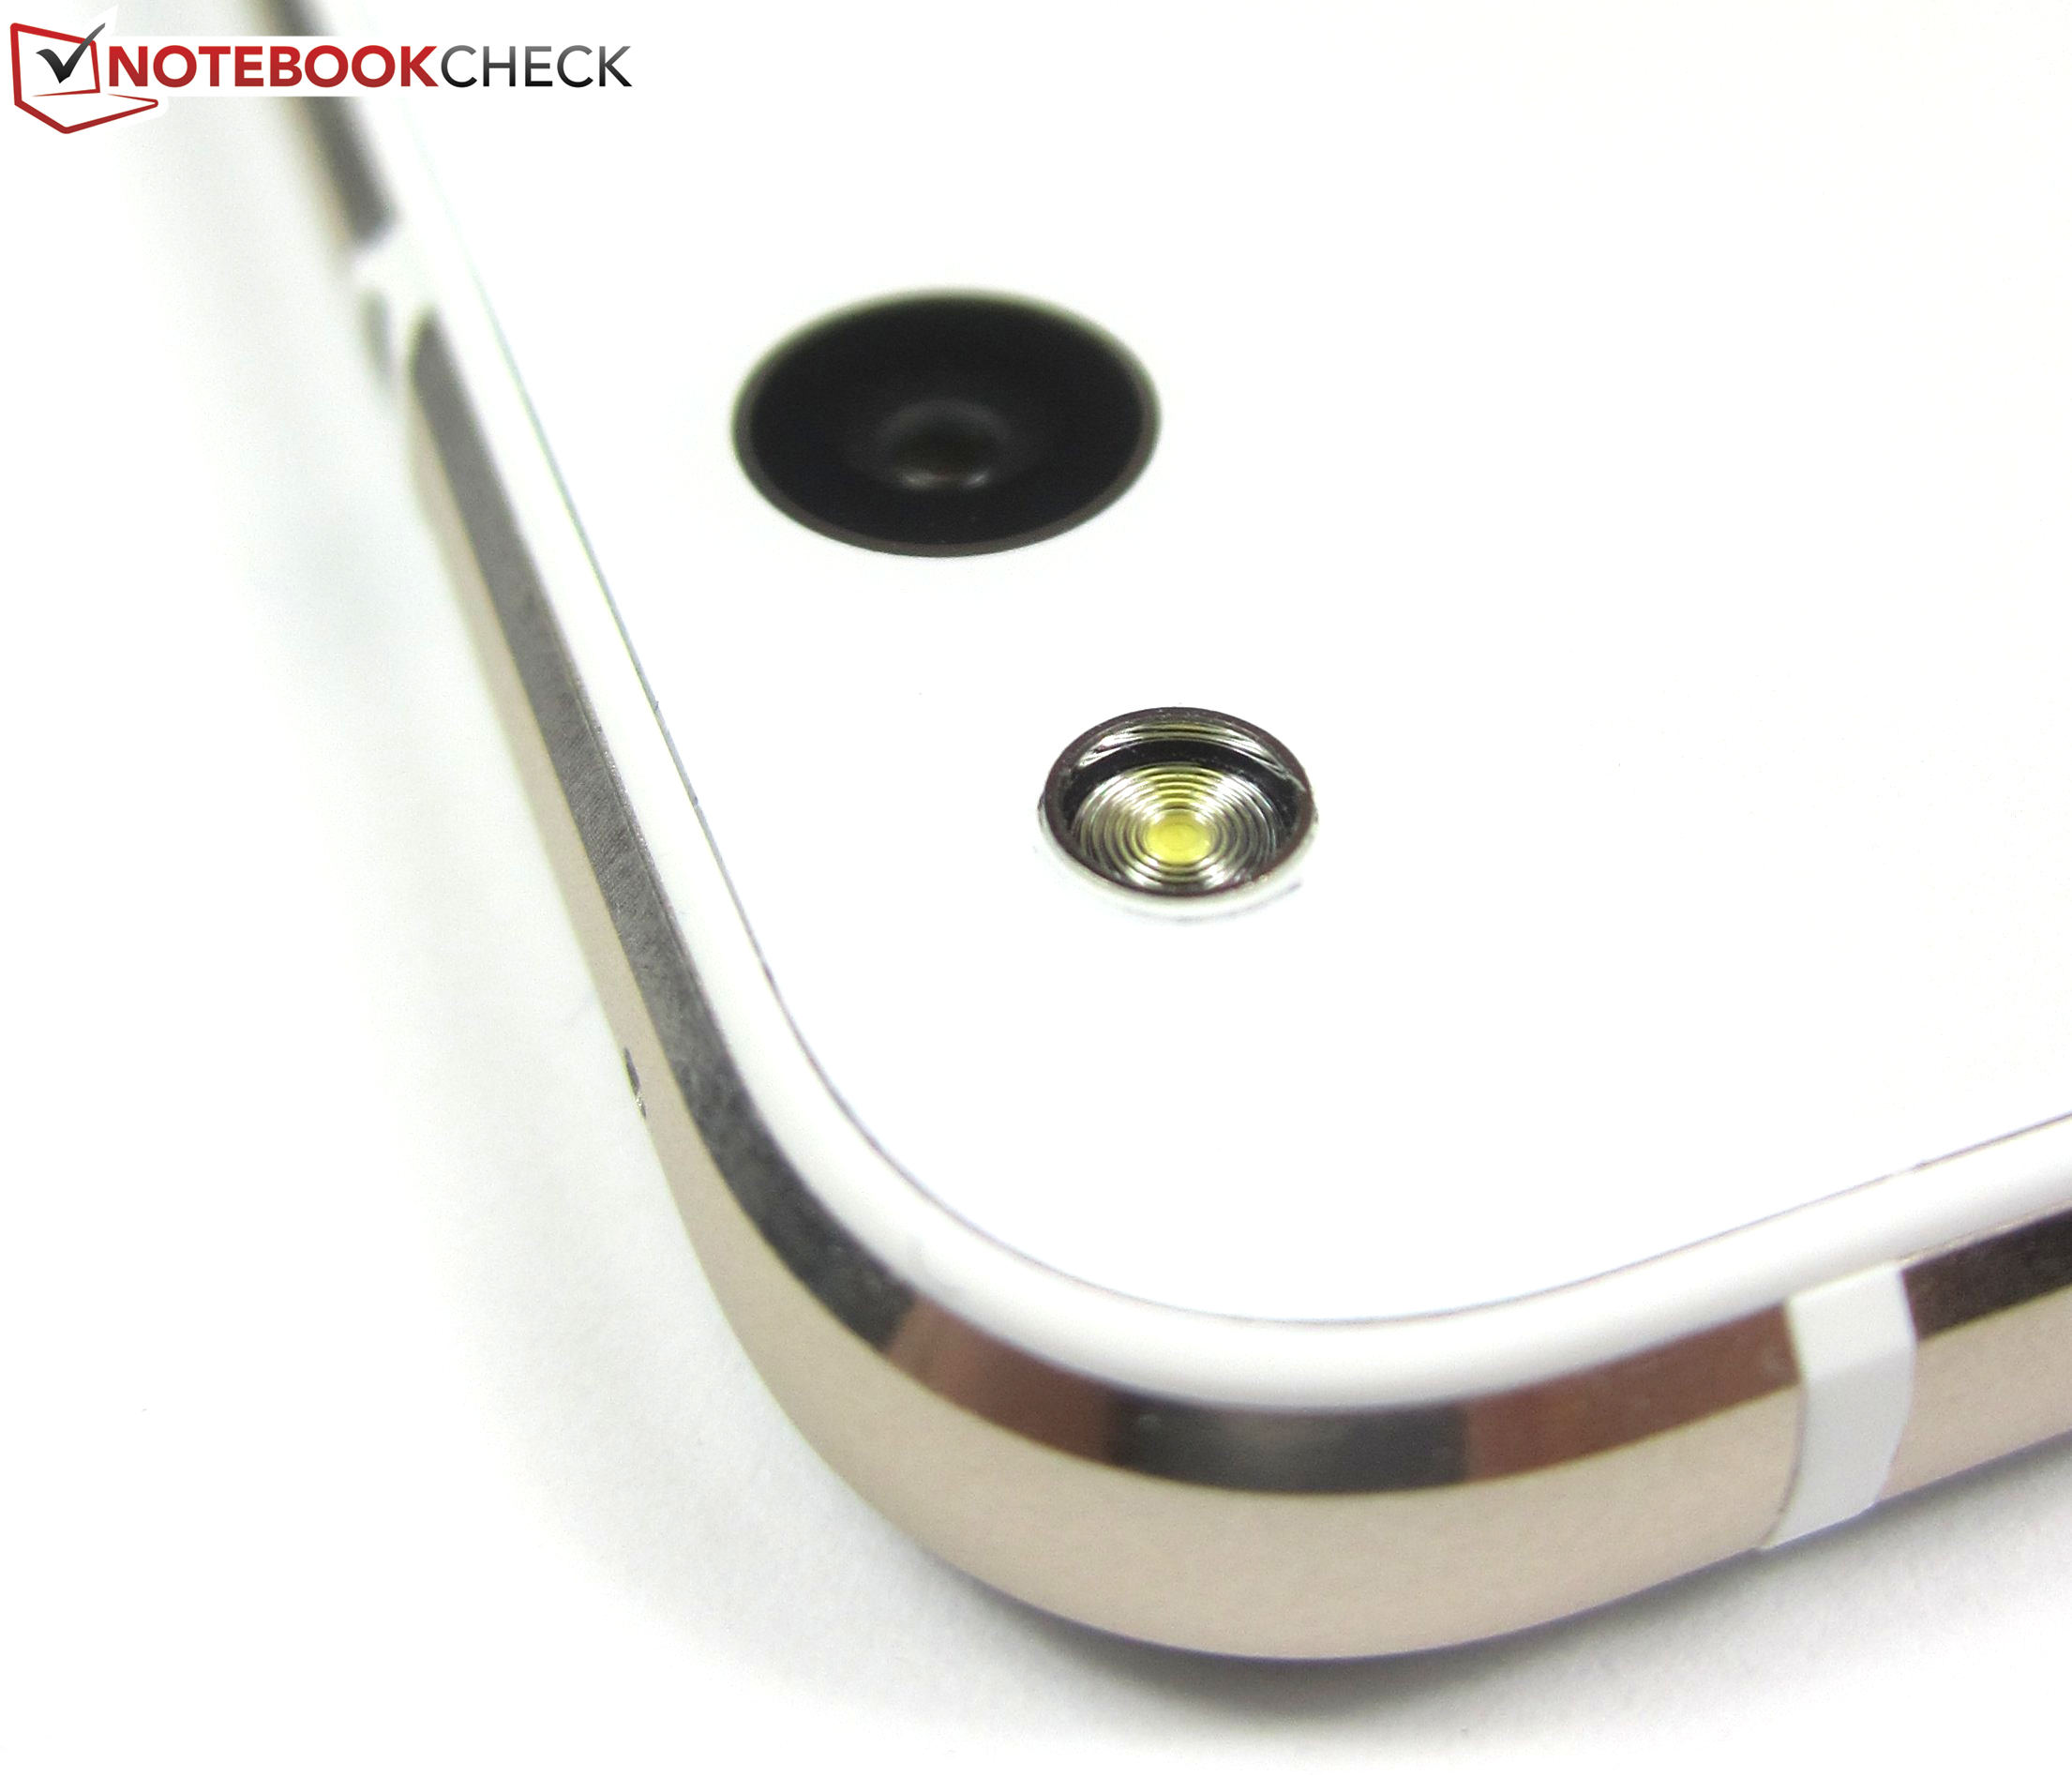
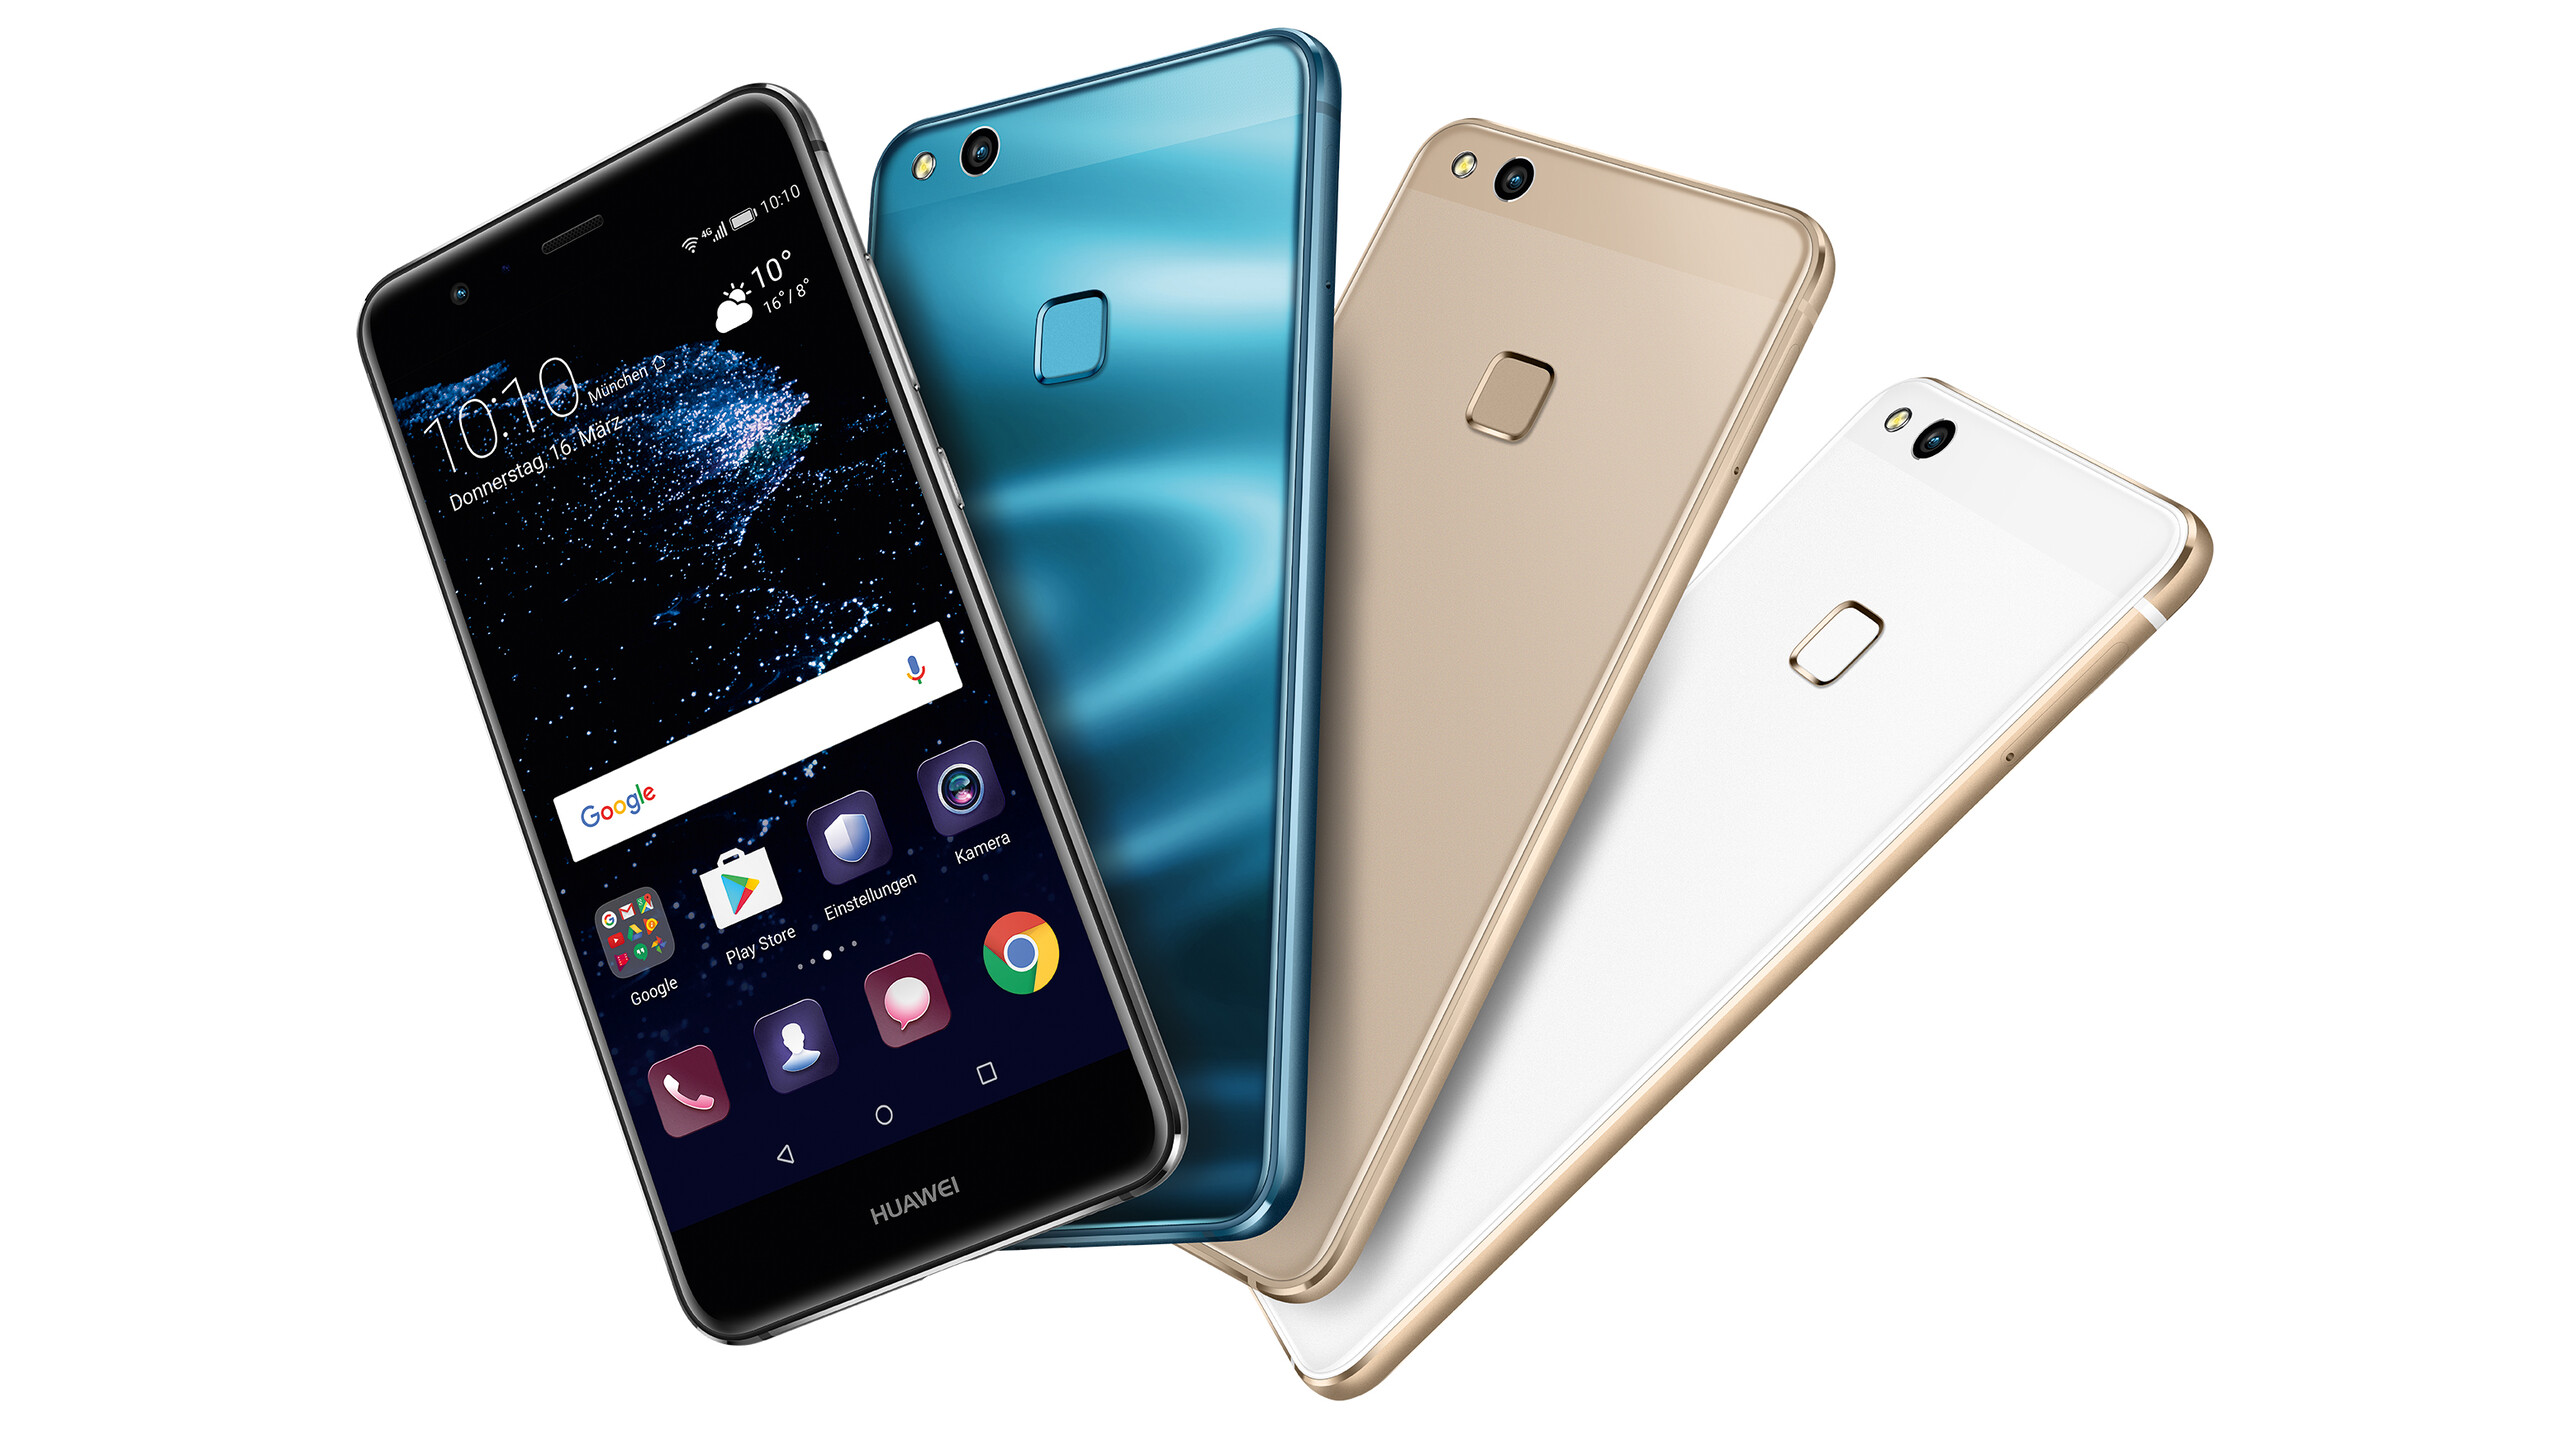
华为没有作出太多让步:P10 Lite是更昂贵的P10(近600欧元,约4431人民币)的不错备选方案。相比它的高端师兄,这台中端设备采用了品质出色的机身,给人以远高于它350欧元(约2585人民币)价位的质感。尽管P10 Lite没有搭配华为P10的徕卡镜头,但1200万像素的主相机也提供了十分优秀的拍摄质量。
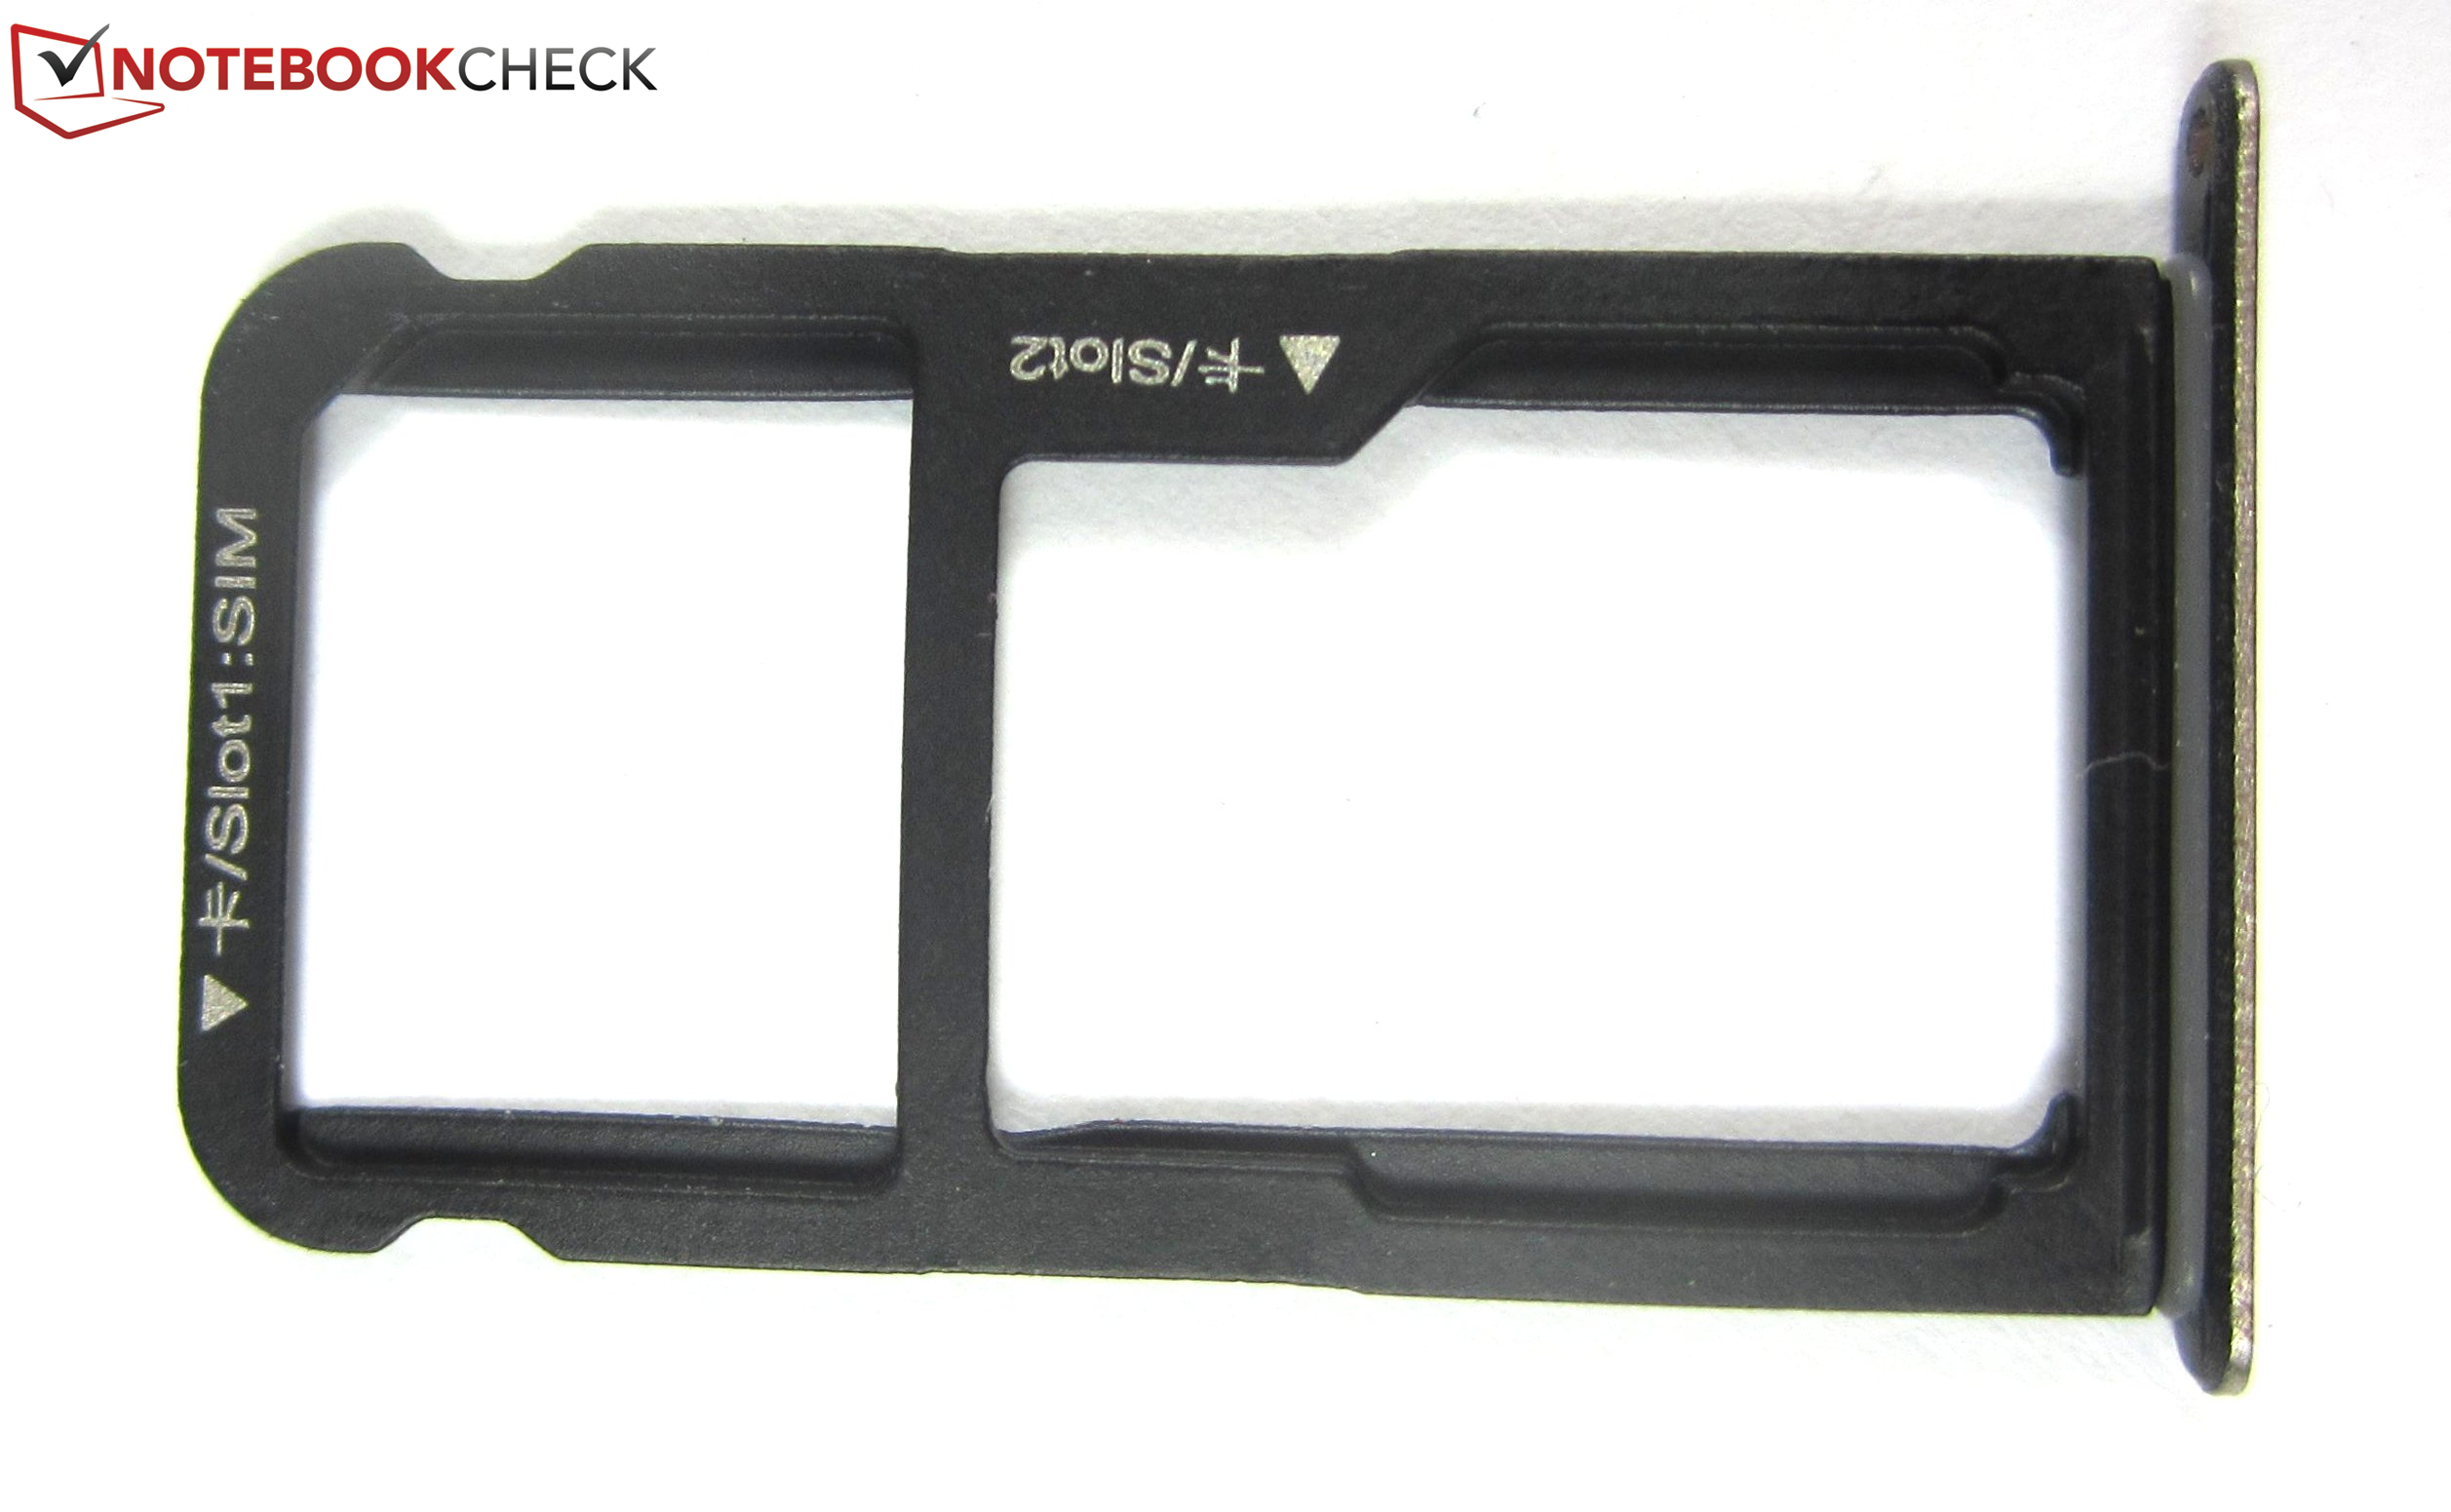
我们也十分喜欢它的明亮屏幕和其他功能如高速无线模组,LTE Cat.6支持,和双SIM功能,可惜其中一个SIM和microSD共用卡槽。它的电池续航时间中规中矩,应该可以满足一整天的使用。
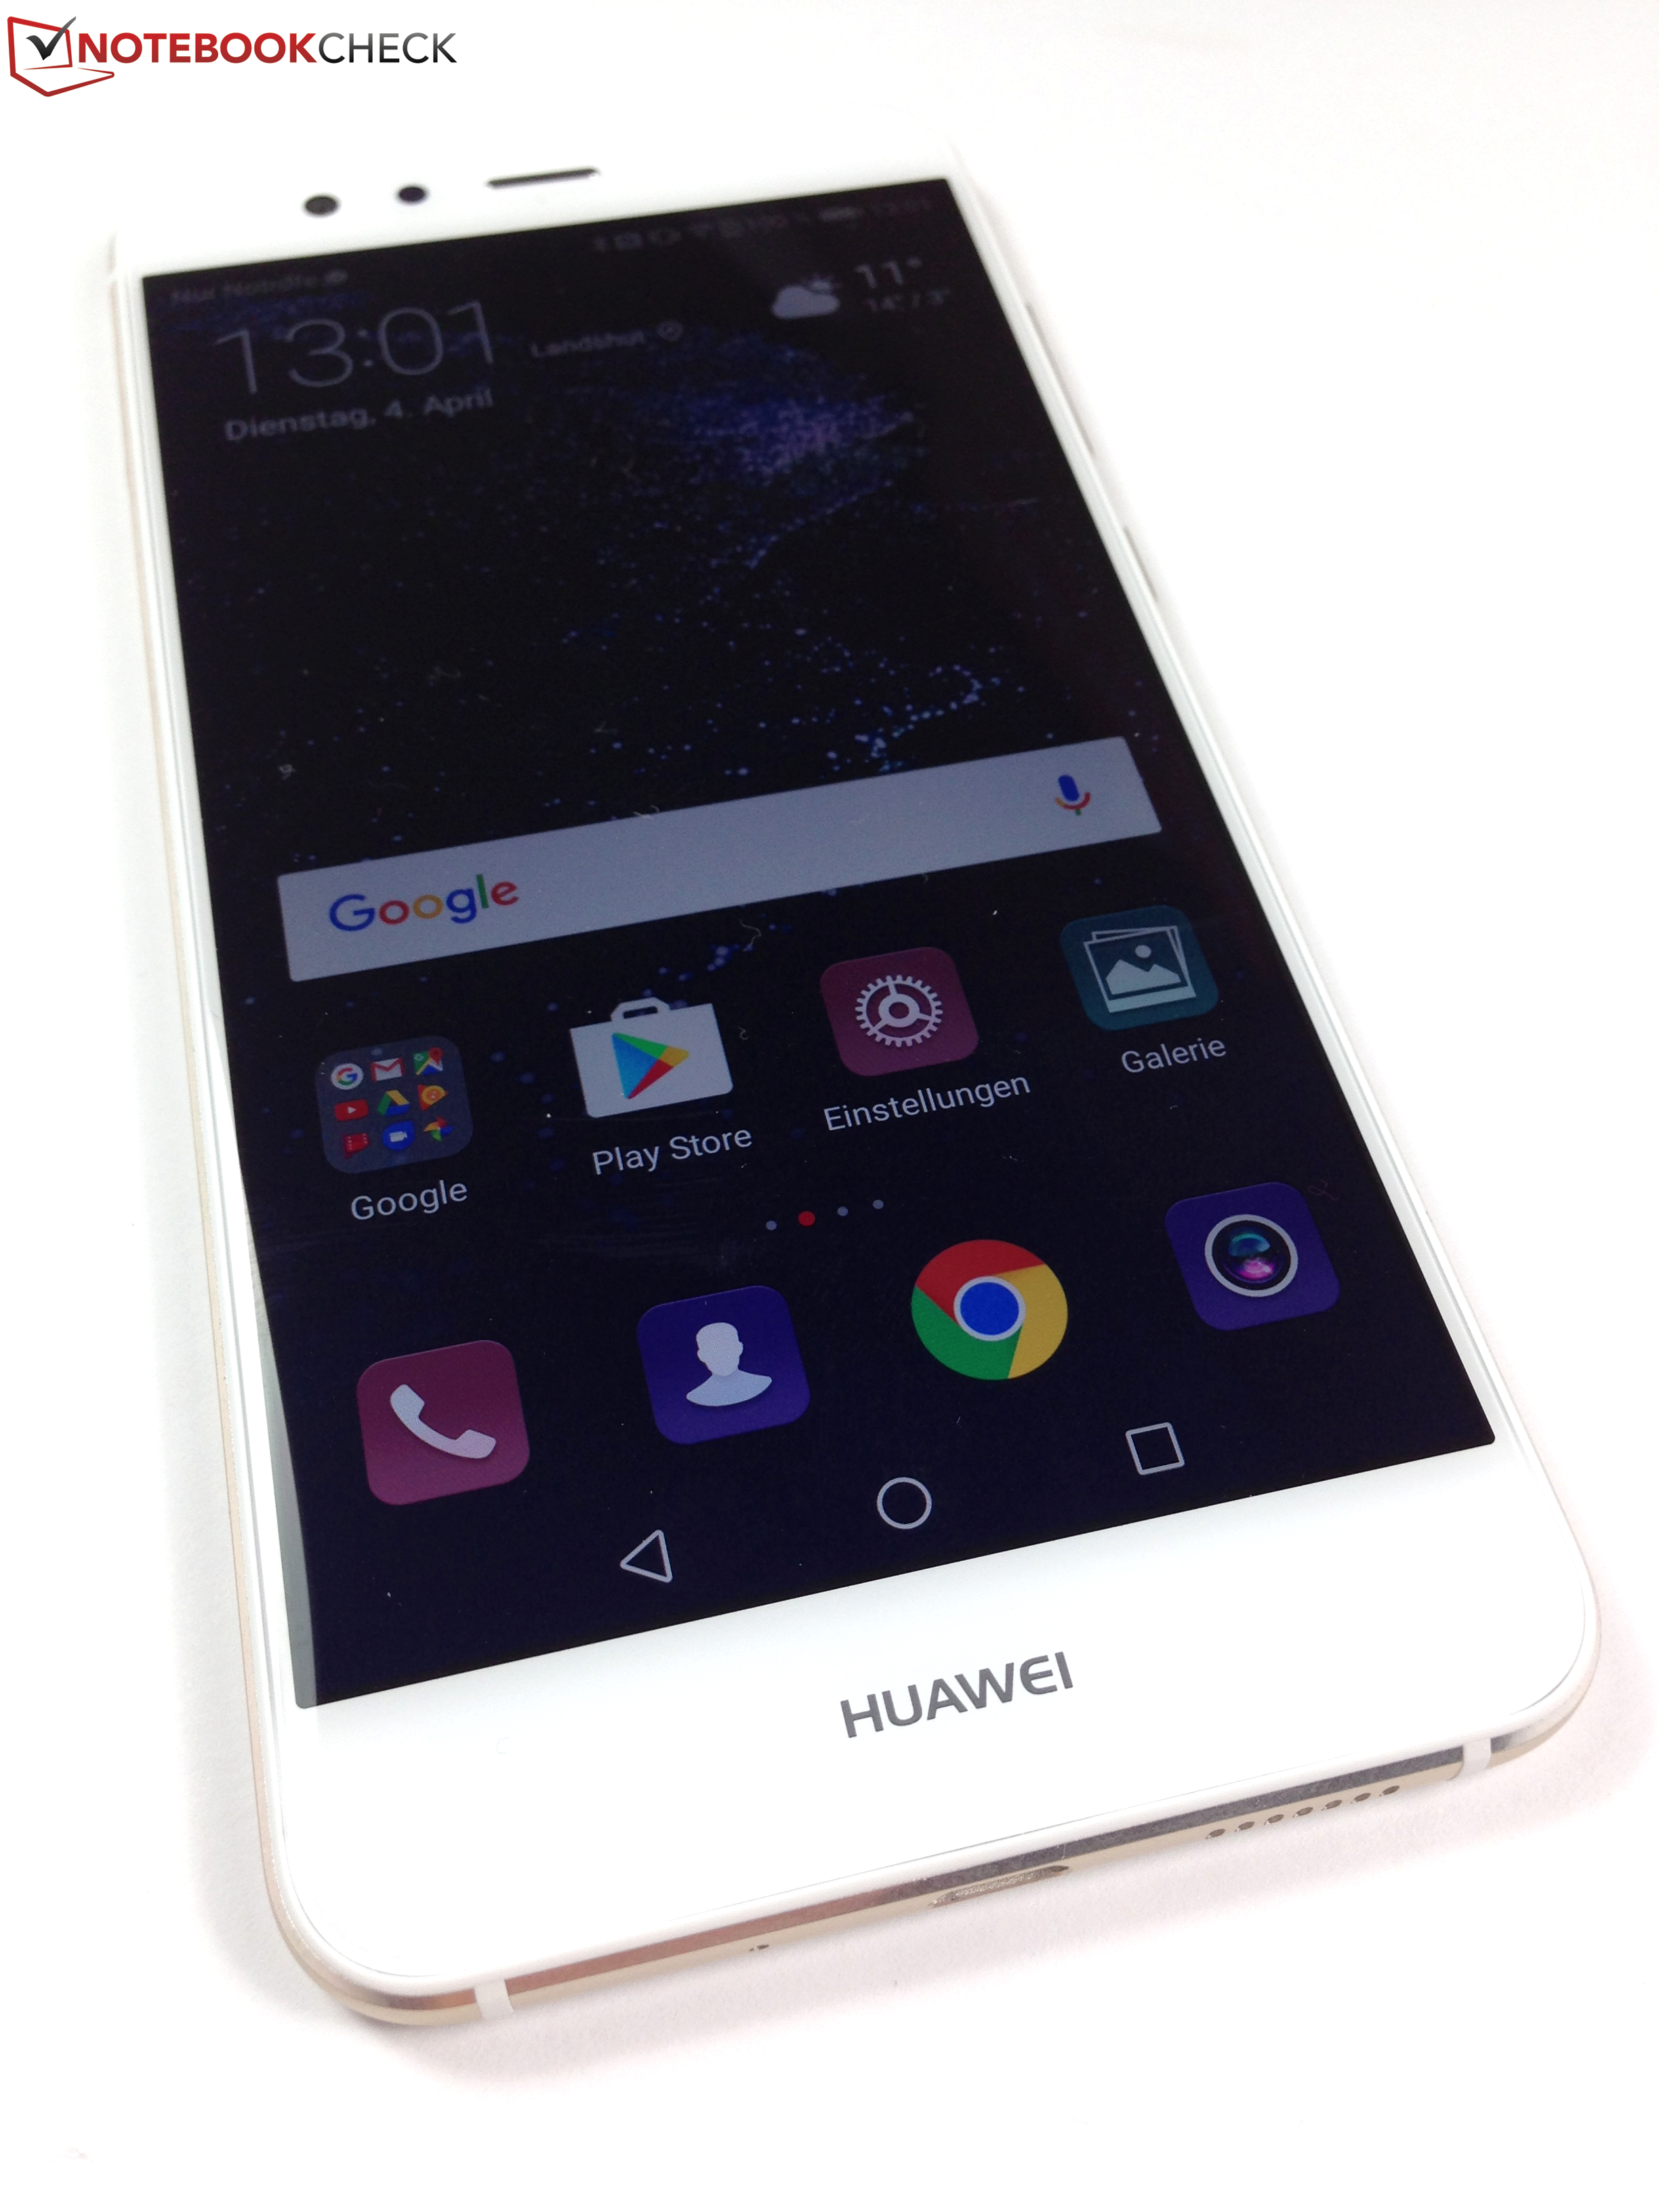
如果你不需要华为P10的更快处理器和徕卡镜头,那么华为P10 Lite是个不错的选择。售价仅350欧元(约2585人民币)的这台5.2寸中端设备是P10系列机型中价位最低的一款。
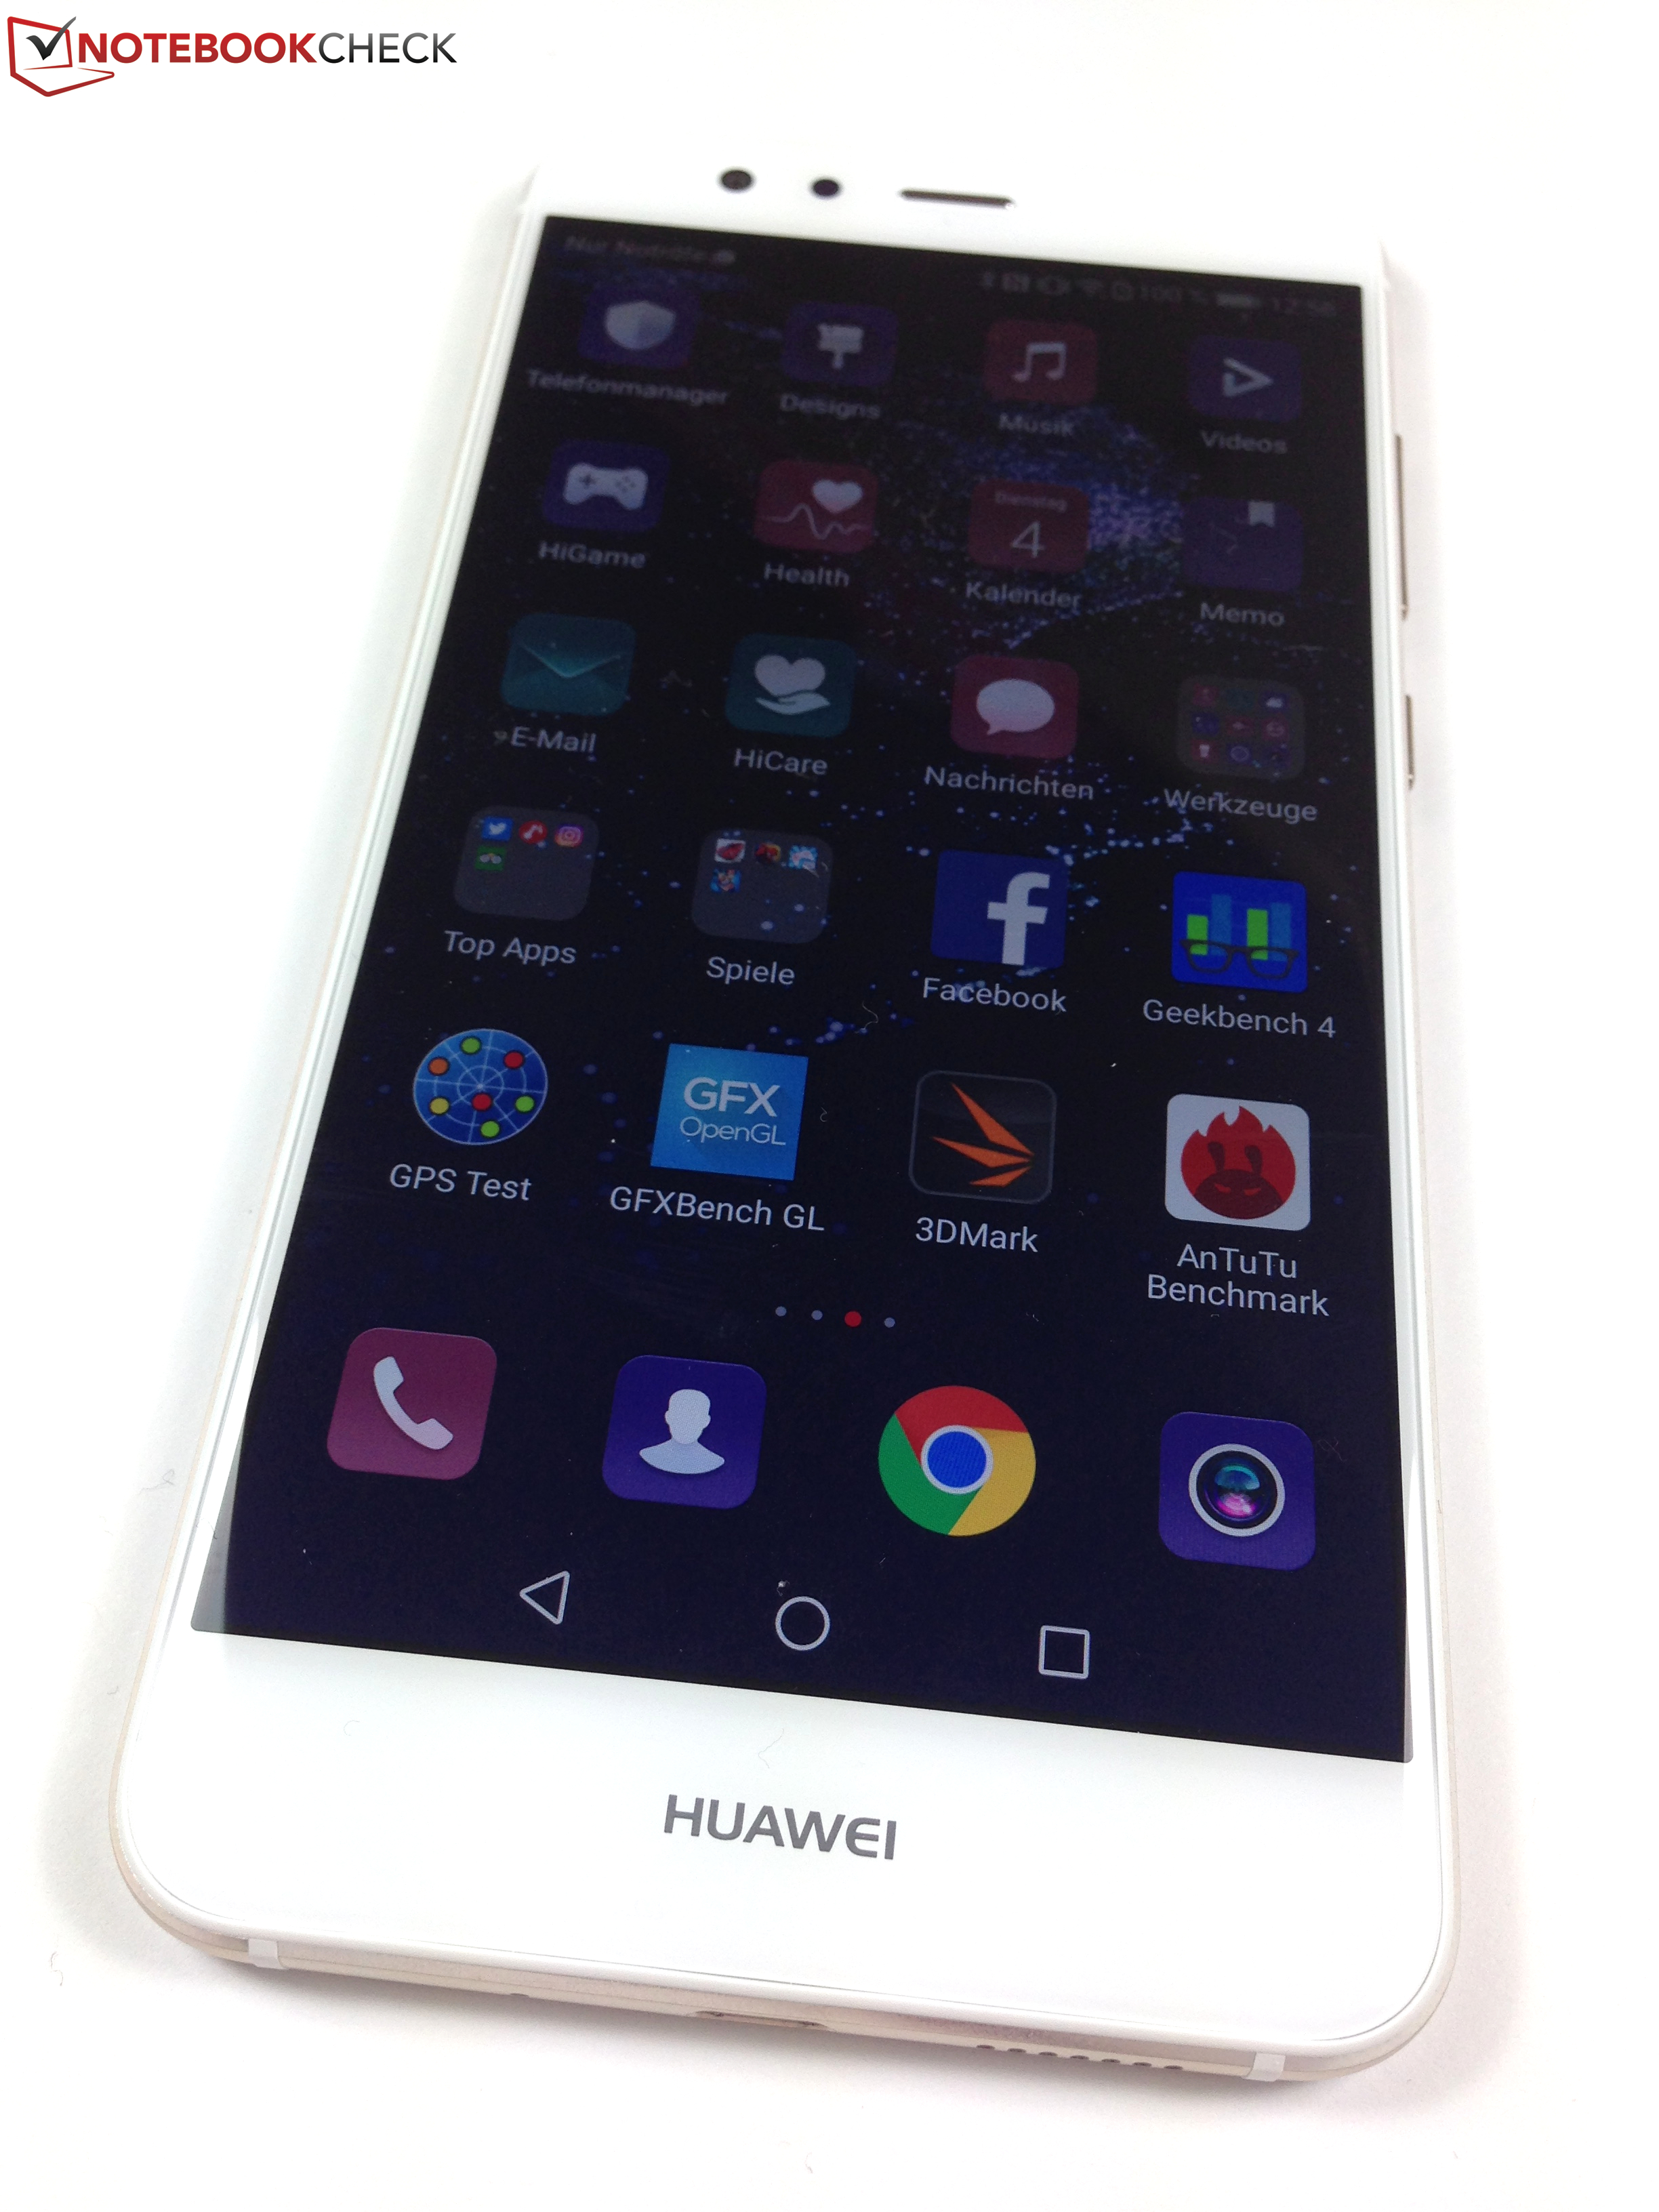
华为节省成本的方面包括USB 2.0,它采用了较老的Micro-USB接口而非C型接口,让用户在连接充电器时仍然会遇到”啊,方向反了“的问题。遗憾的是,它不支持将应用安装在microSD卡上,特别是考虑到它臃肿的预装系统让32GB闪存仅剩20GB给用户支配。不过幸好用户可以自行删除不需要的软件来腾出一些空间。它的处理器表现平平。华为P10 Lite“几乎”可以运行所有游戏,不过显示效果设定可能需要有所降低来满足流畅的帧率。
注:本文是基于完整评测的缩减版本,阅读完整的英文评测,请点击这里。
Huawei P10 Lite
- 04/12/2017 v6 (old)
Manuel Masiero