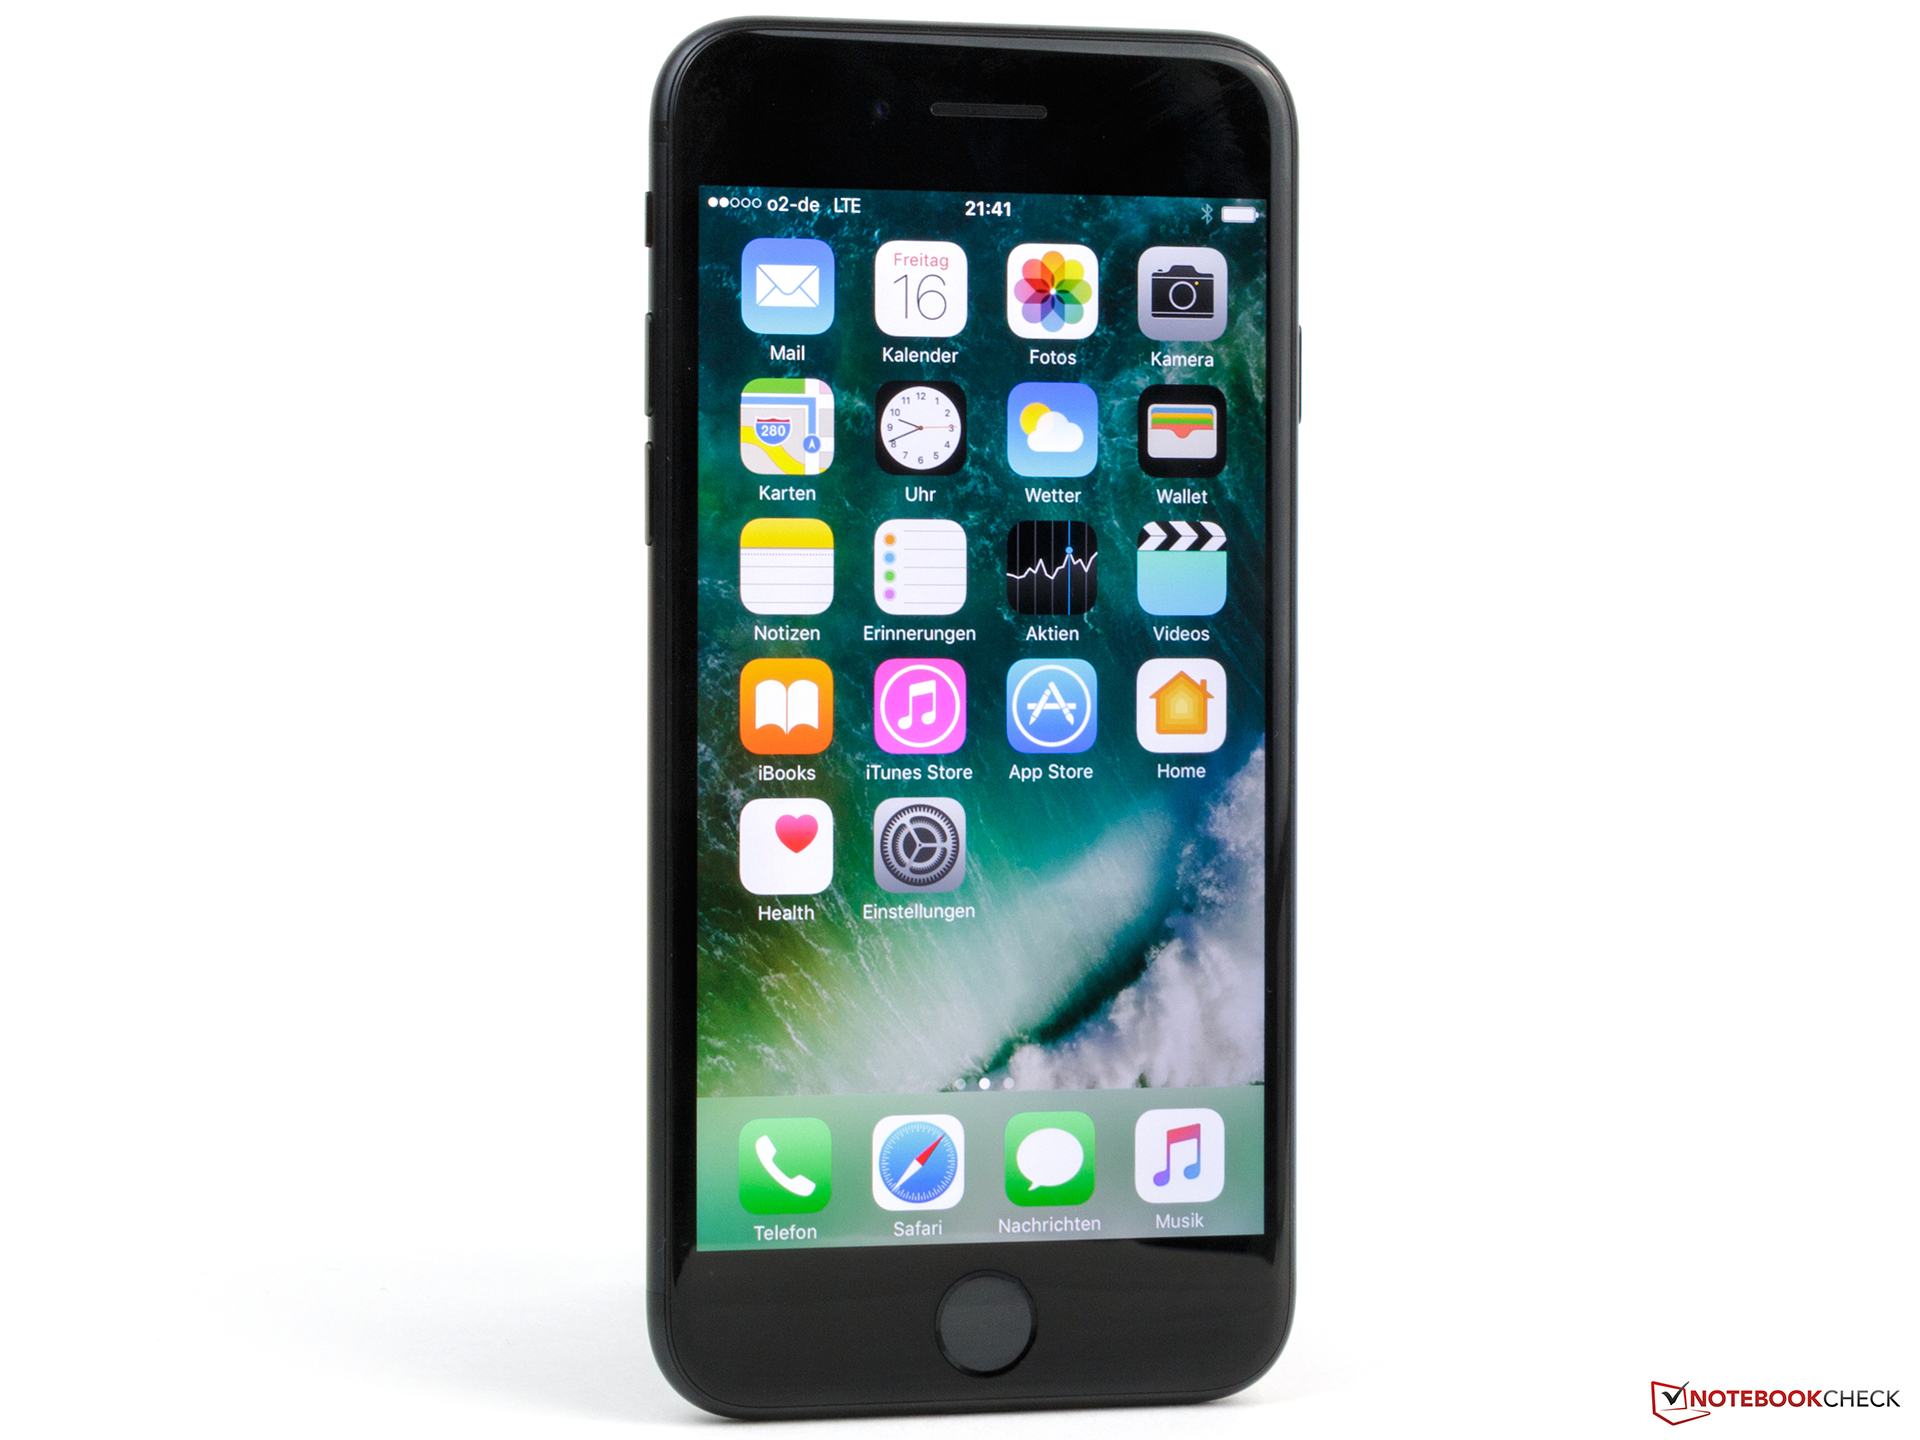
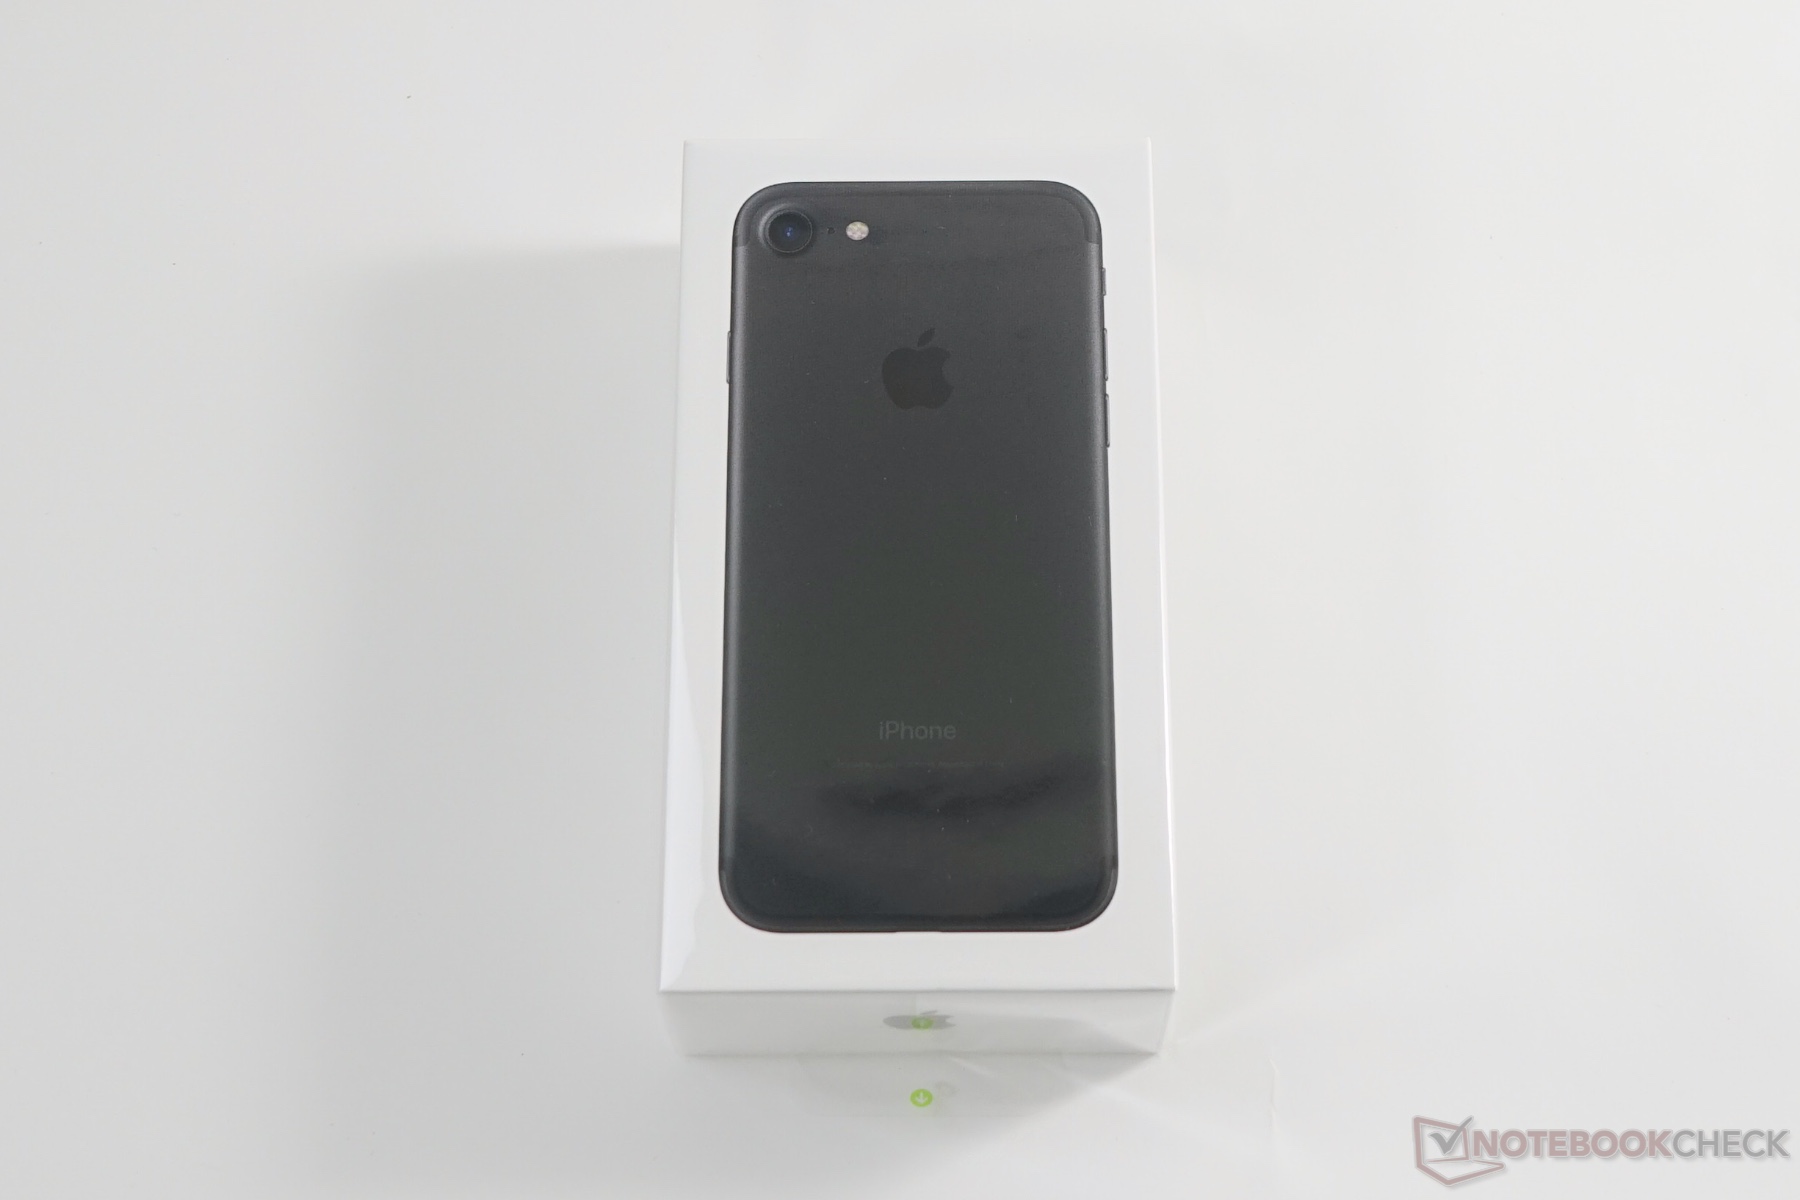
Apple iPhone 7 智能手机简短评测
| Networking | |
| iperf Server (receive) TCP 1 m | |
| Lenovo Moto Z | |
| Apple iPhone 7 | |
| Samsung Galaxy S7 Edge | |
| OnePlus 3 | |
| Huawei P9 | |
| iperf Client (transmit) TCP 1 m | |
| Lenovo Moto Z | |
| Apple iPhone 7 | |
| Samsung Galaxy S7 Edge | |
| OnePlus 3 | |
| Huawei P9 | |


| |||||||||||||||||||||||||
Brightness Distribution: 90 %
Center on Battery: 556 cd/m²
Contrast: 1635:1 (Black: 0.34 cd/m²)
ΔE ColorChecker Calman: 1.3 | ∀{0.5-29.43 Ø4.71}
ΔE Greyscale Calman: 1.9 | ∀{0.09-98 Ø4.96}
100% sRGB (Calman 2D)
99.71% sRGB (Argyll 1.6.3 3D)
63.15% AdobeRGB 1998 (Argyll 1.6.3 3D)
69.1% AdobeRGB 1998 (Argyll 3D)
99.7% sRGB (Argyll 3D)
67.2% Display P3 (Argyll 3D)
Gamma: 2.26
CCT: 6818 K
| Apple iPhone 7 IPS, 1334x750, 4.7" | Apple iPhone 6S IPS, 1334x750, 4.7" | Samsung Galaxy S7 SAMOLED, 2560x1440, 5.1" | HTC 10 Super LCD 5, 2560x1440, 5.2" | Huawei P9 IPS-NEO, JDI, 1920x1080, 5.2" | LG G5 IPS Quantum, 2560x1440, 5.3" | |
|---|---|---|---|---|---|---|
| Screen | -35% | -11% | -50% | -56% | -99% | |
| Brightness middle (cd/m²) | 556 | 552 -1% | 350 -37% | 445 -20% | 582 5% | 784 41% |
| Brightness (cd/m²) | 519 | 549 6% | 351 -32% | 434 -16% | 563 8% | 774 49% |
| Brightness Distribution (%) | 90 | 87 -3% | 98 9% | 93 3% | 91 1% | 91 1% |
| Black Level * (cd/m²) | 0.34 | 0.39 -15% | 0.36 -6% | 0.38 -12% | 0.43 -26% | |
| Contrast (:1) | 1635 | 1415 -13% | 1236 -24% | 1532 -6% | 1823 11% | |
| Colorchecker dE 2000 * | 1.3 | 3.4 -162% | 2.04 -57% | 2.8 -115% | 4.4 -238% | 6.5 -400% |
| Colorchecker dE 2000 max. * | 2.6 | 3.25 -25% | 5.8 -123% | 7.4 -185% | 11.7 -350% | |
| Greyscale dE 2000 * | 1.9 | 4.16 -119% | 1.63 14% | 3.7 -95% | 4.8 -153% | 8 -321% |
| Gamma | 2.26 97% | 2.21 100% | 2.07 106% | 2.31 95% | 2.2 100% | 2.22 99% |
| CCT | 6818 95% | 7288 89% | 6391 102% | 7164 91% | 6175 105% | 8699 75% |
| Color Space (Percent of AdobeRGB 1998) (%) | 63.15 | 62.18 -2% | 86.86 38% | 77.78 23% | 68.08 8% | |
| Color Space (Percent of sRGB) (%) | 99.71 | 95.93 -4% | 99.35 0% | 99.44 0% | 97.46 -2% |
* ... smaller is better
Display Response Times
| ↔ Response Time Black to White | ||
|---|---|---|
| 32 ms ... rise ↗ and fall ↘ combined | ↗ 7.8 ms rise | 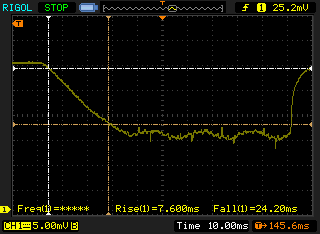 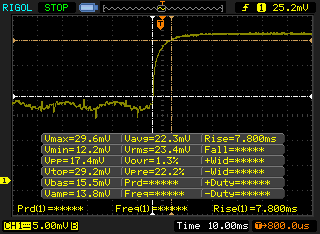 |
| ↘ 25.2 ms fall | ||
| The screen shows slow response rates in our tests and will be unsatisfactory for gamers. In comparison, all tested devices range from 0.1 (minimum) to 240 (maximum) ms. » 86 % of all devices are better. This means that the measured response time is worse than the average of all tested devices (19.8 ms). | ||
| ↔ Response Time 50% Grey to 80% Grey | ||
| 39 ms ... rise ↗ and fall ↘ combined | ↗ 14 ms rise | 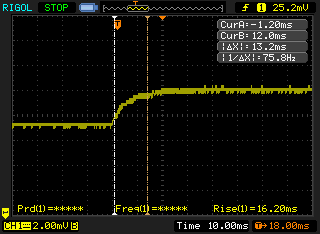 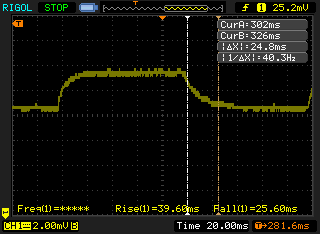 |
| ↘ 25 ms fall | ||
| The screen shows slow response rates in our tests and will be unsatisfactory for gamers. In comparison, all tested devices range from 0.165 (minimum) to 636 (maximum) ms. » 59 % of all devices are better. This means that the measured response time is worse than the average of all tested devices (31 ms). | ||
Screen Flickering / PWM (Pulse-Width Modulation)
| Screen flickering / PWM not detected | 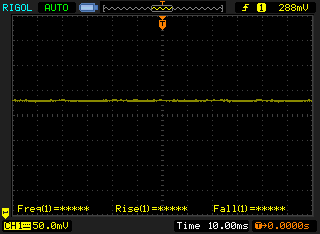 | ||
In comparison: 52 % of all tested devices do not use PWM to dim the display. If PWM was detected, an average of 7757 (minimum: 5 - maximum: 343500) Hz was measured. | |||
| AnTuTu v6 - Total Score (sort by value) | |
| Apple iPhone 7 | |
| Apple iPhone 7 Plus | |
| Samsung Galaxy S7 | |
| HTC 10 | |
| Huawei P9 | |
| LG G5 | |
| 3DMark | |
| 1280x720 offscreen Ice Storm Unlimited Score (sort by value) | |
| Apple iPhone 7 | |
| Apple iPhone 6S | |
| Apple iPhone 7 Plus | |
| Samsung Galaxy S7 | |
| HTC 10 | |
| Huawei P9 | |
| LG G5 | |
| 1280x720 offscreen Ice Storm Unlimited Graphics Score (sort by value) | |
| Apple iPhone 7 | |
| Apple iPhone 6S | |
| Apple iPhone 7 Plus | |
| Samsung Galaxy S7 | |
| HTC 10 | |
| Huawei P9 | |
| LG G5 | |
| 1280x720 offscreen Ice Storm Unlimited Physics (sort by value) | |
| Apple iPhone 7 | |
| Apple iPhone 6S | |
| Apple iPhone 7 Plus | |
| Samsung Galaxy S7 | |
| HTC 10 | |
| Huawei P9 | |
| LG G5 | |
| 2560x1440 Sling Shot OpenGL ES 3.0 (sort by value) | |
| Apple iPhone 7 | |
| Apple iPhone 7 Plus | |
| Samsung Galaxy S7 | |
| HTC 10 | |
| Huawei P9 | |
| LG G5 | |
| 2560x1440 Sling Shot OpenGL ES 3.0 Graphics (sort by value) | |
| Apple iPhone 7 | |
| Apple iPhone 7 Plus | |
| Samsung Galaxy S7 | |
| HTC 10 | |
| Huawei P9 | |
| LG G5 | |
| 2560x1440 Sling Shot OpenGL ES 3.0 Physics (sort by value) | |
| Apple iPhone 7 | |
| Apple iPhone 7 Plus | |
| Samsung Galaxy S7 | |
| HTC 10 | |
| Huawei P9 | |
| LG G5 | |
| GFXBench (DX / GLBenchmark) 2.7 | |
| T-Rex Onscreen (sort by value) | |
| Apple iPhone 7 | |
| Apple iPhone 6S | |
| Apple iPhone 7 Plus | |
| Samsung Galaxy S7 | |
| HTC 10 | |
| Huawei P9 | |
| LG G5 | |
| 1920x1080 T-Rex Offscreen (sort by value) | |
| Apple iPhone 7 | |
| Apple iPhone 6S | |
| Apple iPhone 7 Plus | |
| Samsung Galaxy S7 | |
| HTC 10 | |
| Huawei P9 | |
| LG G5 | |
| GFXBench 3.0 | |
| on screen Manhattan Onscreen OGL (sort by value) | |
| Apple iPhone 7 | |
| Apple iPhone 6S | |
| Apple iPhone 7 Plus | |
| Samsung Galaxy S7 | |
| HTC 10 | |
| Huawei P9 | |
| LG G5 | |
| 1920x1080 1080p Manhattan Offscreen (sort by value) | |
| Apple iPhone 7 | |
| Apple iPhone 6S | |
| Apple iPhone 7 Plus | |
| Samsung Galaxy S7 | |
| HTC 10 | |
| Huawei P9 | |
| LG G5 | |
| Geekbench 4.0 | |
| 64 Bit Single-Core Score (sort by value) | |
| Apple iPhone 7 | |
| Apple iPhone 7 Plus | |
| Huawei P9 | |
| LG G5 | |
| 64 Bit Multi-Core Score (sort by value) | |
| Apple iPhone 7 | |
| Apple iPhone 7 Plus | |
| Huawei P9 | |
| LG G5 | |
| Octane V2 - Total Score (sort by value) | |
| Apple iPhone 7 | |
| Apple iPhone 7 Plus | |
| Apple iPhone 6S | |
| Samsung Galaxy S7 | |
| HTC 10 | |
| Huawei P9 | |
| LG G5 | |
| Mozilla Kraken 1.1 - Total (sort by value) | |
| Apple iPhone 7 | |
| Apple iPhone 7 Plus | |
| Apple iPhone 6S | |
| Samsung Galaxy S7 | |
| HTC 10 | |
| Huawei P9 | |
| LG G5 | |
| WebXPRT 2015 - Overall (sort by value) | |
| Apple iPhone 7 | |
| Apple iPhone 7 Plus | |
| Apple iPhone 6S | |
| Samsung Galaxy S7 | |
| HTC 10 | |
| Huawei P9 | |
| LG G5 | |
| JetStream 1.1 - 1.1 Total (sort by value) | |
| Apple iPhone 7 | |
| Apple iPhone 7 Plus | |
| Apple iPhone 6S | |
| Samsung Galaxy S7 | |
| HTC 10 | |
| Huawei P9 | |
| LG G5 | |
* ... smaller is better
| PassMark PerformanceTest Mobile V1 - Disk Tests (sort by value) | |
| Apple iPhone 7 | |
| Apple iPhone 7 Plus | |
| Apple iPhone 6S | |
| Samsung Galaxy S7 | |
| Huawei P9 | |
| LG G5 | |
| BaseMark OS II - Memory (sort by value) | |
| Apple iPhone 7 | |
| Apple iPhone 7 Plus | |
| Apple iPhone 6S | |
| Samsung Galaxy S7 | |
| HTC 10 | |
| Huawei P9 | |
| LG G5 | |
(+) The maximum temperature on the upper side is 38 °C / 100 F, compared to the average of 35.3 °C / 96 F, ranging from 21.9 to 247 °C for the class Smartphone.
(±) The bottom heats up to a maximum of 40 °C / 104 F, compared to the average of 34 °C / 93 F
(+) In idle usage, the average temperature for the upper side is 31.5 °C / 89 F, compared to the device average of 33 °C / 91 F.
Apple iPhone 7 audio analysis
(+) | speakers can play relatively loud (83.1 dB)
Bass 100 - 315 Hz
(-) | nearly no bass - on average 21.8% lower than median
(±) | linearity of bass is average (9.5% delta to prev. frequency)
Mids 400 - 2000 Hz
(+) | balanced mids - only 4.3% away from median
(+) | mids are linear (6% delta to prev. frequency)
Highs 2 - 16 kHz
(±) | higher highs - on average 5.9% higher than median
(±) | linearity of highs is average (8.2% delta to prev. frequency)
Overall 100 - 16.000 Hz
(±) | linearity of overall sound is average (20.9% difference to median)
Compared to same class
» 39% of all tested devices in this class were better, 8% similar, 53% worse
» The best had a delta of 11%, average was 34%, worst was 134%
Compared to all devices tested
» 57% of all tested devices were better, 8% similar, 35% worse
» The best had a delta of 4%, average was 23%, worst was 134%
Samsung Galaxy Note 7 audio analysis
(+) | speakers can play relatively loud (85.7 dB)
Bass 100 - 315 Hz
(-) | nearly no bass - on average 28.6% lower than median
(±) | linearity of bass is average (8.5% delta to prev. frequency)
Mids 400 - 2000 Hz
(+) | balanced mids - only 3.5% away from median
(+) | mids are linear (5.2% delta to prev. frequency)
Highs 2 - 16 kHz
(+) | balanced highs - only 4.9% away from median
(+) | highs are linear (6.1% delta to prev. frequency)
Overall 100 - 16.000 Hz
(±) | linearity of overall sound is average (20.8% difference to median)
Compared to same class
» 38% of all tested devices in this class were better, 9% similar, 53% worse
» The best had a delta of 11%, average was 34%, worst was 134%
Compared to all devices tested
» 56% of all tested devices were better, 8% similar, 36% worse
» The best had a delta of 4%, average was 23%, worst was 134%
Apple iPhone 6S audio analysis
(±) | speaker loudness is average but good (75.5 dB)
Bass 100 - 315 Hz
(±) | reduced bass - on average 12.1% lower than median
(±) | linearity of bass is average (10.9% delta to prev. frequency)
Mids 400 - 2000 Hz
(+) | balanced mids - only 3.2% away from median
(+) | mids are linear (4.8% delta to prev. frequency)
Highs 2 - 16 kHz
(±) | higher highs - on average 7% higher than median
(±) | linearity of highs is average (7.2% delta to prev. frequency)
Overall 100 - 16.000 Hz
(±) | linearity of overall sound is average (19.4% difference to median)
Compared to same class
» 28% of all tested devices in this class were better, 9% similar, 64% worse
» The best had a delta of 11%, average was 34%, worst was 134%
Compared to all devices tested
» 48% of all tested devices were better, 7% similar, 45% worse
» The best had a delta of 4%, average was 23%, worst was 134%
| Off / Standby | |
| Idle | |
| Load |
|
Key:
min: | |
| Apple iPhone 7 1960 mAh | Apple iPhone 6S mAh | Apple iPhone 7 Plus 2915 mAh | Samsung Galaxy S7 3000 mAh | HTC 10 3000 mAh | Huawei P9 3000 mAh | LG G5 2800 mAh | |
|---|---|---|---|---|---|---|---|
| Power Consumption | 3% | -44% | -7% | -48% | -28% | -37% | |
| Idle Minimum * (Watt) | 0.54 | 0.5 7% | 0.77 -43% | 0.68 -26% | 0.68 -26% | 0.77 -43% | 0.55 -2% |
| Idle Average * (Watt) | 1.51 | 1.6 -6% | 2.04 -35% | 1.02 32% | 1.49 1% | 2.36 -56% | 1.37 9% |
| Idle Maximum * (Watt) | 1.54 | 1.9 -23% | 2.24 -45% | 1.14 26% | 1.91 -24% | 2.37 -54% | 2.25 -46% |
| Load Average * (Watt) | 3.75 | 2.5 33% | 4.69 -25% | 4.73 -26% | 7.4 -97% | 3.09 18% | 6.24 -66% |
| Load Maximum * (Watt) | 5.01 | 4.8 4% | 8.66 -73% | 7.16 -43% | 9.71 -94% | 5.35 -7% | 9.12 -82% |
* ... smaller is better
| Apple iPhone 7 1960 mAh | Apple iPhone 6S mAh | Apple iPhone 7 Plus 2915 mAh | Samsung Galaxy S7 3000 mAh | HTC 10 3000 mAh | Huawei P9 3000 mAh | LG G5 2800 mAh | |
|---|---|---|---|---|---|---|---|
| Battery runtime | -3% | 28% | 26% | 1% | 9% | 19% | |
| Reader / Idle (h) | 29.5 | 25.2 -15% | 30.6 4% | 30.2 2% | 21.2 -28% | 25.2 -15% | 30.6 4% |
| H.264 (h) | 12 | 11.7 -2% | 13.6 13% | 14.9 24% | 10.8 -10% | 9.5 -21% | 10 -17% |
| WiFi v1.3 (h) | 8.6 | 8.2 -5% | 9.8 14% | 7.6 -12% | 6.9 -20% | 9.5 10% | 6.5 -24% |
| Load (h) | 2.1 | 2.3 10% | 3.8 81% | 4 90% | 3.4 62% | 3.4 62% | 4.5 114% |
Pros
Cons
Apple iPhone 7当然不会做为智能手机市场的革新被记入史册。如果传说无误的话,Apple将会在iPhone10周年时候推出革命性的产品。不过生产商依然带来了一台非常优秀的高端智能手机,在所有方面的表现都不俗。
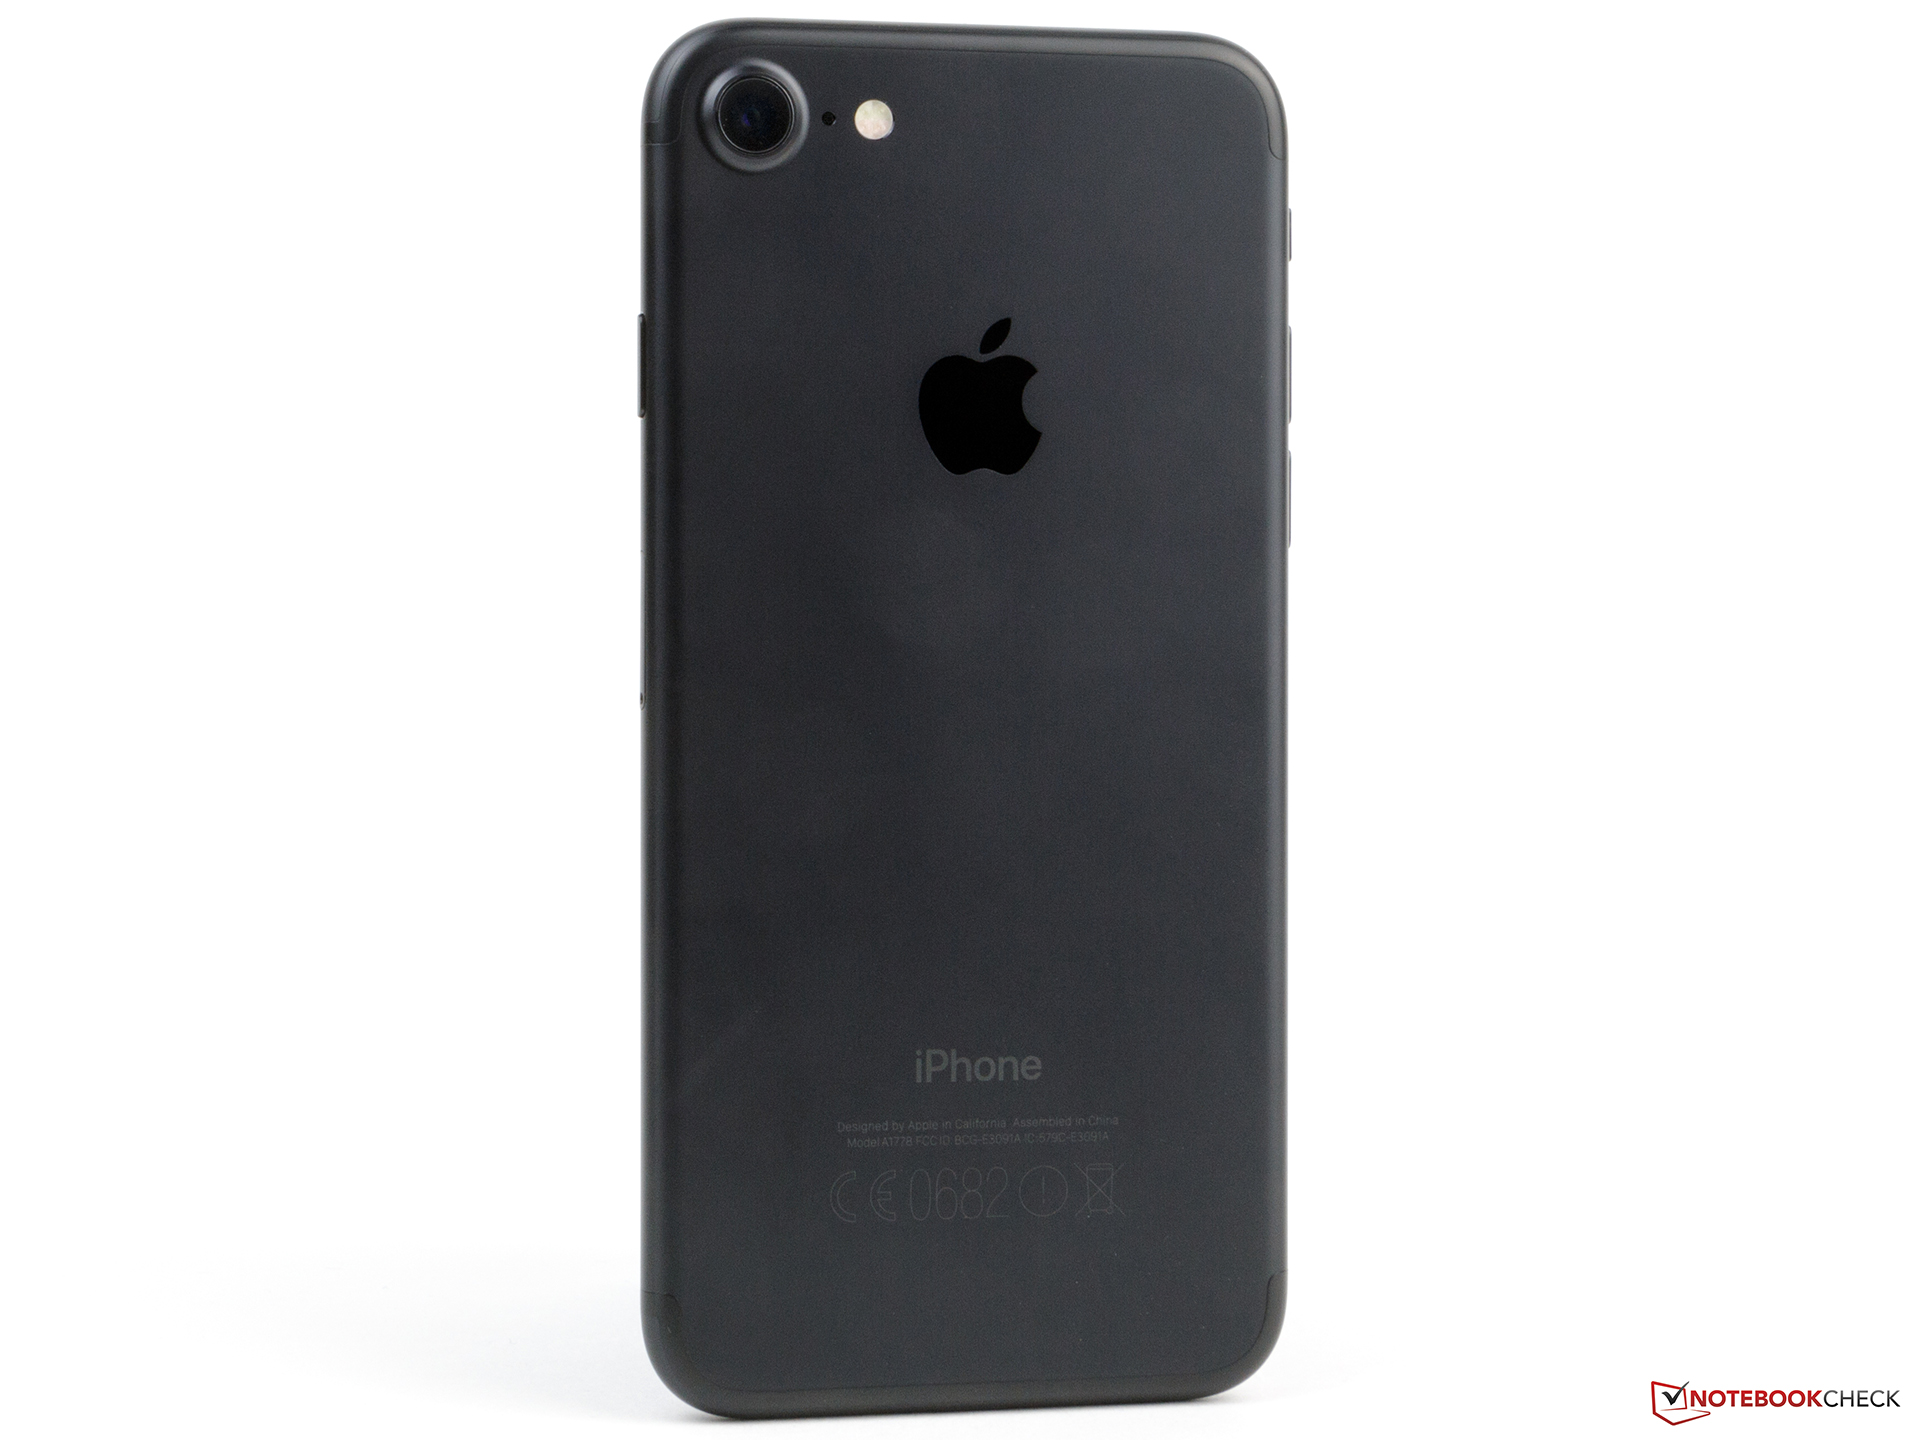
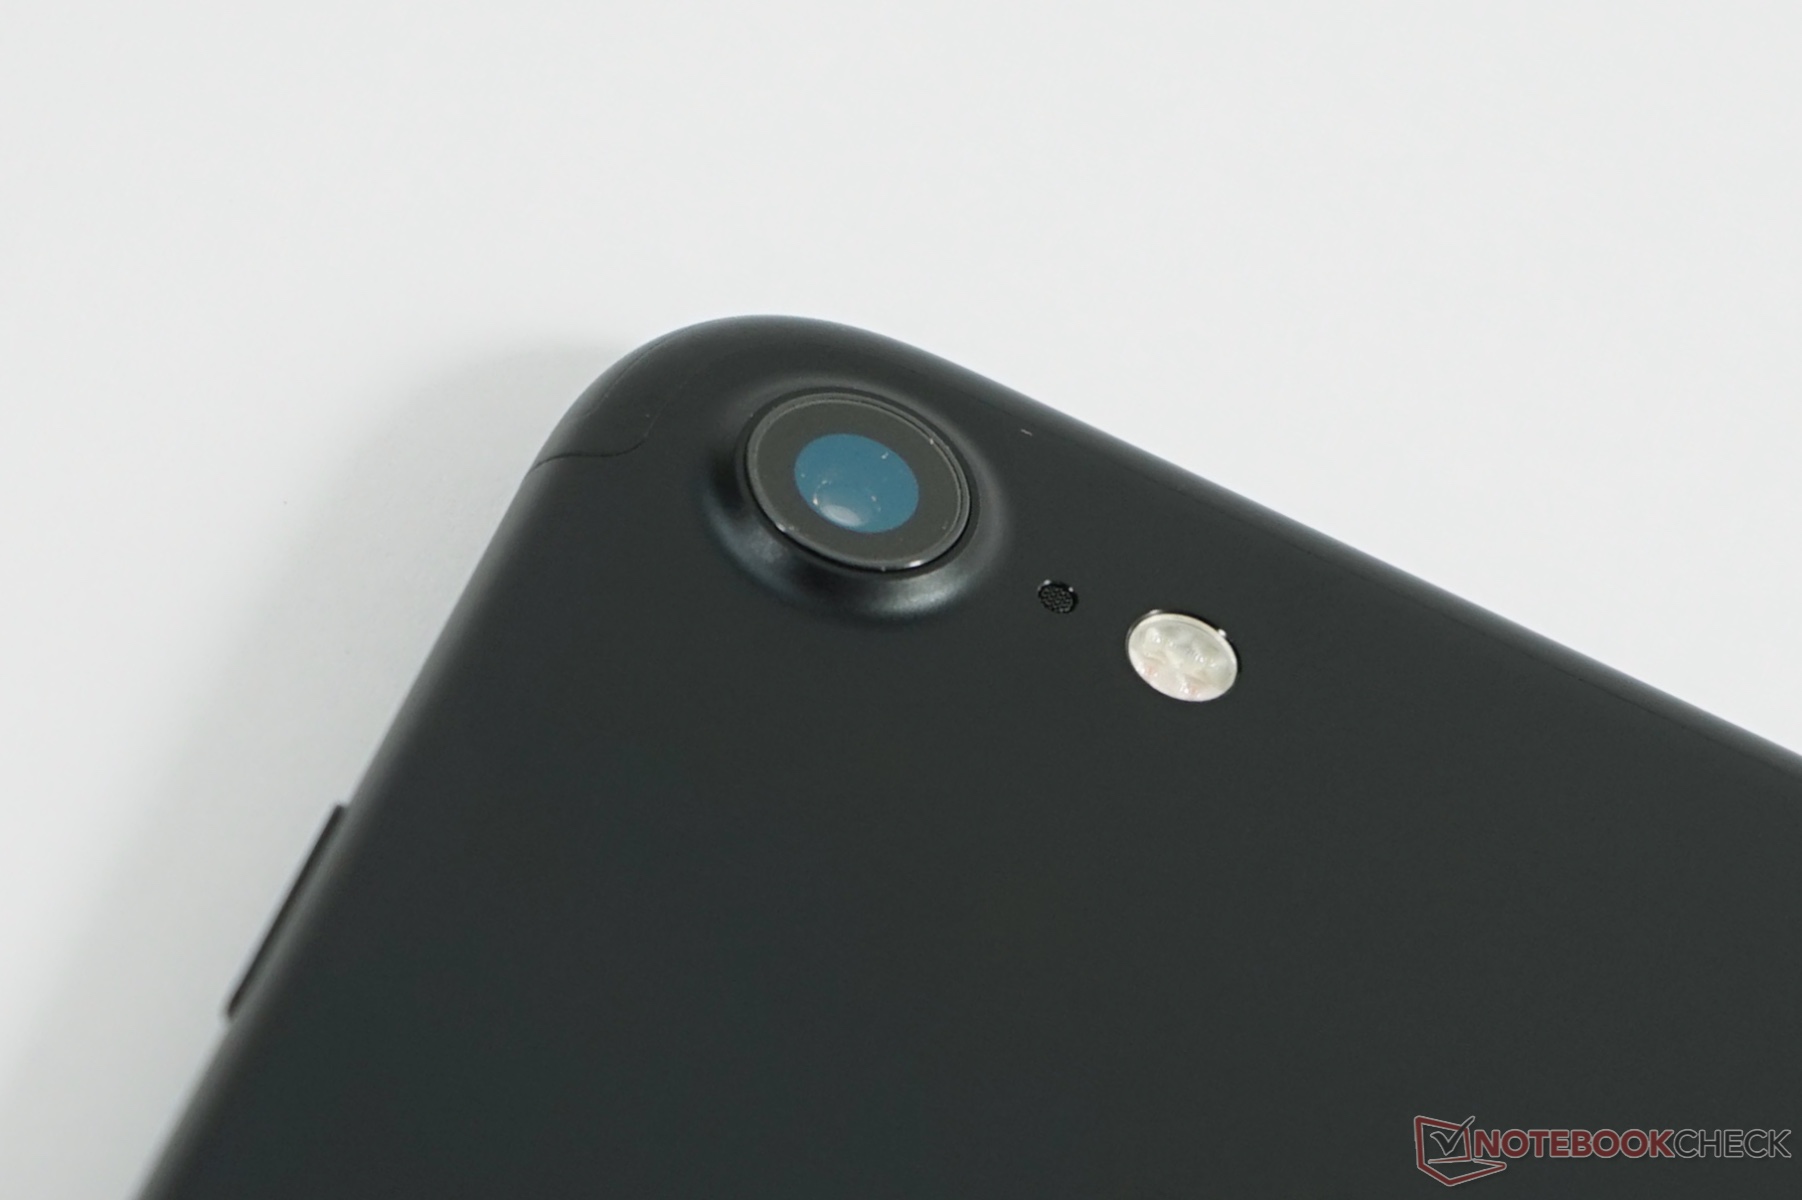
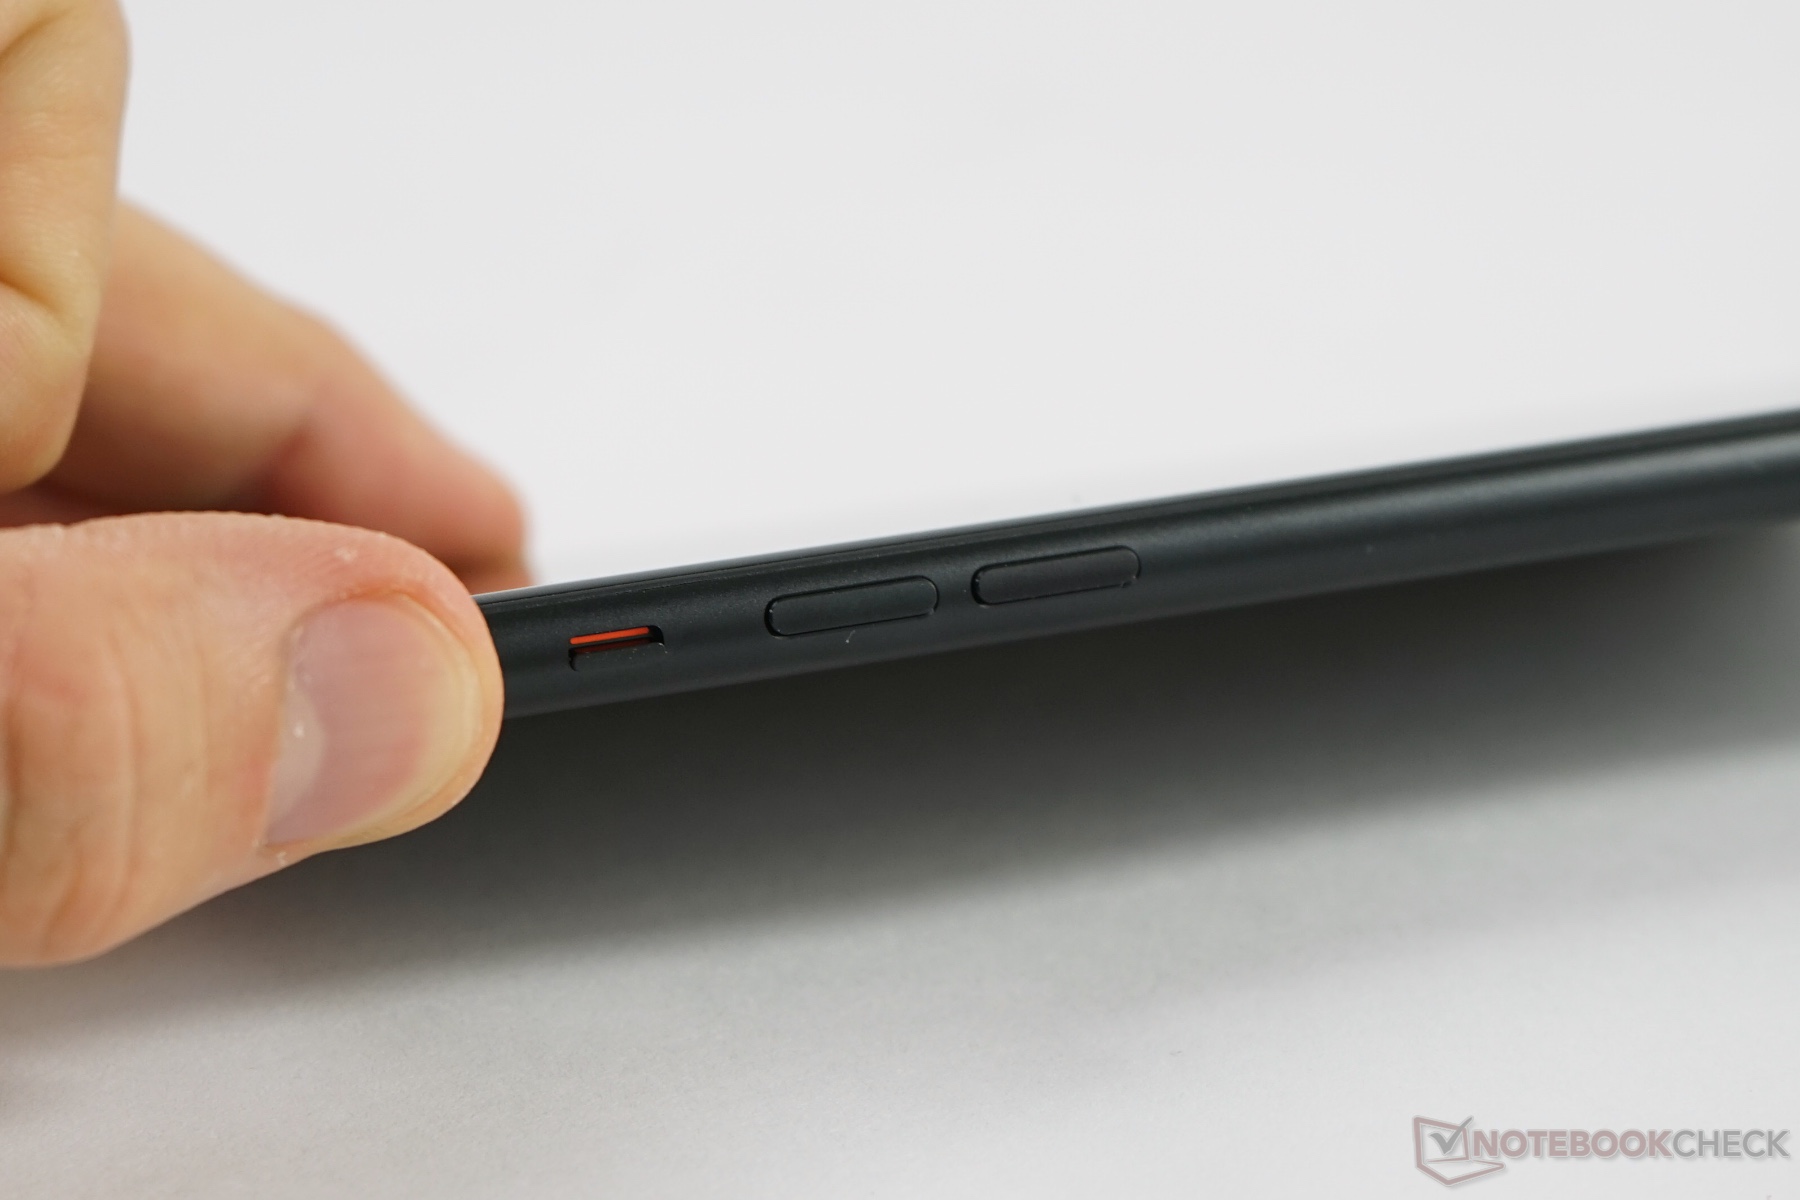
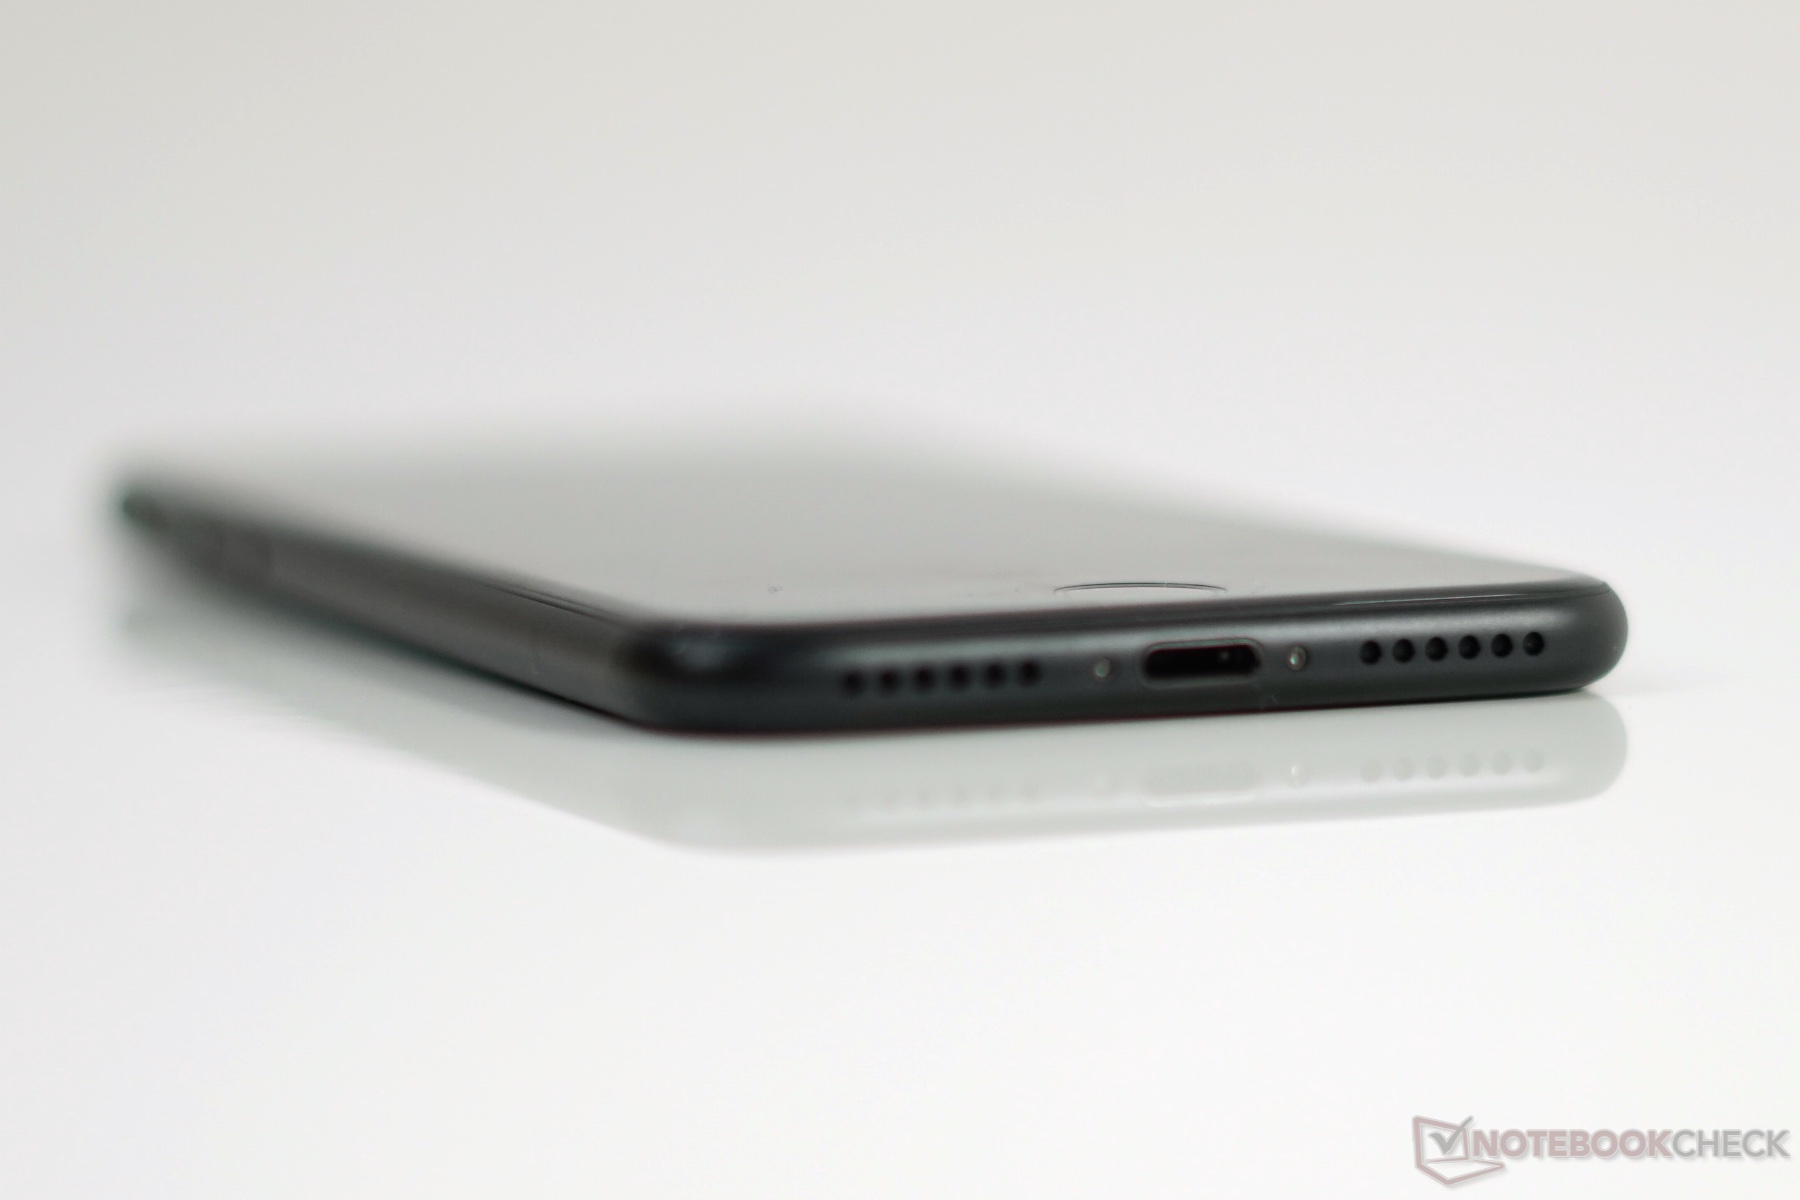
它也有一些不小的变化:它的机身现在提供了防水防尘的特性,同时有了新的颜色可选。iOS 10和相关应用也得到了改进。不过除了Home键解锁功能的变化外它没有什么别的大变化了。它搭配了速度更快、覆盖更广的网络模组。Ligntning接口现在成为了它仅有的物理接口,这也带来了一些问题,越来越多的功能需要通过转接头实现。
不过,iPhone 7的一些方面仍然有改进的空间:它对高品质音乐文件的支持不进反退,因为Lightning到3.5毫米耳机转接头可能会限制频响范围。可能新的AirPods可能会改进音效,不过可能不是每个人都愿意每听五个小时音乐就充一次电……
新的立体声扬声器的音响效果最多算是一般,同时它的通话效果也是如此。而铝合金机身在负载下也会变得很热。
不过,它也还有很多值得称道的方面,比如对比度超高的绚丽屏幕(尽管分辨率相对较低)、高性能和非常优秀的电池续航时间。同时这台智能手机在使用中也十分流畅顺手,这要归功于准确的触控屏幕和出色的触控引擎。
Apple的iPhone 7整体十分优秀。如果你已经在使用iPhone 6或6s了,那么请不要对新功能抱太大的期待。iPhone 7是个成功的更新,如果你在用的手机已经较老的话,更换它将不会让你后悔。
如果你正在寻找一款出色的高端智能手机,也有足够的预算的话,那么这台最新iPhone应该是不二选择了。如果你可以等待,明年的iPhone可能会是一次技术革命,不过目前iPhone 7已经是最先进的智能手机之一了。
注:本文是基于完整评测的缩减版本,阅读完整的英文评测,请点击这里。
Apple iPhone 7
- 09/18/2016 v5.1 (old)
Daniel Schmidt, Patrick Afschar Kaboli