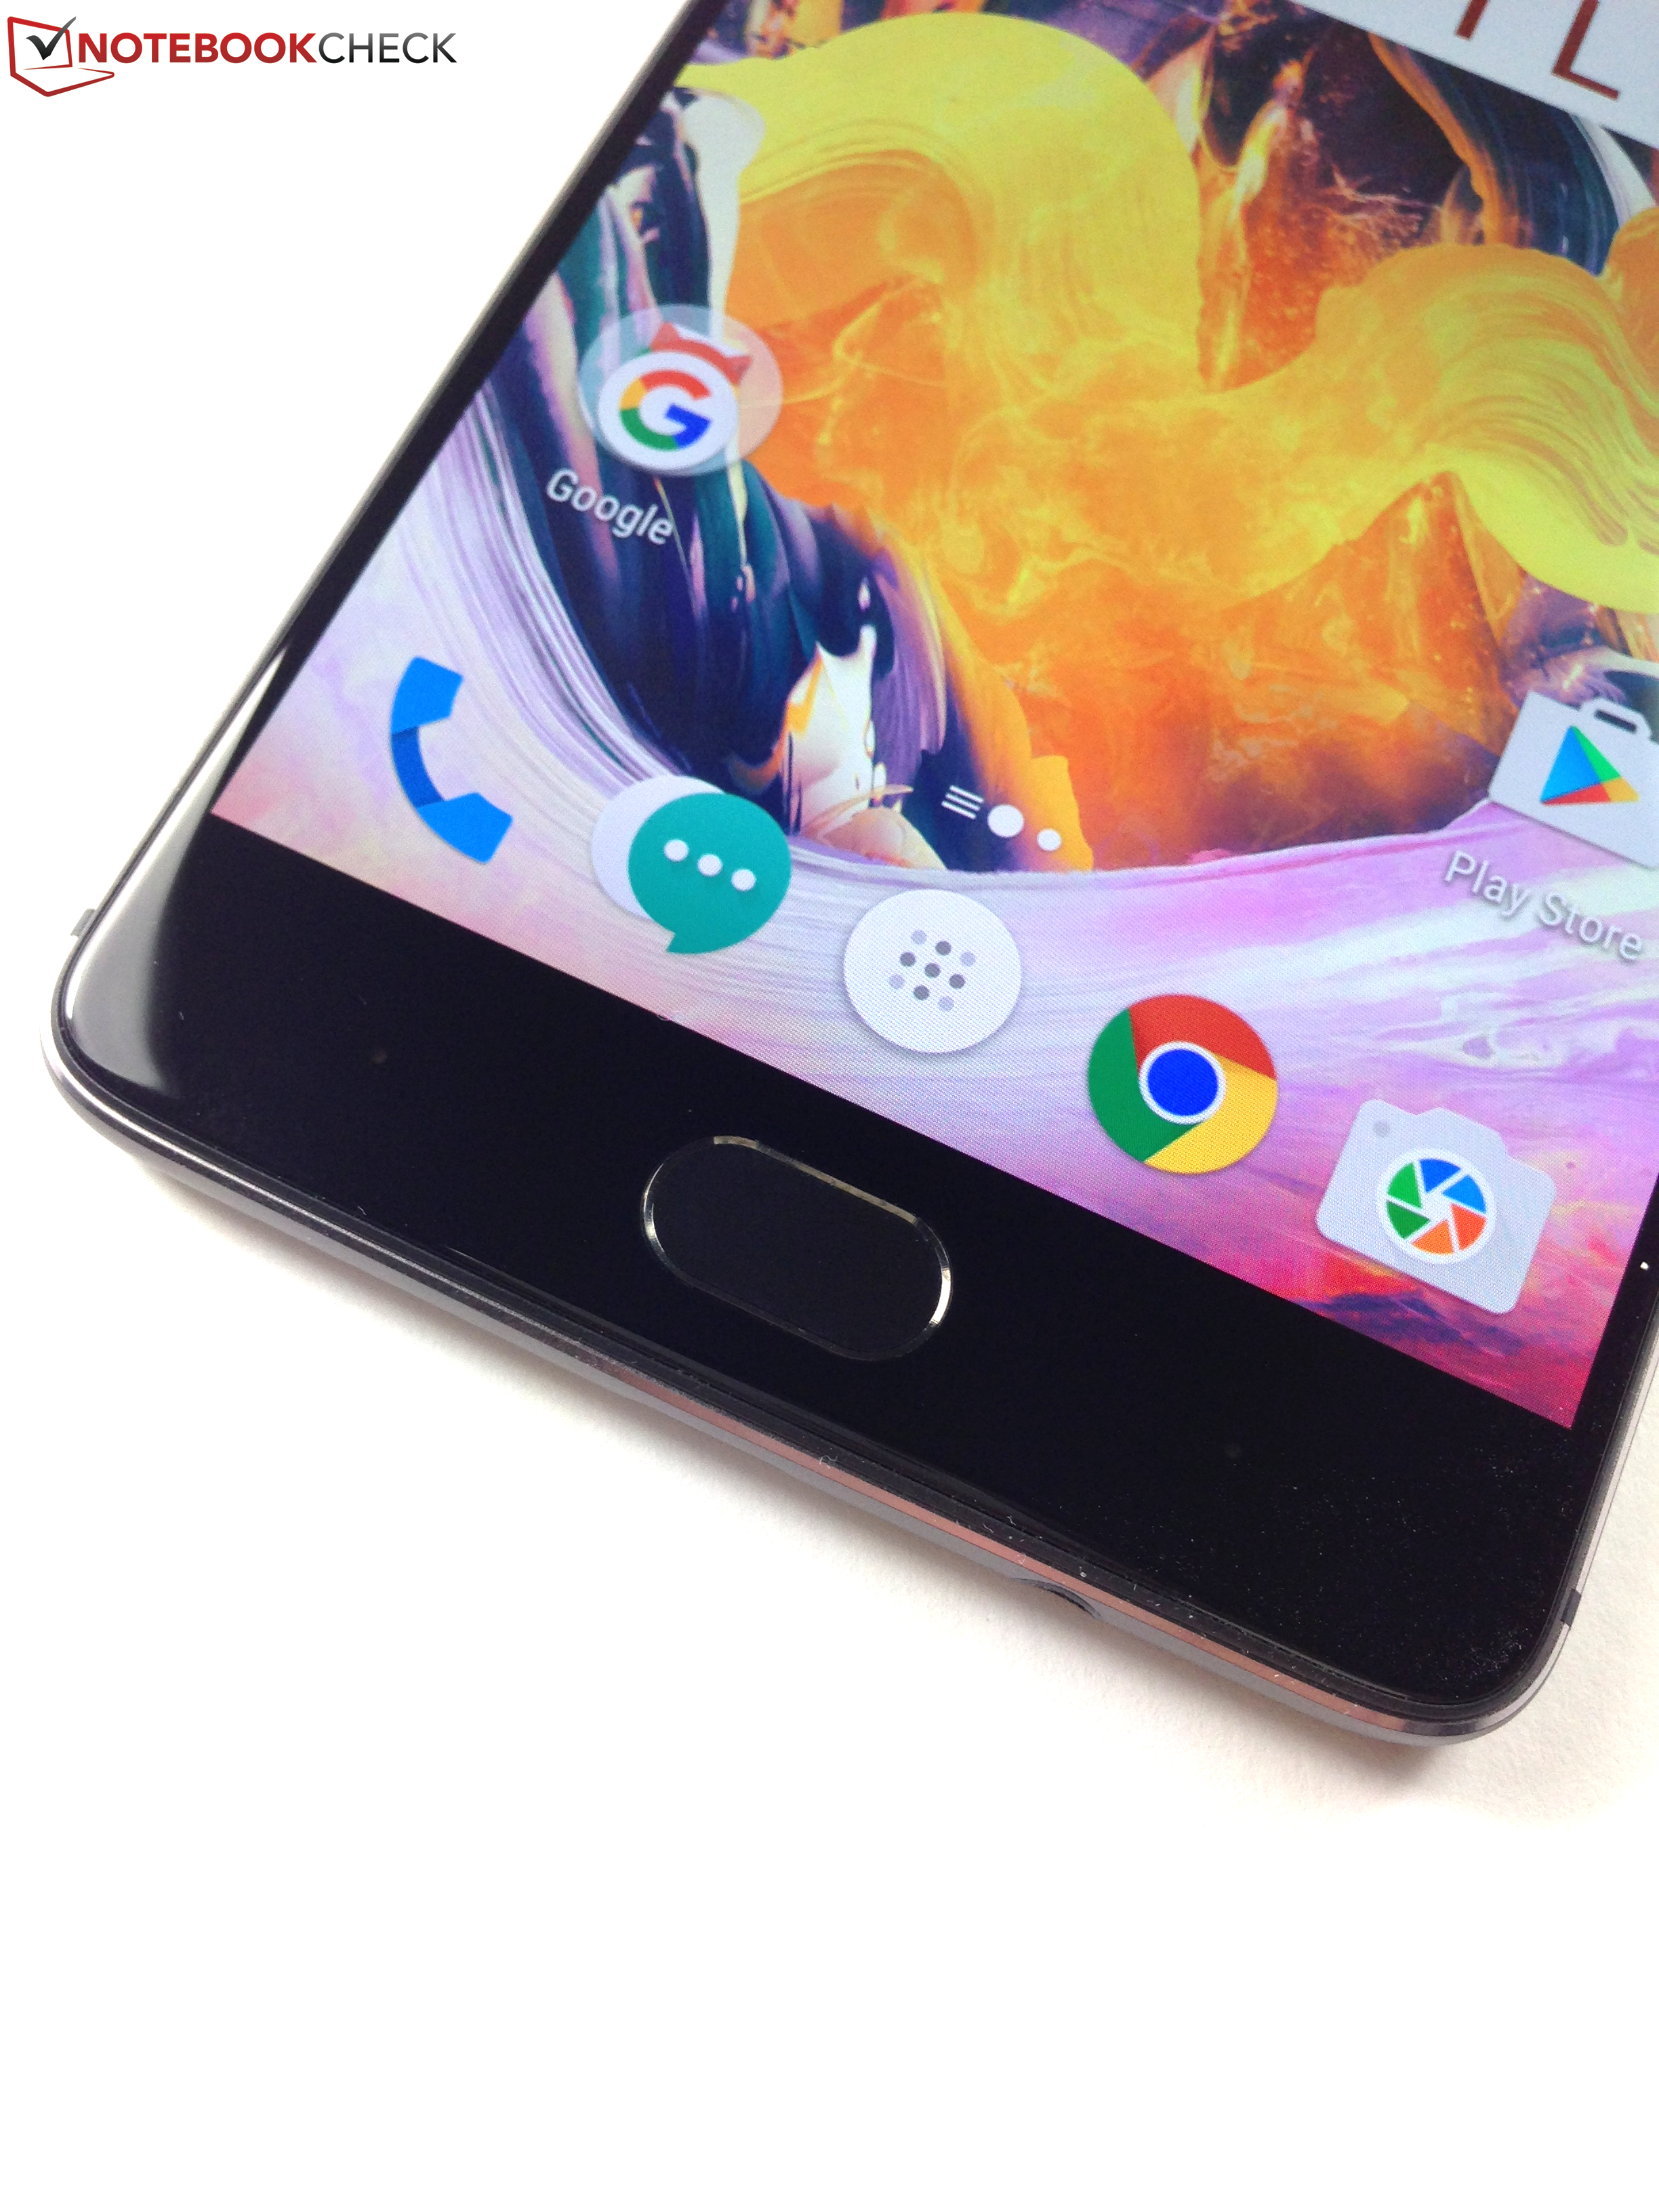
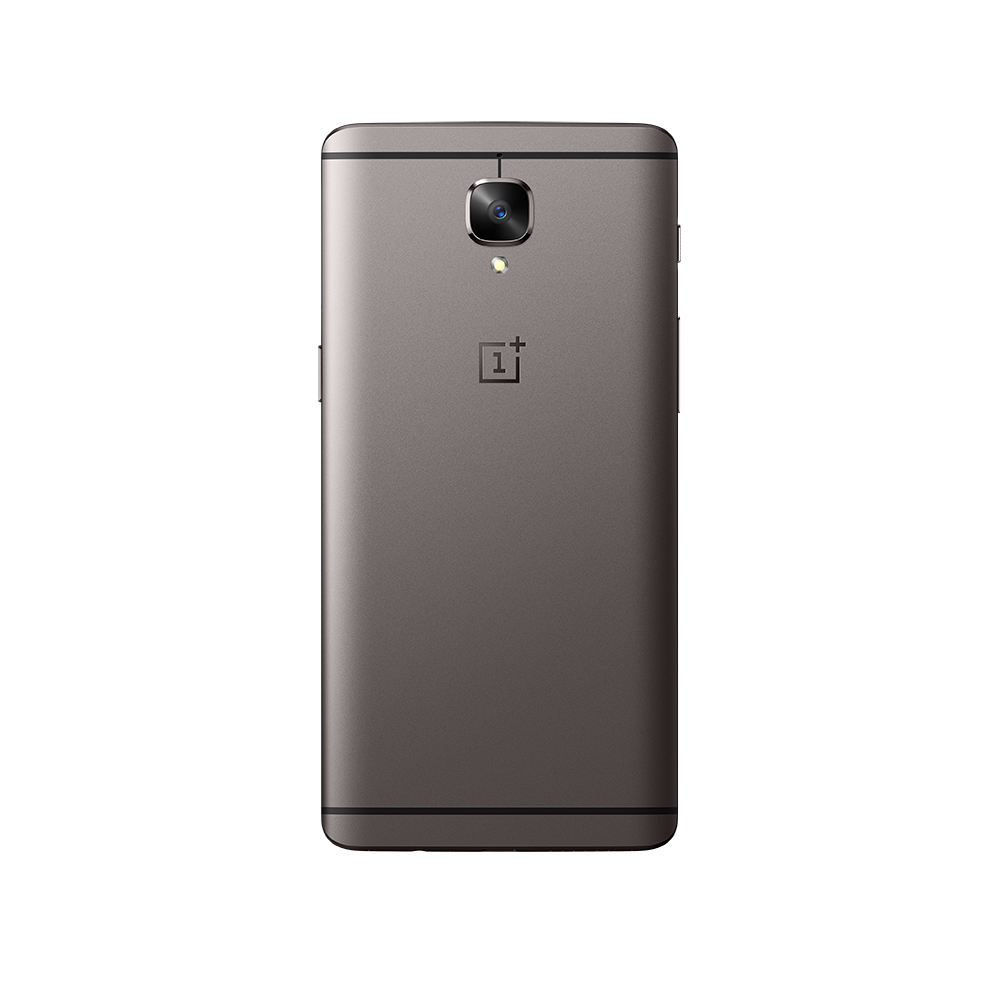
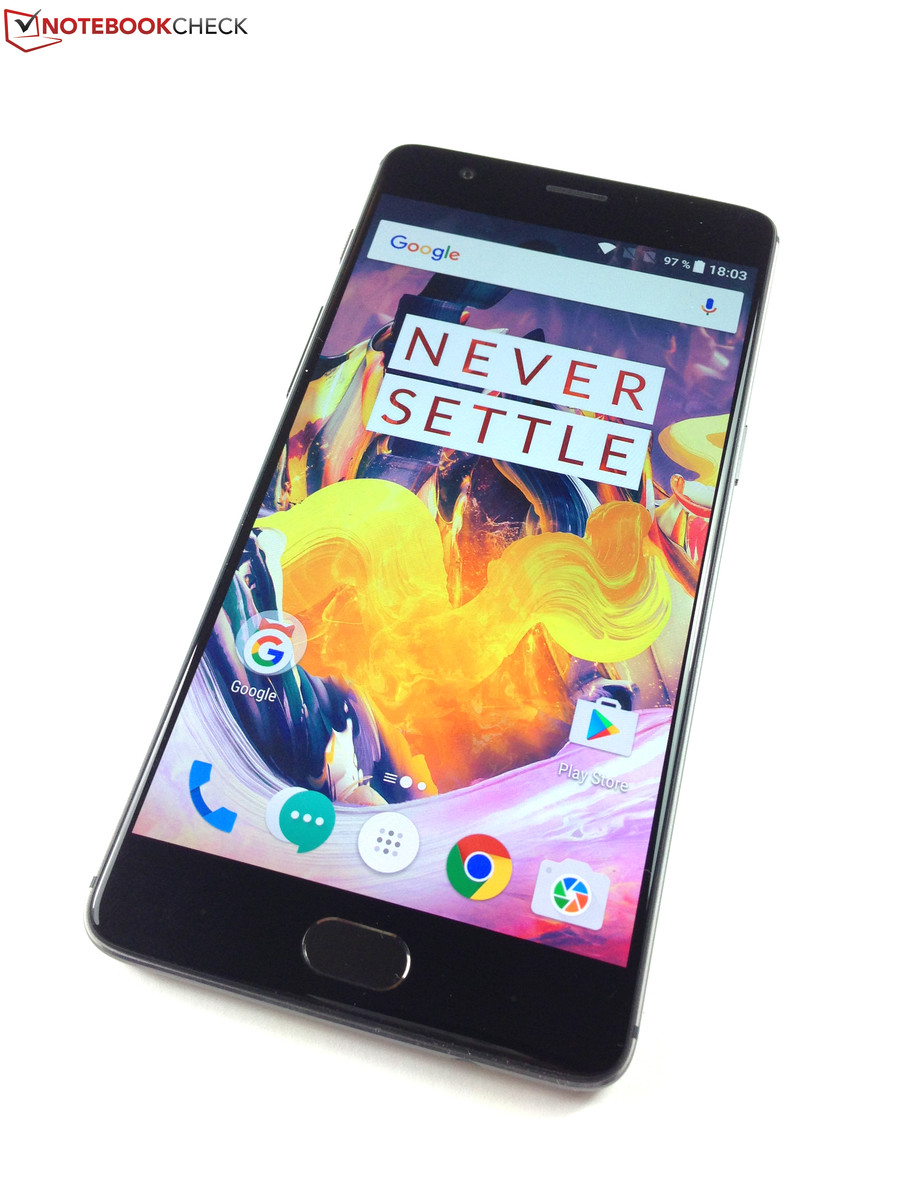
一加 3T 智能手机简短评测
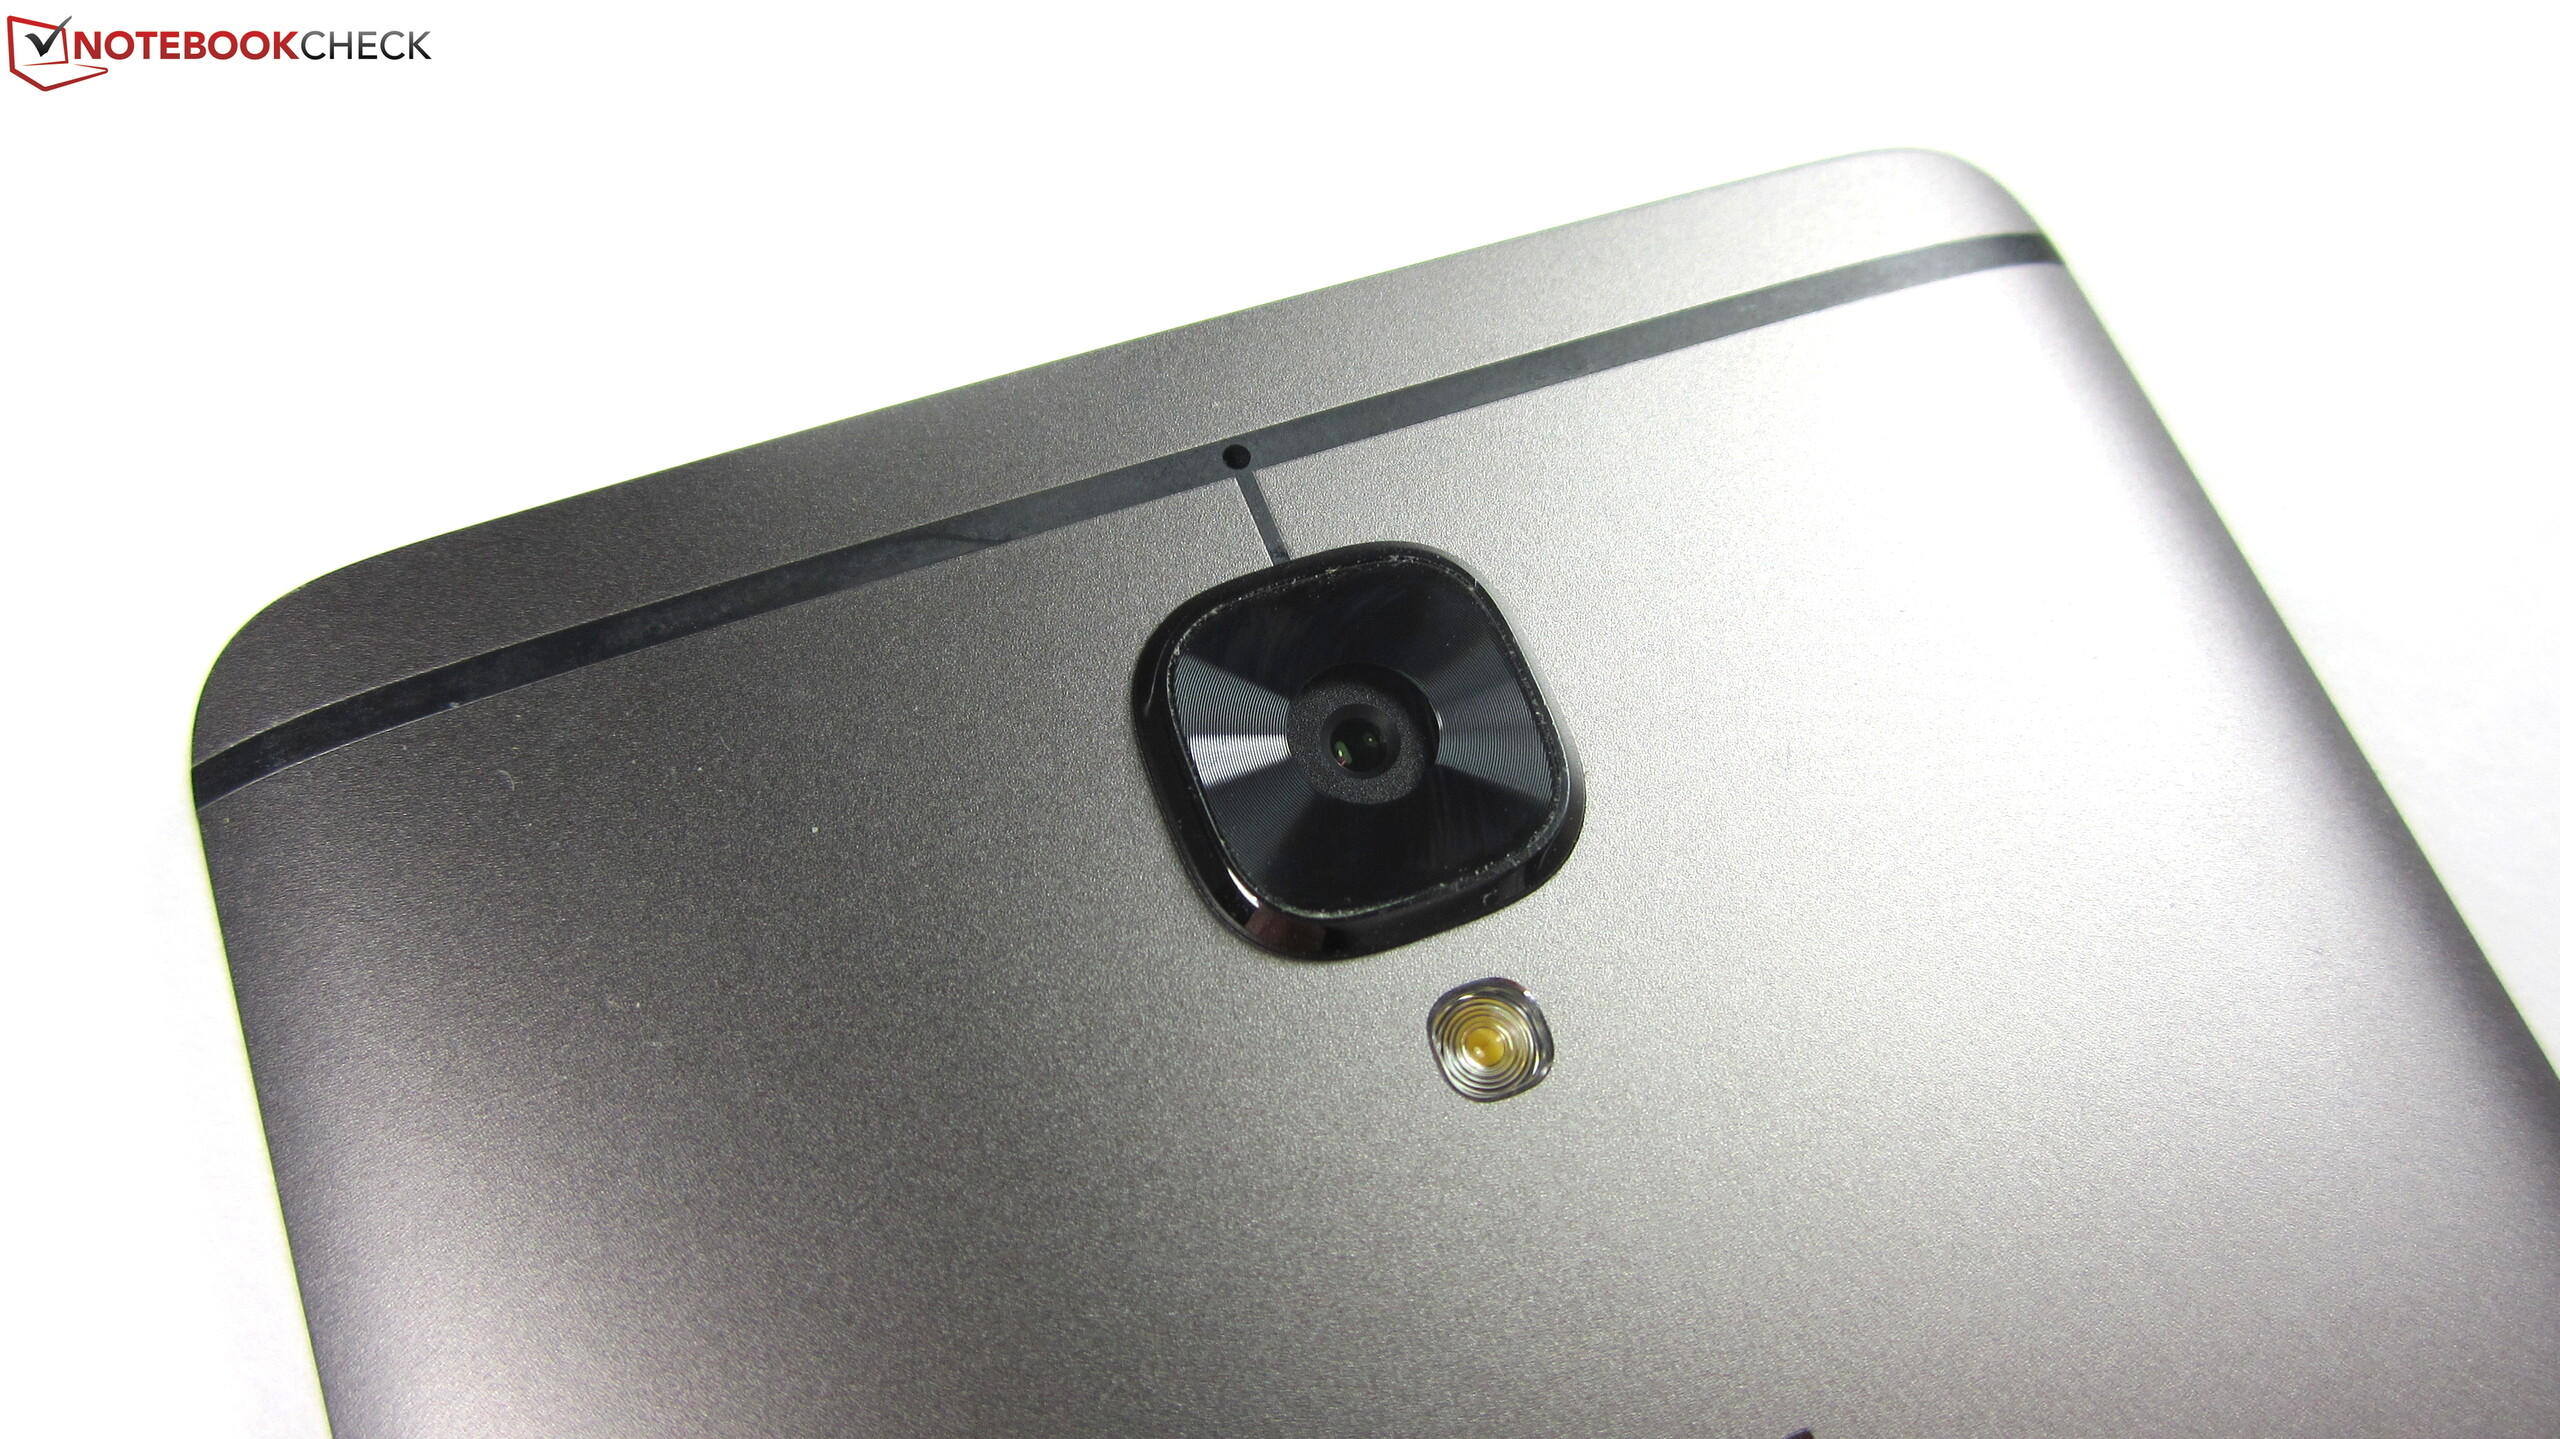
Case


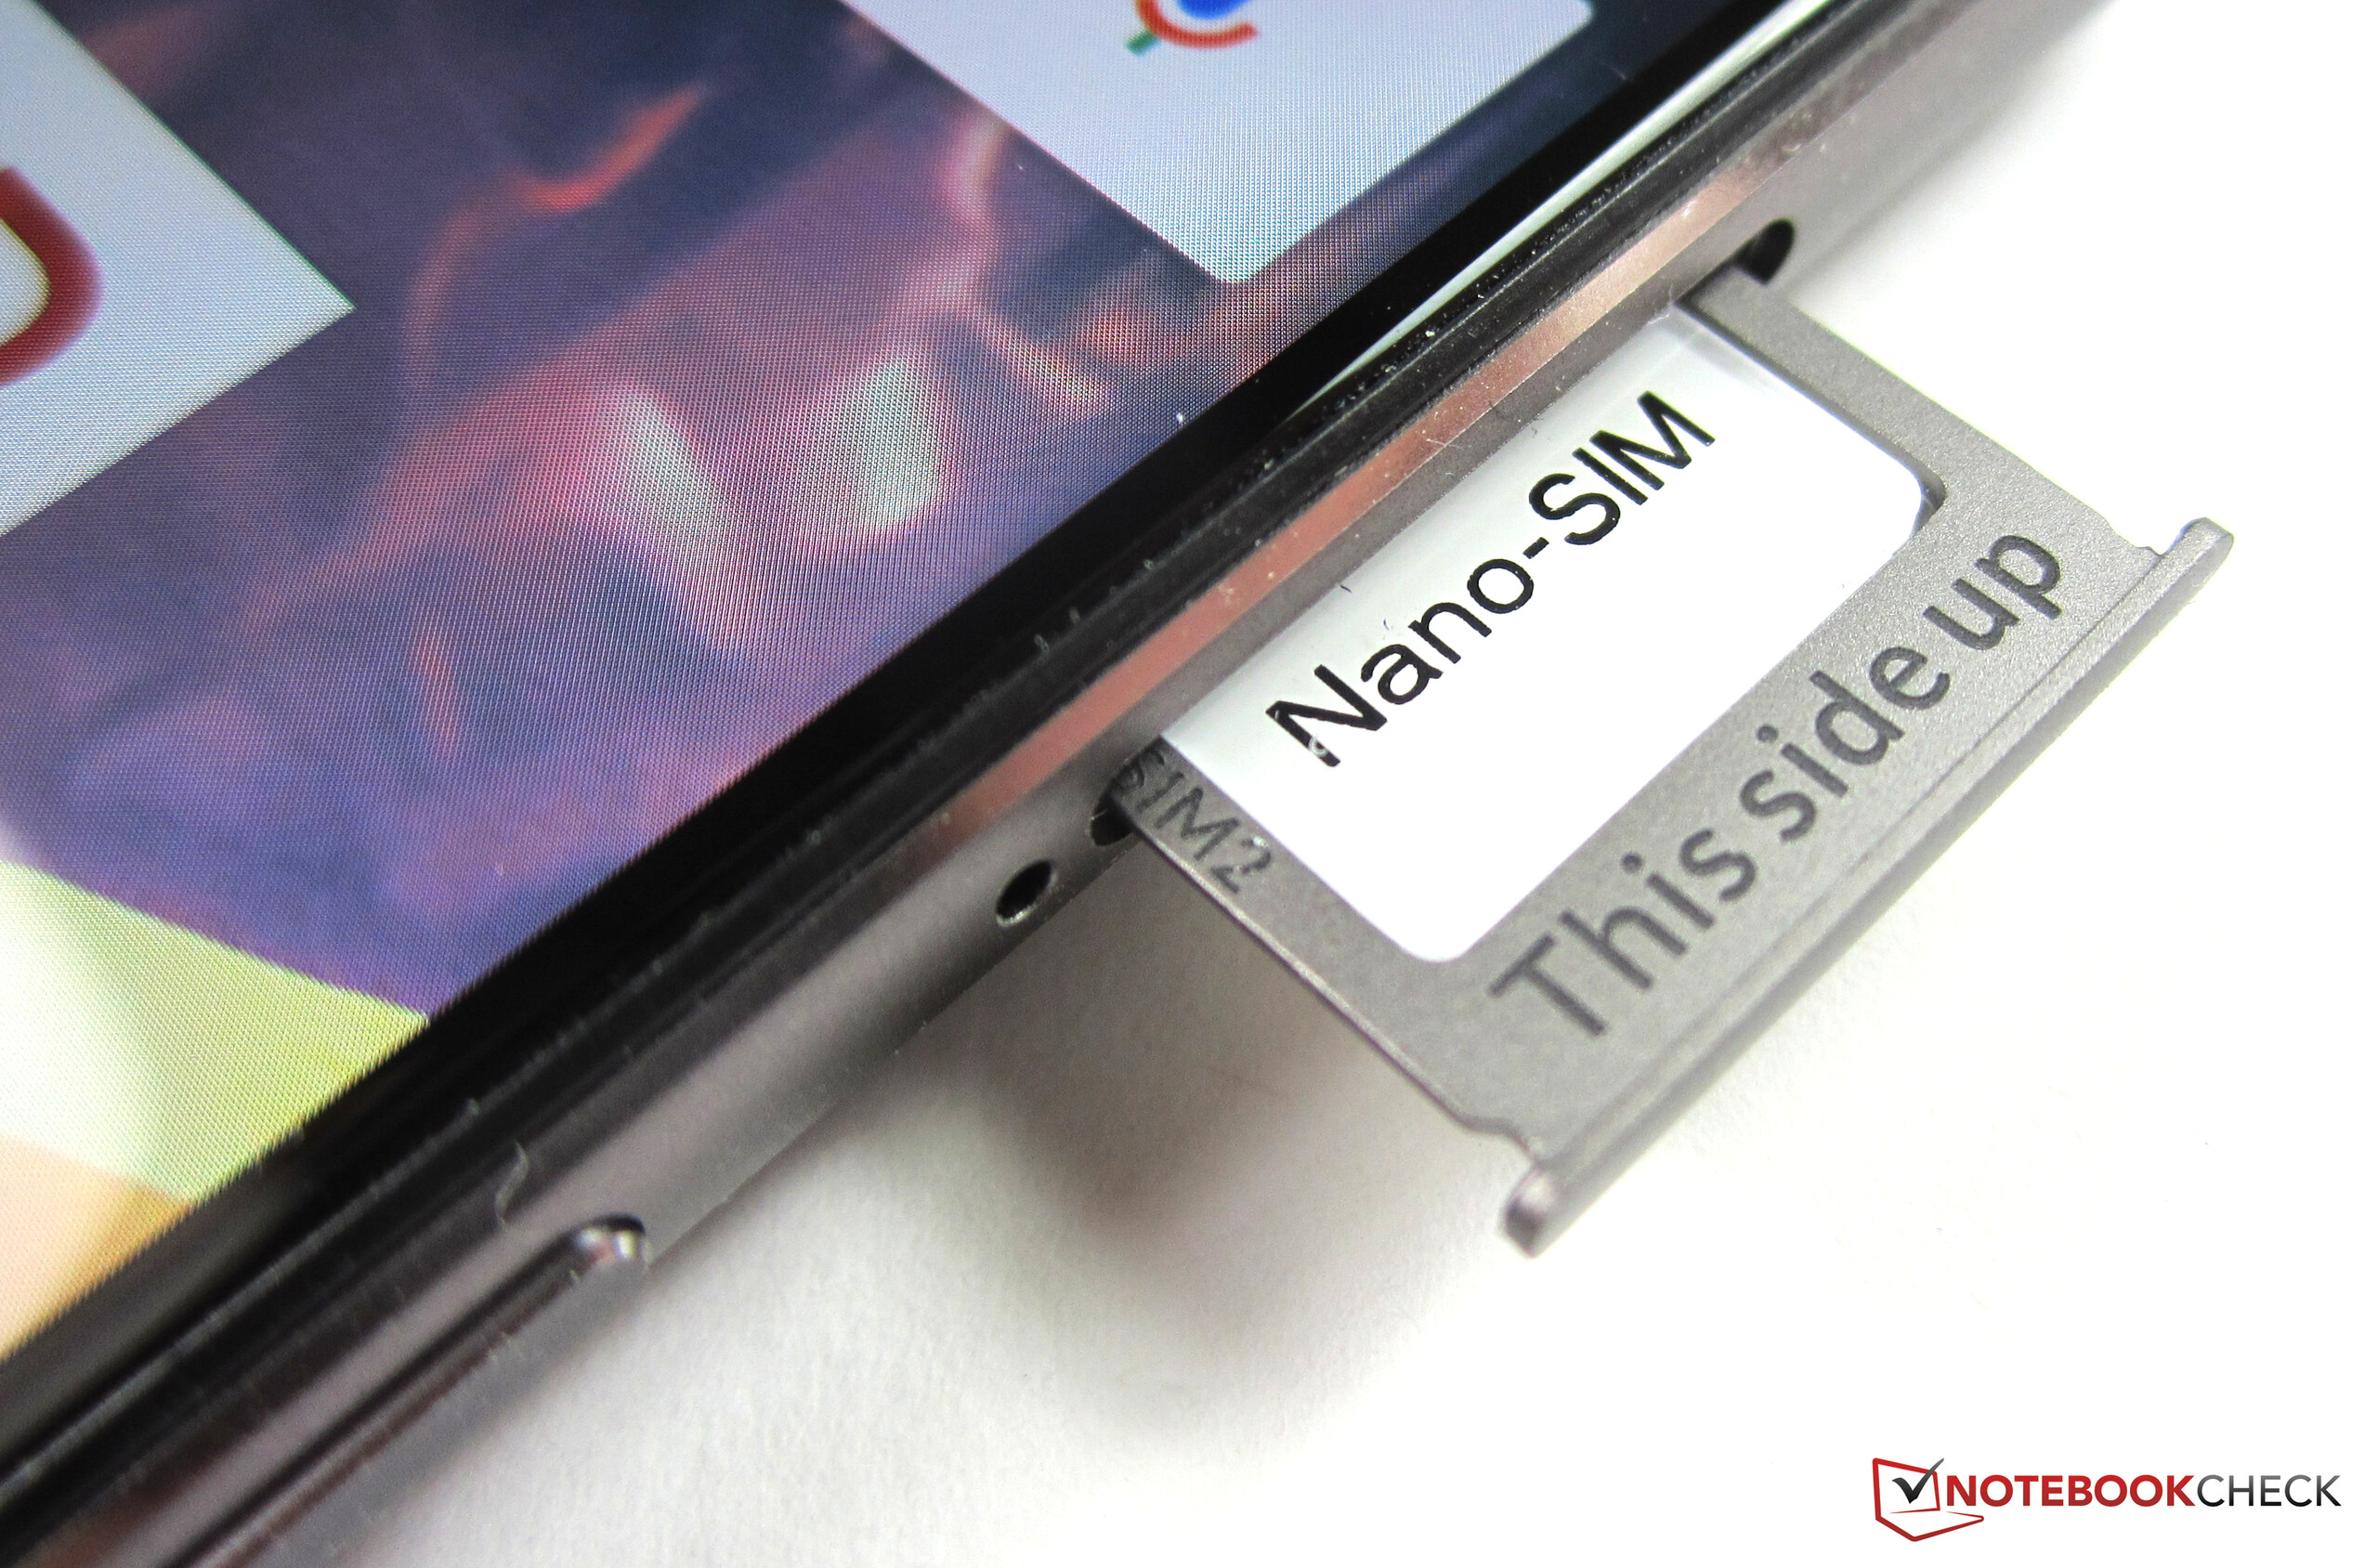
Connectivity
| Networking | |
| iperf3 transmit AX12 | |
| Apple iPhone 7 (Klaus I211) | |
| Samsung Galaxy S7 | |
| OnePlus 3 | |
| OnePlus 3T | |
| Huawei P9 | |
| iperf3 receive AX12 | |
| Apple iPhone 7 (Klaus I211) | |
| OnePlus 3 | |
| Samsung Galaxy S7 | |
| Huawei P9 | |
| OnePlus 3T | |


Display
| |||||||||||||||||||||||||
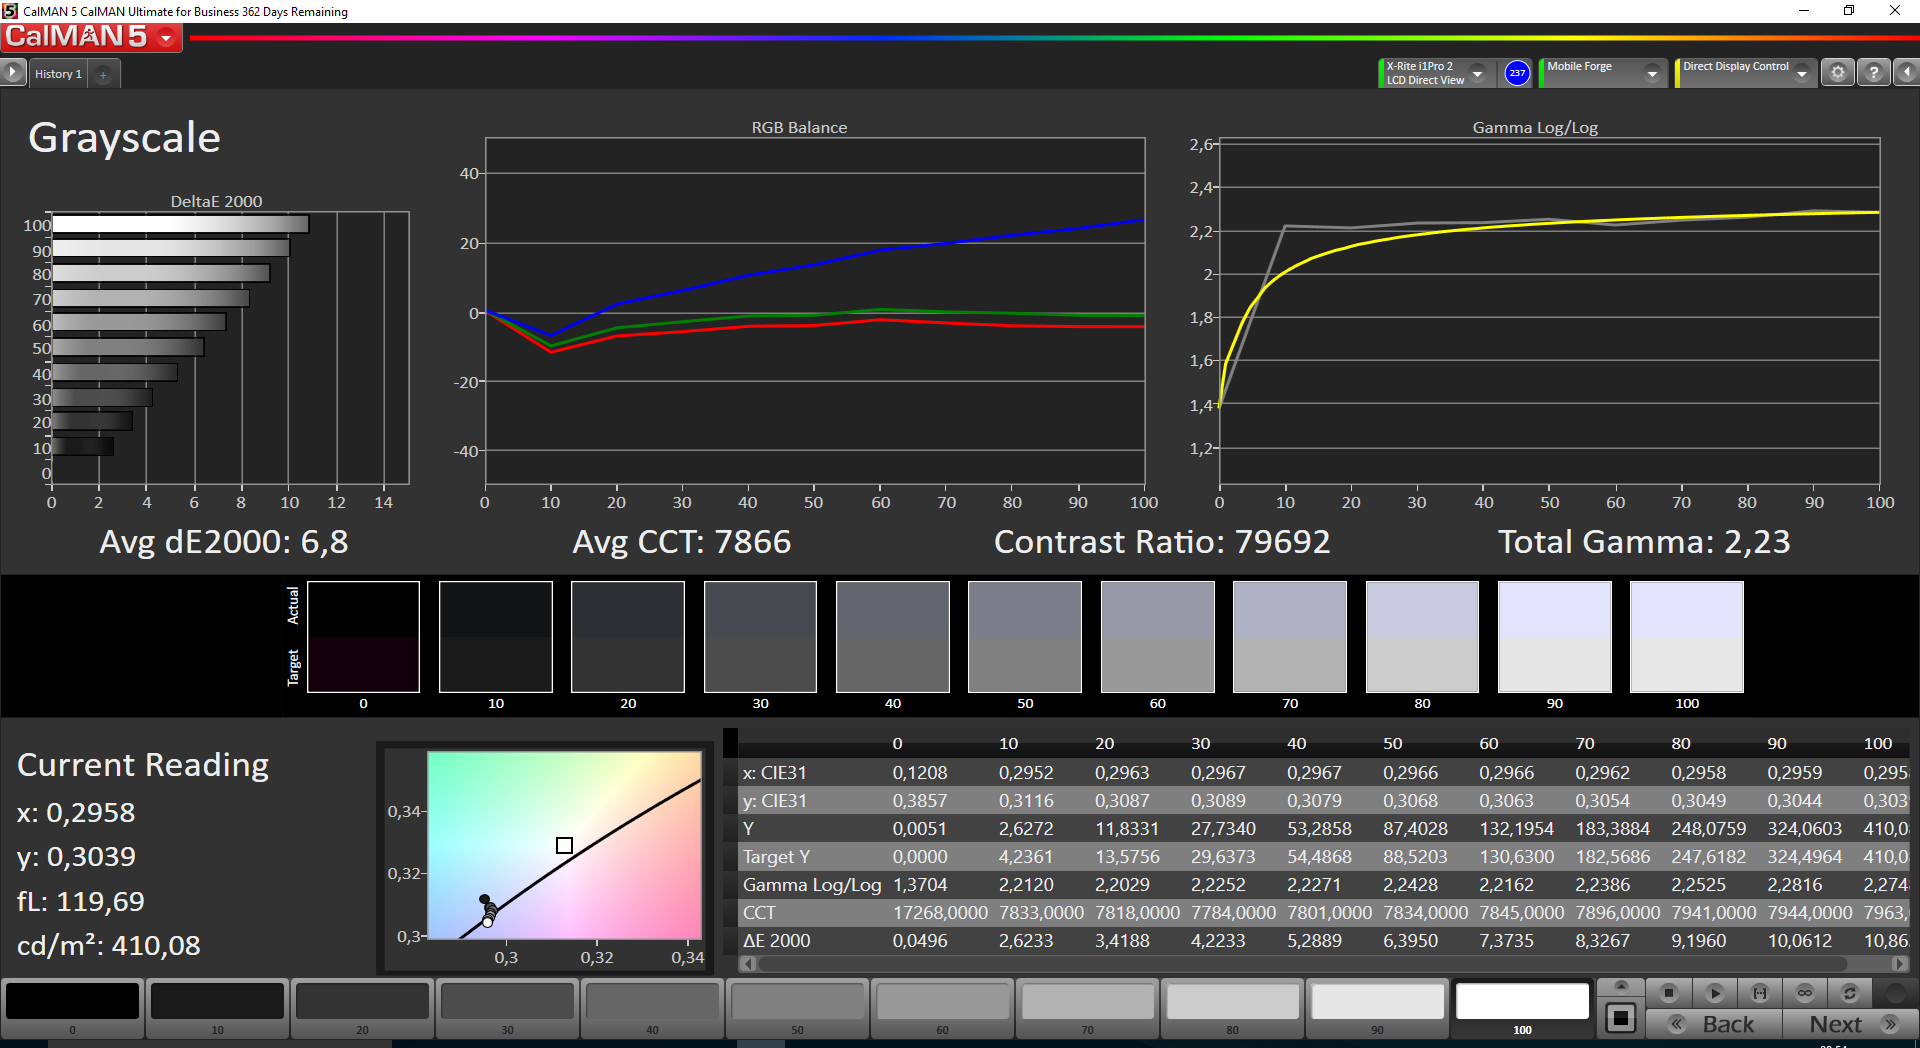
Brightness Distribution: 84 %
Center on Battery: 421 cd/m²
Contrast: ∞:1 (Black: 0 cd/m²)
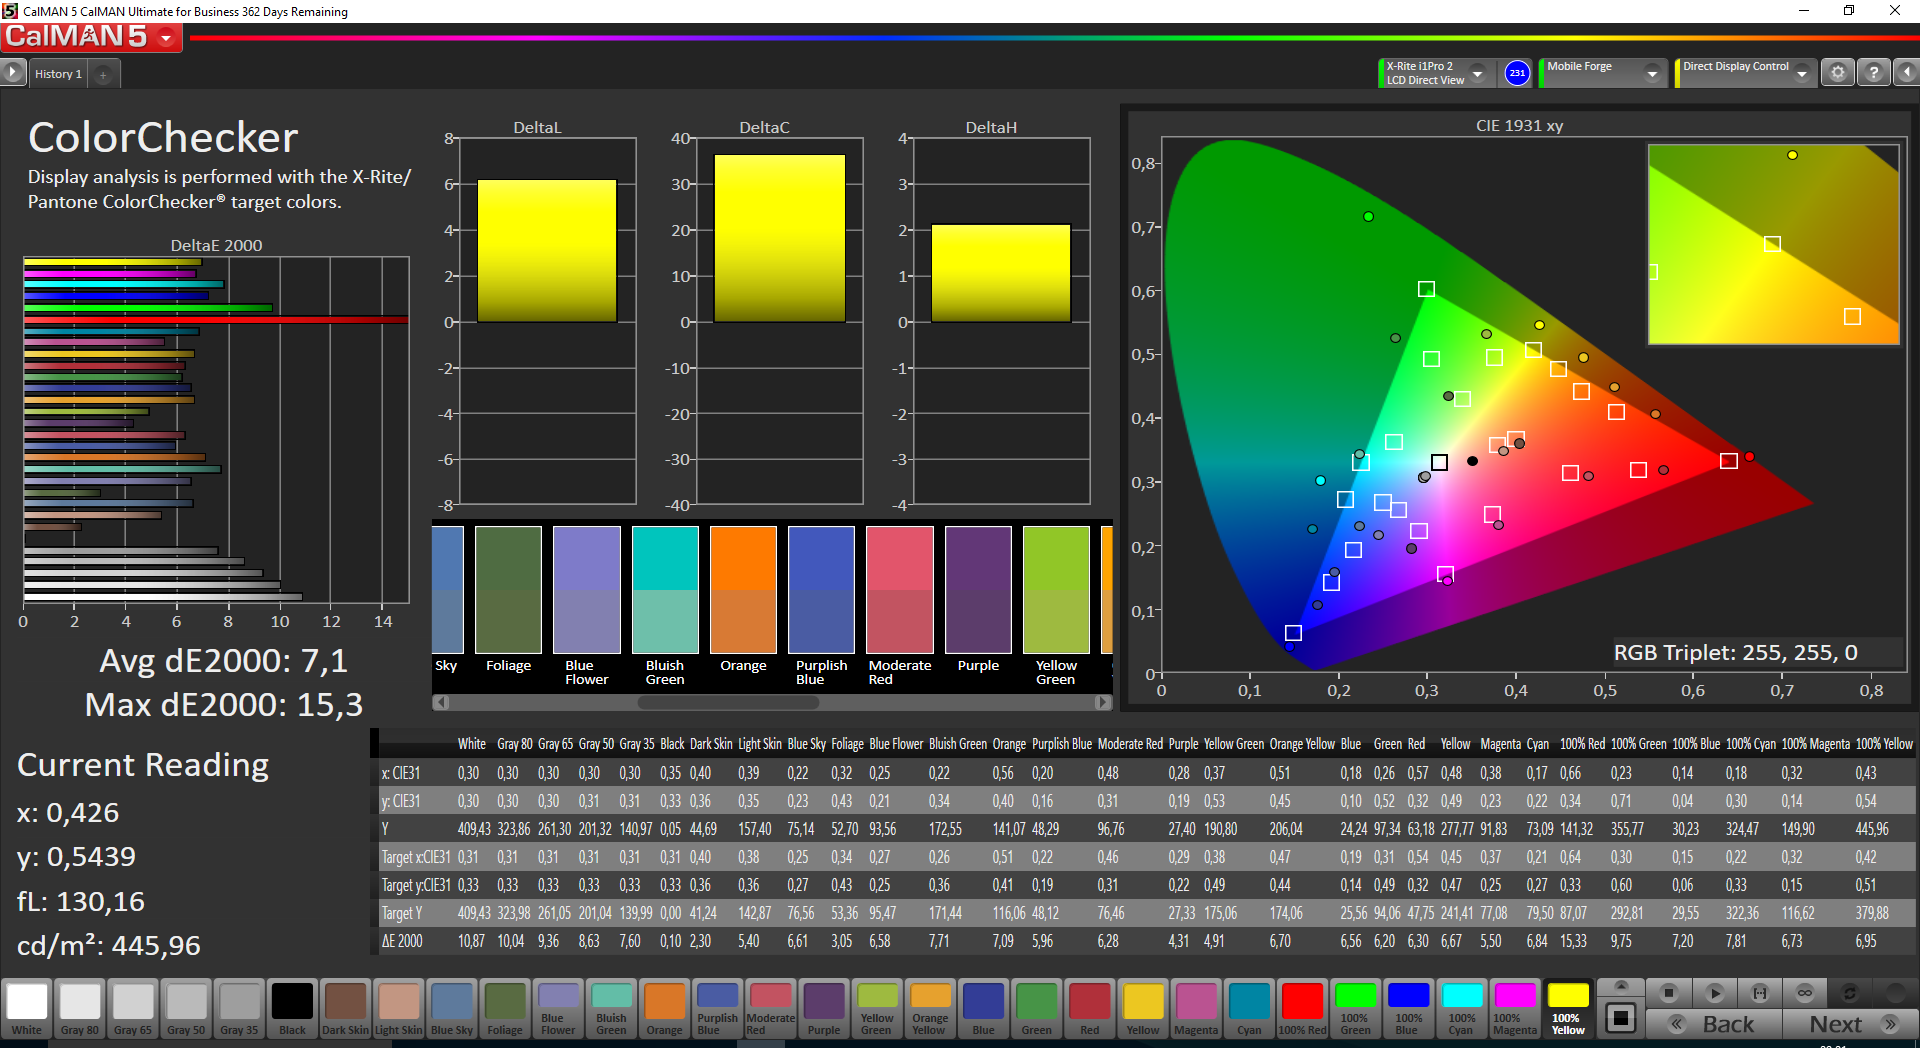
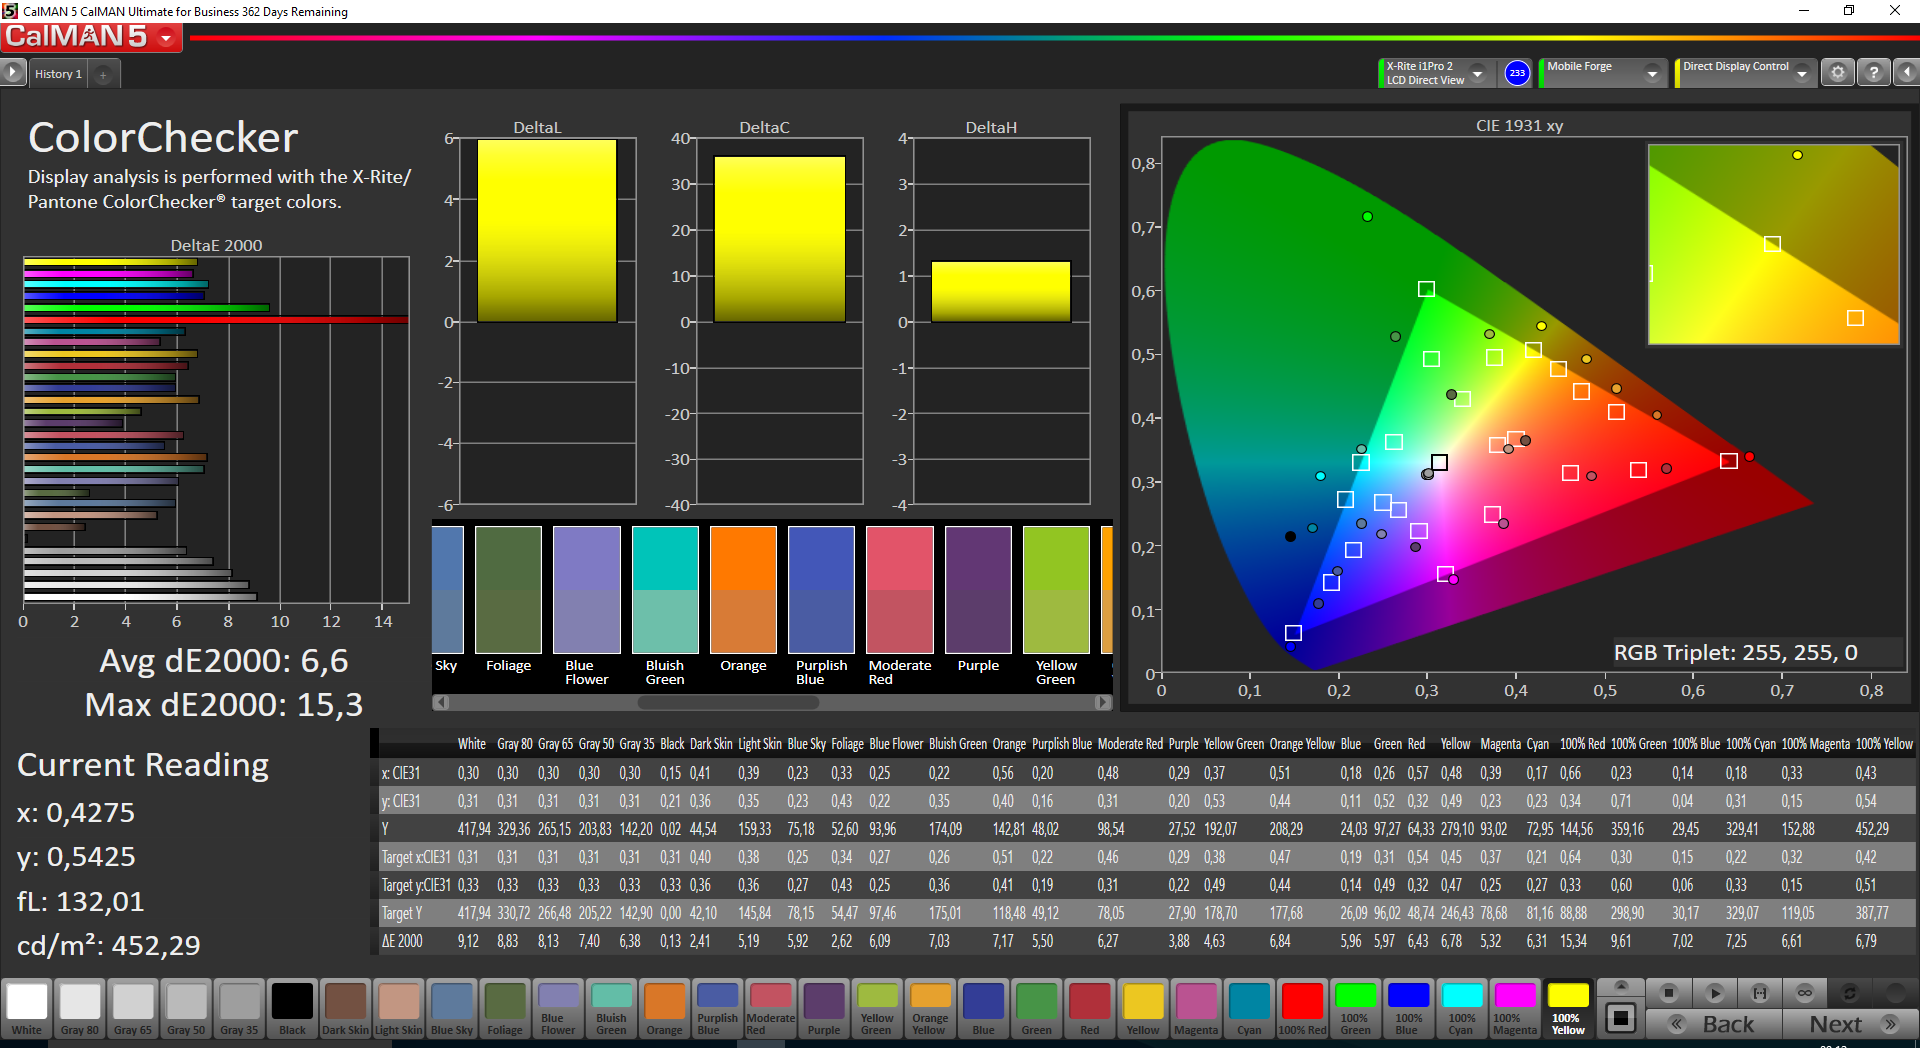
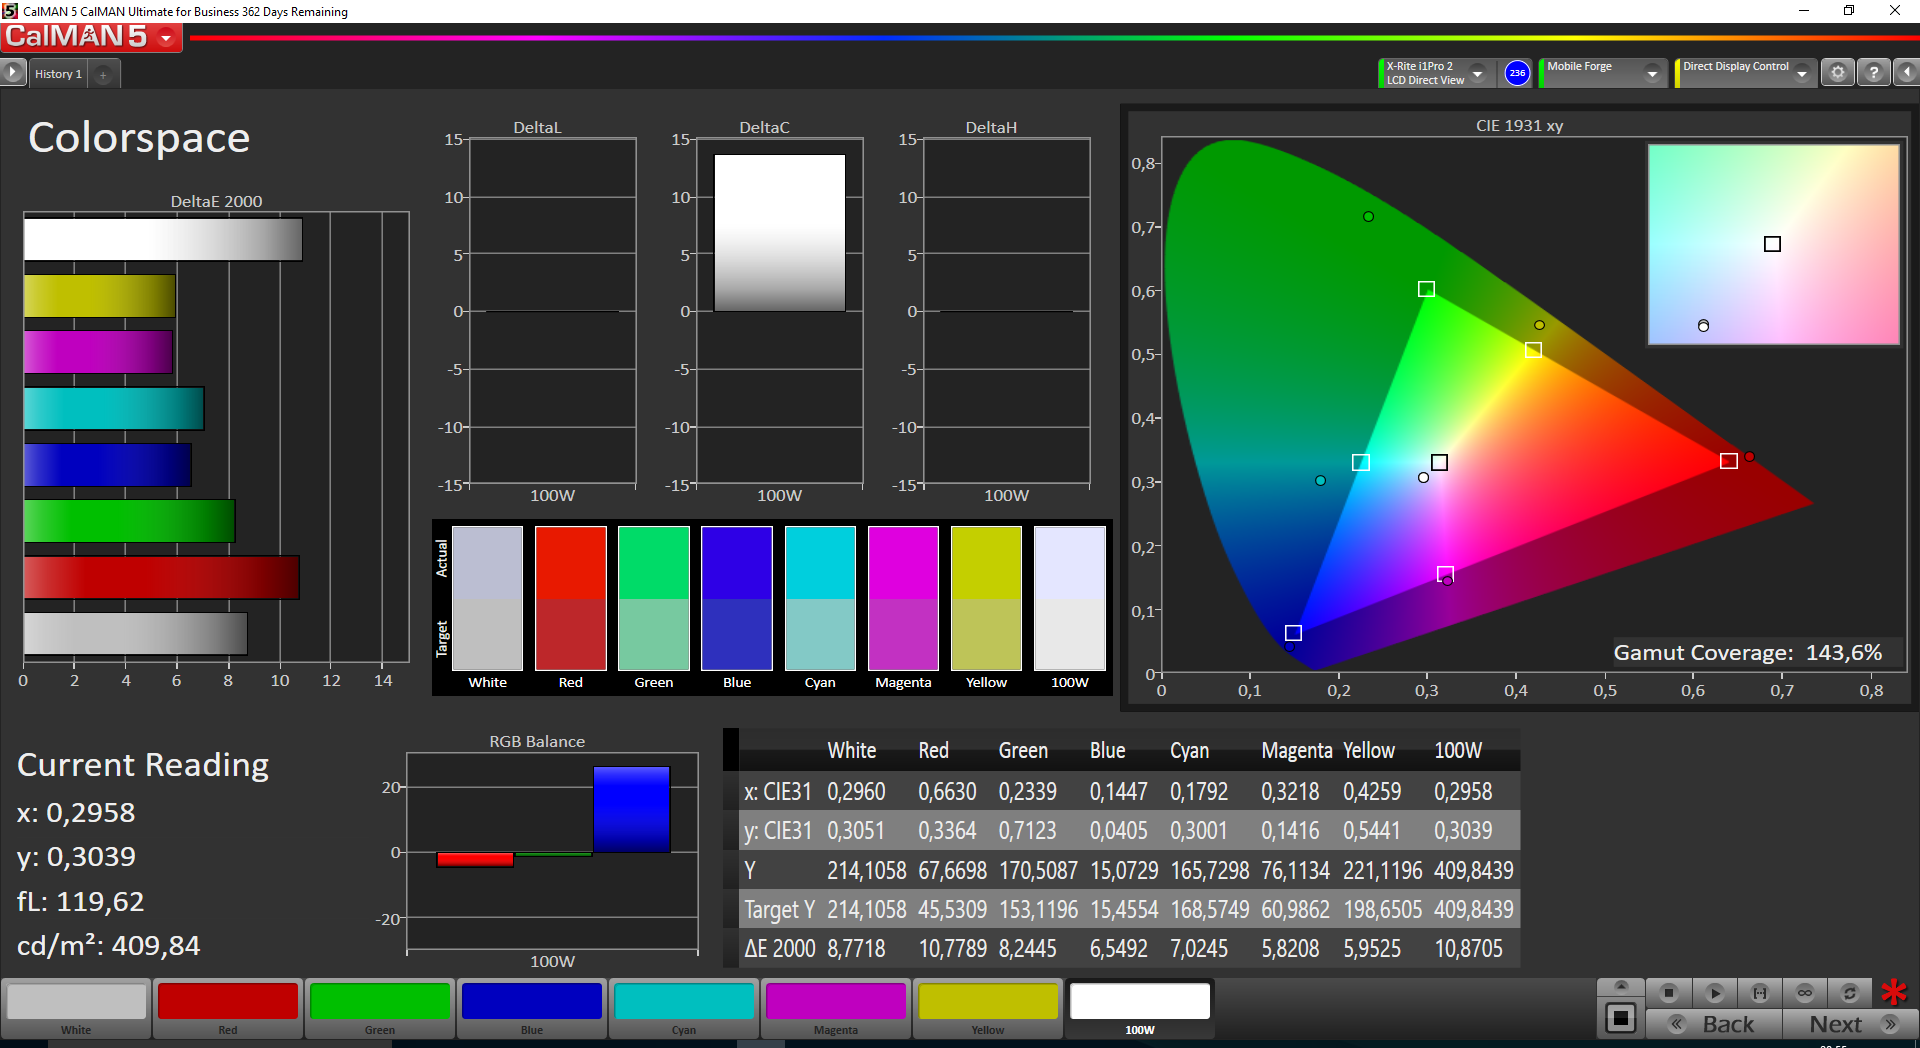
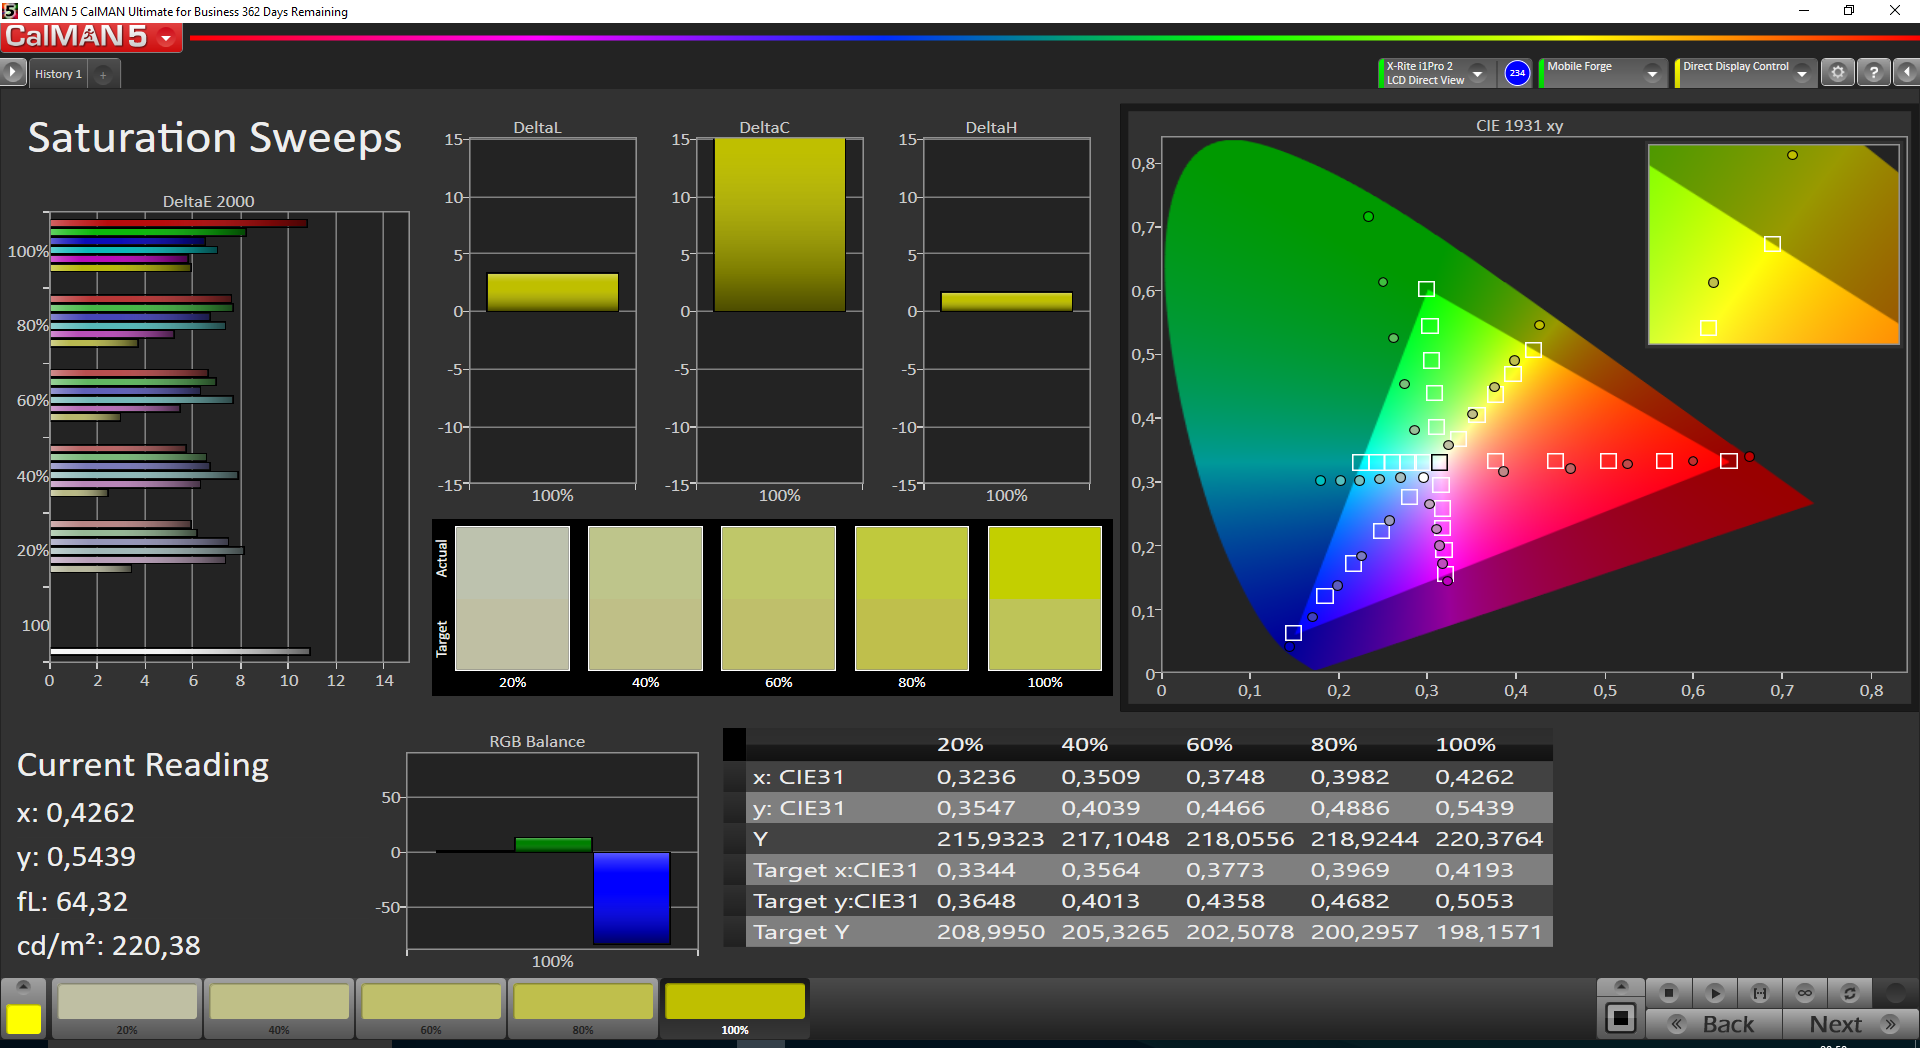
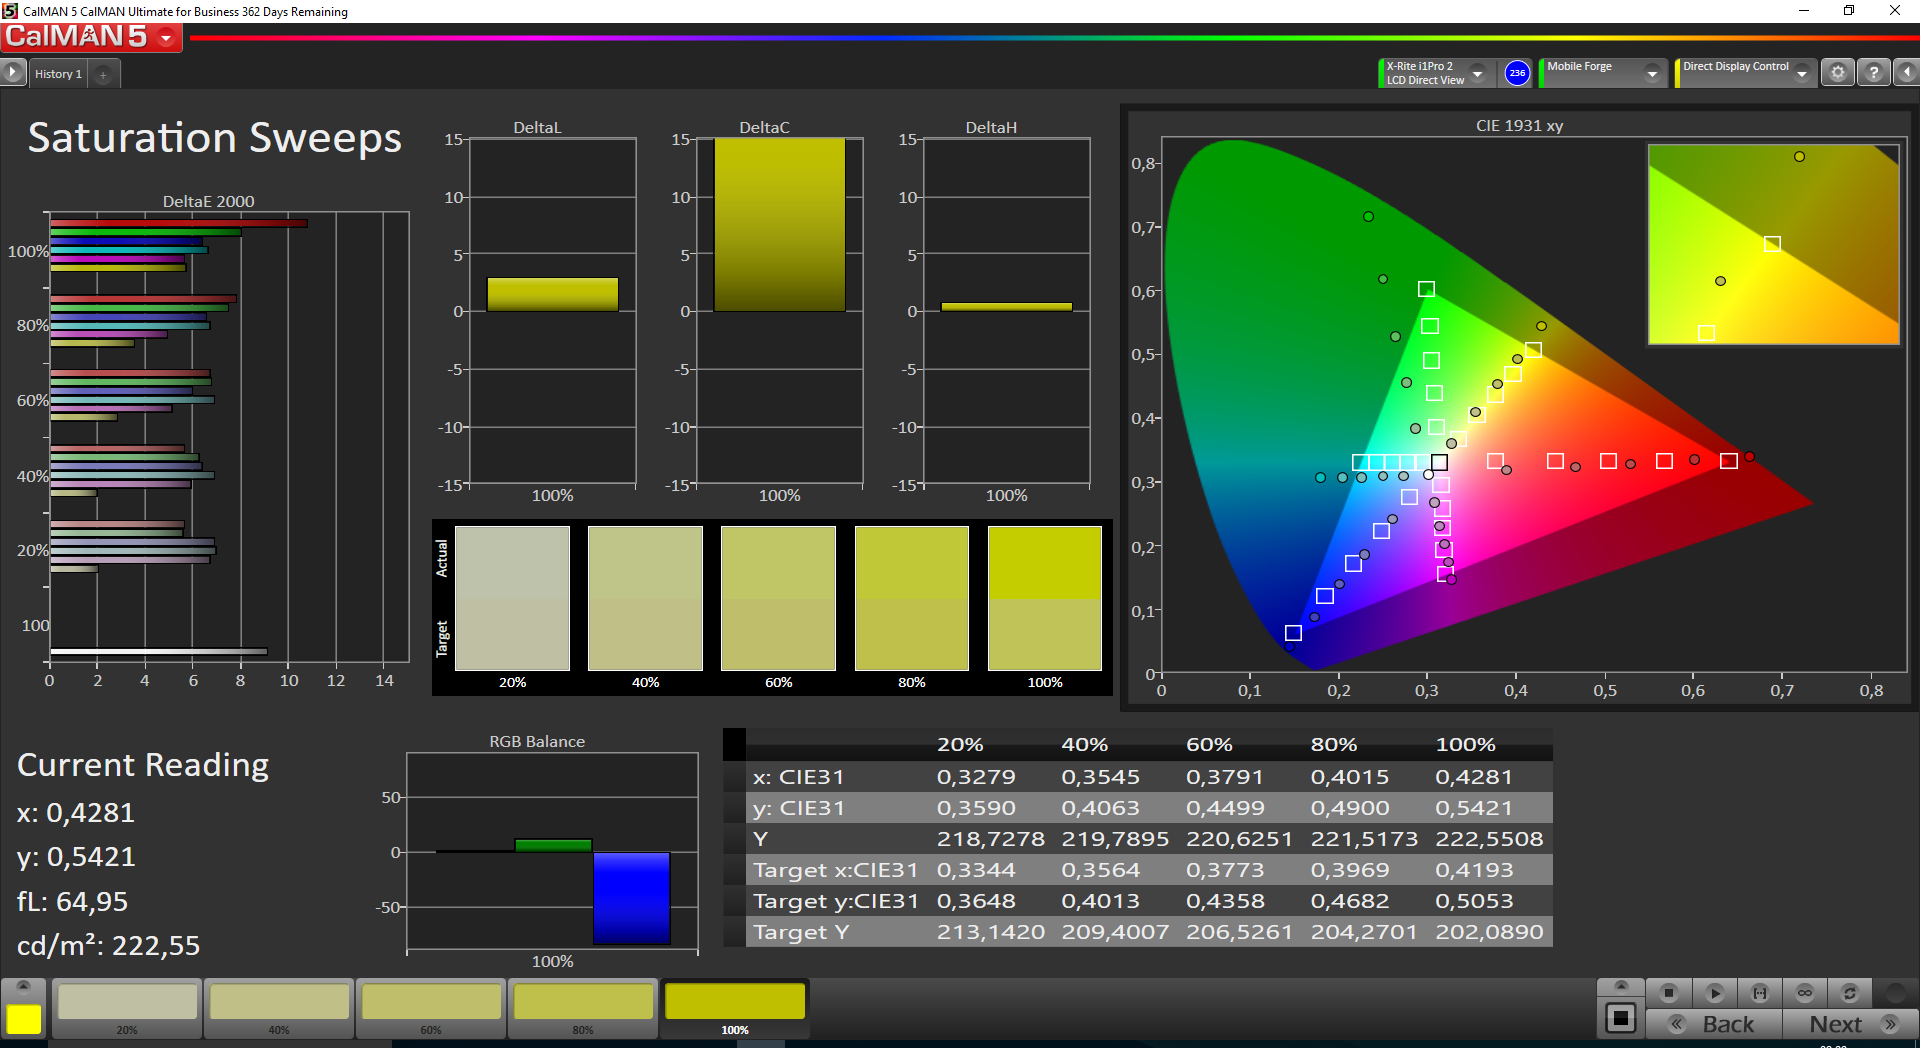
ΔE ColorChecker Calman: 7.1 | ∀{0.5-29.43 Ø4.71}
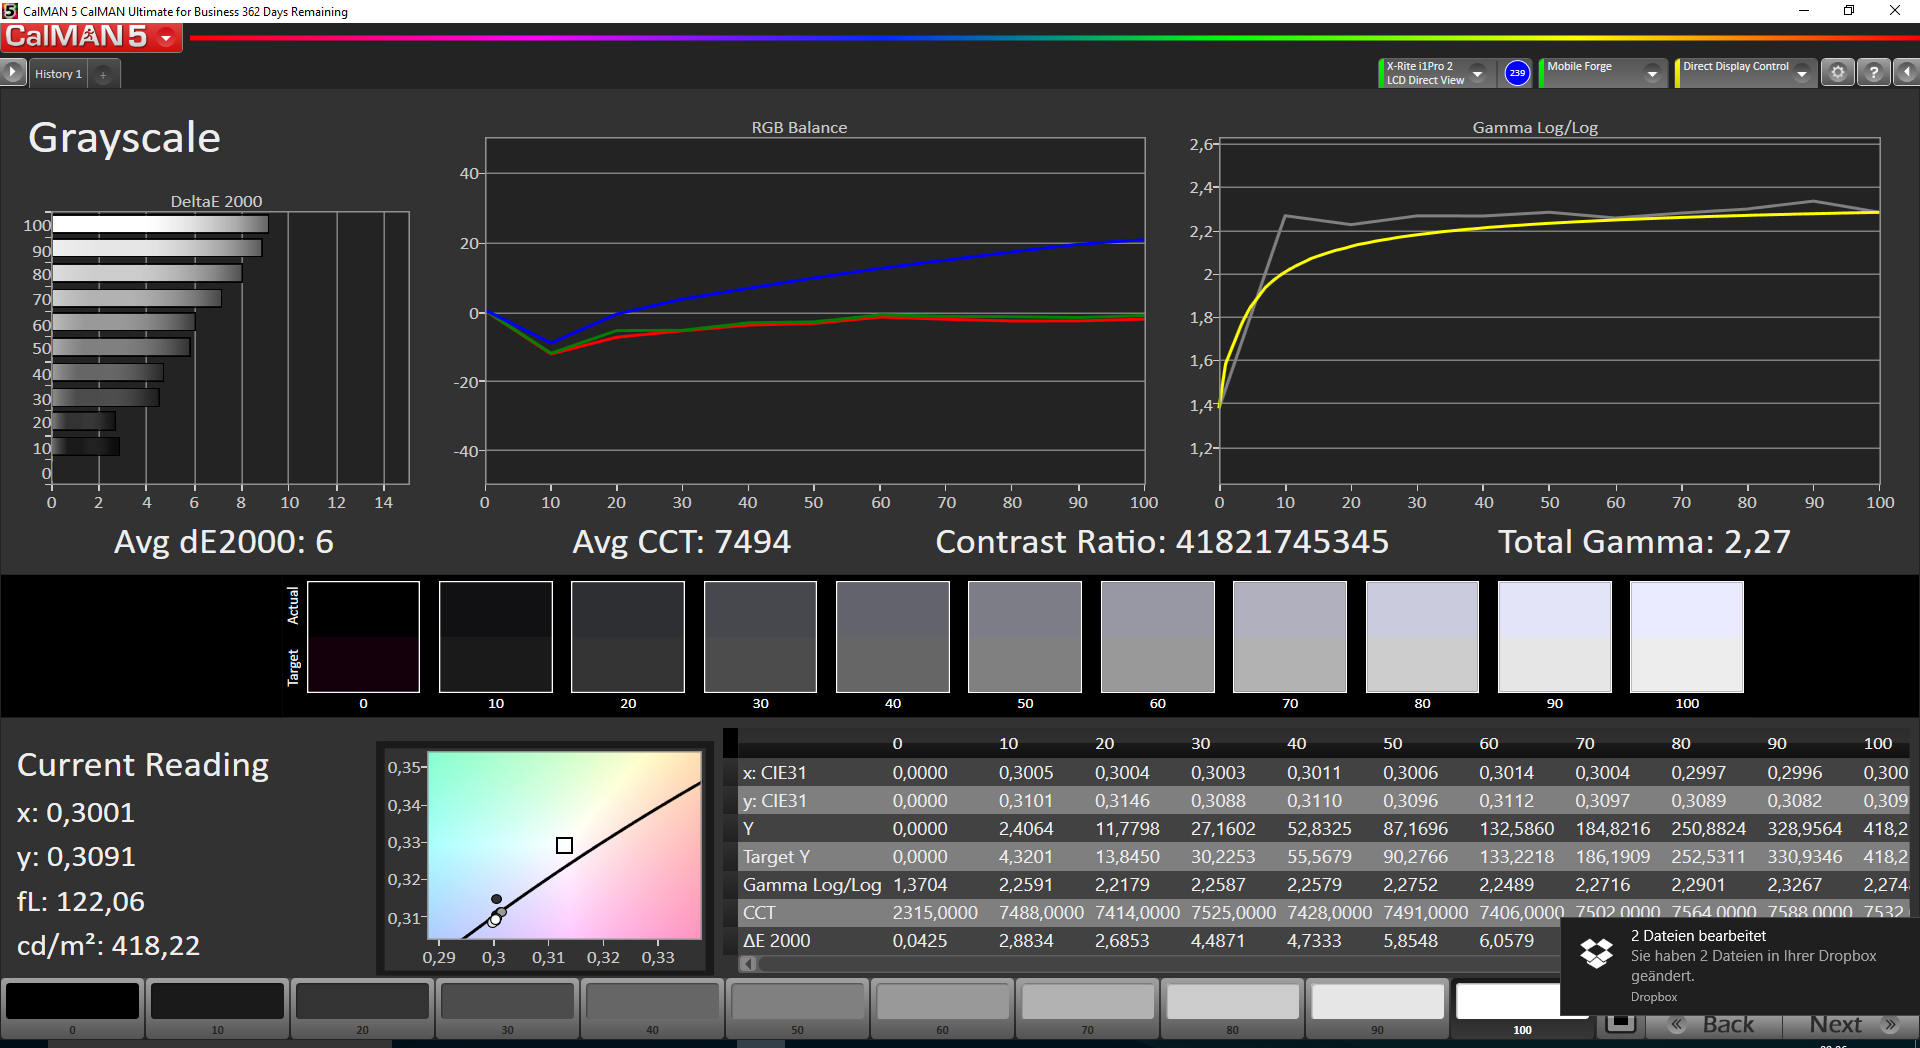
ΔE Greyscale Calman: 6.8 | ∀{0.09-98 Ø4.96}
Gamma: 2.23
CCT: 7866 K
| OnePlus 3T Optic-AMOLED, 1920x1080, 5.5" | Apple iPhone 7 IPS, 1334x750, 4.7" | HTC 10 Super LCD 5, 2560x1440, 5.2" | Huawei P9 IPS-NEO, JDI, 1920x1080, 5.2" | OnePlus 3 Optic-AMOLED, 1920x1080, 5.5" | Samsung Galaxy S7 SAMOLED, 2560x1440, 5.1" | |
|---|---|---|---|---|---|---|
| Screen | 50% | 31% | 33% | 19% | 35% | |
| Brightness middle (cd/m²) | 421 | 556 32% | 445 6% | 582 38% | 419 0% | 350 -17% |
| Brightness (cd/m²) | 430 | 519 21% | 434 1% | 563 31% | 431 0% | 351 -18% |
| Brightness Distribution (%) | 84 | 90 7% | 93 11% | 91 8% | 84 0% | 98 17% |
| Black Level * (cd/m²) | 0.34 | 0.36 | 0.38 | |||
| Colorchecker dE 2000 * | 7.1 | 1.3 82% | 2.8 61% | 4.4 38% | 4.1 42% | 2.04 71% |
| Colorchecker dE 2000 max. * | 15.3 | 2.6 83% | 5.8 62% | 7.4 52% | 12 22% | 3.25 79% |
| Greyscale dE 2000 * | 6.8 | 1.9 72% | 3.7 46% | 4.8 29% | 3.3 51% | 1.63 76% |
| Gamma | 2.23 99% | 2.26 97% | 2.31 95% | 2.2 100% | 2.1 105% | 2.07 106% |
| CCT | 7866 83% | 6818 95% | 7164 91% | 6175 105% | 6550 99% | 6391 102% |
| Contrast (:1) | 1635 | 1236 | 1532 | |||
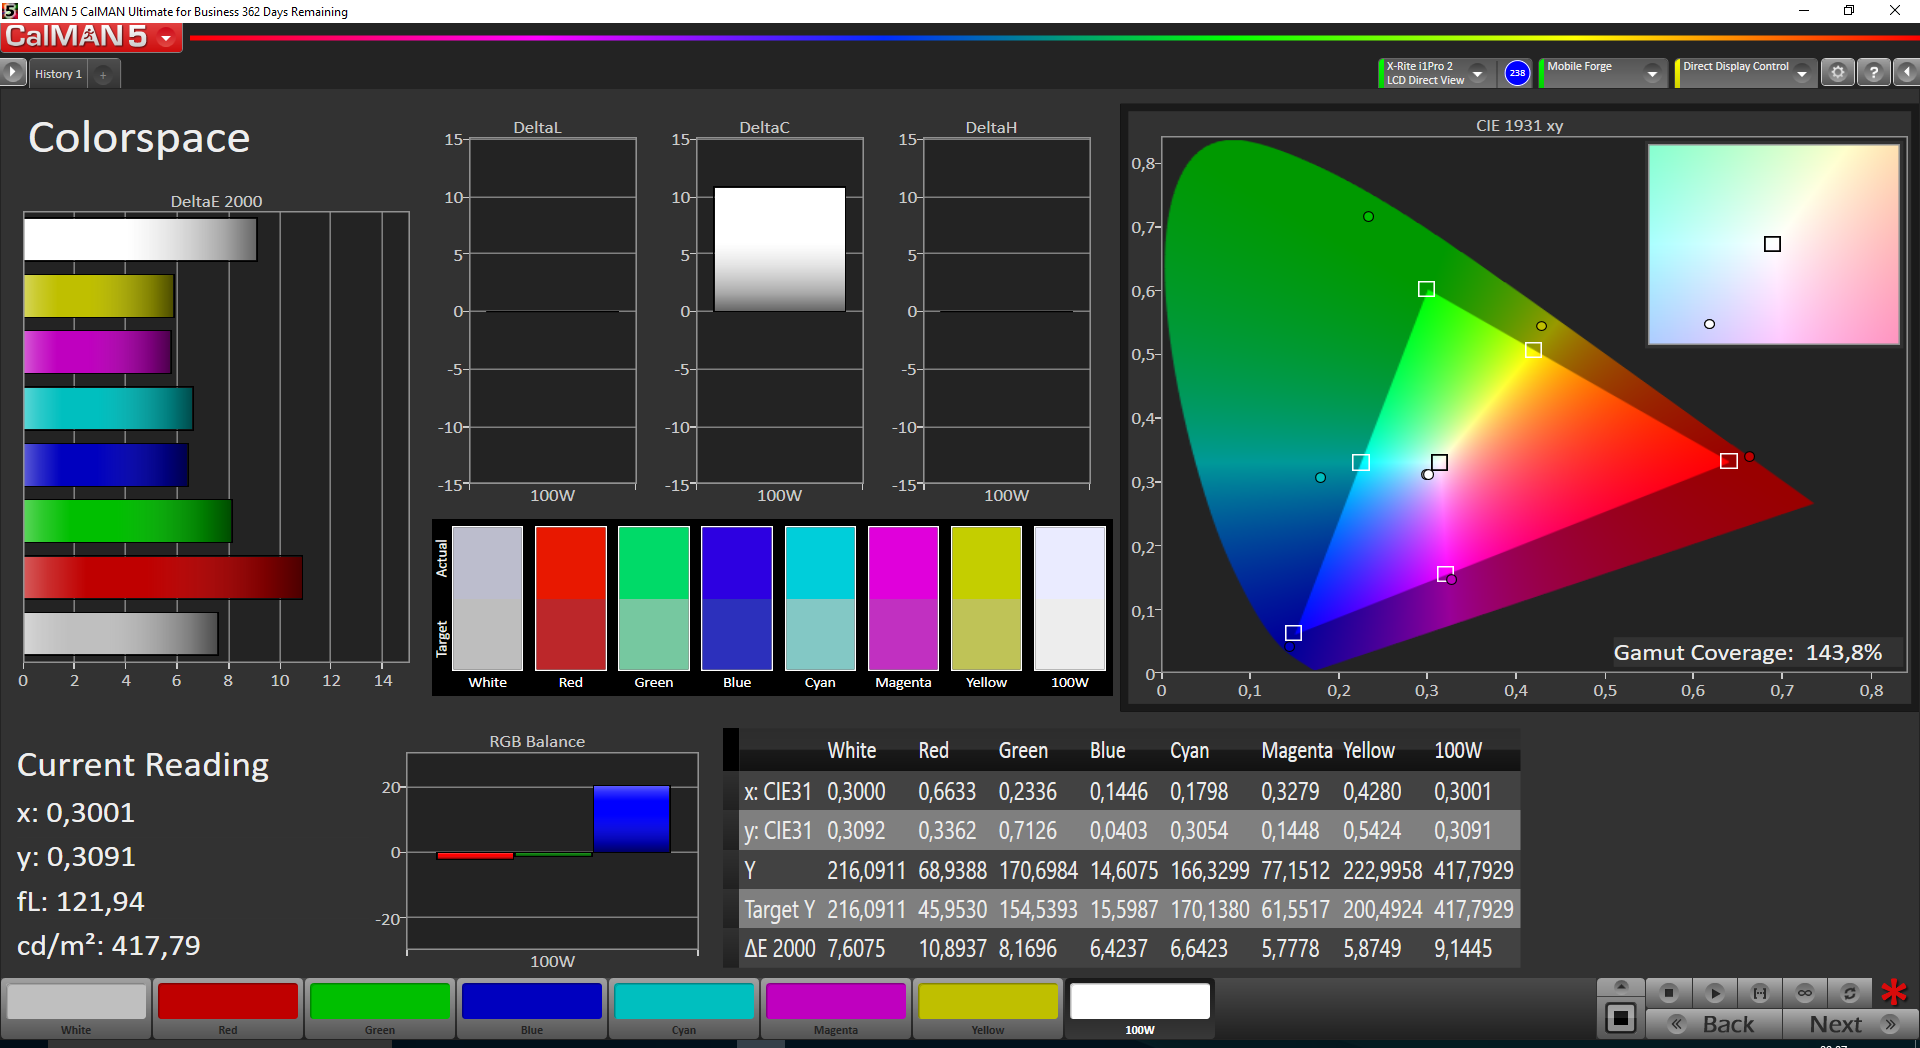
| Color Space (Percent of AdobeRGB 1998) (%) | 63.15 | 77.78 | 89.38 | 86.86 | ||
| Color Space (Percent of sRGB) (%) | 99.71 | 99.44 | 100 | 99.35 |
* ... smaller is better
Screen Flickering / PWM (Pulse-Width Modulation)
| Screen flickering / PWM detected | 244 Hz | 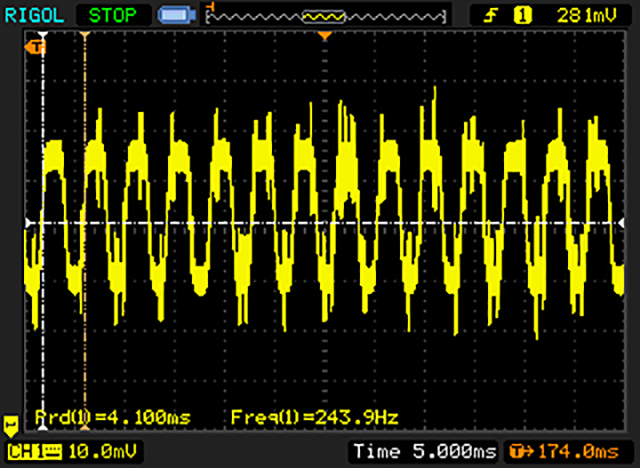 | |
The display backlight flickers at 244 Hz (worst case, e.g., utilizing PWM) . The frequency of 244 Hz is relatively low, so sensitive users will likely notice flickering and experience eyestrain at the stated brightness setting and below. In comparison: 52 % of all tested devices do not use PWM to dim the display. If PWM was detected, an average of 7754 (minimum: 5 - maximum: 343500) Hz was measured. | |||
Display Response Times
| ↔ Response Time Black to White | ||
|---|---|---|
| 11 ms ... rise ↗ and fall ↘ combined | ↗ 6 ms rise | 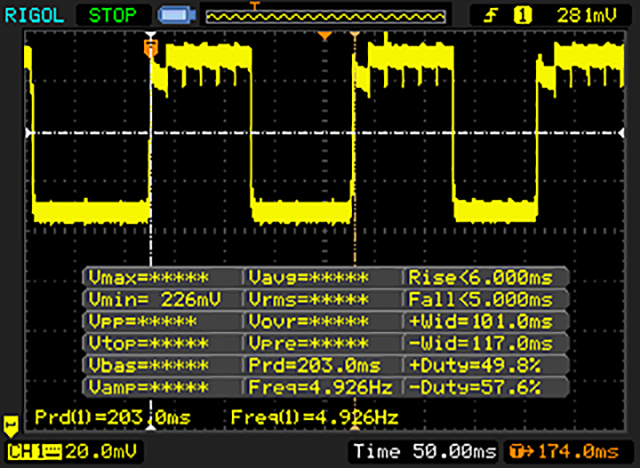 |
| ↘ 5 ms fall | ||
| The screen shows good response rates in our tests, but may be too slow for competitive gamers. In comparison, all tested devices range from 0.1 (minimum) to 240 (maximum) ms. » 30 % of all devices are better. This means that the measured response time is better than the average of all tested devices (19.8 ms). | ||
| ↔ Response Time 50% Grey to 80% Grey | ||
| 11 ms ... rise ↗ and fall ↘ combined | ↗ 6 ms rise | 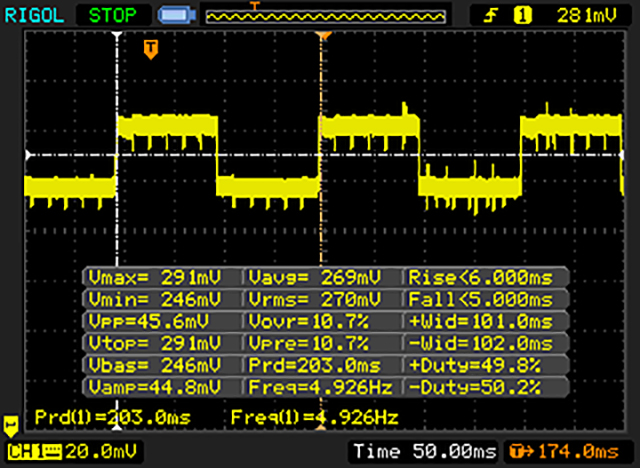 |
| ↘ 5 ms fall | ||
| The screen shows good response rates in our tests, but may be too slow for competitive gamers. In comparison, all tested devices range from 0.165 (minimum) to 636 (maximum) ms. » 25 % of all devices are better. This means that the measured response time is better than the average of all tested devices (31 ms). | ||
Performance
| AnTuTu v6 - Total Score (sort by value) | |
| OnePlus 3T | |
| Apple iPhone 7 | |
| HTC 10 | |
| Huawei P9 | |
| OnePlus 3 | |
| Samsung Galaxy S7 | |
| Geekbench 4.0 | |
| 64 Bit Single-Core Score (sort by value) | |
| OnePlus 3T | |
| Apple iPhone 7 | |
| Huawei P9 | |
| OnePlus 3 | |
| 64 Bit Multi-Core Score (sort by value) | |
| OnePlus 3T | |
| Apple iPhone 7 | |
| Huawei P9 | |
| OnePlus 3 | |
| GFXBench (DX / GLBenchmark) 2.7 | |
| T-Rex Onscreen (sort by value) | |
| OnePlus 3T | |
| Apple iPhone 7 | |
| HTC 10 | |
| Huawei P9 | |
| OnePlus 3 | |
| Samsung Galaxy S7 | |
| 1920x1080 T-Rex Offscreen (sort by value) | |
| OnePlus 3T | |
| Apple iPhone 7 | |
| HTC 10 | |
| Huawei P9 | |
| OnePlus 3 | |
| Samsung Galaxy S7 | |
| GFXBench 3.0 | |
| on screen Manhattan Onscreen OGL (sort by value) | |
| OnePlus 3T | |
| Apple iPhone 7 | |
| HTC 10 | |
| Huawei P9 | |
| OnePlus 3 | |
| Samsung Galaxy S7 | |
| 1920x1080 1080p Manhattan Offscreen (sort by value) | |
| OnePlus 3T | |
| Apple iPhone 7 | |
| HTC 10 | |
| Huawei P9 | |
| OnePlus 3 | |
| Samsung Galaxy S7 | |
| GFXBench 3.1 | |
| on screen Manhattan ES 3.1 Onscreen (sort by value) | |
| OnePlus 3T | |
| Apple iPhone 7 | |
| HTC 10 | |
| Huawei P9 | |
| OnePlus 3 | |
| Samsung Galaxy S7 | |
| 1920x1080 Manhattan ES 3.1 Offscreen (sort by value) | |
| OnePlus 3T | |
| Apple iPhone 7 | |
| HTC 10 | |
| Huawei P9 | |
| OnePlus 3 | |
| Samsung Galaxy S7 | |
| PCMark for Android - Work performance score (sort by value) | |
| OnePlus 3T | |
| HTC 10 | |
| Huawei P9 | |
| OnePlus 3 | |
| Samsung Galaxy S7 | |
| Octane V2 - Total Score (sort by value) | |
| OnePlus 3T | |
| Apple iPhone 7 | |
| HTC 10 | |
| Huawei P9 | |
| OnePlus 3 | |
| Samsung Galaxy S7 | |
| Mozilla Kraken 1.1 - Total (sort by value) | |
| OnePlus 3T | |
| Apple iPhone 7 | |
| HTC 10 | |
| Huawei P9 | |
| OnePlus 3 | |
| Samsung Galaxy S7 | |
| WebXPRT 2015 - Overall (sort by value) | |
| OnePlus 3T | |
| Apple iPhone 7 | |
| HTC 10 | |
| Huawei P9 | |
| OnePlus 3 | |
| Samsung Galaxy S7 | |
| JetStream 1.1 - 1.1 Total (sort by value) | |
| OnePlus 3T | |
| Apple iPhone 7 | |
| HTC 10 | |
| Huawei P9 | |
| OnePlus 3 | |
| Samsung Galaxy S7 | |
* ... smaller is better
| OnePlus 3T | Apple iPhone 7 | HTC 10 | Huawei P9 | OnePlus 3 | Samsung Galaxy S7 | |
|---|---|---|---|---|---|---|
| AndroBench 3-5 | -56% | -49% | -19% | -28% | ||
| Sequential Read 256KB (MB/s) | 436.4 | 275.1 -37% | 281.3 -36% | 408.7 -6% | 483.8 11% | |
| Sequential Write 256KB (MB/s) | 165.3 | 115.6 -30% | 72.2 -56% | 153.3 -7% | 145.7 -12% | |
| Random Read 4KB (MB/s) | 123.6 | 29.92 -76% | 39 -68% | 137.6 11% | 85.9 -31% | |
| Random Write 4KB (MB/s) | 74.4 | 15.89 -79% | 47.45 -36% | 18.23 -75% | 16.01 -78% | |
| Sequential Read 256KB SDCard (MB/s) | 83.3 | 55 | 72.3 | |||
| Sequential Write 256KB SDCard (MB/s) | 65.4 | 24.83 | 53.6 |
| Asphalt 8: Airborne | |||
| Settings | Value | ||
| high | 30 fps | ||
| very low | 30 fps | ||
| Dead Trigger 2 | |||
| Settings | Value | ||
| high | 59 fps | ||
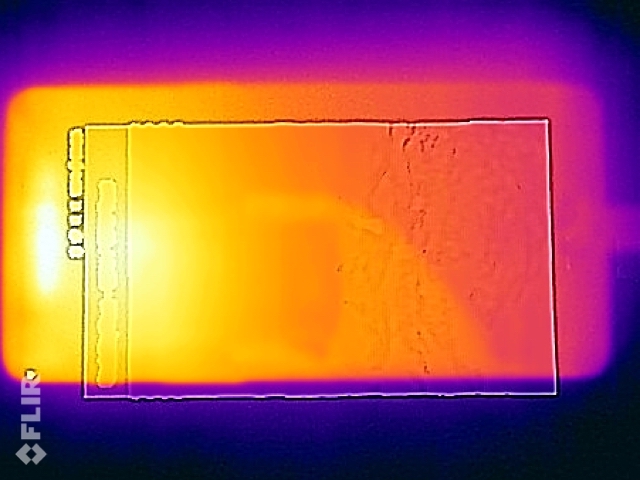
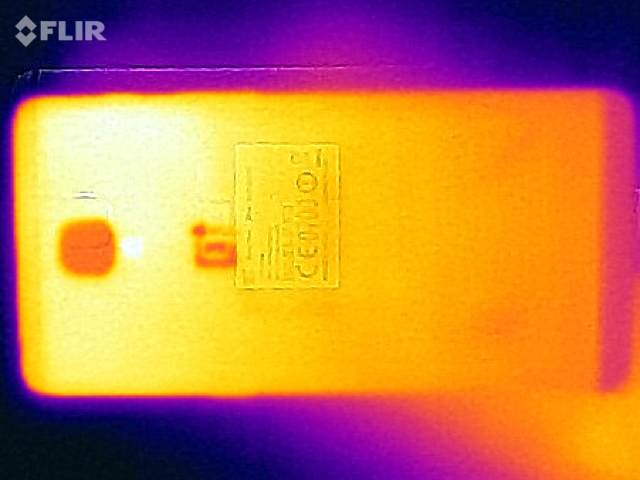
Emissions
(+) The maximum temperature on the upper side is 39.4 °C / 103 F, compared to the average of 35.3 °C / 96 F, ranging from 21.9 to 247 °C for the class Smartphone.
(+) The bottom heats up to a maximum of 37.5 °C / 100 F, compared to the average of 34 °C / 93 F
(+) In idle usage, the average temperature for the upper side is 28.8 °C / 84 F, compared to the device average of 33 °C / 91 F.
OnePlus 3T audio analysis
(+) | speakers can play relatively loud (84.3 dB)
Bass 100 - 315 Hz
(-) | nearly no bass - on average 24.6% lower than median
(±) | linearity of bass is average (7.2% delta to prev. frequency)
Mids 400 - 2000 Hz
(+) | balanced mids - only 4.6% away from median
(+) | mids are linear (4.6% delta to prev. frequency)
Highs 2 - 16 kHz
(±) | higher highs - on average 7.1% higher than median
(+) | highs are linear (2.8% delta to prev. frequency)
Overall 100 - 16.000 Hz
(±) | linearity of overall sound is average (20.9% difference to median)
Compared to same class
» 39% of all tested devices in this class were better, 8% similar, 53% worse
» The best had a delta of 11%, average was 34%, worst was 134%
Compared to all devices tested
» 57% of all tested devices were better, 8% similar, 35% worse
» The best had a delta of 4%, average was 23%, worst was 134%
OnePlus 3 audio analysis
(+) | speakers can play relatively loud (88.6 dB)
Bass 100 - 315 Hz
(-) | nearly no bass - on average 30.9% lower than median
(±) | linearity of bass is average (11.3% delta to prev. frequency)
Mids 400 - 2000 Hz
(+) | balanced mids - only 4.2% away from median
(+) | mids are linear (4.9% delta to prev. frequency)
Highs 2 - 16 kHz
(±) | higher highs - on average 5.6% higher than median
(+) | highs are linear (3.2% delta to prev. frequency)
Overall 100 - 16.000 Hz
(±) | linearity of overall sound is average (21.8% difference to median)
Compared to same class
» 45% of all tested devices in this class were better, 8% similar, 47% worse
» The best had a delta of 11%, average was 34%, worst was 134%
Compared to all devices tested
» 62% of all tested devices were better, 7% similar, 31% worse
» The best had a delta of 4%, average was 23%, worst was 134%
Apple iPhone 7 audio analysis
(+) | speakers can play relatively loud (83.1 dB)
Bass 100 - 315 Hz
(-) | nearly no bass - on average 21.8% lower than median
(±) | linearity of bass is average (9.5% delta to prev. frequency)
Mids 400 - 2000 Hz
(+) | balanced mids - only 4.3% away from median
(+) | mids are linear (6% delta to prev. frequency)
Highs 2 - 16 kHz
(±) | higher highs - on average 5.9% higher than median
(±) | linearity of highs is average (8.2% delta to prev. frequency)
Overall 100 - 16.000 Hz
(±) | linearity of overall sound is average (20.9% difference to median)
Compared to same class
» 39% of all tested devices in this class were better, 8% similar, 53% worse
» The best had a delta of 11%, average was 34%, worst was 134%
Compared to all devices tested
» 57% of all tested devices were better, 8% similar, 35% worse
» The best had a delta of 4%, average was 23%, worst was 134%
Frequency Comparison (Checkboxes select/deselectable!)
Energy Management
| Off / Standby | |
| Idle | |
| Load |
|
Key:
min: | |
| OnePlus 3T 3400 mAh | Apple iPhone 7 1960 mAh | HTC 10 3000 mAh | Huawei P9 3000 mAh | OnePlus 3 3000 mAh | Samsung Galaxy S7 3000 mAh | |
|---|---|---|---|---|---|---|
| Power Consumption | 28% | 0% | 3% | 15% | 26% | |
| Idle Minimum * (Watt) | 0.61 | 0.54 11% | 0.68 -11% | 0.77 -26% | 0.57 7% | 0.68 -11% |
| Idle Average * (Watt) | 1.77 | 1.51 15% | 1.49 16% | 2.36 -33% | 1.24 30% | 1.02 42% |
| Idle Maximum * (Watt) | 1.81 | 1.54 15% | 1.91 -6% | 2.37 -31% | 1.36 25% | 1.14 37% |
| Load Average * (Watt) | 6.67 | 3.75 44% | 7.4 -11% | 3.09 54% | 5.92 11% | 4.73 29% |
| Load Maximum * (Watt) | 10.98 | 5.01 54% | 9.71 12% | 5.35 51% | 10.53 4% | 7.16 35% |
* ... smaller is better
| OnePlus 3T 3400 mAh | Apple iPhone 7 1960 mAh | HTC 10 3000 mAh | Huawei P9 3000 mAh | OnePlus 3 3000 mAh | Samsung Galaxy S7 3000 mAh | |
|---|---|---|---|---|---|---|
| Battery runtime | -9% | -19% | -9% | 16% | 4% | |
| Reader / Idle (h) | 23.7 | 29.5 24% | 21.2 -11% | 25.2 6% | 22.3 -6% | 30.2 27% |
| H.264 (h) | 13.5 | 12 -11% | 10.8 -20% | 9.5 -30% | 14.1 4% | 14.9 10% |
| WiFi v1.3 (h) | 8.2 | 8.6 5% | 6.9 -16% | 9.5 16% | 14 71% | 7.6 -7% |
| Load (h) | 4.7 | 2.1 -55% | 3.4 -28% | 3.4 -28% | 4.5 -4% | 4 -15% |
Pros
Cons
一加3T是一加3名副其实的继承者。然而,由于之前机型已经是最好的高端安卓手机之一了,对制造商来说它并不算是个挑战。而一加3T的改动很小,这同样是问题所在。
成功的更新:一加3T仅仅是一加3的一个小升级,所以它和旧款一样是最好的高端智能手机之一。
如果您已经拥有一加3,则没有必要购买一加3T,而其他情况下可以选购。终于推出的128GB版本可能会给消费者不小的惊喜。在一加在线商店里,它仅比64GB版本贵40欧元(约42美元),由于缺少microSD卡读卡器,这显得很值得玩味。略快的系统芯片是个不错的改进,但实际上由于温度相似,它们的实际性能表现区别很小。
一加为新款3T配备了更大容量的电池,但是由于功耗更高,它的续航仍然和一加3差不多。我们不想夸大无线连接测试的结果,毕竟之前的型号在一开始也存在着同样的问题,这个问题在一个OxygenOS的更新中被修复。据称安卓7的更新将会在12月发布。
注:本文是基于完整评测的缩减版本,阅读完整的英文评测,请点击这里。
OnePlus 3T
- 12/12/2016 v6 (old)
Manuel Masiero
Price comparison
