戴尔 Inspiron 15 5568 变形本简短评测
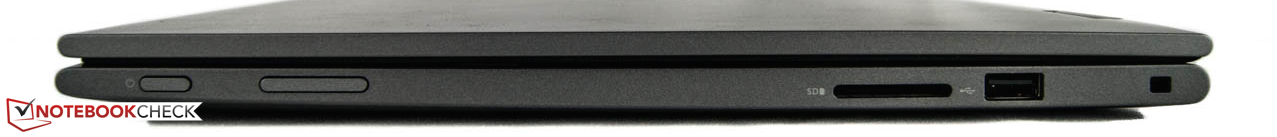


| SD Card Reader | |
| average JPG Copy Test (av. of 3 runs) | |
| Dell XPS 13 2016 9350 (FHD, i7-6560U) | |
| Lenovo Yoga 510-15ISK | |
| HP Envy 15-w103ng x360 | |
| Dell Inspiron 15 5568 | |
| Acer Aspire R14 R5-471T-79GQ | |
| Lenovo Ideapad 500-15ISK 80NT005WGE | |
| maximum AS SSD Seq Read Test (1GB) | |
| Dell XPS 13 2016 9350 (FHD, i7-6560U) | |
| HP Envy 15-w103ng x360 | |
| Lenovo Yoga 510-15ISK | |
| Dell Inspiron 15 5568 | |
| Lenovo Ideapad 500-15ISK 80NT005WGE | |
| Acer Aspire R14 R5-471T-79GQ | |
| Networking | |
| iperf Server (receive) TCP 1 m | |
| Dell Inspiron 15 5568 | |
| HP x2 210 G1 | |
| iperf Client (transmit) TCP 1 m | |
| Dell Inspiron 15 5568 | |
| HP x2 210 G1 | |
| |||||||||||||||||||||||||
Brightness Distribution: 85 %
Center on Battery: 266 cd/m²
Contrast: 1023:1 (Black: 0.26 cd/m²)
ΔE ColorChecker Calman: 4.98 | ∀{0.5-29.43 Ø4.71}
ΔE Greyscale Calman: 2.68 | ∀{0.09-98 Ø4.96}
57% sRGB (Argyll 1.6.3 3D)
36% AdobeRGB 1998 (Argyll 1.6.3 3D)
39.3% AdobeRGB 1998 (Argyll 3D)
57.1% sRGB (Argyll 3D)
38.04% Display P3 (Argyll 3D)
Gamma: 2.27
CCT: 6583 K
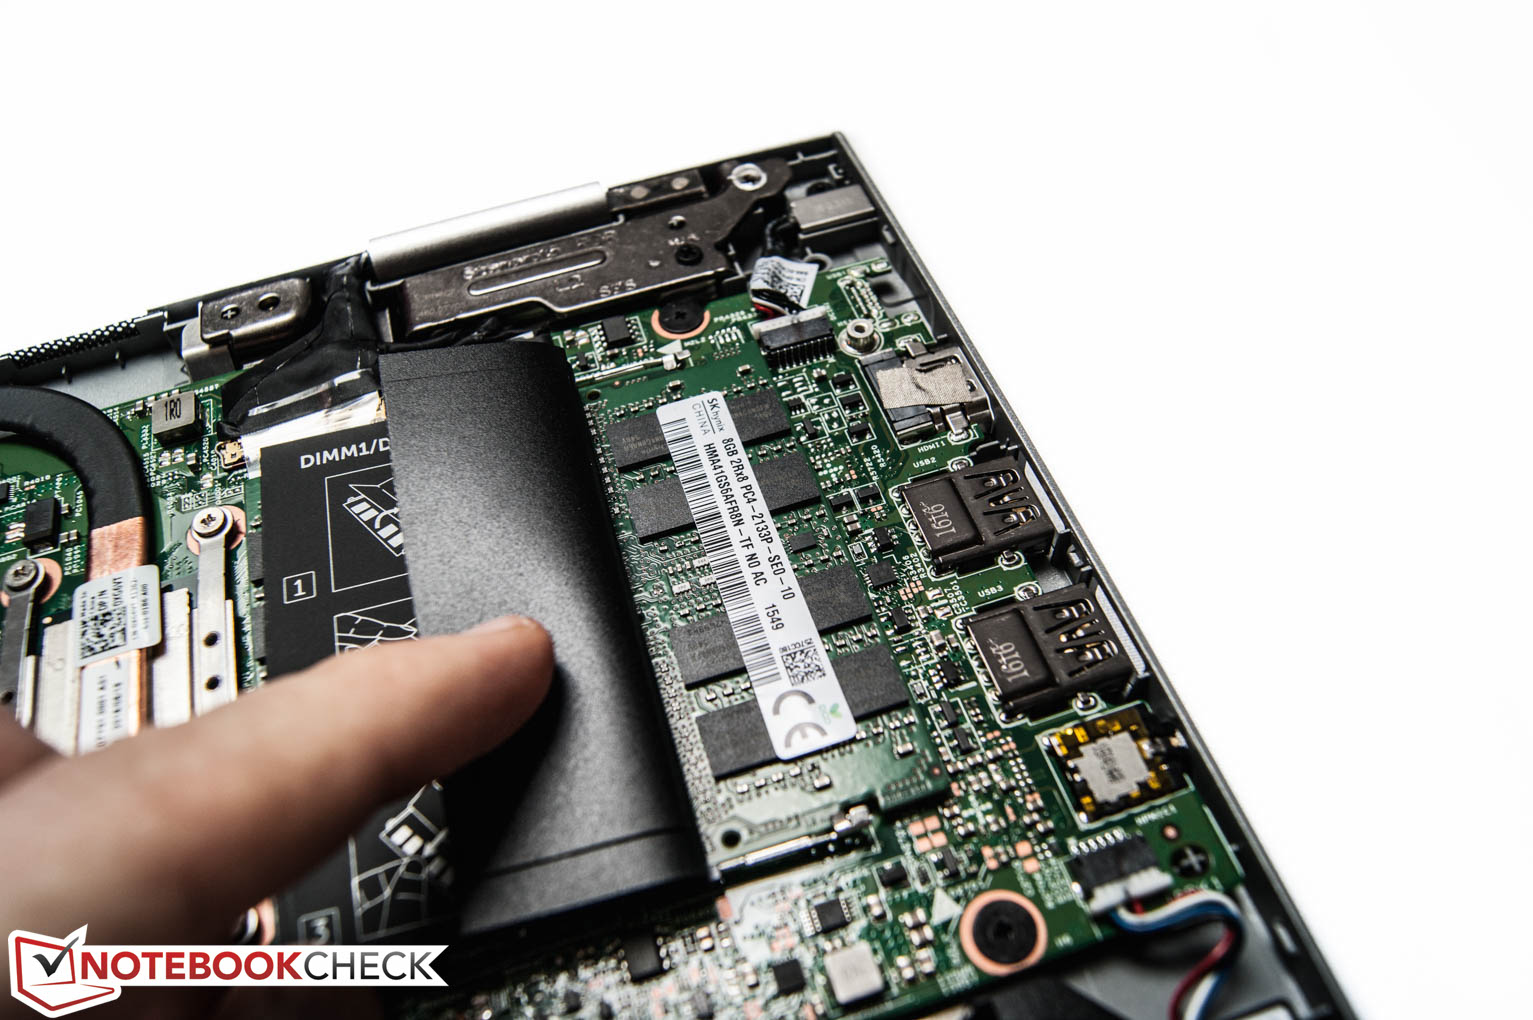
| Dell Inspiron 15 5568 HD Graphics 520, 6500U, Toshiba THNSNK256GCS8 | HP Spectre x360 15-ap012dx HD Graphics 520, 6200U, Sandisk X300 SD7SN6S-256G-1006 | HP Envy 15-w103ng x360 GeForce 930M, 6200U, Samsung SSD PM851 256 GB MZNTE256HMHP | Lenovo Yoga 510-15ISK Radeon R7 M460, 6200U, Liteonit CV3-DE256 | Acer Aspire R14 R5-471T-79GQ HD Graphics 520, 6500U | |
|---|---|---|---|---|---|
| Display | 61% | 5% | 12% | -3% | |
| Display P3 Coverage (%) | 38.04 | 62.8 65% | 39.97 5% | 42.58 12% | 36.92 -3% |
| sRGB Coverage (%) | 57.1 | 88.2 54% | 59.8 5% | 63.9 12% | 55.4 -3% |
| AdobeRGB 1998 Coverage (%) | 39.3 | 63.9 63% | 41.32 5% | 43.99 12% | 38.15 -3% |
| Response Times | -3% | -8% | -22% | -63% | |
| Response Time Grey 50% / Grey 80% * (ms) | 42 ? | 32.8 ? 22% | 37 ? 12% | 43.2 ? -3% | 80 ? -90% |
| Response Time Black / White * (ms) | 22 ? | 28 ? -27% | 28 ? -27% | 30.8 ? -40% | 30 ? -36% |
| PWM Frequency (Hz) | |||||
| Screen | 4% | -30% | 4% | -7% | |
| Brightness middle (cd/m²) | 266 | 298 12% | 208 -22% | 254 -5% | 215 -19% |
| Brightness (cd/m²) | 249 | 295 18% | 205 -18% | 230 -8% | 203 -18% |
| Brightness Distribution (%) | 85 | 88 4% | 80 -6% | 86 1% | 85 0% |
| Black Level * (cd/m²) | 0.26 | 0.57 -119% | 0.26 -0% | 0.26 -0% | 0.25 4% |
| Contrast (:1) | 1023 | 523 -49% | 800 -22% | 977 -4% | 860 -16% |
| Colorchecker dE 2000 * | 4.98 | 4.43 11% | 6.97 -40% | 4.23 15% | 5.04 -1% |
| Colorchecker dE 2000 max. * | 11.82 | 6.62 44% | 9.5 20% | 10.6 10% | |
| Greyscale dE 2000 * | 2.68 | 2.45 9% | 7.37 -175% | 2.87 -7% | 3.3 -23% |
| Gamma | 2.27 97% | 2.45 90% | 2.34 94% | 2.35 94% | 2.35 94% |
| CCT | 6583 99% | 6326 103% | 6823 95% | 5965 109% | 6370 102% |
| Color Space (Percent of AdobeRGB 1998) (%) | 36 | 57.2 59% | 38 6% | 40.35 12% | 35 -3% |
| Color Space (Percent of sRGB) (%) | 57 | 87.8 54% | 59 4% | 63.48 11% | 55 -4% |
| Total Average (Program / Settings) | 21% /
15% | -11% /
-20% | -2% /
2% | -24% /
-14% |
* ... smaller is better
Display Response Times
| ↔ Response Time Black to White | ||
|---|---|---|
| 22 ms ... rise ↗ and fall ↘ combined | ↗ 6 ms rise | 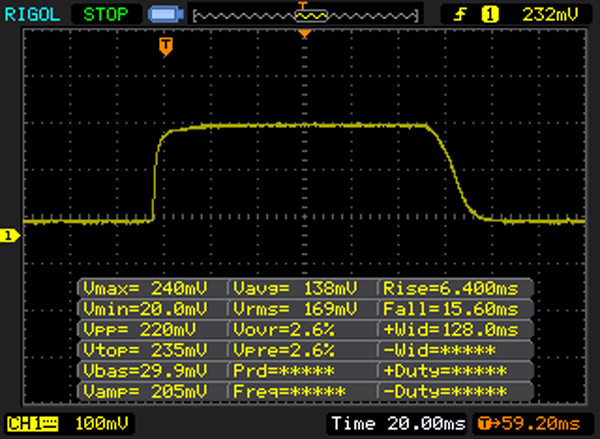 |
| ↘ 16 ms fall | ||
| The screen shows good response rates in our tests, but may be too slow for competitive gamers. In comparison, all tested devices range from 0.1 (minimum) to 240 (maximum) ms. » 49 % of all devices are better. This means that the measured response time is worse than the average of all tested devices (19.8 ms). | ||
| ↔ Response Time 50% Grey to 80% Grey | ||
| 42 ms ... rise ↗ and fall ↘ combined | ↗ 19 ms rise | 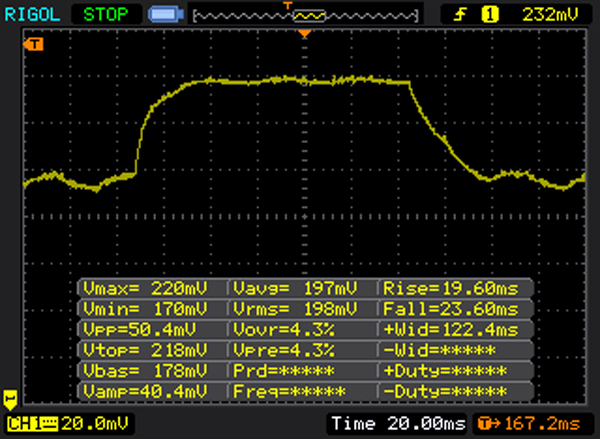 |
| ↘ 23 ms fall | ||
| The screen shows slow response rates in our tests and will be unsatisfactory for gamers. In comparison, all tested devices range from 0.165 (minimum) to 636 (maximum) ms. » 67 % of all devices are better. This means that the measured response time is worse than the average of all tested devices (30.9 ms). | ||
Screen Flickering / PWM (Pulse-Width Modulation)
| Screen flickering / PWM not detected | ||
In comparison: 52 % of all tested devices do not use PWM to dim the display. If PWM was detected, an average of 7748 (minimum: 5 - maximum: 343500) Hz was measured. | ||
| Cinebench R15 | |
| CPU Multi 64Bit | |
| Lenovo Ideapad 500-15ISK 80NT005WGE | |
| Acer Aspire R14 R5-471T-79GQ | |
| HP Spectre x360 15-ap012dx | |
| Dell Inspiron 15 5568 | |
| HP Envy 15-w103ng x360 | |
| Lenovo Yoga 510-15ISK | |
| CPU Single 64Bit | |
| Lenovo Ideapad 500-15ISK 80NT005WGE | |
| Acer Aspire R14 R5-471T-79GQ | |
| Dell Inspiron 15 5568 | |
| HP Spectre x360 15-ap012dx | |
| HP Envy 15-w103ng x360 | |
| Lenovo Yoga 510-15ISK | |
| PCMark 8 - Home Score Accelerated v2 | |
| Lenovo Yoga 510-15ISK | |
| Dell Inspiron 15 5568 | |
| Lenovo Ideapad 500-15ISK 80NT005WGE | |
| Acer Aspire R14 R5-471T-79GQ | |
| HP Envy 15-w103ng x360 | |
| HP Spectre x360 15-ap012dx | |
| PCMark 8 Home Score Accelerated v2 | 3607 points | |
| PCMark 8 Work Score Accelerated v2 | 4433 points | |
Help | ||
| Dell Inspiron 15 5568 HD Graphics 520, 6500U, Toshiba THNSNK256GCS8 | HP Spectre x360 15-ap012dx HD Graphics 520, 6200U, Sandisk X300 SD7SN6S-256G-1006 | HP Envy 15-w103ng x360 GeForce 930M, 6200U, Samsung SSD PM851 256 GB MZNTE256HMHP | Acer Aspire R14 R5-471T-79GQ HD Graphics 520, 6500U | Lenovo Yoga 510-15ISK Radeon R7 M460, 6200U, Liteonit CV3-DE256 | |
|---|---|---|---|---|---|
| CrystalDiskMark 3.0 | 14% | 13% | -9% | 18% | |
| Read Seq (MB/s) | 458.6 | 475.6 4% | 515 12% | 503 10% | 487 6% |
| Write Seq (MB/s) | 270 | 425 57% | 240.7 -11% | 161.6 -40% | 450.7 67% |
| Read 512 (MB/s) | 397.4 | 258.4 -35% | 391.3 -2% | 319.7 -20% | 384.5 -3% |
| Write 512 (MB/s) | 242 | 318.9 32% | 240 -1% | 161.5 -33% | 356.3 47% |
| Read 4k (MB/s) | 19.88 | 35.48 78% | 27.64 39% | 26.04 31% | 27.05 36% |
| Write 4k (MB/s) | 86.7 | 93 7% | 95.2 10% | 81.6 -6% | 63.7 -27% |
| Read 4k QD32 (MB/s) | 275.3 | 281.2 2% | 367.9 34% | 278.5 1% | 281.5 2% |
| Write 4k QD32 (MB/s) | 197.6 | 138.7 -30% | 239 21% | 161.6 -18% | 232 17% |

| 3DMark 11 - 1280x720 Performance | |
| Lenovo Ideapad 500-15ISK 80NT005WGE | |
| HP Envy 15-w103ng x360 | |
| Lenovo Yoga 510-15ISK | |
| Dell Inspiron 15 5568 | |
| Acer Aspire R14 R5-471T-79GQ | |
| HP Spectre x360 15-ap012dx | |
| 3DMark 11 Performance | 1672 points | |
| 3DMark Cloud Gate Standard Score | 6323 points | |
Help | ||
| Tomb Raider | |
| 1366x768 Normal Preset AA:FX AF:4x | |
| HP Envy 15-w103ng x360 | |
| Dell Inspiron 15 5568 | |
| Lenovo Ideapad 500-15ISK 80NT005WGE | |
| Acer Aspire R14 R5-471T-79GQ | |
| Lenovo Yoga 510-15ISK | |
| Asus ASUSPRO P2530UA-DM0046E | |
| Acer TravelMate P648-M-757N | |
| Lenovo ThinkPad X260-20F6007RGE | |
| 1366x768 High Preset AA:FX AF:8x | |
| HP Envy 15-w103ng x360 | |
| Lenovo Ideapad 500-15ISK 80NT005WGE | |
| Lenovo Yoga 510-15ISK | |
| Dell Inspiron 15 5568 | |
| Asus ASUSPRO P2530UA-DM0046E | |
| Acer Aspire R14 R5-471T-79GQ | |
| Acer TravelMate P648-M-757N | |
| Lenovo ThinkPad X260-20F6007RGE | |
| low | med. | high | ultra | |
|---|---|---|---|---|
| Tomb Raider (2013) | 84.1 | 42.7 | 27.9 | 12.6 |
| BioShock Infinite (2013) | 54.4 | 31.5 | 27.7 | 8.2 |
| Rise of the Tomb Raider (2016) | 17.6 | 10.8 | 6.2 |
Noise level
| Idle |
| 32.8 / 32.8 / 33.8 dB(A) |
| Load |
| 36.3 / 36.3 dB(A) |
 | ||
30 dB silent 40 dB(A) audible 50 dB(A) loud |
||
min: | ||
(+) The maximum temperature on the upper side is 37.2 °C / 99 F, compared to the average of 35.4 °C / 96 F, ranging from 19.6 to 60 °C for the class Convertible.
(-) The bottom heats up to a maximum of 50.6 °C / 123 F, compared to the average of 36.9 °C / 98 F
(+) In idle usage, the average temperature for the upper side is 26.2 °C / 79 F, compared to the device average of 30.3 °C / 87 F.
(+) The palmrests and touchpad are cooler than skin temperature with a maximum of 25.2 °C / 77.4 F and are therefore cool to the touch.
(+) The average temperature of the palmrest area of similar devices was 28 °C / 82.4 F (+2.8 °C / 5 F).
| Off / Standby | |
| Idle | |
| Load |
|
Key:
min: | |
| Dell Inspiron 15 5568 HD Graphics 520, 6500U, Toshiba THNSNK256GCS8 | HP Spectre x360 15-ap012dx HD Graphics 520, 6200U, Sandisk X300 SD7SN6S-256G-1006 | HP Envy 15-w103ng x360 GeForce 930M, 6200U, Samsung SSD PM851 256 GB MZNTE256HMHP | Lenovo Yoga 510-15ISK Radeon R7 M460, 6200U, Liteonit CV3-DE256 | Acer Aspire R14 R5-471T-79GQ HD Graphics 520, 6500U | |
|---|---|---|---|---|---|
| Power Consumption | -45% | -13% | -20% | 4% | |
| Idle Minimum * (Watt) | 4.34 | 6.5 -50% | 4.15 4% | 4 8% | 4 8% |
| Idle Average * (Watt) | 7.5 | 13.3 -77% | 8.2 -9% | 7.5 -0% | 6.6 12% |
| Idle Maximum * (Watt) | 8.4 | 15.1 -80% | 8.2 2% | 8.1 4% | 8.6 -2% |
| Load Average * (Watt) | 30.4 | 30.8 -1% | 34.6 -14% | 40.8 -34% | 30.5 -0% |
| Load Maximum * (Watt) | 32.5 | 38.5 -18% | 48 -48% | 57.3 -76% | 32.2 1% |
* ... smaller is better
| Dell Inspiron 15 5568 HD Graphics 520, 6500U, Toshiba THNSNK256GCS8 | HP Spectre x360 15-ap012dx HD Graphics 520, 6200U, Sandisk X300 SD7SN6S-256G-1006 | HP Envy 15-w103ng x360 GeForce 930M, 6200U, Samsung SSD PM851 256 GB MZNTE256HMHP | Acer Aspire R14 R5-471T-79GQ HD Graphics 520, 6500U | Lenovo Yoga 510-15ISK Radeon R7 M460, 6200U, Liteonit CV3-DE256 | |
|---|---|---|---|---|---|
| Battery runtime | 40% | 32% | 50% | 23% | |
| Reader / Idle (h) | 7.5 | 11.8 57% | 12.2 63% | ||
| H.264 (h) | 5 | 5.6 12% | |||
| WiFi v1.3 (h) | 5 | 7.2 44% | 6.6 32% | 7.5 50% | 5.6 12% |
| Load (h) | 1.6 | 1.9 19% | 1.7 6% |
Pros
Cons
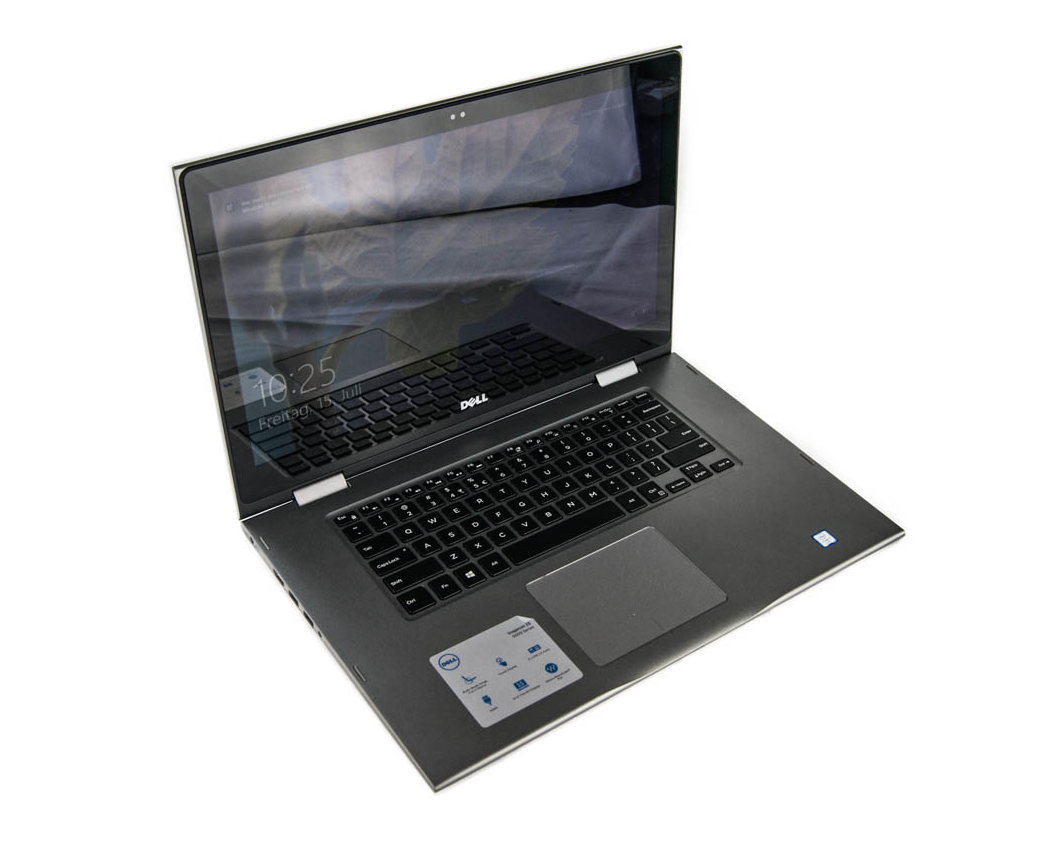
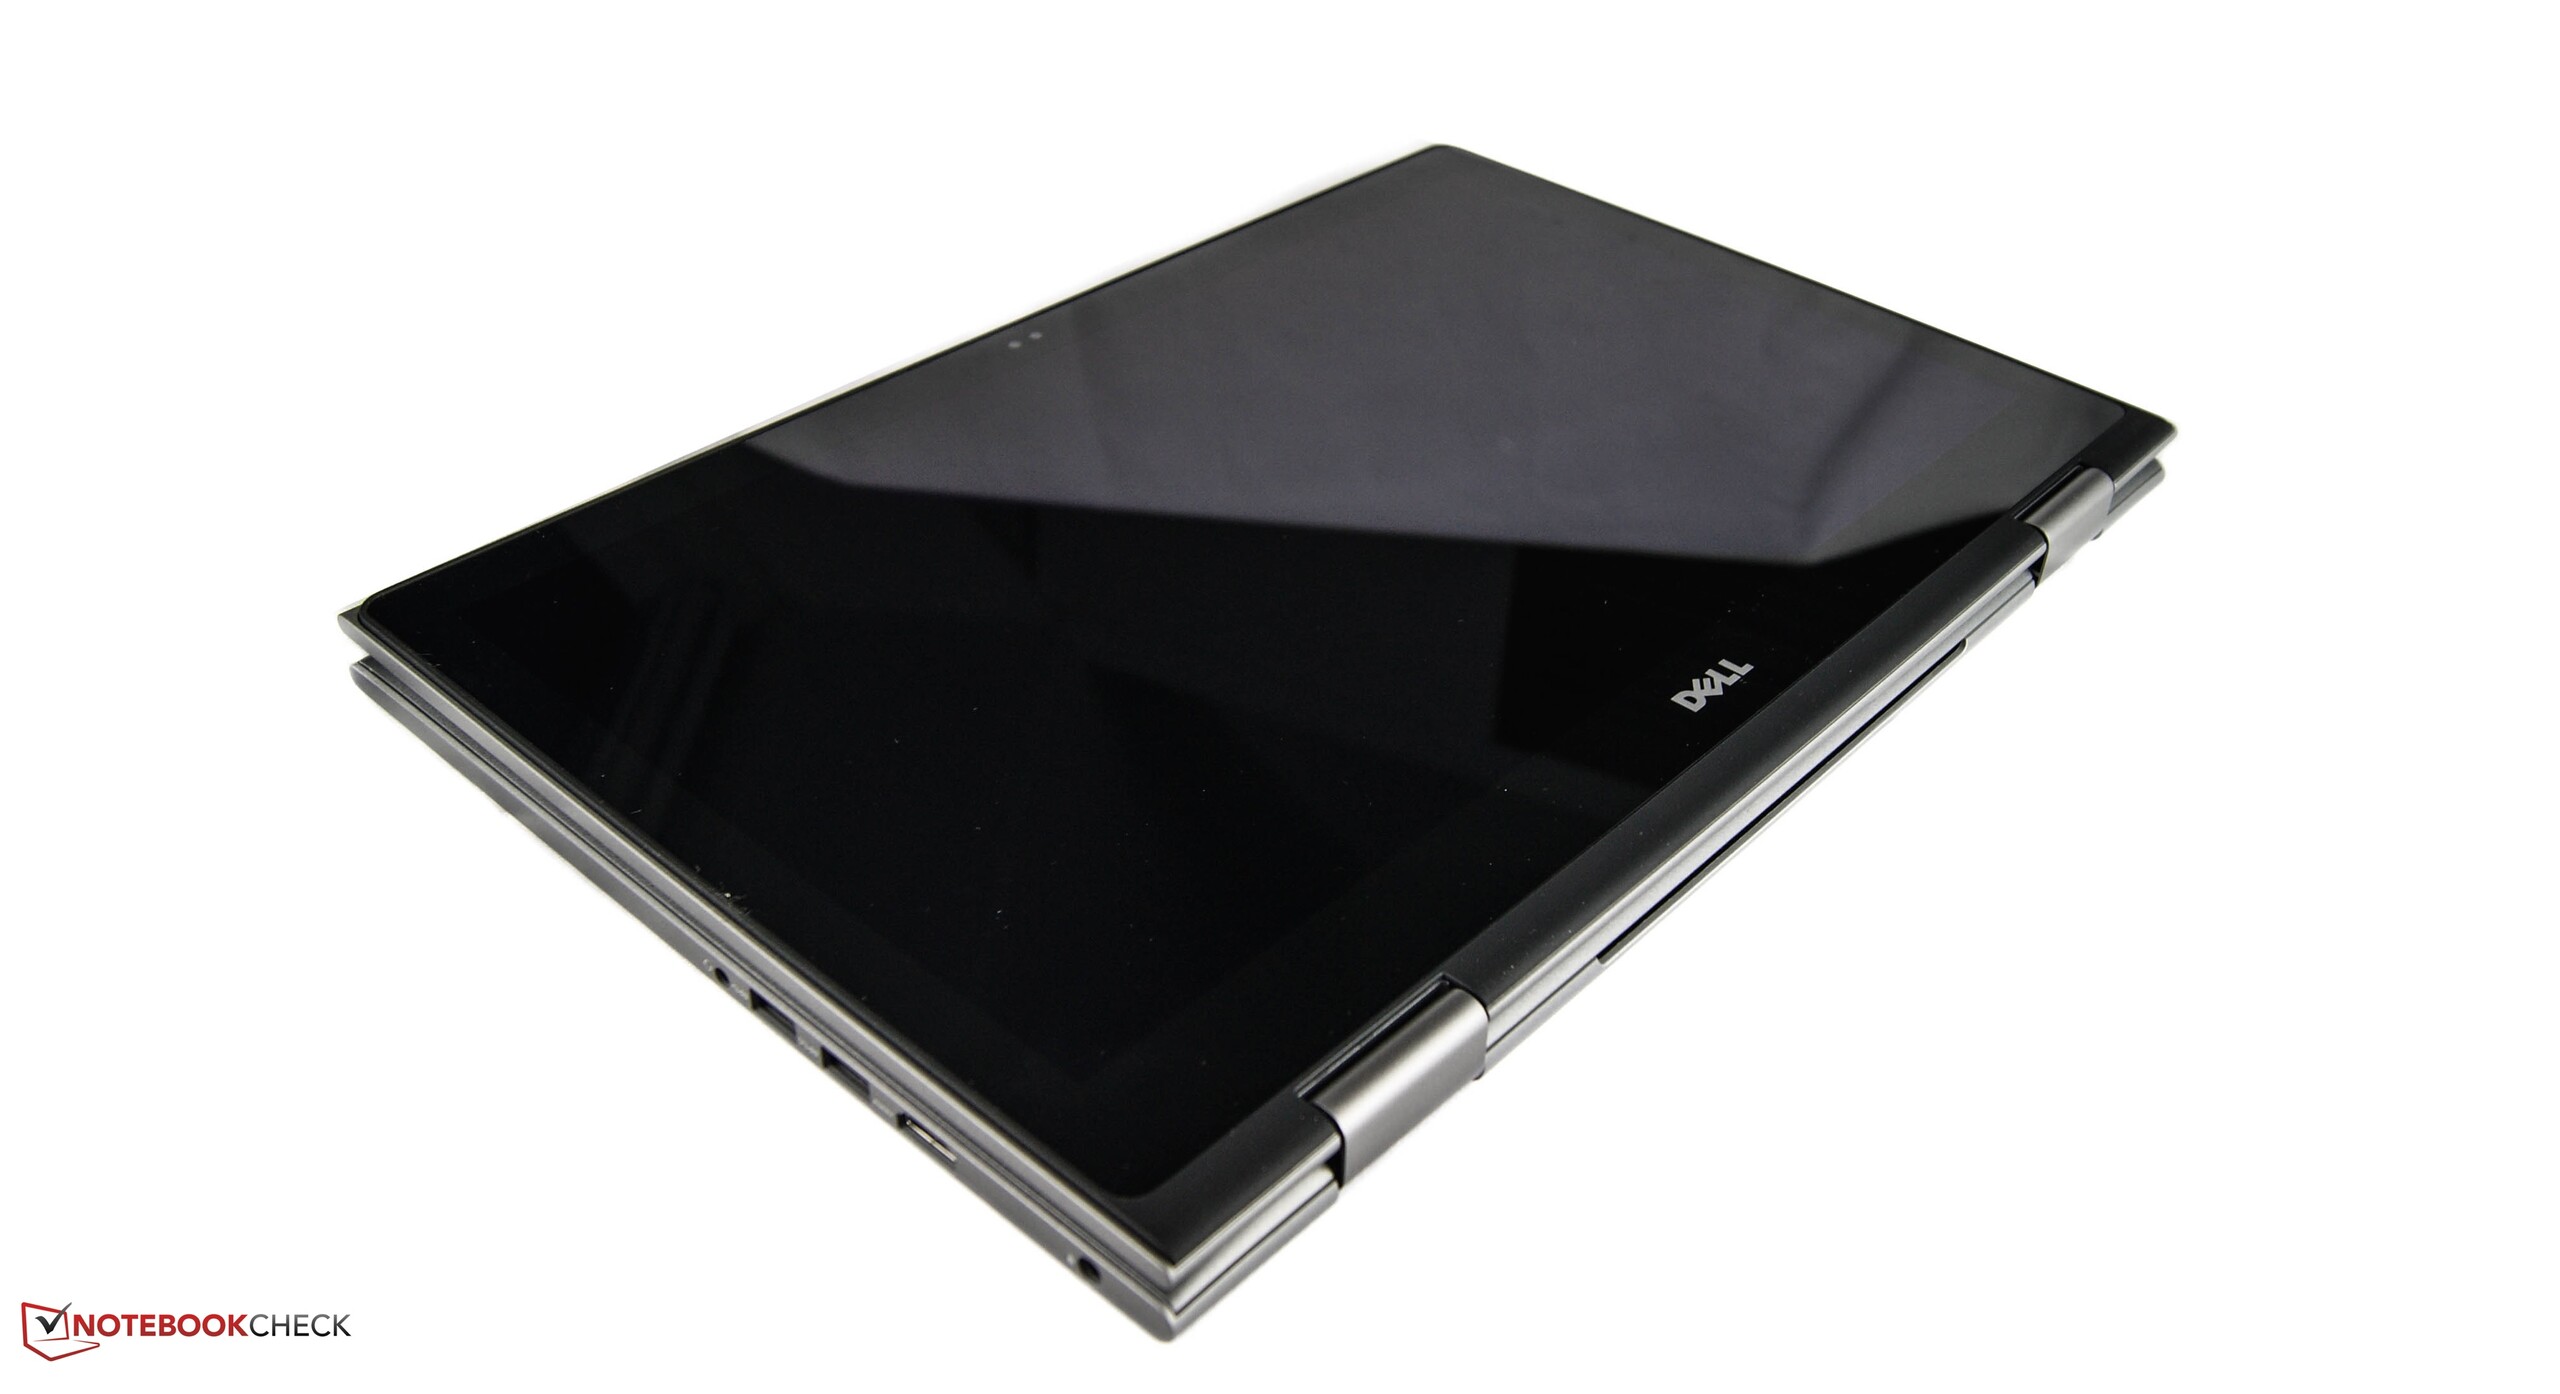
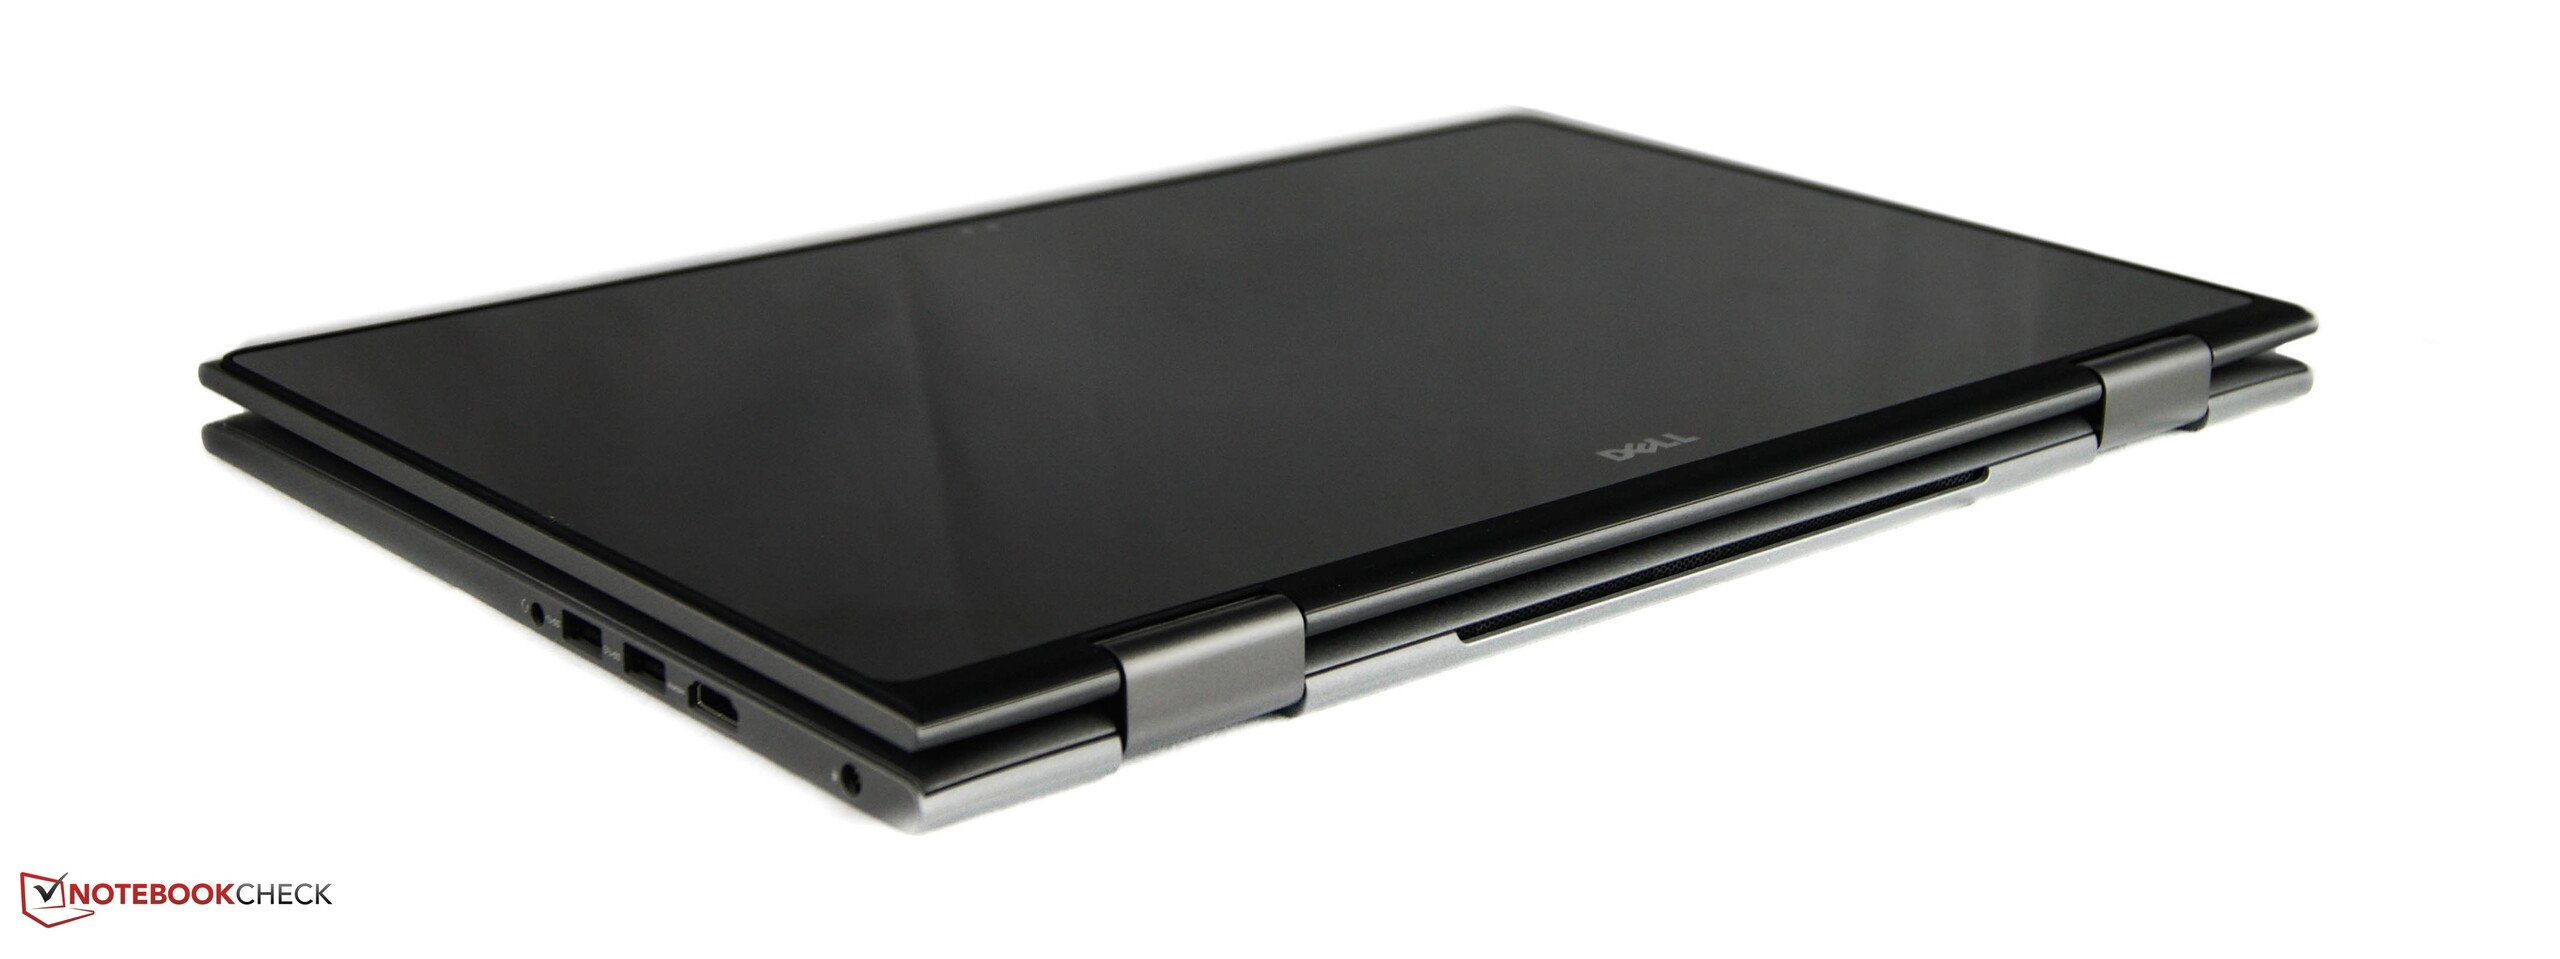
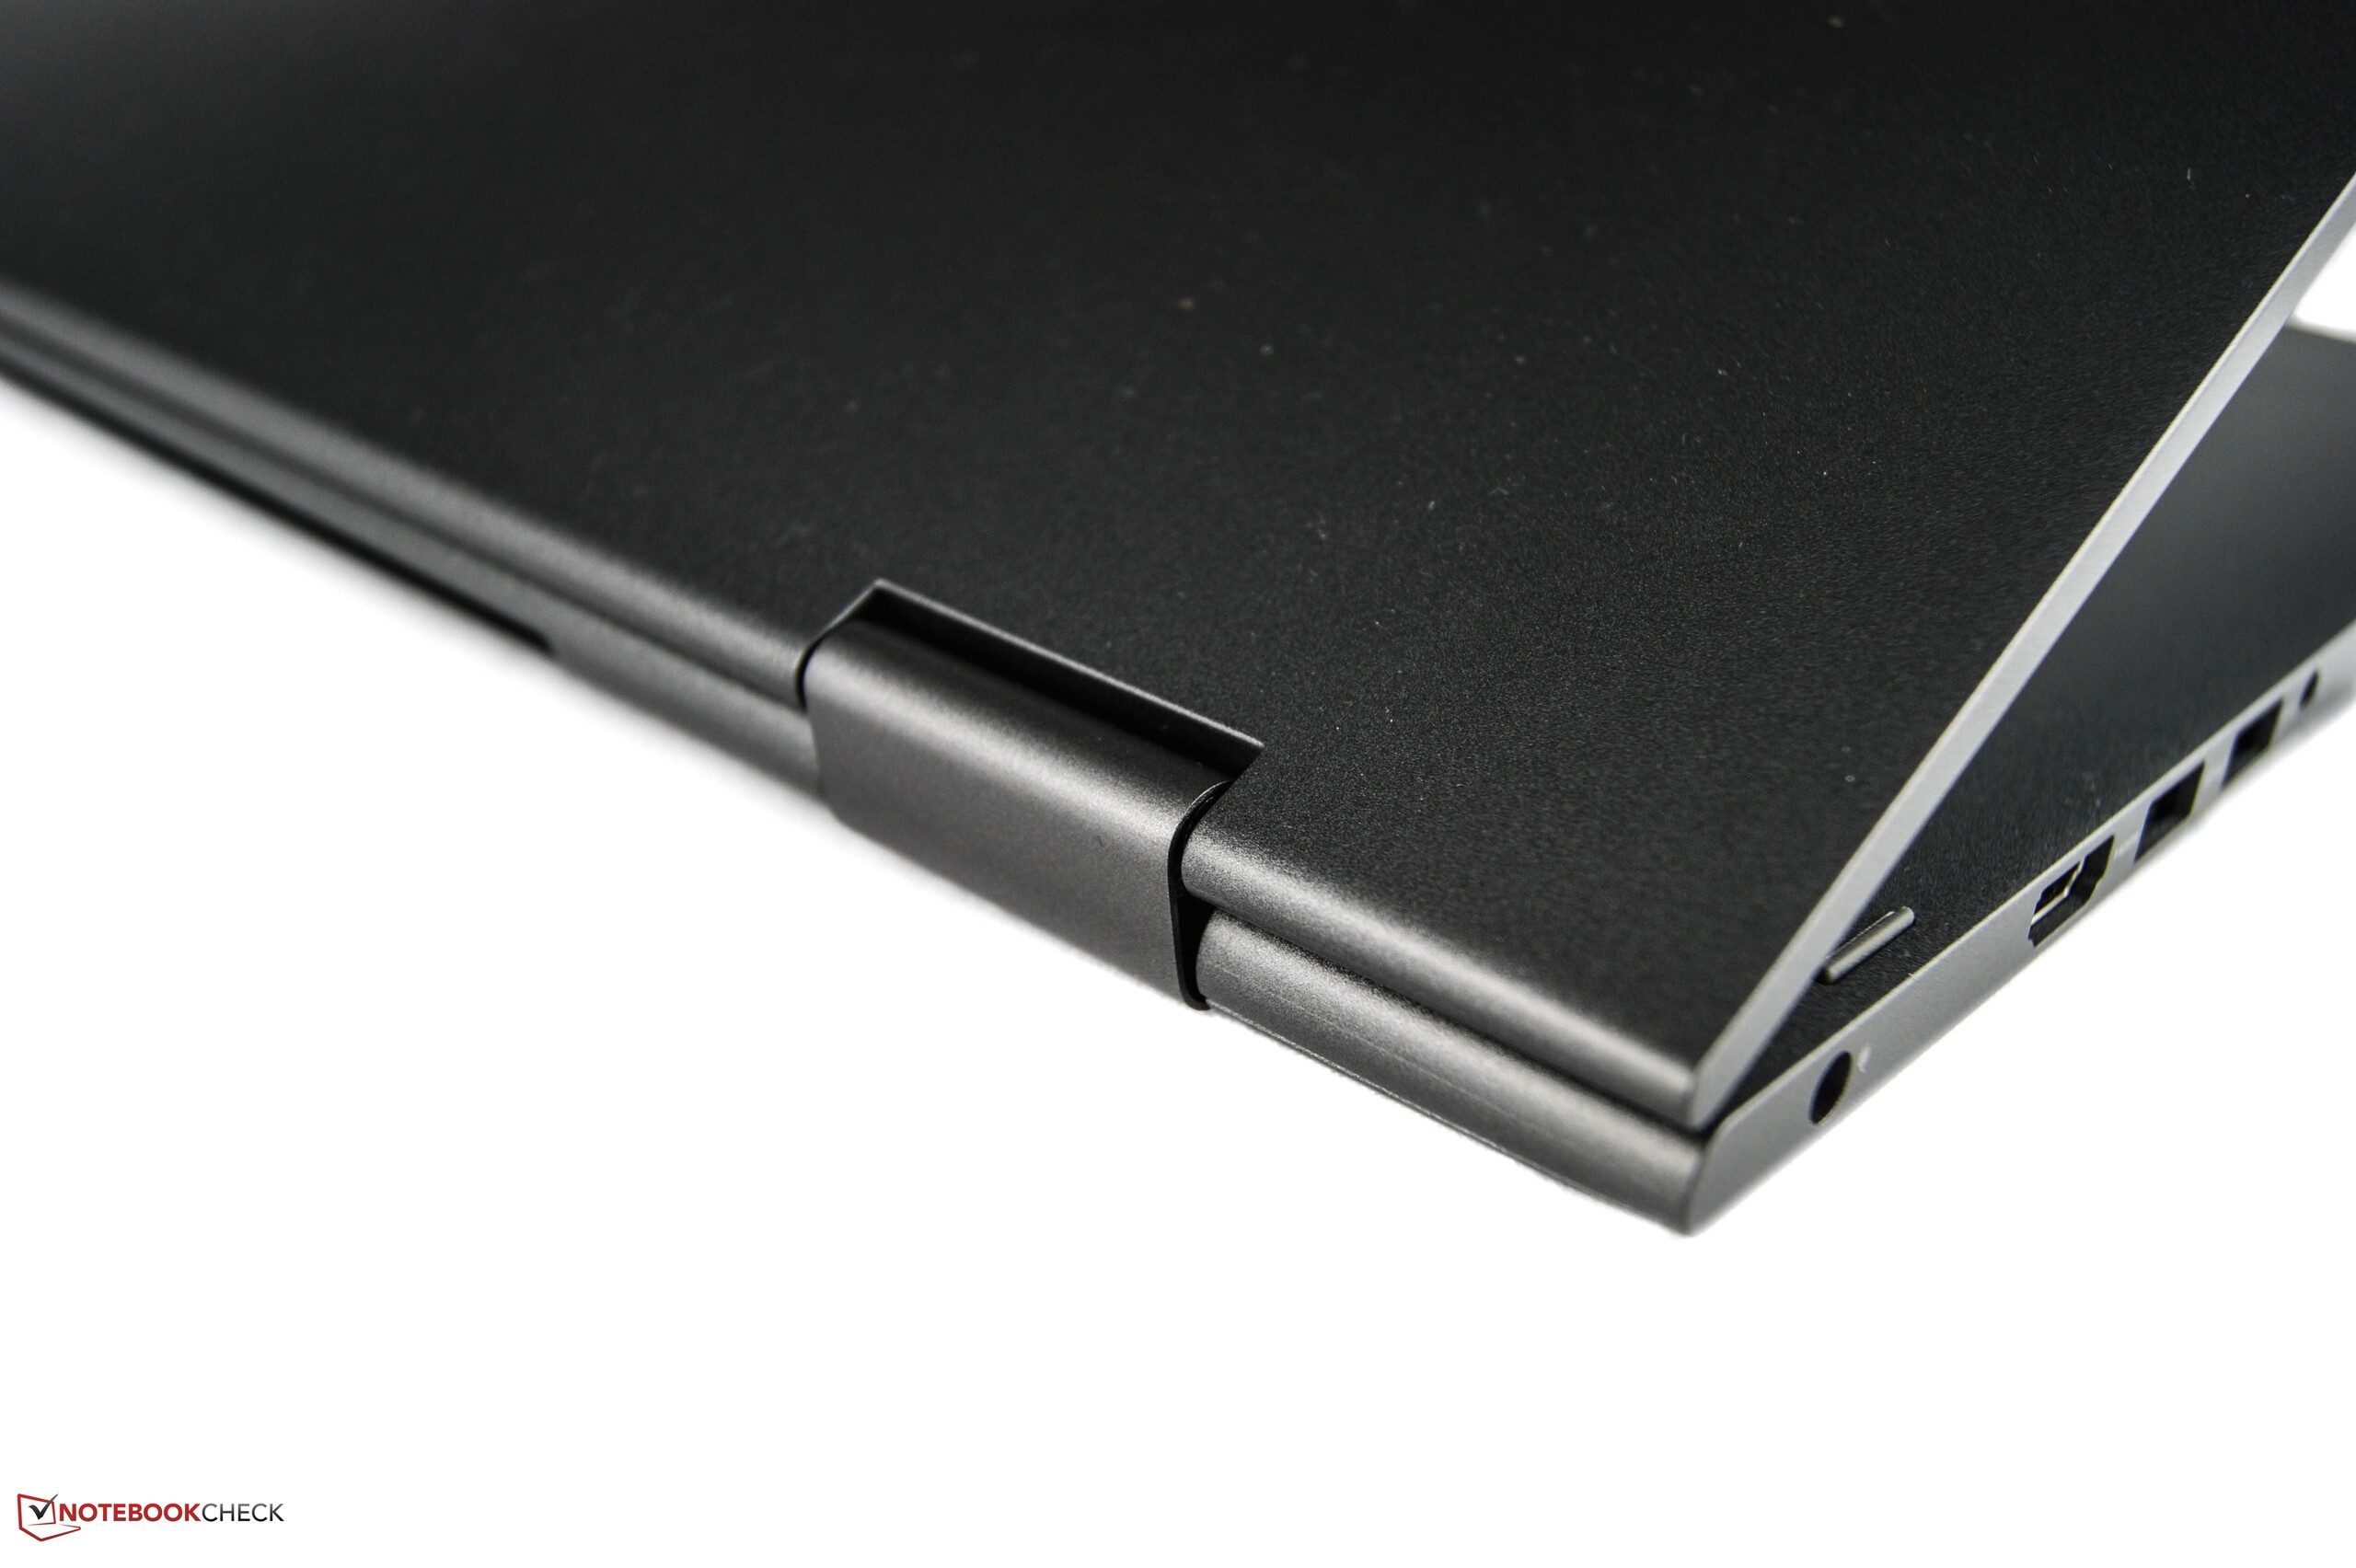
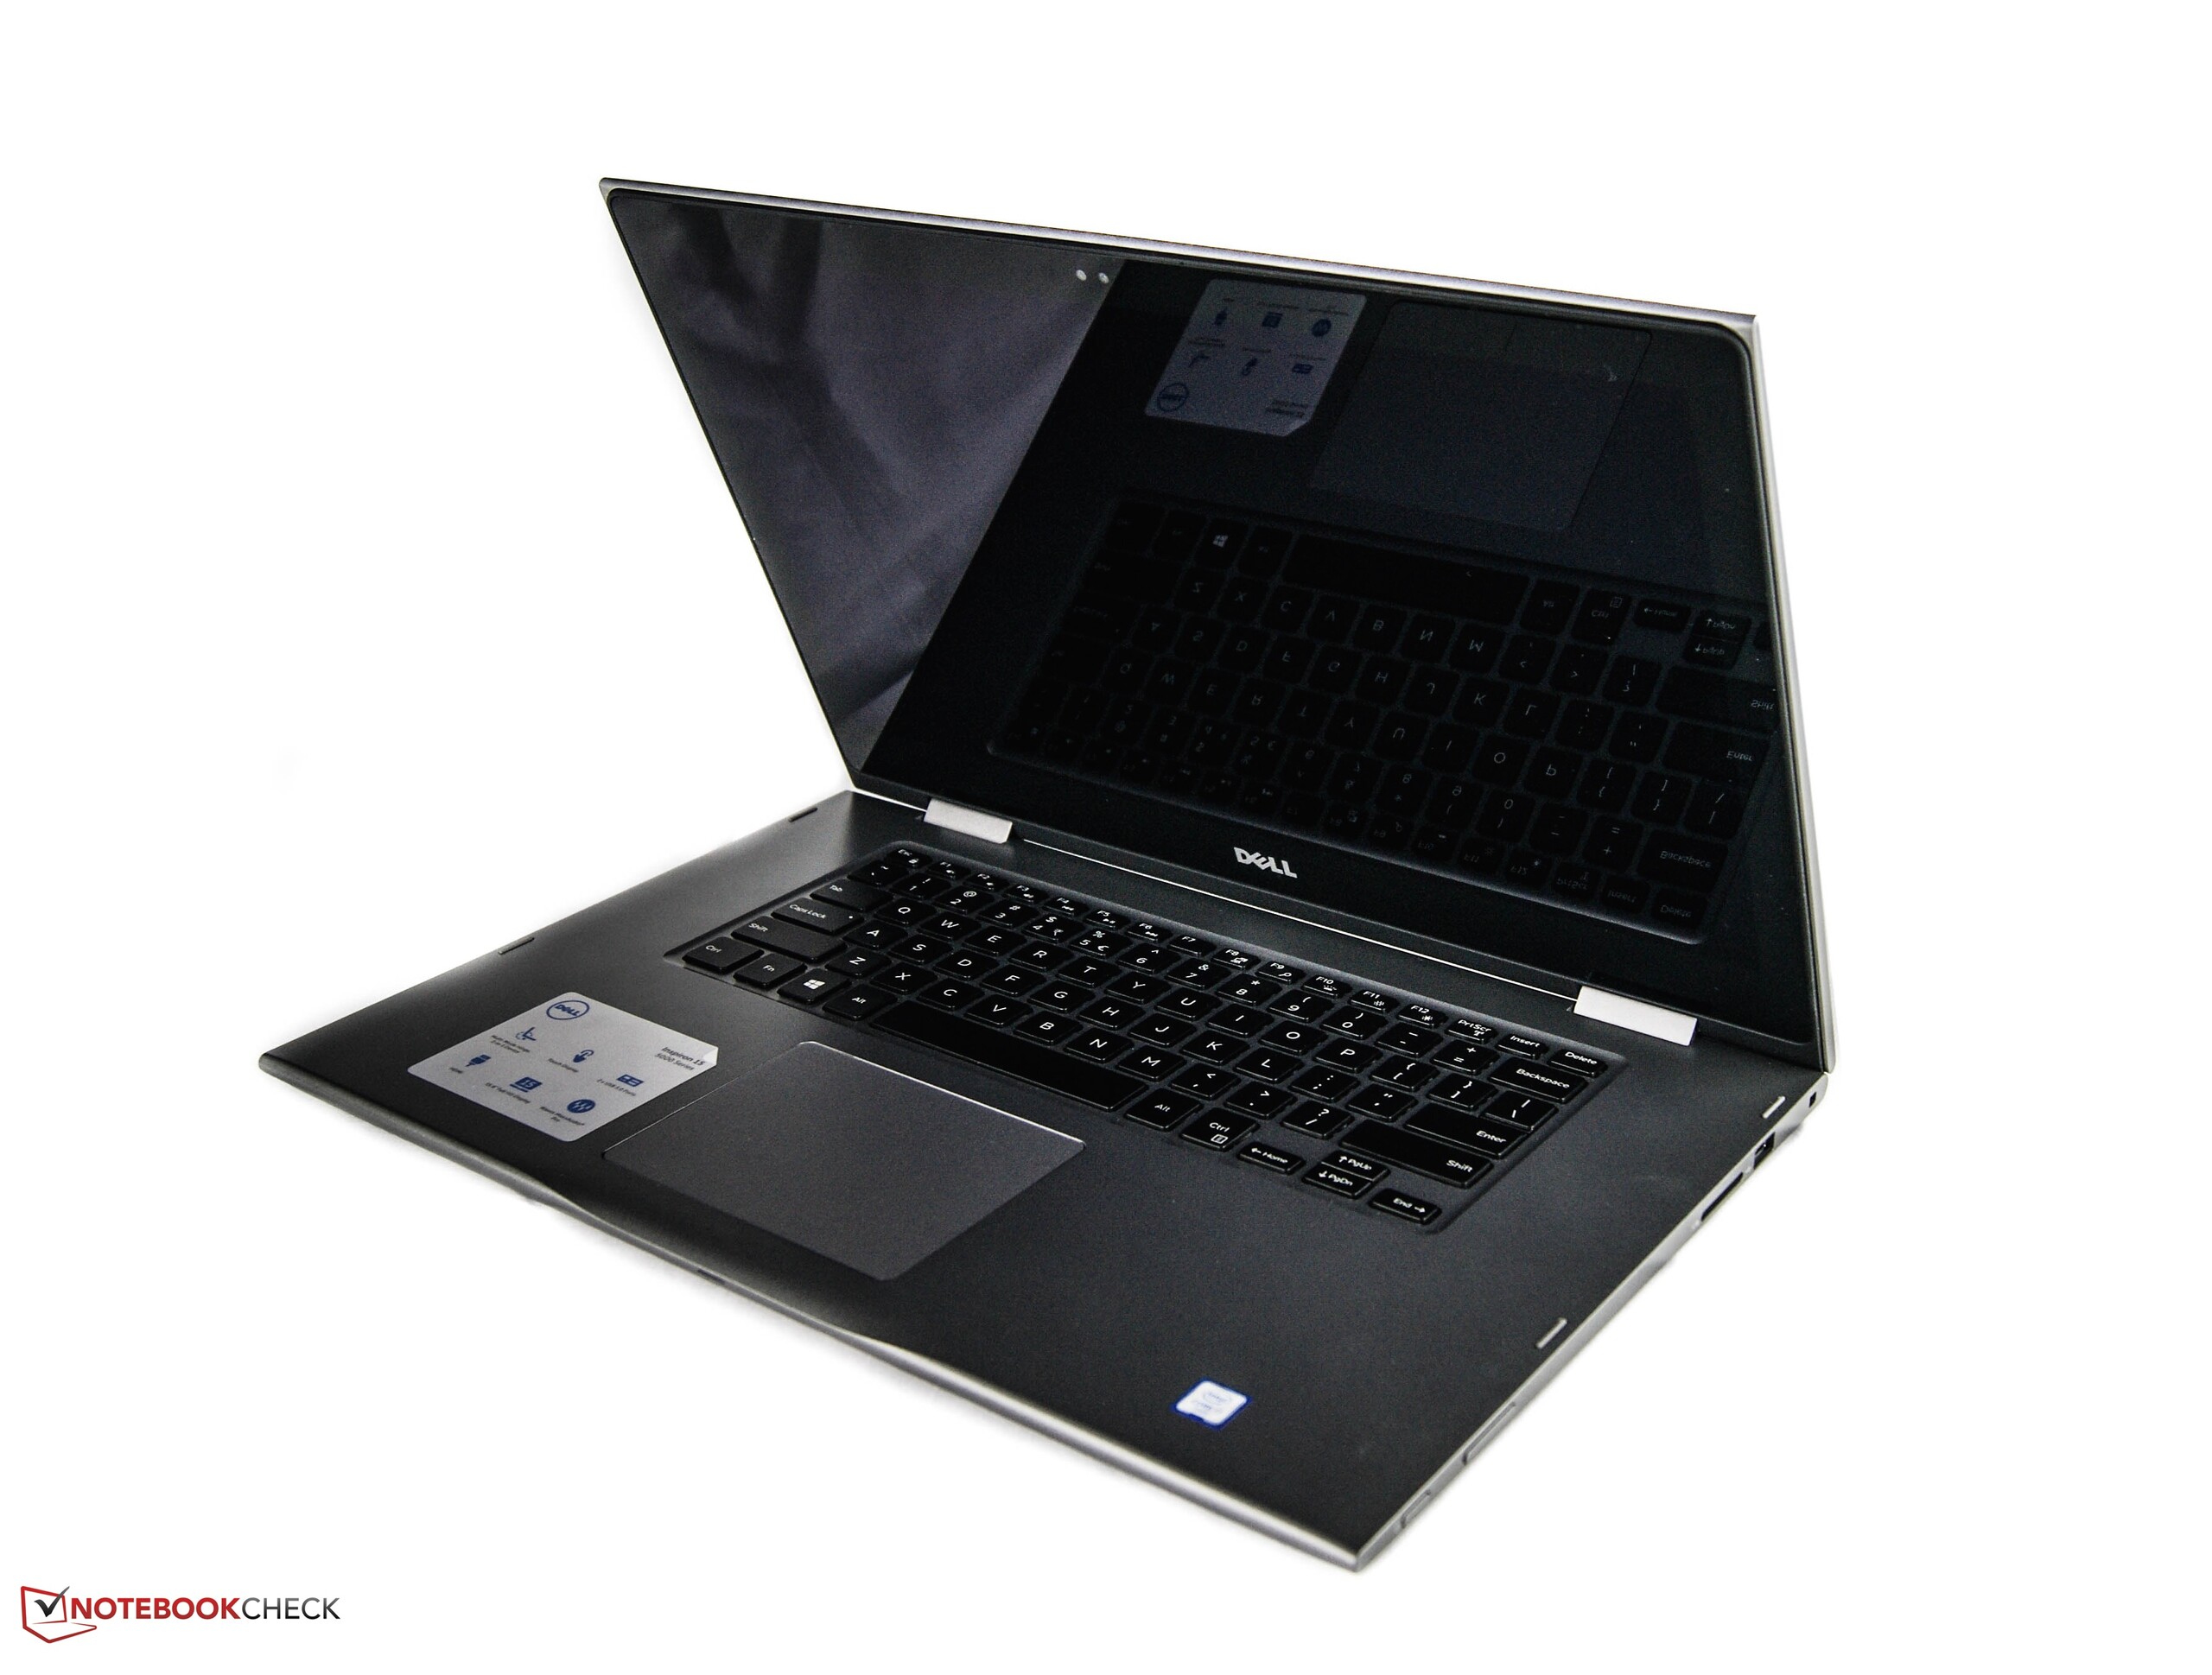
作为优秀的变形本,一台设备需要有优秀而均衡的性能,高品质机身和高便携性。除了一些小细节外,这几点戴尔的最新Inspiron 15 5568都做到了。它的机身出了一些小弱点外在竞争中毫不落后。我们特别欣赏它的高端工艺品质。只有它的屏幕后盖需要更加坚固,整机重量和屏幕亮度分布需要进一步改进。对于它的屏幕我们没有太多的不满,只是如果亮度可以更高的话将会让它更加接近完美。接下来另外一个重要标准是性能表现和响应速度。鉴于戴尔为它搭配了高端部件,我们的测试机在系统基准测试中达到了很高的水平。不过,这也在散热上为它带来了一些压力。它的电池续航也有些短,相比一些竞争对手的表现远远落后。
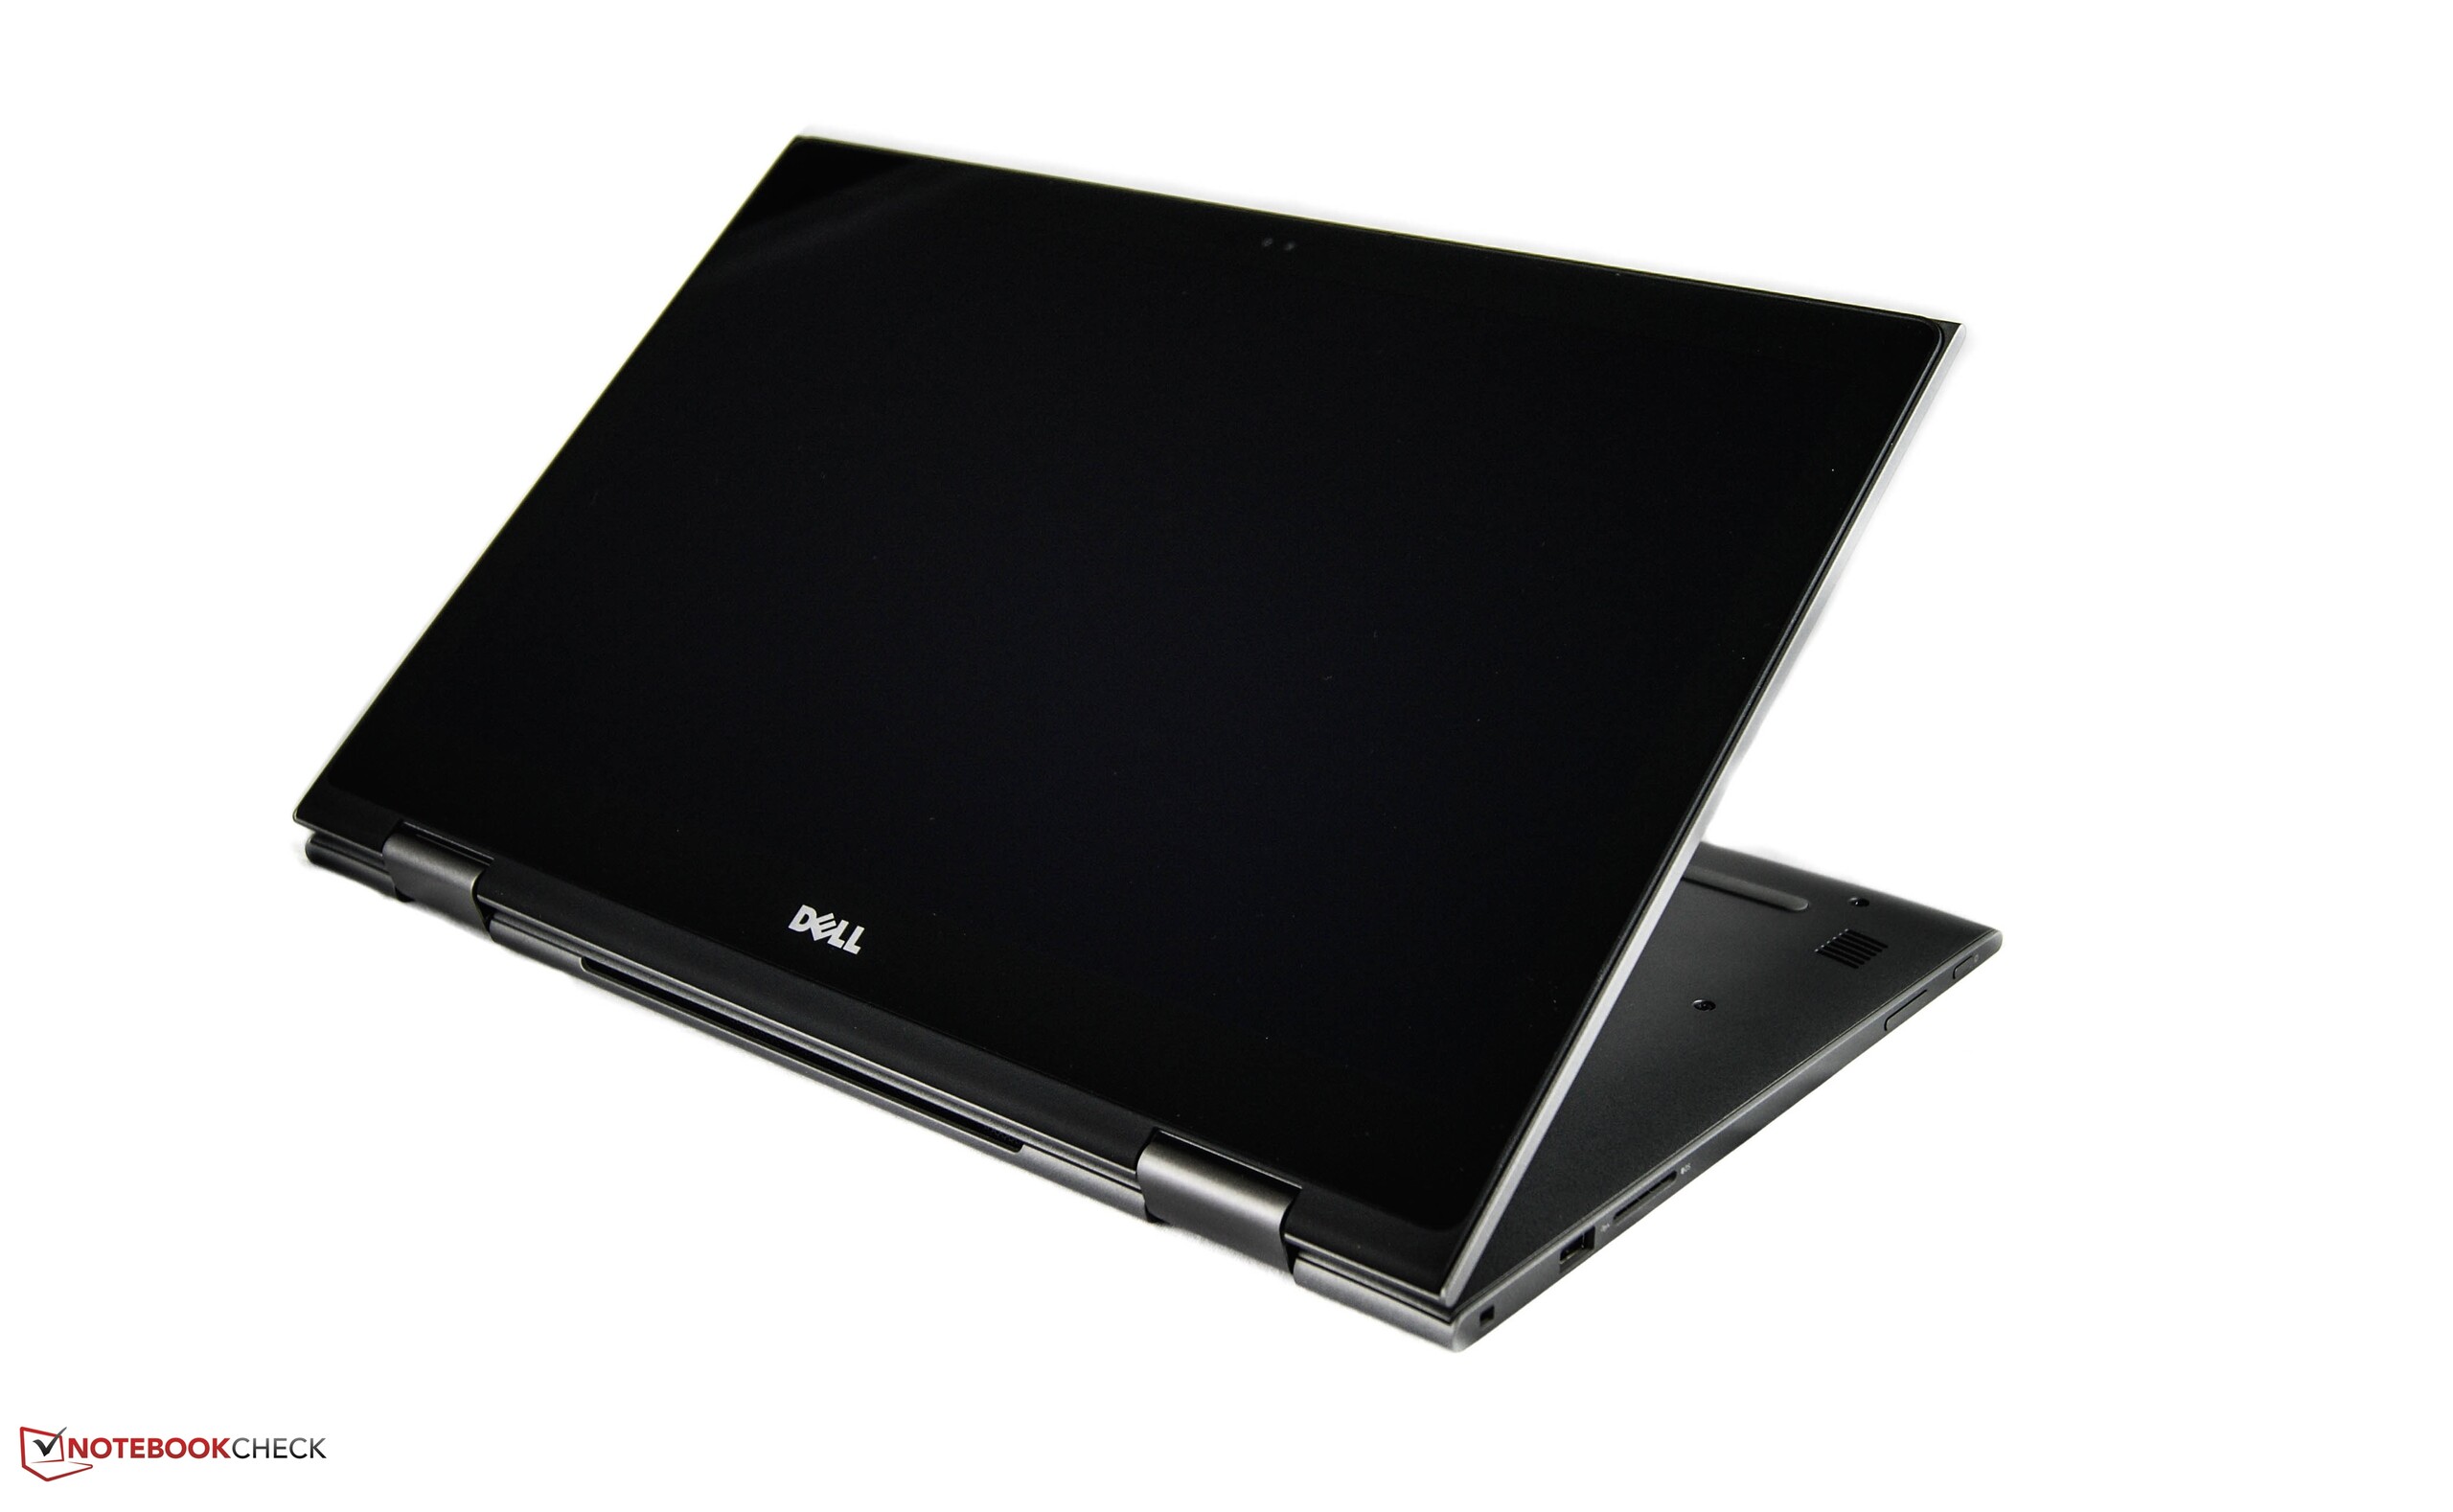
对于需要外观时尚、表现全面的15寸变形本的用户来说,戴尔的最新Inspiron 5000系列会是个不错的选择。
不希望花费1000欧元(约7380人民币)以上预算的用户可以考虑售价低200欧元(约5911人民币)的同系列机型。不过也不能忘了同类竞争产品。值得一提的有惠普 Spectre x360,它提供了更高亮度的屏幕,更长电池续航和更低整机重量,也是一个值得参考的选择。
注:本文是基于完整评测的缩减版本,阅读完整的英文评测,请点击这里。
Dell Inspiron 15 5568
- 07/19/2016 v5.1 (old)
Nino Ricchizzi