结论
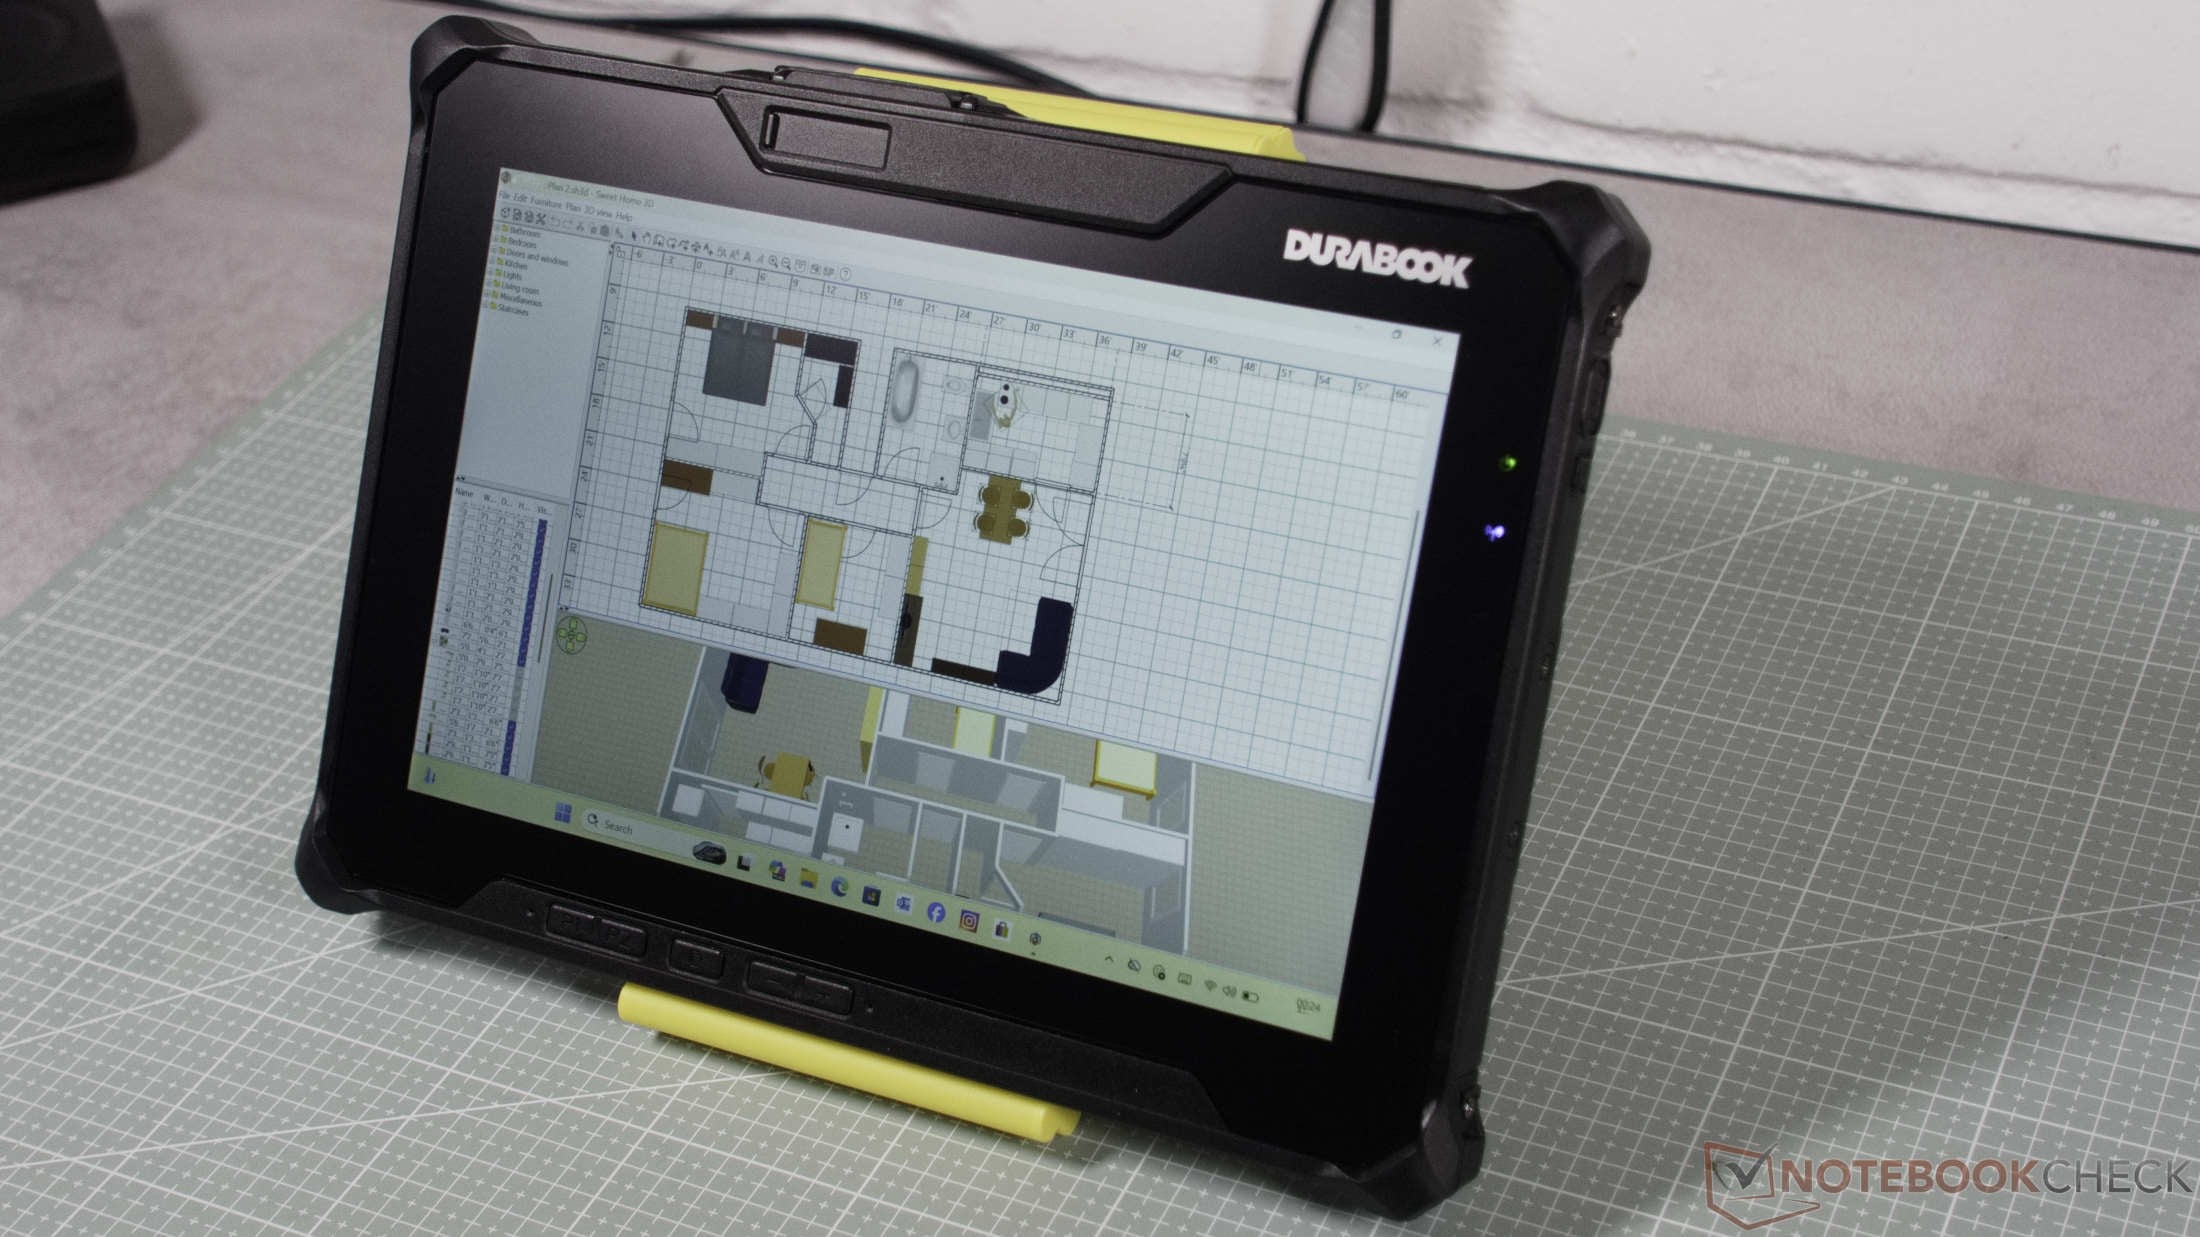
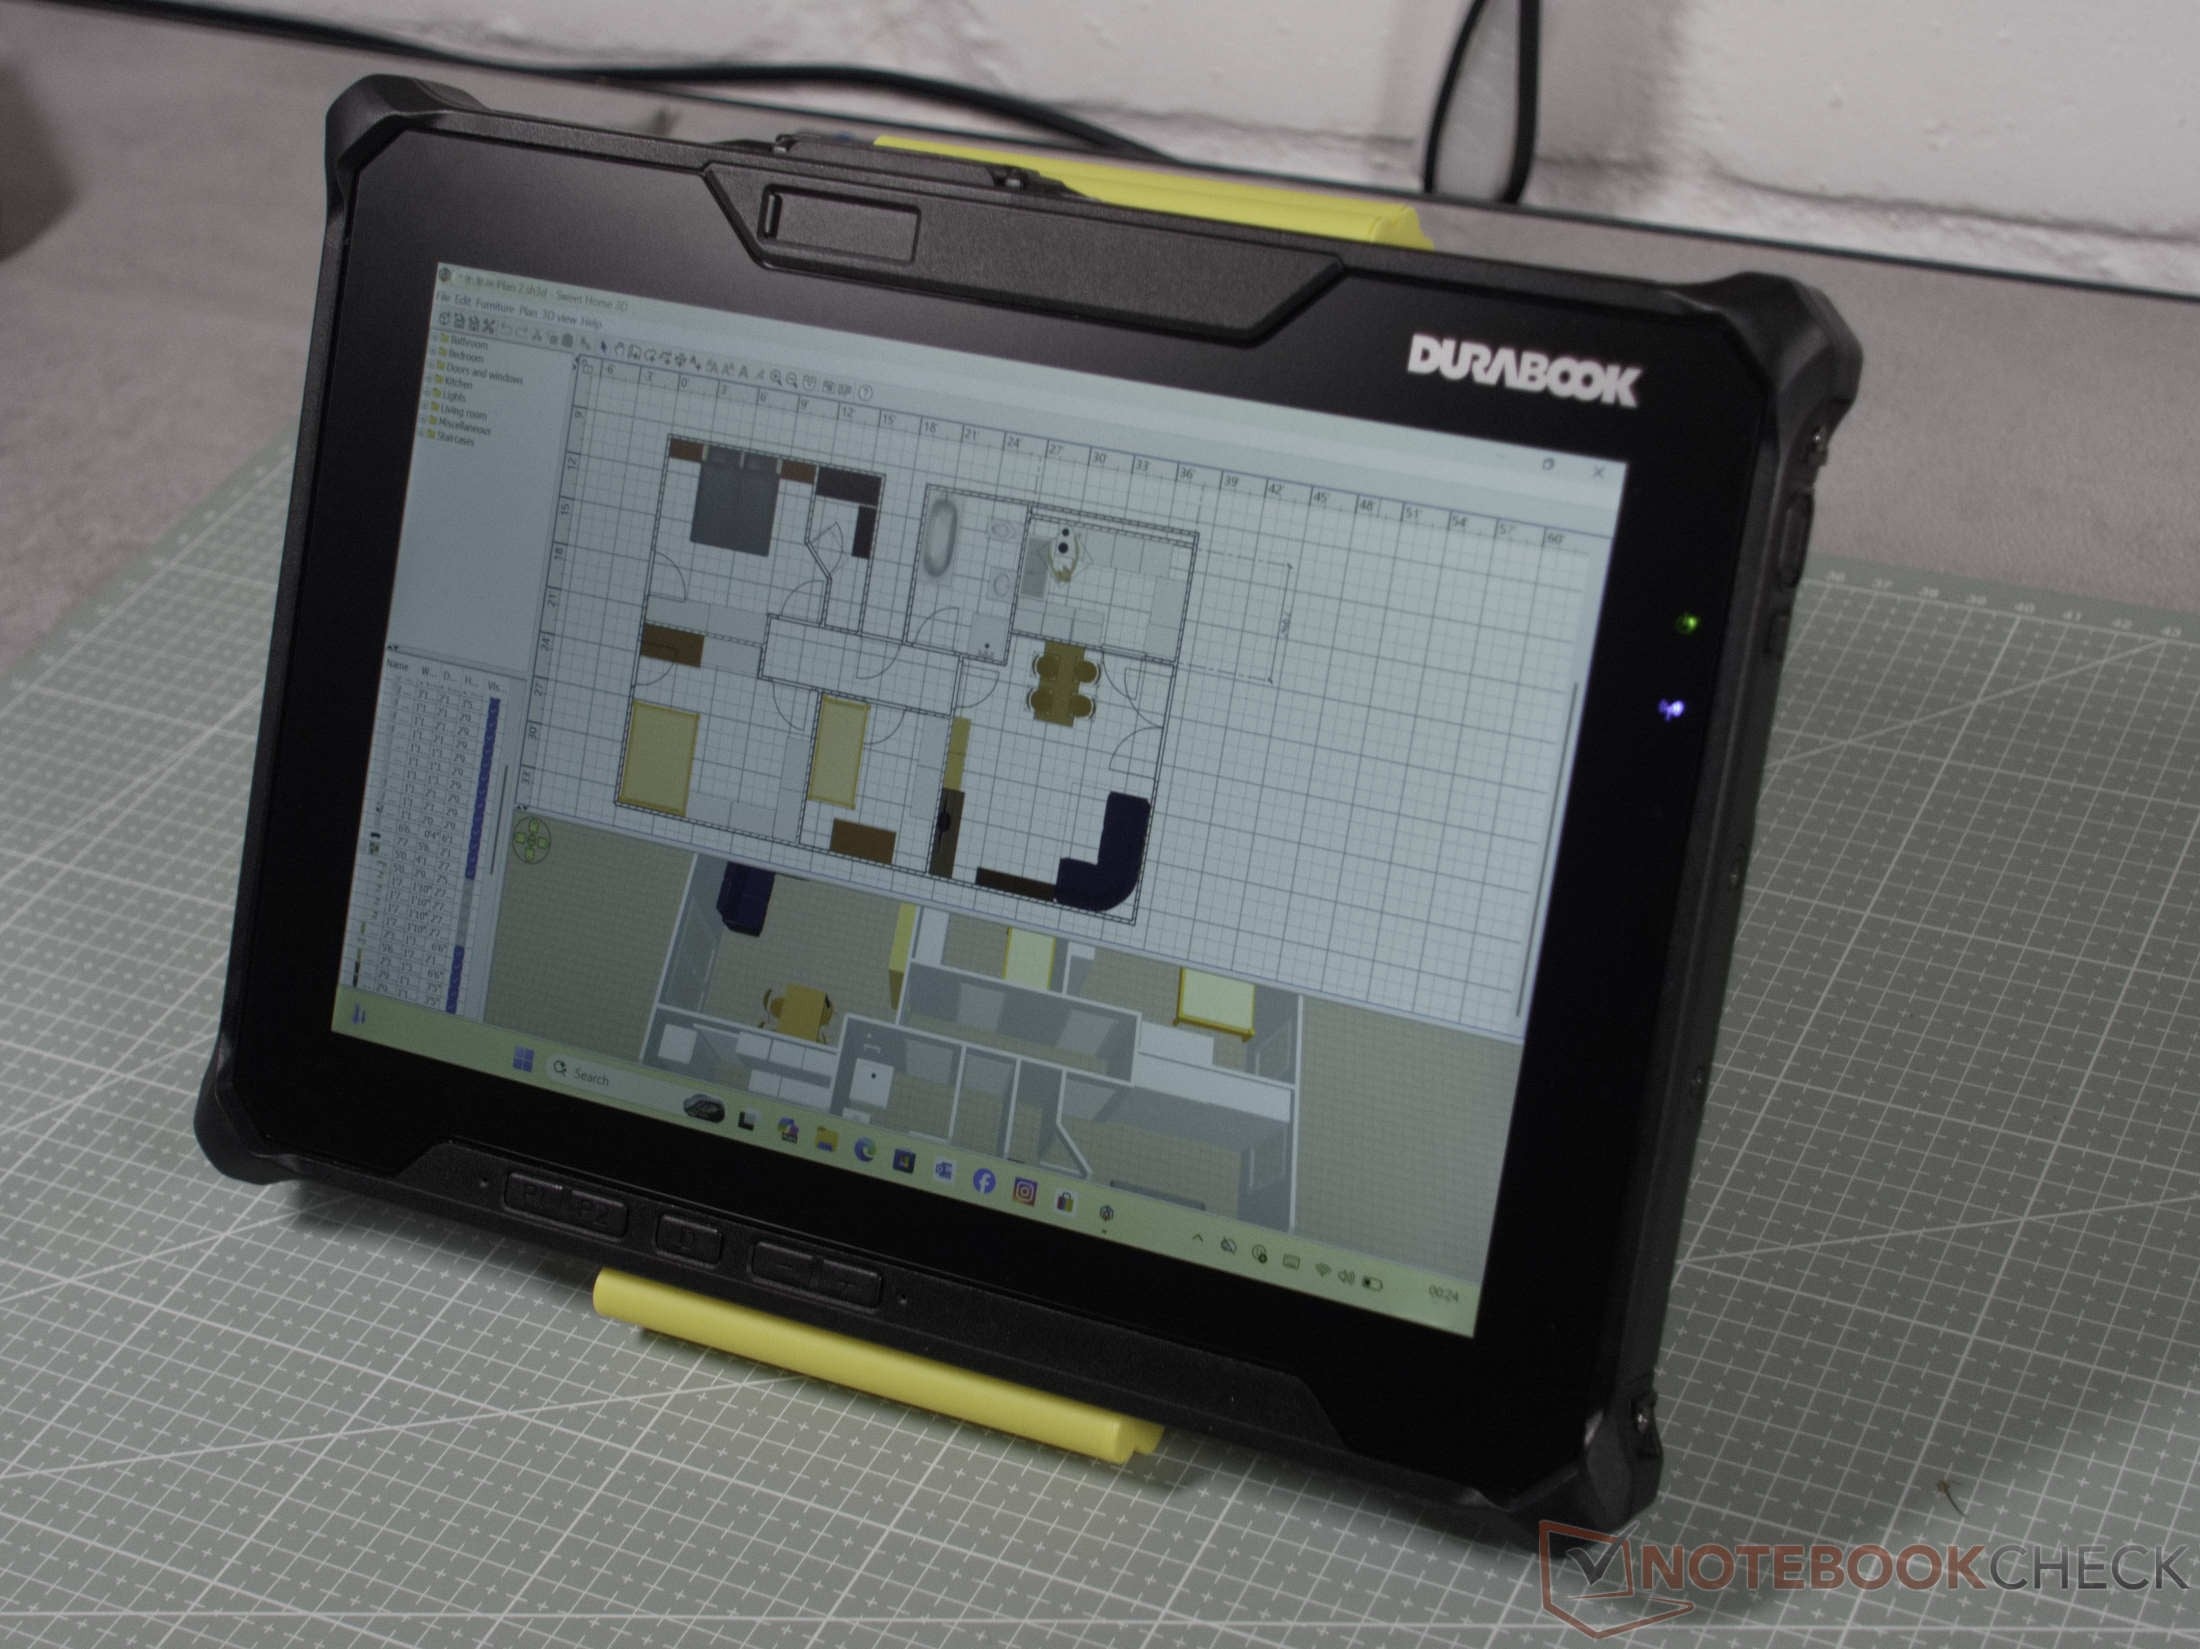
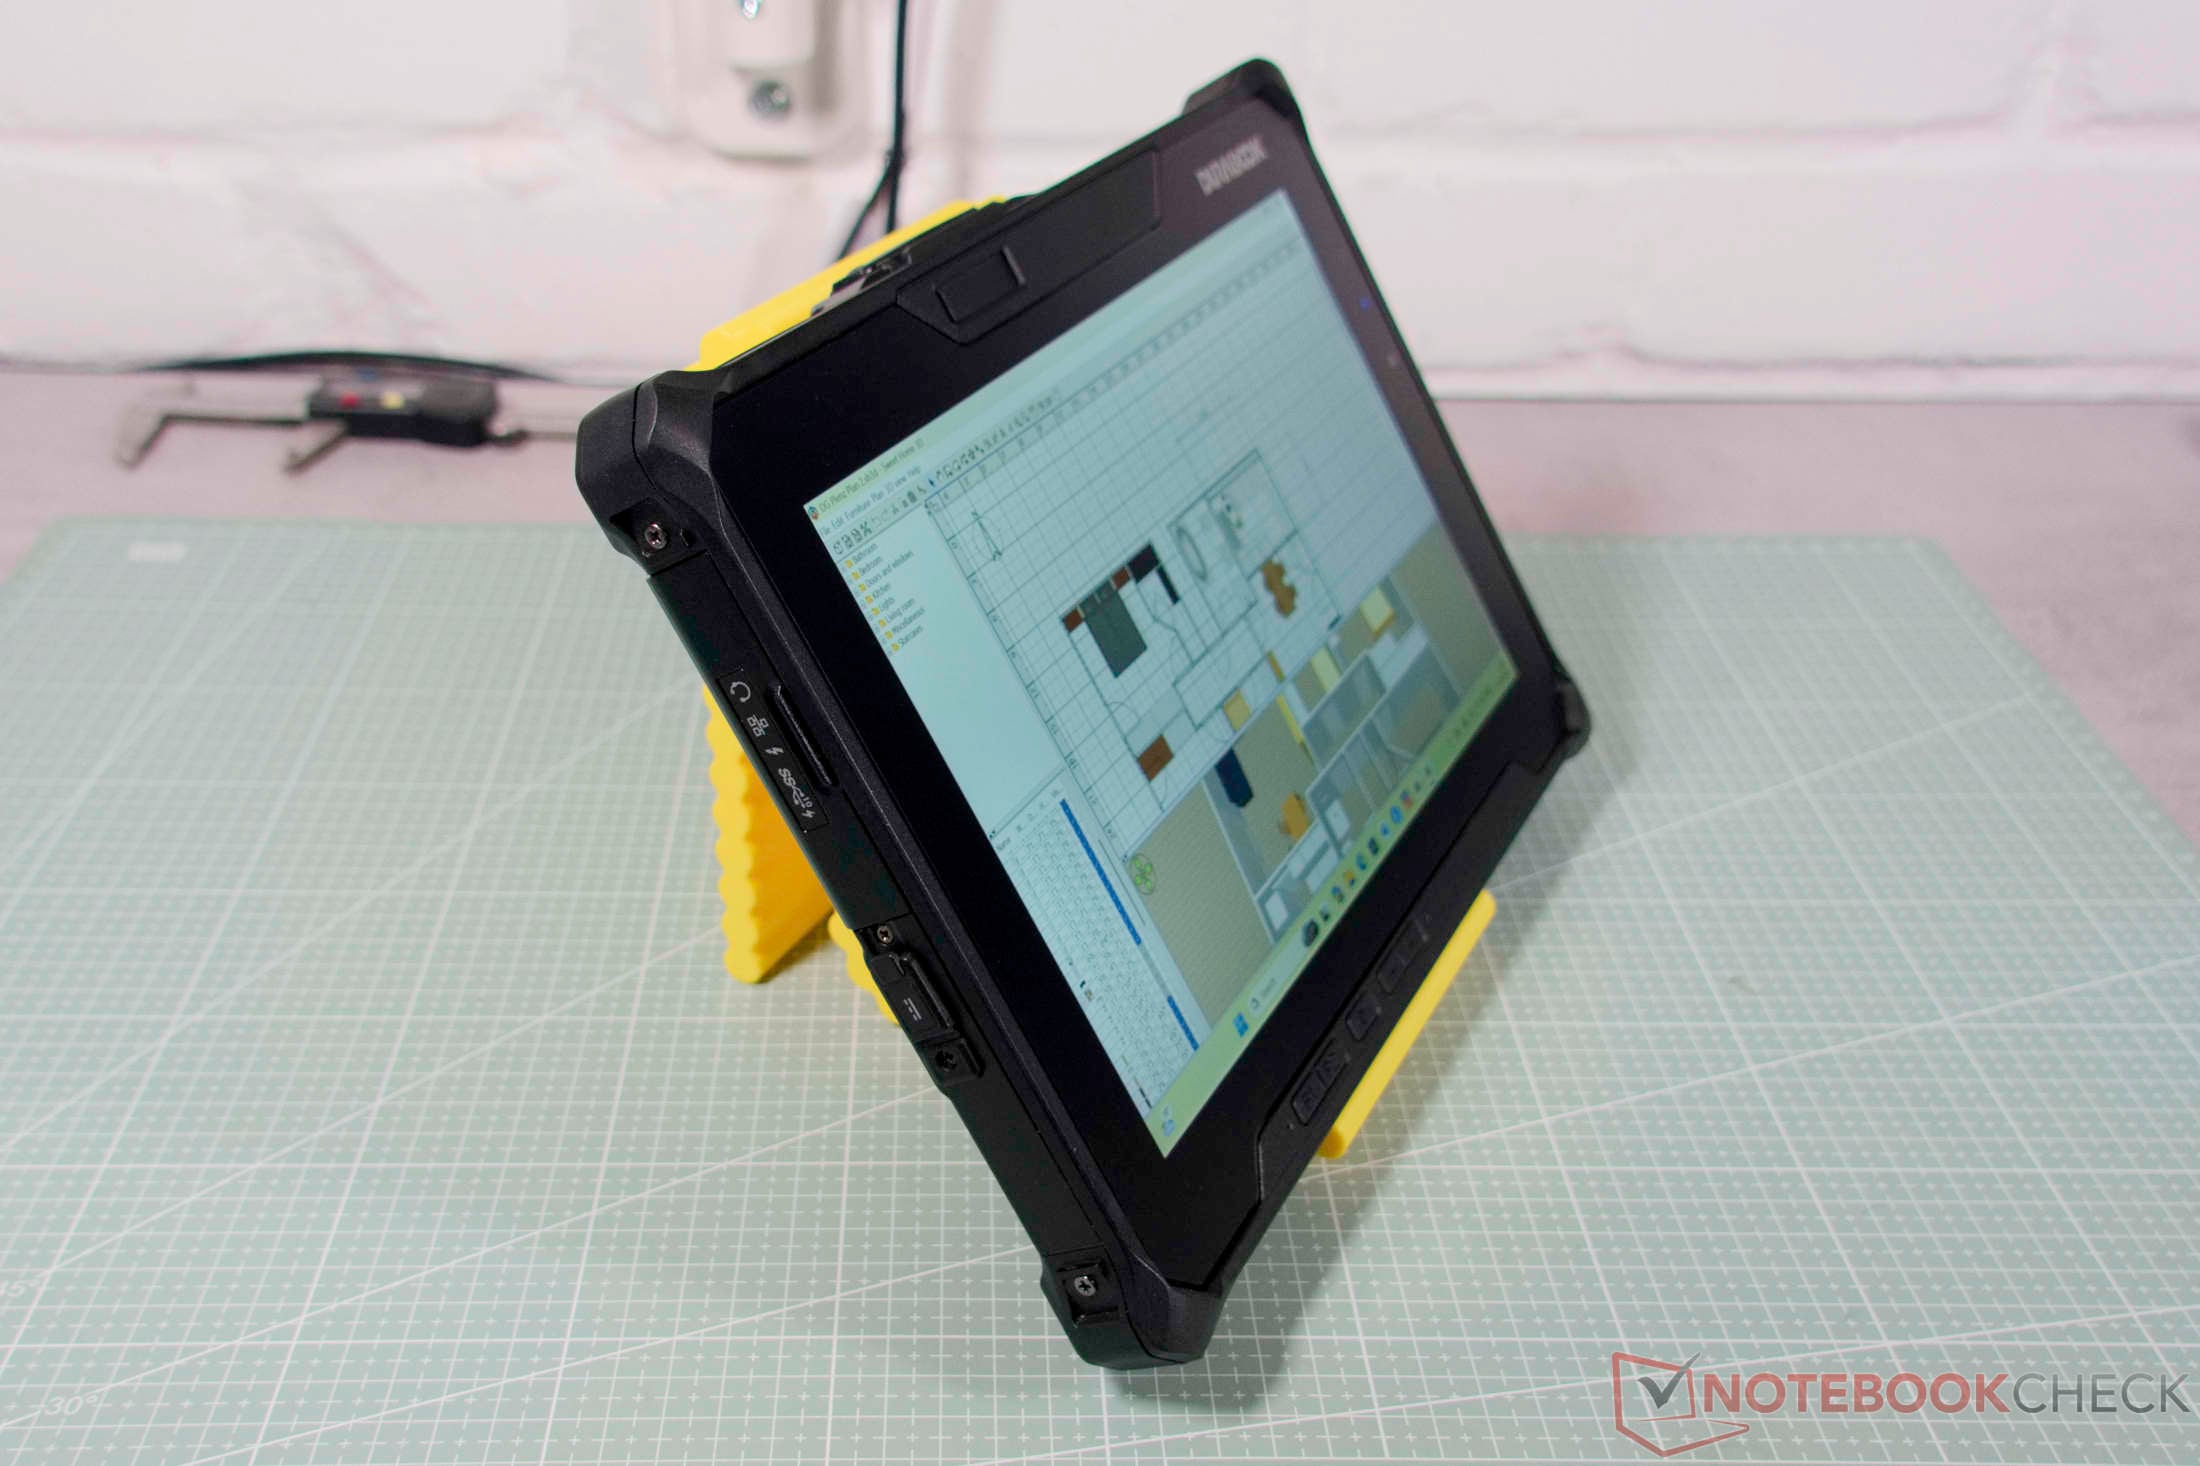
乍看之下,Durabook R10 与传统的消费级平板电脑相比,简直就像一块砖头。这款 10.1 英寸的设备高度略低于 3 厘米,显示屏边框较宽,重量超过 1.2 公斤(约 2.65 磅),拿在手里感觉相当沉重。 纤薄轻盈并非其设计目标。制造商致力于打造适用于极端严苛环境的无妥协工具——无论是尘土飞扬的建筑工地、工业厂房,还是野外作业现场。
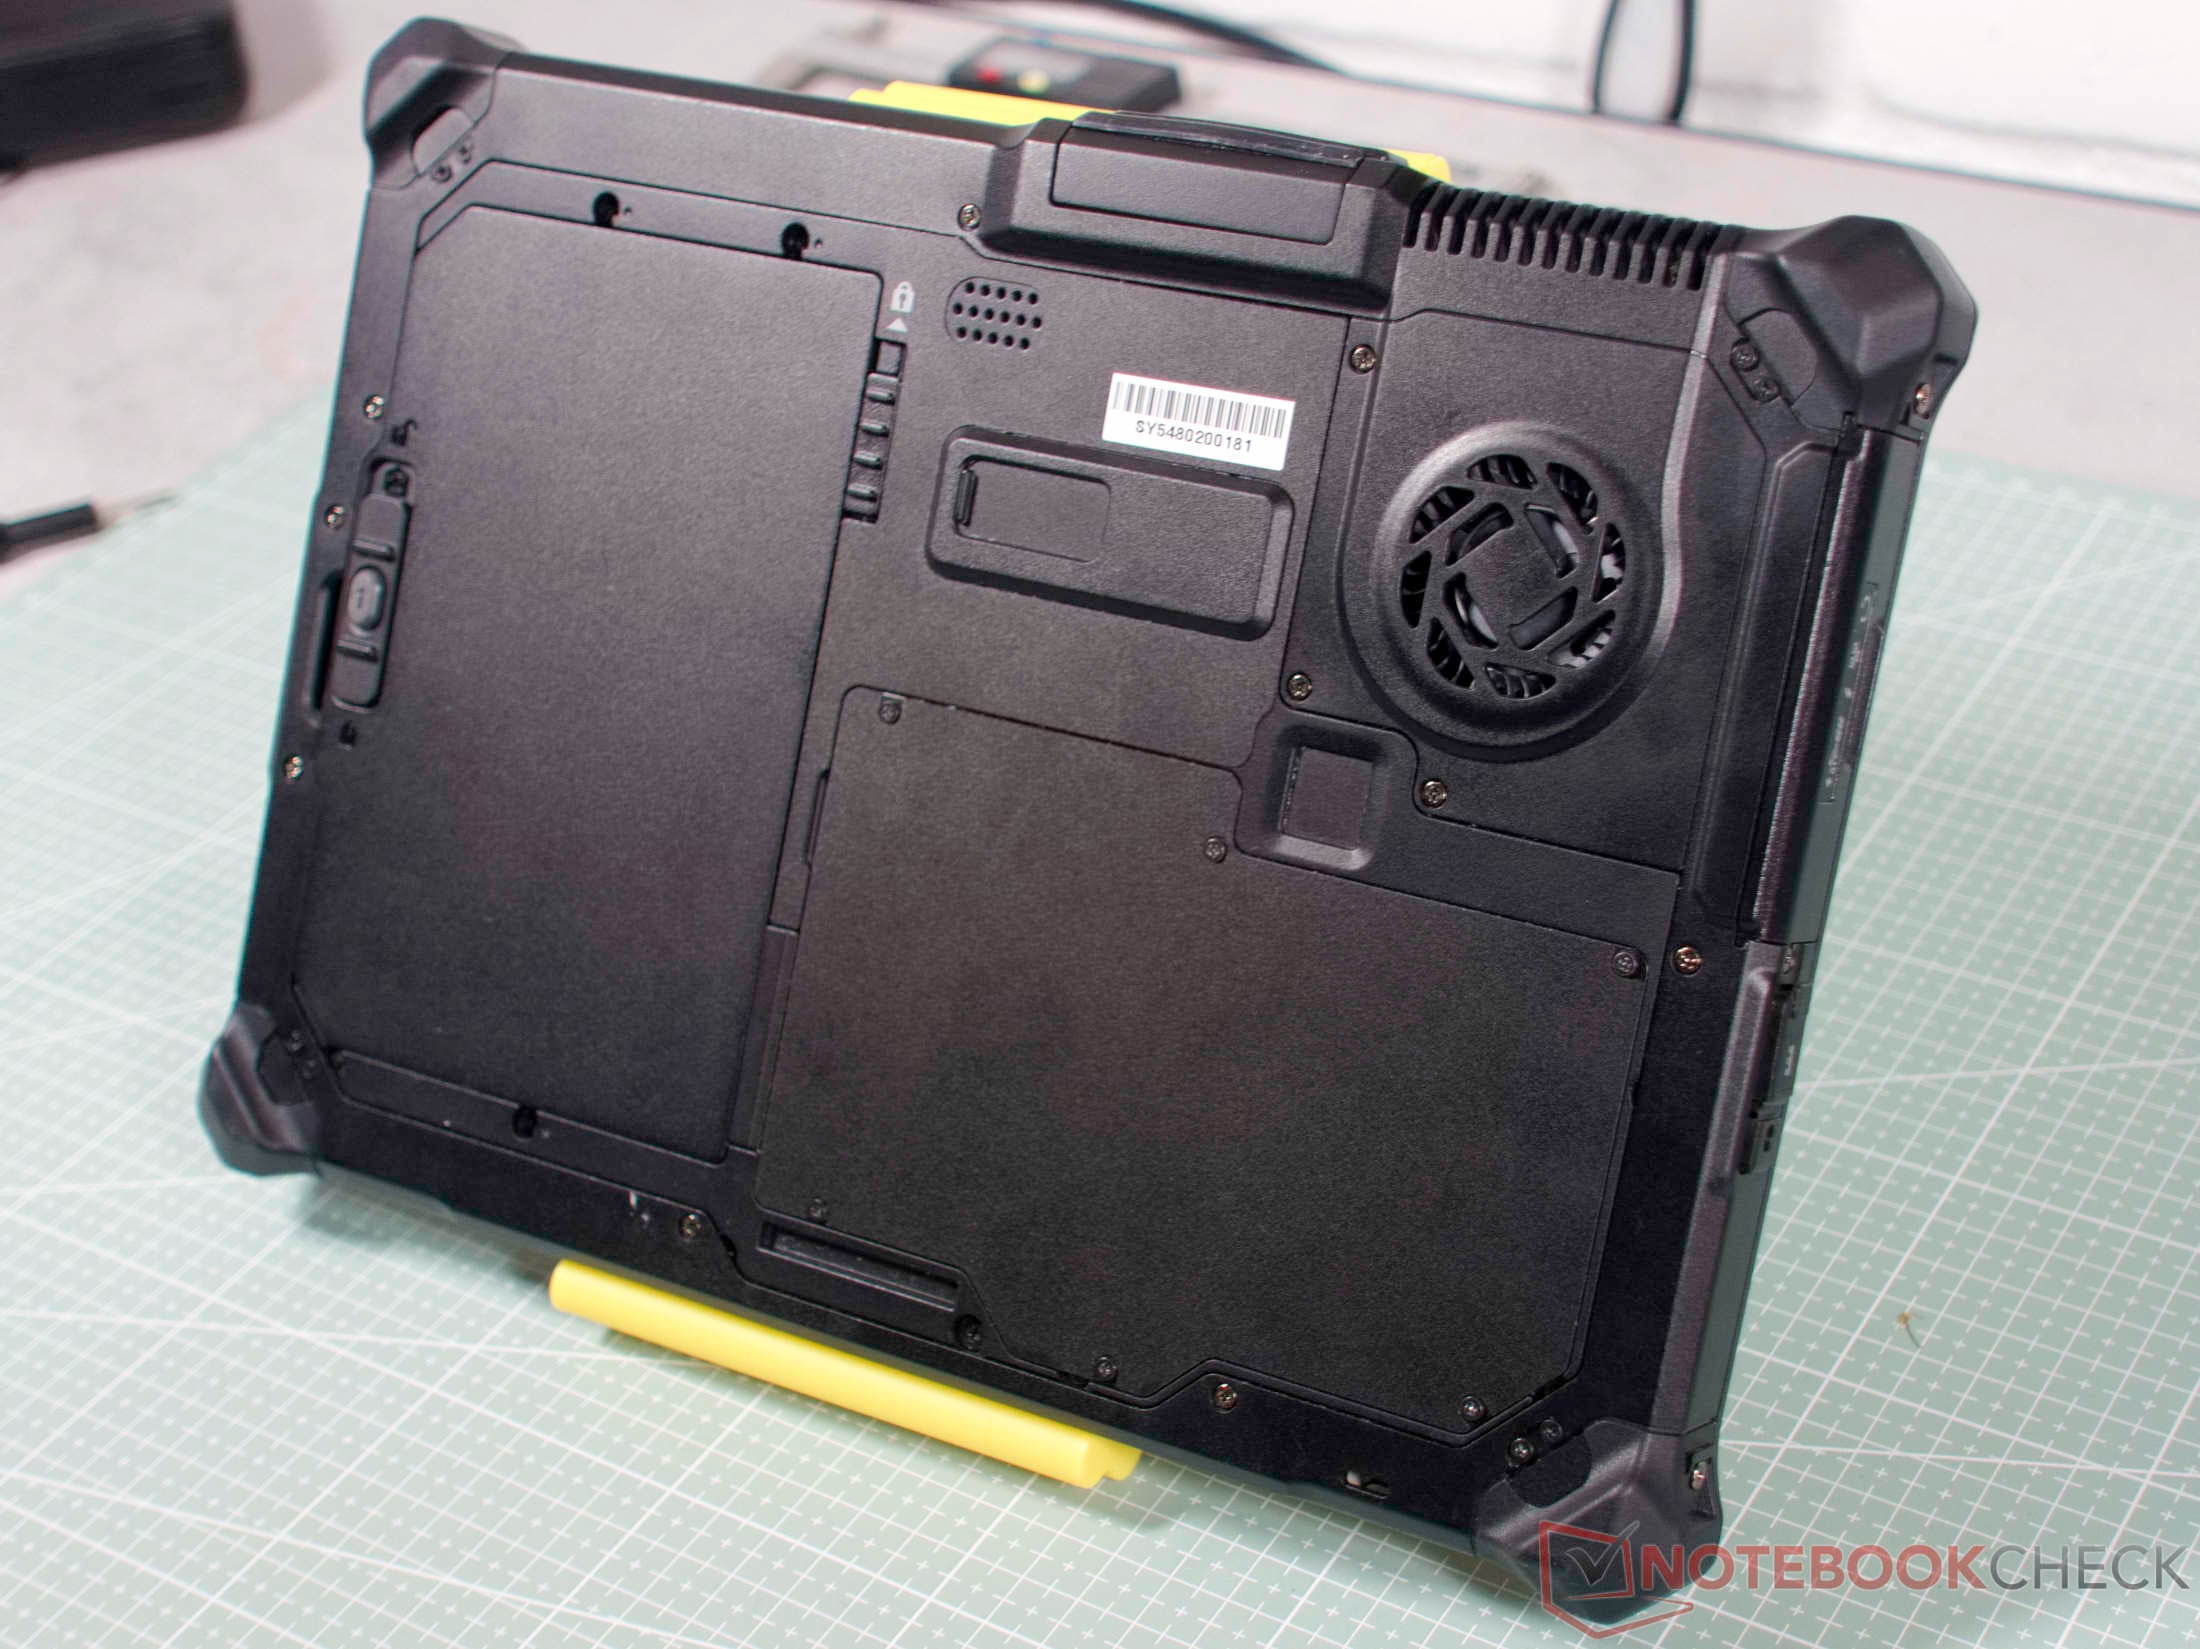
R10正是为应对这些严苛条件而设计。其镁合金外壳坚如坦克,能轻松承受剧烈跌落,并经过严格密封处理,有效防尘防水。然而,对于户外使用而言,最突出的亮点当属屏幕和电源系统。 经我们测试证实,其亮度远超 1,000 cd/m²,这款坚固耐用的平板电脑即使在阳光直射下也能轻松应对。它还配备了内置备用电池,支持真正的热插拔。这意味着主电池可以在设备运行时轻松拆卸并更换。
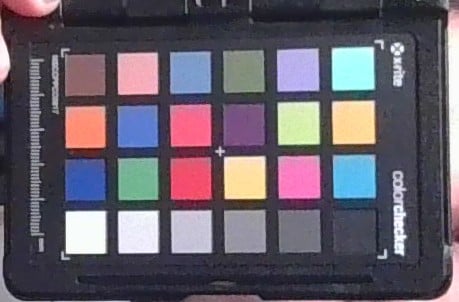
当然,这种程度的专业化需要做出一些妥协。对于对色彩要求极高的工作,这款显示屏——因其明显的绿色偏色——根本无法使用,而摄像头和内置单声道扬声器也仅能满足基本需求。 内置的英特尔酷睿Ultra 7 258V处理器能轻松应对日常办公和文档处理任务,但在测试中却因较高的DPC延迟而表现吃力,这可能会在实时数据采集过程中引发问题。此外,读卡器被笨拙地藏在电池后面。 值得肯定的是,即使在高负载下,这款笨重的机身也不会过热,而内部风扇在后台运转时发出的嗡嗡声也相当轻柔。
价格与供货情况
Durabook R10 的定价和供货情况主要面向专业客户。制造商在其官网上未列出价格;价格仅根据个人询价单独计算。这也是因为许多高度专业化的配置——这些配置是根据客户个人需求量身定制的——仅通过 Durabook 直接销售。这款坚固型平板电脑偶尔也能在专业零售店中找到。例如,零售商Ruggedbooks 列出了 搭载英特尔酷睿Ultra 5 226V处理器的入门款售价约为2,759欧元(约合3146美元)。而在Elmark-Automation ,采用相同处理器的类似配置起价约为2,730欧元(约合3,113美元)。
Table of Contents
技术规格
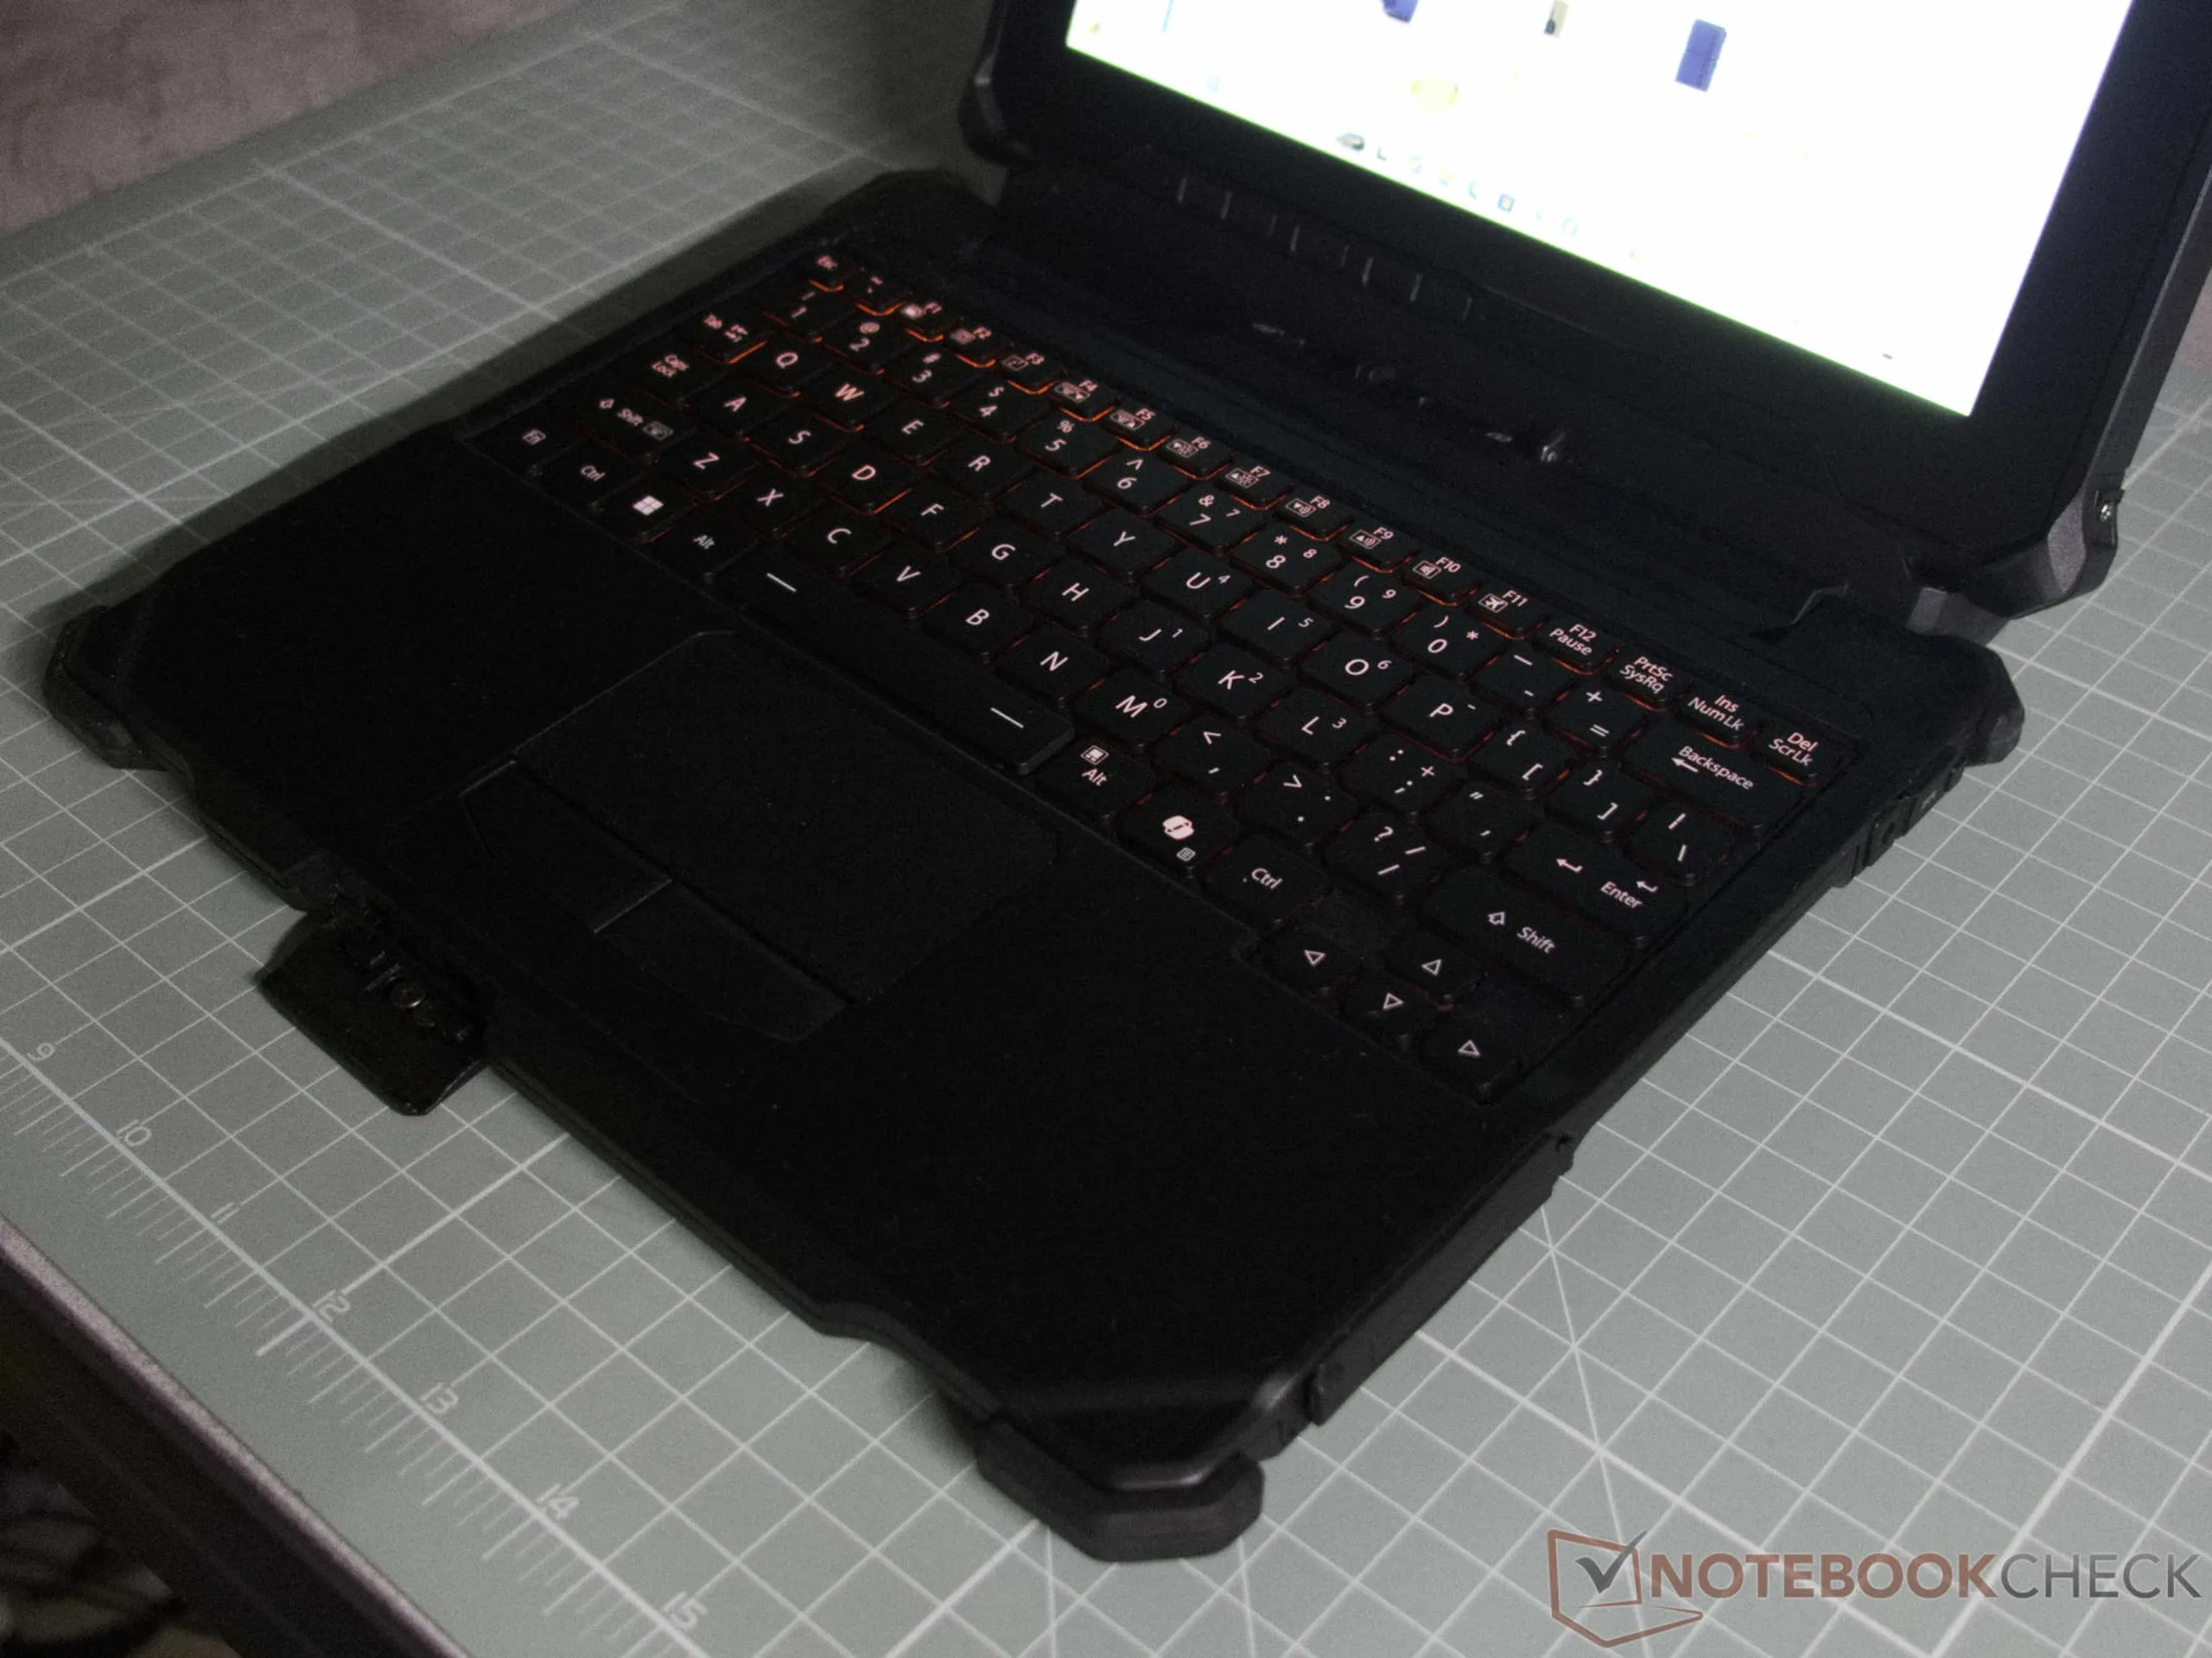
机箱、配件和输入设备
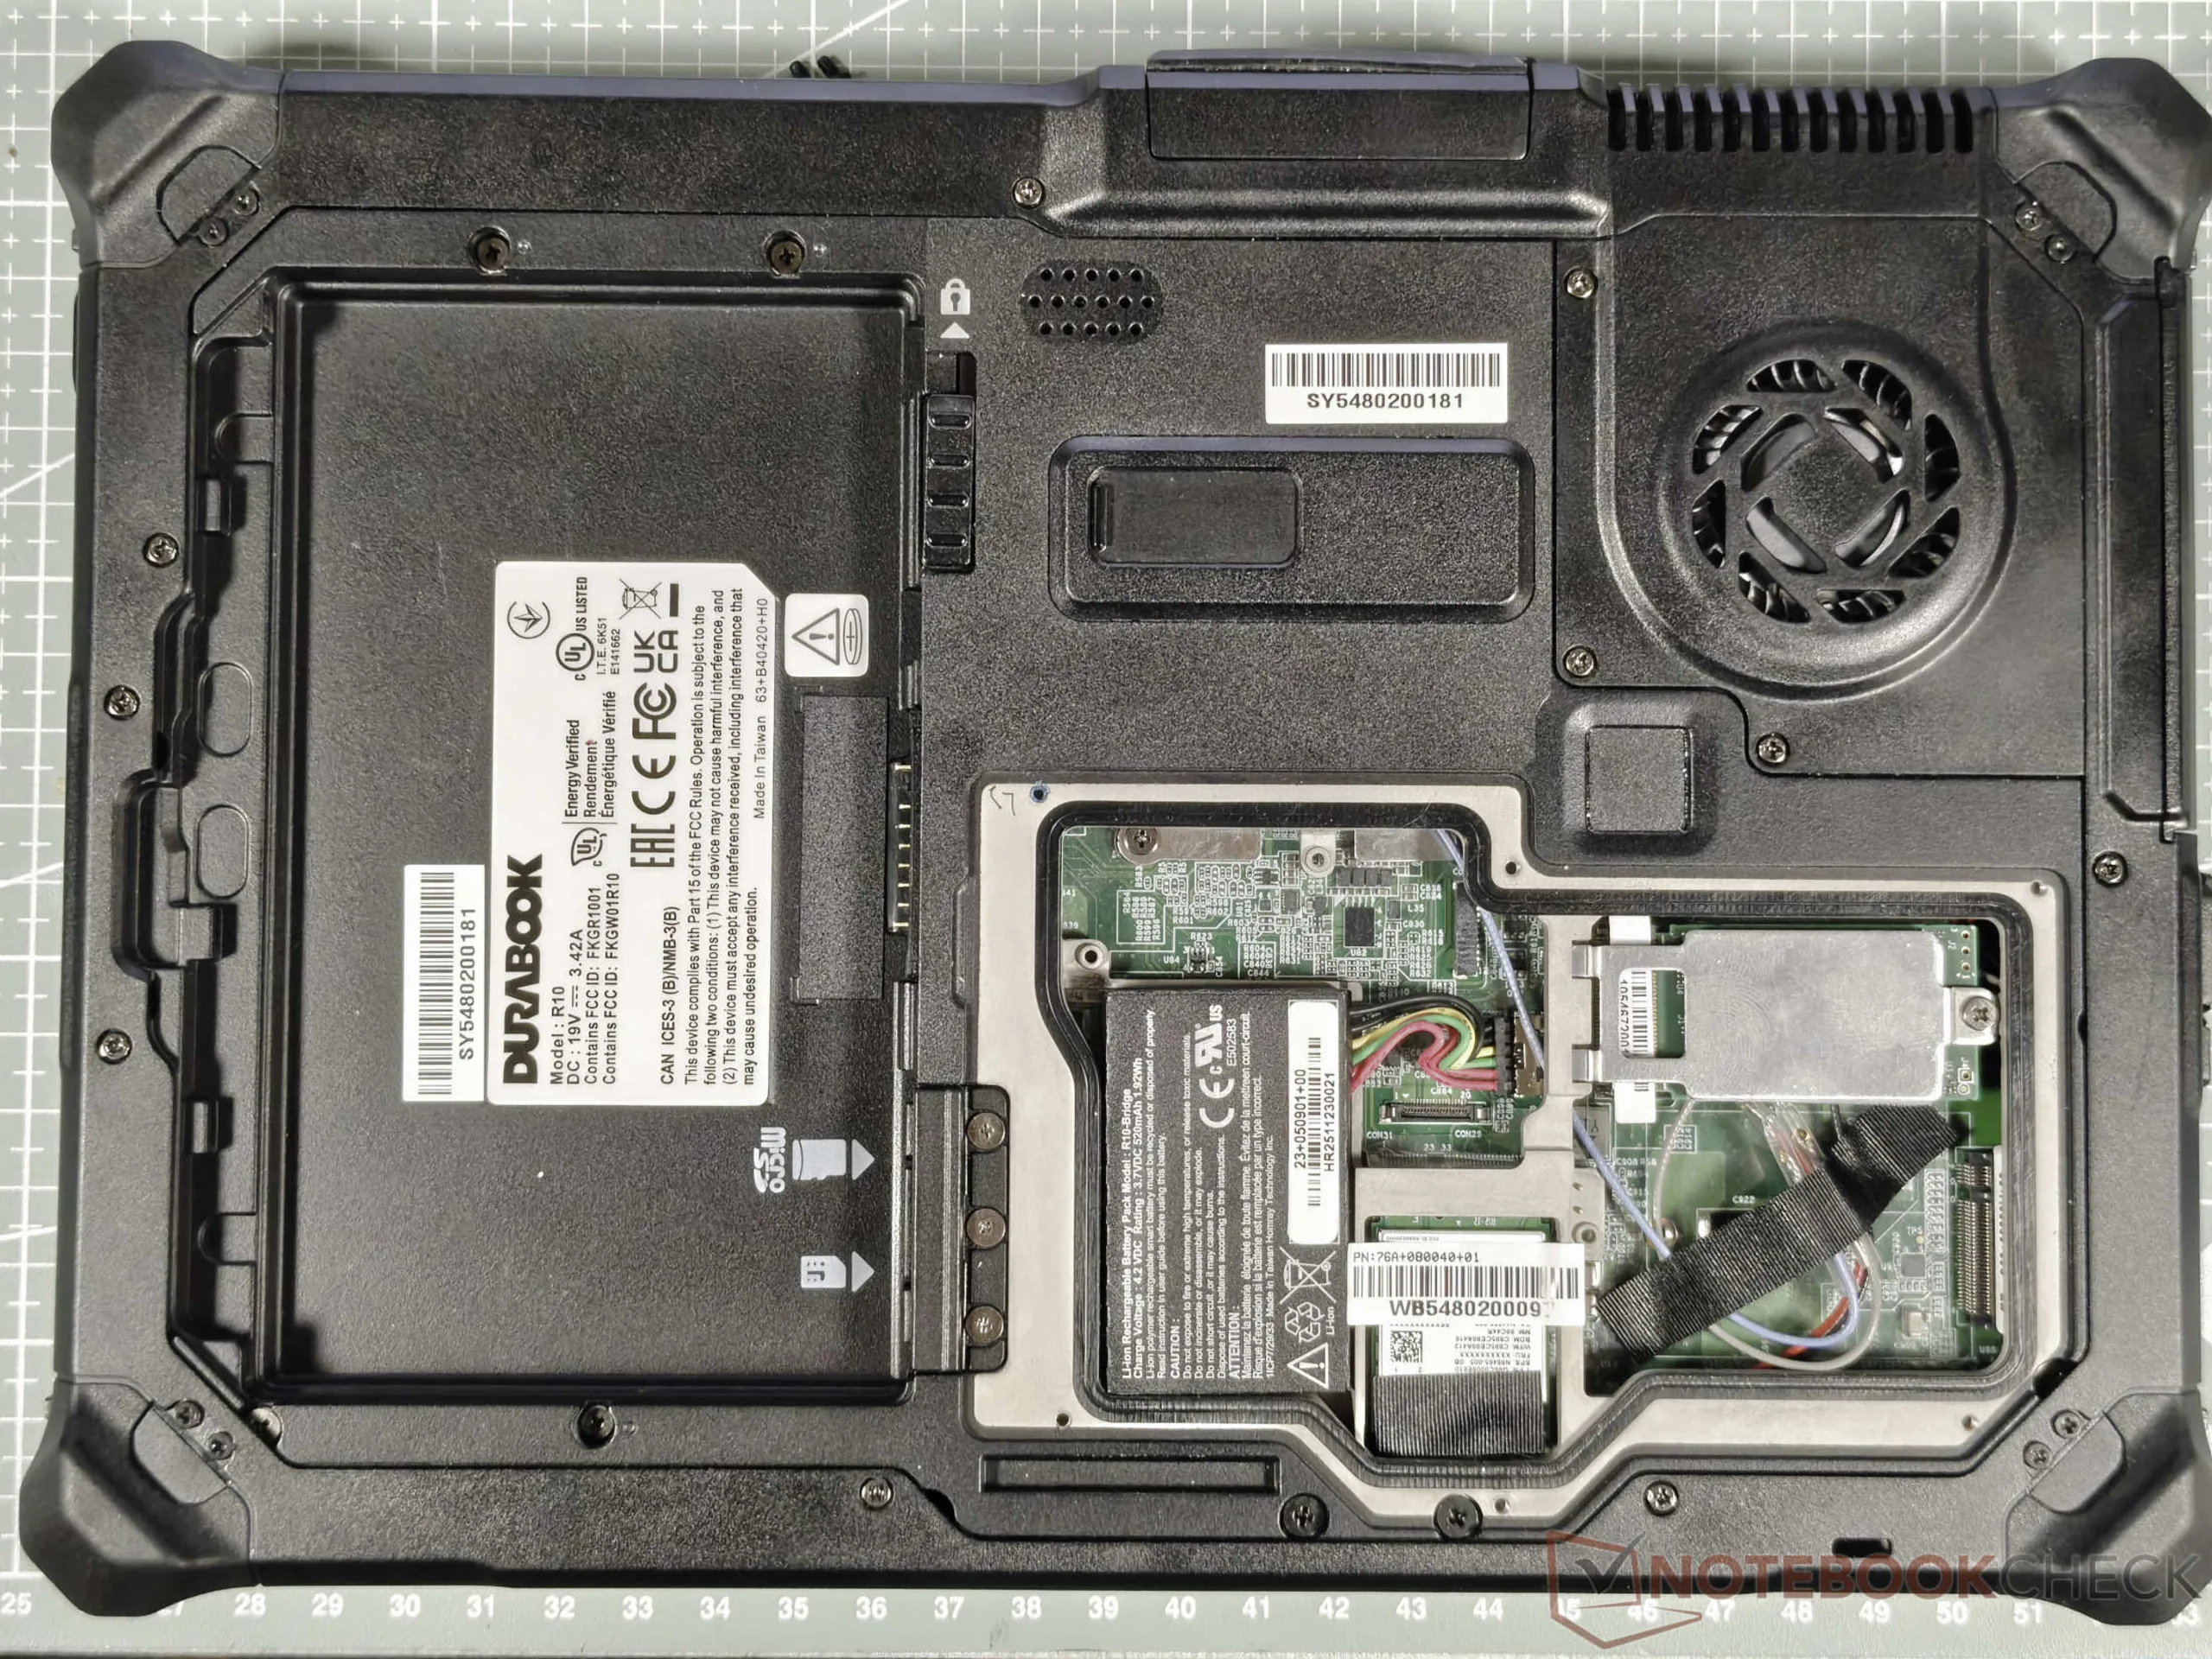
Durabook R10 的机身采用坚固的镁合金材质,非常适合最严苛的工作环境。 该平板电脑通过了美国军用标准 MIL-STD-810H 认证,设计可承受高达 1.8 米(约 5.9 英尺)的跌落,并能适应极端环境条件。此外,其 IP66 认证确保了设备具备防尘和抗高压水柱冲刷的能力。 对于敏感应用,MIL-STD-461F 认证还保证了出色的电磁兼容性。
Durabook Z14I-HG:为极端环境提供人工智能动力
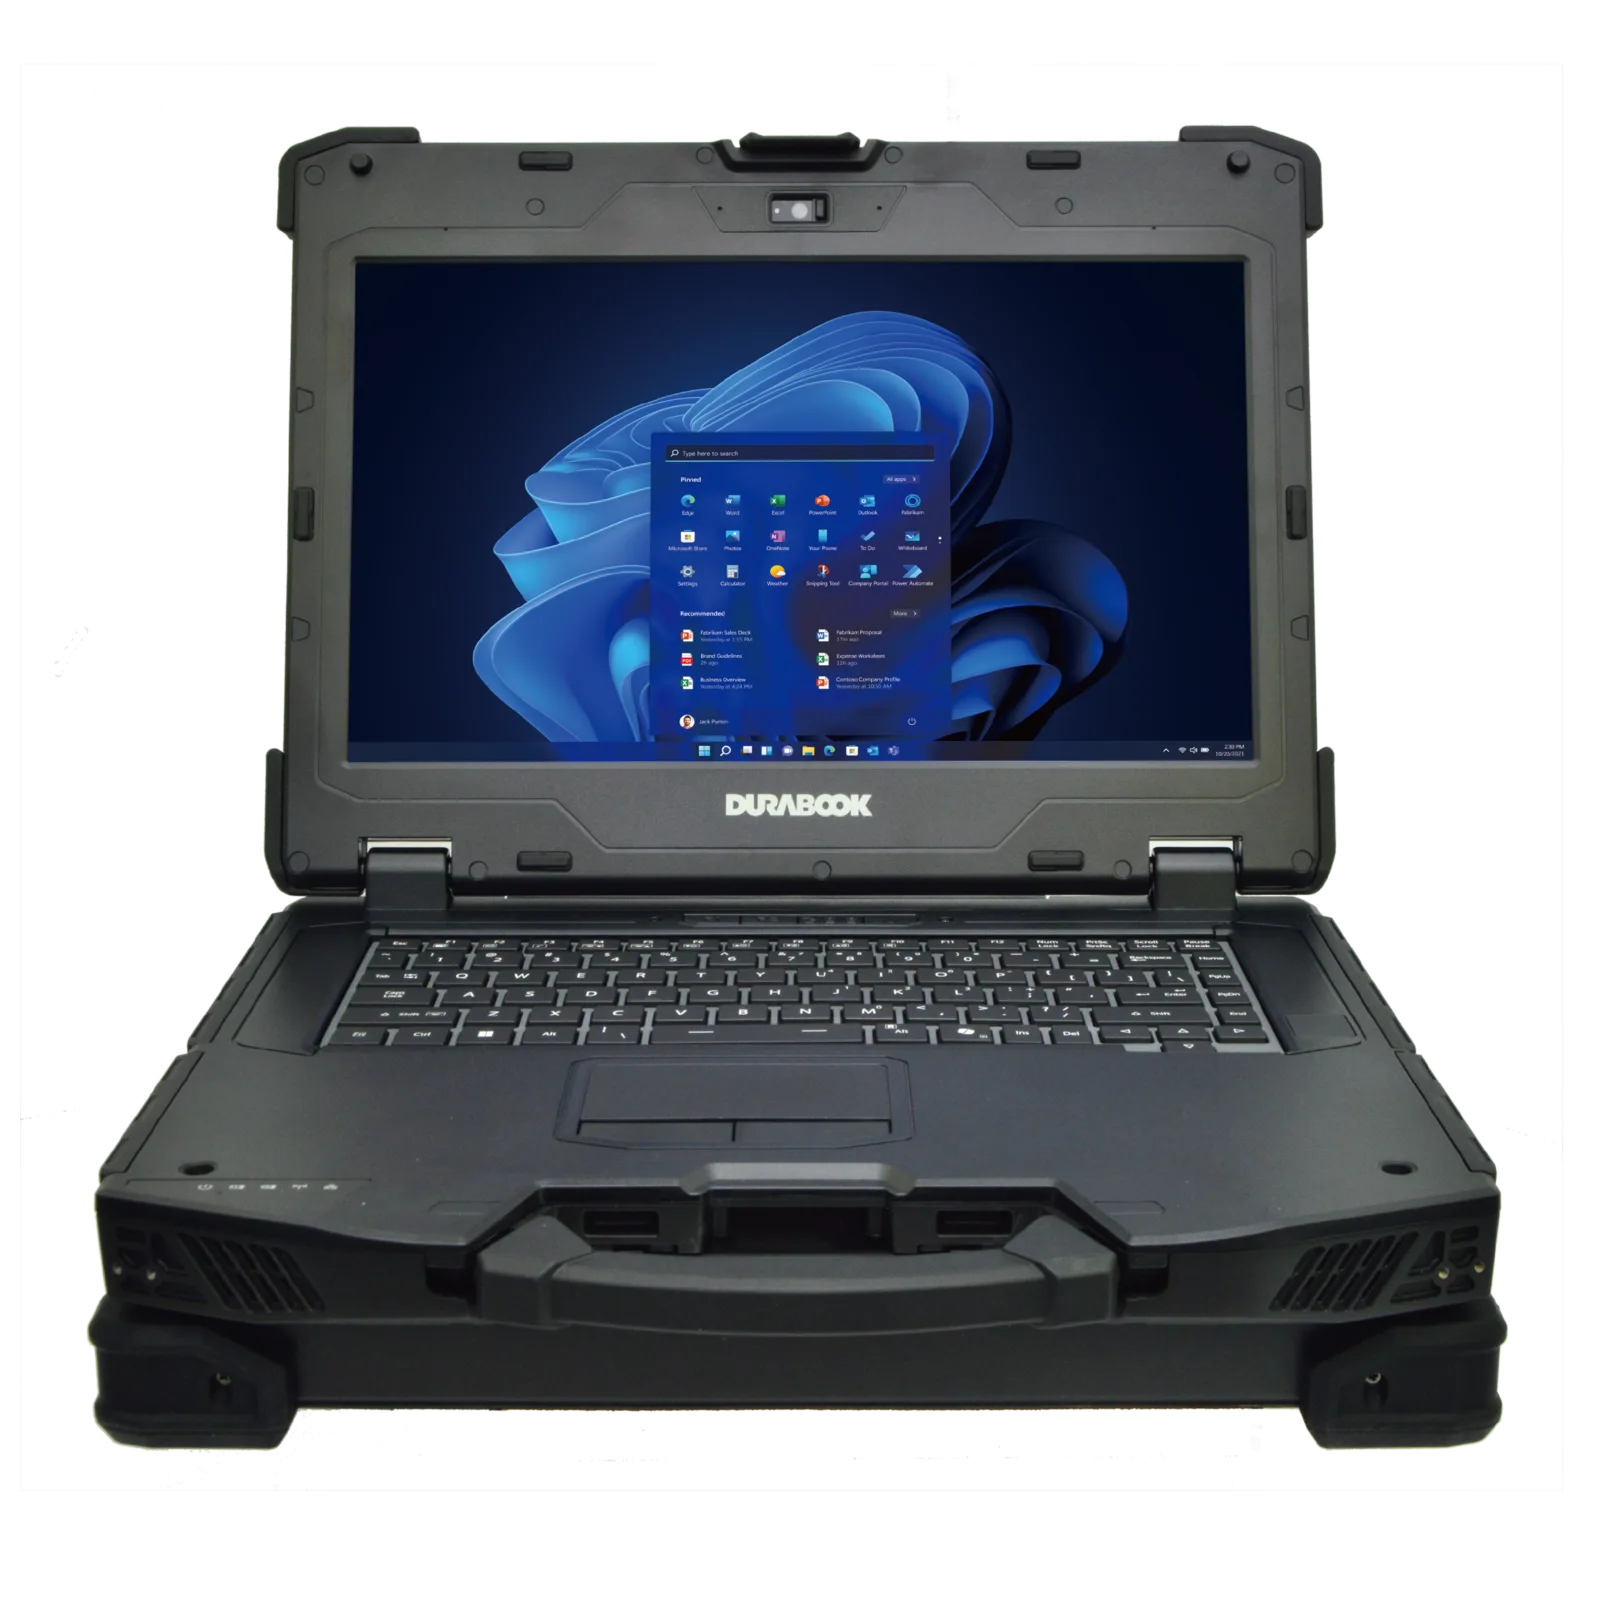
Durabook 凭借 Z14I-HG 推出了新一代移动工作站:完全坚固耐用、支持人工智能,专为现场最严苛的应用场景而设计。这款 14 英寸系统将高达 682 TOPS 的边缘 AI 性能与强大的英特尔® 酷睿™ Ultra 处理器相结合。 该设备还配备了 AI Boost NPU,并可选配 NVIDIA® RTX™ 3500 Ada(12 GB)或 RTX™ 5000 Ada(16 GB)GPU。 无论是在工业自动化、现场服务还是技术研究等领域,凡是依赖强大且坚固耐用硬件的用户,都能从快速的人工智能分析和专业级图形性能中获益,从而实现移动高性能计算。
无论是实时 3D 渲染、AI 推理还是数据密集型仿真——Z14I-HG 都能在本地处理高负载工作任务。这有效降低了延迟。同时,摆脱对云服务提供商的依赖增强了数据安全性,例如在检测、预测性维护或数字孪生应用中。
该系统已通过 MIL-STD-810H、MIL-STD-461G 和 IP66 认证,能够承受极端温度、湿度和电磁干扰。 此外,1200尼特的DynaVue®显示屏即使在阳光直射下仍能保持完美的可读性,并支持多种输入模式以及多屏配置。
Z14I-HG工作站现已上市,可直接向Durabook订购。
连接性
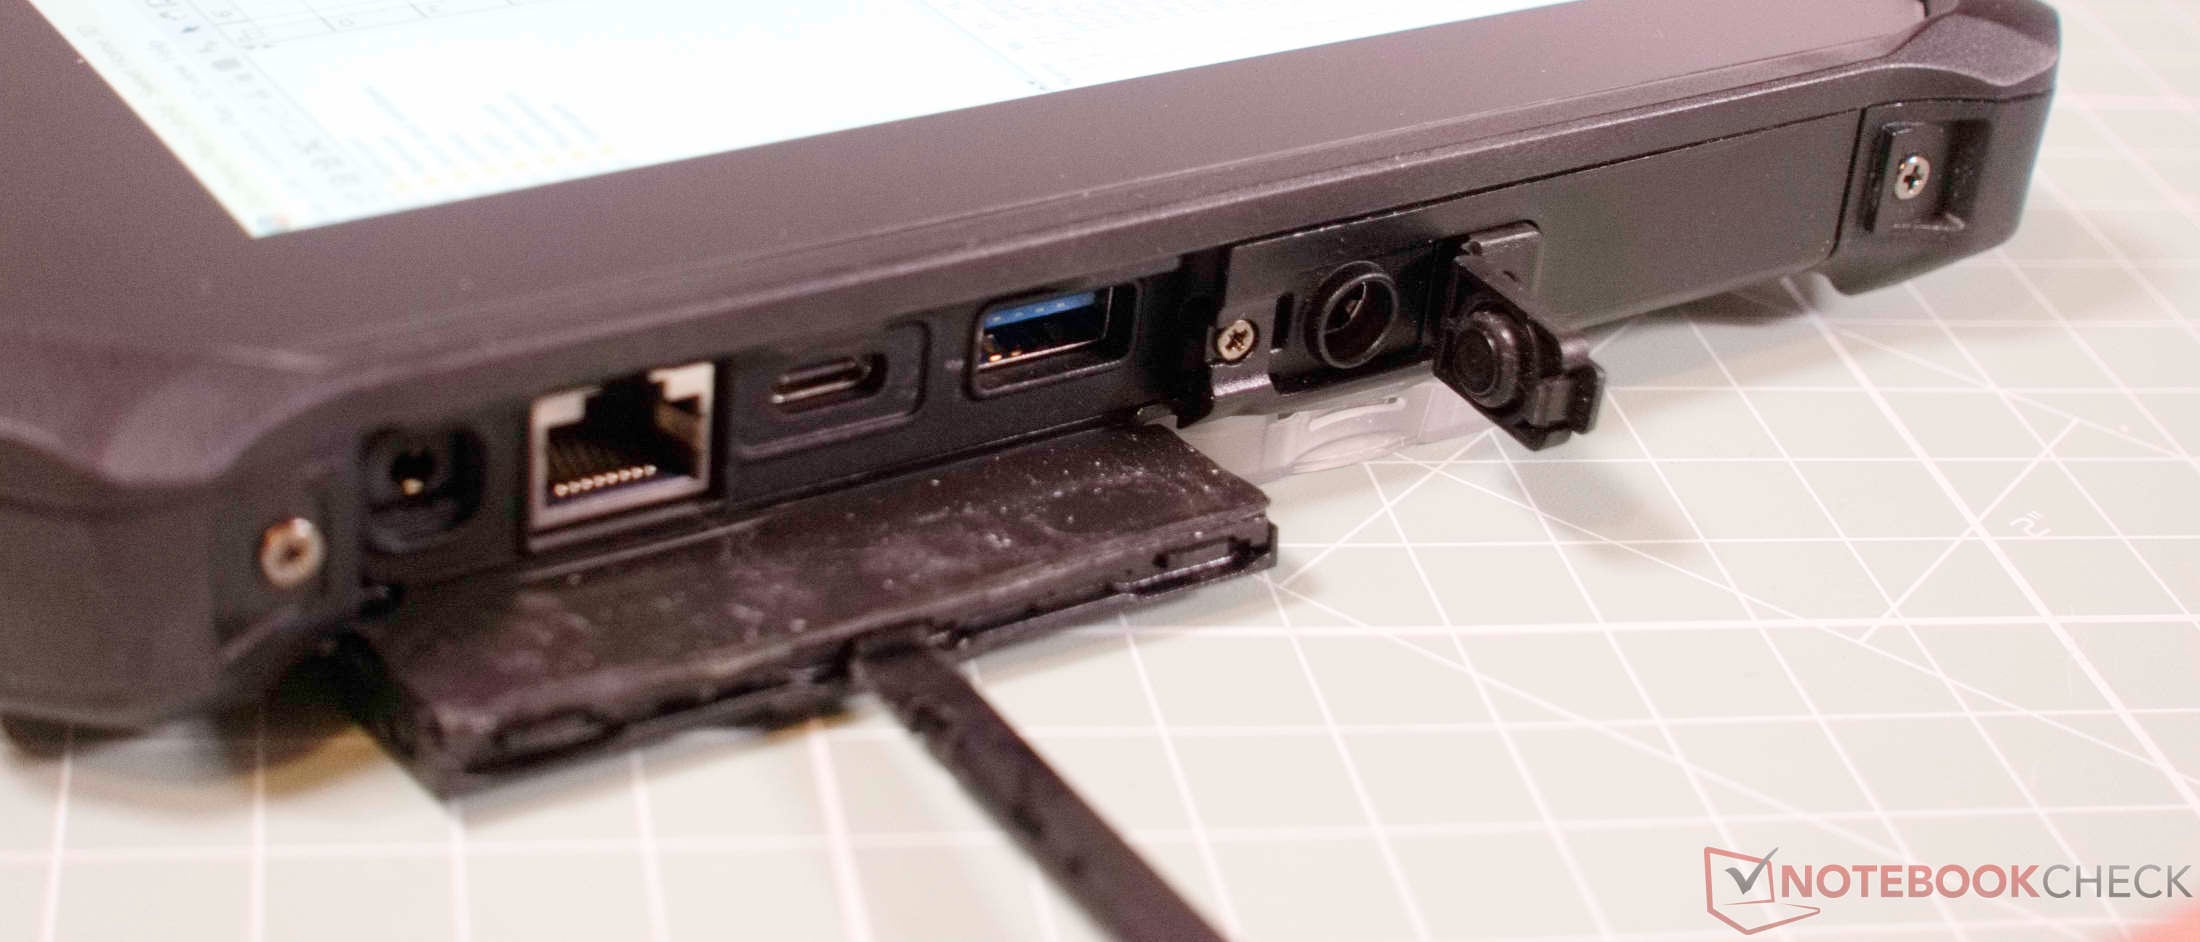
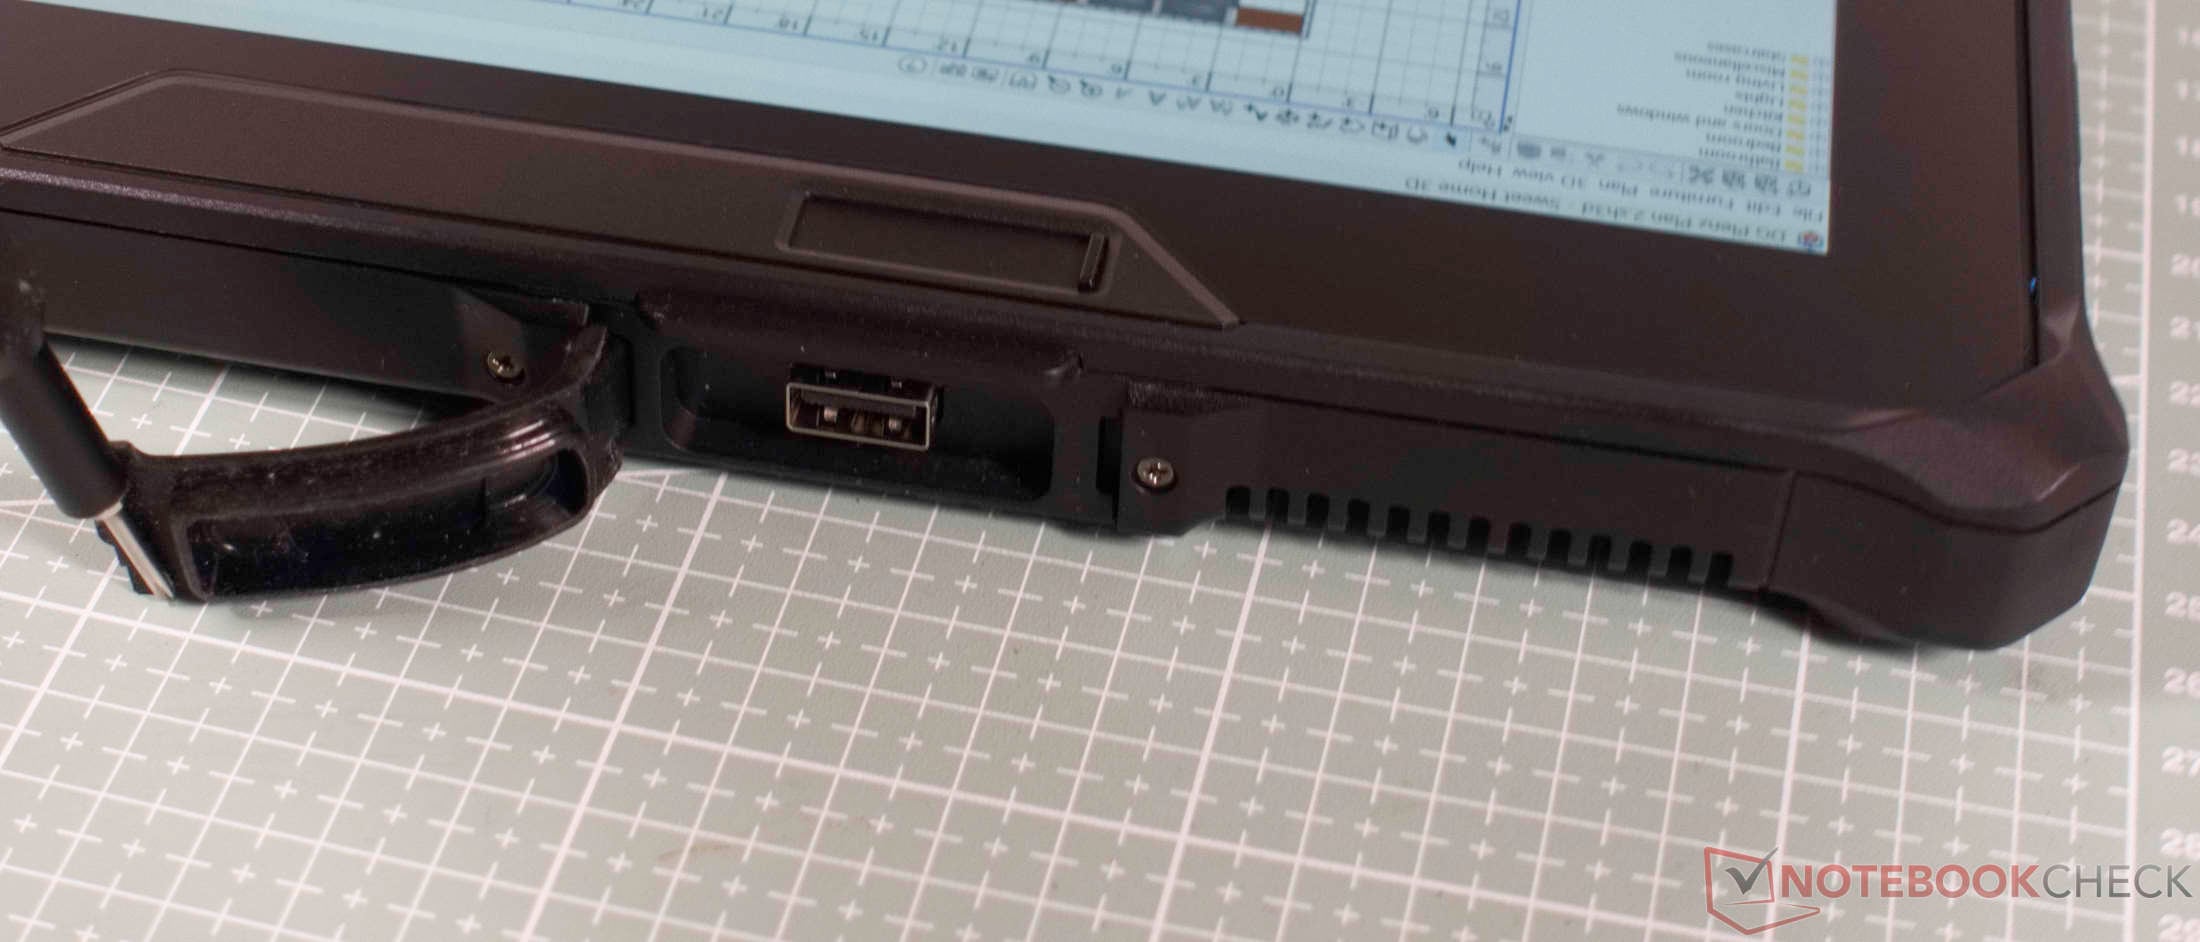
所有接口均隐藏在坚固的保护盖后方。该平板电脑配备了一个支持雷电(Thunderbolt)、DisplayPort 和 Power Delivery 功能的现代 USB-C 接口。此外,还配备了一个 RJ-45 千兆以太网端口、一个耳机插孔和一个标准电源插孔。
平板电脑背面还配备了一个生物识别指纹扫描仪,用于安全登录系统。 遗憾的是,内置的 SD 卡读卡器位置较为隐蔽,位于电池内部。不过,其读卡速度还算快。平板内部还设有用于扩展卡的空插槽。在无线连接方面,这款坚固型平板支持 Wi-Fi 7 和蓝牙 5.4。
| SD Card Reader | |
| average JPG Copy Test (av. of 3 runs) | |
| Durabook R10 | |
| Dell Latitude 7030 Rugged Extreme (AV Pro V60) | |
| Durabook R8 Tablet (AV Pro V60) | |
| Average of class Tablet (10.2 - 79.2, n=44, last 2 years) | |
| Dynabook Portege Z40L-N (AV PRO microSD 128 GB V60) | |
| maximum AS SSD Seq Read Test (1GB) | |
| Dell Latitude 7030 Rugged Extreme (AV Pro V60) | |
| Durabook R10 | |
| Dynabook Portege Z40L-N (AV PRO microSD 128 GB V60) | |
| Average of class Tablet (n=1last 2 years) | |
| Durabook R8 Tablet (AV Pro V60) | |
相机
全高清前置摄像头完全足以满足视频会议的需求。后置的1100万像素主摄像头拍摄微距照片效果令人印象深刻,但由于自动对焦速度较慢且动态范围较窄,在拍摄广角照片时表现欠佳。得益于内置闪光灯,即使在光线昏暗的房间内,该摄像头仍能正常使用。


输入设备
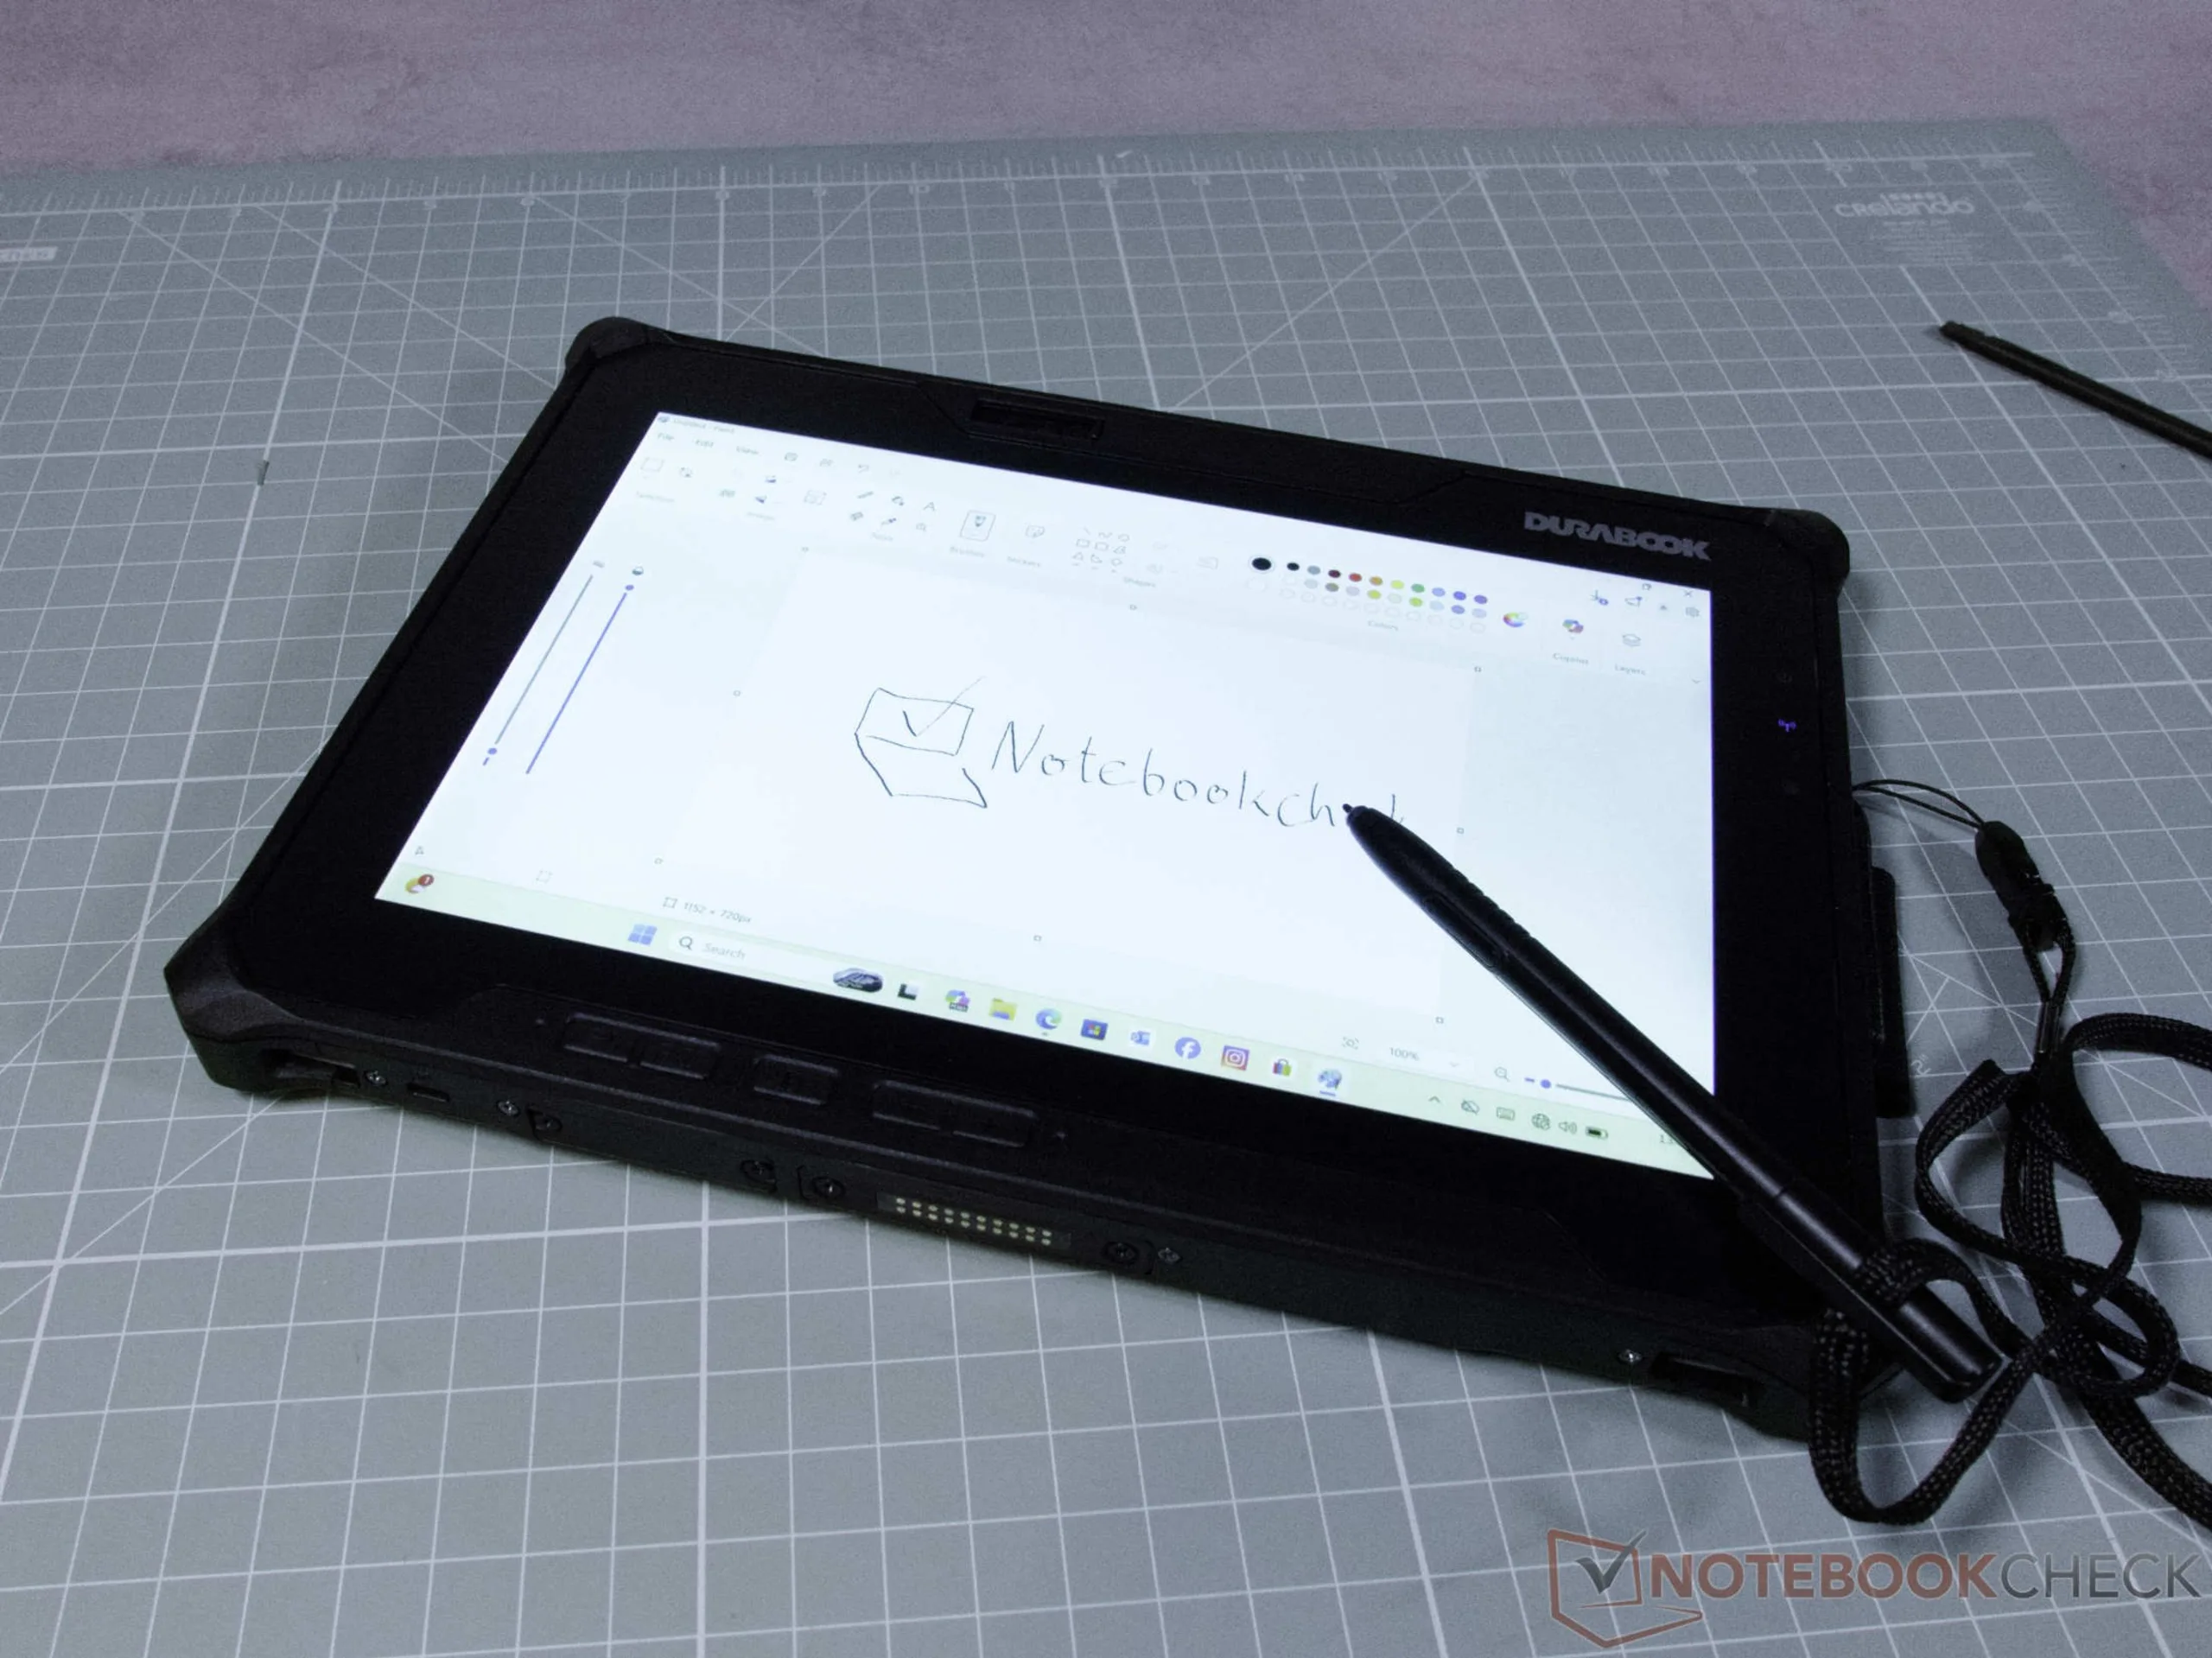
除了触摸屏外,Durabook R10 还配备了六个可自定义功能的按键。不过,触摸屏仍是核心控制元件,并可根据恶劣的工作环境进行灵活优化。例如,可以切换触摸模式,使屏幕在佩戴厚实防护手套或潮湿环境下仍能可靠地识别输入。 对于详细的蓝图或草图,屏幕支持 Microsoft Pen Protocol 1.51 协议。
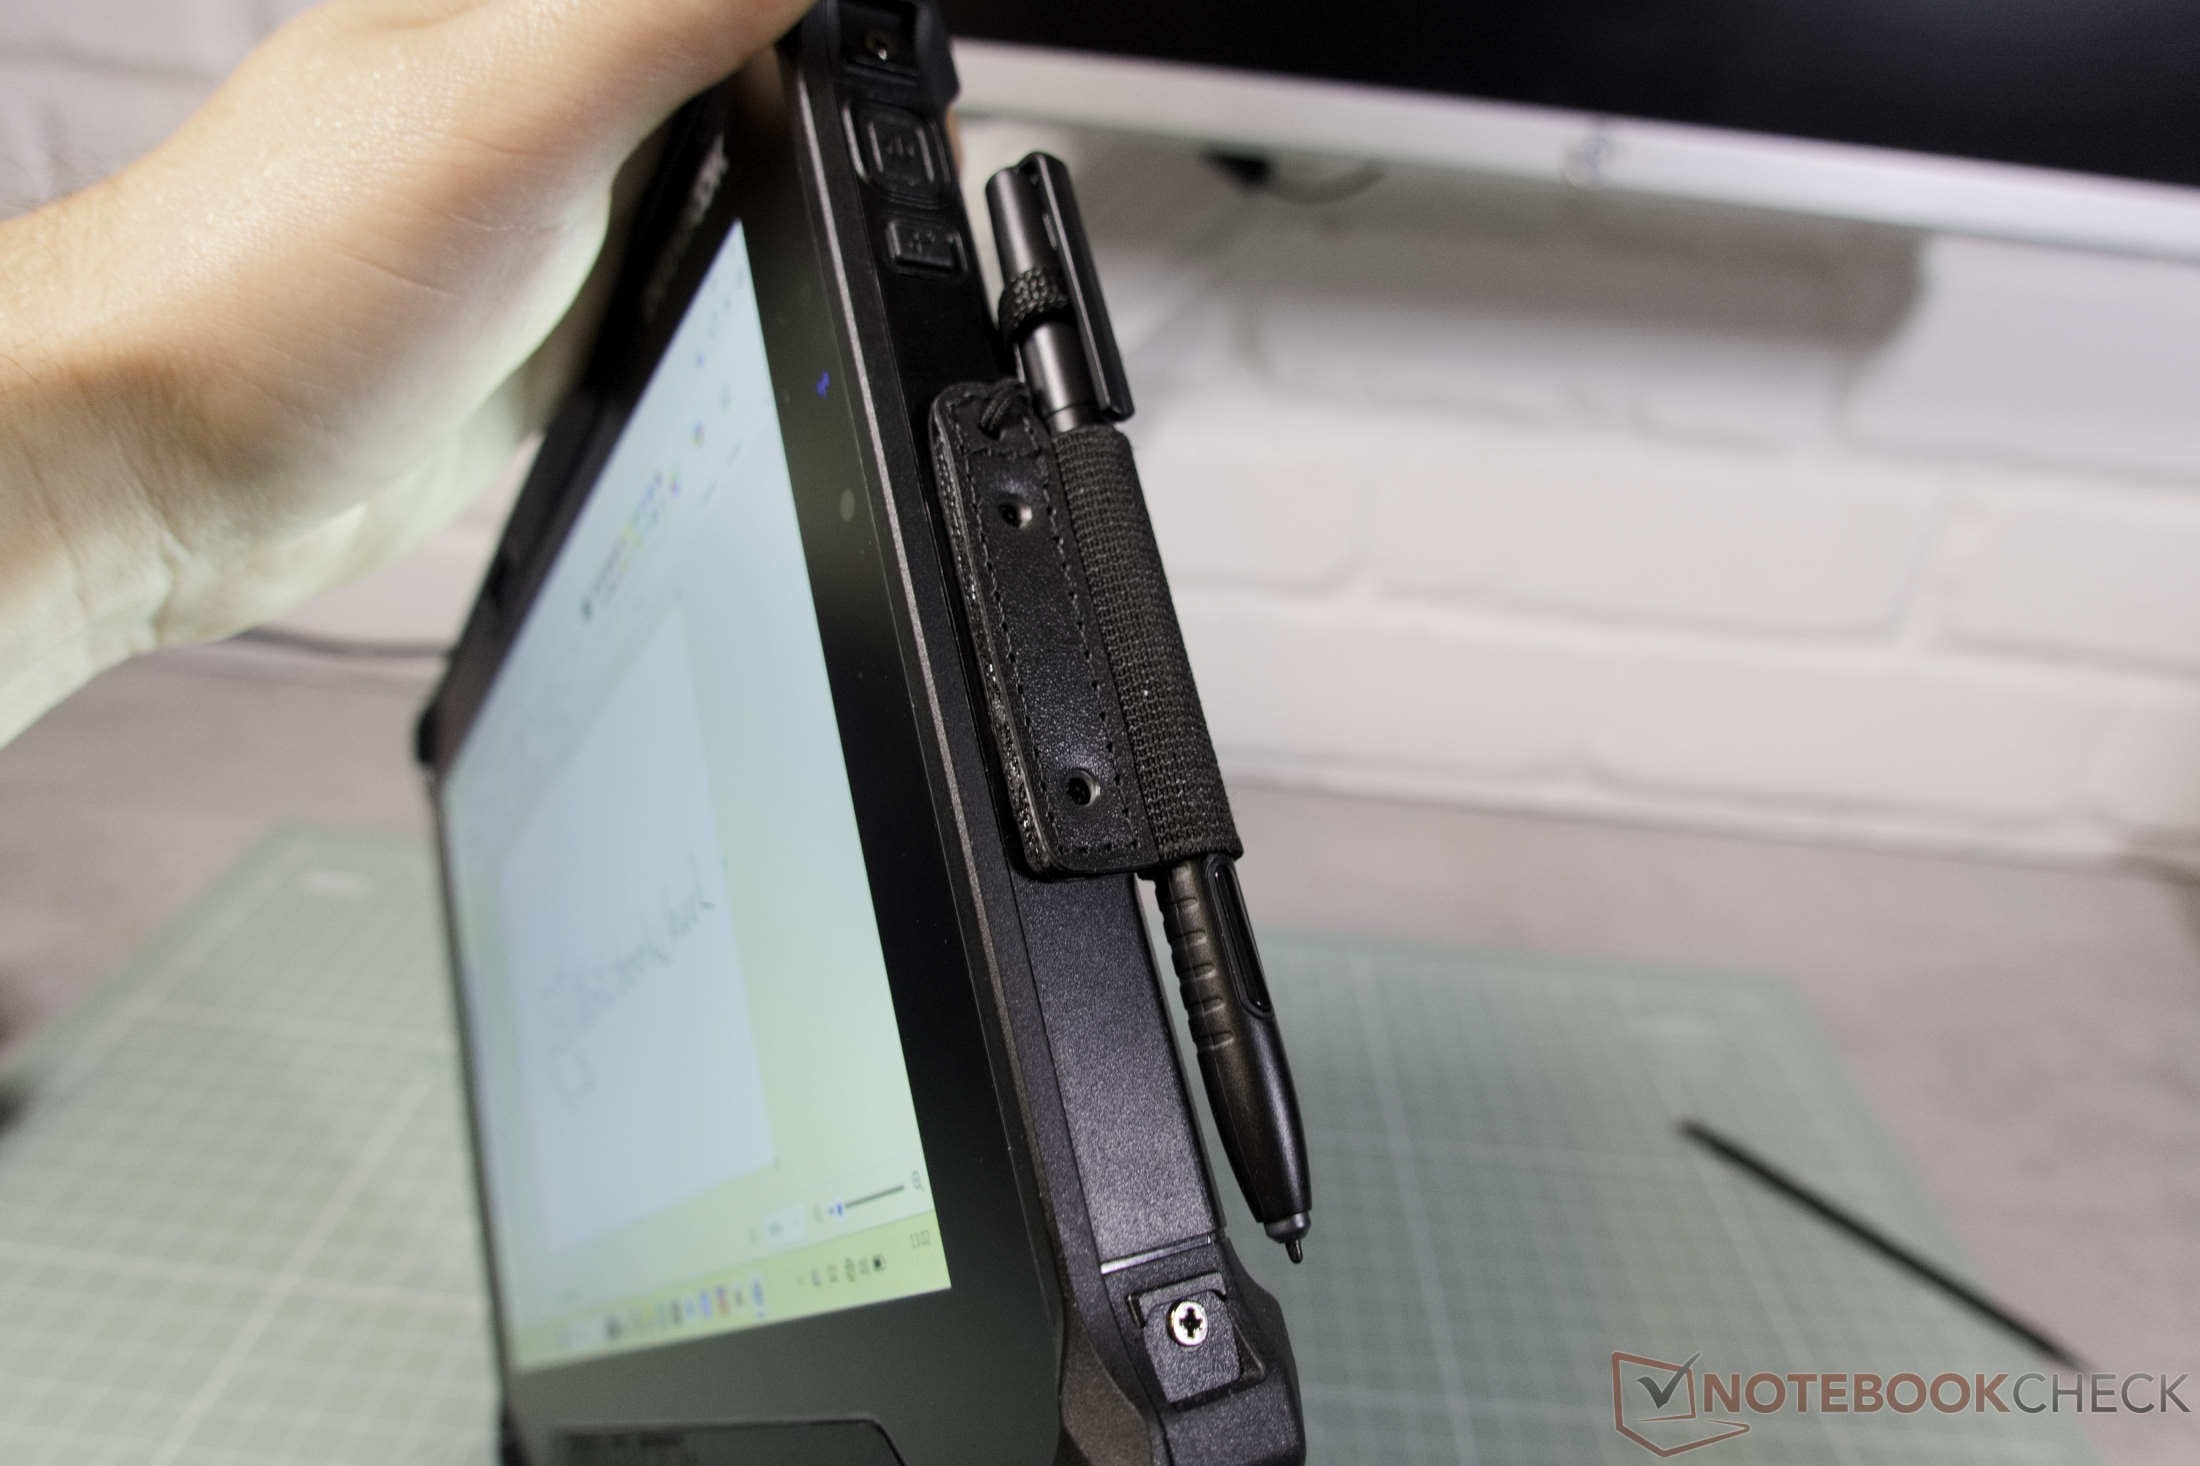
Durabook 触控笔出乎意料地轻盈,却精准度极高。可选配的笔架可通过螺丝固定在平板上,并配有笔绳以确保安全。
此外,该平板电脑还可选配升级为可拆卸型号。配套的键盘模块配备护眼红色背光,并提供多个额外接口。标配两个 USB-A 3.2 接口,并可根据需要配置 HDMI 或 LAN 接口。键盘单元还配备了一个额外的充电接口。
显示
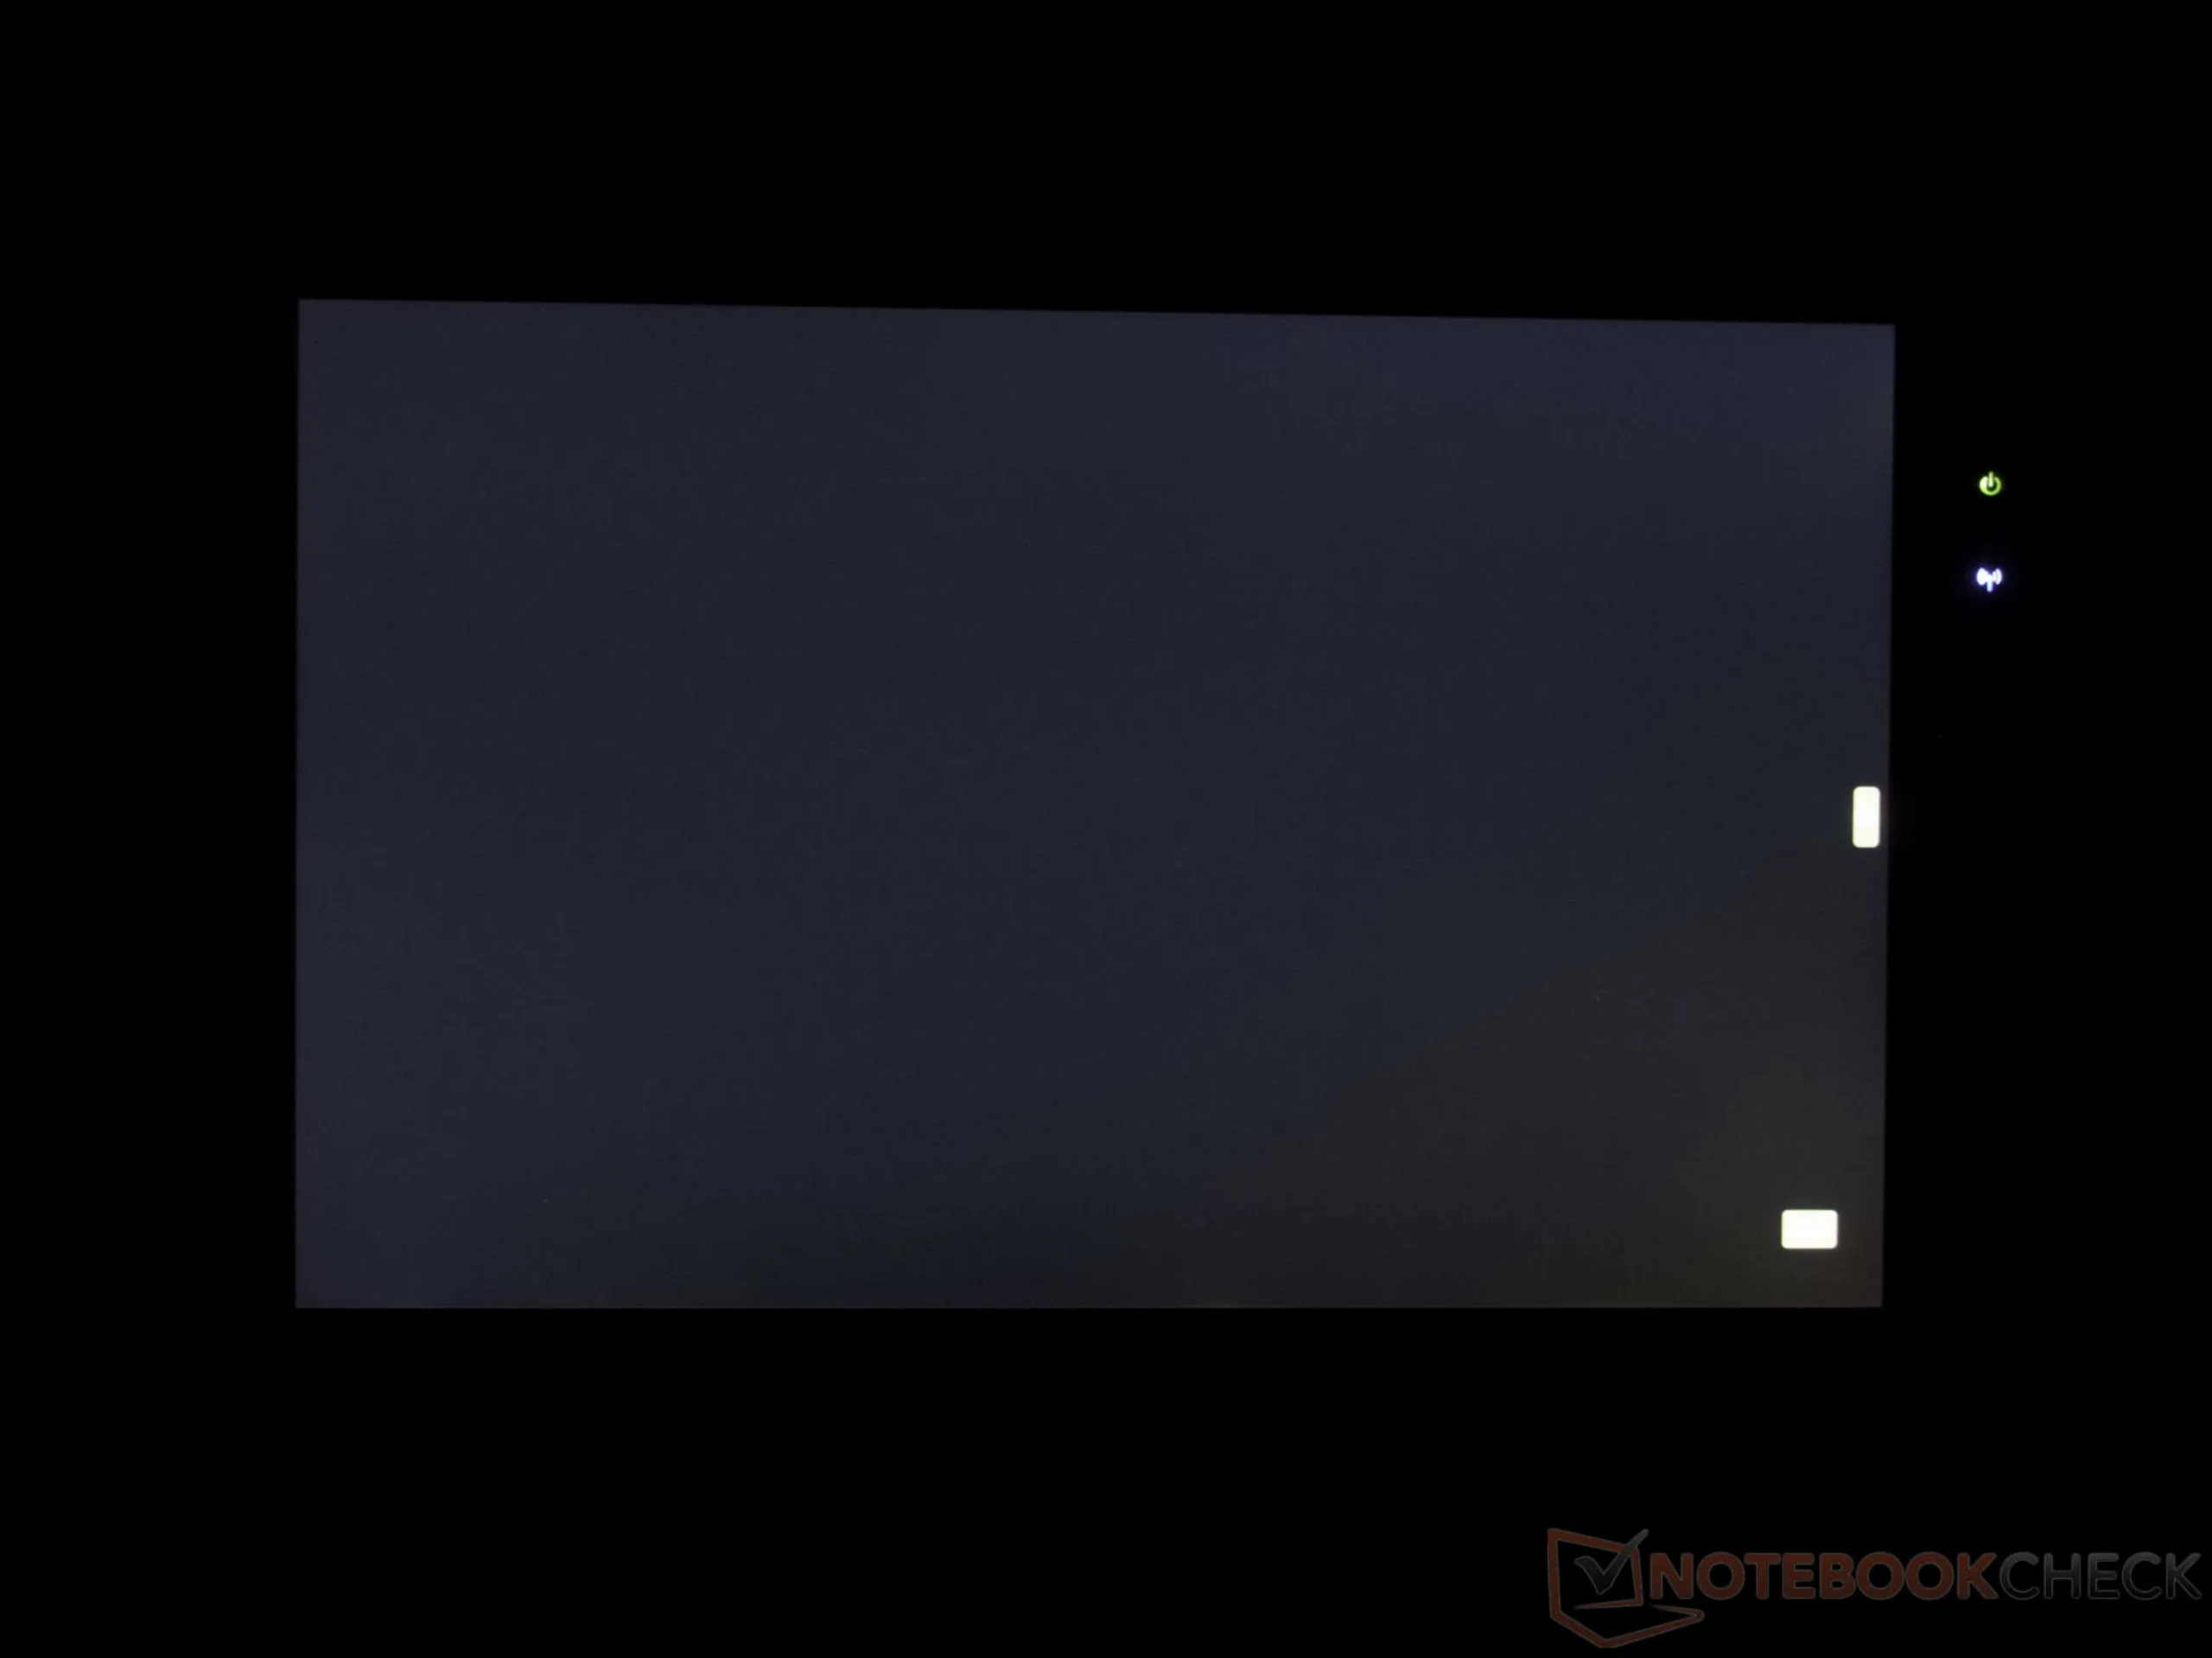
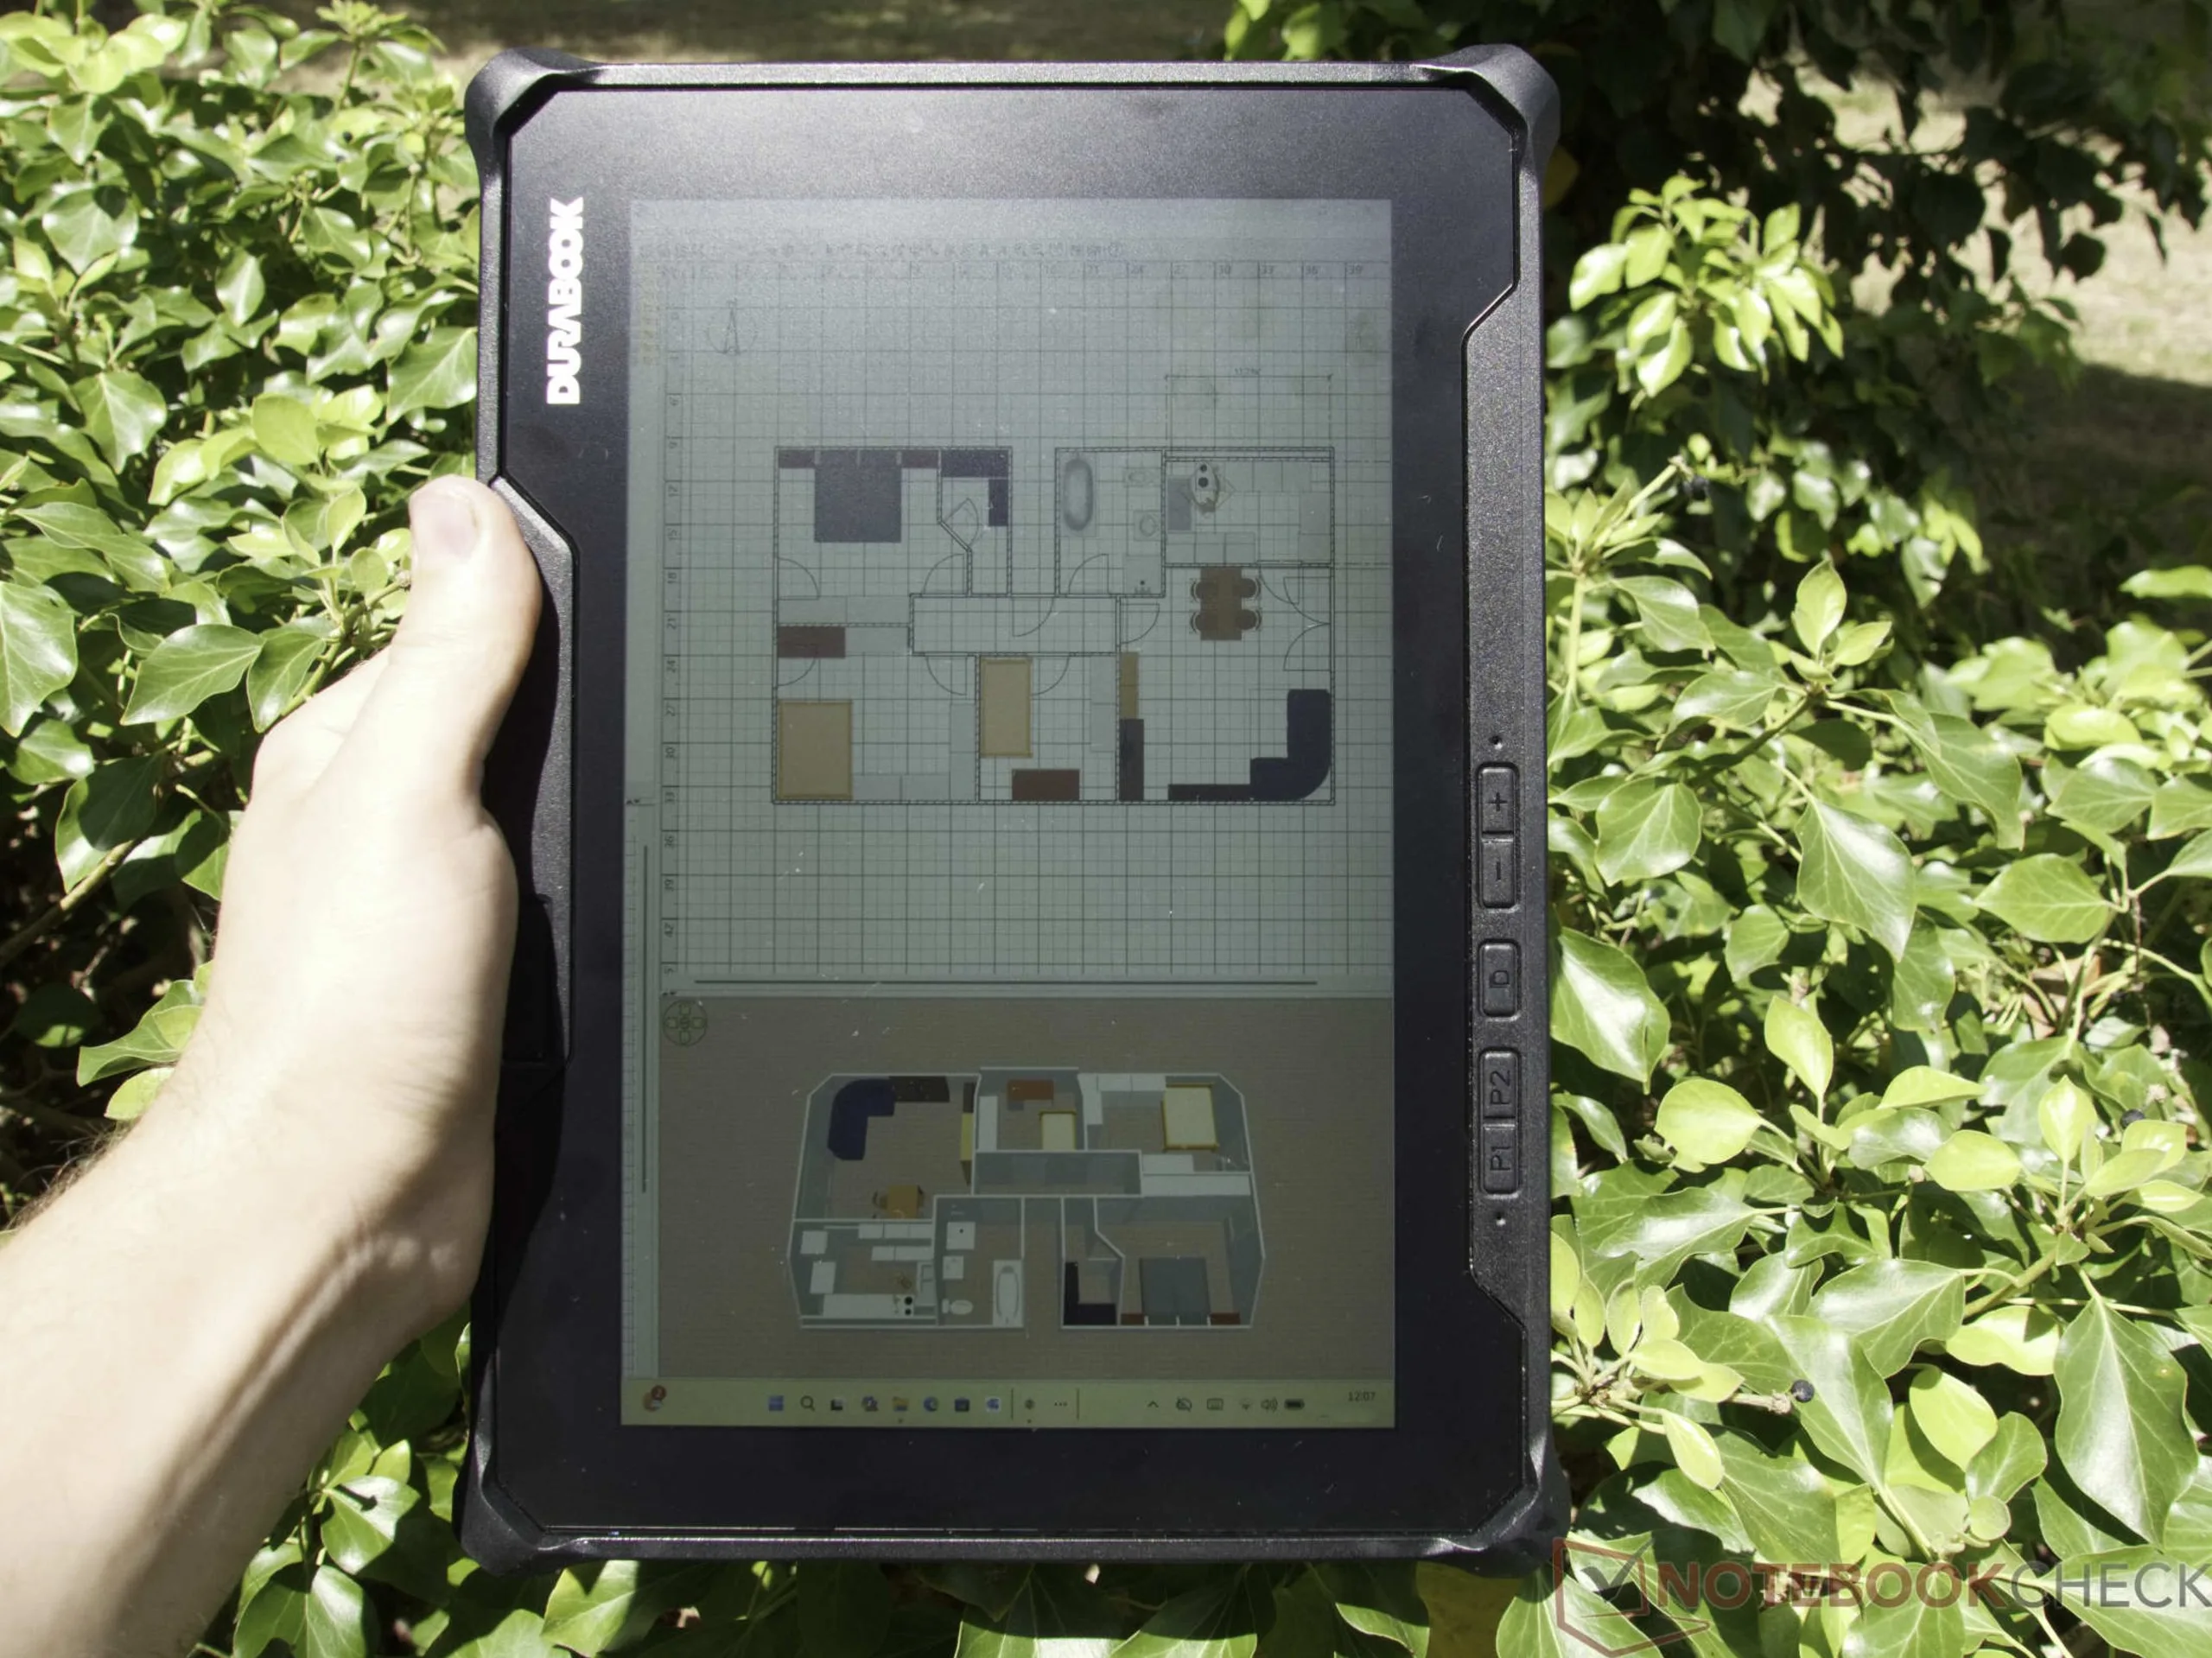
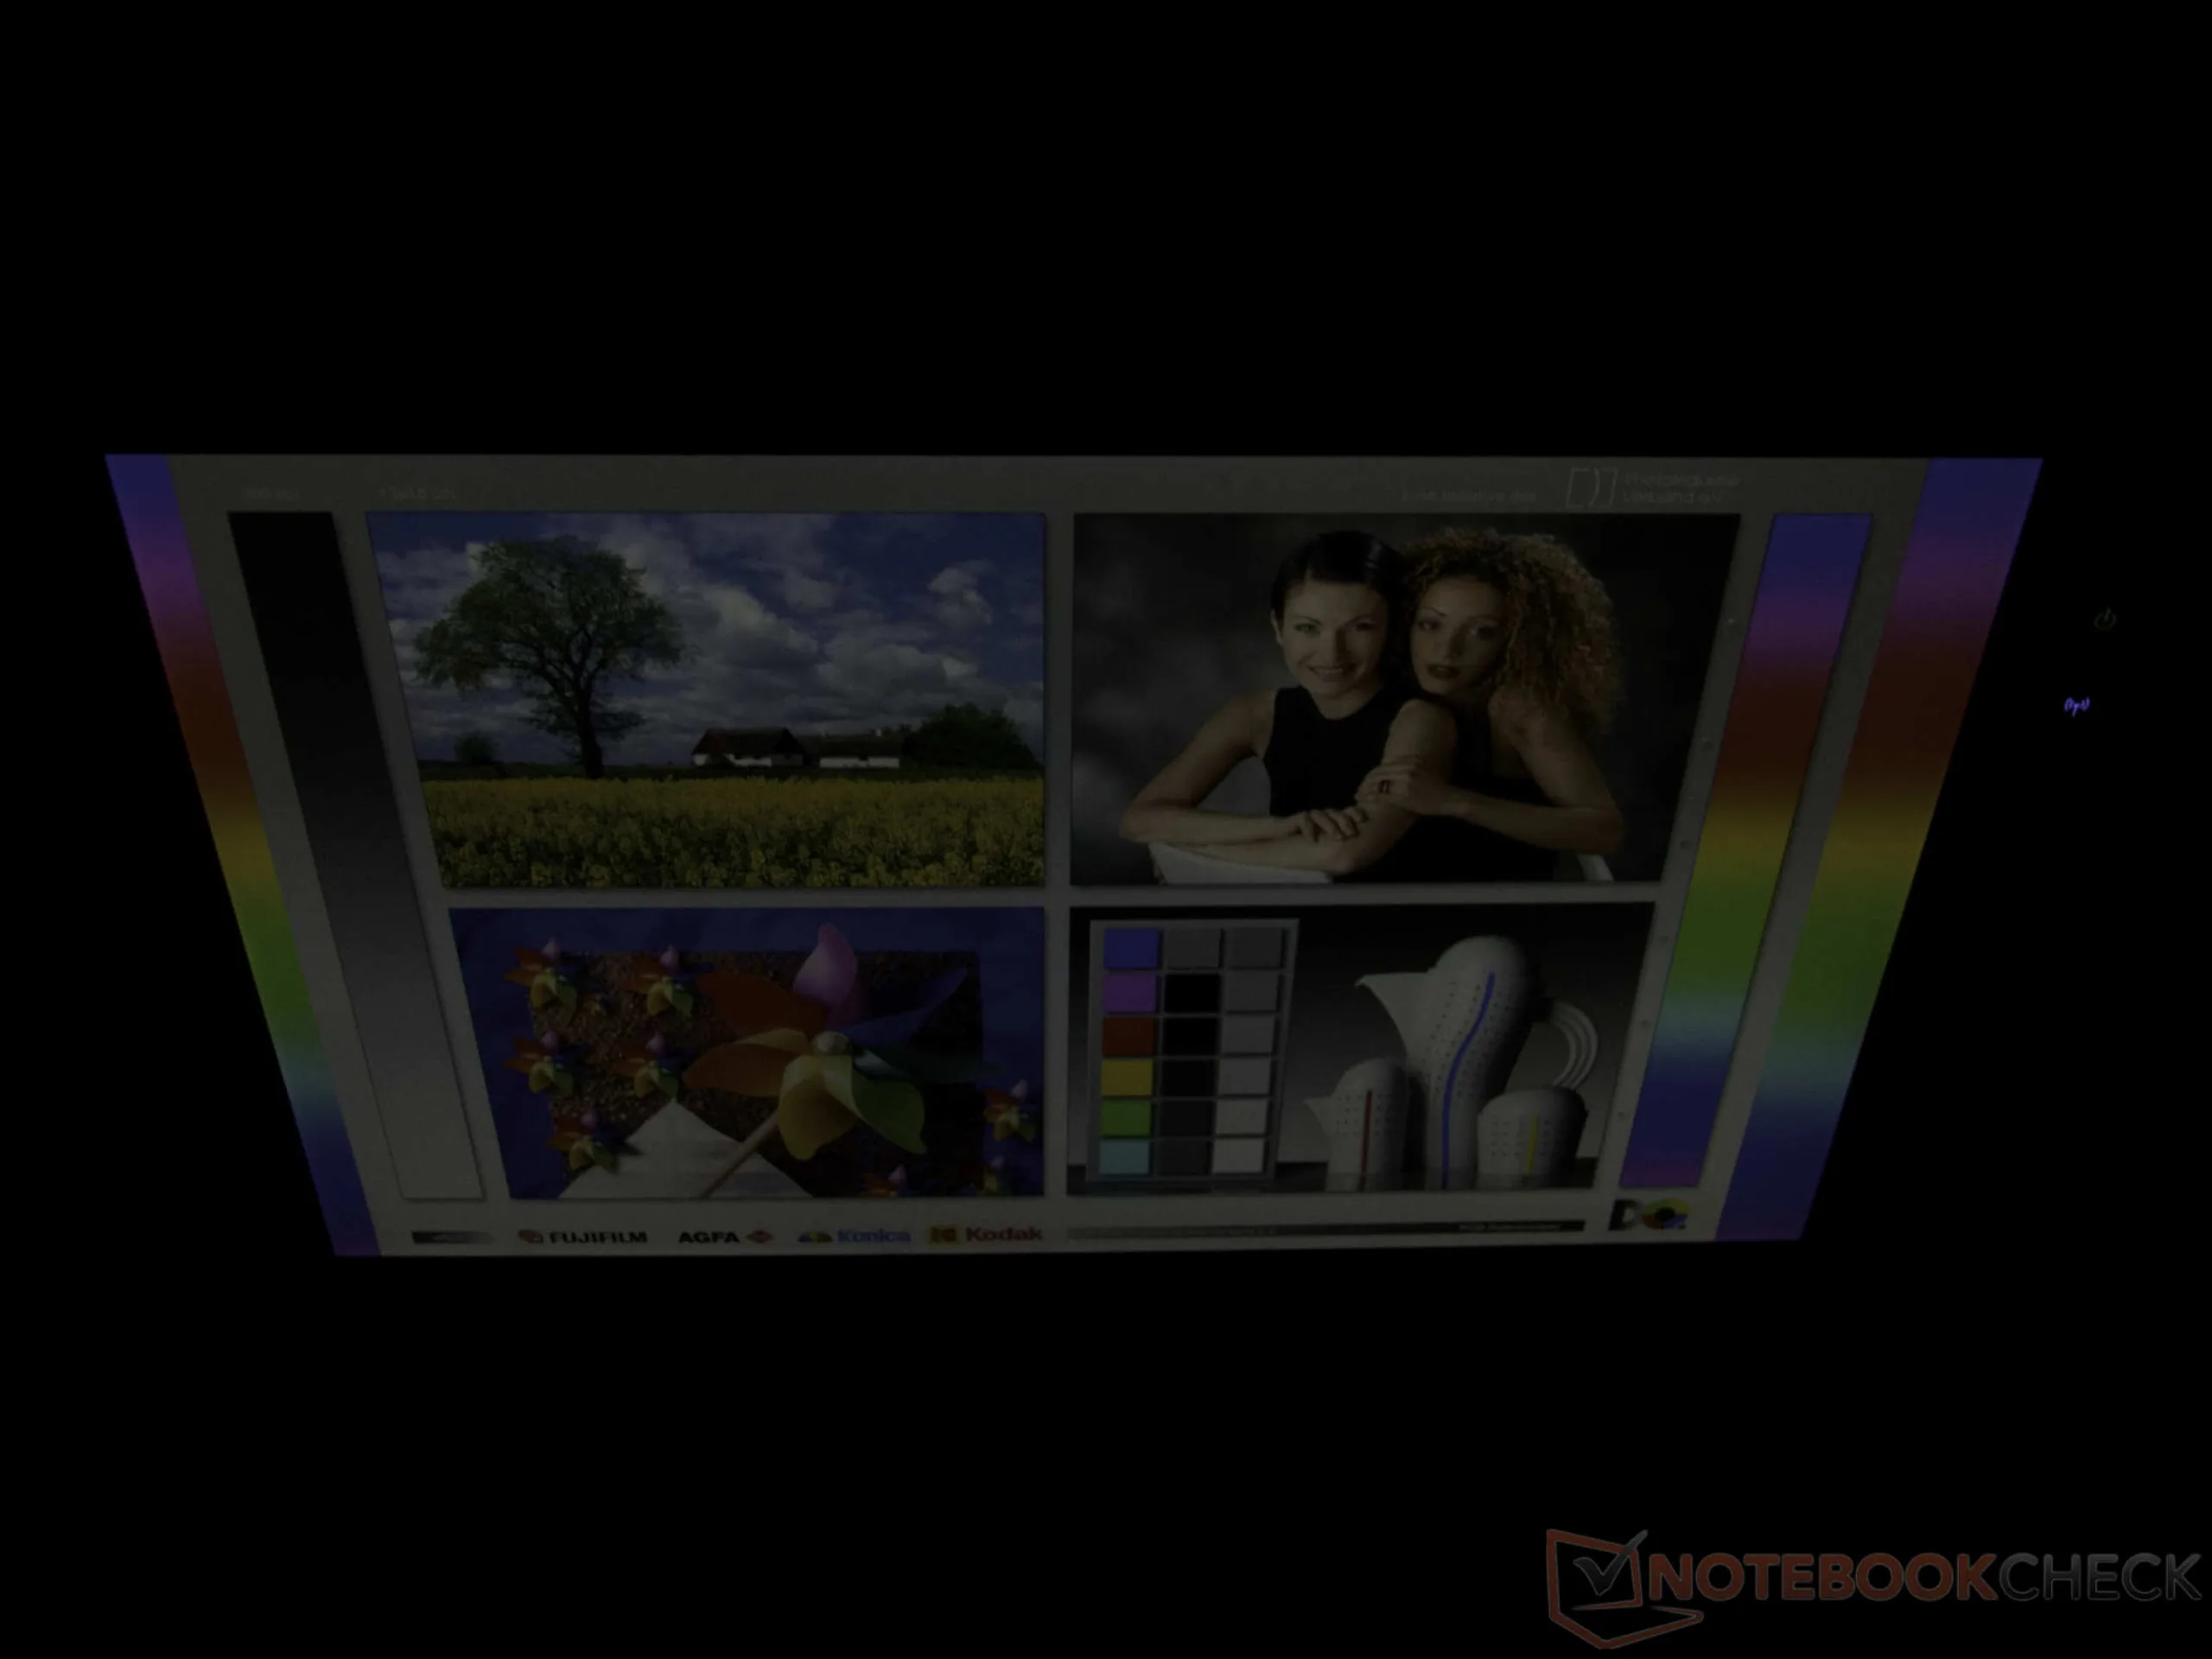
这款10.1英寸WUXGA屏幕专为户外使用而设计,毫不妥协。凭借超过1,000 cd/m²的超高亮度,该面板亮度极高,即使在阳光直射下,屏幕上的所有内容依然清晰可辨。 预装的哑光屏幕保护膜能有效减少令人分心的反光,不过会在亮部区域产生轻微的彩虹效应。自适应亮度功能则是一项实用且便捷的特性。

| |||||||||||||||||||||||||
Brightness Distribution: 92 %
Center on Battery: 1040 cd/m²
Contrast: 1024:1 (Black: 1.05 cd/m²)
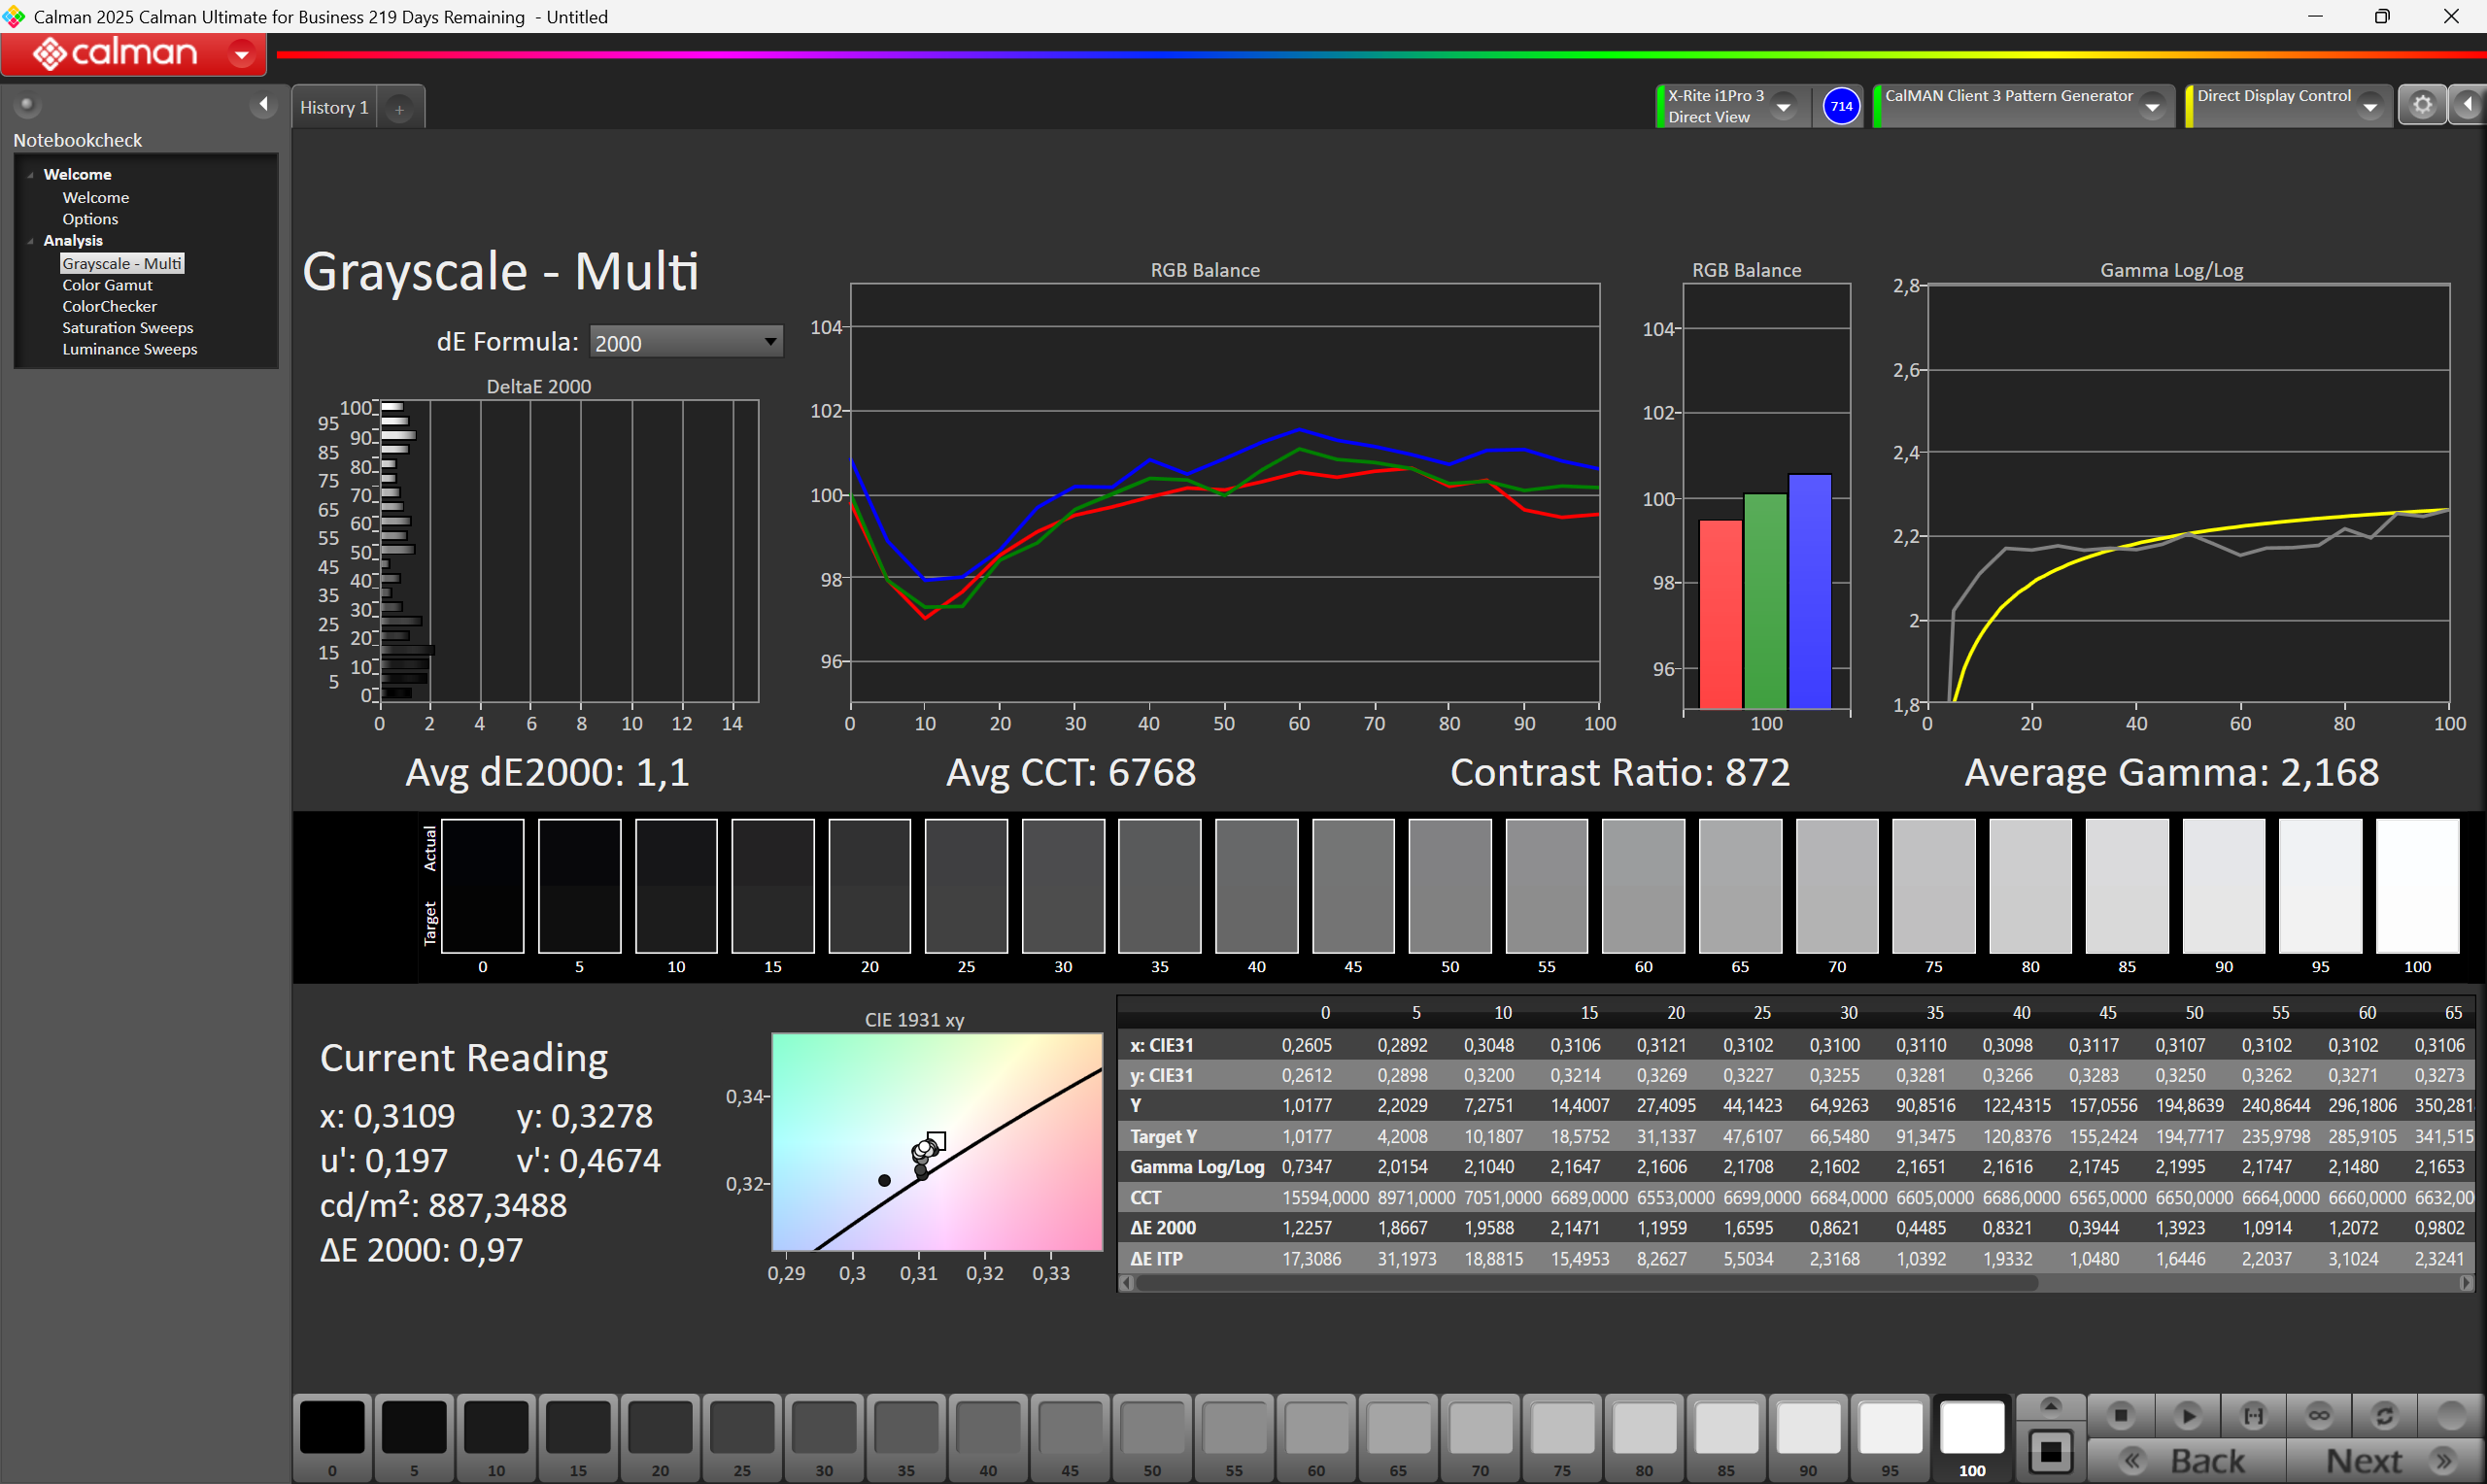
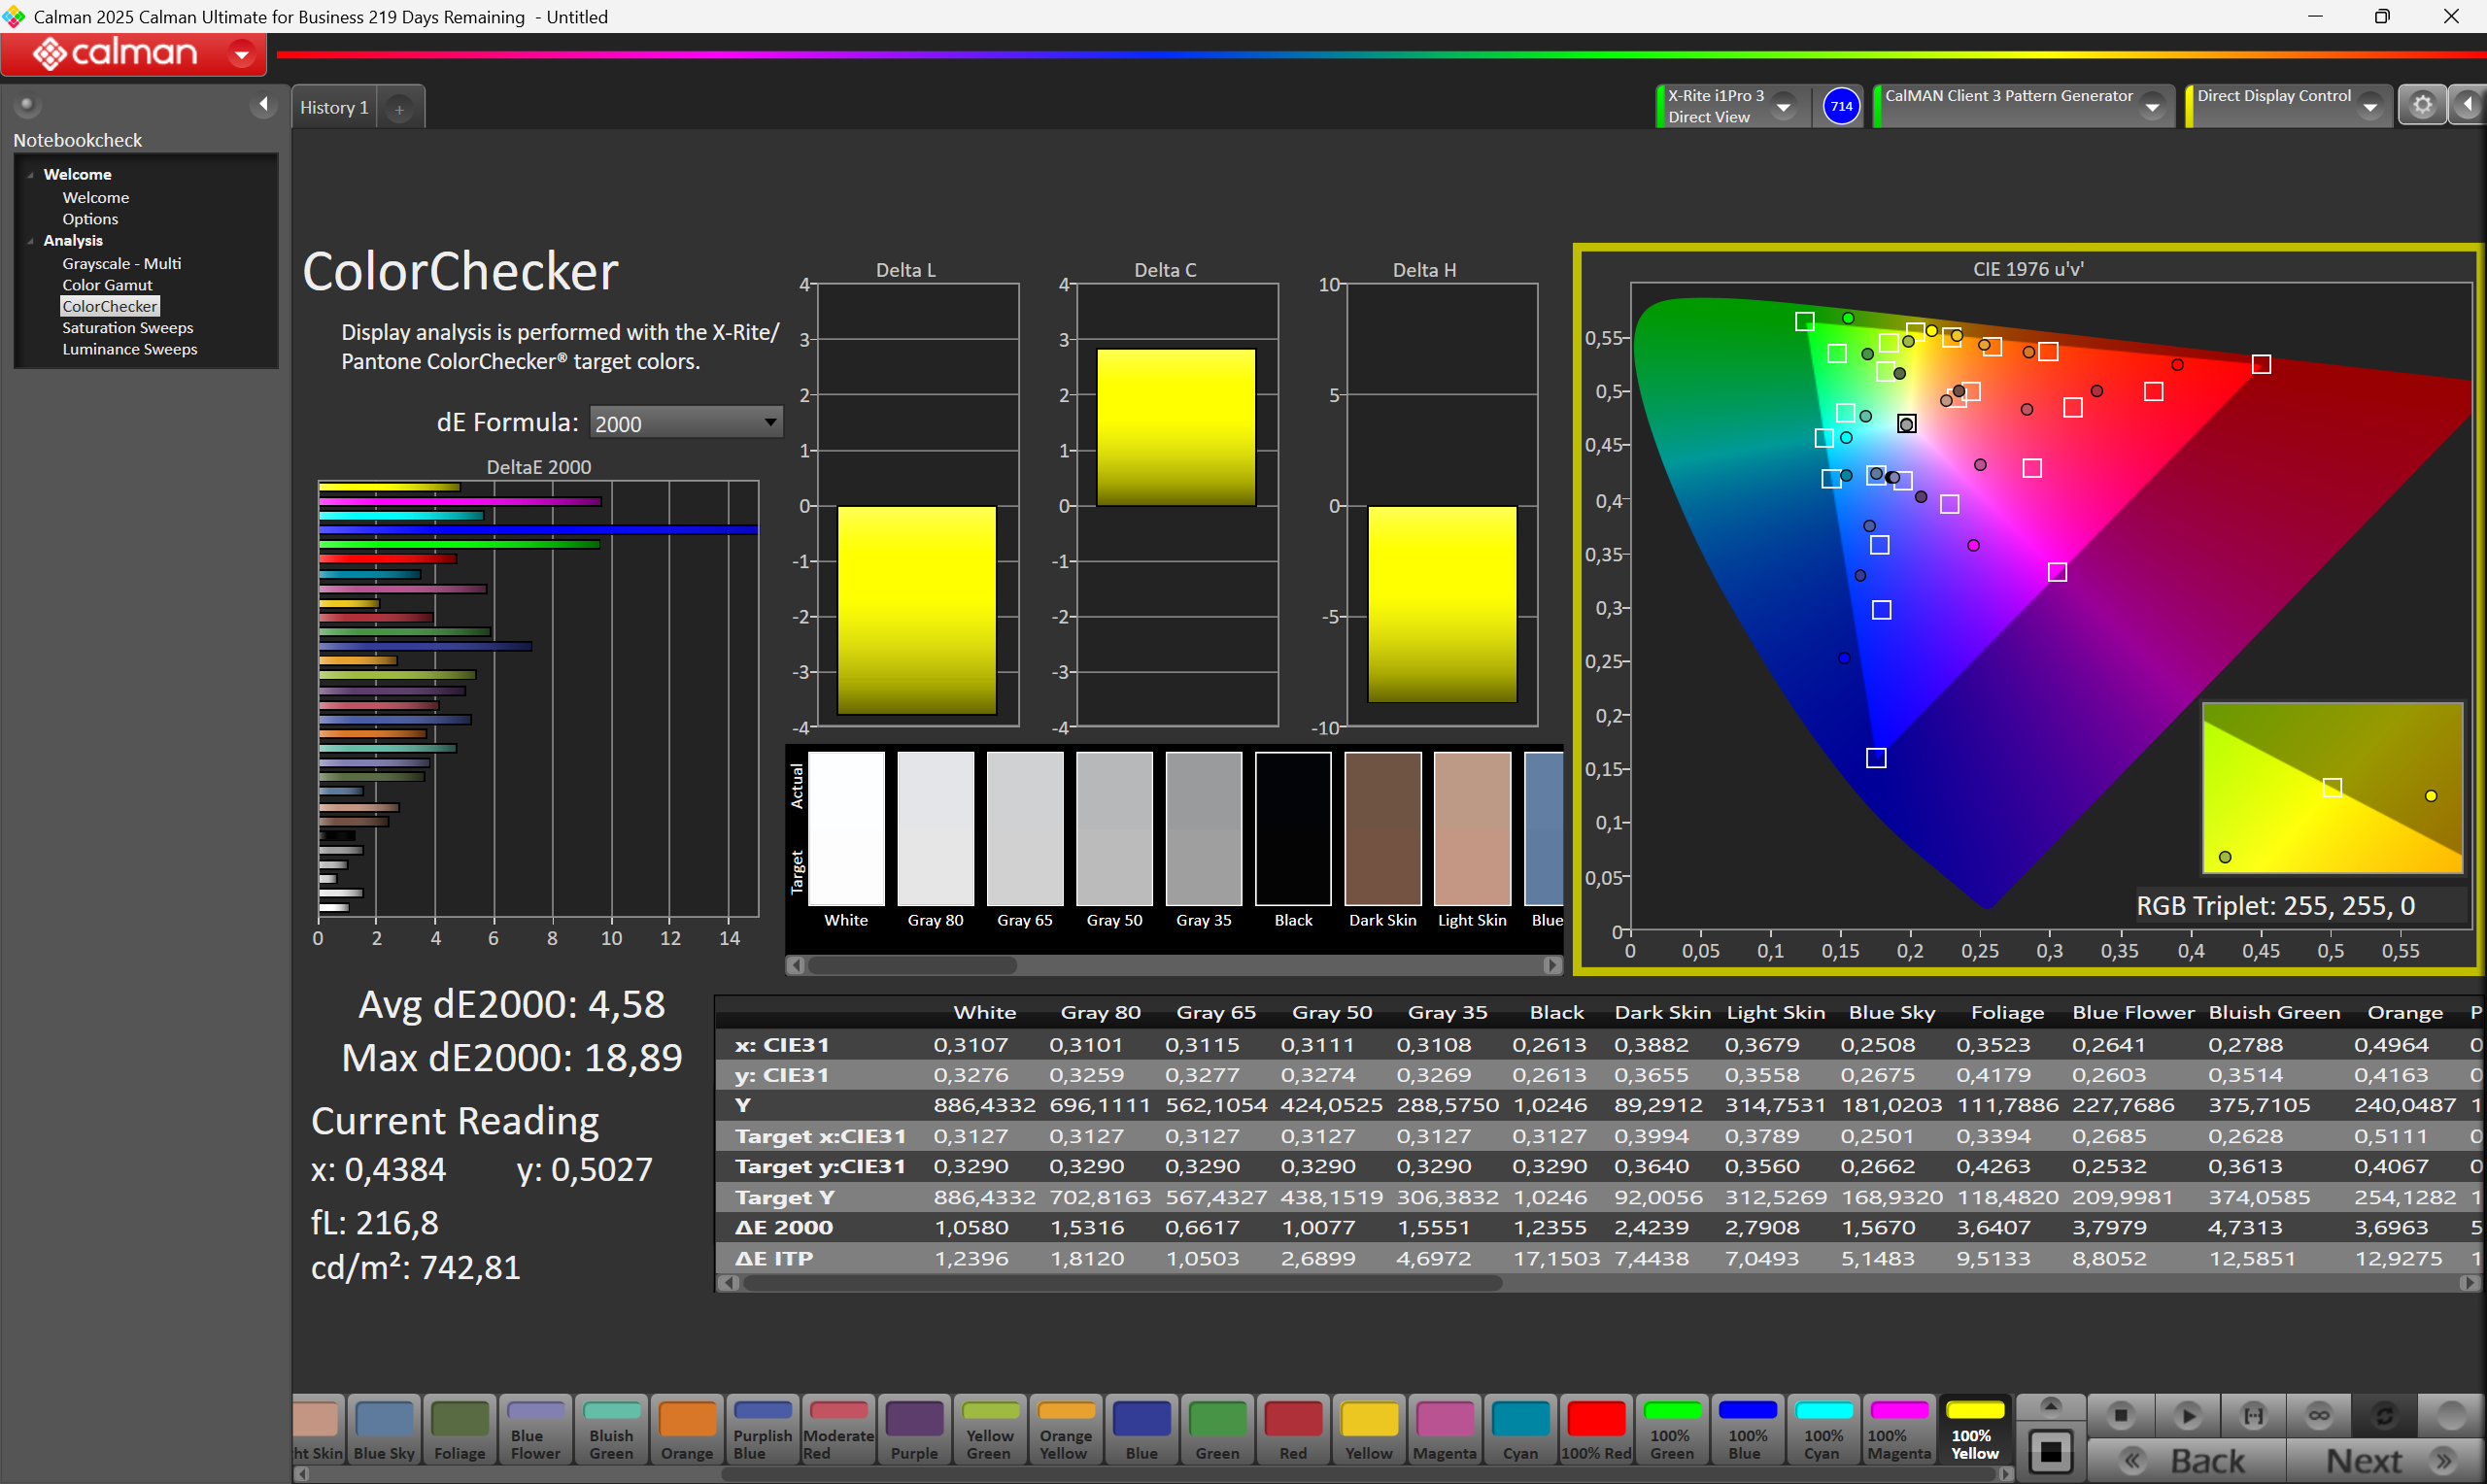
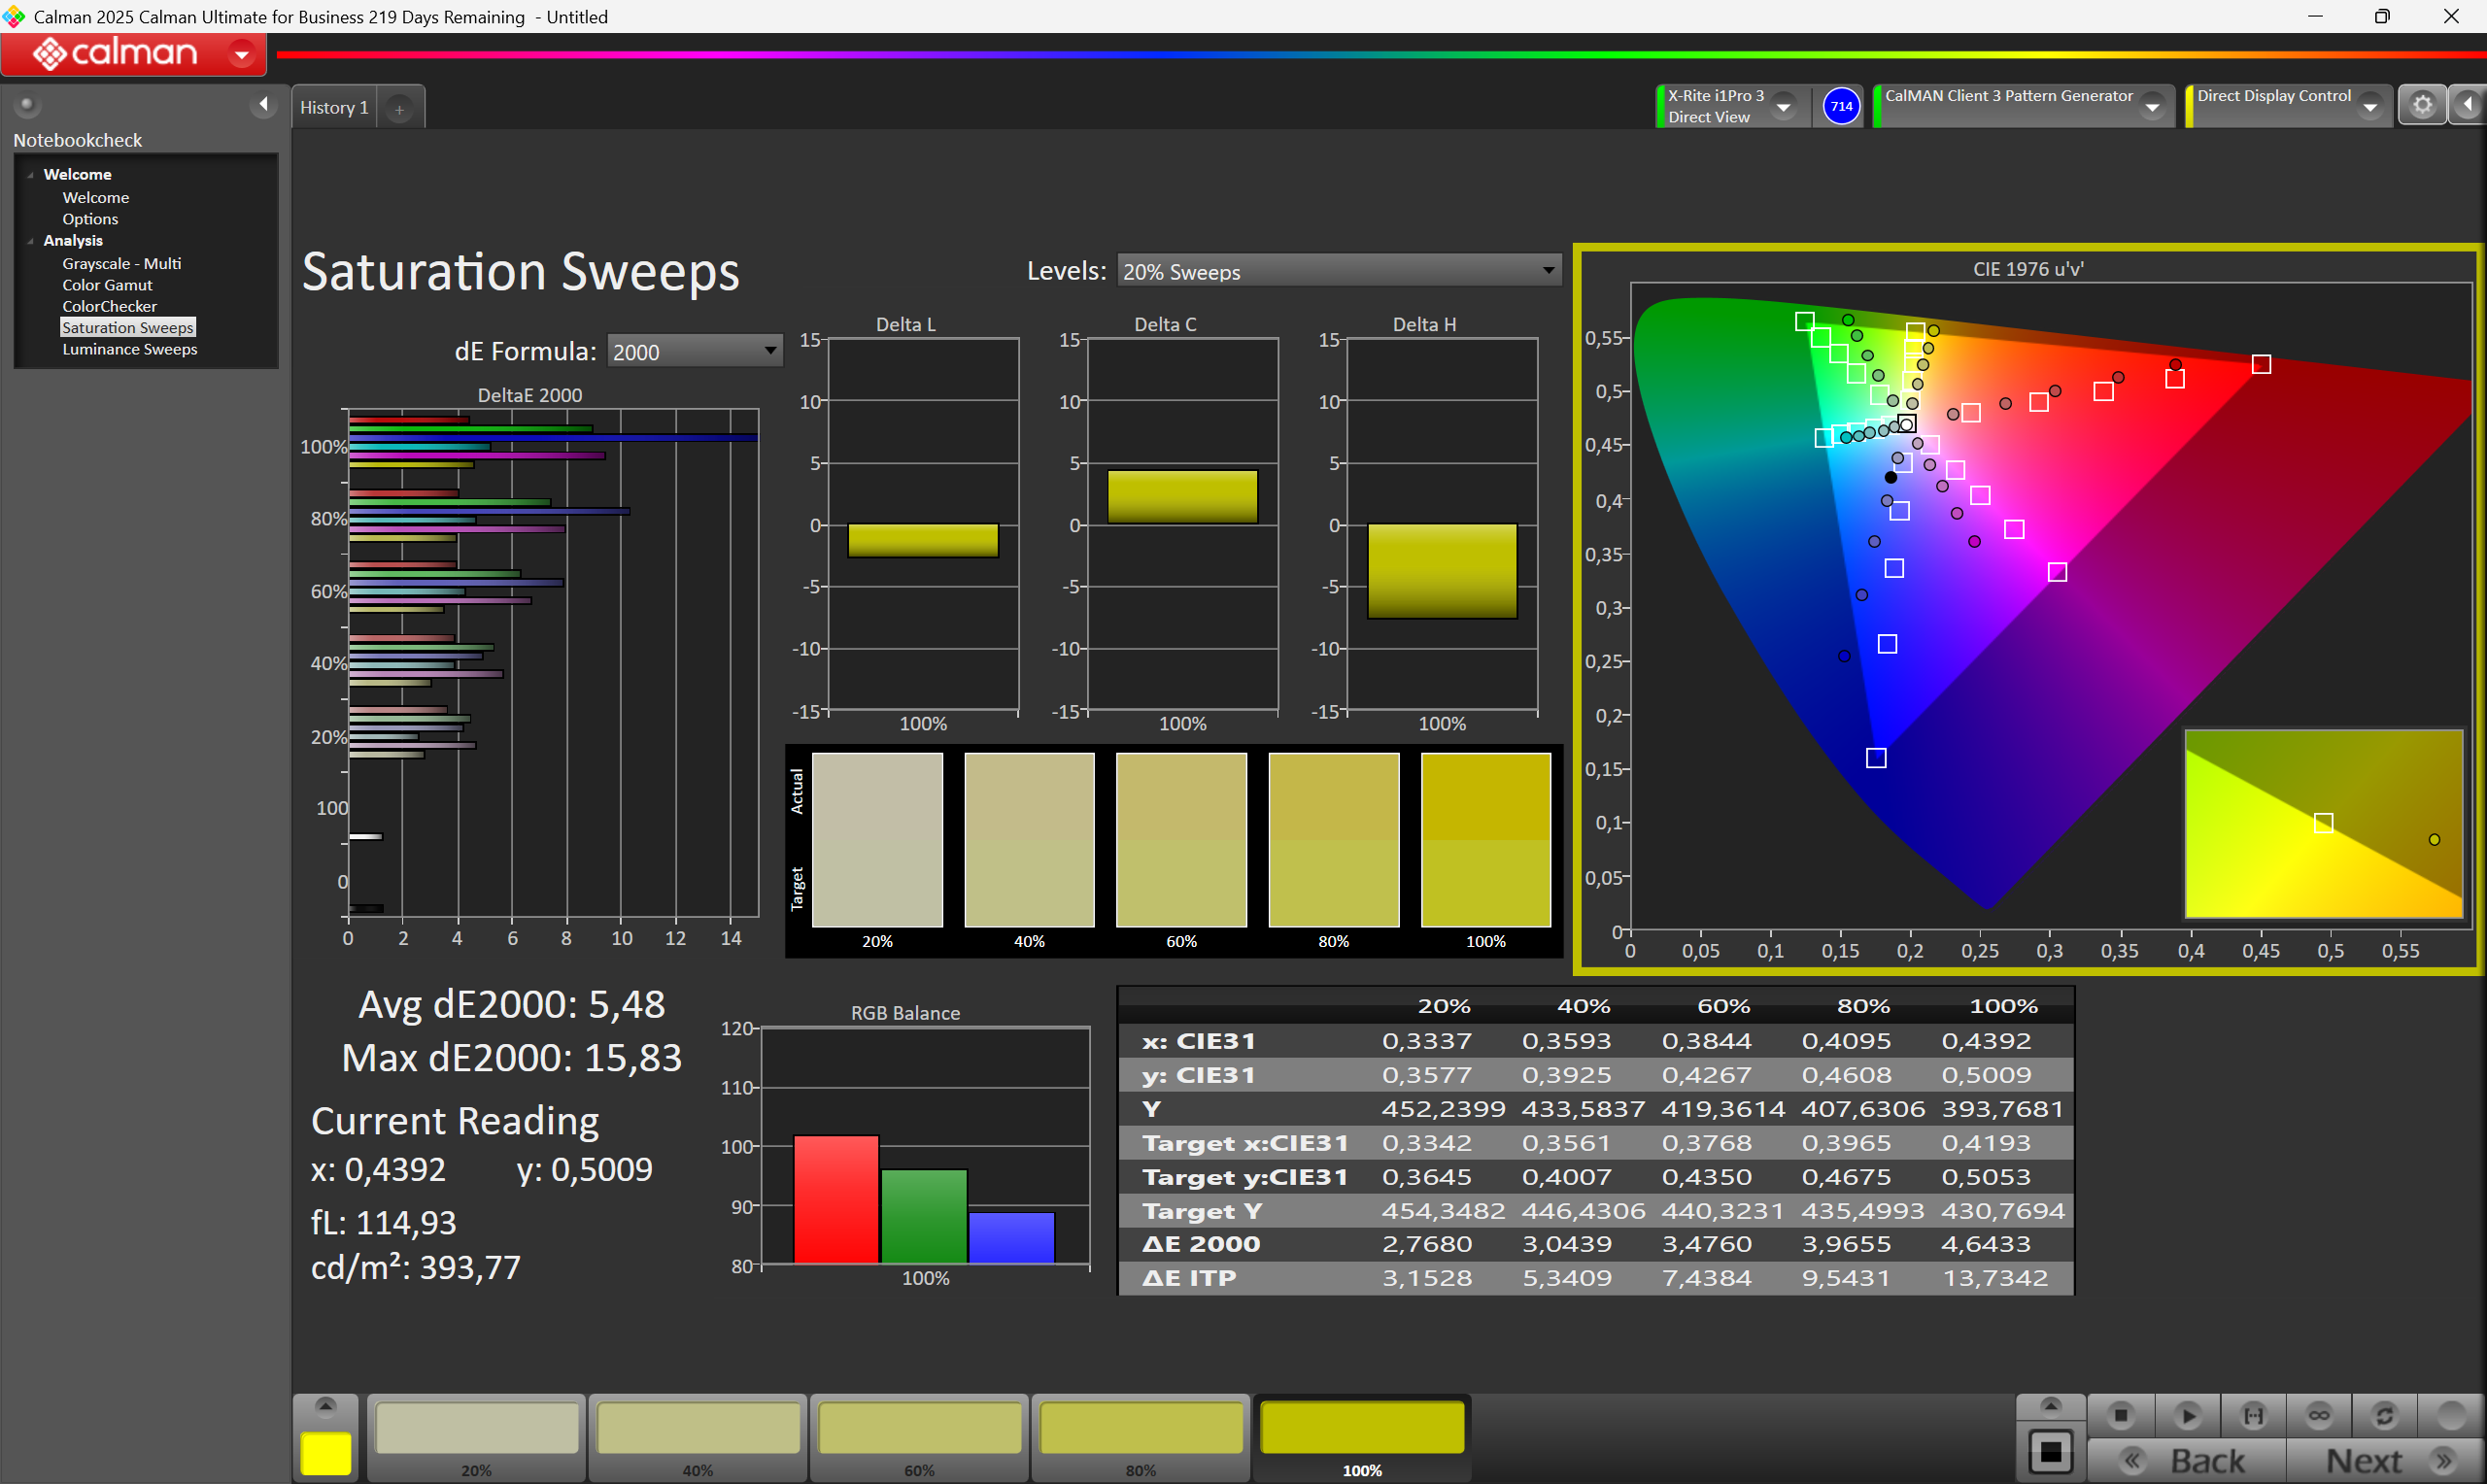
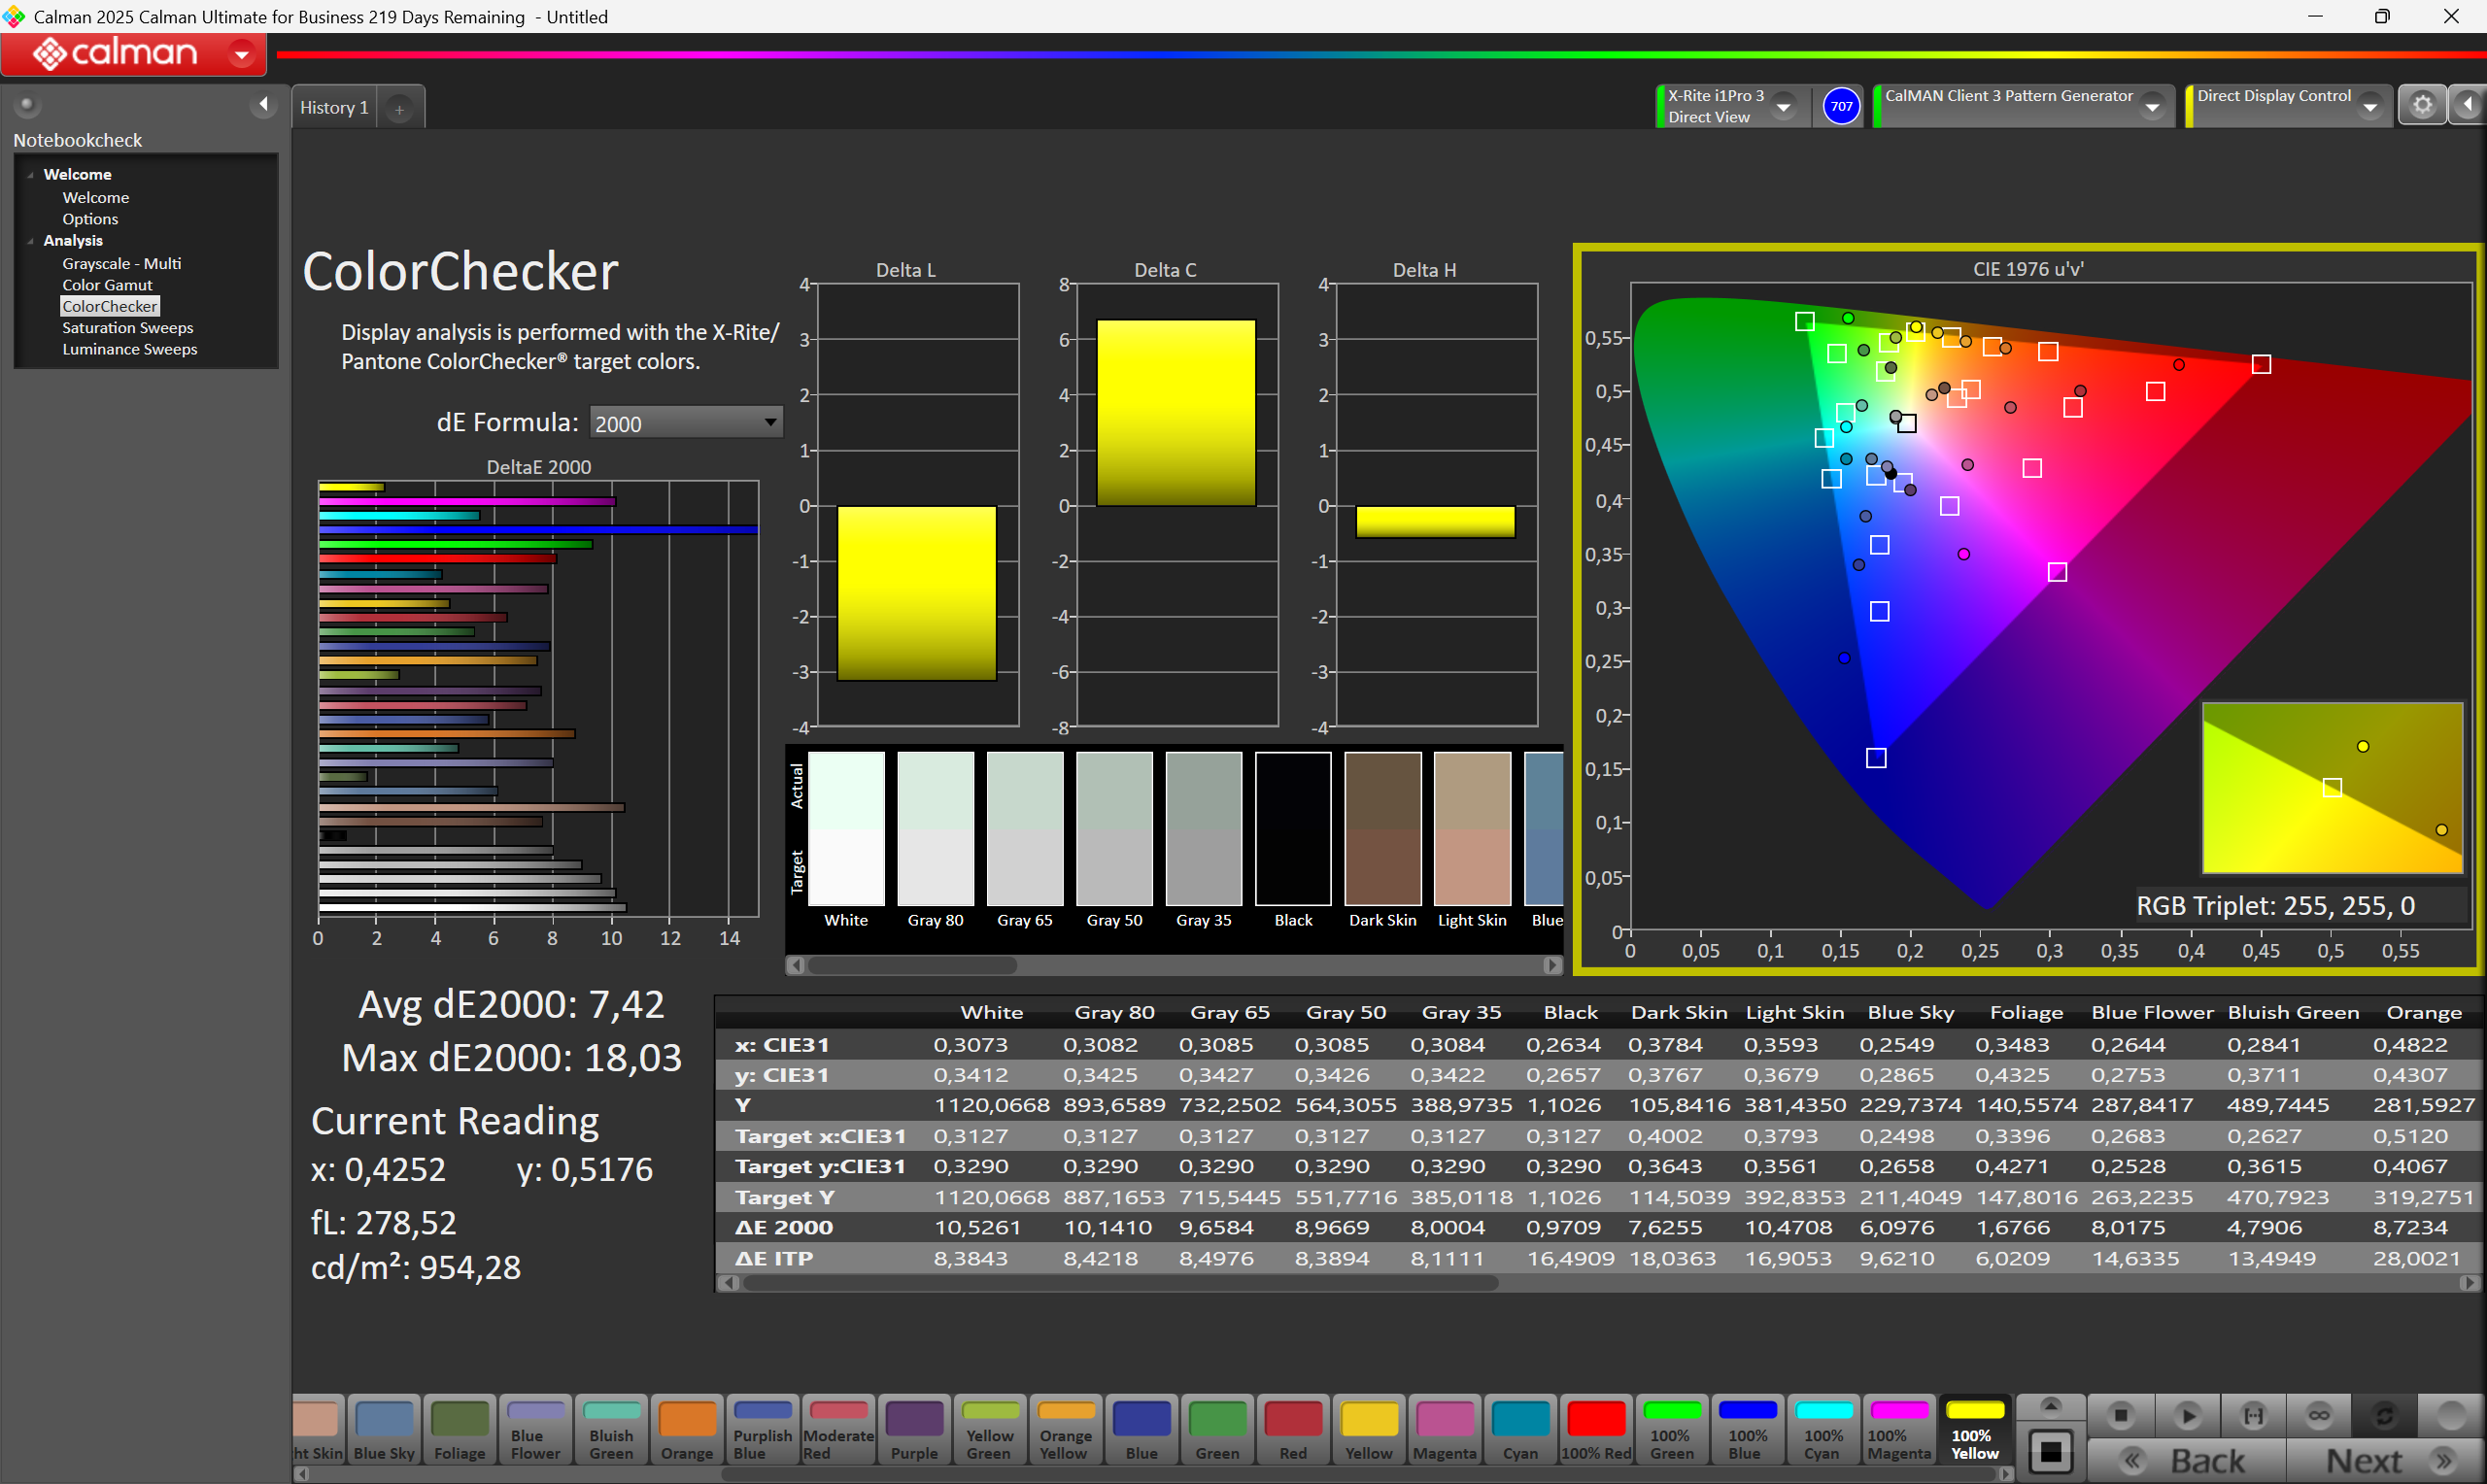
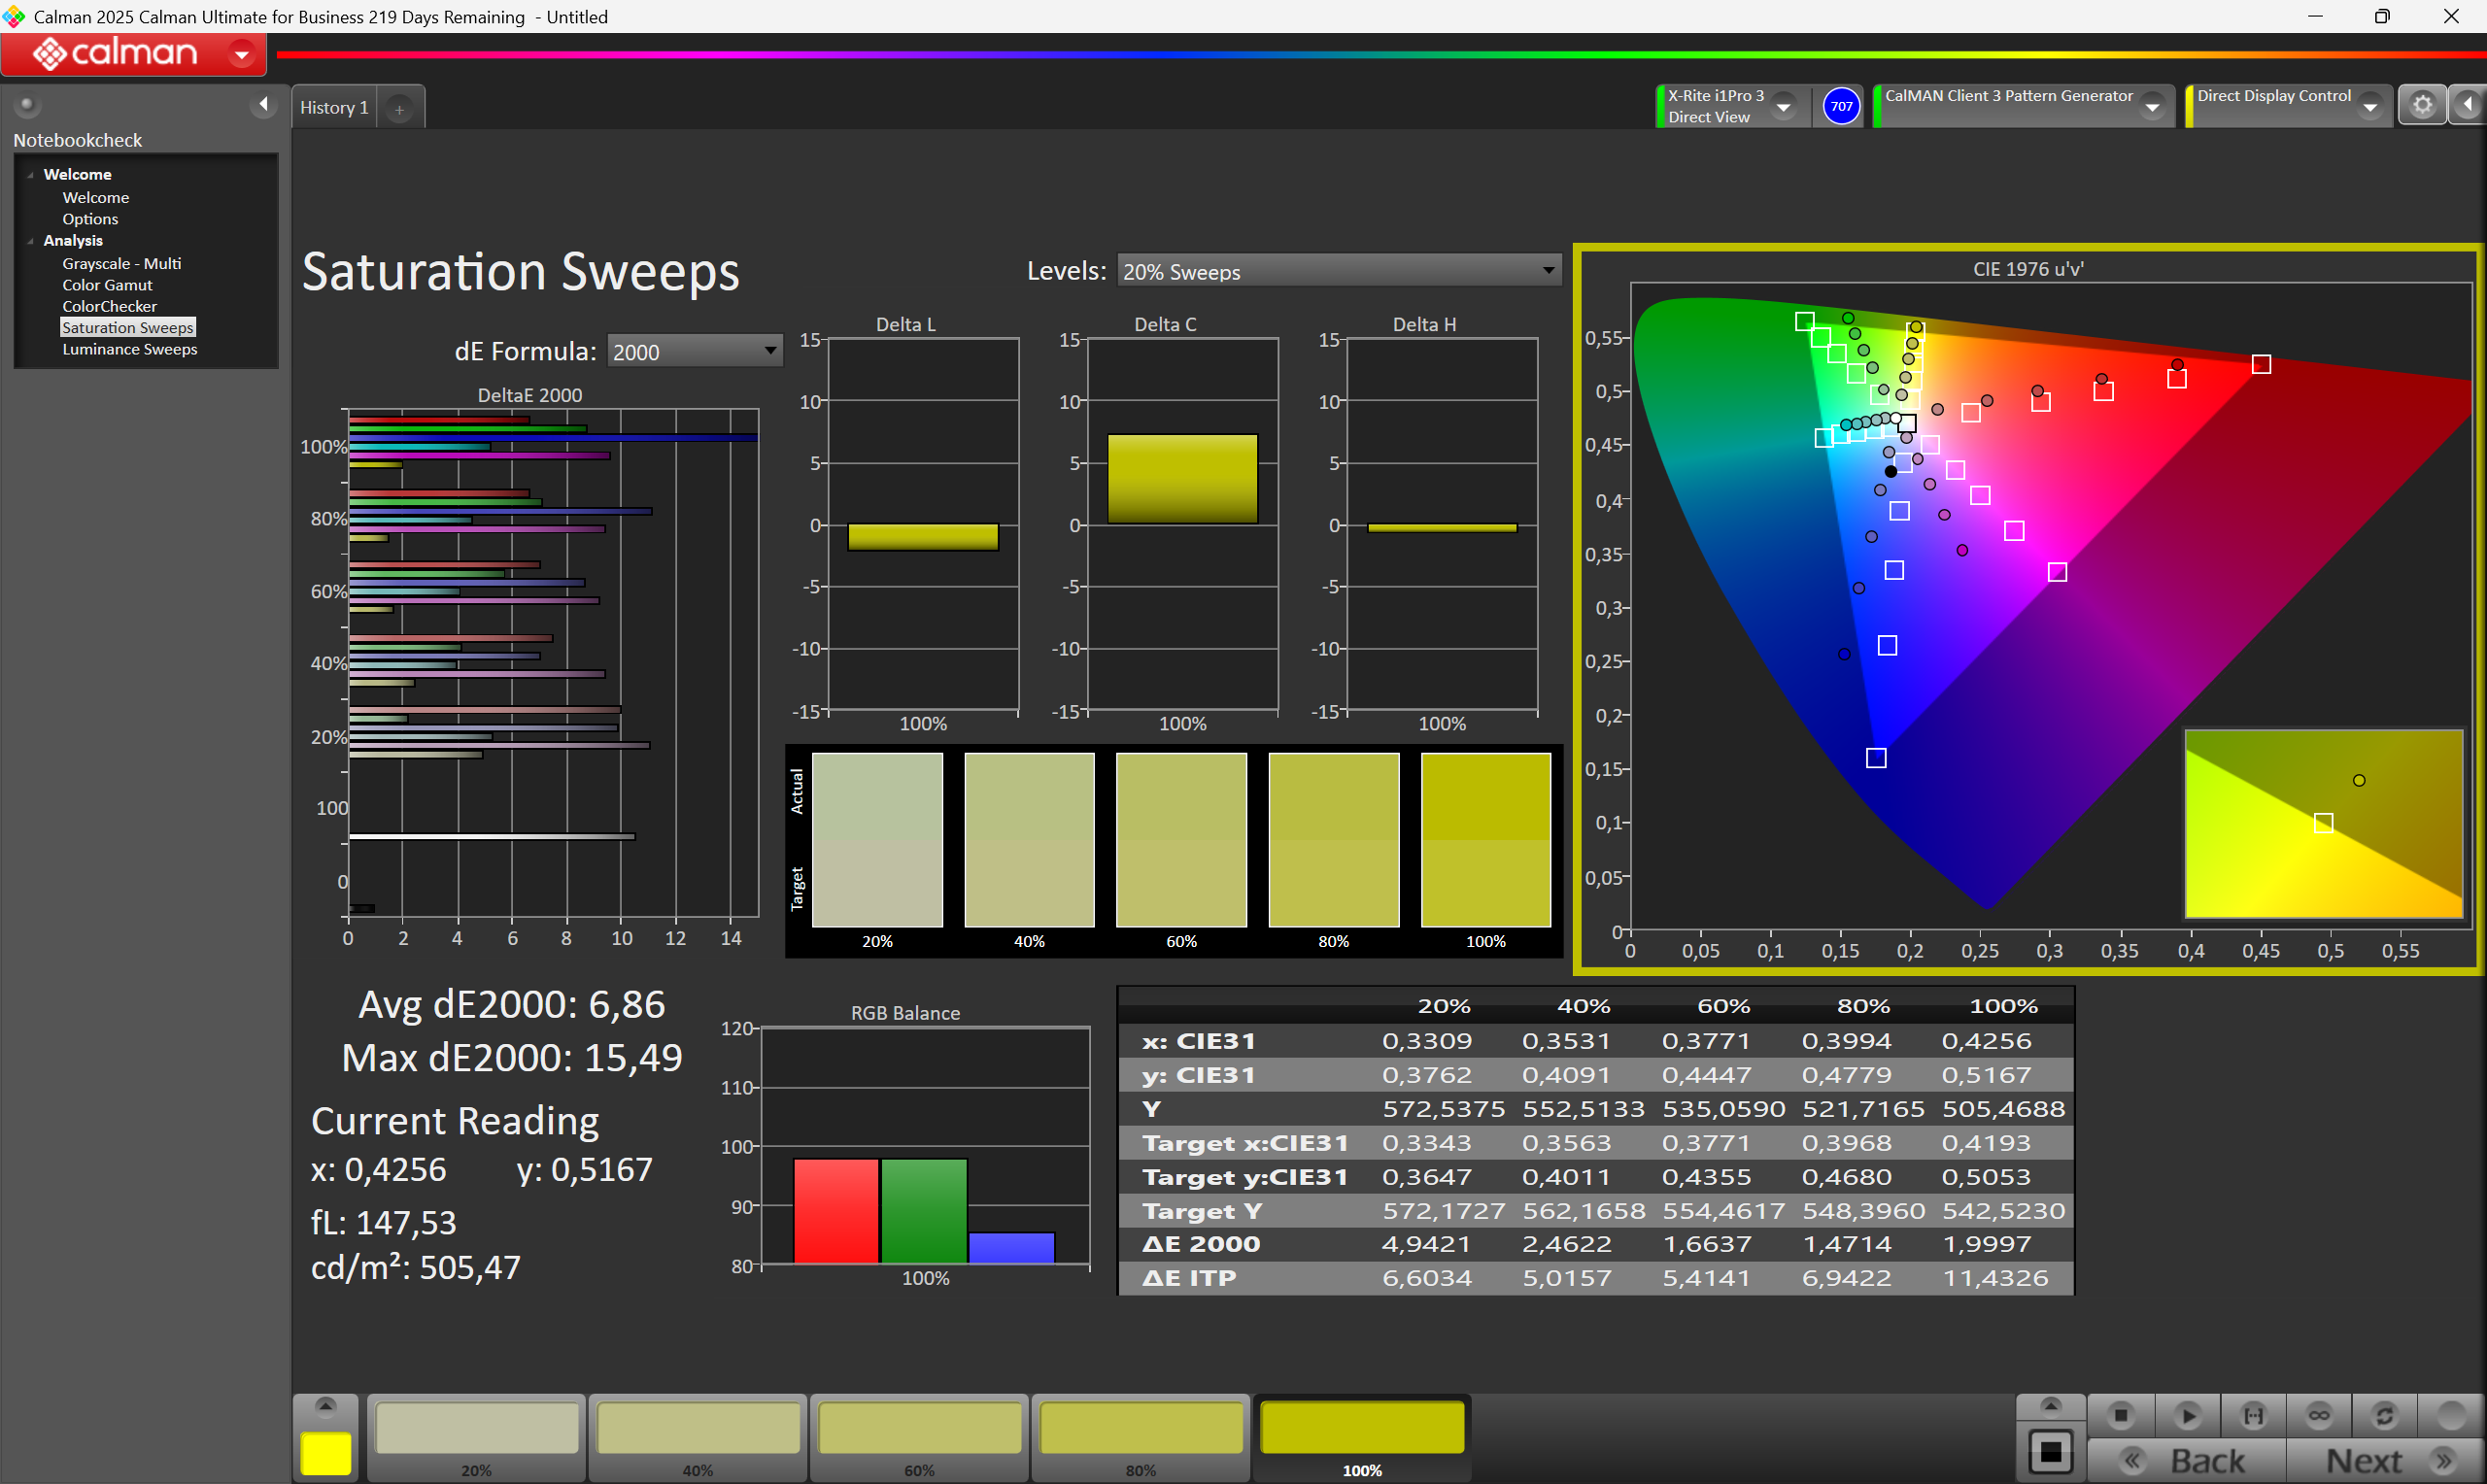
ΔE ColorChecker Calman: 7.42 | ∀{0.5-29.43 Ø4.72}
calibrated: 4.58
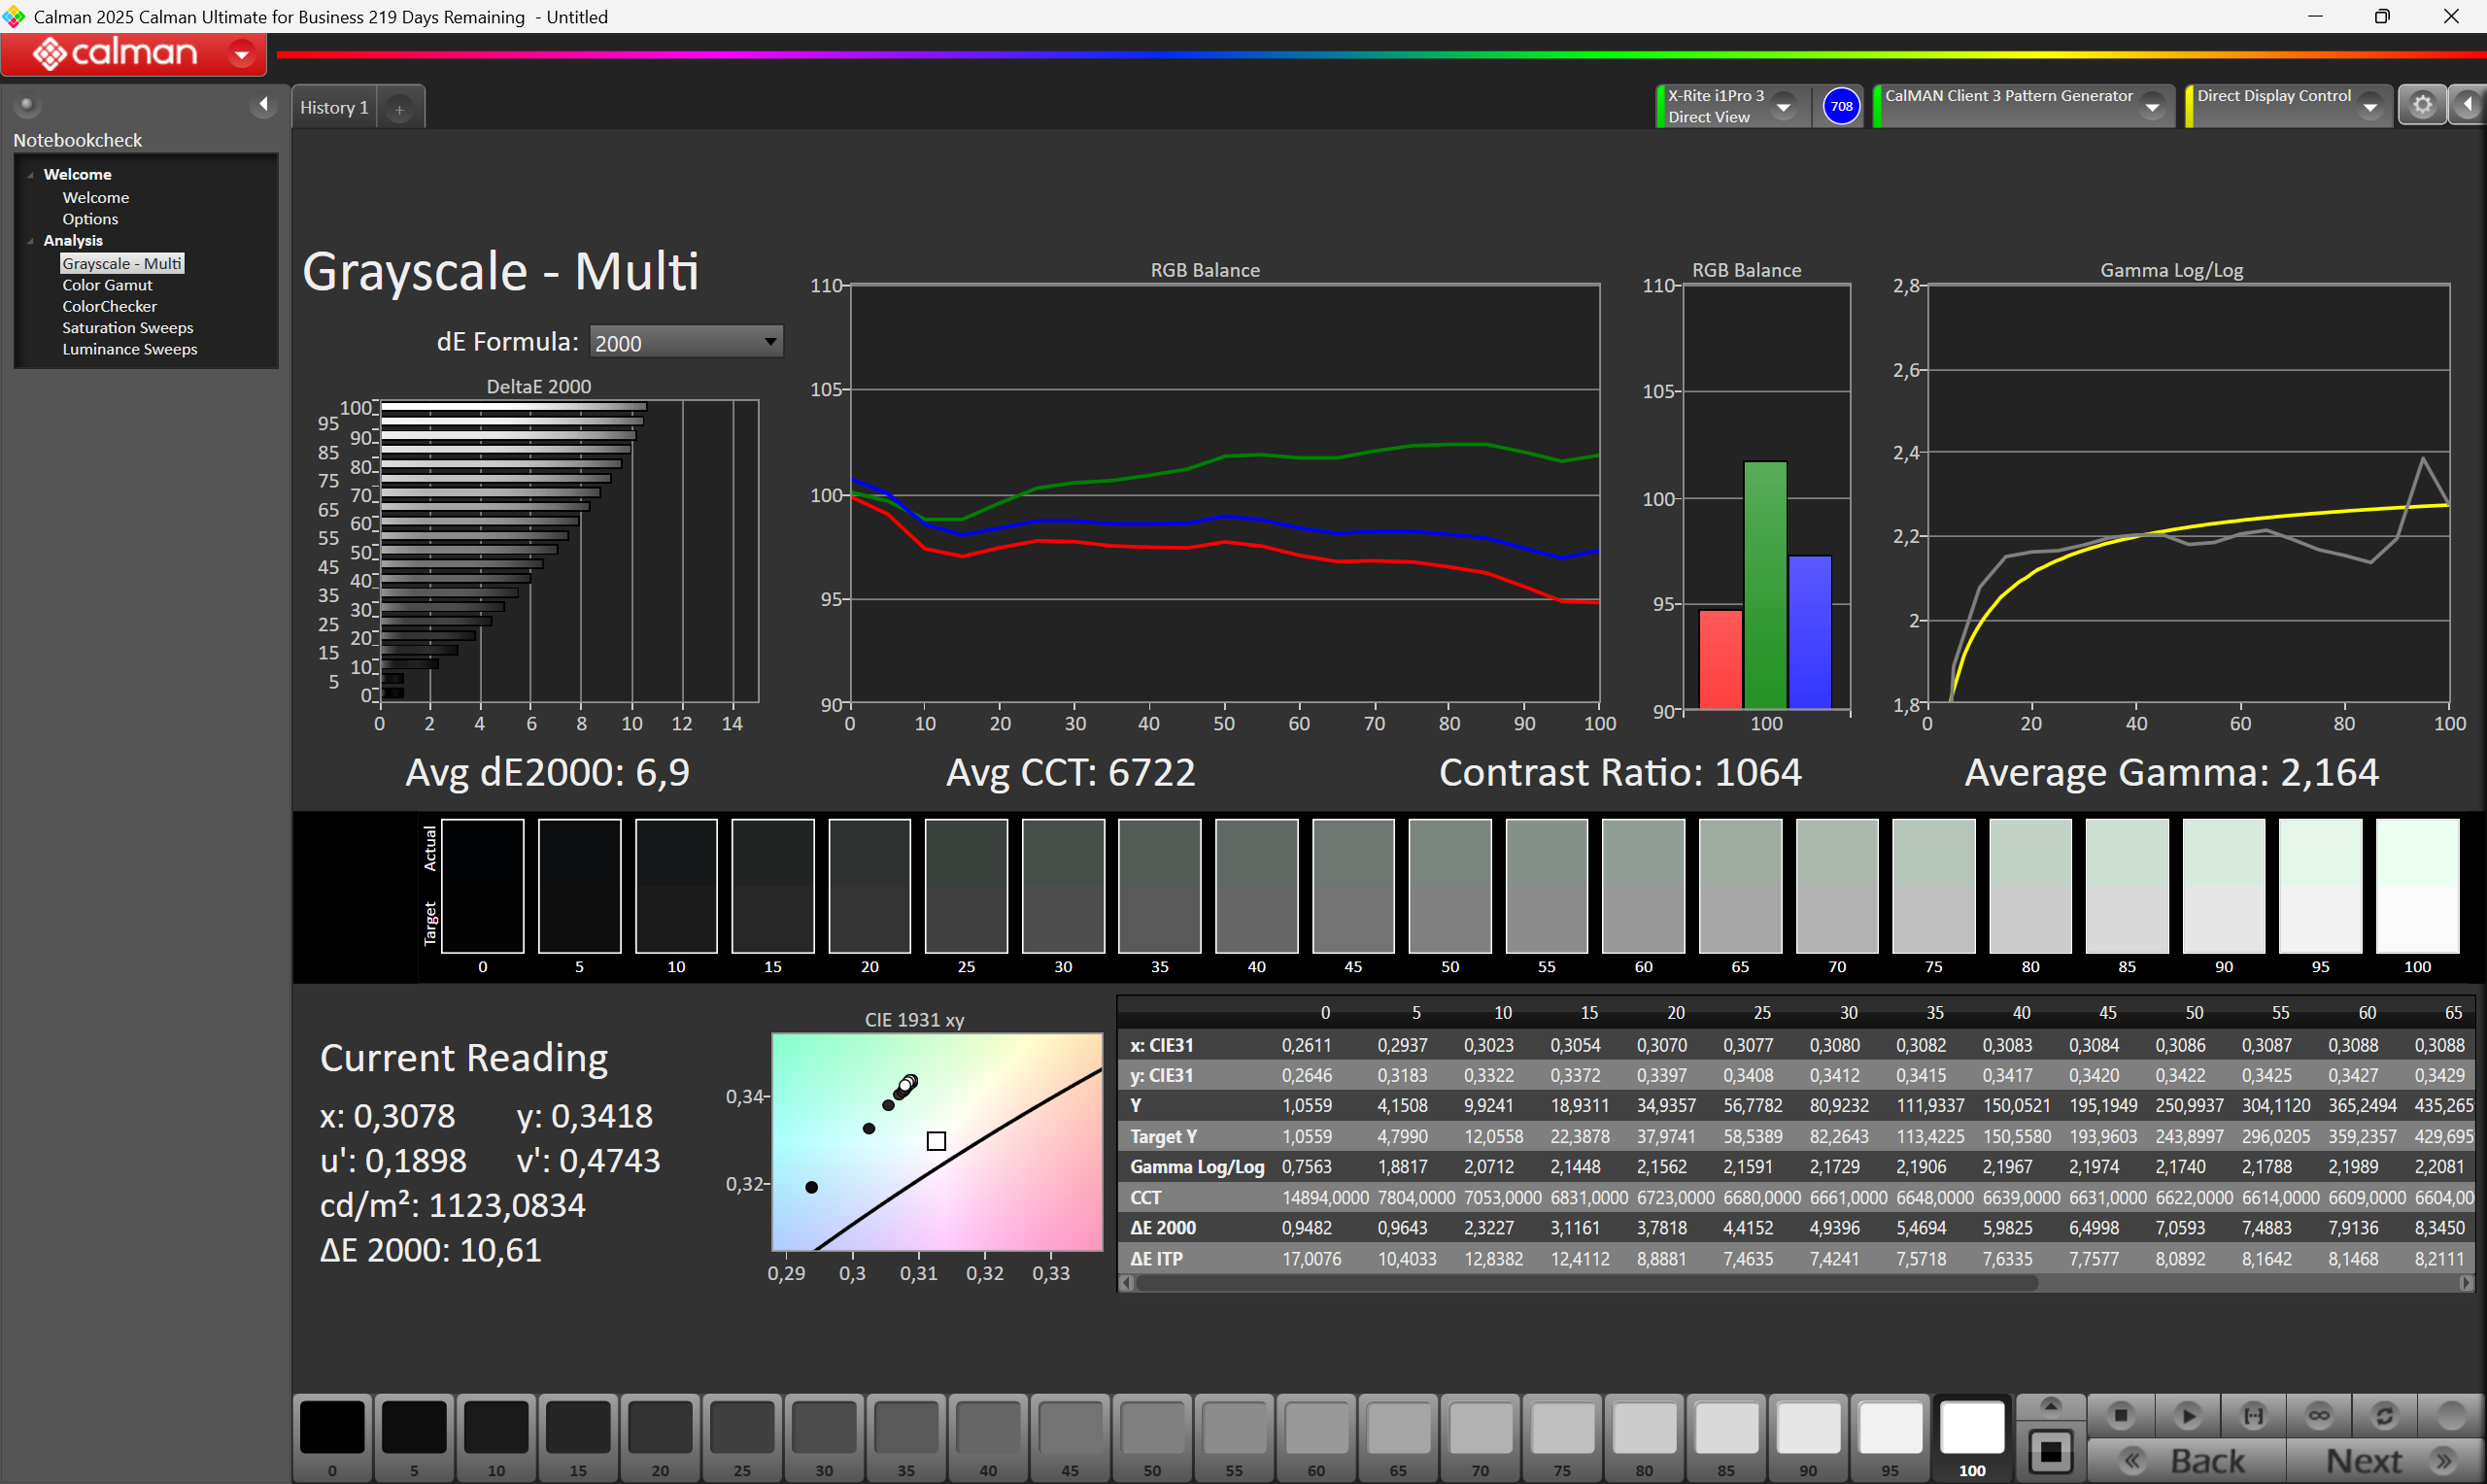
ΔE Greyscale Calman: 6.9 | ∀{0.09-98 Ø4.97}
44.17% AdobeRGB 1998 (Argyll 3D)
61.77% sRGB (Argyll 3D)
42.75% Display P3 (Argyll 3D)
Gamma: 2.164
CCT: 6722 K
| Durabook R10 HannStar 101GUW2, TFT, 1920x1200, 10.1", 60 Hz | Dell Latitude 7030 Rugged Extreme Sharp LQ101N1, IPS, 1920x1200, 10", 60 Hz | Lenovo ThinkPad T14 Gen 6 21QG001VGE MNE007JA1-3, IPS LED, 1920x1200, 14", 60 Hz | Dynabook Portege Z40L-N BOE NE140WUM-N6K, IPS, 1920x1200, 14", 60 Hz | Durabook R8 Tablet Digital Flat Panel, IPS, 1280x800, 8", 60 Hz | Lenovo ThinkPad T14 Gen 6 AMD NE140WUM-N6M, , 1920x1200, 14", 60 Hz | |
|---|---|---|---|---|---|---|
| Display | 65% | 58% | 62% | 22% | 57% | |
| Display P3 Coverage (%) | 42.75 | 72.2 69% | 67.7 58% | 70.1 64% | 51.5 20% | 66.9 56% |
| sRGB Coverage (%) | 61.77 | 99 60% | 98.3 59% | 99 60% | 77.4 25% | 98.5 59% |
| AdobeRGB 1998 Coverage (%) | 44.17 | 72.7 65% | 69.9 58% | 71.8 63% | 53.1 20% | 68.9 56% |
| Response Times | 26% | 10% | 8% | 30% | 28% | |
| Response Time Grey 50% / Grey 80% * (ms) | 53.2 ? | 35.9 ? 33% | 40.2 ? 24% | 42.1 ? 21% | 32.4 ? 39% | 31.1 ? 42% |
| Response Time Black / White * (ms) | 27.6 ? | 22.4 ? 19% | 29.1 ? -5% | 26.7 ? 3% | 21.9 ? 21% | 24.1 ? 13% |
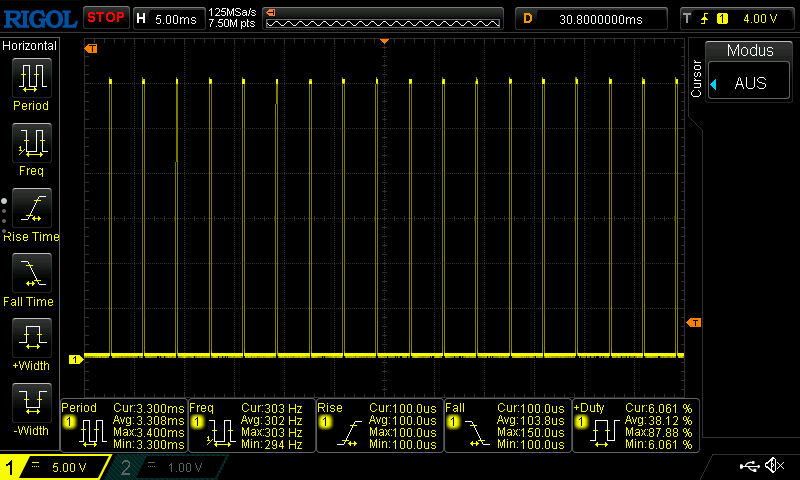
| PWM Frequency (Hz) | 300 | 300 ? | ||||
| PWM Amplitude * (%) | 100 | 100 -0% | ||||
| Screen | 45% | 45% | 34% | 5% | 28% | |
| Brightness middle (cd/m²) | 1075 | 1183.9 10% | 554 -48% | 445.4 -59% | 943.7 -12% | 557 -48% |
| Brightness (cd/m²) | 1042 | 1140 9% | 516 -50% | 424 -59% | 870 -17% | 526 -50% |
| Brightness Distribution (%) | 92 | 88 -4% | 91 -1% | 91 -1% | 85 -8% | 84 -9% |
| Black Level * (cd/m²) | 1.05 | 0.74 30% | 0.24 77% | 0.23 78% | 0.85 19% | 0.4 62% |
| Contrast (:1) | 1024 | 1600 56% | 2308 125% | 1937 89% | 1110 8% | 1393 36% |
| Colorchecker dE 2000 * | 7.42 | 2.03 73% | 1.5 80% | 2.85 62% | 6.35 14% | 2.4 68% |
| Colorchecker dE 2000 max. * | 18.03 | 3.44 81% | 3.4 81% | 4.57 75% | 8.86 51% | 5.9 67% |
| Colorchecker dE 2000 calibrated * | 4.58 | 0.53 88% | 0.9 80% | 1.54 66% | 5.1 -11% | 0.7 85% |
| Greyscale dE 2000 * | 6.9 | 2.6 62% | 2.7 61% | 3.3 52% | 6.9 -0% | 4 42% |
| Gamma | 2.164 102% | 2.27 97% | 2.25 98% | 2.03 108% | 2.65 83% | 2.15 102% |
| CCT | 6722 97% | 6102 107% | 6882 94% | 6497 100% | 6956 93% | 7017 93% |
| Total Average (Program / Settings) | 45% /
47% | 38% /
43% | 35% /
34% | 19% /
12% | 38% /
34% |
* ... smaller is better
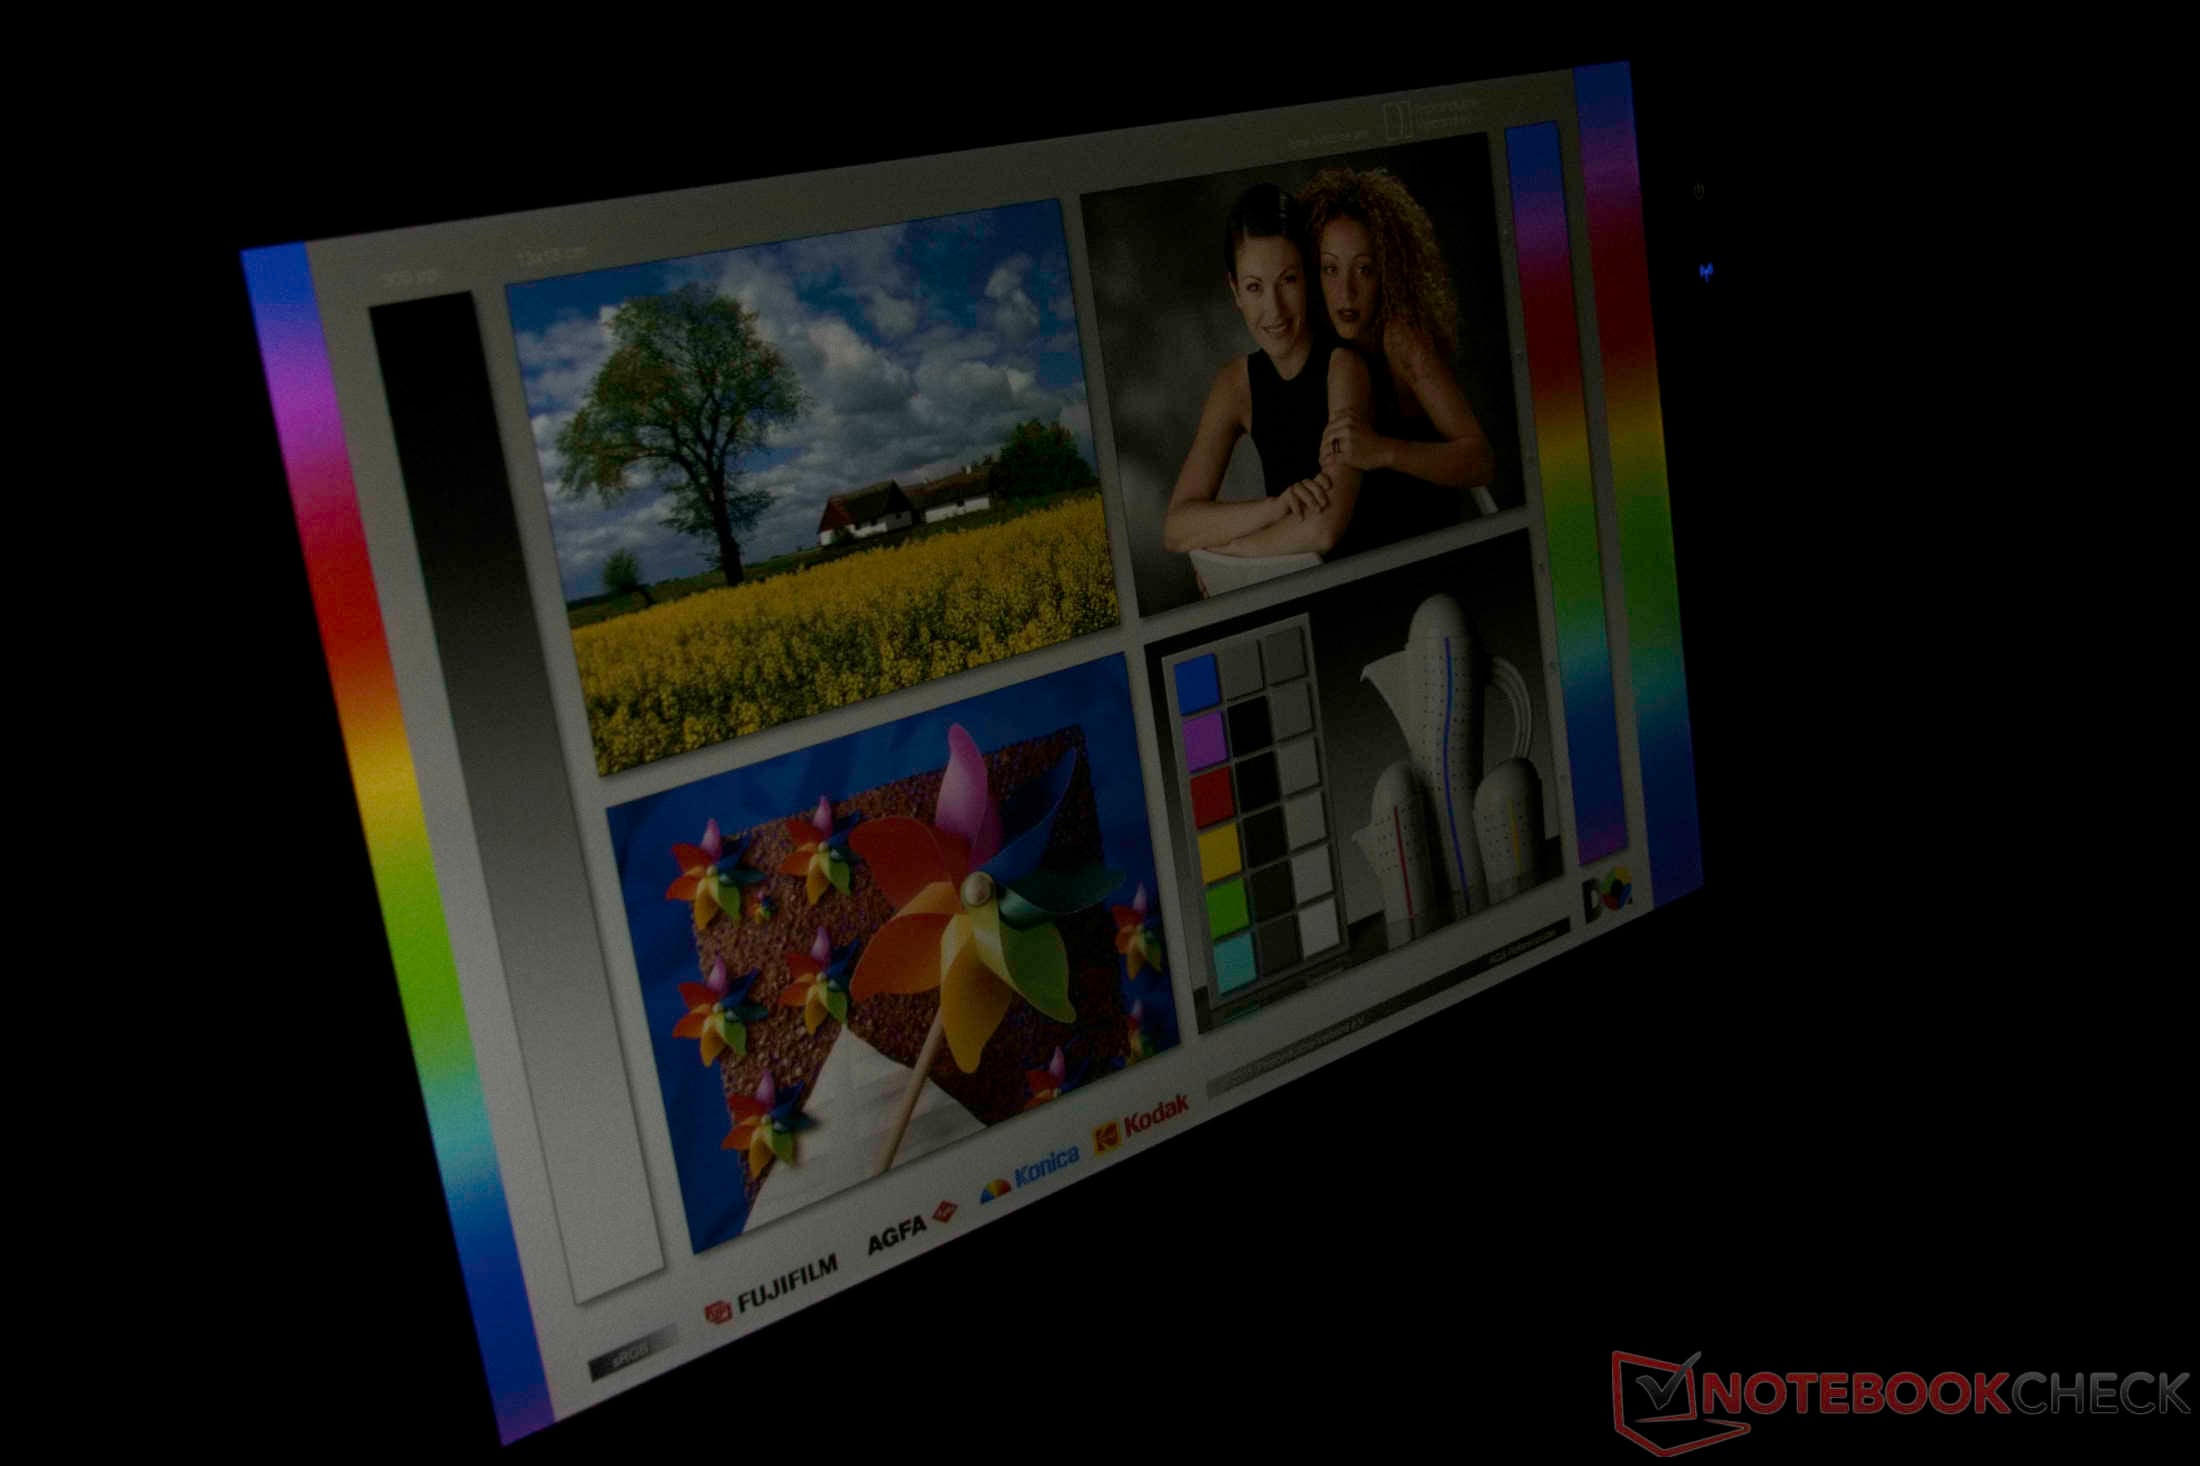
这款平板电脑不适合对色彩要求较高的任务。其sRGB色域覆盖率仅为61%,色彩显得有些淡。开箱即用时,屏幕就带有明显的绿色偏色。
Display Response Times
| ↔ Response Time Black to White | ||
|---|---|---|
| 27.6 ms ... rise ↗ and fall ↘ combined | ↗ 16 ms rise | 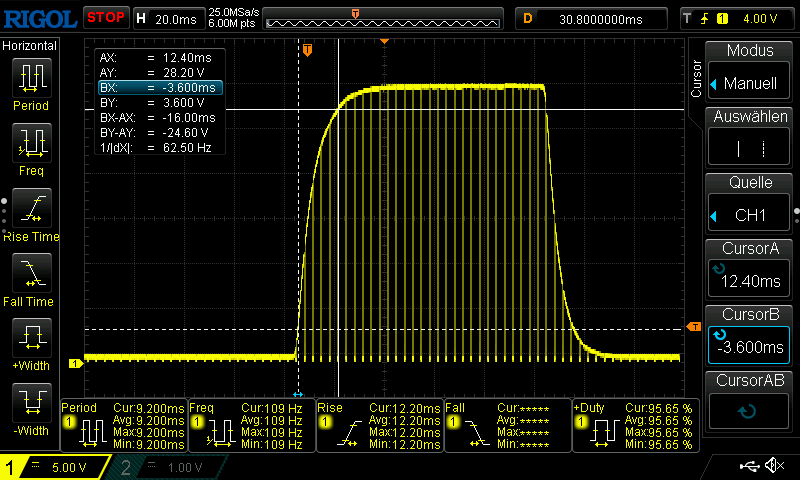 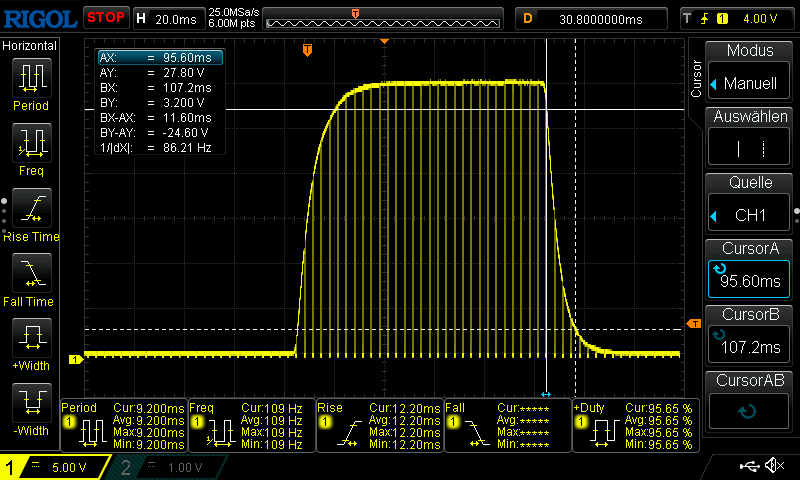 |
| ↘ 11.6 ms fall | ||
| The screen shows relatively slow response rates in our tests and may be too slow for gamers. In comparison, all tested devices range from 0.1 (minimum) to 240 (maximum) ms. » 70 % of all devices are better. This means that the measured response time is worse than the average of all tested devices (19.8 ms). | ||
| ↔ Response Time 50% Grey to 80% Grey | ||
| 53.2 ms ... rise ↗ and fall ↘ combined | ↗ 20 ms rise | 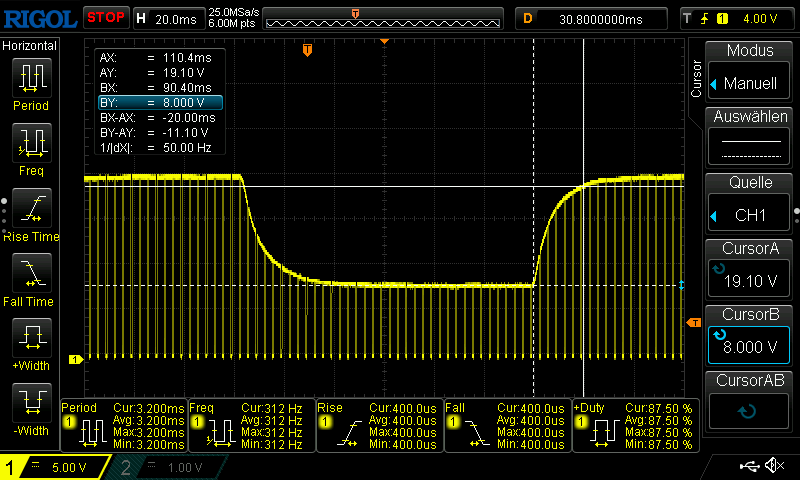 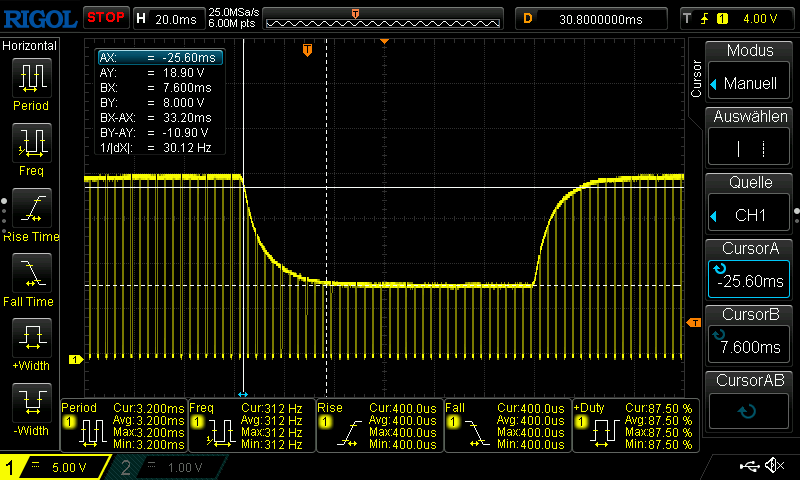 |
| ↘ 33.2 ms fall | ||
| The screen shows slow response rates in our tests and will be unsatisfactory for gamers. In comparison, all tested devices range from 0.165 (minimum) to 636 (maximum) ms. » 90 % of all devices are better. This means that the measured response time is worse than the average of all tested devices (31 ms). | ||
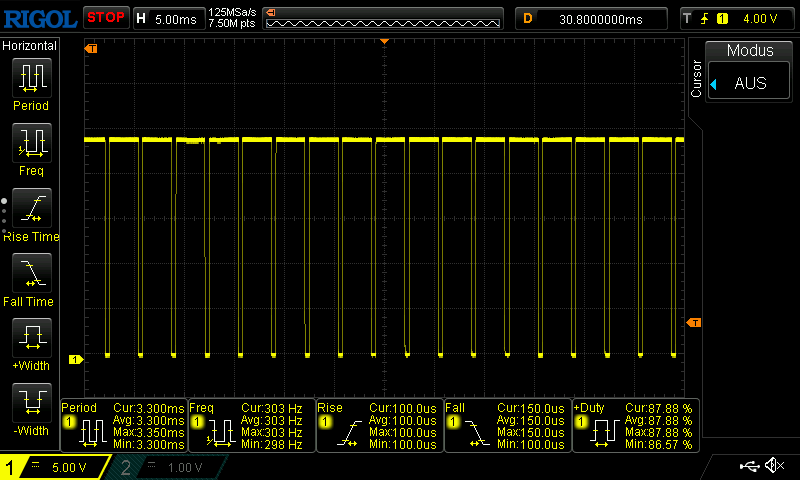
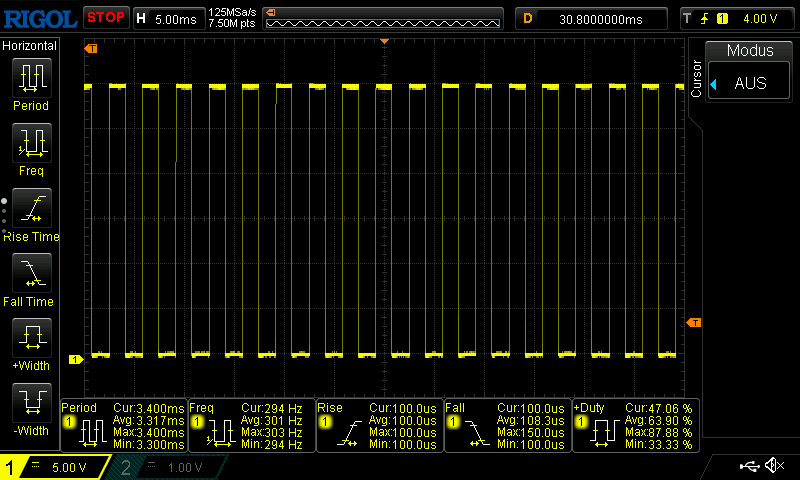
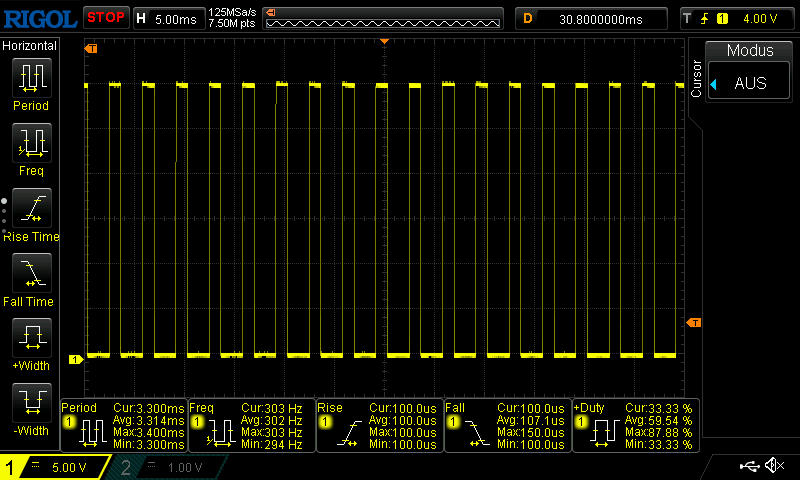
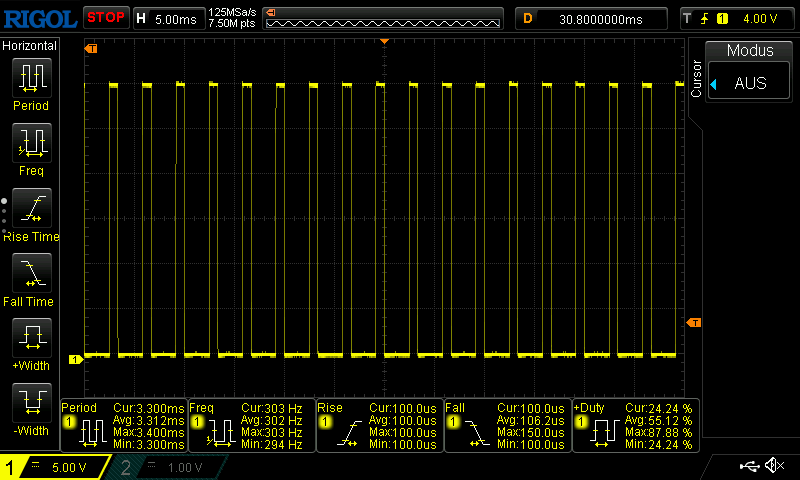
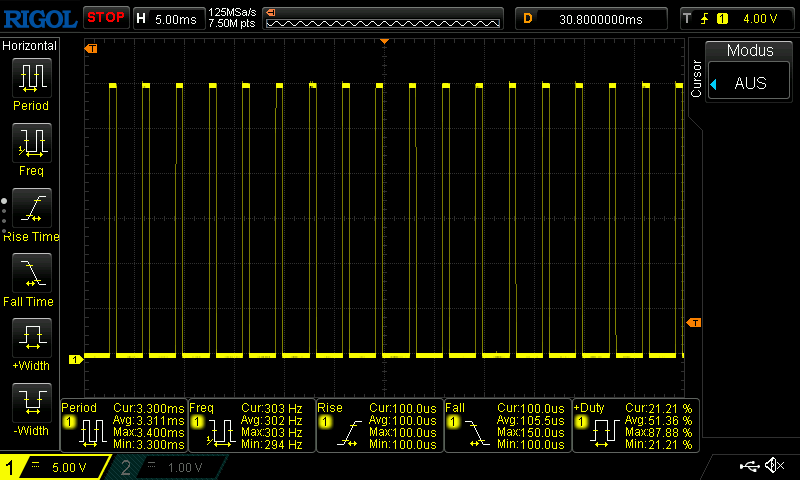
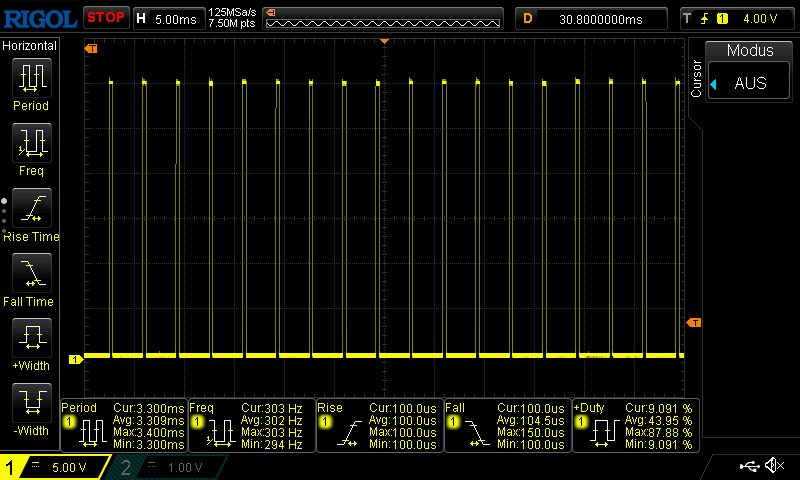
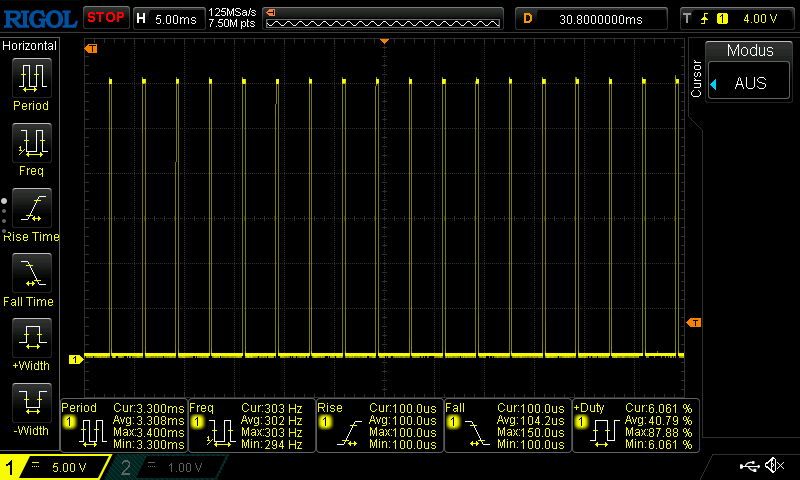
Screen Flickering / PWM (Pulse-Width Modulation)
| Screen flickering / PWM detected | 300 Hz Amplitude: 100 % | 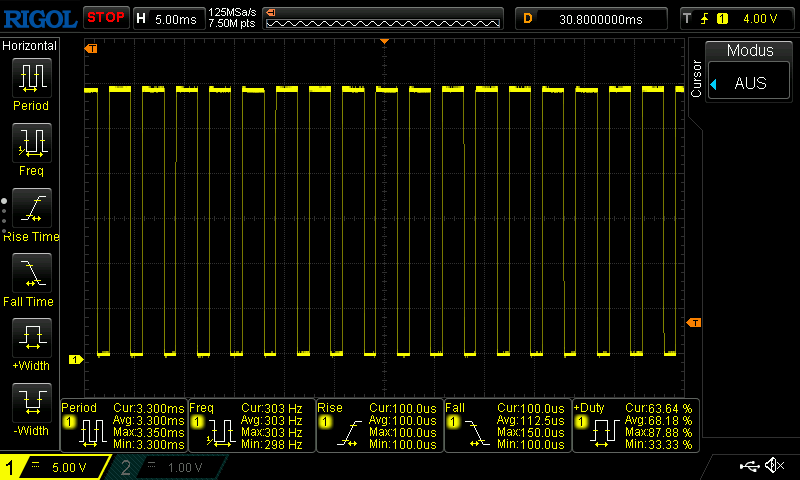 | |
The display backlight flickers at 300 Hz (worst case, e.g., utilizing PWM) . The frequency of 300 Hz is relatively high, so most users sensitive to PWM should not notice any flickering. However, there are reports that some users are still sensitive to PWM at 500 Hz and above, so be aware. In comparison: 52 % of all tested devices do not use PWM to dim the display. If PWM was detected, an average of 7781 (minimum: 5 - maximum: 343500) Hz was measured. | |||

户外使用
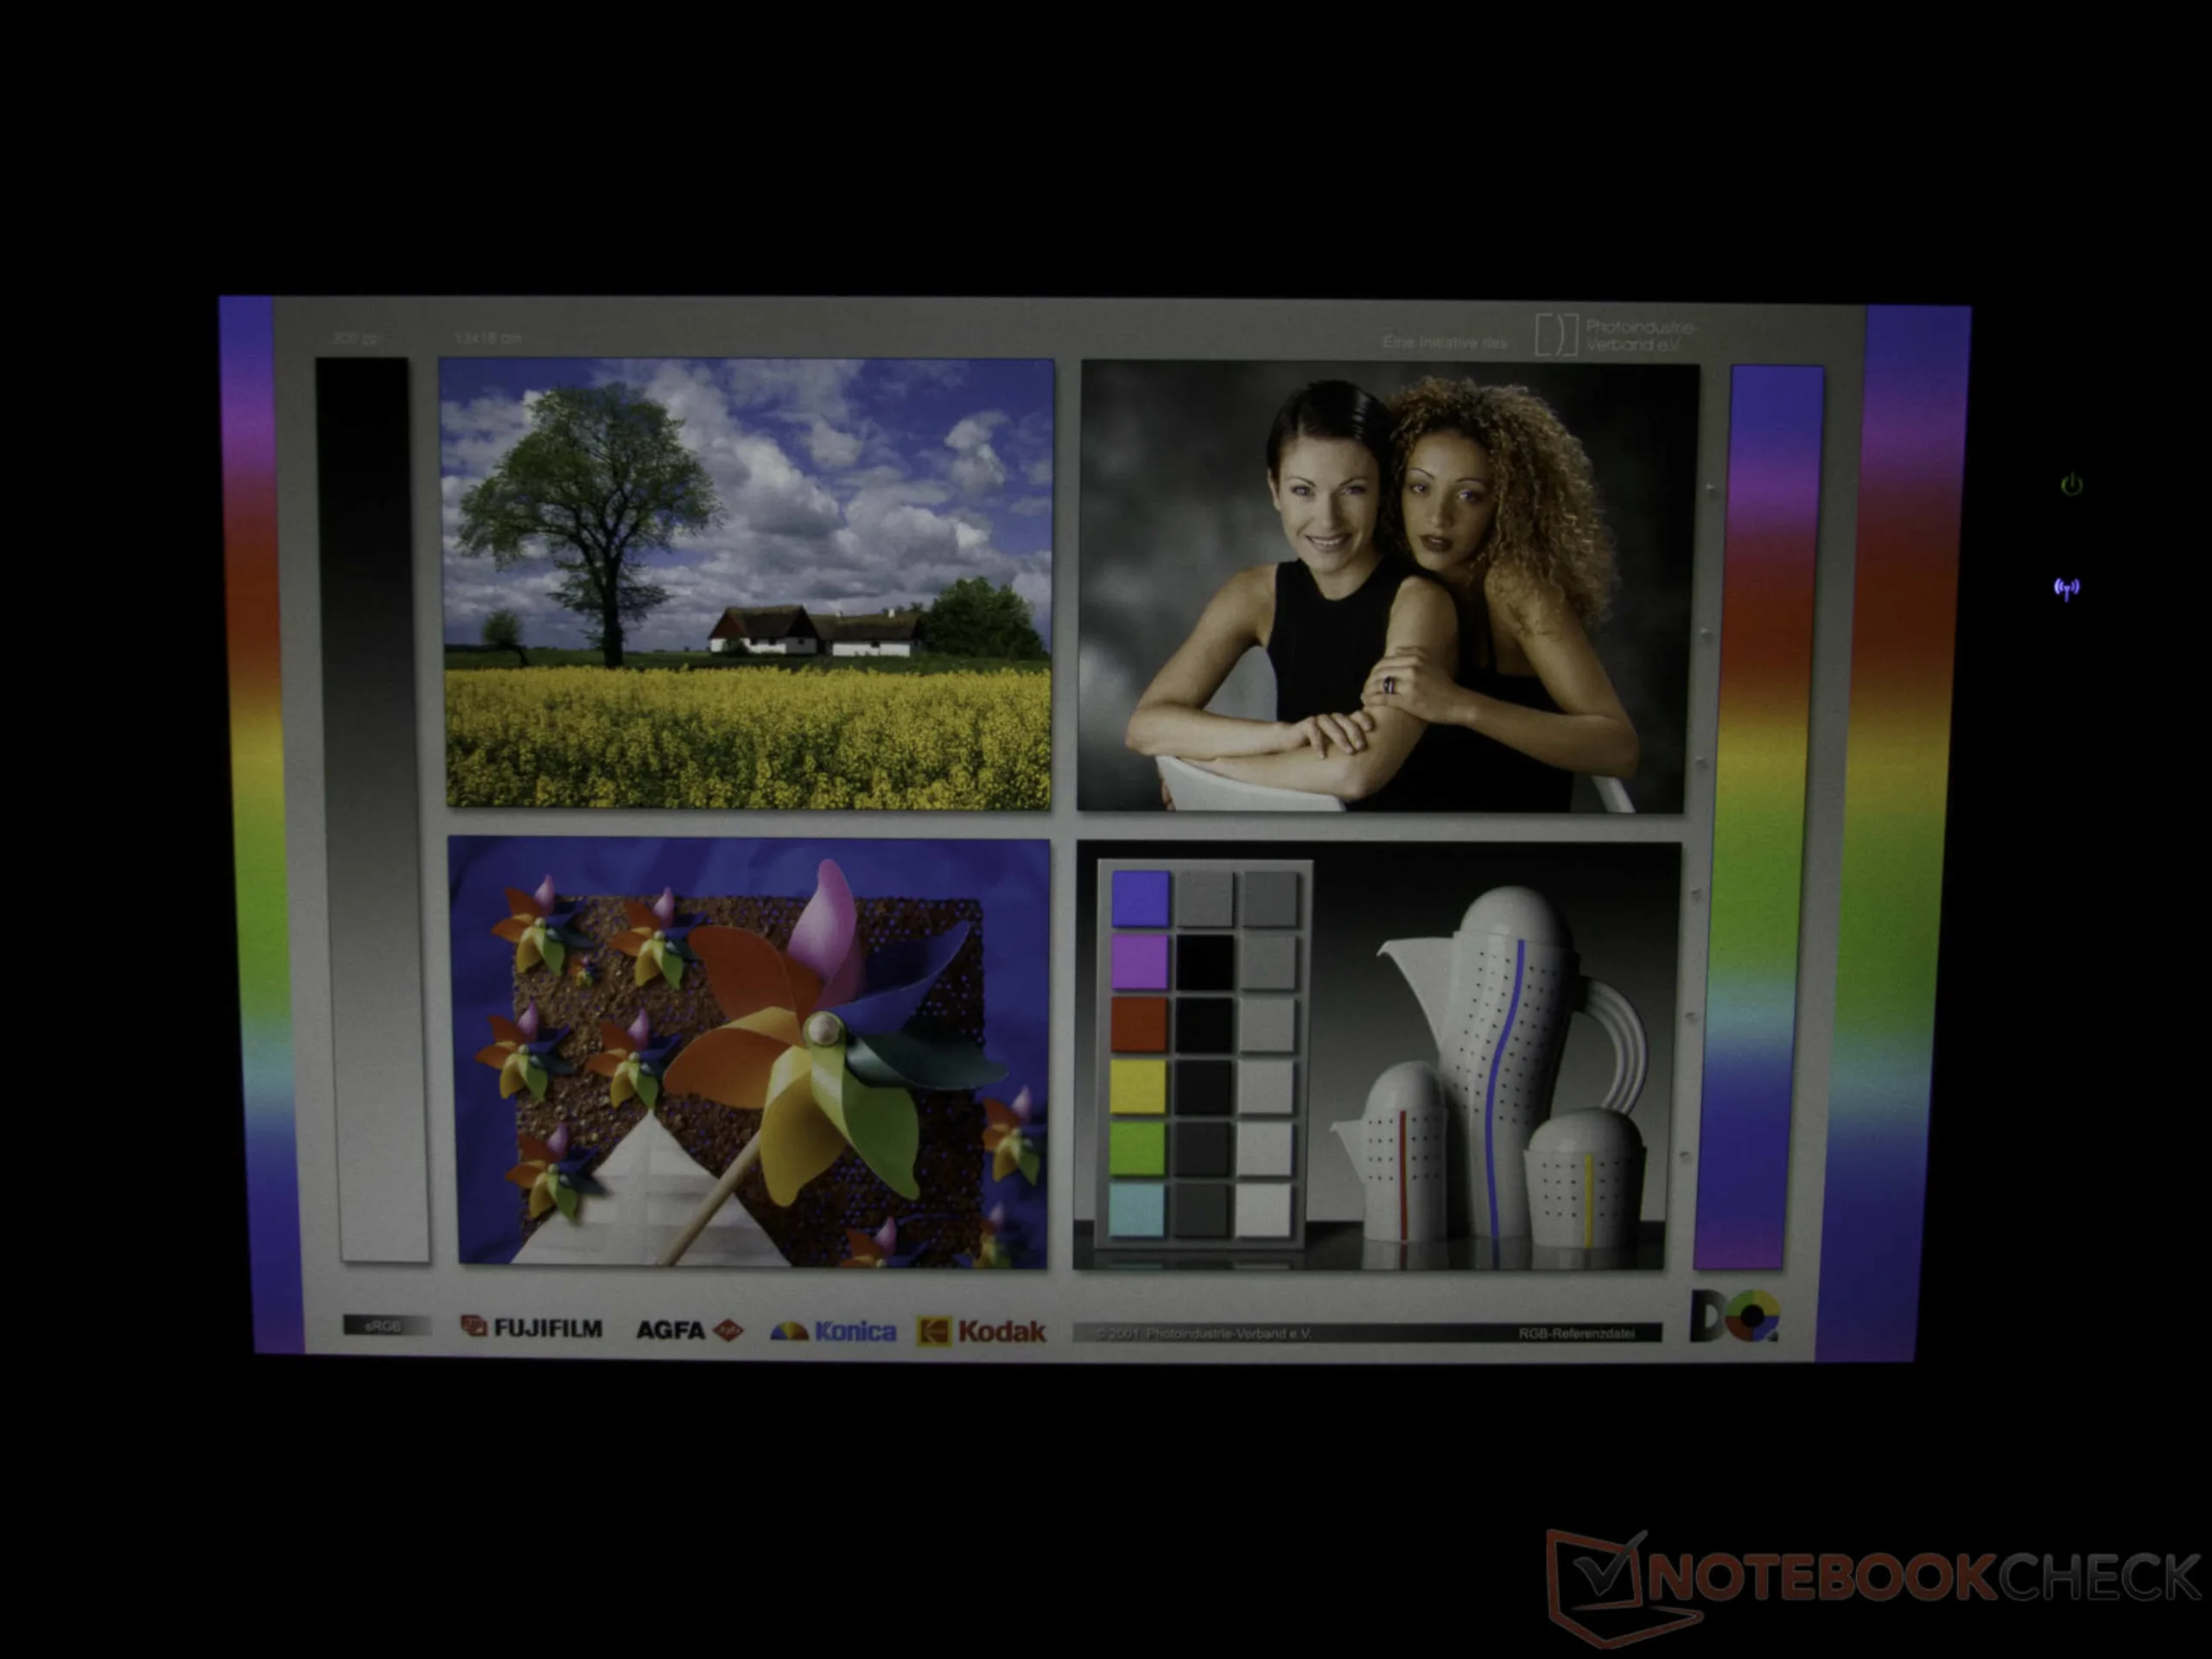
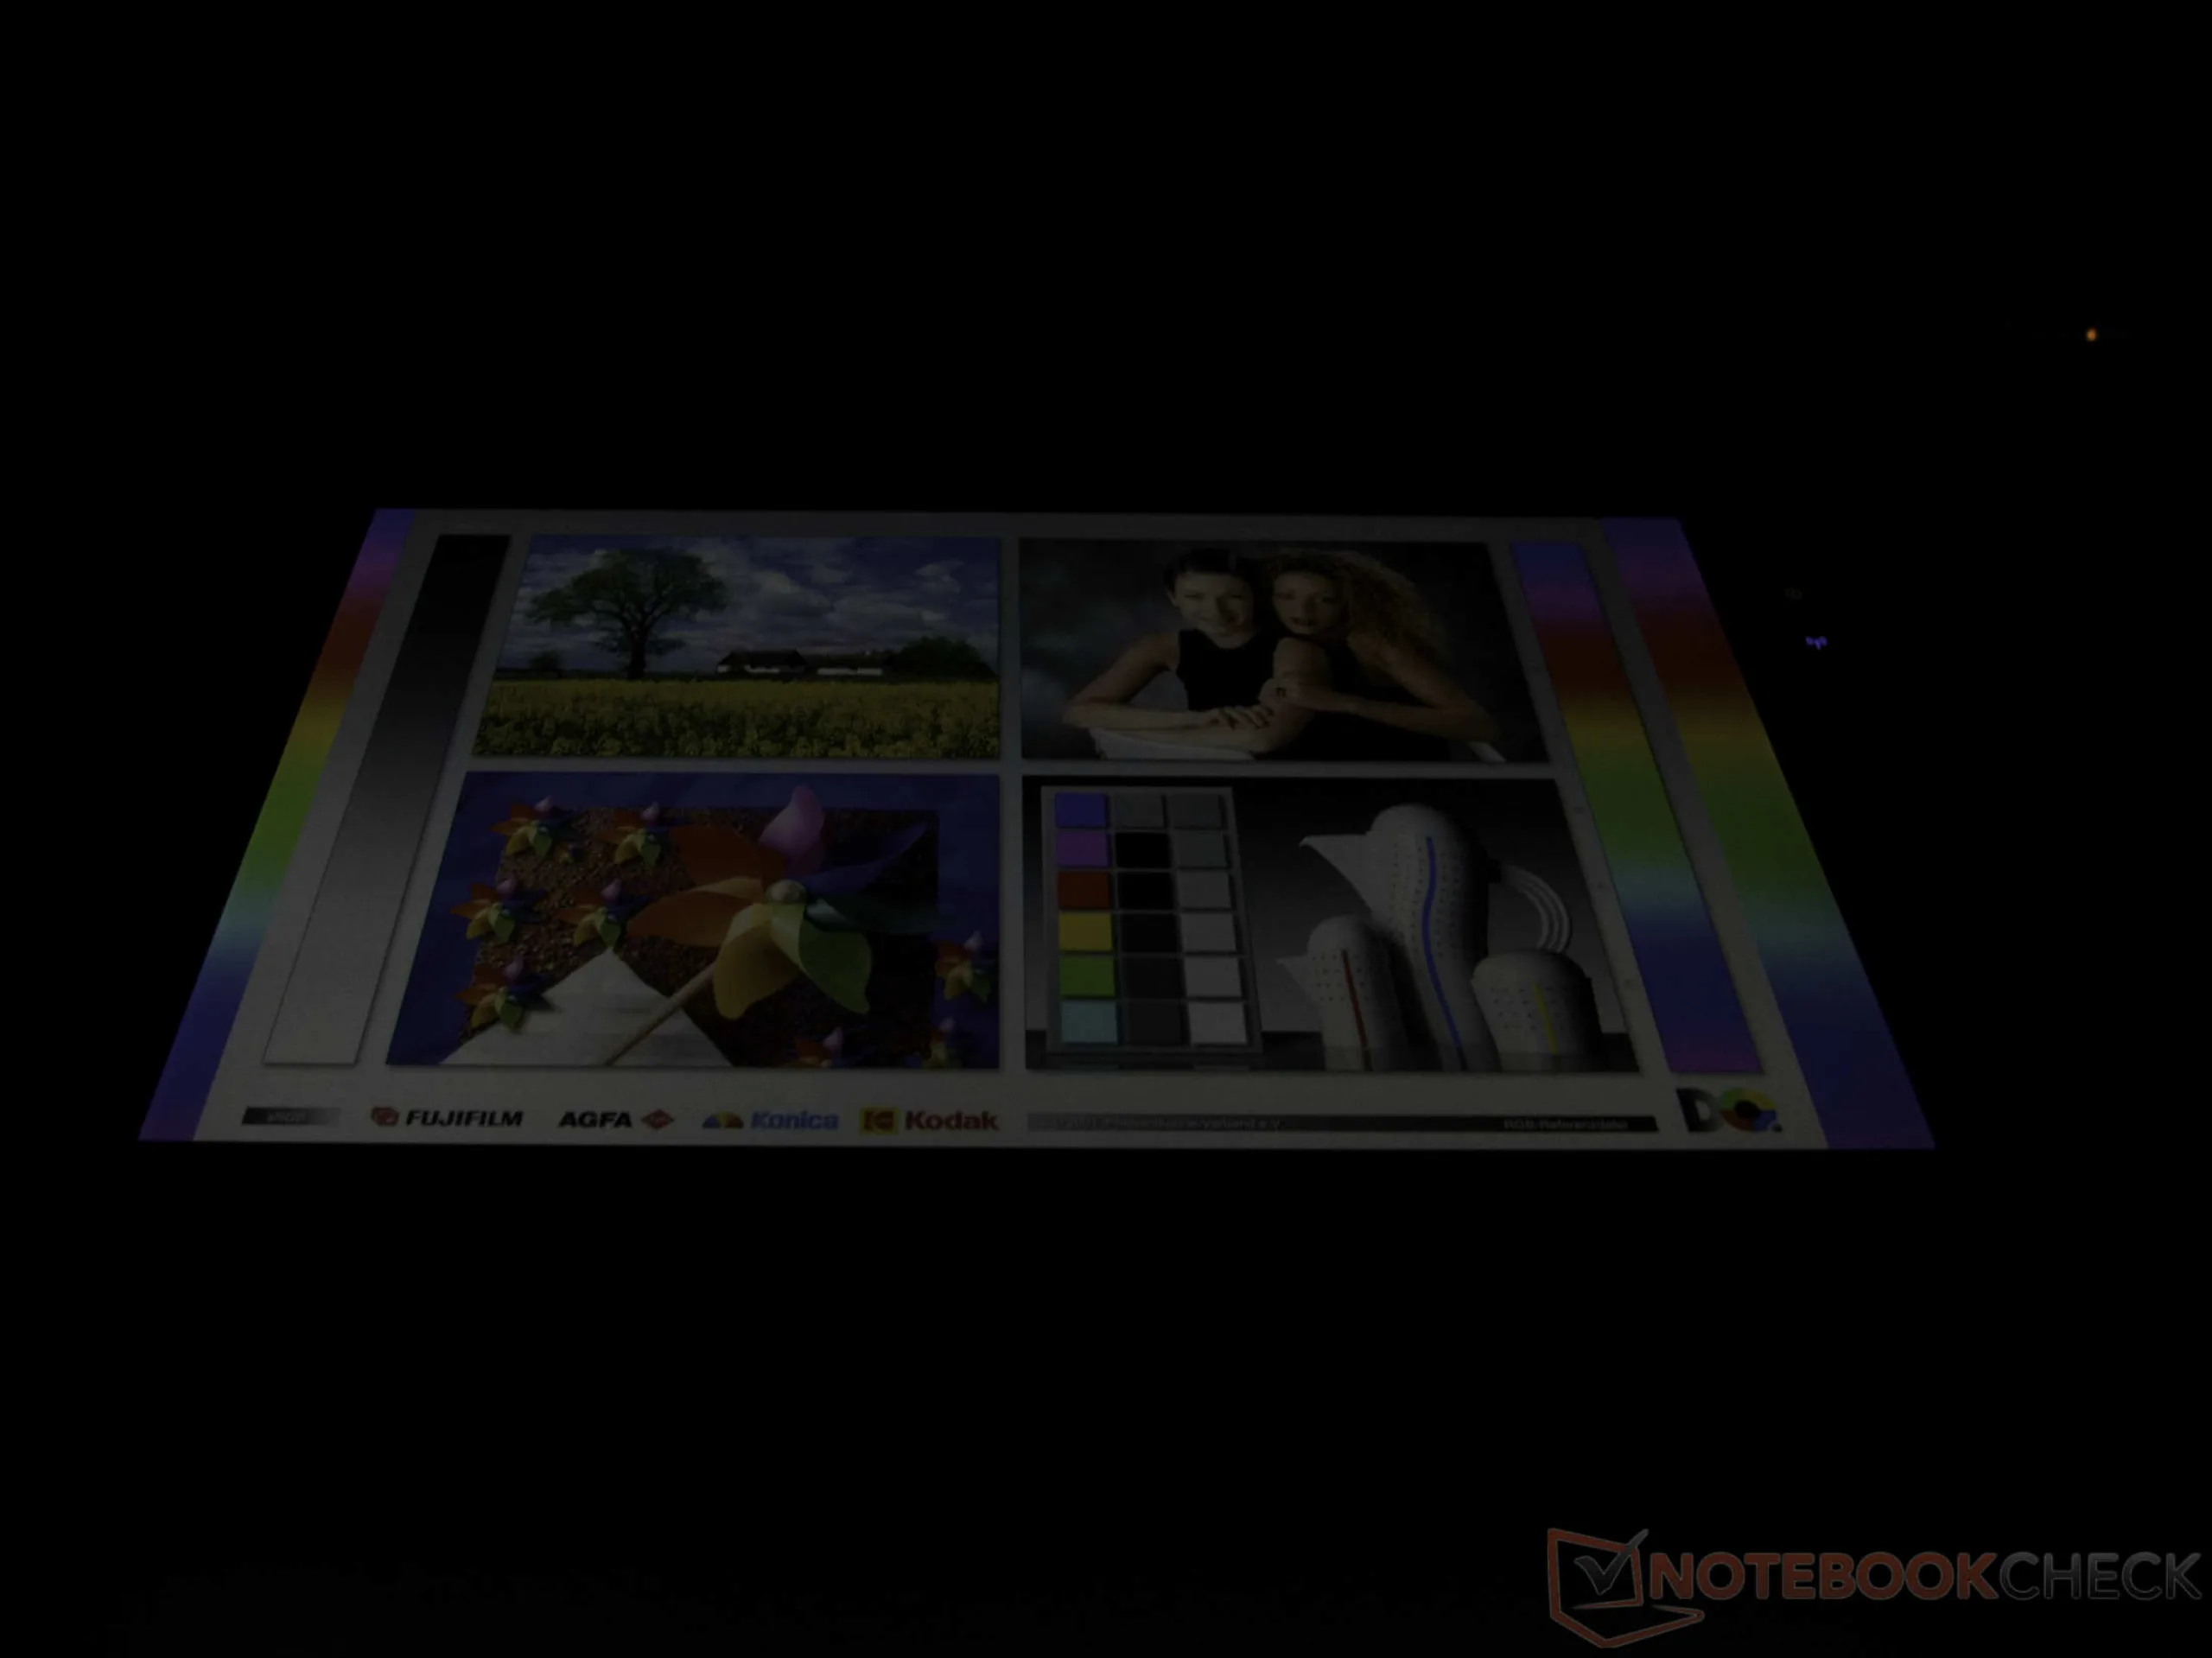
视角分析
性能
在坚固的机箱内部,一款最先进的英特尔酷睿Ultra处理器正不懈地运转。对于R10机型,几乎所有来自Lunar Lake世代的酷睿Ultra 5和酷睿Ultra 7处理器均可进行配置。根据处理器等级的不同,还提供vPro企业版。
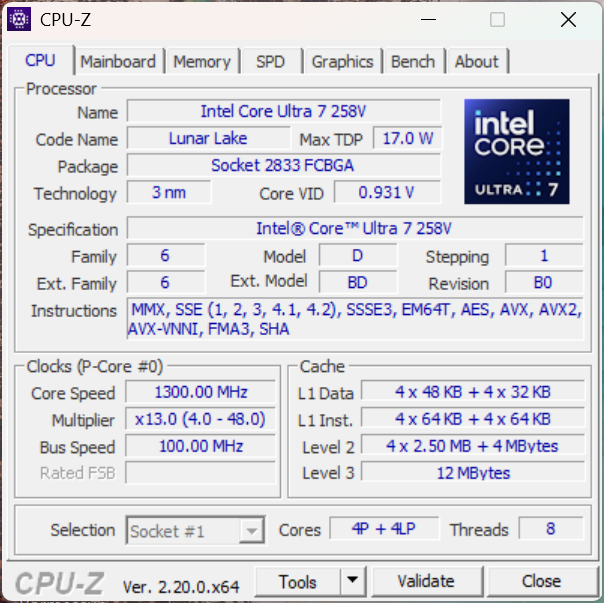
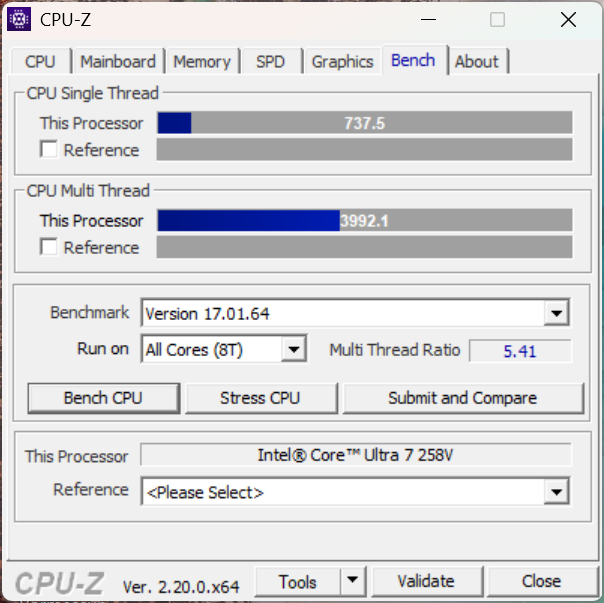
处理器性能
测试机型中的 258V 处理器配备八个核心,但不支持多线程。在短暂的负载峰值期间,系统允许功耗最高达到 32 瓦,随后功耗会被永久限制在约 17 瓦。因此,在我们的对比测试中,Core Ultra 7 的性能表现低于平均水平。 该处理器不具备可调节TDP值的电源管理功能。
Cinebench R15 多核耐力测试
Cinebench R23: Multi Core | Single Core
Cinebench R20: CPU (Multi Core) | CPU (Single Core)
Cinebench R15: CPU Multi 64Bit | CPU Single 64Bit
Blender: v2.79 BMW27 CPU
7-Zip 18.03: 7z b 4 | 7z b 4 -mmt1
Geekbench 6.7: Multi-Core | Single-Core
Geekbench 5.5: Multi-Core | Single-Core
HWBOT x265 Benchmark v2.2: 4k Preset
LibreOffice : 20 Documents To PDF
R Benchmark 2.5: Overall mean
| CPU Performance rating | |
| Lenovo ThinkPad T14 Gen 6 AMD | |
| Lenovo ThinkPad T14 Gen 6 21QG001VGE | |
| Average Intel Core Ultra 7 258V | |
| Dynabook Portege Z40L-N | |
| Durabook R10 | |
| Dell Latitude 7030 Rugged Extreme | |
| Average of class Tablet | |
| Durabook R8 Tablet -2! | |
| Cinebench R23 / Multi Core | |
| Lenovo ThinkPad T14 Gen 6 AMD | |
| Lenovo ThinkPad T14 Gen 6 21QG001VGE | |
| Average Intel Core Ultra 7 258V (7920 - 11097, n=25) | |
| Average of class Tablet (8043 - 10868, n=3, last 2 years) | |
| Dell Latitude 7030 Rugged Extreme | |
| Durabook R10 | |
| Durabook R10 | |
| Dynabook Portege Z40L-N | |
| Durabook R8 Tablet | |
| Cinebench R23 / Single Core | |
| Lenovo ThinkPad T14 Gen 6 AMD | |
| Lenovo ThinkPad T14 Gen 6 21QG001VGE | |
| Durabook R10 | |
| Durabook R10 | |
| Average of class Tablet (1822 - 1921, n=3, last 2 years) | |
| Average Intel Core Ultra 7 258V (1664 - 1957, n=25) | |
| Dynabook Portege Z40L-N | |
| Dell Latitude 7030 Rugged Extreme | |
| Durabook R8 Tablet | |
| Cinebench R20 / CPU (Multi Core) | |
| Lenovo ThinkPad T14 Gen 6 AMD | |
| Lenovo ThinkPad T14 Gen 6 21QG001VGE | |
| Average Intel Core Ultra 7 258V (3130 - 4314, n=24) | |
| Average of class Tablet (3137 - 4255, n=2, last 2 years) | |
| Dell Latitude 7030 Rugged Extreme | |
| Durabook R10 | |
| Dynabook Portege Z40L-N | |
| Durabook R8 Tablet | |
| Cinebench R20 / CPU (Single Core) | |
| Lenovo ThinkPad T14 Gen 6 AMD | |
| Lenovo ThinkPad T14 Gen 6 21QG001VGE | |
| Average of class Tablet (705 - 739, n=2, last 2 years) | |
| Dynabook Portege Z40L-N | |
| Average Intel Core Ultra 7 258V (643 - 749, n=24) | |
| Durabook R10 | |
| Dell Latitude 7030 Rugged Extreme | |
| Durabook R8 Tablet | |
| Cinebench R15 / CPU Multi 64Bit | |
| Lenovo ThinkPad T14 Gen 6 AMD | |
| Lenovo ThinkPad T14 Gen 6 21QG001VGE | |
| Average Intel Core Ultra 7 258V (1280 - 1656, n=24) | |
| Average of class Tablet (1285 - 1651, n=2, last 2 years) | |
| Dell Latitude 7030 Rugged Extreme | |
| Durabook R10 | |
| Dynabook Portege Z40L-N | |
| Durabook R8 Tablet | |
| Cinebench R15 / CPU Single 64Bit | |
| Average of class Tablet (274 - 299, n=2, last 2 years) | |
| Lenovo ThinkPad T14 Gen 6 21QG001VGE | |
| Average Intel Core Ultra 7 258V (258 - 298, n=24) | |
| Dynabook Portege Z40L-N | |
| Durabook R10 | |
| Dell Latitude 7030 Rugged Extreme | |
| Lenovo ThinkPad T14 Gen 6 AMD | |
| Durabook R8 Tablet | |
| Blender / v2.79 BMW27 CPU | |
| Durabook R8 Tablet | |
| Durabook R10 | |
| Dynabook Portege Z40L-N | |
| Average of class Tablet (337 - 484, n=2, last 2 years) | |
| Dell Latitude 7030 Rugged Extreme | |
| Average Intel Core Ultra 7 258V (315 - 484, n=24) | |
| Lenovo ThinkPad T14 Gen 6 21QG001VGE | |
| Lenovo ThinkPad T14 Gen 6 AMD | |
| 7-Zip 18.03 / 7z b 4 | |
| Lenovo ThinkPad T14 Gen 6 AMD | |
| Lenovo ThinkPad T14 Gen 6 21QG001VGE | |
| Dell Latitude 7030 Rugged Extreme | |
| Average Intel Core Ultra 7 258V (24486 - 36724, n=24) | |
| Average of class Tablet (24486 - 36610, n=2, last 2 years) | |
| Dynabook Portege Z40L-N | |
| Durabook R10 | |
| Durabook R8 Tablet | |
| 7-Zip 18.03 / 7z b 4 -mmt1 | |
| Lenovo ThinkPad T14 Gen 6 AMD | |
| Lenovo ThinkPad T14 Gen 6 21QG001VGE | |
| Dynabook Portege Z40L-N | |
| Average Intel Core Ultra 7 258V (4769 - 5869, n=24) | |
| Average of class Tablet (4769 - 5991, n=2, last 2 years) | |
| Dell Latitude 7030 Rugged Extreme | |
| Durabook R10 | |
| Durabook R8 Tablet | |
| Geekbench 6.7 / Multi-Core | |
| Lenovo ThinkPad T14 Gen 6 AMD | |
| Lenovo ThinkPad T14 Gen 6 21QG001VGE | |
| Average Intel Core Ultra 7 258V (8964 - 11334, n=24) | |
| Dynabook Portege Z40L-N | |
| Durabook R10 | |
| Dell Latitude 7030 Rugged Extreme | |
| Average of class Tablet (1104 - 16544, n=86, last 2 years) | |
| Geekbench 6.7 / Single-Core | |
| Lenovo ThinkPad T14 Gen 6 AMD | |
| Lenovo ThinkPad T14 Gen 6 21QG001VGE | |
| Dynabook Portege Z40L-N | |
| Average Intel Core Ultra 7 258V (2593 - 2795, n=24) | |
| Durabook R10 | |
| Dell Latitude 7030 Rugged Extreme | |
| Average of class Tablet (323 - 4128, n=86, last 2 years) | |
| Geekbench 5.5 / Multi-Core | |
| Lenovo ThinkPad T14 Gen 6 AMD | |
| Lenovo ThinkPad T14 Gen 6 21QG001VGE | |
| Average Intel Core Ultra 7 258V (7574 - 9918, n=24) | |
| Dynabook Portege Z40L-N | |
| Durabook R10 | |
| Dell Latitude 7030 Rugged Extreme | |
| Average of class Tablet (303 - 10522, n=39, last 2 years) | |
| Durabook R8 Tablet | |
| Geekbench 5.5 / Single-Core | |
| Lenovo ThinkPad T14 Gen 6 AMD | |
| Lenovo ThinkPad T14 Gen 6 21QG001VGE | |
| Dynabook Portege Z40L-N | |
| Average Intel Core Ultra 7 258V (1891 - 2046, n=24) | |
| Durabook R10 | |
| Dell Latitude 7030 Rugged Extreme | |
| Durabook R8 Tablet | |
| Average of class Tablet (103 - 2286, n=39, last 2 years) | |
| HWBOT x265 Benchmark v2.2 / 4k Preset | |
| Lenovo ThinkPad T14 Gen 6 AMD | |
| Lenovo ThinkPad T14 Gen 6 21QG001VGE | |
| Average Intel Core Ultra 7 258V (7.11 - 14.2, n=24) | |
| Average of class Tablet (7.11 - 12.9, n=2, last 2 years) | |
| Dynabook Portege Z40L-N | |
| Dell Latitude 7030 Rugged Extreme | |
| Durabook R10 | |
| Durabook R8 Tablet | |
| LibreOffice / 20 Documents To PDF | |
| Durabook R10 | |
| Durabook R8 Tablet | |
| Average of class Tablet (48.3 - 62.8, n=2, last 2 years) | |
| Lenovo ThinkPad T14 Gen 6 AMD | |
| Average Intel Core Ultra 7 258V (41.1 - 62.8, n=24) | |
| Lenovo ThinkPad T14 Gen 6 21QG001VGE | |
| Dell Latitude 7030 Rugged Extreme | |
| Dynabook Portege Z40L-N | |
| R Benchmark 2.5 / Overall mean | |
| Durabook R8 Tablet | |
| Durabook R10 | |
| Dell Latitude 7030 Rugged Extreme | |
| Average of class Tablet (0.4361 - 0.542, n=2, last 2 years) | |
| Dynabook Portege Z40L-N | |
| Average Intel Core Ultra 7 258V (0.443 - 0.542, n=24) | |
| Lenovo ThinkPad T14 Gen 6 21QG001VGE | |
| Lenovo ThinkPad T14 Gen 6 AMD | |
* ... smaller is better
AIDA64: FP32 Ray-Trace | FPU Julia | CPU SHA3 | FPU SinJulia | FPU Mandel | CPU AES | CPU ZLib | FP64 Ray-Trace | CPU PhotoWorxx | CPU CheckMate
| Performance rating | |
| Lenovo ThinkPad T14 Gen 6 AMD | |
| Lenovo ThinkPad T14 Gen 6 21QG001VGE -1! | |
| Average Intel Core Ultra 7 258V | |
| Average of class Tablet | |
| Durabook R10 | |
| Dynabook Portege Z40L-N -1! | |
| Dell Latitude 7030 Rugged Extreme -1! | |
| Durabook R8 Tablet -1! | |
| AIDA64 / FP32 Ray-Trace | |
| Lenovo ThinkPad T14 Gen 6 AMD (v8.20.8100) | |
| Lenovo ThinkPad T14 Gen 6 AMD (v6.92.6600) | |
| Lenovo ThinkPad T14 Gen 6 21QG001VGE (v6.92.6600) | |
| Average Intel Core Ultra 7 258V (8454 - 12781, n=26) | |
| Average of class Tablet (8485 - 12759, n=2, last 2 years) | |
| Dynabook Portege Z40L-N (v6.92.6600) | |
| Durabook R10 (v8.20.8100) | |
| Dell Latitude 7030 Rugged Extreme (v6.92.6600) | |
| Durabook R8 Tablet (v6.85.6300) | |
| AIDA64 / FPU Julia | |
| Lenovo ThinkPad T14 Gen 6 AMD (v8.20.8100) | |
| Lenovo ThinkPad T14 Gen 6 AMD (v6.92.6600) | |
| Lenovo ThinkPad T14 Gen 6 21QG001VGE (v6.92.6600) | |
| Average Intel Core Ultra 7 258V (40875 - 63401, n=26) | |
| Average of class Tablet (42586 - 62102, n=2, last 2 years) | |
| Dynabook Portege Z40L-N (v6.92.6600) | |
| Durabook R10 (v8.20.8100) | |
| Dell Latitude 7030 Rugged Extreme (v6.92.6600) | |
| Durabook R8 Tablet (v6.85.6300) | |
| AIDA64 / CPU SHA3 | |
| Lenovo ThinkPad T14 Gen 6 AMD (v6.92.6600) | |
| Lenovo ThinkPad T14 Gen 6 AMD (v8.20.8100) | |
| Lenovo ThinkPad T14 Gen 6 21QG001VGE (v6.92.6600) | |
| Average Intel Core Ultra 7 258V (1930 - 2817, n=26) | |
| Average of class Tablet (2056 - 2784, n=2, last 2 years) | |
| Durabook R10 (v8.20.8100) | |
| Dynabook Portege Z40L-N (v6.92.6600) | |
| Dell Latitude 7030 Rugged Extreme (v6.92.6600) | |
| Durabook R8 Tablet (v6.85.6300) | |
| AIDA64 / FPU SinJulia | |
| Lenovo ThinkPad T14 Gen 6 AMD (v8.20.8100) | |
| Lenovo ThinkPad T14 Gen 6 AMD (v6.92.6600) | |
| Lenovo ThinkPad T14 Gen 6 21QG001VGE (v6.92.6600) | |
| Average Intel Core Ultra 7 258V (3817 - 4440, n=26) | |
| Average of class Tablet (4083 - 4429, n=2, last 2 years) | |
| Dell Latitude 7030 Rugged Extreme (v6.92.6600) | |
| Durabook R10 (v8.20.8100) | |
| Dynabook Portege Z40L-N (v6.92.6600) | |
| Durabook R8 Tablet (v6.85.6300) | |
| AIDA64 / FPU Mandel | |
| Lenovo ThinkPad T14 Gen 6 AMD (v8.20.8100) | |
| Lenovo ThinkPad T14 Gen 6 AMD (v6.92.6600) | |
| Lenovo ThinkPad T14 Gen 6 21QG001VGE (v6.92.6600) | |
| Average Intel Core Ultra 7 258V (21670 - 33565, n=26) | |
| Average of class Tablet (22775 - 31836, n=2, last 2 years) | |
| Dynabook Portege Z40L-N (v6.92.6600) | |
| Durabook R10 (v8.20.8100) | |
| Dell Latitude 7030 Rugged Extreme (v6.92.6600) | |
| Durabook R8 Tablet (v6.85.6300) | |
| AIDA64 / CPU AES | |
| Lenovo ThinkPad T14 Gen 6 AMD (v6.92.6600) | |
| Lenovo ThinkPad T14 Gen 6 AMD (v8.20.8100) | |
| Lenovo ThinkPad T14 Gen 6 21QG001VGE (v6.92.6600) | |
| Average Intel Core Ultra 7 258V (30957 - 40753, n=26) | |
| Average of class Tablet (34551 - 38941, n=2, last 2 years) | |
| Dell Latitude 7030 Rugged Extreme (v6.92.6600) | |
| Durabook R10 (v8.20.8100) | |
| Dynabook Portege Z40L-N (v6.92.6600) | |
| Durabook R8 Tablet (v6.85.6300) | |
| AIDA64 / CPU ZLib | |
| Lenovo ThinkPad T14 Gen 6 AMD (v6.92.6600) | |
| Lenovo ThinkPad T14 Gen 6 AMD (v8.20.8100) | |
| Lenovo ThinkPad T14 Gen 6 21QG001VGE (v6.92.6600) | |
| Dell Latitude 7030 Rugged Extreme (v6.92.6600) | |
| Average Intel Core Ultra 7 258V (422 - 632, n=26) | |
| Average of class Tablet (434 - 631, n=2, last 2 years) | |
| Dynabook Portege Z40L-N (v6.92.6600) | |
| Durabook R10 (v8.20.8100) | |
| Durabook R8 Tablet (v6.85.6300) | |
| AIDA64 / FP64 Ray-Trace | |
| Lenovo ThinkPad T14 Gen 6 AMD (v6.92.6600) | |
| Lenovo ThinkPad T14 Gen 6 AMD (v8.20.8100) | |
| Lenovo ThinkPad T14 Gen 6 21QG001VGE (v6.92.6600) | |
| Average Intel Core Ultra 7 258V (4258 - 6930, n=26) | |
| Average of class Tablet (4660 - 6803, n=2, last 2 years) | |
| Dynabook Portege Z40L-N (v6.92.6600) | |
| Durabook R10 (v8.20.8100) | |
| Dell Latitude 7030 Rugged Extreme (v6.92.6600) | |
| Durabook R8 Tablet (v6.85.6300) | |
| AIDA64 / CPU PhotoWorxx | |
| Lenovo ThinkPad T14 Gen 6 21QG001VGE (v6.92.6600) | |
| Average of class Tablet (52755 - 54886, n=2, last 2 years) | |
| Average Intel Core Ultra 7 258V (44223 - 59245, n=26) | |
| Durabook R10 (v8.20.8100) | |
| Dynabook Portege Z40L-N (v6.92.6600) | |
| Dell Latitude 7030 Rugged Extreme (v6.92.6600) | |
| Lenovo ThinkPad T14 Gen 6 AMD (v8.20.8100) | |
| Lenovo ThinkPad T14 Gen 6 AMD (v6.92.6600) | |
| Durabook R8 Tablet (v6.85.6300) | |
| AIDA64 / CPU CheckMate | |
| Lenovo ThinkPad T14 Gen 6 AMD (v8.20.8100) | |
| Average Intel Core Ultra 7 258V (2014 - 2513, n=2) | |
| Durabook R10 (v8.20.8100) | |
| Average of class Tablet (n=1last 2 years) | |
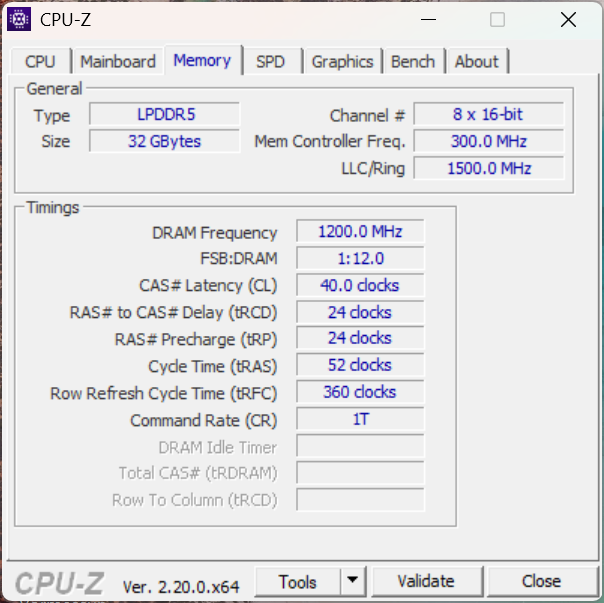
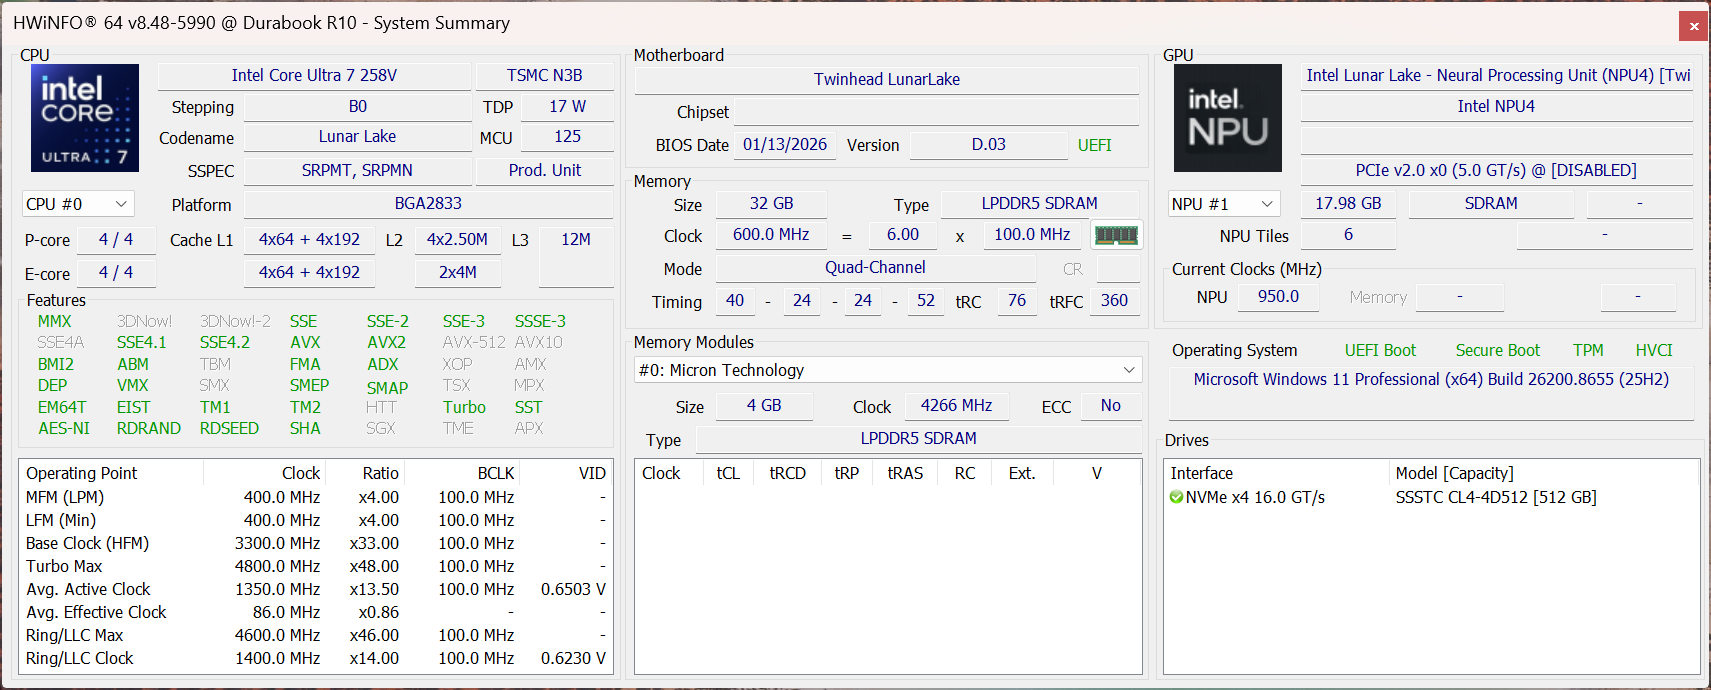
系统和存储性能
在日常使用中,该平台能确保 Office 任务的流畅运行。然而,从基准测试成绩来看,这款平板电脑的性能总体上低于 Lunar Lake 的平均水平。唯有在存储速度方面,这款平板电脑表现突出,展现出了 Lunar Lake 一贯的强劲性能。
PCMark 10: Score | Essentials | Productivity | Digital Content Creation
CrossMark: Overall | Productivity | Creativity | Responsiveness
WebXPRT 3: Overall
WebXPRT 4: Overall
Mozilla Kraken 1.1: Total
| Performance rating | |
| Lenovo ThinkPad T14 Gen 6 AMD | |
| Lenovo ThinkPad T14 Gen 6 21QG001VGE | |
| Average Intel Core Ultra 7 258V, Intel Arc Graphics 140V | |
| Dynabook Portege Z40L-N | |
| Durabook R10 | |
| Dell Latitude 7030 Rugged Extreme | |
| Average of class Tablet | |
| Durabook R8 Tablet | |
| PCMark 10 / Score | |
| Durabook R10 | |
| Lenovo ThinkPad T14 Gen 6 21QG001VGE | |
| Average of class Tablet (6924 - 7420, n=2, last 2 years) | |
| Lenovo ThinkPad T14 Gen 6 AMD | |
| Average Intel Core Ultra 7 258V, Intel Arc Graphics 140V (6265 - 7420, n=23) | |
| Dynabook Portege Z40L-N | |
| Dell Latitude 7030 Rugged Extreme | |
| Durabook R8 Tablet | |
| PCMark 10 / Essentials | |
| Lenovo ThinkPad T14 Gen 6 AMD | |
| Lenovo ThinkPad T14 Gen 6 21QG001VGE | |
| Average Intel Core Ultra 7 258V, Intel Arc Graphics 140V (9295 - 11467, n=23) | |
| Dynabook Portege Z40L-N | |
| Average of class Tablet (9991 - 10351, n=2, last 2 years) | |
| Durabook R10 | |
| Dell Latitude 7030 Rugged Extreme | |
| Durabook R8 Tablet | |
| PCMark 10 / Productivity | |
| Durabook R10 | |
| Average of class Tablet (8823 - 13600, n=2, last 2 years) | |
| Lenovo ThinkPad T14 Gen 6 AMD | |
| Dynabook Portege Z40L-N | |
| Lenovo ThinkPad T14 Gen 6 21QG001VGE | |
| Average Intel Core Ultra 7 258V, Intel Arc Graphics 140V (7357 - 13600, n=23) | |
| Dell Latitude 7030 Rugged Extreme | |
| Durabook R8 Tablet | |
| PCMark 10 / Digital Content Creation | |
| Lenovo ThinkPad T14 Gen 6 21QG001VGE | |
| Average Intel Core Ultra 7 258V, Intel Arc Graphics 140V (8160 - 10308, n=23) | |
| Average of class Tablet (8160 - 9863, n=2, last 2 years) | |
| Dynabook Portege Z40L-N | |
| Lenovo ThinkPad T14 Gen 6 AMD | |
| Durabook R10 | |
| Dell Latitude 7030 Rugged Extreme | |
| Durabook R8 Tablet | |
| CrossMark / Overall | |
| Lenovo ThinkPad T14 Gen 6 AMD | |
| Lenovo ThinkPad T14 Gen 6 21QG001VGE | |
| Average Intel Core Ultra 7 258V, Intel Arc Graphics 140V (1275 - 1742, n=22) | |
| Dynabook Portege Z40L-N | |
| Dell Latitude 7030 Rugged Extreme | |
| Durabook R10 | |
| Durabook R8 Tablet | |
| Average of class Tablet (319 - 2375, n=46, last 2 years) | |
| CrossMark / Productivity | |
| Lenovo ThinkPad T14 Gen 6 AMD | |
| Lenovo ThinkPad T14 Gen 6 21QG001VGE | |
| Average Intel Core Ultra 7 258V, Intel Arc Graphics 140V (1267 - 1684, n=22) | |
| Dynabook Portege Z40L-N | |
| Dell Latitude 7030 Rugged Extreme | |
| Durabook R10 | |
| Durabook R8 Tablet | |
| Average of class Tablet (346 - 2036, n=44, last 2 years) | |
| CrossMark / Creativity | |
| Lenovo ThinkPad T14 Gen 6 AMD | |
| Lenovo ThinkPad T14 Gen 6 21QG001VGE | |
| Average Intel Core Ultra 7 258V, Intel Arc Graphics 140V (1393 - 1977, n=22) | |
| Dynabook Portege Z40L-N | |
| Dell Latitude 7030 Rugged Extreme | |
| Durabook R10 | |
| Durabook R8 Tablet | |
| Average of class Tablet (288 - 2620, n=44, last 2 years) | |
| CrossMark / Responsiveness | |
| Average of class Tablet (333 - 12671, n=44, last 2 years) | |
| Lenovo ThinkPad T14 Gen 6 AMD | |
| Lenovo ThinkPad T14 Gen 6 21QG001VGE | |
| Average Intel Core Ultra 7 258V, Intel Arc Graphics 140V (999 - 1411, n=22) | |
| Dynabook Portege Z40L-N | |
| Dell Latitude 7030 Rugged Extreme | |
| Durabook R10 | |
| Durabook R8 Tablet | |
| WebXPRT 3 / Overall | |
| Lenovo ThinkPad T14 Gen 6 AMD | |
| Dynabook Portege Z40L-N | |
| Lenovo ThinkPad T14 Gen 6 21QG001VGE | |
| Average Intel Core Ultra 7 258V, Intel Arc Graphics 140V (219 - 317, n=22) | |
| Durabook R10 | |
| Dell Latitude 7030 Rugged Extreme | |
| Average of class Tablet (108 - 480, n=10, last 2 years) | |
| Durabook R8 Tablet | |
| WebXPRT 4 / Overall | |
| Dynabook Portege Z40L-N | |
| Lenovo ThinkPad T14 Gen 6 21QG001VGE | |
| Lenovo ThinkPad T14 Gen 6 AMD | |
| Average Intel Core Ultra 7 258V, Intel Arc Graphics 140V (199.5 - 291, n=22) | |
| Durabook R10 | |
| Dell Latitude 7030 Rugged Extreme | |
| Durabook R8 Tablet | |
| Average of class Tablet (39 - 376, n=56, last 2 years) | |
| Mozilla Kraken 1.1 / Total | |
| Average of class Tablet (243 - 27101, n=66, last 2 years) | |
| Durabook R8 Tablet | |
| Dell Latitude 7030 Rugged Extreme | |
| Durabook R10 | |
| Average Intel Core Ultra 7 258V, Intel Arc Graphics 140V (468 - 559, n=24) | |
| Lenovo ThinkPad T14 Gen 6 21QG001VGE | |
| Dynabook Portege Z40L-N | |
| Lenovo ThinkPad T14 Gen 6 AMD | |
* ... smaller is better
| PCMark 10 Score | 7420 points | |
Help | ||
| AIDA64 / Memory Copy | |
| Durabook R10 | |
| Lenovo ThinkPad T14 Gen 6 21QG001VGE | |
| Average of class Tablet (108317 - 110050, n=2, last 2 years) | |
| Average Intel Core Ultra 7 258V (104408 - 114336, n=24) | |
| Dynabook Portege Z40L-N | |
| Dell Latitude 7030 Rugged Extreme | |
| Lenovo ThinkPad T14 Gen 6 AMD | |
| Lenovo ThinkPad T14 Gen 6 AMD | |
| Durabook R8 Tablet | |
| AIDA64 / Memory Read | |
| Lenovo ThinkPad T14 Gen 6 21QG001VGE | |
| Average Intel Core Ultra 7 258V (82846 - 89417, n=24) | |
| Dynabook Portege Z40L-N | |
| Average of class Tablet (85395 - 87747, n=2, last 2 years) | |
| Durabook R10 | |
| Dell Latitude 7030 Rugged Extreme | |
| Lenovo ThinkPad T14 Gen 6 AMD | |
| Lenovo ThinkPad T14 Gen 6 AMD | |
| Durabook R8 Tablet | |
| AIDA64 / Memory Write | |
| Lenovo ThinkPad T14 Gen 6 21QG001VGE | |
| Average Intel Core Ultra 7 258V (108824 - 117989, n=24) | |
| Average of class Tablet (108824 - 117859, n=2, last 2 years) | |
| Dynabook Portege Z40L-N | |
| Durabook R10 | |
| Dell Latitude 7030 Rugged Extreme | |
| Lenovo ThinkPad T14 Gen 6 AMD | |
| Lenovo ThinkPad T14 Gen 6 AMD | |
| Durabook R8 Tablet | |
| AIDA64 / Memory Latency | |
| Dell Latitude 7030 Rugged Extreme | |
| Lenovo ThinkPad T14 Gen 6 AMD | |
| Lenovo ThinkPad T14 Gen 6 AMD | |
| Durabook R8 Tablet | |
| Durabook R10 | |
| Dynabook Portege Z40L-N | |
| Lenovo ThinkPad T14 Gen 6 21QG001VGE | |
| Average of class Tablet (94.4 - 101.7, n=2, last 2 years) | |
| Average Intel Core Ultra 7 258V (95 - 101.7, n=24) | |
* ... smaller is better
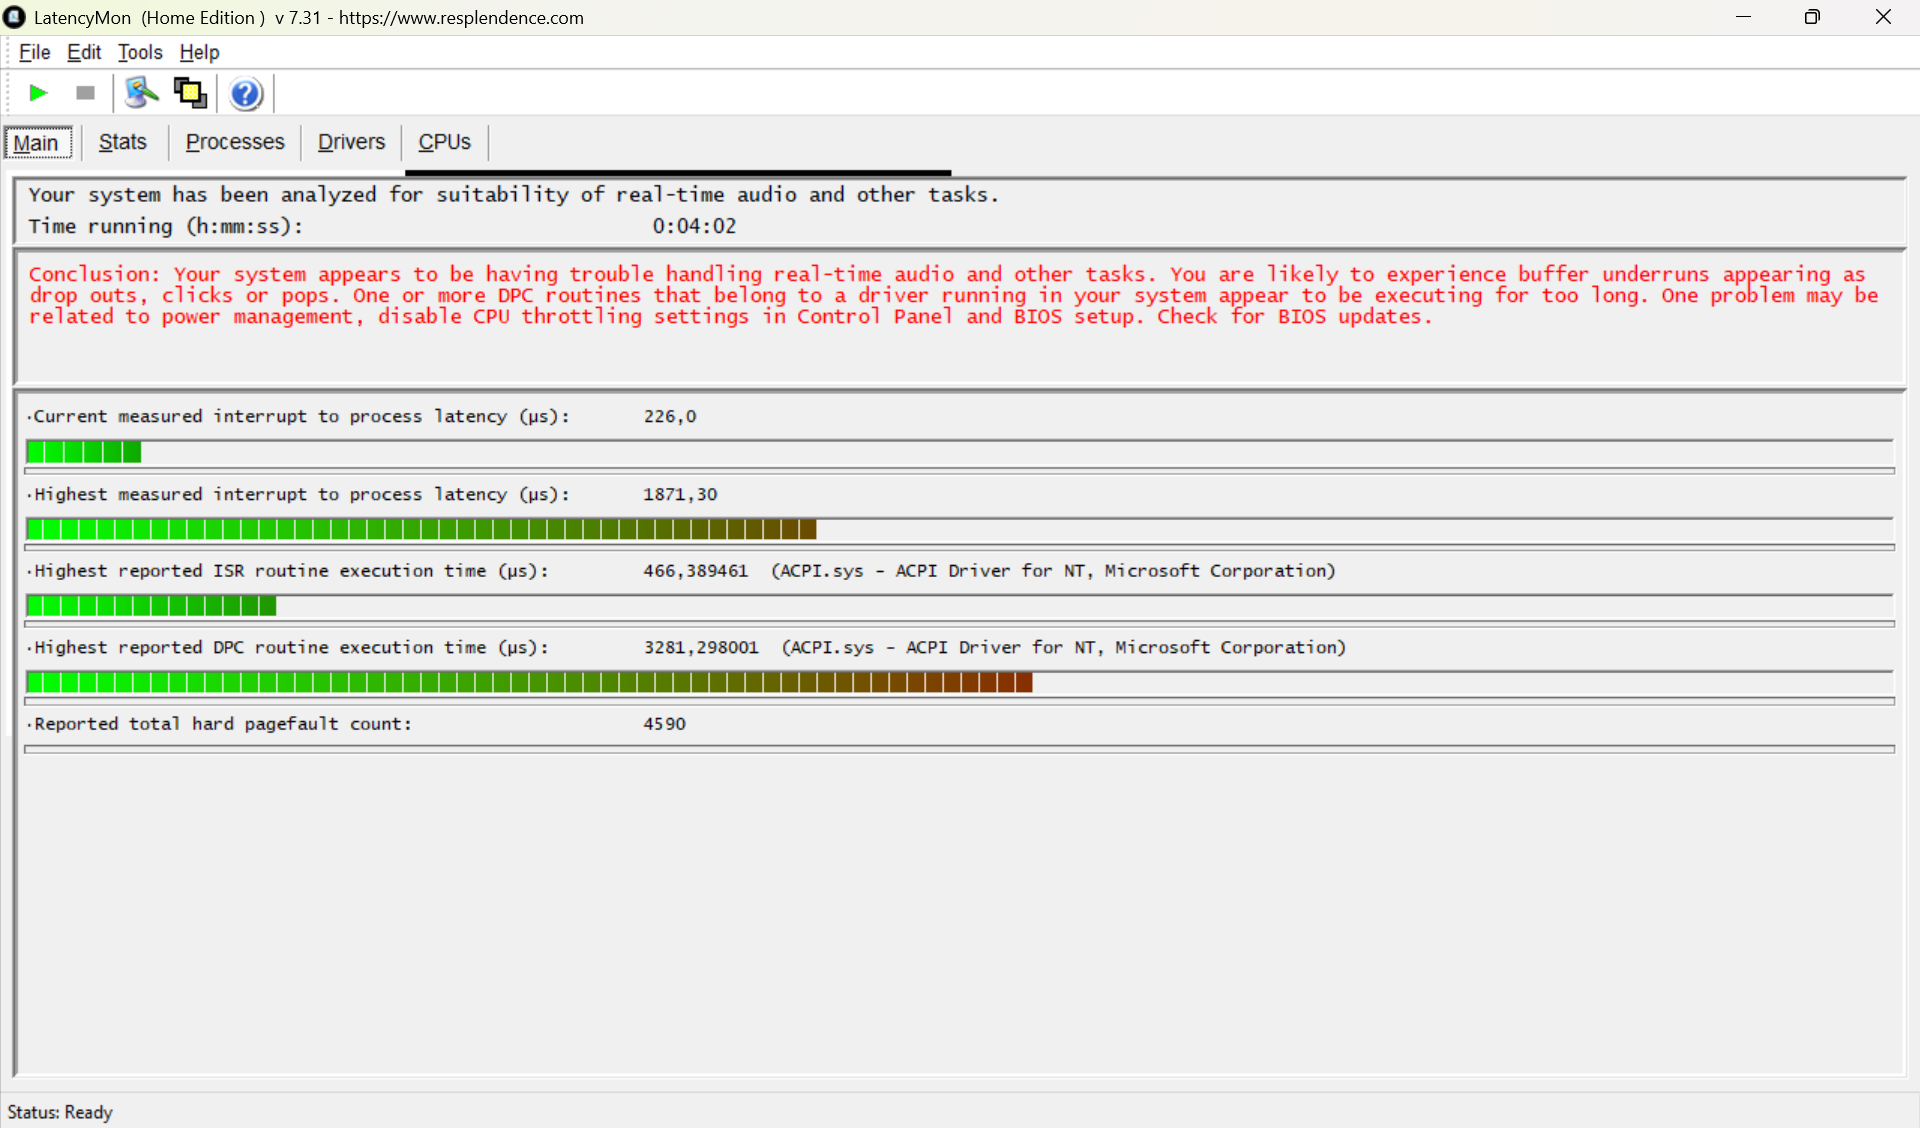
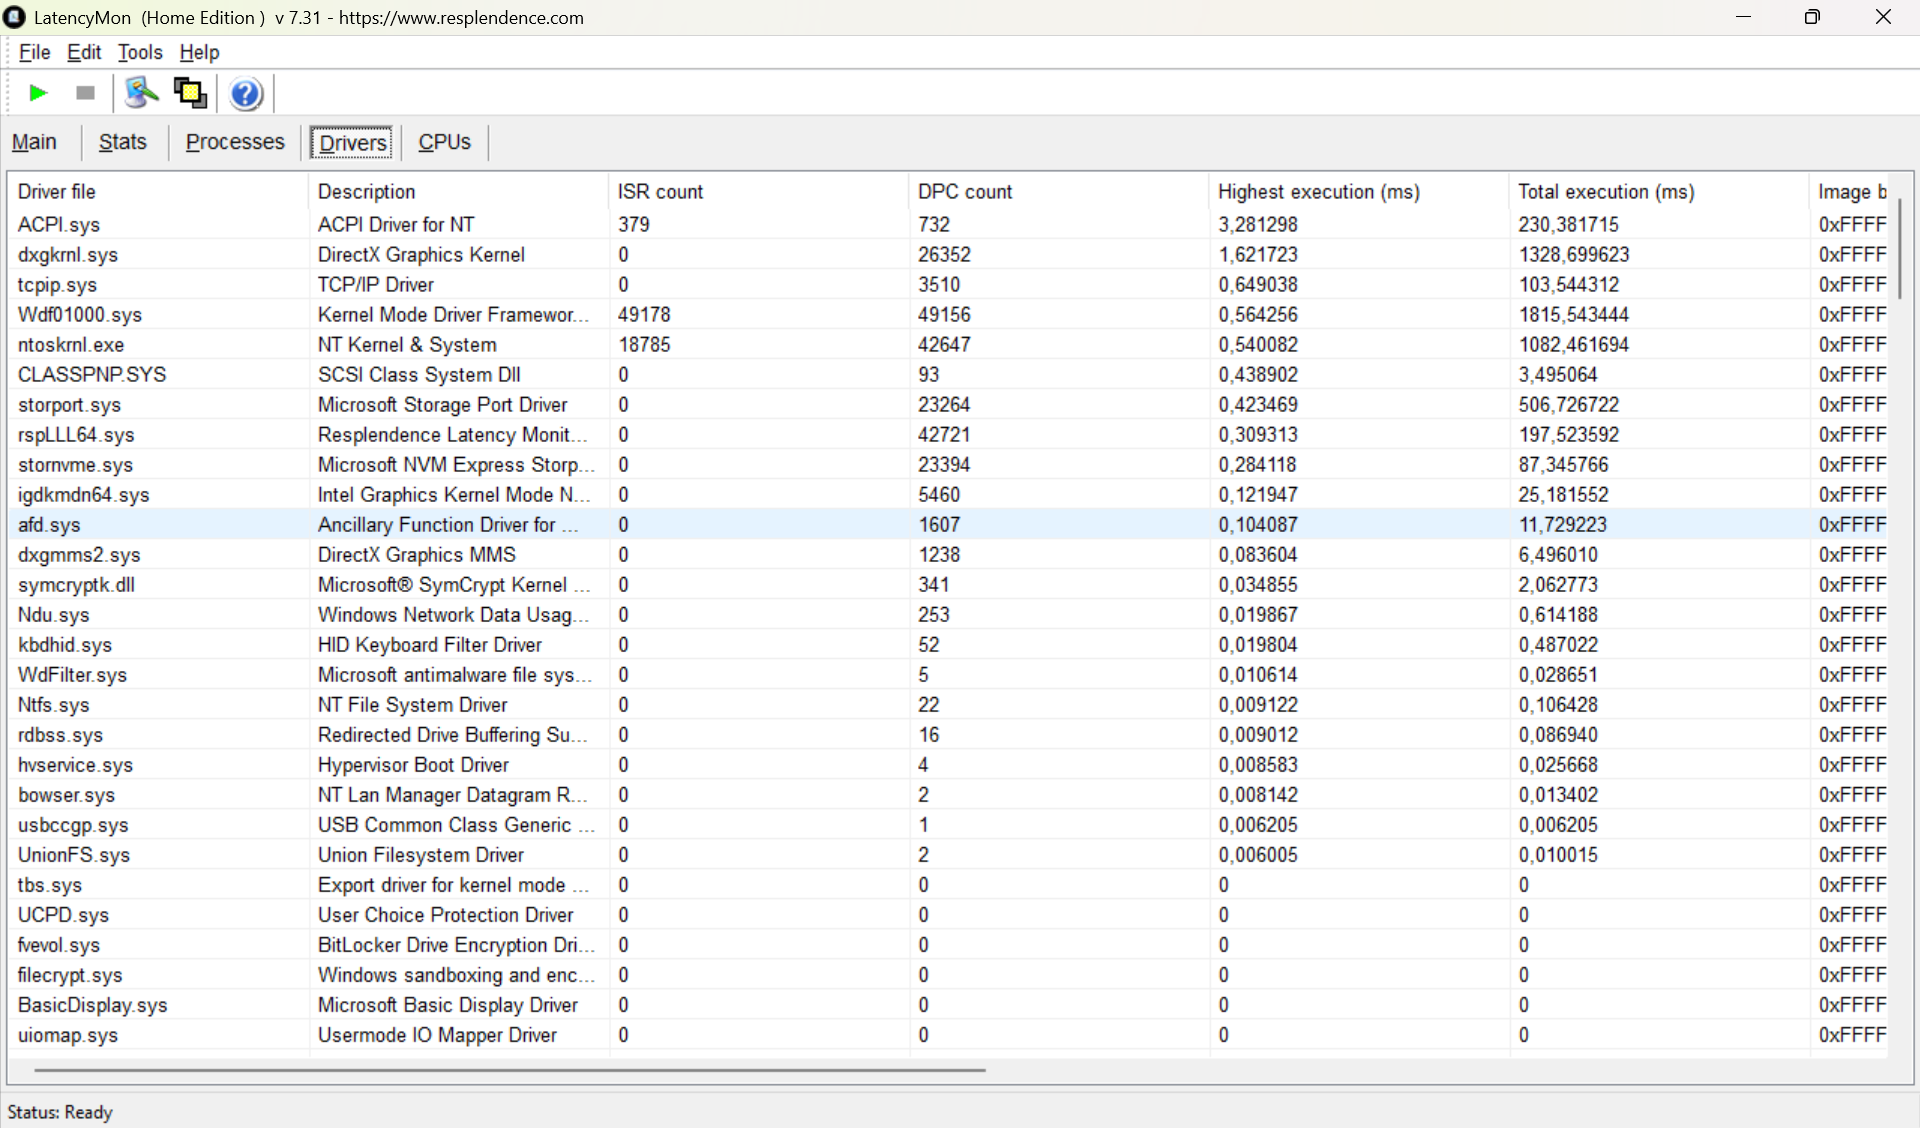
DPC 延迟
LatencyMon 分析工具显示,ACPI 驱动程序会在平板电脑上造成长达 3,281 微秒的延迟。这可能会导致在音频编辑或高频数据采集等对时间要求较高的任务中出现故障。
| DPC Latencies / LatencyMon - interrupt to process latency (max), Web, Youtube, Prime95 | |
| Durabook R10 | |
| Dell Latitude 7030 Rugged Extreme | |
| Durabook R8 Tablet | |
| Lenovo ThinkPad T14 Gen 6 21QG001VGE | |
| Dynabook Portege Z40L-N | |
| Average of class Tablet (482 - 1871, n=2, last 2 years) | |
* ... smaller is better
大容量存储

* ... smaller is better
持续读取性能:DiskSpd 读取循环,队列深度为 8
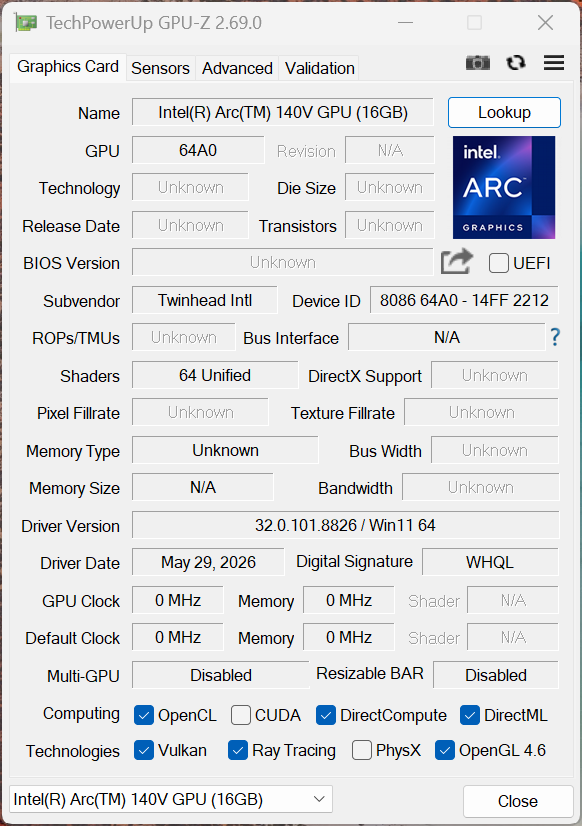
GPU 和游戏性能
图形处理由集成在处理器中的英特尔 Arc Graphics 140V 负责。它能够轻松处理高分辨率视频、轻量级 3D 任务以及多显示器配置。不过,大型 CAD 文件或对图形处理要求较高的应用程序可能会对英特尔显卡构成挑战。
| 3DMark 11 Performance | 9563 points | |
| 3DMark Ice Storm Standard Score | 178031 points | |
| 3DMark Cloud Gate Standard Score | 26729 points | |
| 3DMark Fire Strike Score | 7287 points | |
| 3DMark Time Spy Score | 3373 points | |
| 3DMark Steel Nomad Score | 743 points | |
| 3DMark Steel Nomad Light Score | 2843 points | |
Help | ||
* ... smaller is better
| Performance rating - Percent | |
| Lenovo ThinkPad T14 Gen 6 21QG001VGE -1! | |
| Average of class Tablet | |
| Dynabook Portege Z40L-N | |
| Durabook R10 | |
| Lenovo ThinkPad T14 Gen 6 AMD -1! | |
| Dell Latitude 7030 Rugged Extreme -1! | |
| Durabook R8 Tablet -5! | |
| Cyberpunk 2077 - 1920x1080 Ultra Preset (FSR off) | |
| Lenovo ThinkPad T14 Gen 6 21QG001VGE | |
| Average of class Tablet (21.2 - 28.7, n=2, last 2 years) | |
| Durabook R10 | |
| Dynabook Portege Z40L-N | |
| Lenovo ThinkPad T14 Gen 6 AMD | |
| Dell Latitude 7030 Rugged Extreme | |
| Baldur's Gate 3 - 1920x1080 Ultra Preset AA:T | |
| Lenovo ThinkPad T14 Gen 6 21QG001VGE | |
| Average of class Tablet (22.8 - 28.3, n=2, last 2 years) | |
| Dynabook Portege Z40L-N | |
| Durabook R10 | |
| Lenovo ThinkPad T14 Gen 6 AMD | |
| GTA V - 1920x1080 Highest AA:4xMSAA + FX AF:16x | |
| Lenovo ThinkPad T14 Gen 6 21QG001VGE | |
| Average of class Tablet (21.1 - 27.8, n=2, last 2 years) | |
| Dynabook Portege Z40L-N | |
| Durabook R10 | |
| Lenovo ThinkPad T14 Gen 6 AMD | |
| Dell Latitude 7030 Rugged Extreme | |
| Final Fantasy XV Benchmark - 1920x1080 High Quality | |
| Lenovo ThinkPad T14 Gen 6 21QG001VGE | |
| Average of class Tablet (25.4 - 34.4, n=3, last 2 years) | |
| Durabook R10 | |
| Durabook R10 | |
| Dynabook Portege Z40L-N | |
| Lenovo ThinkPad T14 Gen 6 AMD | |
| Dell Latitude 7030 Rugged Extreme | |
| Strange Brigade - 1920x1080 ultra AA:ultra AF:16 | |
| Average of class Tablet (44.4 - 58, n=2, last 2 years) | |
| Dynabook Portege Z40L-N | |
| Durabook R10 | |
| Dell Latitude 7030 Rugged Extreme | |
| Dota 2 Reborn - 1920x1080 ultra (3/3) best looking | |
| Lenovo ThinkPad T14 Gen 6 21QG001VGE | |
| Average of class Tablet (70.9 - 84.5, n=2, last 2 years) | |
| Durabook R10 | |
| Dynabook Portege Z40L-N | |
| Dell Latitude 7030 Rugged Extreme | |
| Lenovo ThinkPad T14 Gen 6 AMD | |
| Durabook R8 Tablet | |
《赛博朋克2077》超高清帧率图表
| low | med. | high | ultra | |
|---|---|---|---|---|
| GTA V (2015) | 128.8 | 125.6 | 50.7 | 21.1 |
| Dota 2 Reborn (2015) | 92.5 | 75 | 51.7 | 70.9 |
| Final Fantasy XV Benchmark (2018) | 63.8 | 35.9 | 25.4 | |
| X-Plane 11.11 (2018) | 34.5 | 31.4 | 30.1 | |
| Strange Brigade (2018) | 161.3 | 52.1 | 52.9 | 44.4 |
| Baldur's Gate 3 (2023) | 34.1 | 24.9 | 22.8 | |
| Cyberpunk 2077 (2023) | 37.9 | 21.2 | ||
| F1 24 (2024) | 40.4 | 14.6 | ||
| F1 25 (2025) | 55.8 | 48.6 | 34.9 |
排放与能源
噪声排放
内部风扇几乎持续运转。虽然系统空闲时几乎听不到风扇声,但在压力测试期间,其噪音也并未明显增大,仅为31 dB(A)。不过,当设备在户外使用时,这种轻微的嗡嗡声会被完全掩盖。
Noise level
| Idle |
| 27.7 / 27.7 / 27.7 dB(A) |
| Load |
| / 31.6 dB(A) |
 | ||
30 dB silent 40 dB(A) audible 50 dB(A) loud |
||
min: | ||
| Durabook R10 Core Ultra 7 258V, Arc 140V | Dell Latitude 7030 Rugged Extreme i7-1260U, Iris Xe G7 96EUs | Lenovo ThinkPad T14 Gen 6 21QG001VGE Core Ultra 7 258V, Arc 140V | Dynabook Portege Z40L-N Core Ultra 7 258V, Arc 140V | Durabook R8 Tablet i5-1230U, Iris Xe G7 80EUs | Lenovo ThinkPad T14 Gen 6 AMD Ryzen AI 7 PRO 350, Radeon 860M | |
|---|---|---|---|---|---|---|
| Noise | -1% | 0% | 6% | 7% | ||
| off / environment * (dB) | 25.9 | 23 11% | 25.1 3% | 23.5 9% | 24.5 5% | |
| Idle Minimum * (dB) | 27.7 | 23.5 15% | 25.1 9% | 23.6 15% | 24.5 12% | |
| Idle Average * (dB) | 27.7 | 23.5 15% | 25.1 9% | 23.6 15% | 24.5 12% | |
| Idle Maximum * (dB) | 27.7 | 23.5 15% | 27.1 2% | 23.6 15% | 24.5 12% | |
| Load Maximum * (dB) | 31.6 | 50.6 -60% | 38.5 -22% | 39 -23% | 33.7 -7% | |
| Load Average * (dB) | 24.1 | 34.8 | 37 | 26.8 | ||
| Cyberpunk 2077 ultra * (dB) | 50.5 | 38.3 | 37.8 | 35.3 |
* ... smaller is better
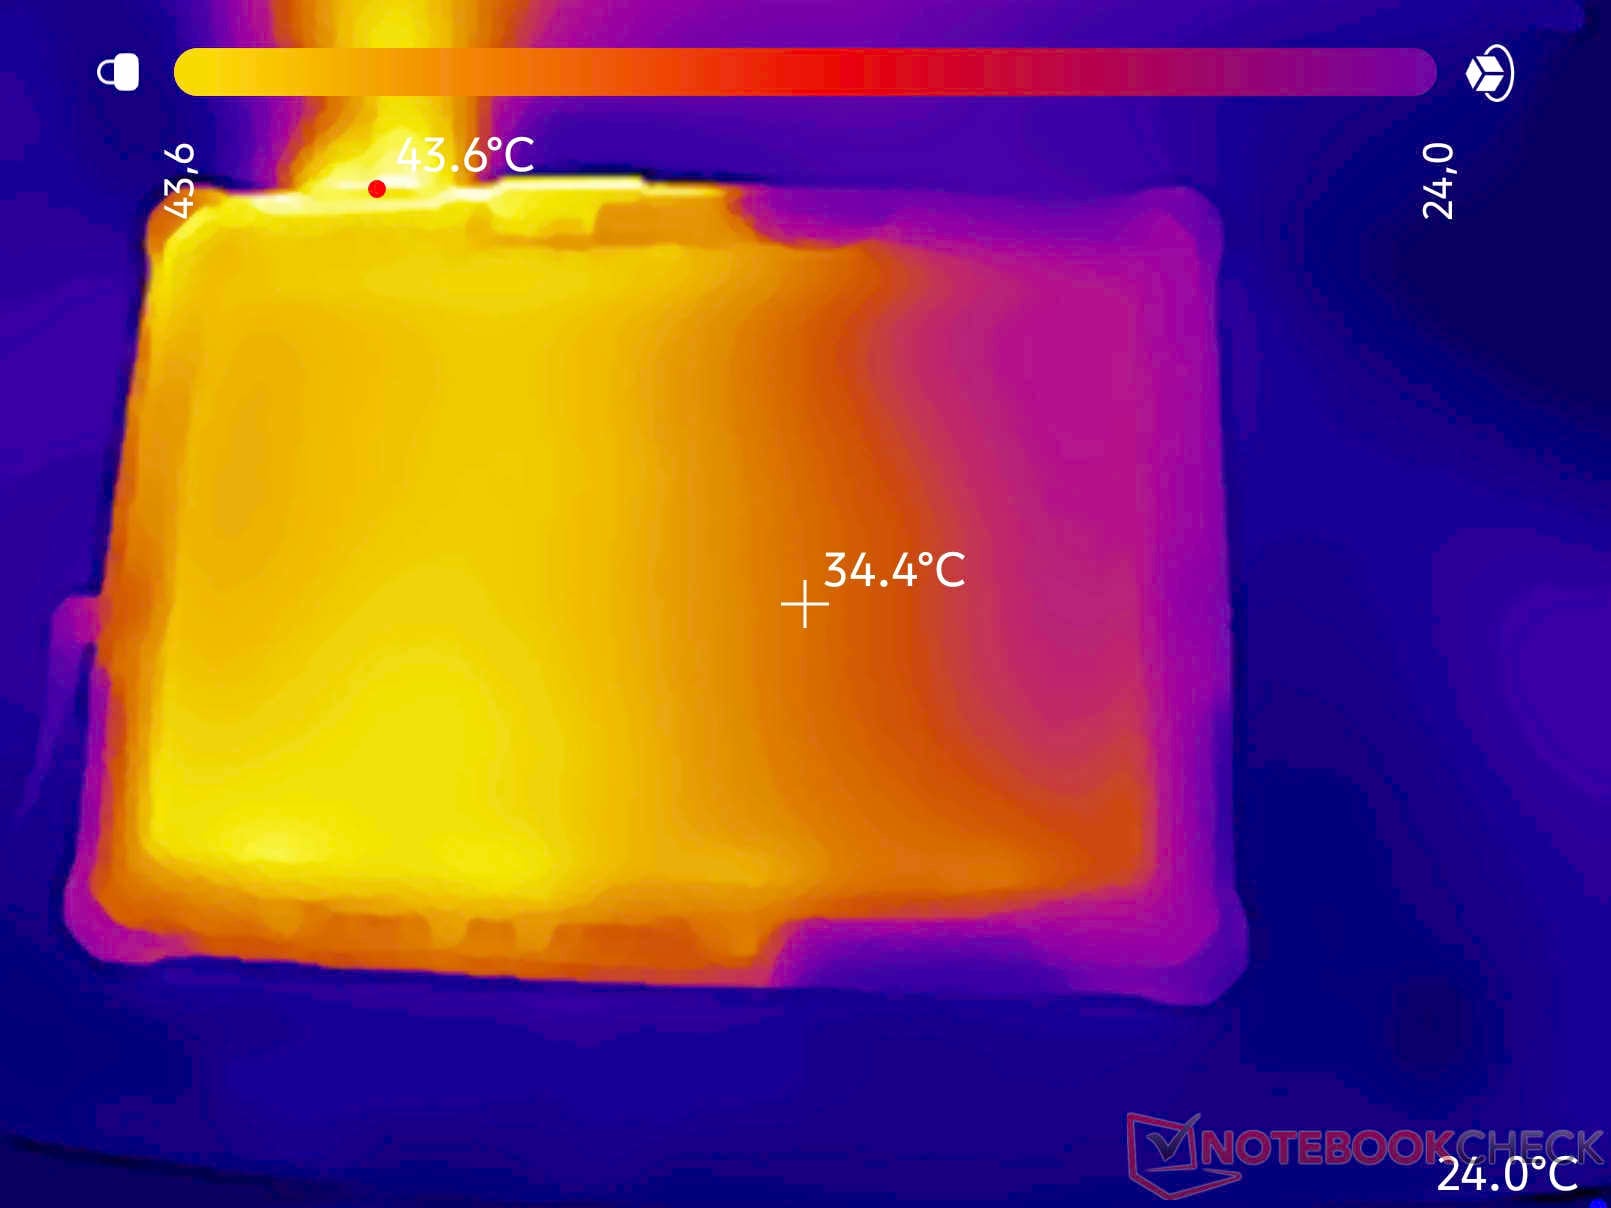
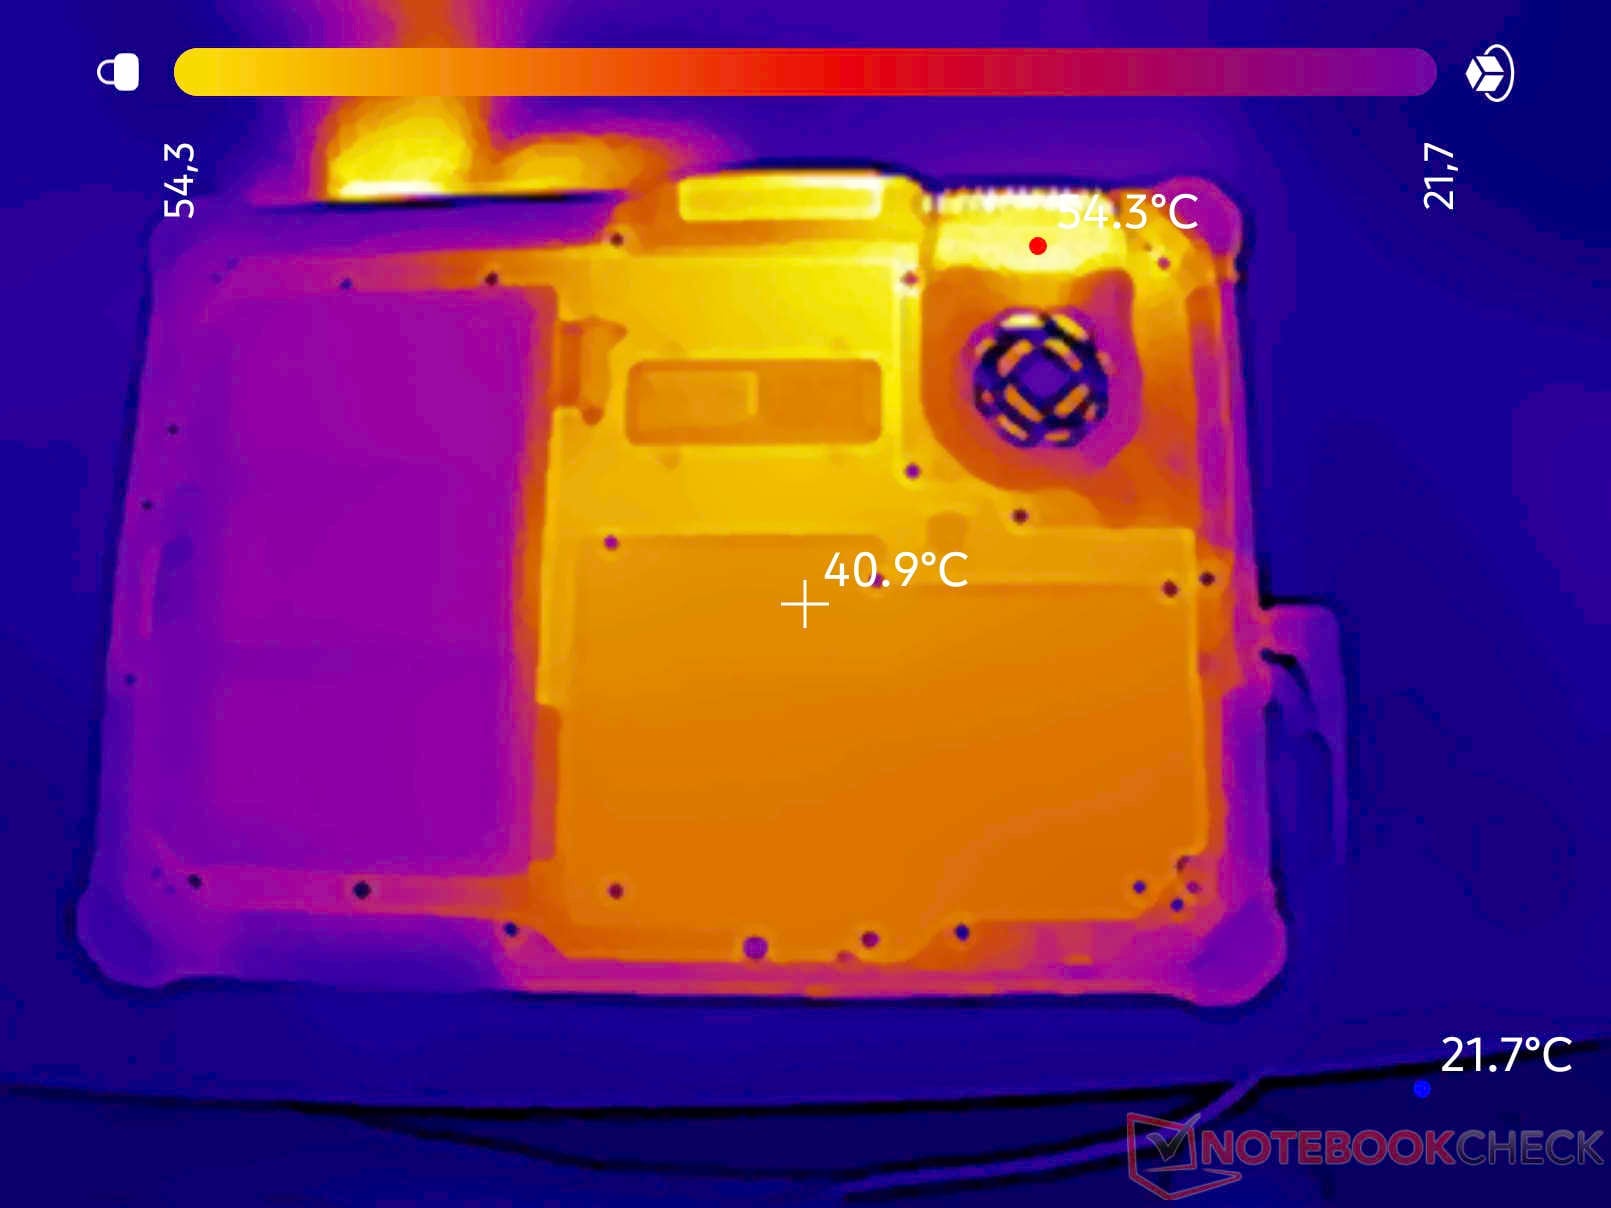
温度
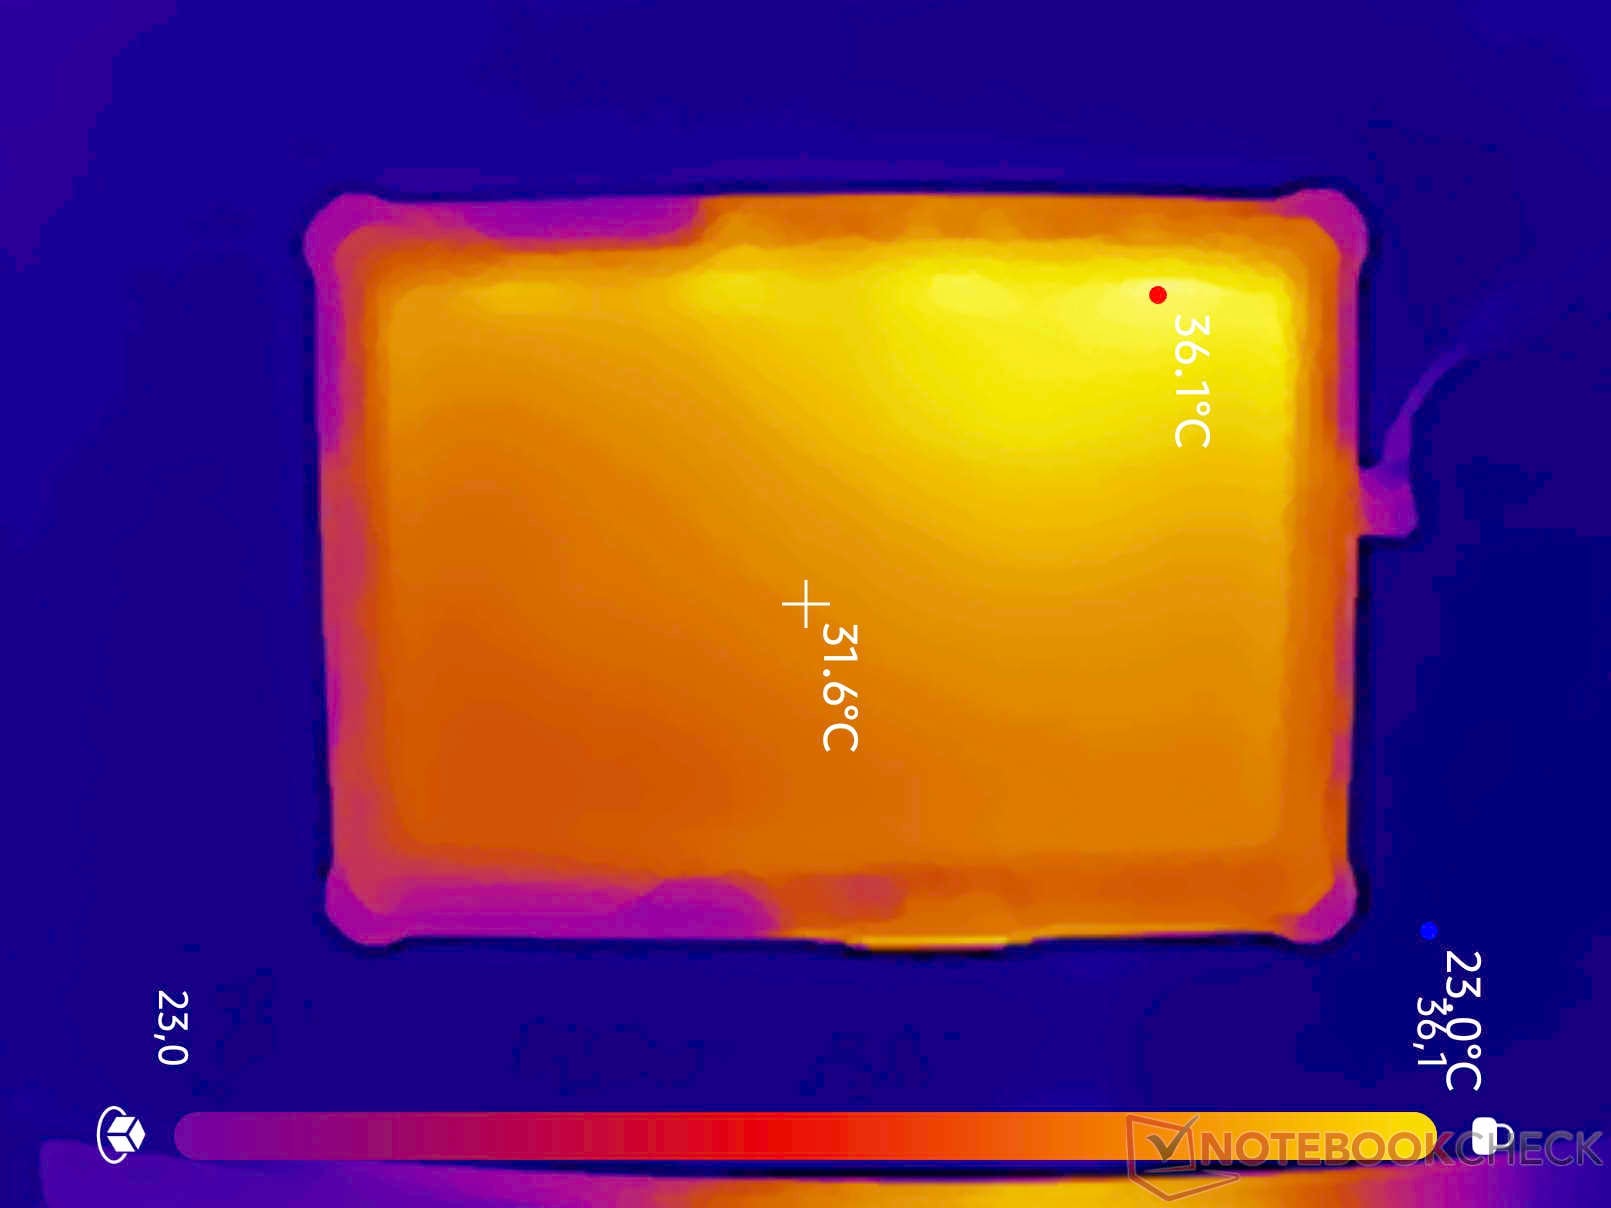
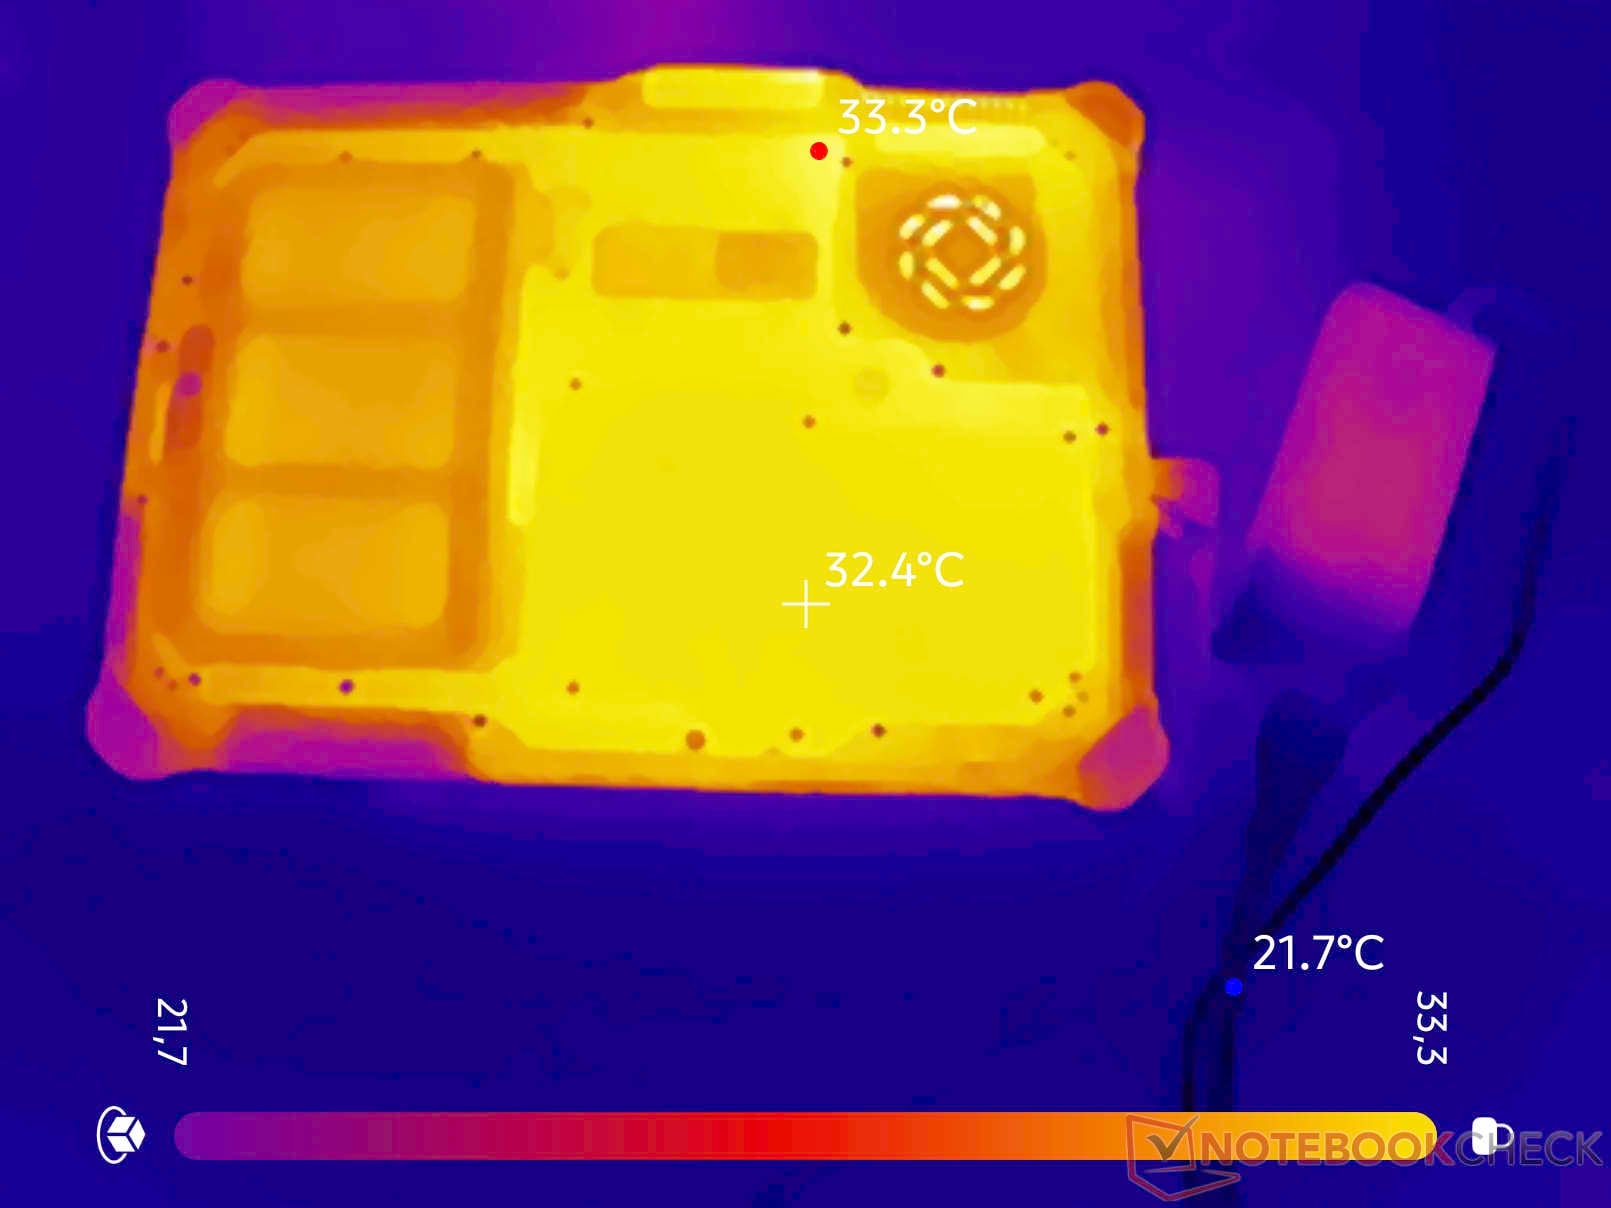
散热系统的表现非常出色。在压力测试中,平板电脑仅有少数几个部位的温度超过了40 °C(104 °F)。坚固的机身其余部分则保持在舒适的温度范围内。
(±) The maximum temperature on the upper side is 43.6 °C / 110 F, compared to the average of 33.6 °C / 92 F, ranging from 20.7 to 53.2 °C for the class Tablet.
(±) The bottom heats up to a maximum of 40 °C / 104 F, compared to the average of 33.2 °C / 92 F
(±) In idle usage, the average temperature for the upper side is 33.3 °C / 92 F, compared to the device average of 30 °C / 86 F.
| Durabook R10 Core Ultra 7 258V, Arc 140V | Dell Latitude 7030 Rugged Extreme i7-1260U, Iris Xe G7 96EUs | Lenovo ThinkPad T14 Gen 6 21QG001VGE Core Ultra 7 258V, Arc 140V | Dynabook Portege Z40L-N Core Ultra 7 258V, Arc 140V | Durabook R8 Tablet i5-1230U, Iris Xe G7 80EUs | Lenovo ThinkPad T14 Gen 6 AMD Ryzen AI 7 PRO 350, Radeon 860M | |
|---|---|---|---|---|---|---|
| Heat | 11% | 16% | -2% | -0% | -3% | |
| Maximum Upper Side * (°C) | 43.6 | 37.2 15% | 39.7 9% | 41.2 6% | 38.2 12% | 47.7 -9% |
| Maximum Bottom * (°C) | 40 | 43.4 -9% | 38.1 5% | 38 5% | 49.6 -24% | 49.5 -24% |
| Idle Upper Side * (°C) | 36.1 | 26.4 27% | 24.3 33% | 35.4 2% | 32.2 11% | 30.7 15% |
| Idle Bottom * (°C) | 33.3 | 29.6 11% | 27.7 17% | 39.8 -20% | 33.4 -0% | 31.6 5% |
* ... smaller is better
演讲者
该设备的音频性能较为一般。平板电脑背面的内置单声道扬声器最大音量可达54 dB(A),音质则相当平庸。不过,这在安静的环境中播放系统提示音时,至少是足够的。
Durabook R10 audio analysis
(-) | not very loud speakers (58.3 dB)
Bass 100 - 315 Hz
(-) | nearly no bass - on average 17.7% lower than median
(±) | linearity of bass is average (7.6% delta to prev. frequency)
Mids 400 - 2000 Hz
(+) | balanced mids - only 2.9% away from median
(±) | linearity of mids is average (13.7% delta to prev. frequency)
Highs 2 - 16 kHz
(+) | balanced highs - only 4.7% away from median
(±) | linearity of highs is average (10.2% delta to prev. frequency)
Overall 100 - 16.000 Hz
(-) | overall sound is not linear (31.3% difference to median)
Compared to same class
» 90% of all tested devices in this class were better, 3% similar, 7% worse
» The best had a delta of 7%, average was 20%, worst was 129%
Compared to all devices tested
» 90% of all tested devices were better, 2% similar, 8% worse
» The best had a delta of 4%, average was 24%, worst was 134%
Apple MacBook Pro 16 2021 M1 Pro audio analysis
(+) | speakers can play relatively loud (84.7 dB)
Bass 100 - 315 Hz
(+) | good bass - only 3.8% away from median
(+) | bass is linear (5.2% delta to prev. frequency)
Mids 400 - 2000 Hz
(+) | balanced mids - only 1.3% away from median
(+) | mids are linear (2.1% delta to prev. frequency)
Highs 2 - 16 kHz
(+) | balanced highs - only 1.9% away from median
(+) | highs are linear (2.7% delta to prev. frequency)
Overall 100 - 16.000 Hz
(+) | overall sound is linear (4.6% difference to median)
Compared to same class
» 0% of all tested devices in this class were better, 0% similar, 100% worse
» The best had a delta of 5%, average was 17%, worst was 45%
Compared to all devices tested
» 0% of all tested devices were better, 0% similar, 100% worse
» The best had a delta of 4%, average was 24%, worst was 134%
能耗与电池续航时间
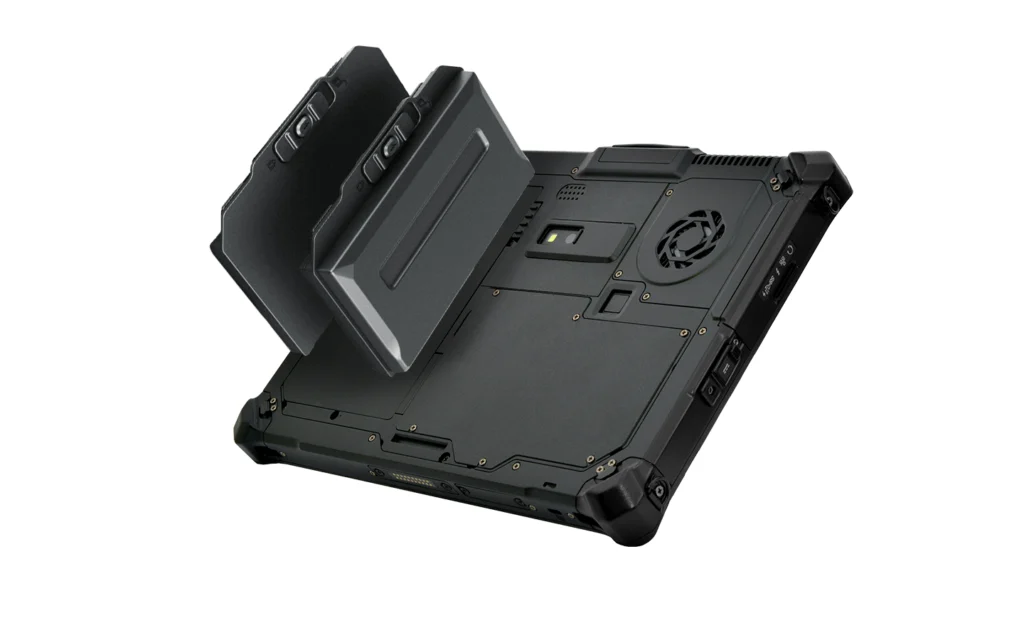
在我们的压力测试中,我们记录到的最大功耗为55瓦。目前为止,功耗最大的部分是极其明亮的显示屏,这给电池或电源适配器带来了相当大的负担。在远离电源插座的情况下,我们的测试显示,通过Wi-Fi连续浏览网页时,电池续航时间为八小时。 得益于热插拔功能,设备运行时即可更换电池。 Durabook 内部配备了一块小型备用电池,可提供略多于一分钟的电力,从而允许在无需关闭设备的情况下更换电池。为了实现更长时间的免充电或免更换电池使用,制造商还提供了一块高容量电池,不过该电池会明显凸出机身。
| Off / Standby | |
| Idle | |
| Load |
|
Key:
min: | |
能耗 《赛博朋克》/压力测试
连接外接显示器时的能耗
| Durabook R10 Core Ultra 7 258V, Arc 140V, 48 Wh | Dell Latitude 7030 Rugged Extreme i7-1260U, Iris Xe G7 96EUs, 36 Wh | Lenovo ThinkPad T14 Gen 6 21QG001VGE Core Ultra 7 258V, Arc 140V, 57 Wh | Dynabook Portege Z40L-N Core Ultra 7 258V, Arc 140V, 56 Wh | Durabook R8 Tablet i5-1230U, Iris Xe G7 80EUs, 27.4 Wh | Lenovo ThinkPad T14 Gen 6 AMD Ryzen AI 7 PRO 350, Radeon 860M, 57 Wh | Average of class Tablet | |
|---|---|---|---|---|---|---|---|
| Battery Runtime | |||||||
| WiFi Websurfing (h) | 8.4 | 6.1 -27% | 19.4 131% | 19.1 127% | 5.3 -37% | 13.8 64% | 15.8 ? 88% |
| Battery runtime | -27% | 131% | 127% | -37% | 64% | 88% | |
| WiFi v1.3 (h) | 8.4 | 6.1 -27% | 19.4 131% | 19.1 127% | 5.3 -37% | 13.8 64% | 15.8 ? 88% |
| Load (h) | 1.6 | 1.1 | 4.16 ? | ||||
| Total Average (Program / Settings) | -27% /
-27% | 131% /
131% | 127% /
127% | -37% /
-37% | 64% /
64% | 88% /
88% |
| Durabook R10 Core Ultra 7 258V, Arc 140V, 48 Wh | Dell Latitude 7030 Rugged Extreme i7-1260U, Iris Xe G7 96EUs, 36 Wh | Lenovo ThinkPad T14 Gen 6 21QG001VGE Core Ultra 7 258V, Arc 140V, 57 Wh | Dynabook Portege Z40L-N Core Ultra 7 258V, Arc 140V, 56 Wh | Durabook R8 Tablet i5-1230U, Iris Xe G7 80EUs, 27.4 Wh | Lenovo ThinkPad T14 Gen 6 AMD Ryzen AI 7 PRO 350, Radeon 860M, 57 Wh | Average of class Tablet | |
|---|---|---|---|---|---|---|---|
| Battery runtime | -27% | 131% | 127% | -37% | 64% | 88% | |
| WiFi v1.3 (h) | 8.4 | 6.1 -27% | 19.4 131% | 19.1 127% | 5.3 -37% | 13.8 64% | 15.8 ? 88% |
| Load (h) | 1.6 | 1.1 | 4.16 ? |
Notebookcheck 综合评分
Durabook R10 是一款专为极端工作环境设计的真正“重量级”产品。其通过军用标准认证、亮度出色的显示屏以及无缝供电功能都令人印象深刻。不过,低于平均水平的 CPU 性能、较高的延迟以及略带绿光的屏幕,意味着用户需要做出一些妥协。
Durabook R10
- 06/18/2026 v8
Marc Herter
 Total Sustainability Score:
 各种可行方案的比较
Image | Model / Review | Price | Weight | Height | Display |
|---|---|---|---|---|---|
1. 76.5%  | Durabook R10 Intel Core Ultra 7 258V ⎘ Intel Arc Graphics 140V ⎘ 32 GB Memory | Amazon: 1. $14.99 ZBAGUG for Durabook R10 Tabl... 2. $17.99 ZBAGUG 2-Pack for Durabook R... | 1.3 kg | 29 mm | 10.10" 1920x1200 224 PPI TFT |
2. 82.3% 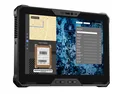 | Dell Latitude 7030 Rugged Extreme Intel Core i7-1260U ⎘ Intel Iris Xe Graphics G7 96EUs ⎘ 32 GB Memory, 1024 GB SSD | Amazon: 1. $2,049.00 Dell Latitude Rugged Extreme... 2. $2,199.00 Dell Latitude 7330 Rugged Ex... 3. $1,850.00 Dell Latitude Rugged Extreme... List Price: 3000 USD | 1.1 kg | 25.4 mm | 10.00" 1920x1200 226 PPI IPS |
3. 79.6% v7 (old)  | Durabook R8 Tablet Intel Core i5-1230U ⎘ Intel Iris Xe Graphics G7 80EUs ⎘ 8 GB Memory, 128 GB SSD | Amazon: 1. $38.99 PowerHOOD DC19V AC Power Ada... 2. $39.95 BoxWave Screen Protector Com... 3. $39.95 BoxWave Screen Protector Com... | 856 g | 20.6 mm | 8.00" 1280x800 189 PPI IPS |
Transparency
The selection of devices to be reviewed is made by our editorial team. The test sample was provided to the author as a loan by the manufacturer or retailer for the purpose of this review. The lender had no influence on this review, nor did the manufacturer receive a copy of this review before publication. There was no obligation to publish this review. As an independent media company, Notebookcheck is not subjected to the authority of manufacturers, retailers or publishers.
This is how Notebookcheck is testing
Every year, Notebookcheck independently reviews hundreds of laptops and smartphones using standardized procedures to ensure that all results are comparable. We have continuously developed our test methods for around 20 years and set industry standards in the process. In our test labs, high-quality measuring equipment is utilized by experienced technicians and editors. These tests involve a multi-stage validation process. Our complex rating system is based on hundreds of well-founded measurements and benchmarks, which maintains objectivity. Further information on our test methods can be found here.
