华硕 ZenBook UX310UA (7500U, 全高清) 笔记本电脑简短评测


| SD Card Reader | |
| average JPG Copy Test (av. of 3 runs) | |
| Dell XPS 13 9360 FHD i5 | |
| Asus Zenbook UX310UQ-GL011T | |
| Asus UX310UQ-FC396T | |
| Asus Zenbook UX3410UA | |
| Asus Zenbook UX310UA-FC347T iGP | |
| maximum AS SSD Seq Read Test (1GB) | |
| Dell XPS 13 9360 FHD i5 | |
| Asus Zenbook UX310UQ-GL011T | |
| Asus Zenbook UX3410UA | |
| Asus UX310UQ-FC396T | |
| Asus Zenbook UX310UA-FC347T iGP | |
| Networking | |
| iperf3 transmit AX12 | |
| Asus Zenbook UX310UA-FC347T iGP (jseb) | |
| Asus UX310UQ-FC396T (jseb) | |
| Dell XPS 13 9360 FHD i5 | |
| Asus Zenbook UX3410UA | |
| iperf3 receive AX12 | |
| Dell XPS 13 9360 FHD i5 | |
| Asus UX310UQ-FC396T (jseb) | |
| Asus Zenbook UX310UA-FC347T iGP (jseb) | |
| Asus Zenbook UX3410UA | |
| |||||||||||||||||||||||||
Brightness Distribution: 87 %
Center on Battery: 362 cd/m²
Contrast: 1377:1 (Black: 0.26 cd/m²)
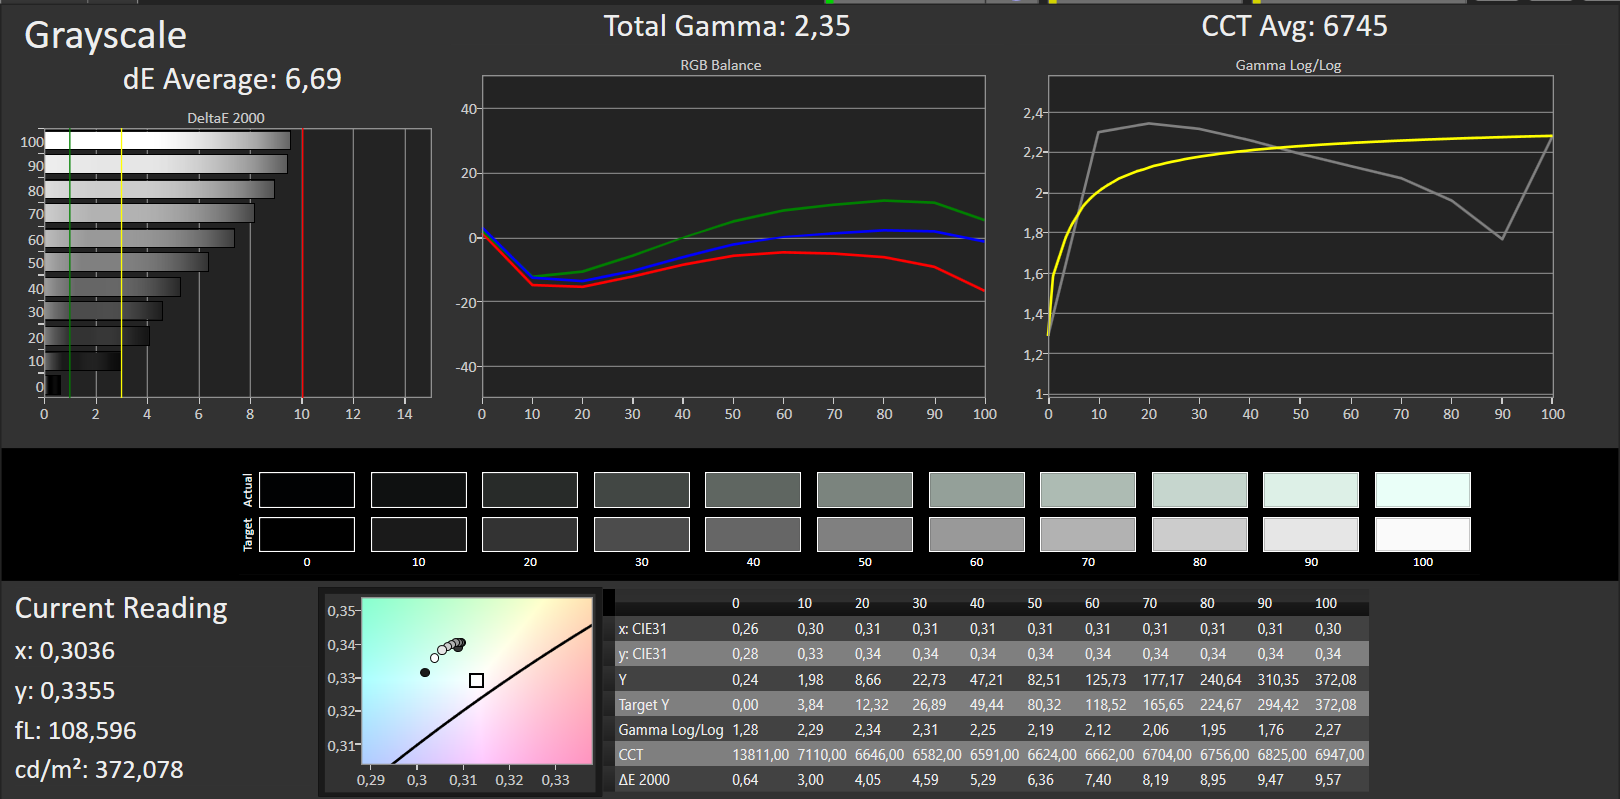
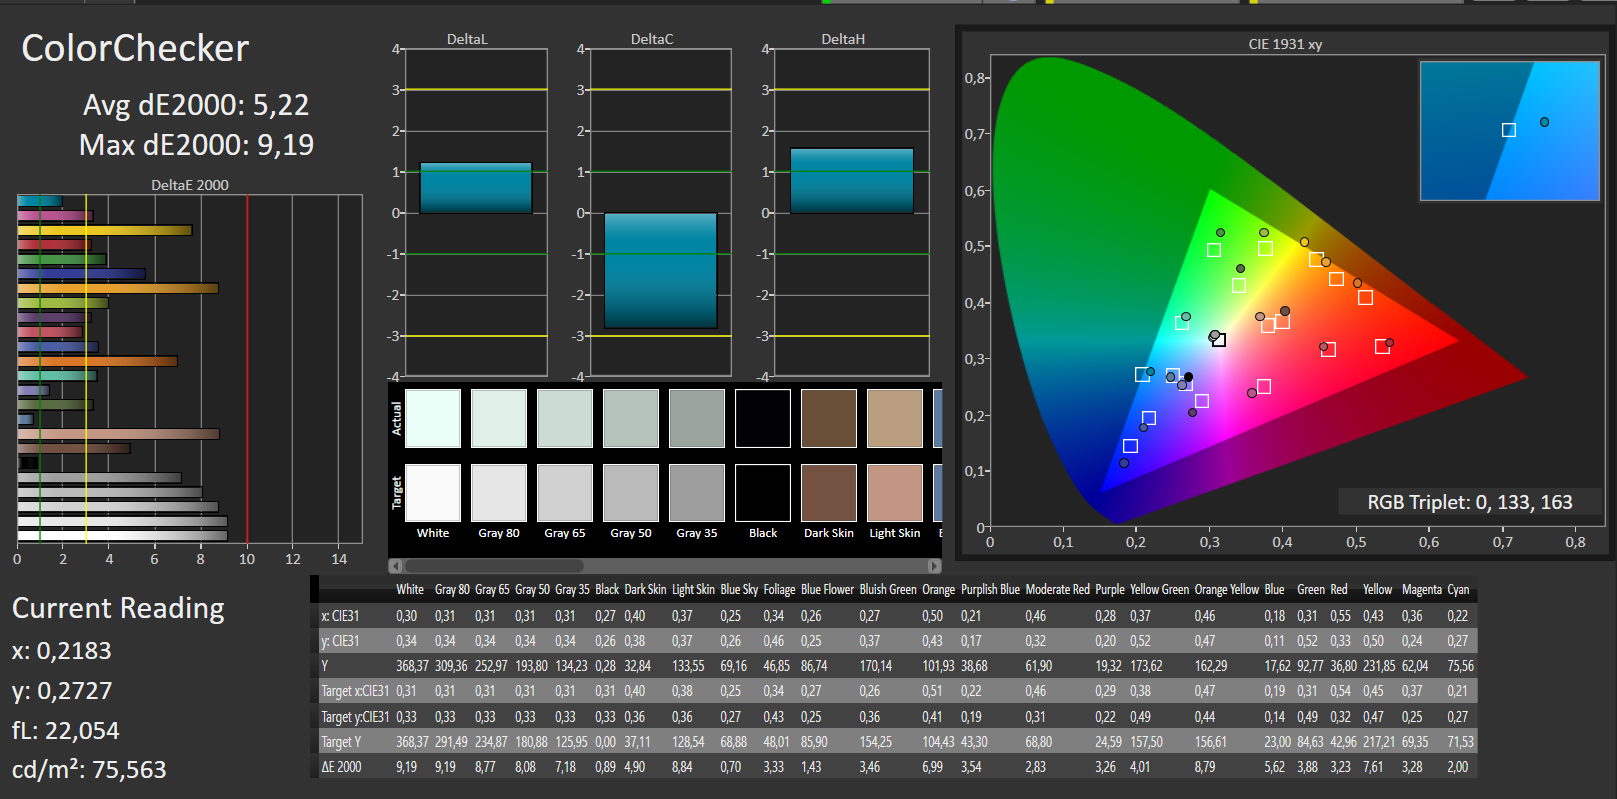
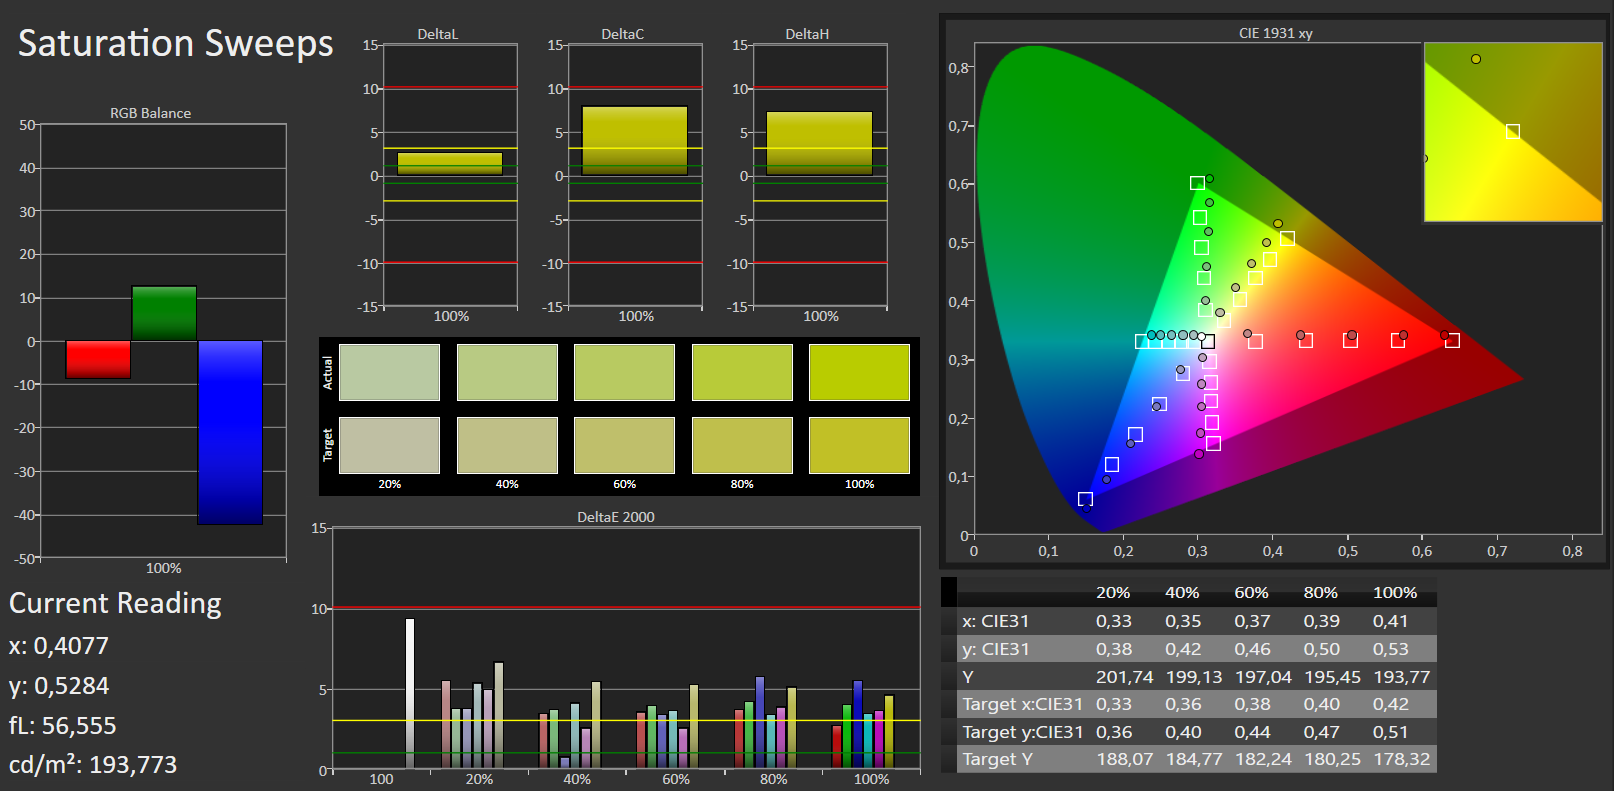
ΔE ColorChecker Calman: 5.22 | ∀{0.5-29.43 Ø4.71}
ΔE Greyscale Calman: 6.69 | ∀{0.09-98 Ø4.96}
91% sRGB (Argyll 1.6.3 3D)
59% AdobeRGB 1998 (Argyll 1.6.3 3D)
65.3% AdobeRGB 1998 (Argyll 3D)
65.3% sRGB (Argyll 3D)
64.2% Display P3 (Argyll 3D)
Gamma: 2.35
CCT: 6745 K
| Asus Zenbook UX310UA-FC347T iGP AU Optronics AUO272D, 1920x1080, 13.3" | Asus Zenbook UX310UQ-GL011T AU Optronics AUO142D, 1920x1080, 13.3" | Asus UX310UQ-FC396T AU Optronics AUO272D, 1920x1080, 13.3" | Asus Zenbook UX3410UA ChiMei N140HCE-EN1, 1920x1080, 14" | Acer Swift 7 SF713-51 Chimei Innolux, N133HCE-GP1, 1920x1080, 13.3" | Dell XPS 13 9360 FHD i5 Sharp SHP1449 LQ133M1, 1920x1080, 13.3" | |
|---|---|---|---|---|---|---|
| Display | 9% | 14% | 21% | 12% | -12% | |
| Display P3 Coverage (%) | 64.2 | 61.9 -4% | 64.1 0% | 67.7 5% | 64.6 1% | 48.94 -24% |
| sRGB Coverage (%) | 65.3 | 88.3 35% | 92.2 41% | 99.1 52% | 89.1 36% | 73.3 12% |
| AdobeRGB 1998 Coverage (%) | 65.3 | 63 -4% | 65.3 0% | 69.4 6% | 64.8 -1% | 50.5 -23% |
| Response Times | -4% | 14% | -19% | -1% | -17% | |
| Response Time Grey 50% / Grey 80% * (ms) | 40 ? | 39 ? 2% | 31 ? 22% | 33 ? 17% | 31 ? 22% | 32.8 ? 18% |
| Response Time Black / White * (ms) | 22 ? | 24 ? -9% | 21 ? 5% | 34 ? -55% | 27 ? -23% | 33.2 ? -51% |
| PWM Frequency (Hz) | 200 ? | 50 ? | 192 ? | |||
| Screen | -15% | 1% | 8% | 4% | -2% | |
| Brightness middle (cd/m²) | 358 | 247 -31% | 362 1% | 376 5% | 359 0% | 351.2 -2% |
| Brightness (cd/m²) | 347 | 240 -31% | 343 -1% | 355 2% | 344 -1% | 325 -6% |
| Brightness Distribution (%) | 87 | 90 3% | 92 6% | 87 0% | 92 6% | 89 2% |
| Black Level * (cd/m²) | 0.26 | 0.43 -65% | 0.28 -8% | 0.32 -23% | 0.25 4% | 0.195 25% |
| Contrast (:1) | 1377 | 574 -58% | 1293 -6% | 1175 -15% | 1436 4% | 1801 31% |
| Colorchecker dE 2000 * | 5.22 | 4.74 9% | 5.08 3% | 3.2 39% | 4.57 12% | 7.4 -42% |
| Colorchecker dE 2000 max. * | 9.19 | 9.14 1% | 8.95 3% | 7.1 23% | 9.25 -1% | 9.08 1% |
| Greyscale dE 2000 * | 6.69 | 4.87 27% | 6.21 7% | 4.4 34% | 5.2 22% | 6.71 -0% |
| Gamma | 2.35 94% | 2.57 86% | 2.4 92% | 2.12 104% | 2.47 89% | 2.74 80% |
| CCT | 6745 96% | 7450 87% | 6817 95% | 7440 87% | 6887 94% | 7222 90% |
| Color Space (Percent of AdobeRGB 1998) (%) | 59 | 57 -3% | 60 2% | 63.78 8% | 58 -2% | 50.48 -14% |
| Color Space (Percent of sRGB) (%) | 91 | 88 -3% | 92 1% | 98.98 9% | 89 -2% | 73.31 -19% |
| Total Average (Program / Settings) | -3% /
-9% | 10% /
5% | 3% /
7% | 5% /
5% | -10% /
-6% |
* ... smaller is better
Display Response Times
| ↔ Response Time Black to White | ||
|---|---|---|
| 22 ms ... rise ↗ and fall ↘ combined | ↗ 5 ms rise | 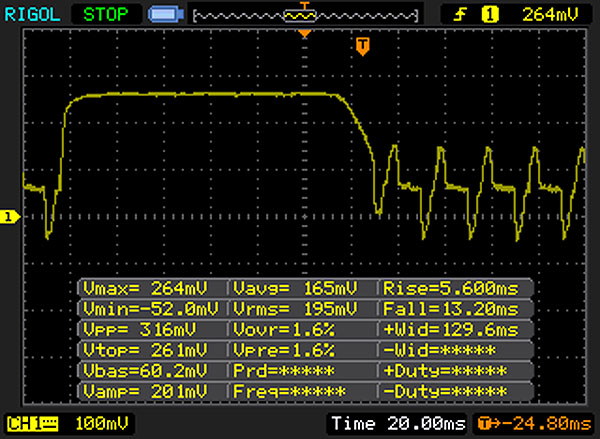 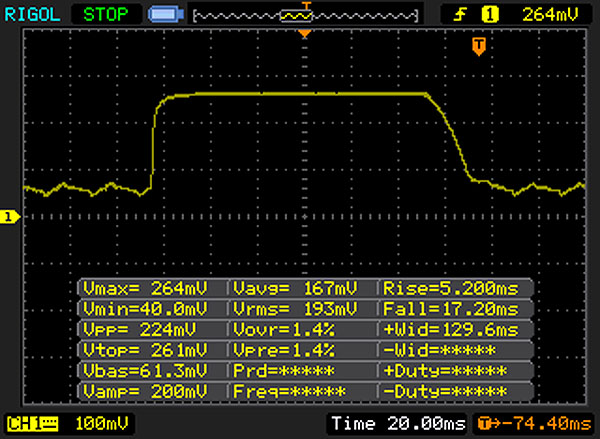 |
| ↘ 17 ms fall | ||
| The screen shows good response rates in our tests, but may be too slow for competitive gamers. In comparison, all tested devices range from 0.1 (minimum) to 240 (maximum) ms. » 49 % of all devices are better. This means that the measured response time is worse than the average of all tested devices (19.8 ms). | ||
| ↔ Response Time 50% Grey to 80% Grey | ||
| 40 ms ... rise ↗ and fall ↘ combined | ↗ 12 ms rise | 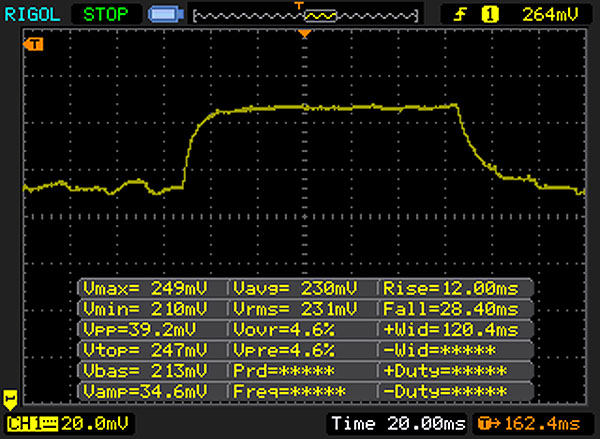 |
| ↘ 28 ms fall | ||
| The screen shows slow response rates in our tests and will be unsatisfactory for gamers. In comparison, all tested devices range from 0.165 (minimum) to 636 (maximum) ms. » 61 % of all devices are better. This means that the measured response time is worse than the average of all tested devices (31 ms). | ||
Screen Flickering / PWM (Pulse-Width Modulation)
| Screen flickering / PWM detected | 200 Hz | ≤ 20 % brightness setting | 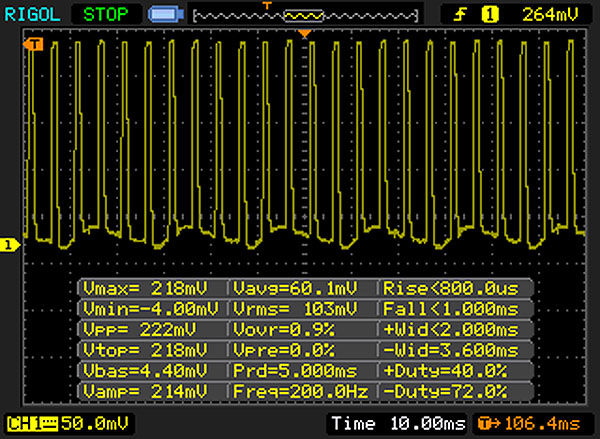 |
The display backlight flickers at 200 Hz (worst case, e.g., utilizing PWM) Flickering detected at a brightness setting of 20 % and below. There should be no flickering or PWM above this brightness setting. The frequency of 200 Hz is relatively low, so sensitive users will likely notice flickering and experience eyestrain at the stated brightness setting and below. In comparison: 52 % of all tested devices do not use PWM to dim the display. If PWM was detected, an average of 7754 (minimum: 5 - maximum: 343500) Hz was measured. | |||
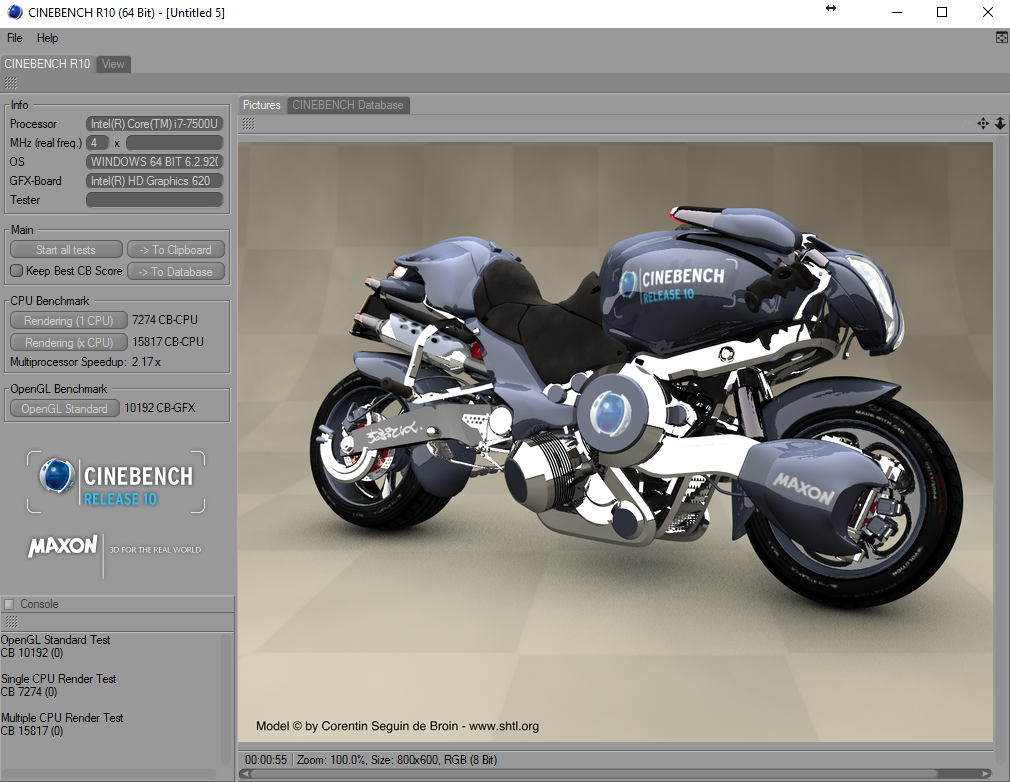
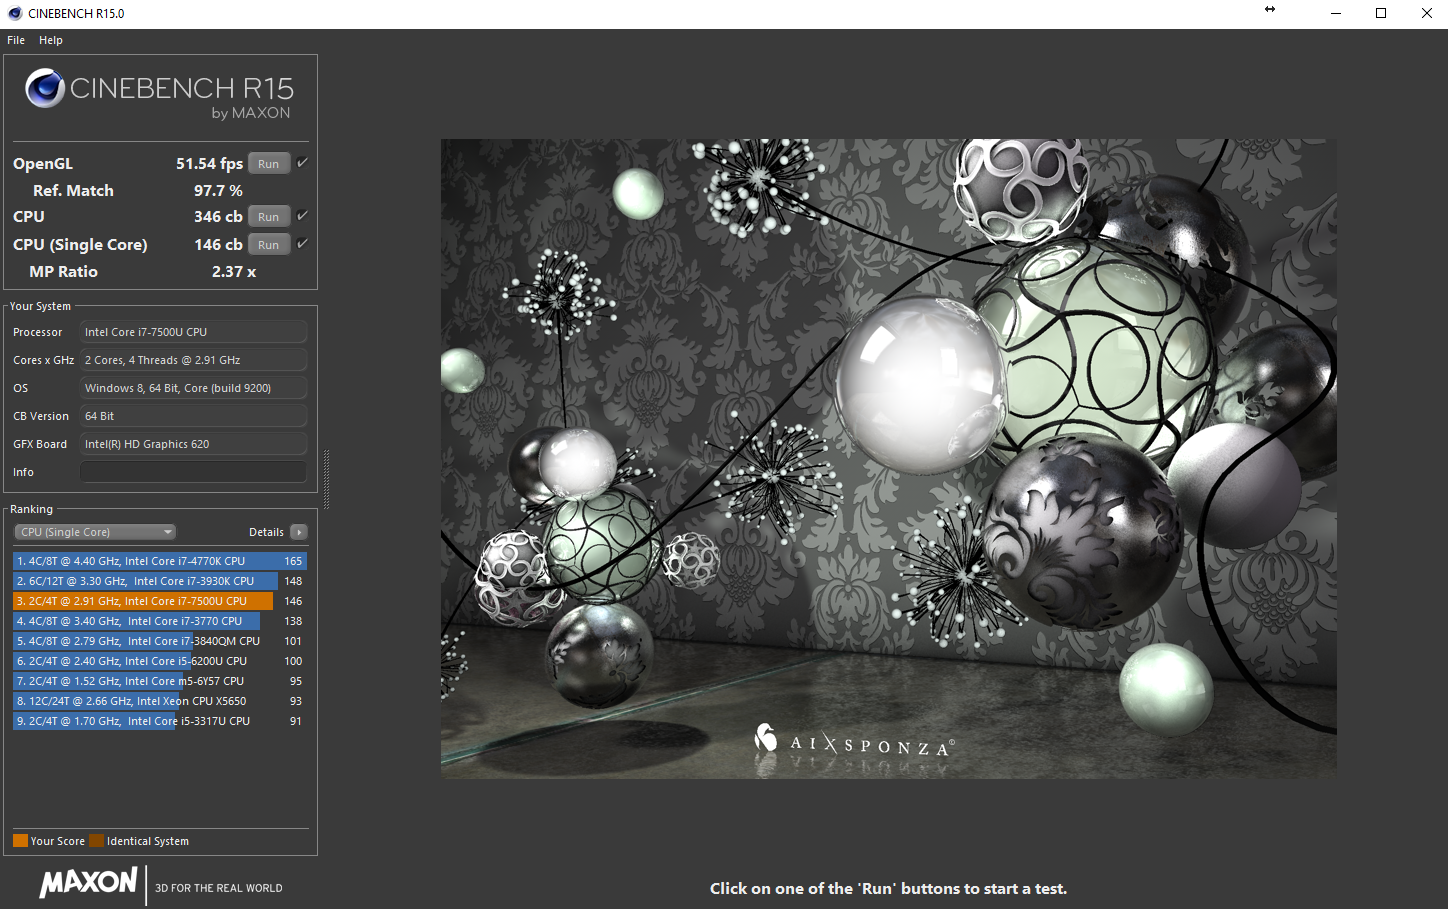
| Cinebench R10 | |
| Rendering Single CPUs 64Bit | |
| Asus UX310UQ-FC396T | |
| Asus Zenbook UX310UA-FC347T iGP | |
| Asus Zenbook UX310UQ-GL011T | |
| Acer Swift 7 SF713-51 | |
| Rendering Multiple CPUs 64Bit | |
| Asus Zenbook UX310UA-FC347T iGP | |
| Asus UX310UQ-FC396T | |
| Asus Zenbook UX310UQ-GL011T | |
| Acer Swift 7 SF713-51 | |
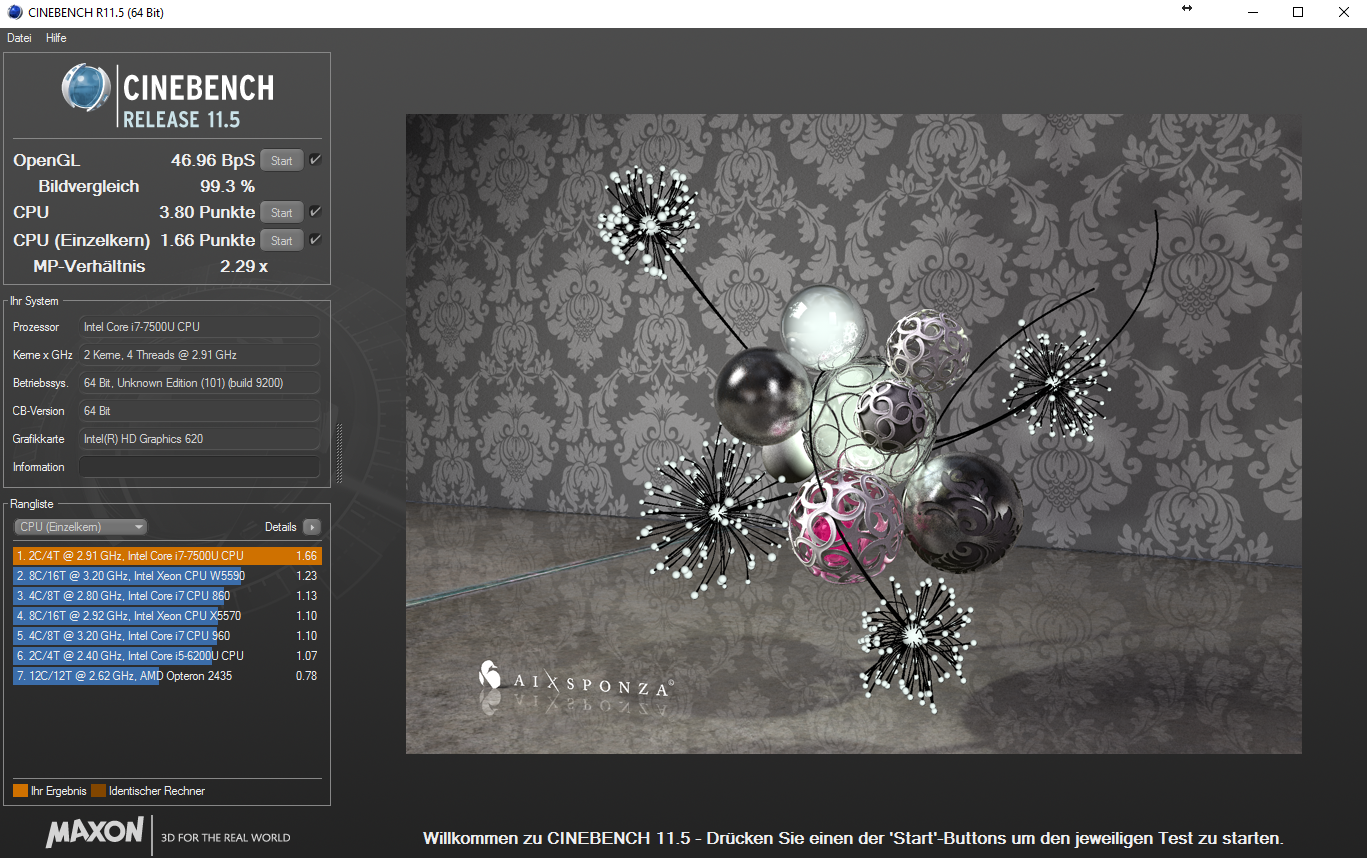
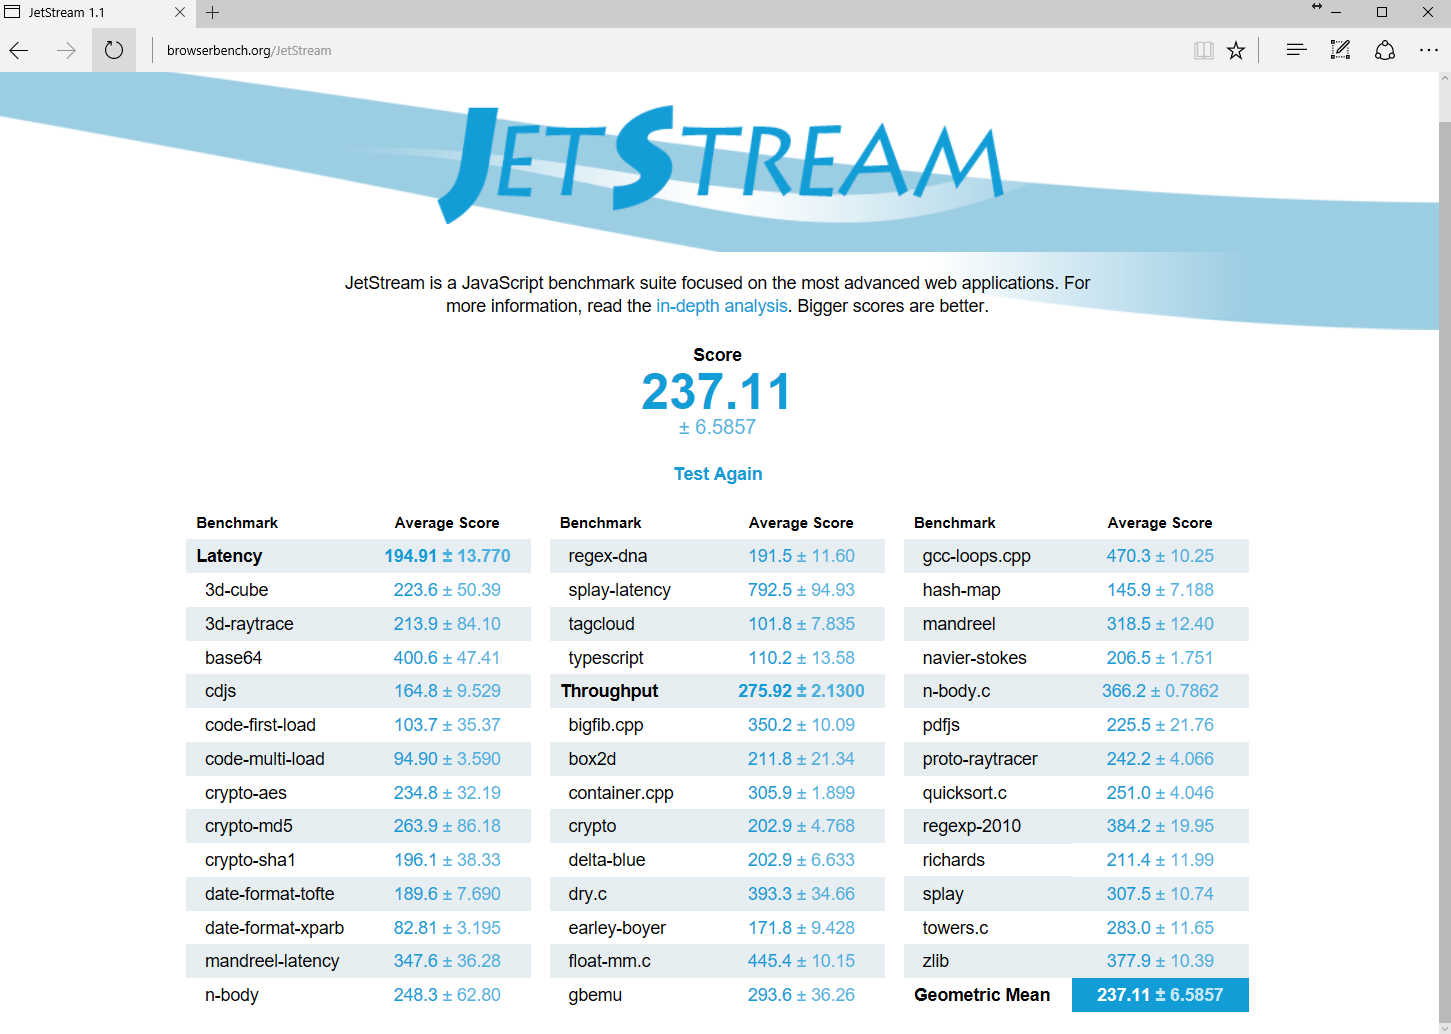
| JetStream 1.1 - 1.1 Total | |
| Asus UX310UQ-FC396T | |
| Asus Zenbook UX310UA-FC347T iGP | |
| Asus Zenbook UX310UQ-GL011T | |
| Asus Zenbook UX3410UA | |
| Acer Swift 7 SF713-51 | |
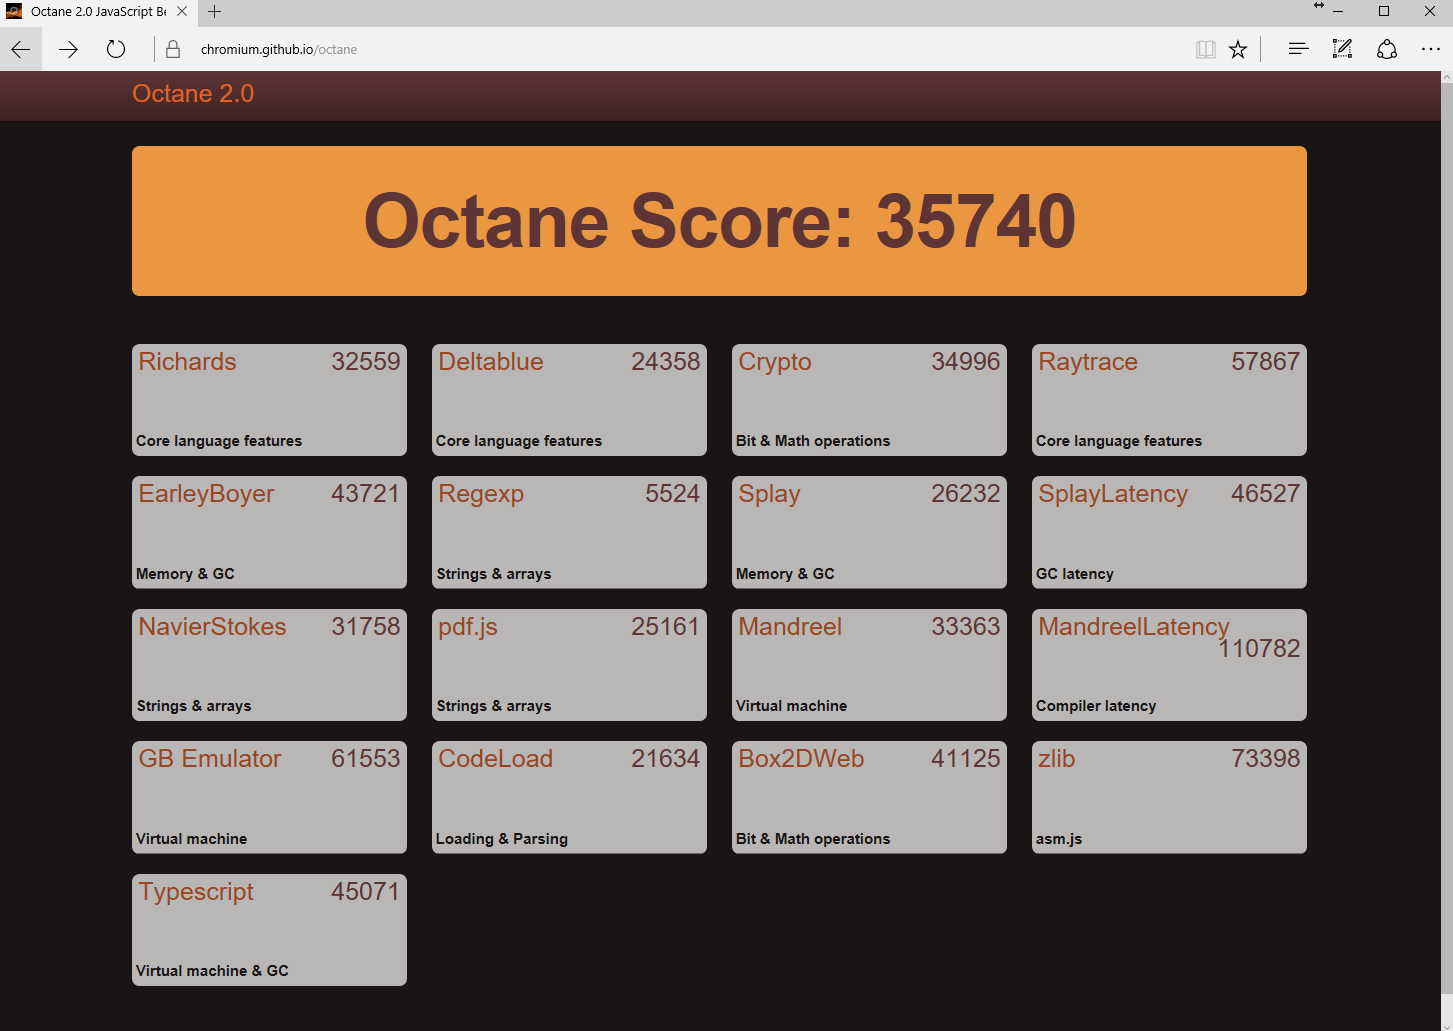
| Octane V2 - Total Score | |
| Asus UX310UQ-FC396T | |
| Asus Zenbook UX310UA-FC347T iGP | |
| Dell XPS 13 9360 FHD i5 | |
| Asus Zenbook UX3410UA | |
| Asus Zenbook UX310UQ-GL011T | |
| Acer Swift 7 SF713-51 | |
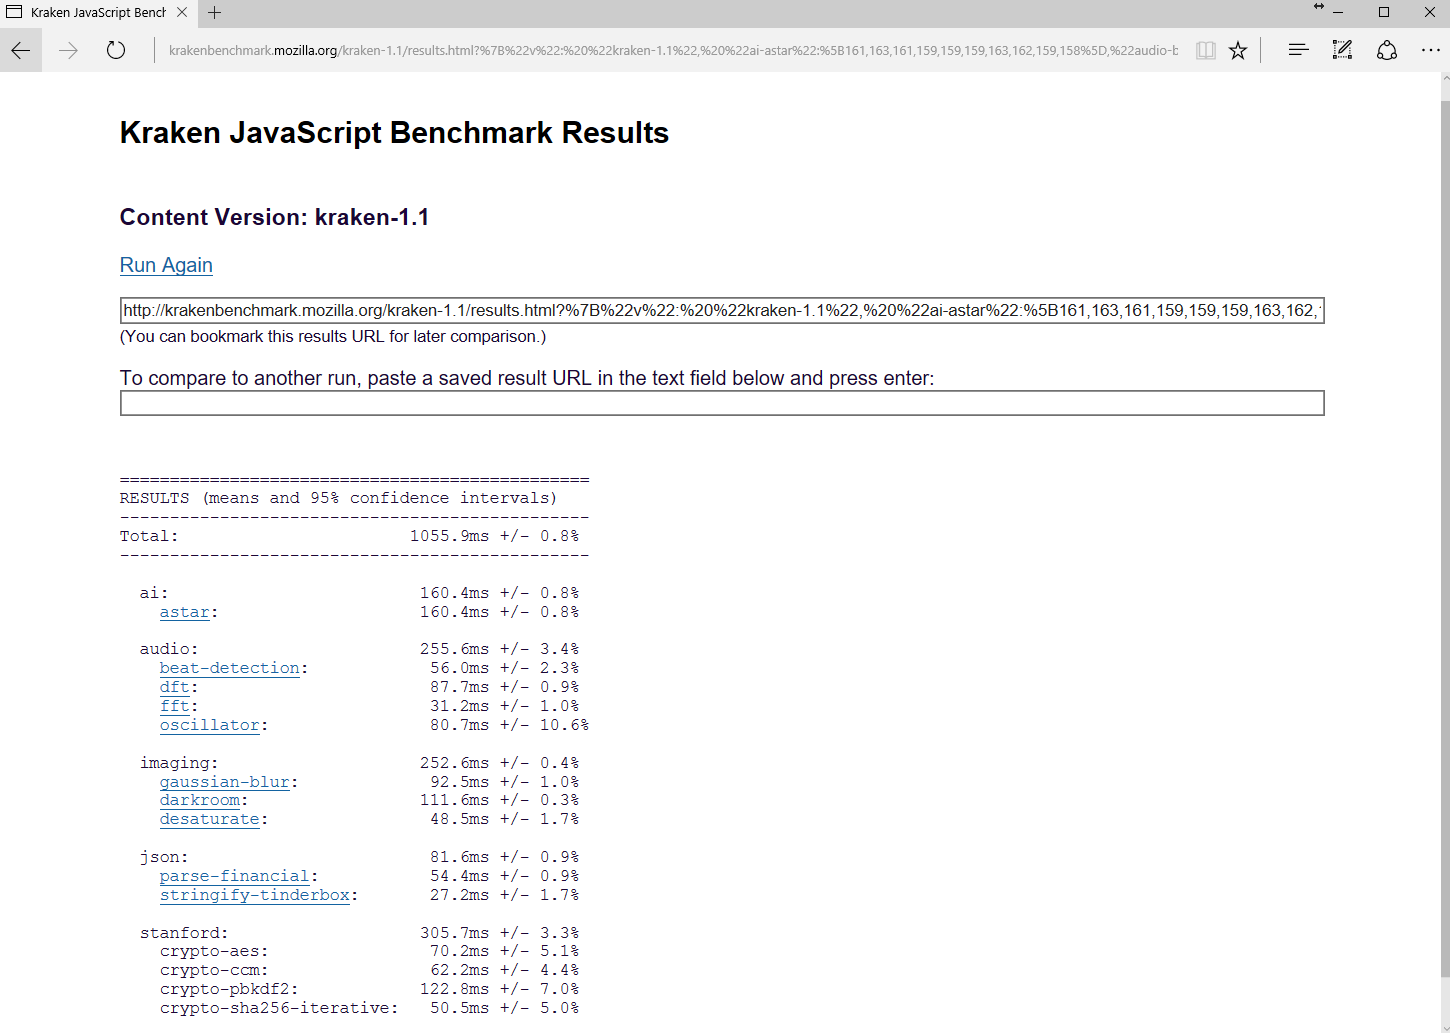
| Mozilla Kraken 1.1 - Total | |
| Acer Swift 7 SF713-51 | |
| Asus Zenbook UX310UQ-GL011T | |
| Asus Zenbook UX3410UA | |
| Asus Zenbook UX310UA-FC347T iGP | |
| Asus UX310UQ-FC396T | |
* ... smaller is better
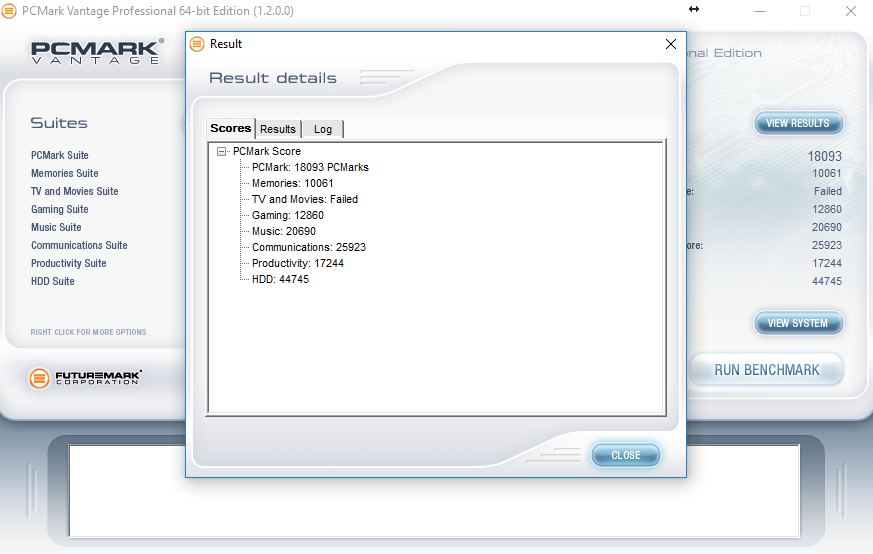
| PCMark Vantage Result | 18093 points | |
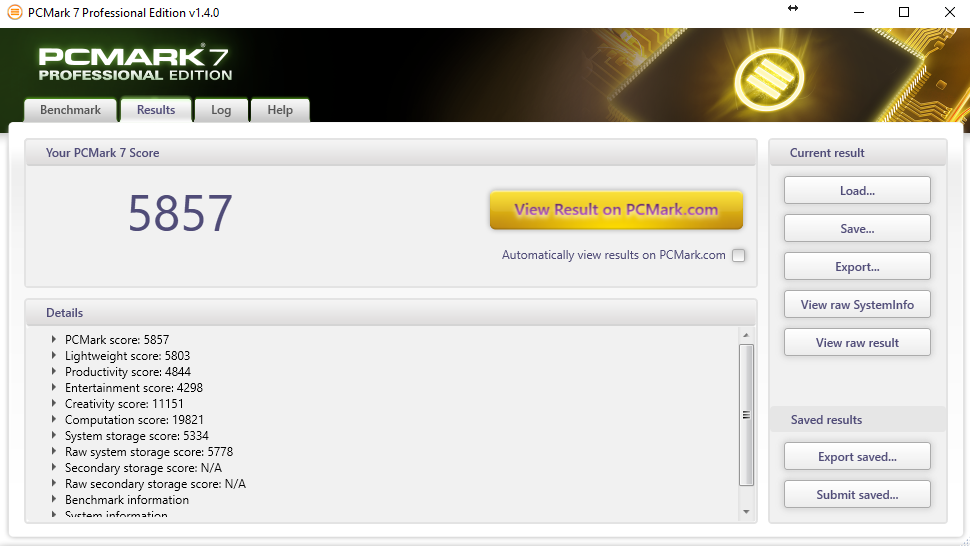
| PCMark 7 Score | 5857 points | |
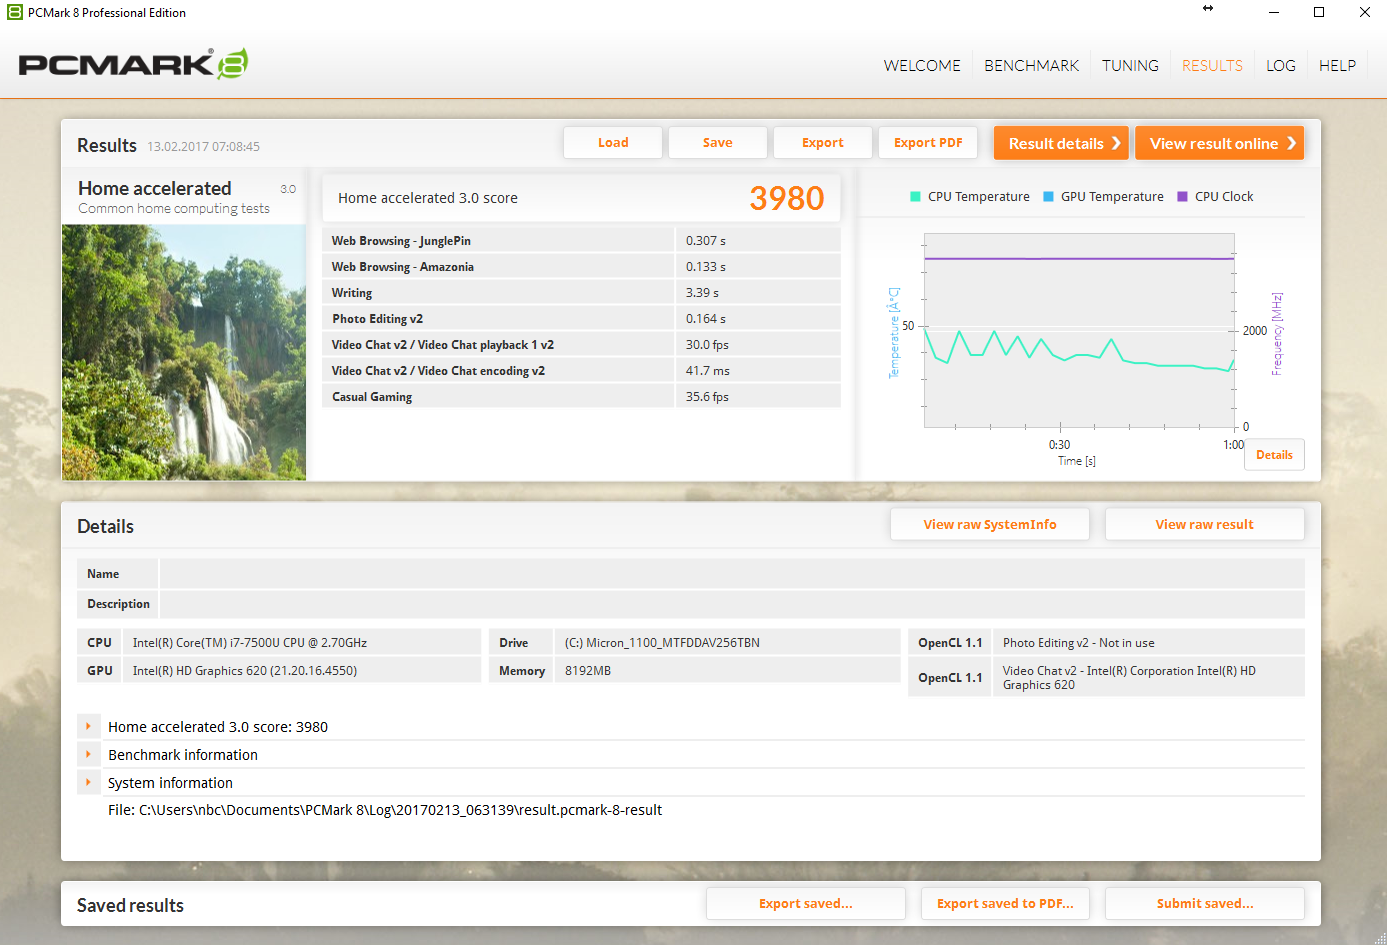
| PCMark 8 Home Score Accelerated v2 | 3980 points | |
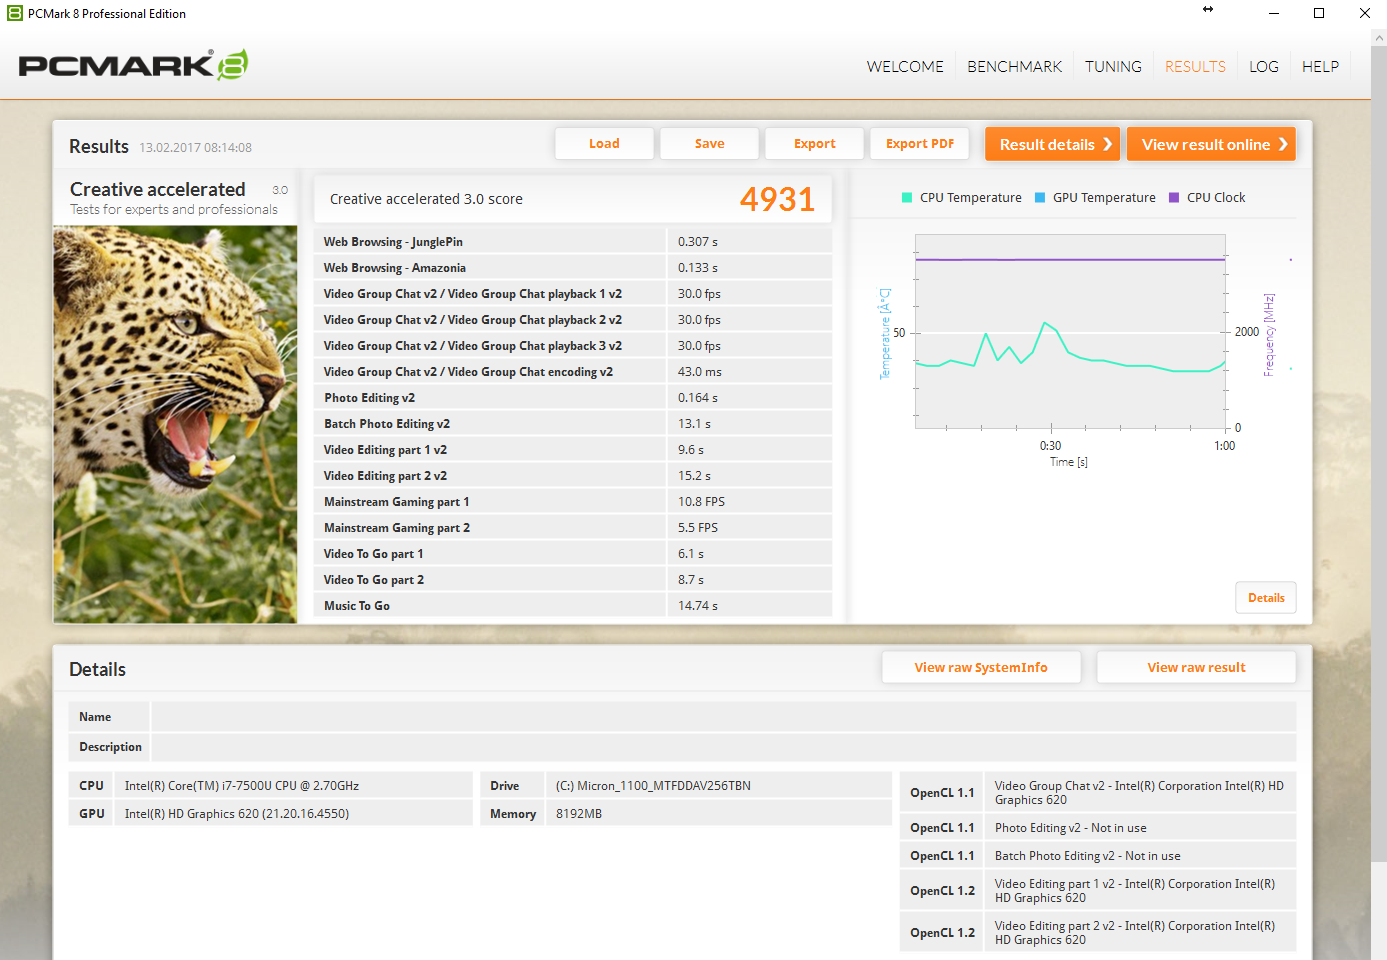
| PCMark 8 Creative Score Accelerated v2 | 4931 points | |
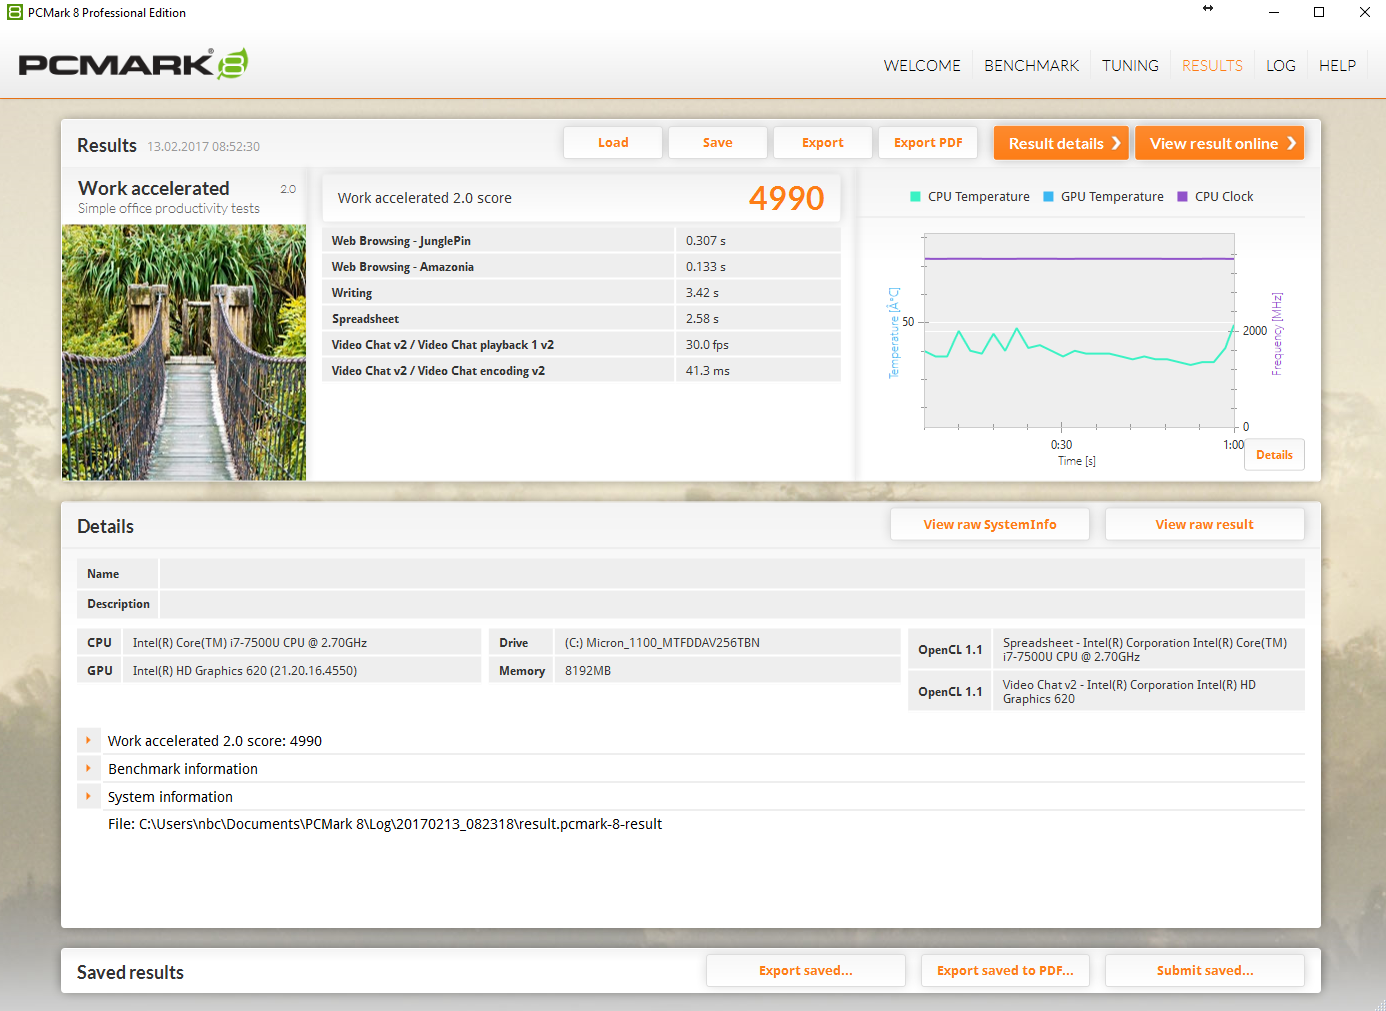
| PCMark 8 Work Score Accelerated v2 | 4990 points | |
Help | ||
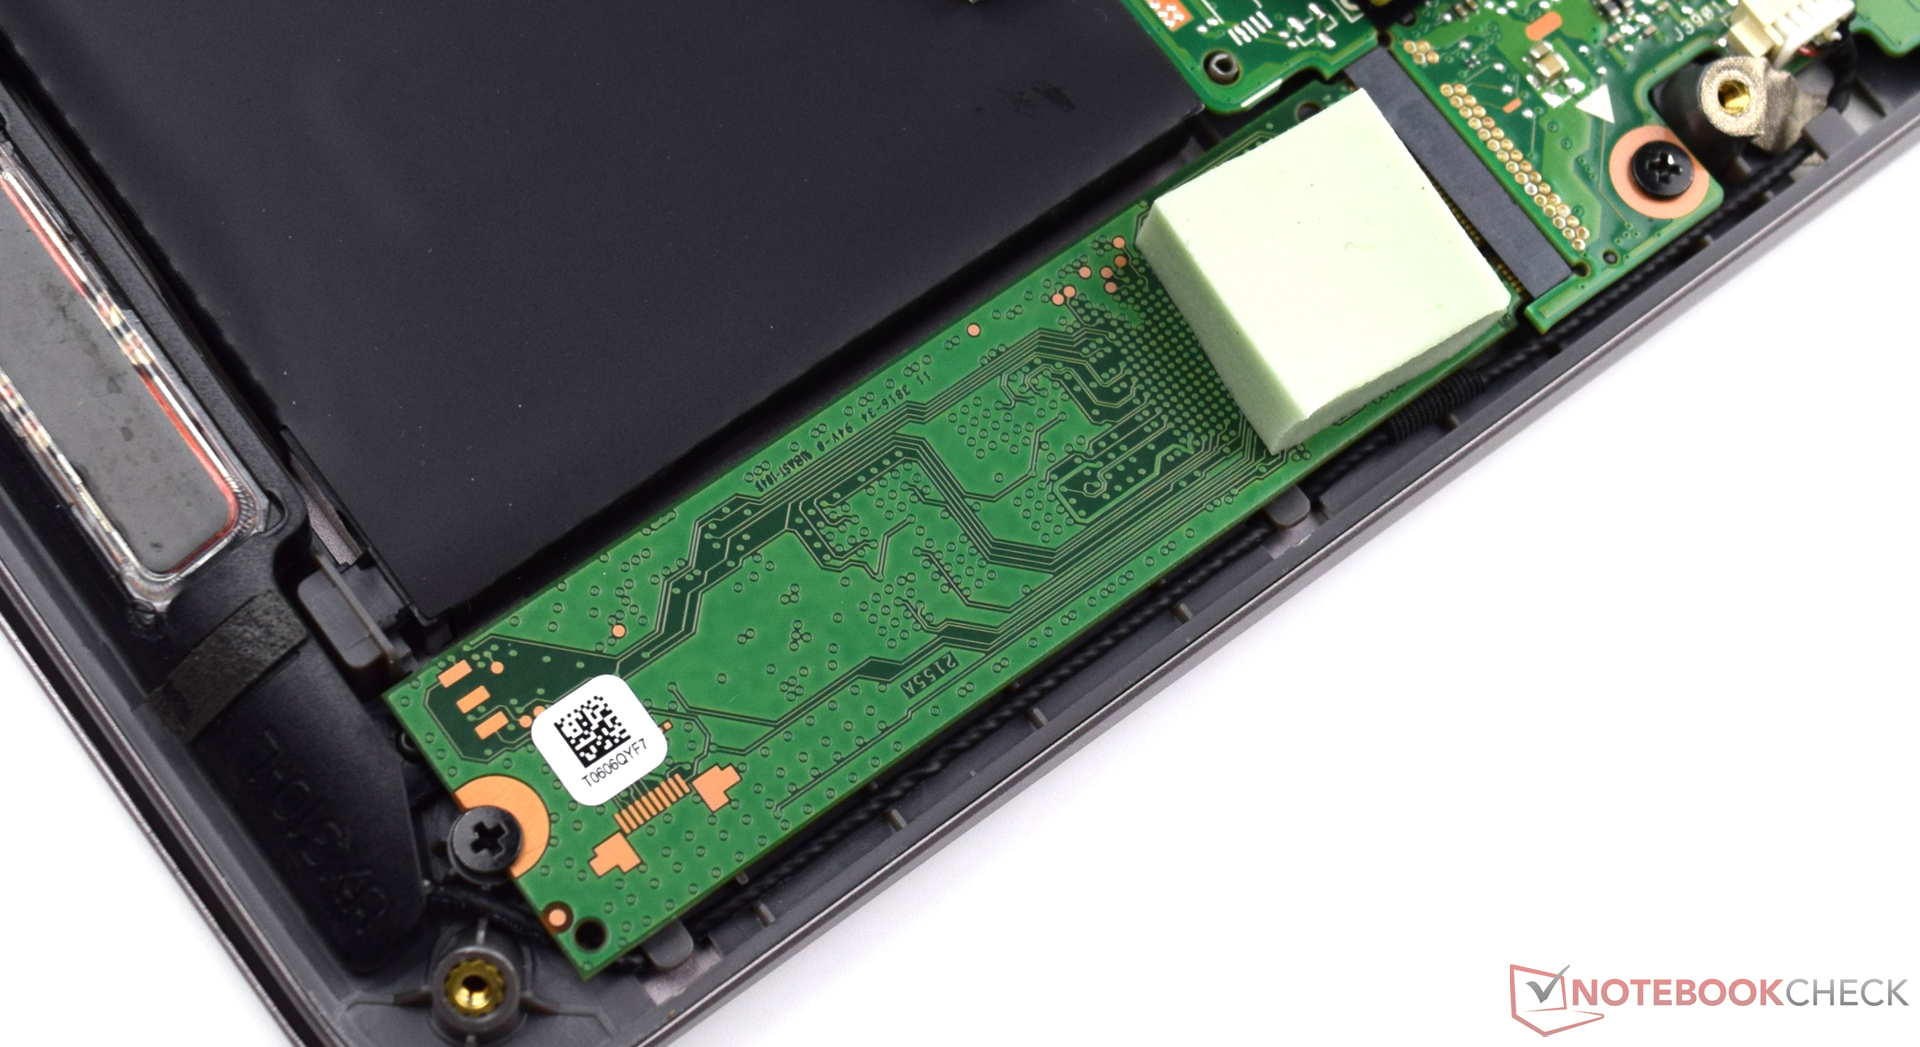
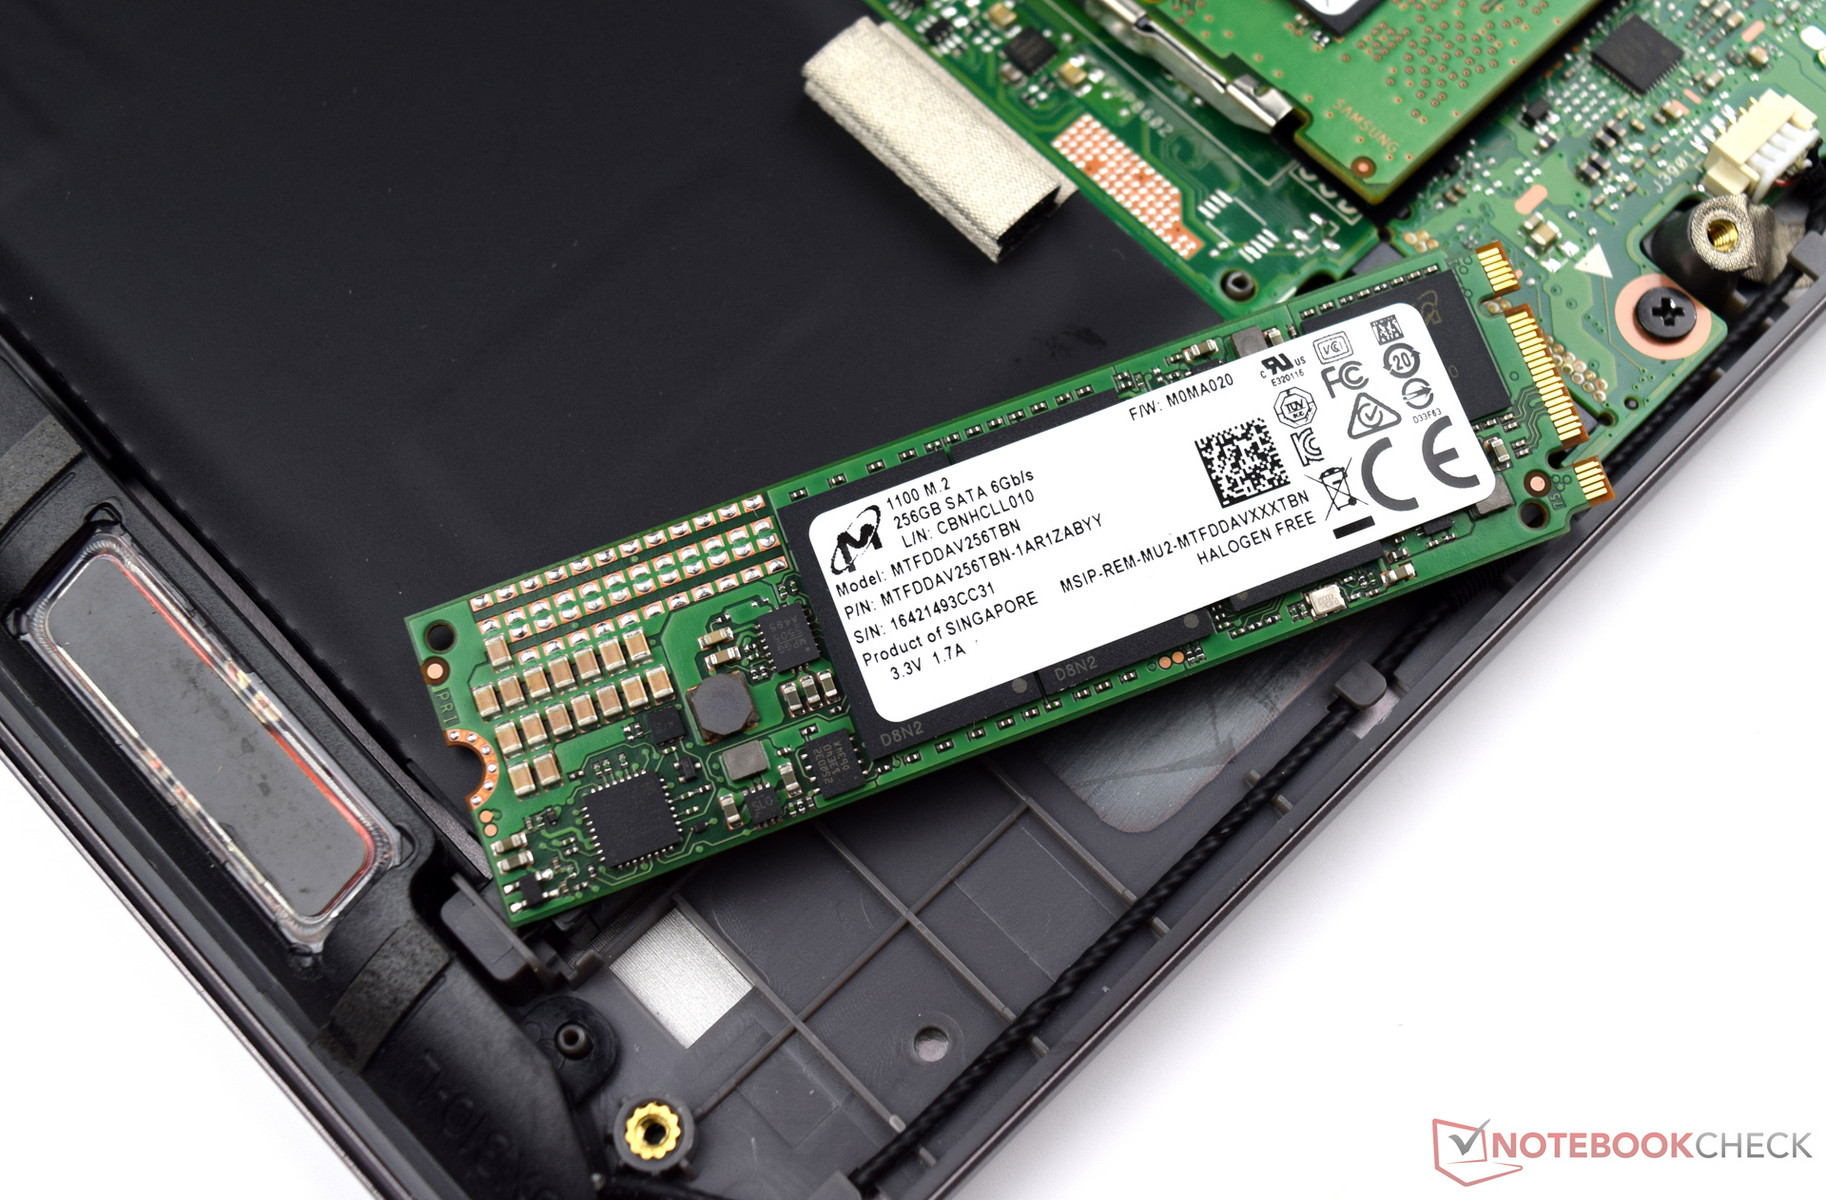
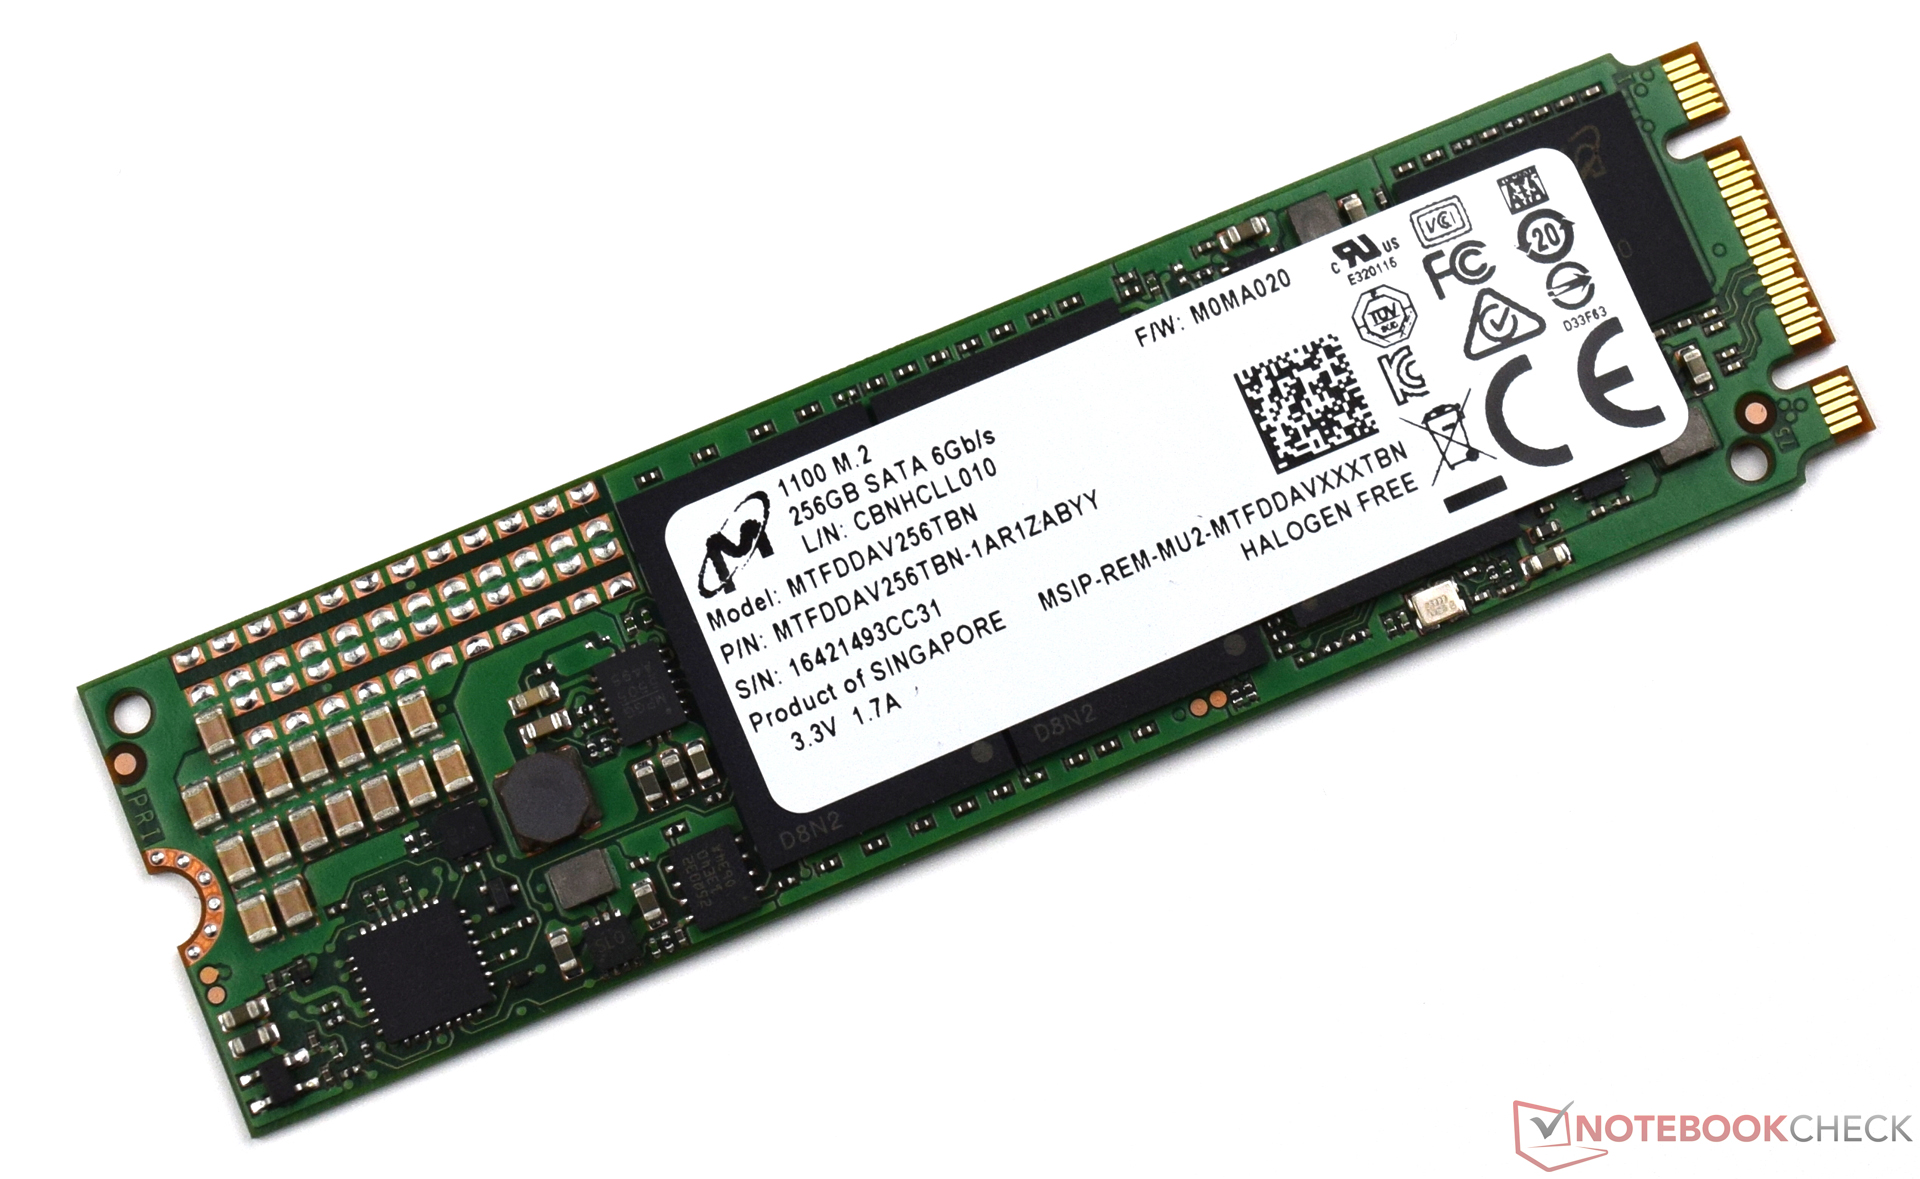

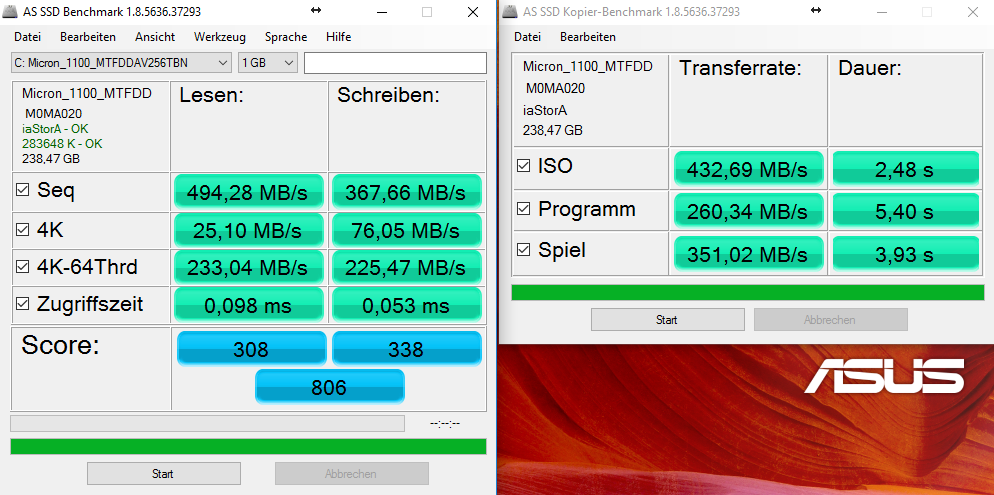
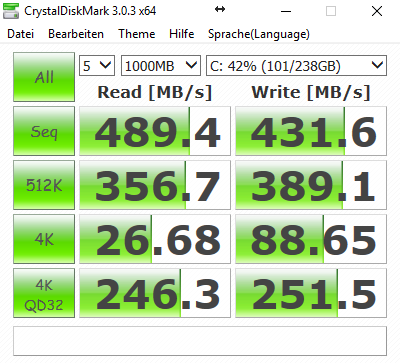
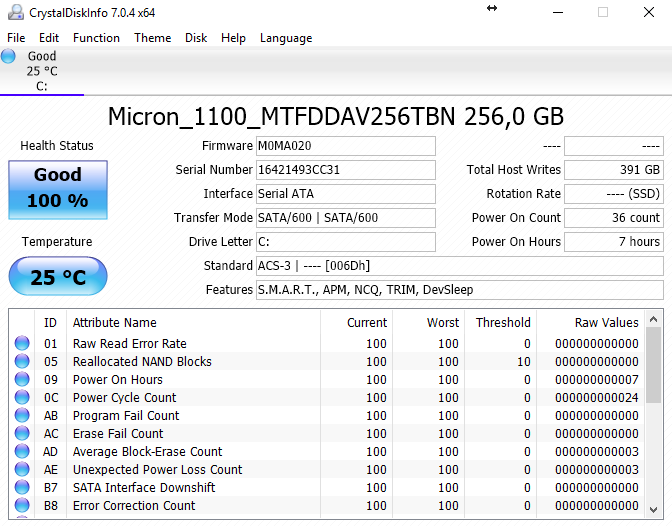
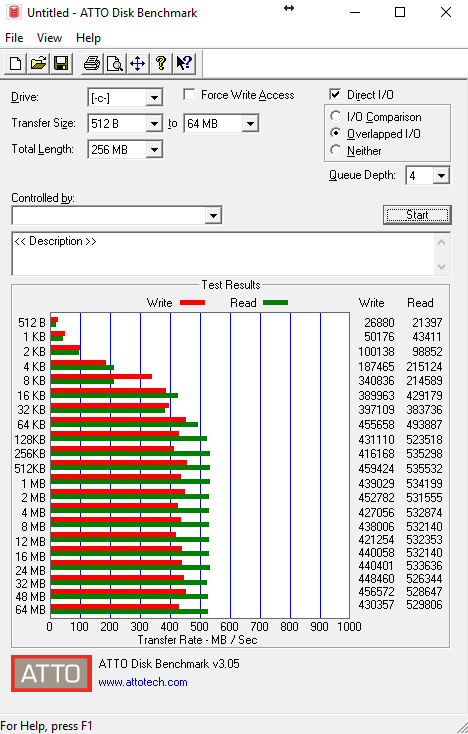
| Asus Zenbook UX310UA-FC347T iGP Micron SSD 1100 (MTFDDAV256TBN) | Asus Zenbook UX310UQ-GL011T SanDisk SD8SNAT256G1002 | Asus UX310UQ-FC396T SanDisk SD8SN8U512G1002 | Asus Zenbook UX3410UA SanDisk SD8SN8U512G1002 | Acer Swift 7 SF713-51 Kingston RBU-SNS4180S3256GG | Dell XPS 13 9360 FHD i5 Toshiba NVMe THNSN5256GPUK | |
|---|---|---|---|---|---|---|
| CrystalDiskMark 3.0 | -21% | 2% | 2% | 4% | 69% | |
| Read Seq (MB/s) | 489.4 | 468.1 -4% | 519 6% | 494.5 1% | 431.2 -12% | 1233 152% |
| Write Seq (MB/s) | 431.6 | 319.2 -26% | 468 8% | 461.7 7% | 401 -7% | 733 70% |
| Read 512 (MB/s) | 356.7 | 318.6 -11% | 344.8 -3% | 328 -8% | 283.7 -20% | 1036 190% |
| Write 512 (MB/s) | 389.1 | 272.8 -30% | 458 18% | 419.7 8% | 313.6 -19% | 439.9 13% |
| Read 4k (MB/s) | 26.68 | 22.03 -17% | 28.45 7% | 27.53 3% | 36.62 37% | 29.31 10% |
| Write 4k (MB/s) | 88.7 | 72.1 -19% | 56.2 -37% | 56.5 -36% | 76.1 -14% | 116.9 32% |
| Read 4k QD32 (MB/s) | 246.3 | 147.4 -40% | 286 16% | 351 43% | 329.4 34% | 479.2 95% |
| Write 4k QD32 (MB/s) | 251.5 | 200.2 -20% | 257.7 2% | 249.3 -1% | 325.6 29% | 218.3 -13% |

| 3DMark | |
| 1280x720 Cloud Gate Standard Graphics | |
| Asus Zenbook UX310UA-FC347T iGP | |
| Asus Zenbook UX3410UA | |
| Asus UX310UQ-FC396T | |
| Asus Zenbook UX310UQ-GL011T | |
| Dell XPS 13 9360 FHD i5 | |
| Acer Swift 7 SF713-51 | |
| 1920x1080 Fire Strike Graphics | |
| Asus Zenbook UX310UQ-GL011T | |
| Asus UX310UQ-FC396T | |
| Asus Zenbook UX310UA-FC347T iGP | |
| Asus Zenbook UX3410UA | |
| Dell XPS 13 9360 FHD i5 | |
| Acer Swift 7 SF713-51 | |
| 1280x720 Ice Storm Standard Graphics | |
| Asus Zenbook UX310UA-FC347T iGP | |
| Dell XPS 13 9360 FHD i5 | |
| Acer Swift 7 SF713-51 | |
| Asus UX310UQ-FC396T | |
| Asus Zenbook UX310UQ-GL011T | |
| 3DMark 06 - 1280x1024 Standard Score AA:0x AF:0x | |
| Asus UX310UQ-FC396T | |
| Asus Zenbook UX310UQ-GL011T | |
| Asus Zenbook UX310UA-FC347T iGP | |
| Acer Swift 7 SF713-51 | |
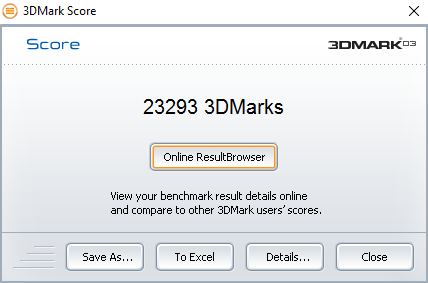
| 3DMark 03 Standard | 23293 points | |
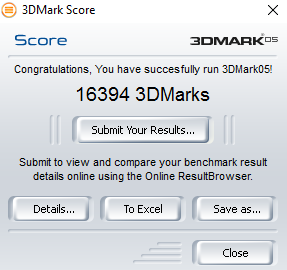
| 3DMark 05 Standard | 16394 points | |
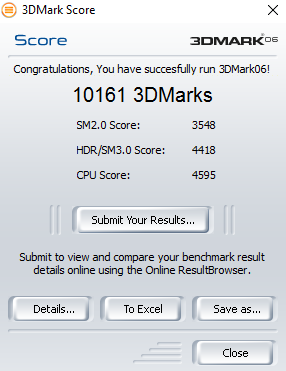
| 3DMark 06 Standard Score | 10161 points | |
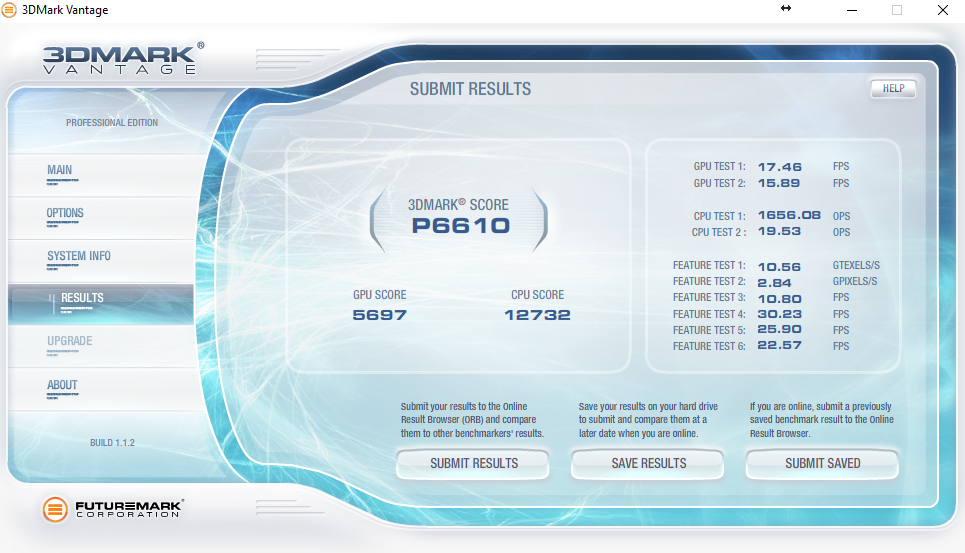
| 3DMark Vantage P Result | 6610 points | |
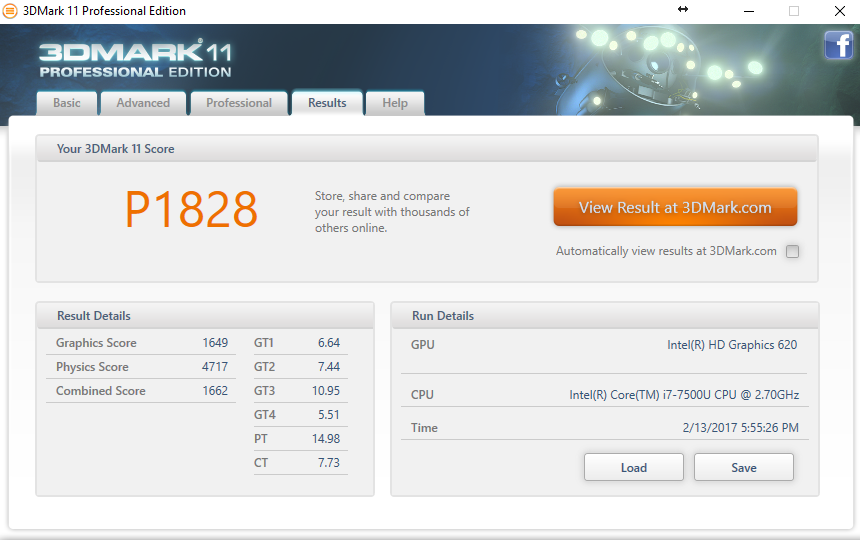
| 3DMark 11 Performance | 1828 points | |
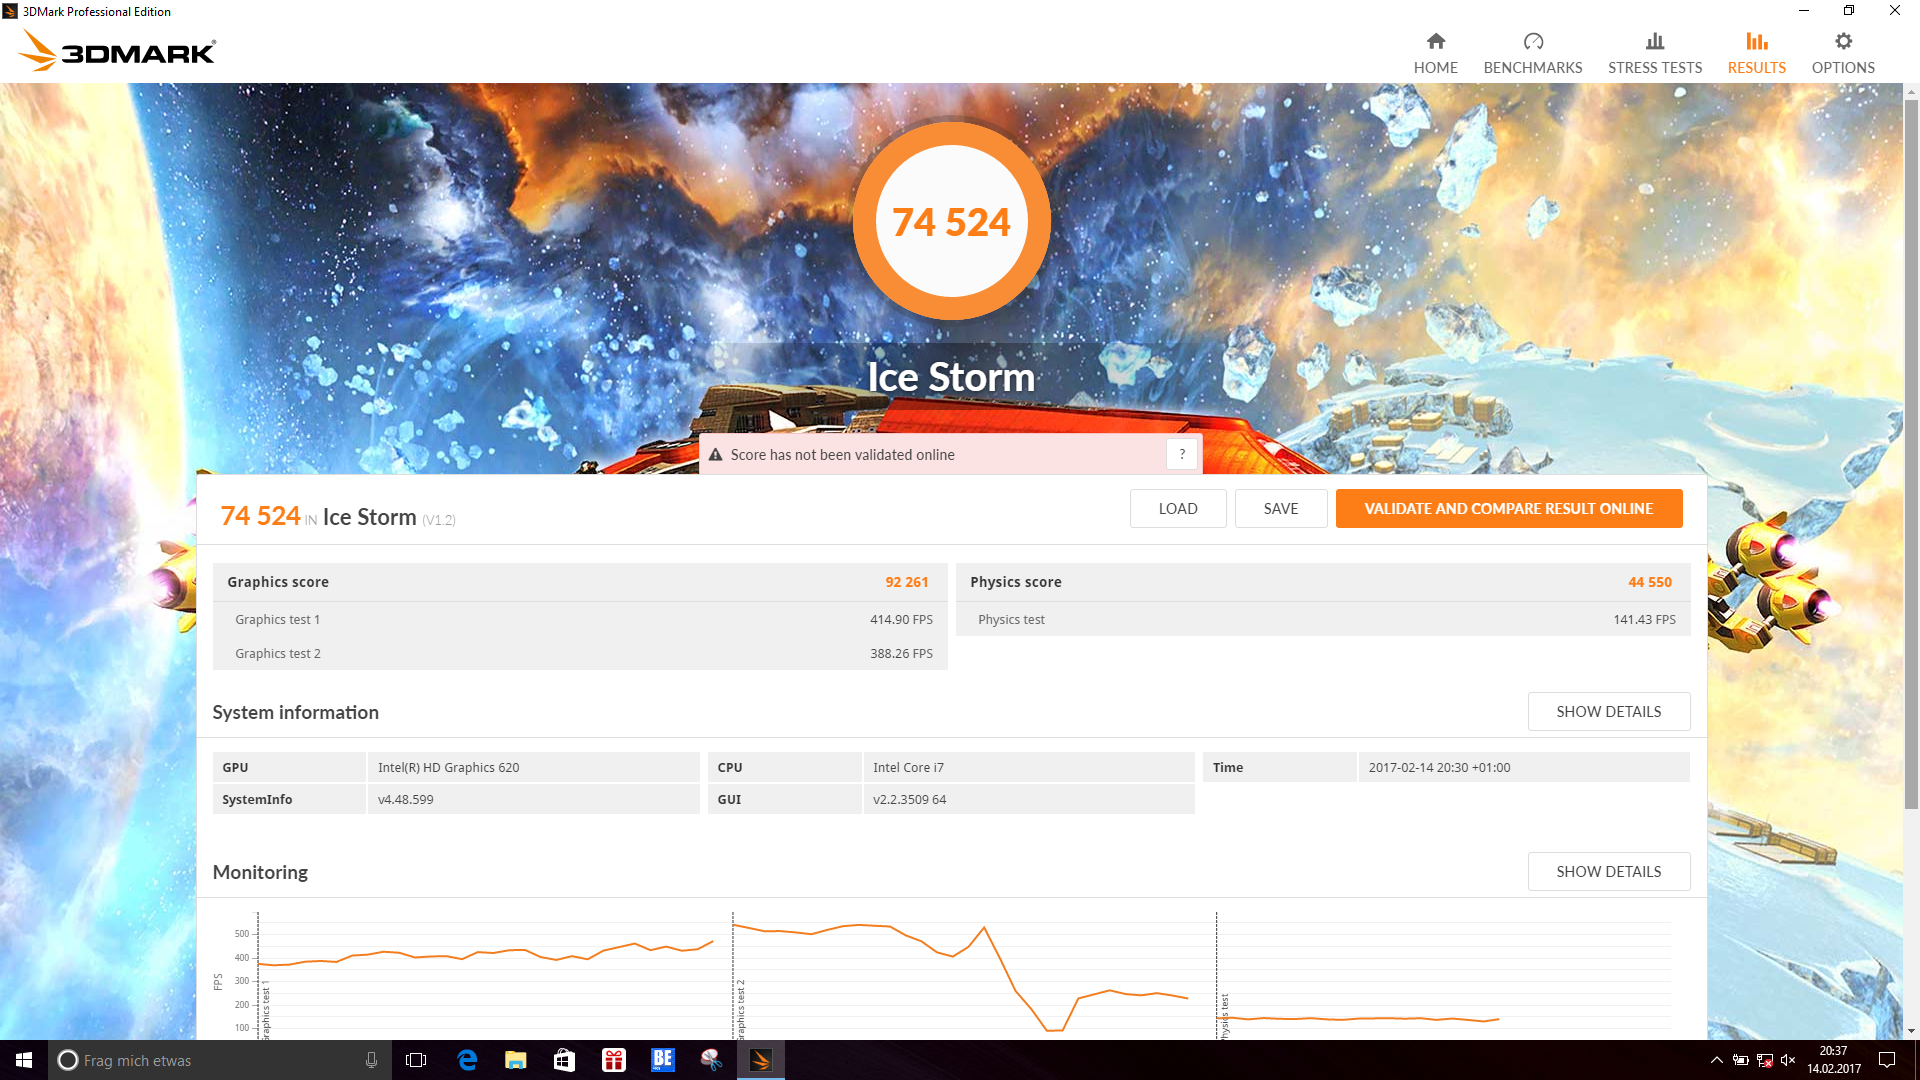
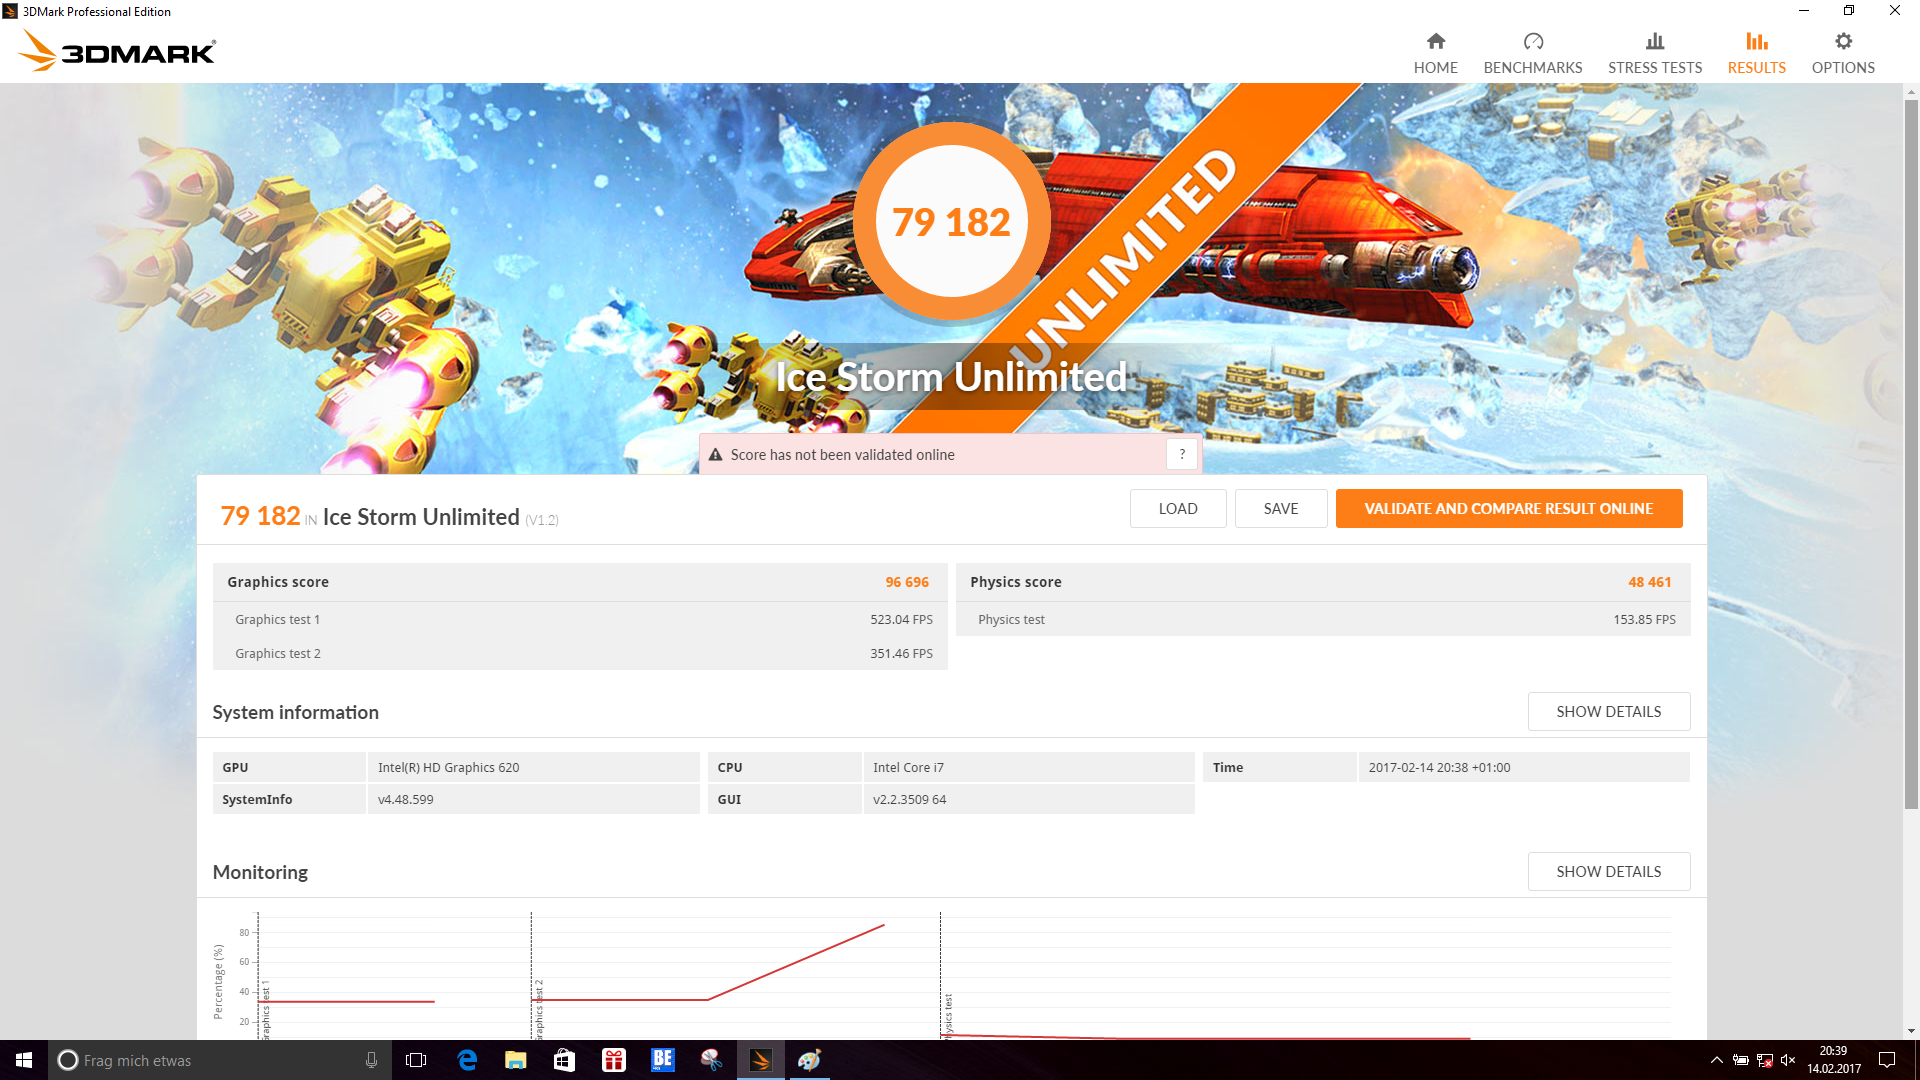
| 3DMark Ice Storm Standard Score | 74524 points | |
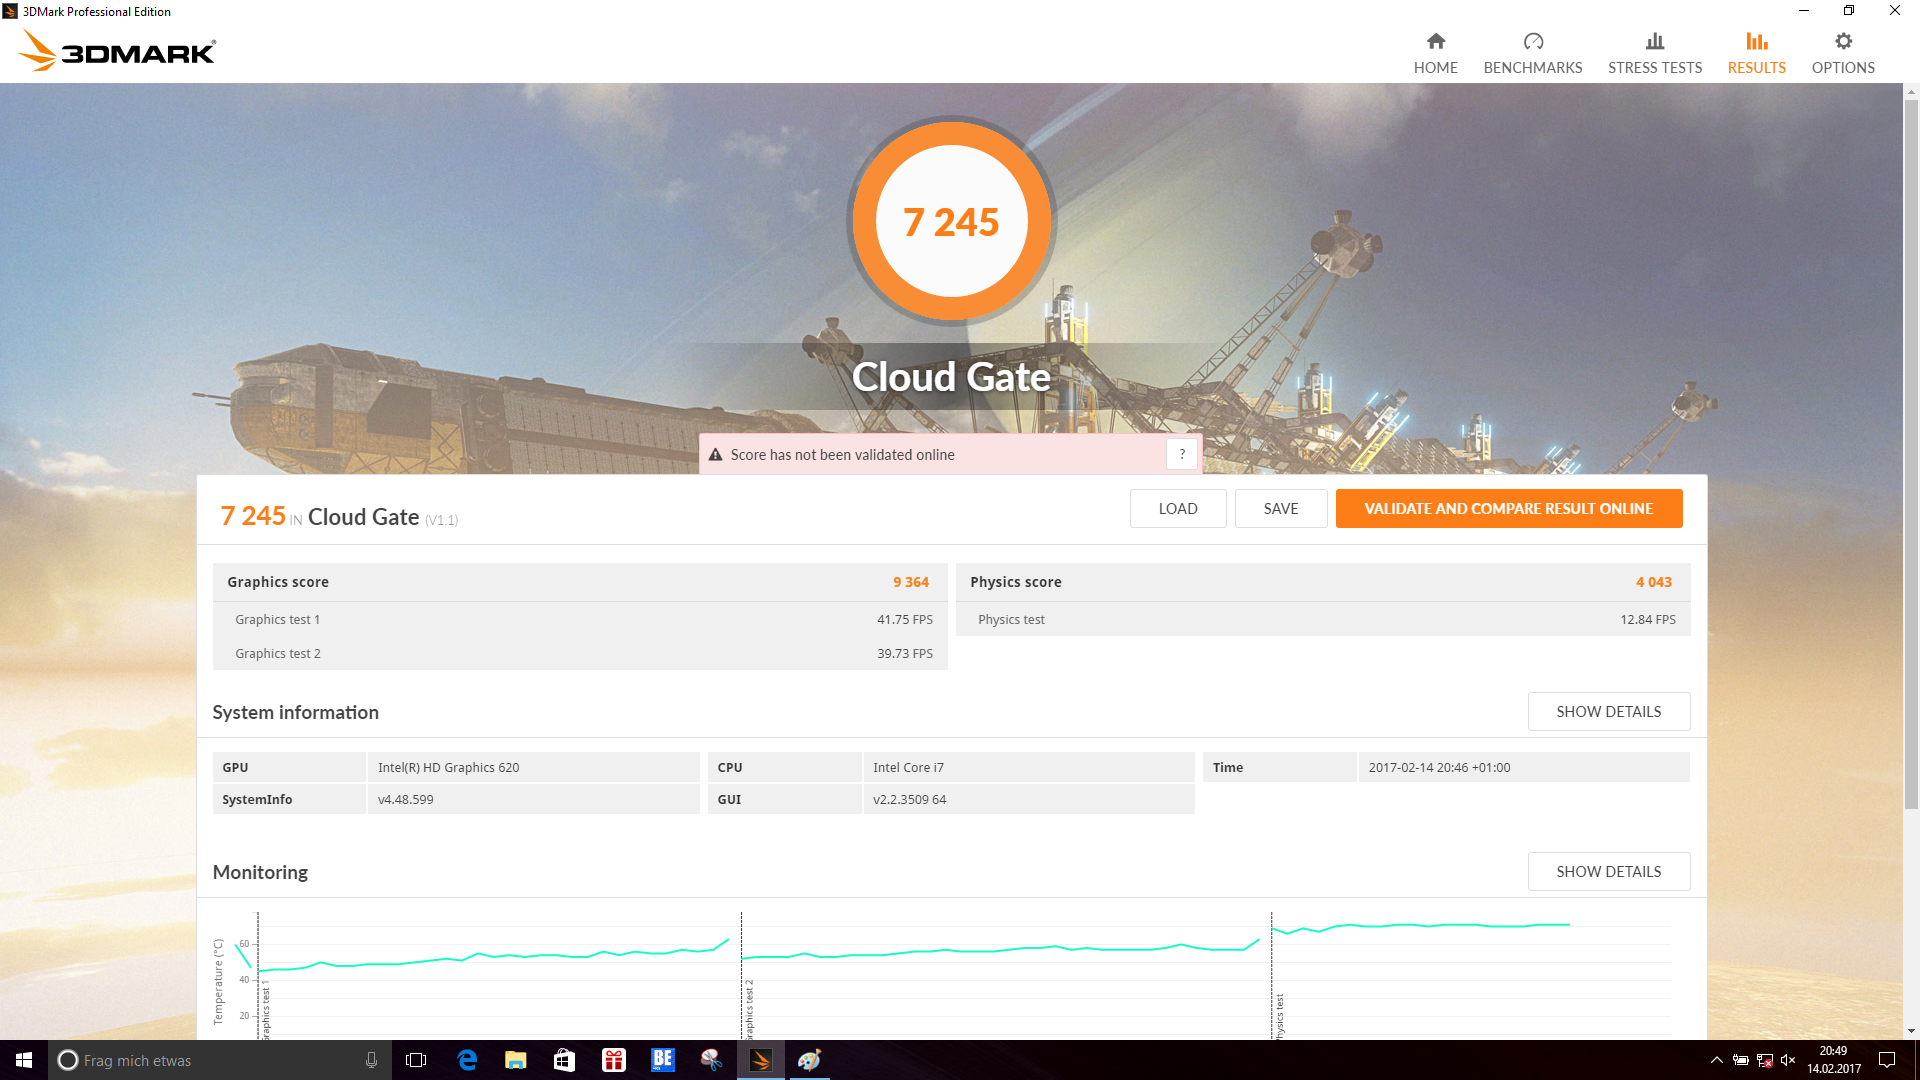
| 3DMark Cloud Gate Standard Score | 7245 points | |
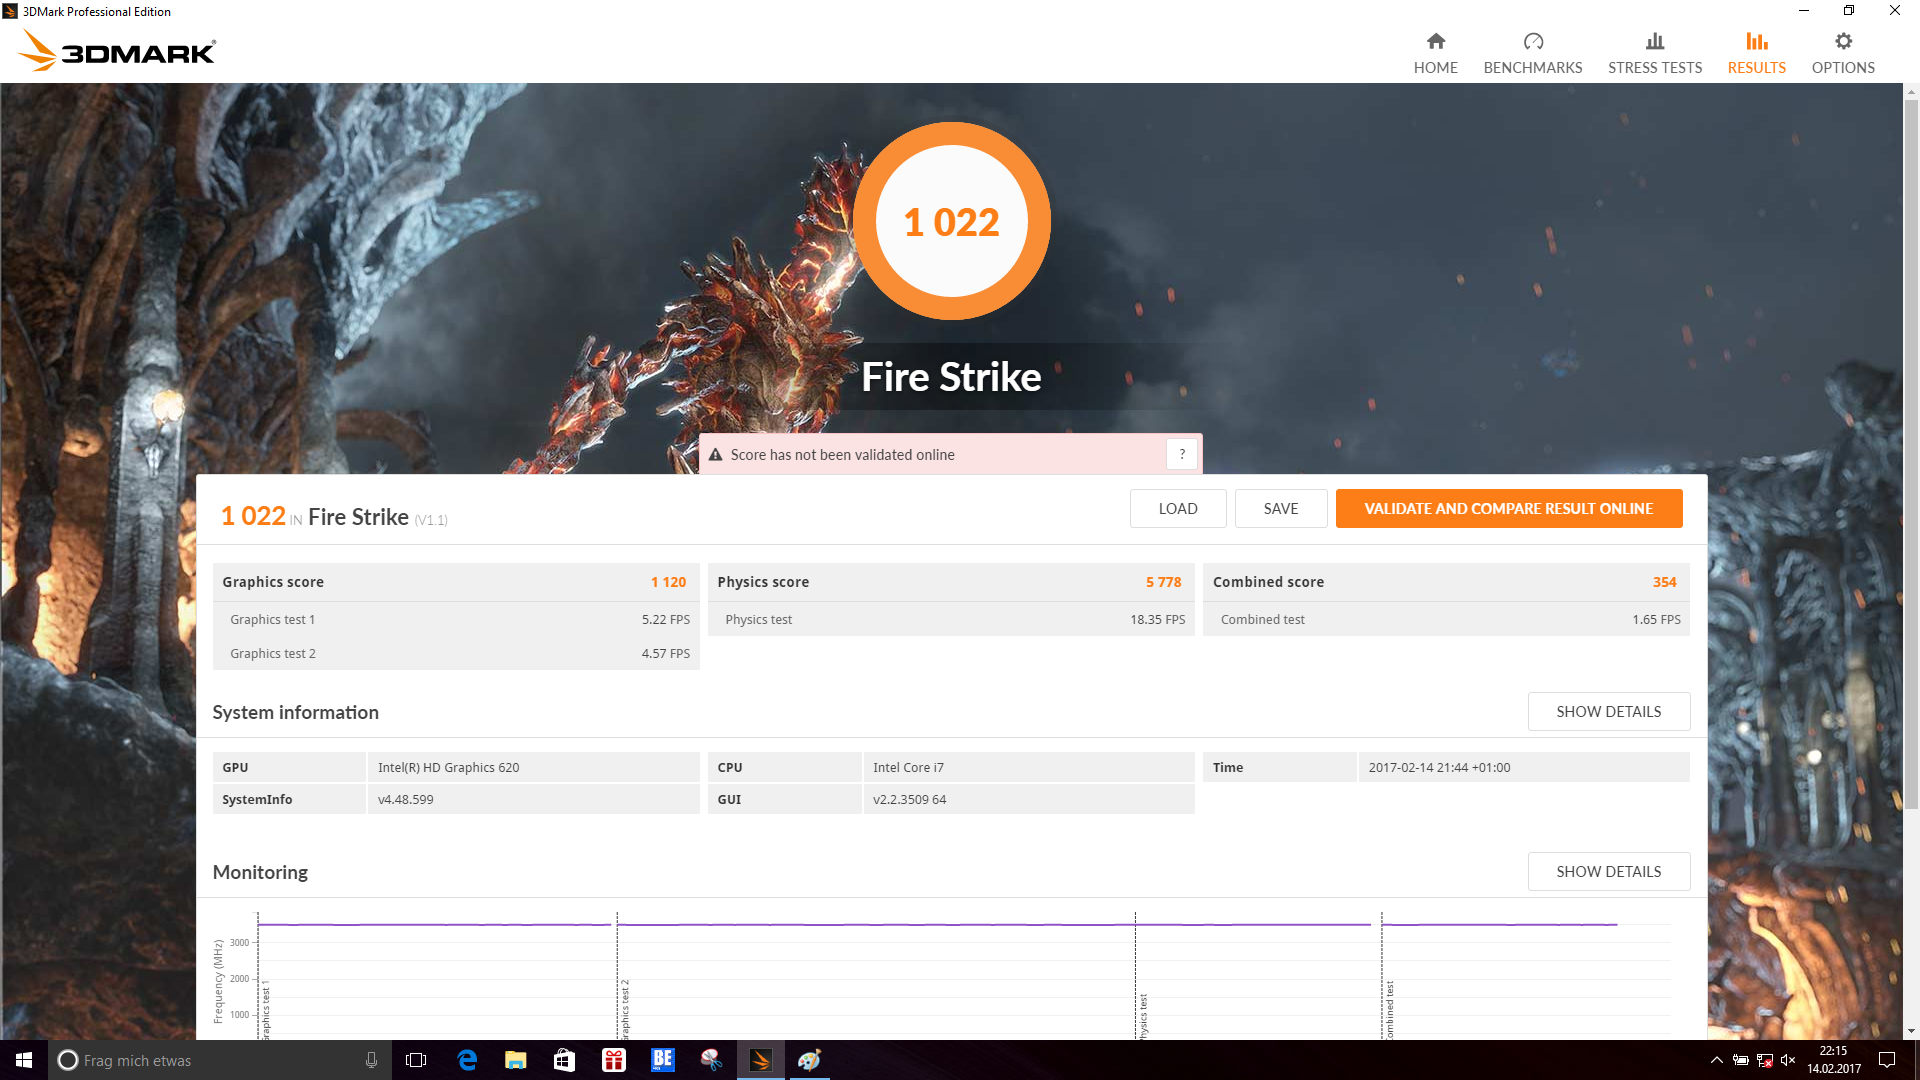
| 3DMark Fire Strike Score | 1022 points | |
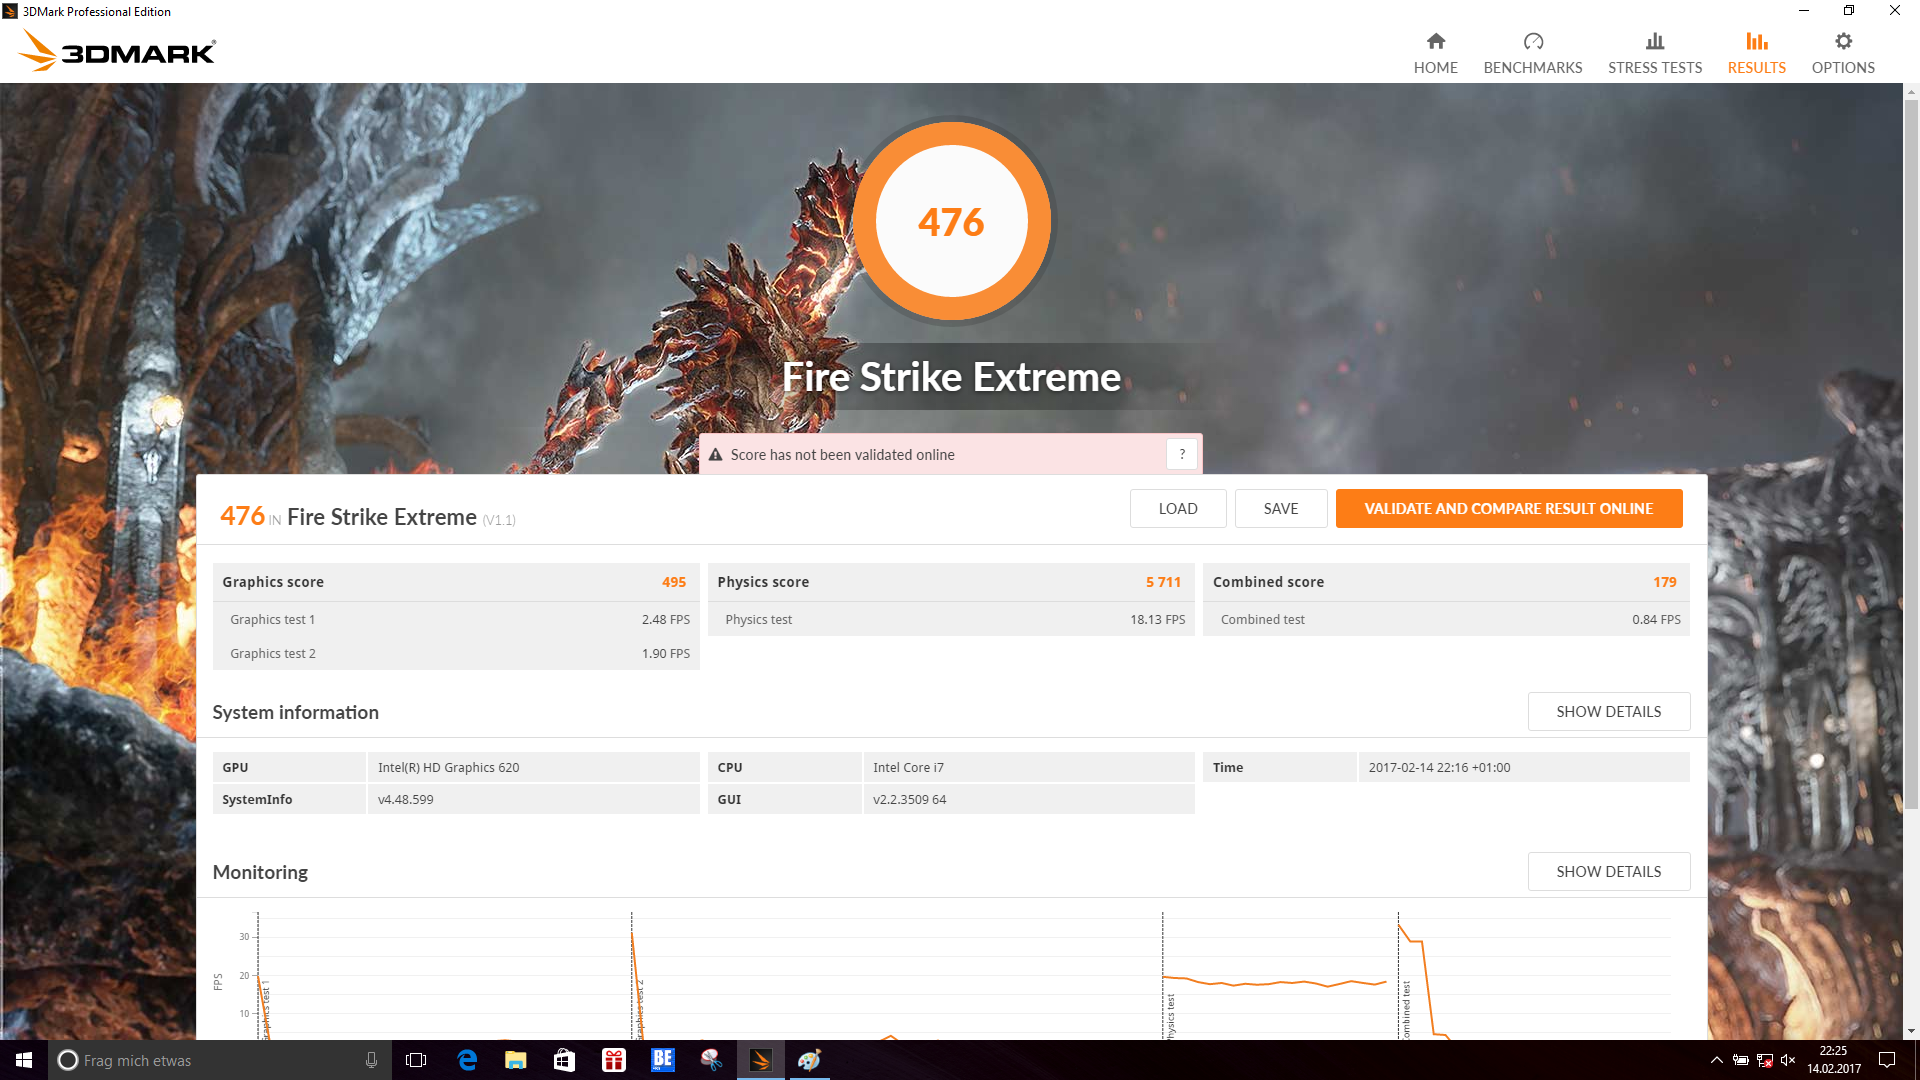
| 3DMark Fire Strike Extreme Score | 476 points | |
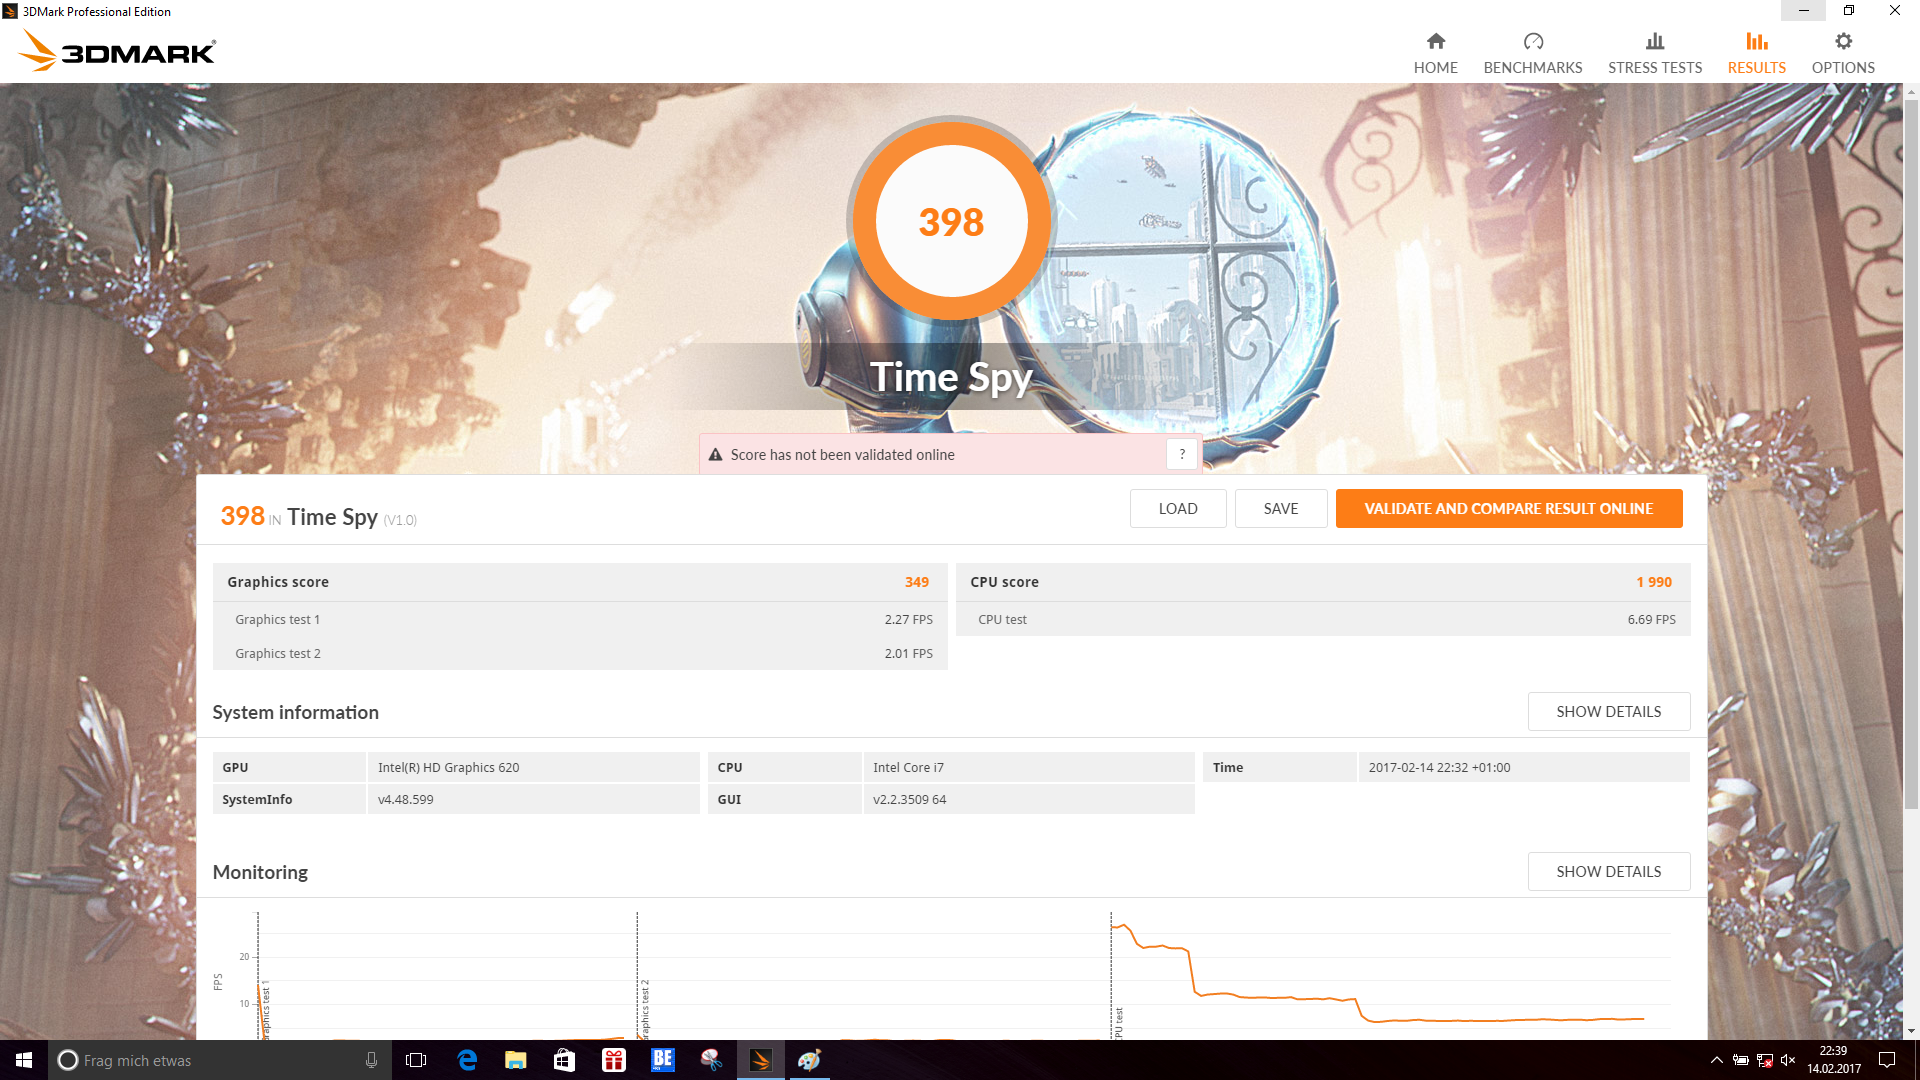
| 3DMark Time Spy Score | 398 points | |
Help | ||
| BioShock Infinite - 1366x768 Medium Preset | |
| Asus UX310UQ-FC396T | |
| Asus Zenbook UX310UQ-GL011T | |
| Asus Zenbook UX310UA-FC347T iGP | |
| Asus Zenbook UX3410UA | |
| Acer Swift 7 SF713-51 | |
| Battlefield 4 - 1366x768 Medium Preset | |
| Asus UX310UQ-FC396T | |
| Asus Zenbook UX310UQ-GL011T | |
| Asus Zenbook UX3410UA | |
| Asus Zenbook UX310UA-FC347T iGP | |
| Acer Swift 7 SF713-51 | |
| The Witcher 3 - 1366x768 Medium Graphics & Postprocessing | |
| Asus Zenbook UX310UA-FC347T iGP | |
| Asus UX310UQ-FC396T | |
| Asus Zenbook UX310UQ-GL011T | |
| Asus Zenbook UX3410UA | |
| low | med. | high | ultra | |
|---|---|---|---|---|
| BioShock Infinite (2013) | 64.5 | 34.9 | 29.1 | 8.9 |
| Battlefield 4 (2013) | 48.6 | 30.5 | 22.4 | 7.8 |
| The Witcher 3 (2015) | 24.3 | 17.1 | 6.9 |
Noise level
| Idle |
| 30.9 / 30.9 / 30.9 dB(A) |
| Load |
| 35.6 / 34.1 dB(A) |
 | ||
30 dB silent 40 dB(A) audible 50 dB(A) loud |
||
min: | ||
| Asus Zenbook UX310UA-FC347T iGP Intel Core i7-7500U, HD Graphics 620 | Asus Zenbook UX310UQ-GL011T Intel Core i7-6500U, GeForce 940MX | Asus UX310UQ-FC396T Intel Core i7-7500U, GeForce 940MX | Asus Zenbook UX3410UA Intel Core i7-7500U, HD Graphics 620 | Acer Swift 7 SF713-51 Intel Core i5-7Y54, HD Graphics 615 | Dell XPS 13 9360 FHD i5 Intel Core i5-7200U, HD Graphics 620 | |
|---|---|---|---|---|---|---|
| Noise | -3% | -5% | -9% | 7% | ||
| off / environment * (dB) | 30.7 | 30.5 1% | 30.7 -0% | 29.9 3% | ||
| Idle Minimum * (dB) | 30.9 | 30.5 1% | 31.1 -1% | 29.9 3% | 28.9 6% | |
| Idle Average * (dB) | 30.9 | 30.5 1% | 31.1 -1% | 29.9 3% | 28.9 6% | |
| Idle Maximum * (dB) | 30.9 | 31.5 -2% | 31.5 -2% | 35.2 -14% | 28.9 6% | |
| Load Average * (dB) | 35.6 | 36.2 -2% | 38.5 -8% | 43.5 -22% | 30.9 13% | |
| Load Maximum * (dB) | 34.1 | 40 -17% | 39.7 -16% | 43.8 -28% | 33.5 2% |
* ... smaller is better
| Asus Zenbook UX310UA-FC347T iGP HD Graphics 620, i7-7500U, Micron SSD 1100 (MTFDDAV256TBN) | Asus Zenbook UX310UQ-GL011T GeForce 940MX, 6500U, SanDisk SD8SNAT256G1002 | Asus UX310UQ-FC396T GeForce 940MX, i7-7500U, SanDisk SD8SN8U512G1002 | Asus Zenbook UX3410UA HD Graphics 620, i7-7500U, SanDisk SD8SN8U512G1002 | Acer Swift 7 SF713-51 HD Graphics 615, i5-7Y54, Kingston RBU-SNS4180S3256GG | Dell XPS 13 9360 FHD i5 HD Graphics 620, i5-7200U, Toshiba NVMe THNSN5256GPUK | |
|---|---|---|---|---|---|---|
| Heat | -7% | -15% | -13% | -21% | -22% | |
| Maximum Upper Side * (°C) | 33.7 | 38.5 -14% | 40 -19% | 39.4 -17% | 45.7 -36% | 43.4 -29% |
| Maximum Bottom * (°C) | 34.1 | 40.4 -18% | 42.4 -24% | 35.2 -3% | 48.7 -43% | 49.2 -44% |
| Idle Upper Side * (°C) | 25.2 | 24.8 2% | 23.9 5% | 29.4 -17% | 25.5 -1% | 26.4 -5% |
| Idle Bottom * (°C) | 24.1 | 23.8 1% | 29.3 -22% | 27.6 -15% | 25.2 -5% | 26.4 -10% |
* ... smaller is better
(+) The maximum temperature on the upper side is 33.7 °C / 93 F, compared to the average of 35.9 °C / 97 F, ranging from 21.4 to 59 °C for the class Subnotebook.
(+) The bottom heats up to a maximum of 34.1 °C / 93 F, compared to the average of 39.2 °C / 103 F
(+) In idle usage, the average temperature for the upper side is 23.4 °C / 74 F, compared to the device average of 30.8 °C / 87 F.
(+) The palmrests and touchpad are cooler than skin temperature with a maximum of 28.8 °C / 83.8 F and are therefore cool to the touch.
(±) The average temperature of the palmrest area of similar devices was 28.2 °C / 82.8 F (-0.6 °C / -1 F).
Asus Zenbook UX310UA-FC347T iGP audio analysis
(±) | speaker loudness is average but good (73 dB)
Bass 100 - 315 Hz
(±) | reduced bass - on average 13.7% lower than median
(+) | bass is linear (6.4% delta to prev. frequency)
Mids 400 - 2000 Hz
(+) | balanced mids - only 2.5% away from median
(+) | mids are linear (3.3% delta to prev. frequency)
Highs 2 - 16 kHz
(±) | higher highs - on average 6.7% higher than median
(+) | highs are linear (4% delta to prev. frequency)
Overall 100 - 16.000 Hz
(±) | linearity of overall sound is average (16% difference to median)
Compared to same class
» 38% of all tested devices in this class were better, 5% similar, 56% worse
» The best had a delta of 5%, average was 18%, worst was 53%
Compared to all devices tested
» 25% of all tested devices were better, 5% similar, 69% worse
» The best had a delta of 4%, average was 23%, worst was 134%
Apple MacBook 12 (Early 2016) 1.1 GHz audio analysis
(+) | speakers can play relatively loud (83.6 dB)
Bass 100 - 315 Hz
(±) | reduced bass - on average 11.3% lower than median
(±) | linearity of bass is average (14.2% delta to prev. frequency)
Mids 400 - 2000 Hz
(+) | balanced mids - only 2.4% away from median
(+) | mids are linear (5.5% delta to prev. frequency)
Highs 2 - 16 kHz
(+) | balanced highs - only 2% away from median
(+) | highs are linear (4.5% delta to prev. frequency)
Overall 100 - 16.000 Hz
(+) | overall sound is linear (10.2% difference to median)
Compared to same class
» 7% of all tested devices in this class were better, 2% similar, 90% worse
» The best had a delta of 5%, average was 18%, worst was 53%
Compared to all devices tested
» 5% of all tested devices were better, 1% similar, 94% worse
» The best had a delta of 4%, average was 23%, worst was 134%
| Off / Standby | |
| Idle | |
| Load |
|
Key:
min: | |
| Asus Zenbook UX310UA-FC347T iGP i7-7500U, HD Graphics 620, Micron SSD 1100 (MTFDDAV256TBN), IPS, LED, 1920x1080, 13.3" | Asus Zenbook UX310UQ-GL011T 6500U, GeForce 940MX, SanDisk SD8SNAT256G1002, TN LED, 1920x1080, 13.3" | Asus UX310UQ-FC396T i7-7500U, GeForce 940MX, SanDisk SD8SN8U512G1002, IPS, LED, 1920x1080, 13.3" | Asus Zenbook UX3410UA i7-7500U, HD Graphics 620, SanDisk SD8SN8U512G1002, IPS, 1920x1080, 14" | Acer Swift 7 SF713-51 i5-7Y54, HD Graphics 615, Kingston RBU-SNS4180S3256GG, IPS, WLED, 1920x1080, 13.3" | Dell XPS 13 9360 FHD i5 i5-7200U, HD Graphics 620, Toshiba NVMe THNSN5256GPUK, IPS, 1920x1080, 13.3" | |
|---|---|---|---|---|---|---|
| Power Consumption | -12% | -32% | -3% | 20% | 23% | |
| Idle Minimum * (Watt) | 3.5 | 3 14% | 4.1 -17% | 3.7 -6% | 4.1 -17% | 4.1 -17% |
| Idle Average * (Watt) | 6.6 | 5.6 15% | 8.2 -24% | 6 9% | 6.4 3% | 4.2 36% |
| Idle Maximum * (Watt) | 7.5 | 6.8 9% | 8.9 -19% | 6.78 10% | 6.8 9% | 5.1 32% |
| Load Average * (Watt) | 34.7 | 48.7 -40% | 48 -38% | 37.3 -7% | 16 54% | 22.1 36% |
| Load Maximum * (Watt) | 39.6 | 63 -59% | 64.1 -62% | 47.4 -20% | 18.7 53% | 29.4 26% |
* ... smaller is better
| Asus Zenbook UX310UA-FC347T iGP i7-7500U, HD Graphics 620, 48 Wh | Asus Zenbook UX310UQ-GL011T 6500U, GeForce 940MX, 48 Wh | Asus UX310UQ-FC396T i7-7500U, GeForce 940MX, 48 Wh | Asus Zenbook UX3410UA i7-7500U, HD Graphics 620, 48 Wh | Acer Swift 7 SF713-51 i5-7Y54, HD Graphics 615, 41.58 Wh | Dell XPS 13 9360 FHD i5 i5-7200U, HD Graphics 620, 60 Wh | |
|---|---|---|---|---|---|---|
| Battery runtime | -9% | -3% | 4% | 4% | 30% | |
| Reader / Idle (h) | 16.1 | 14.6 -9% | 15.3 -5% | 17.7 10% | 13.2 -18% | 21.6 34% |
| H.264 (h) | 6.9 | 7 1% | 7.3 6% | 10.1 46% | 6.8 -1% | |
| WiFi v1.3 (h) | 9.6 | 8.1 -16% | 8.8 -8% | 7.4 -23% | 7.3 -24% | 11.3 18% |
| Load (h) | 1.9 | 1.7 -11% | 1.8 -5% | 1.6 -16% | 3 58% | 2.6 37% |
Pros
Cons
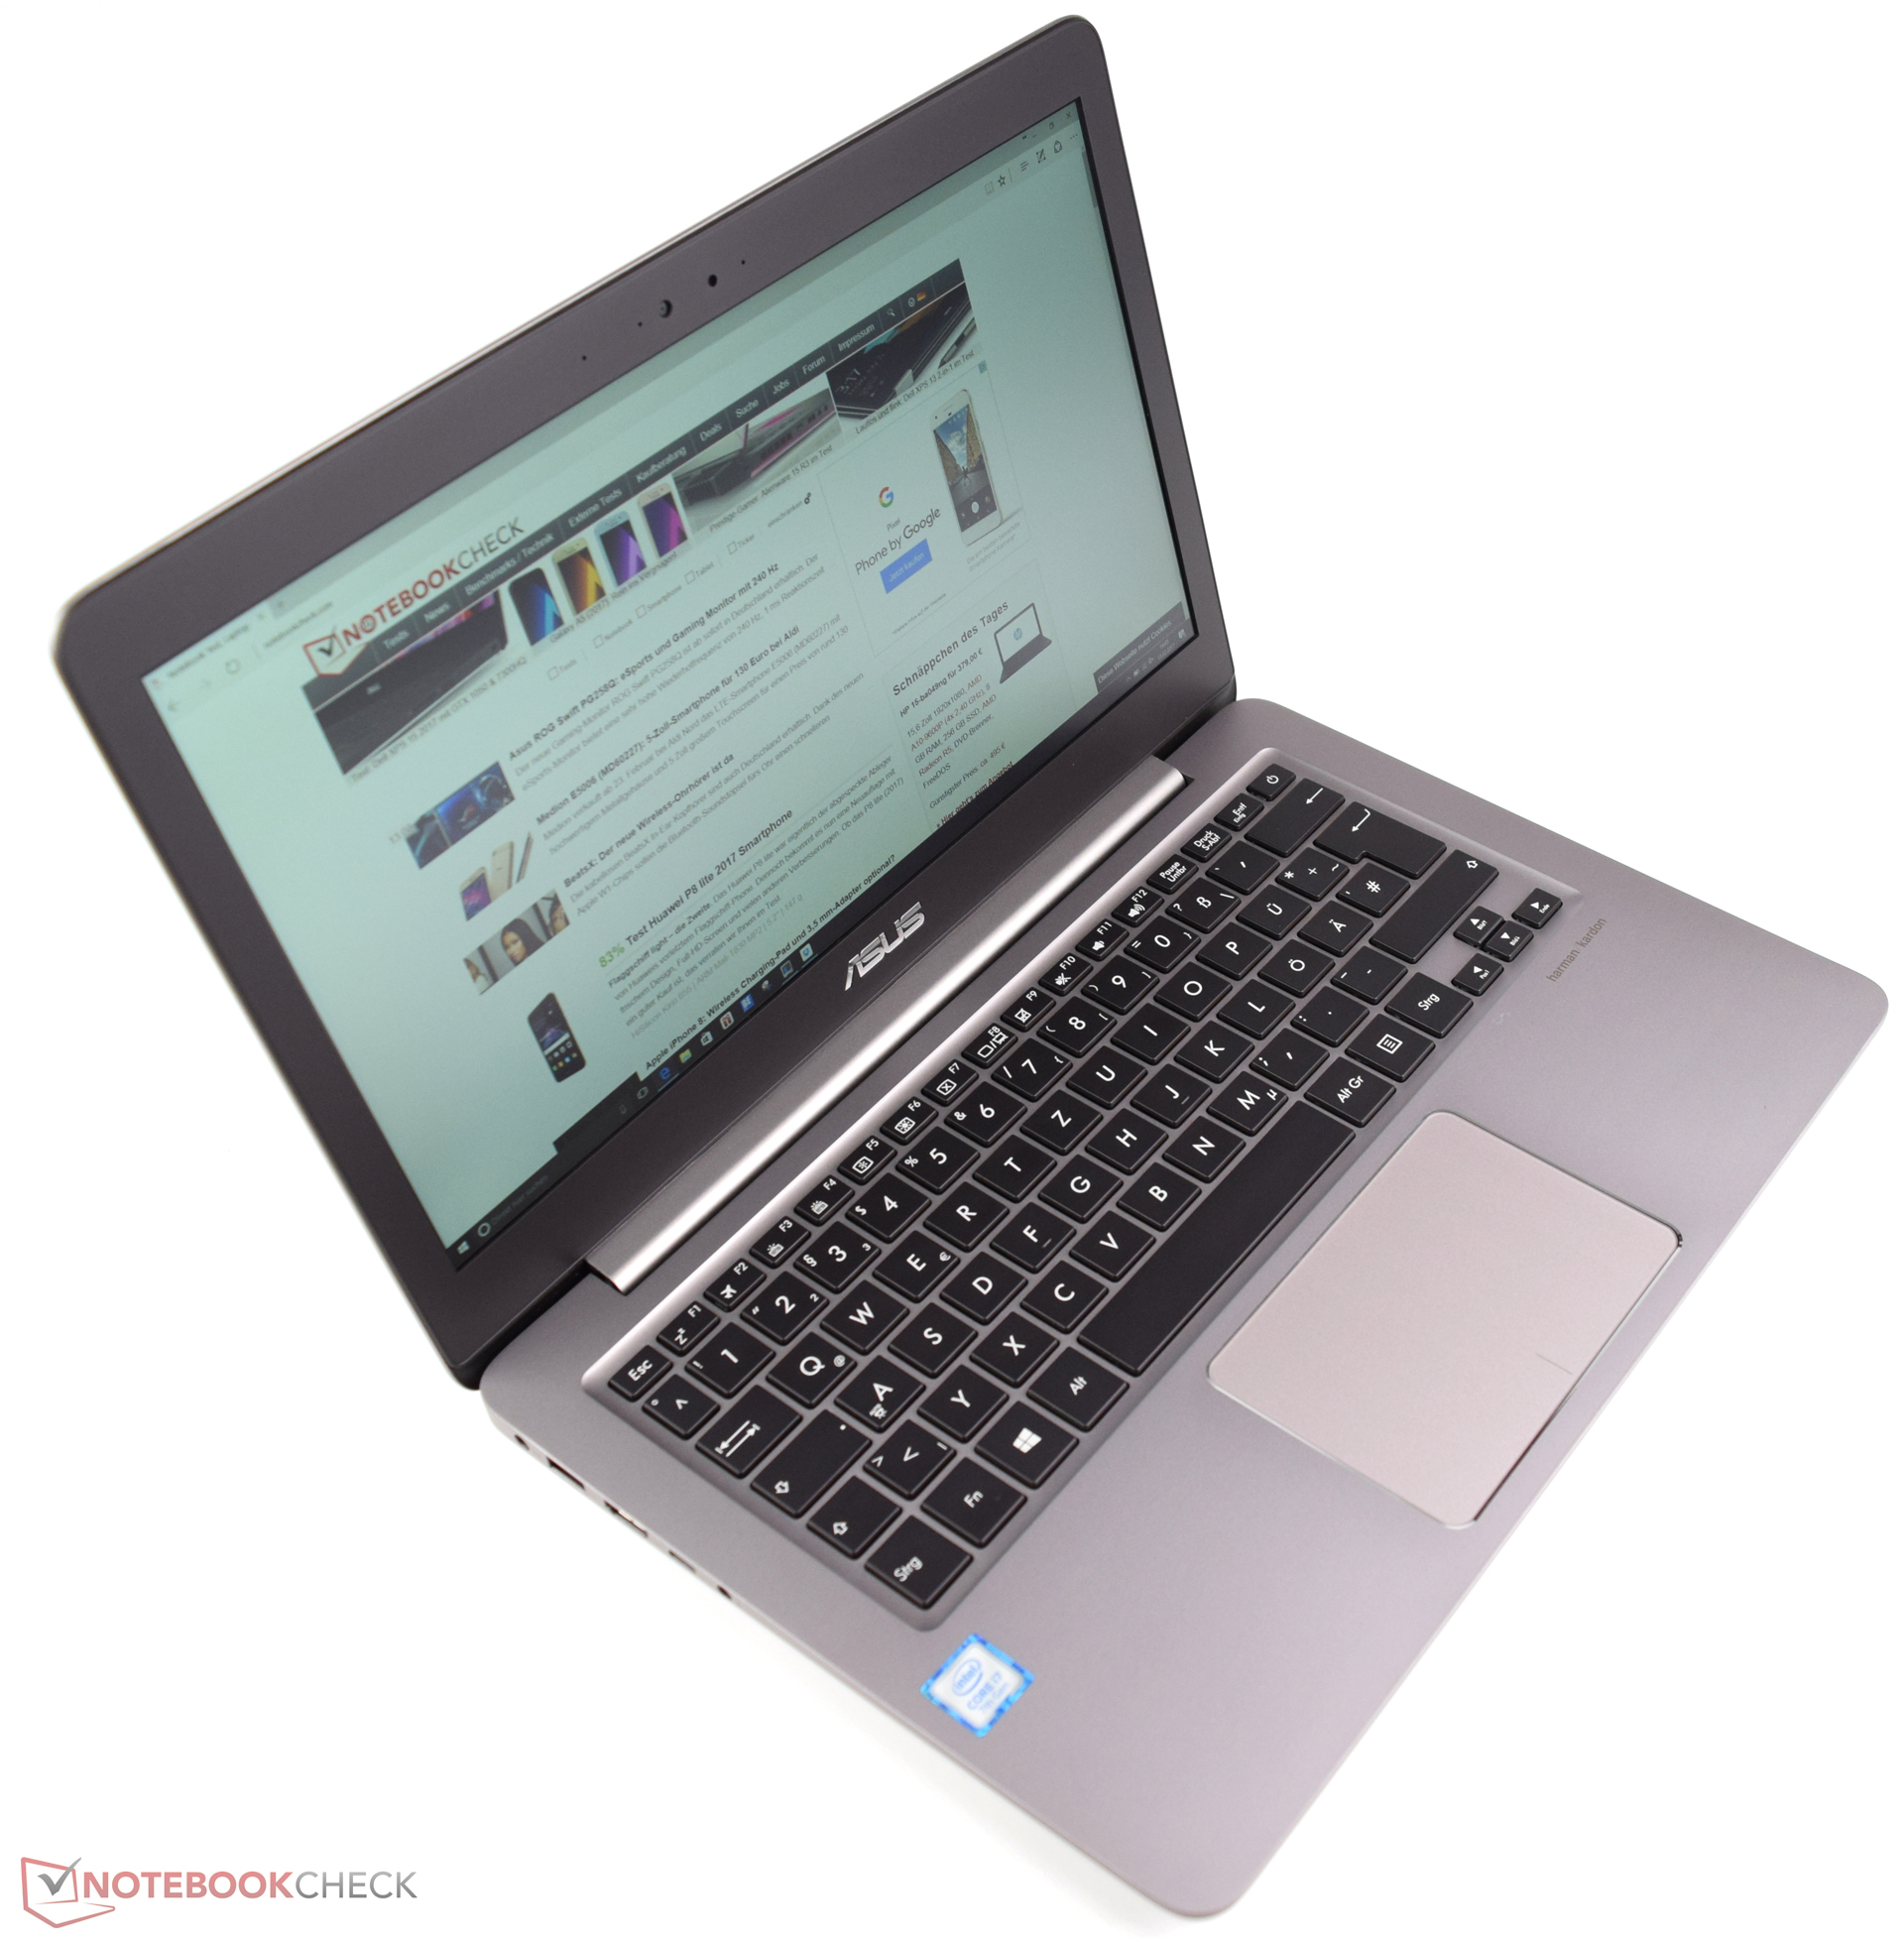
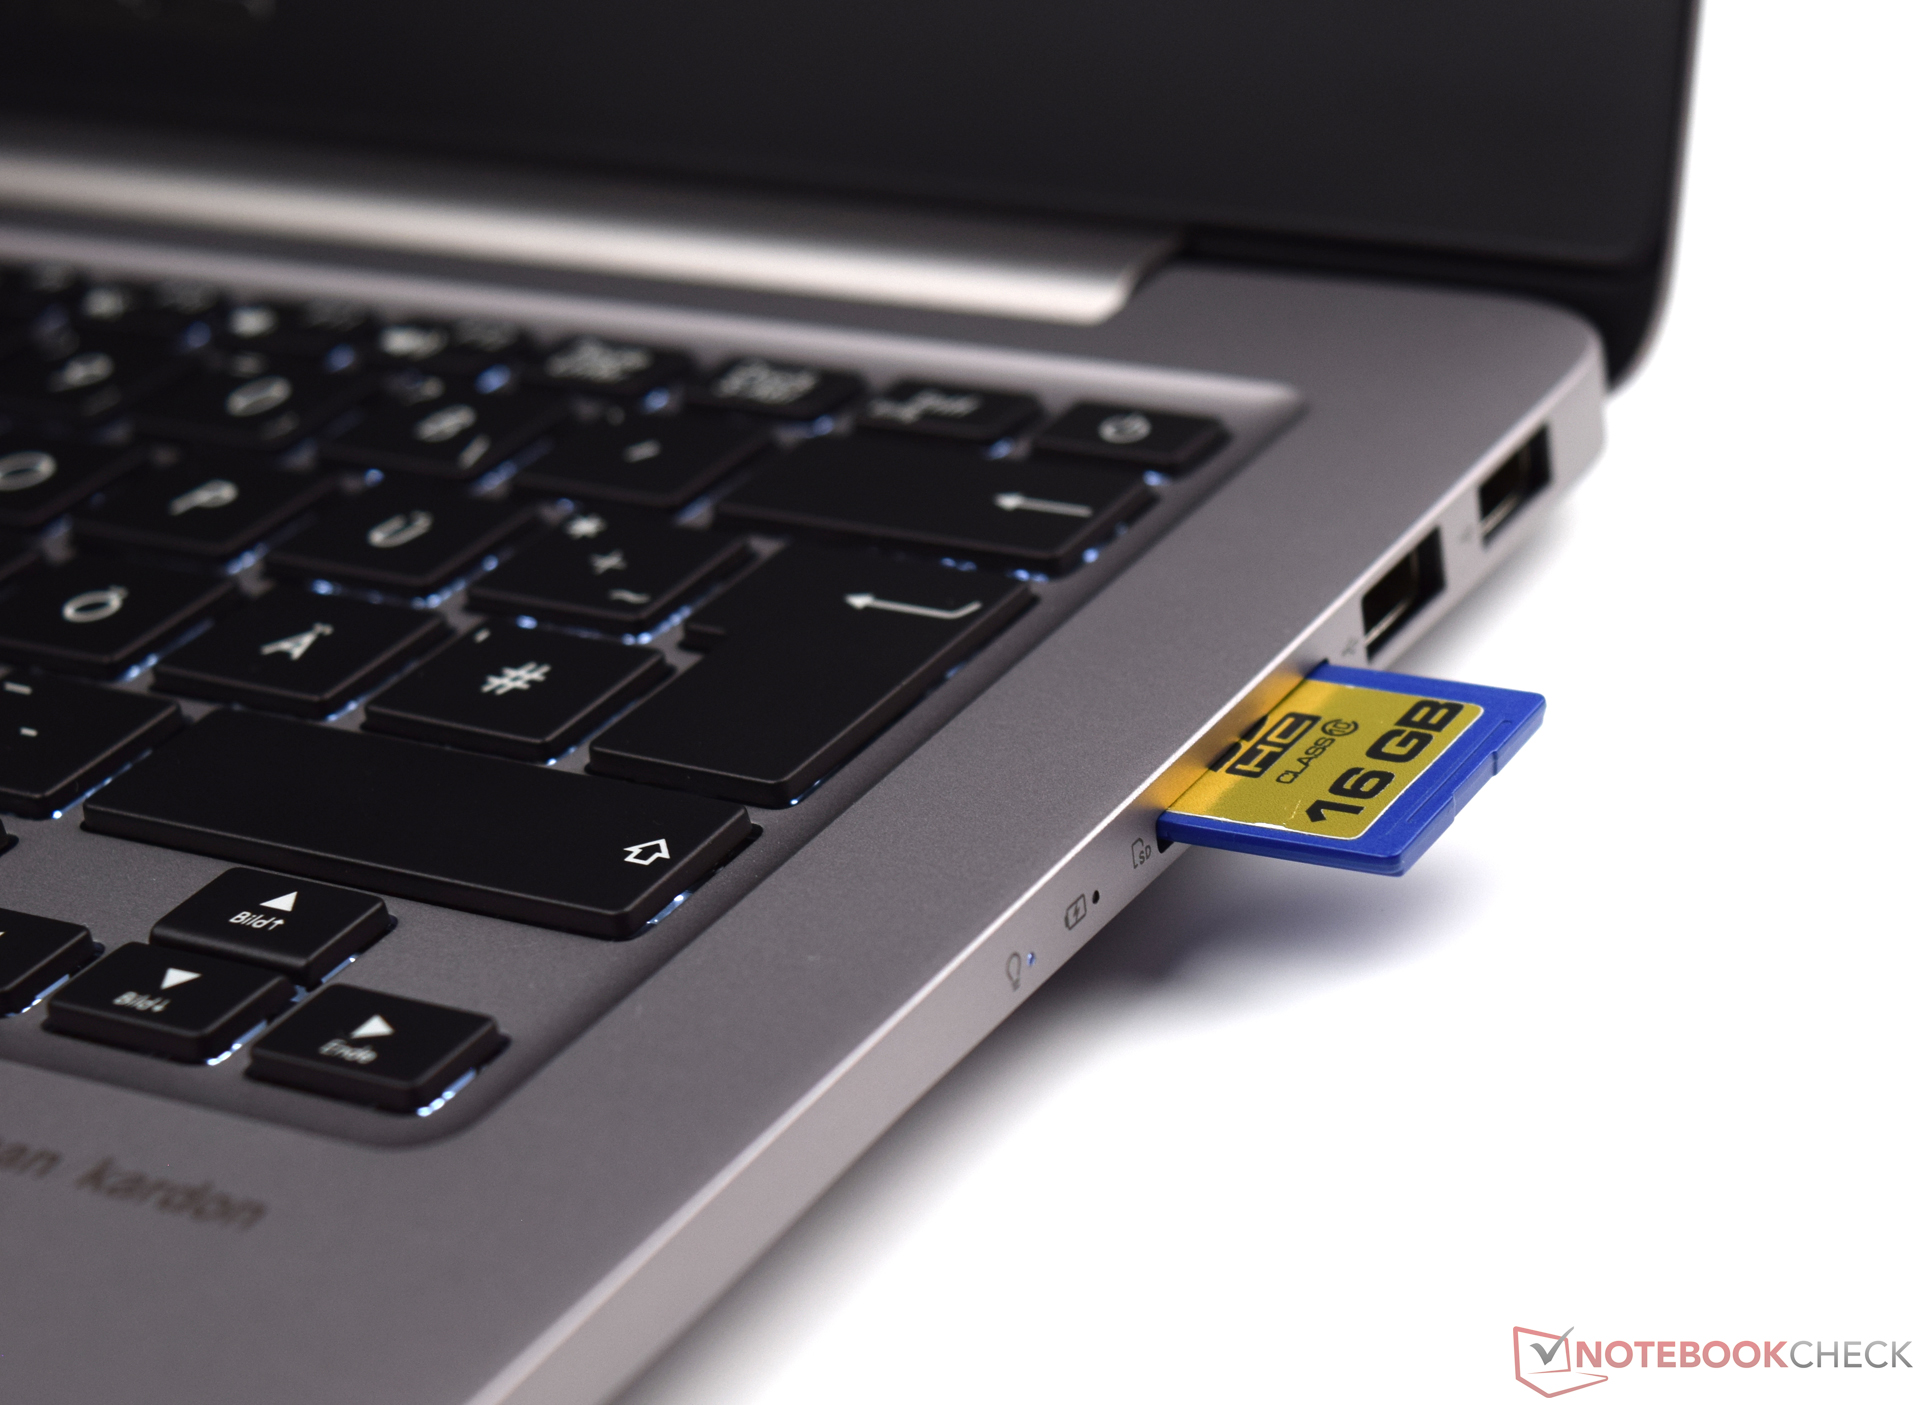
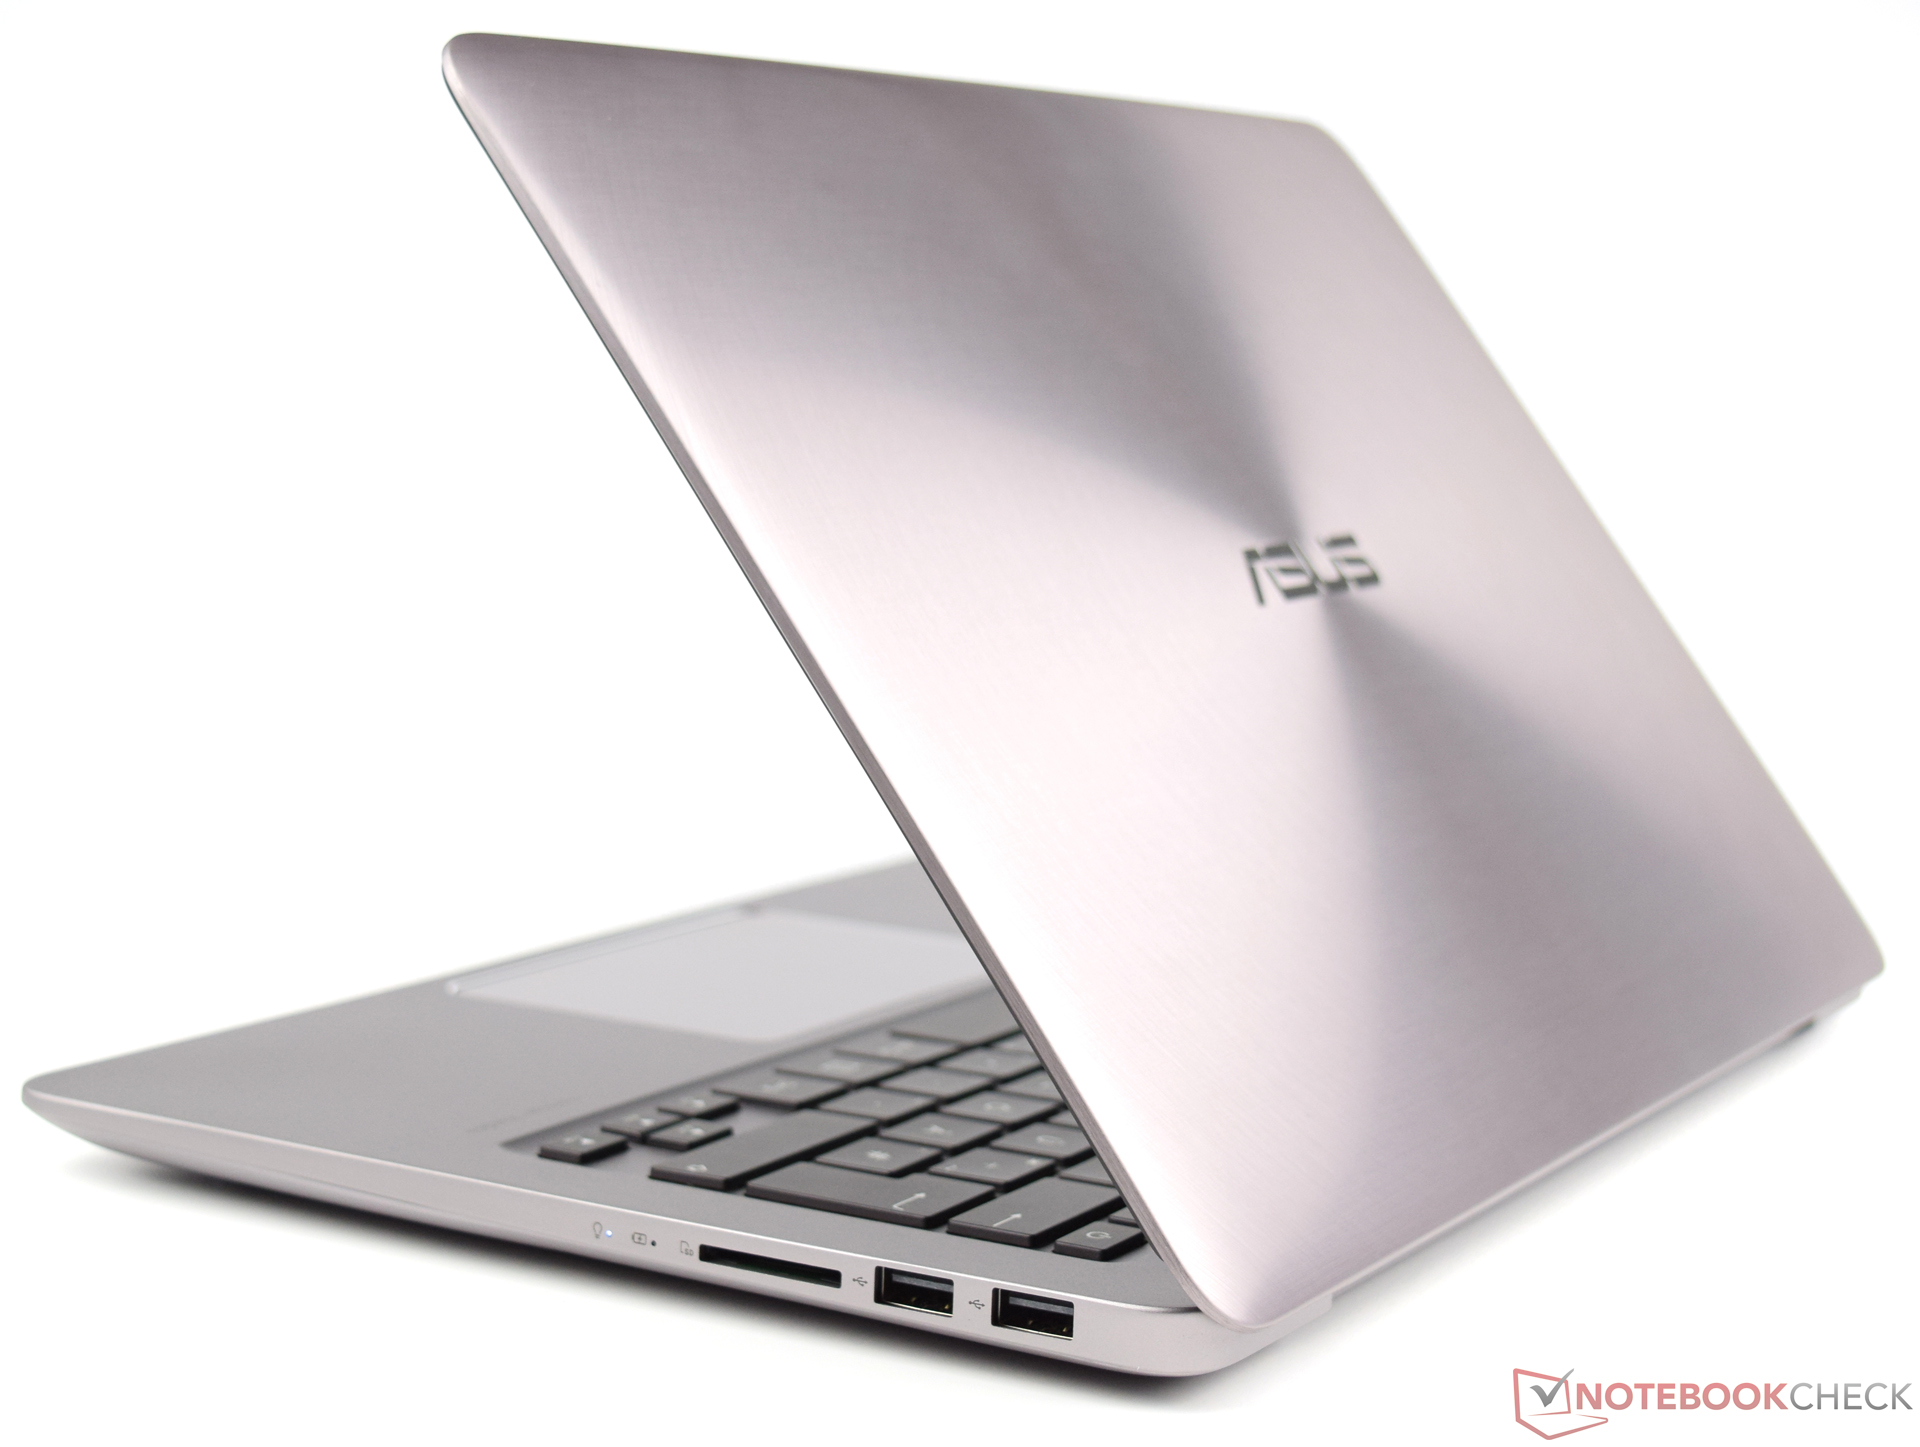
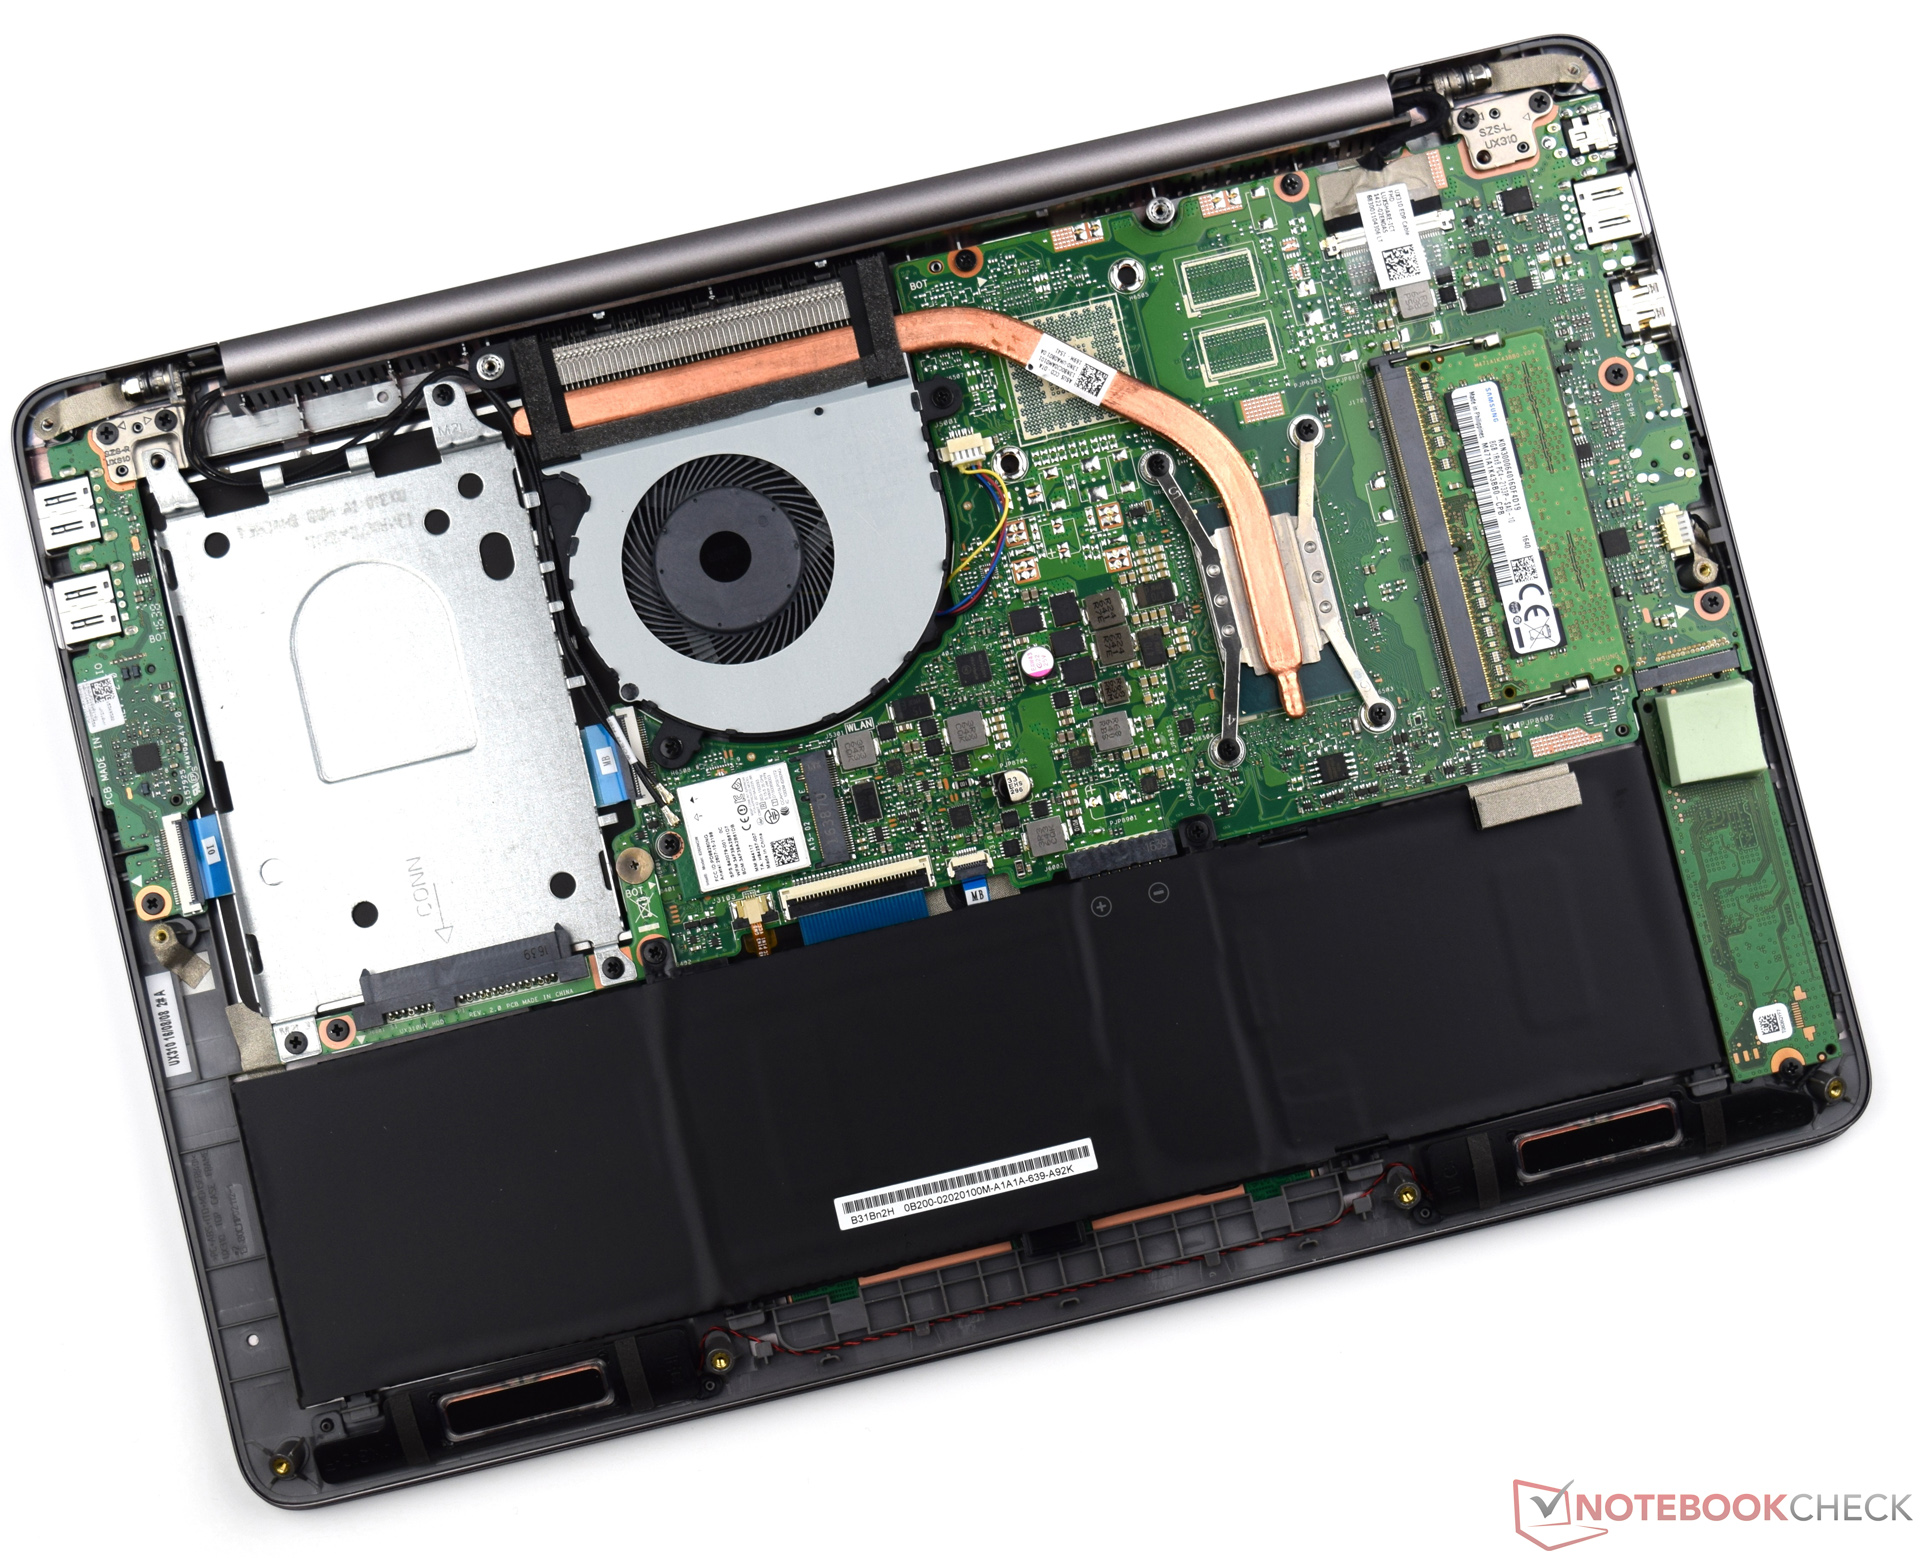
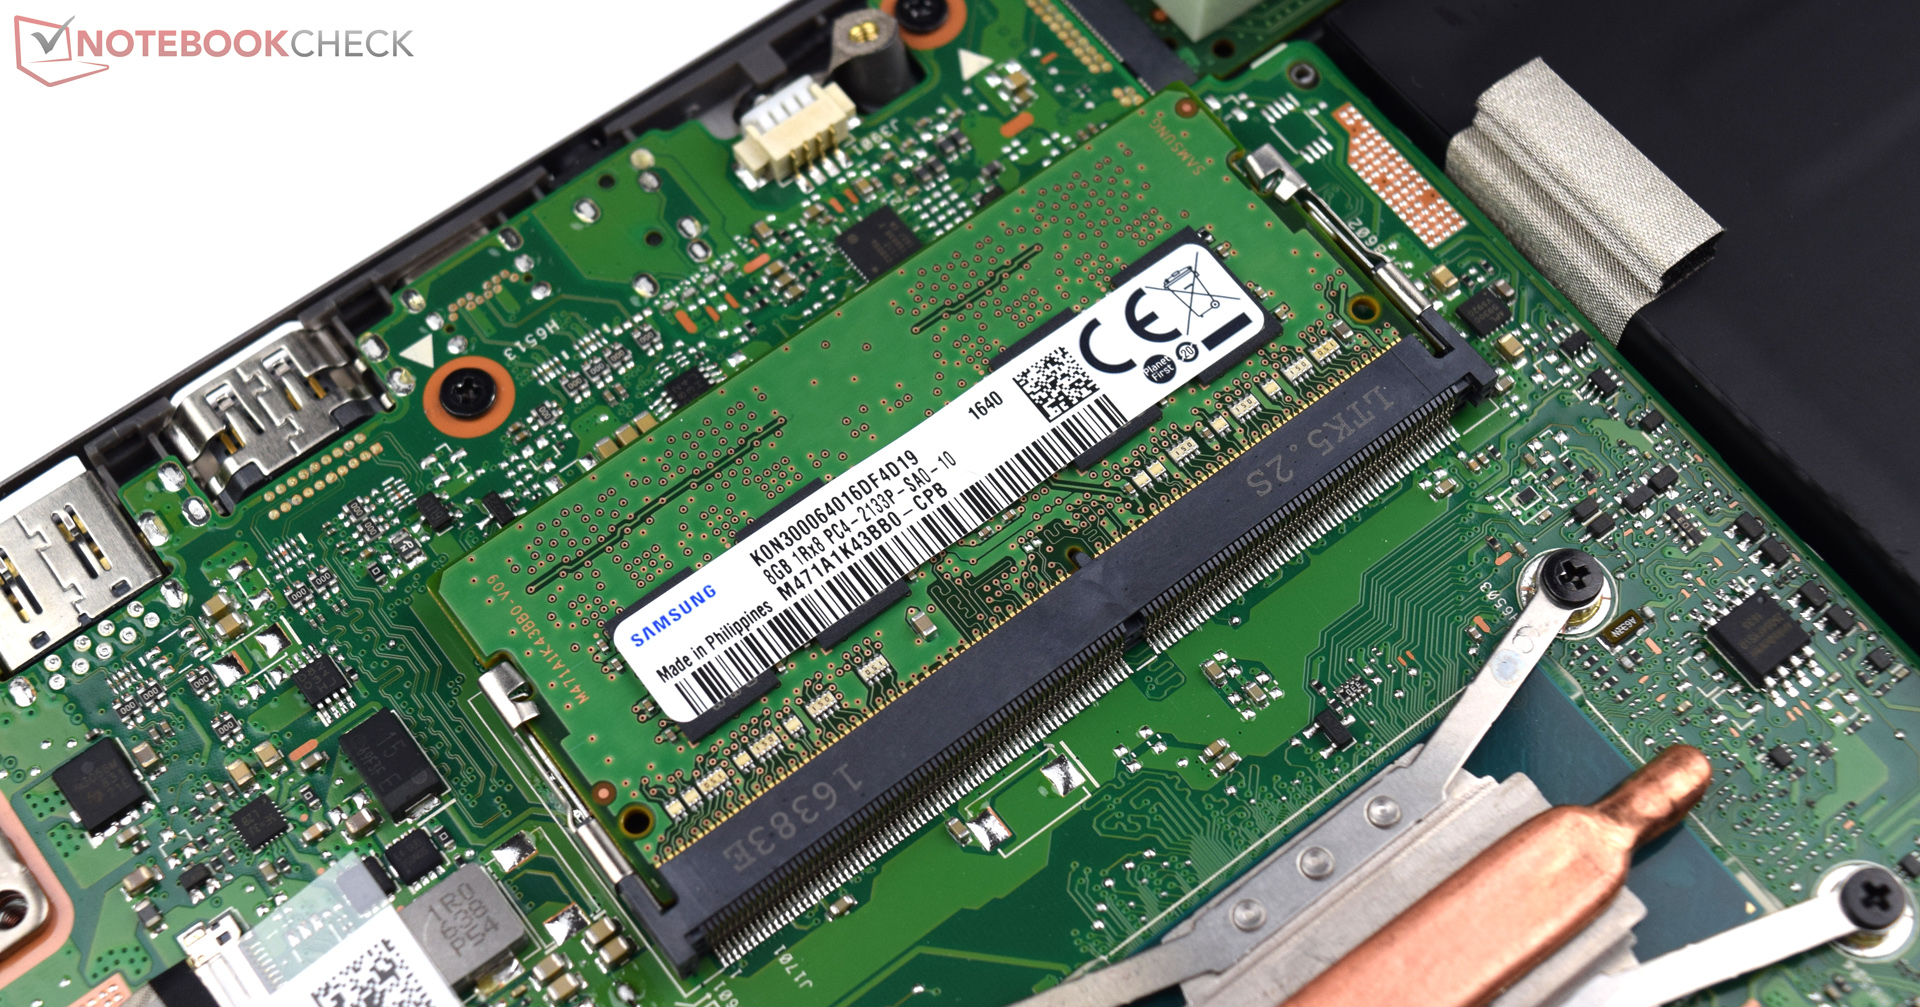
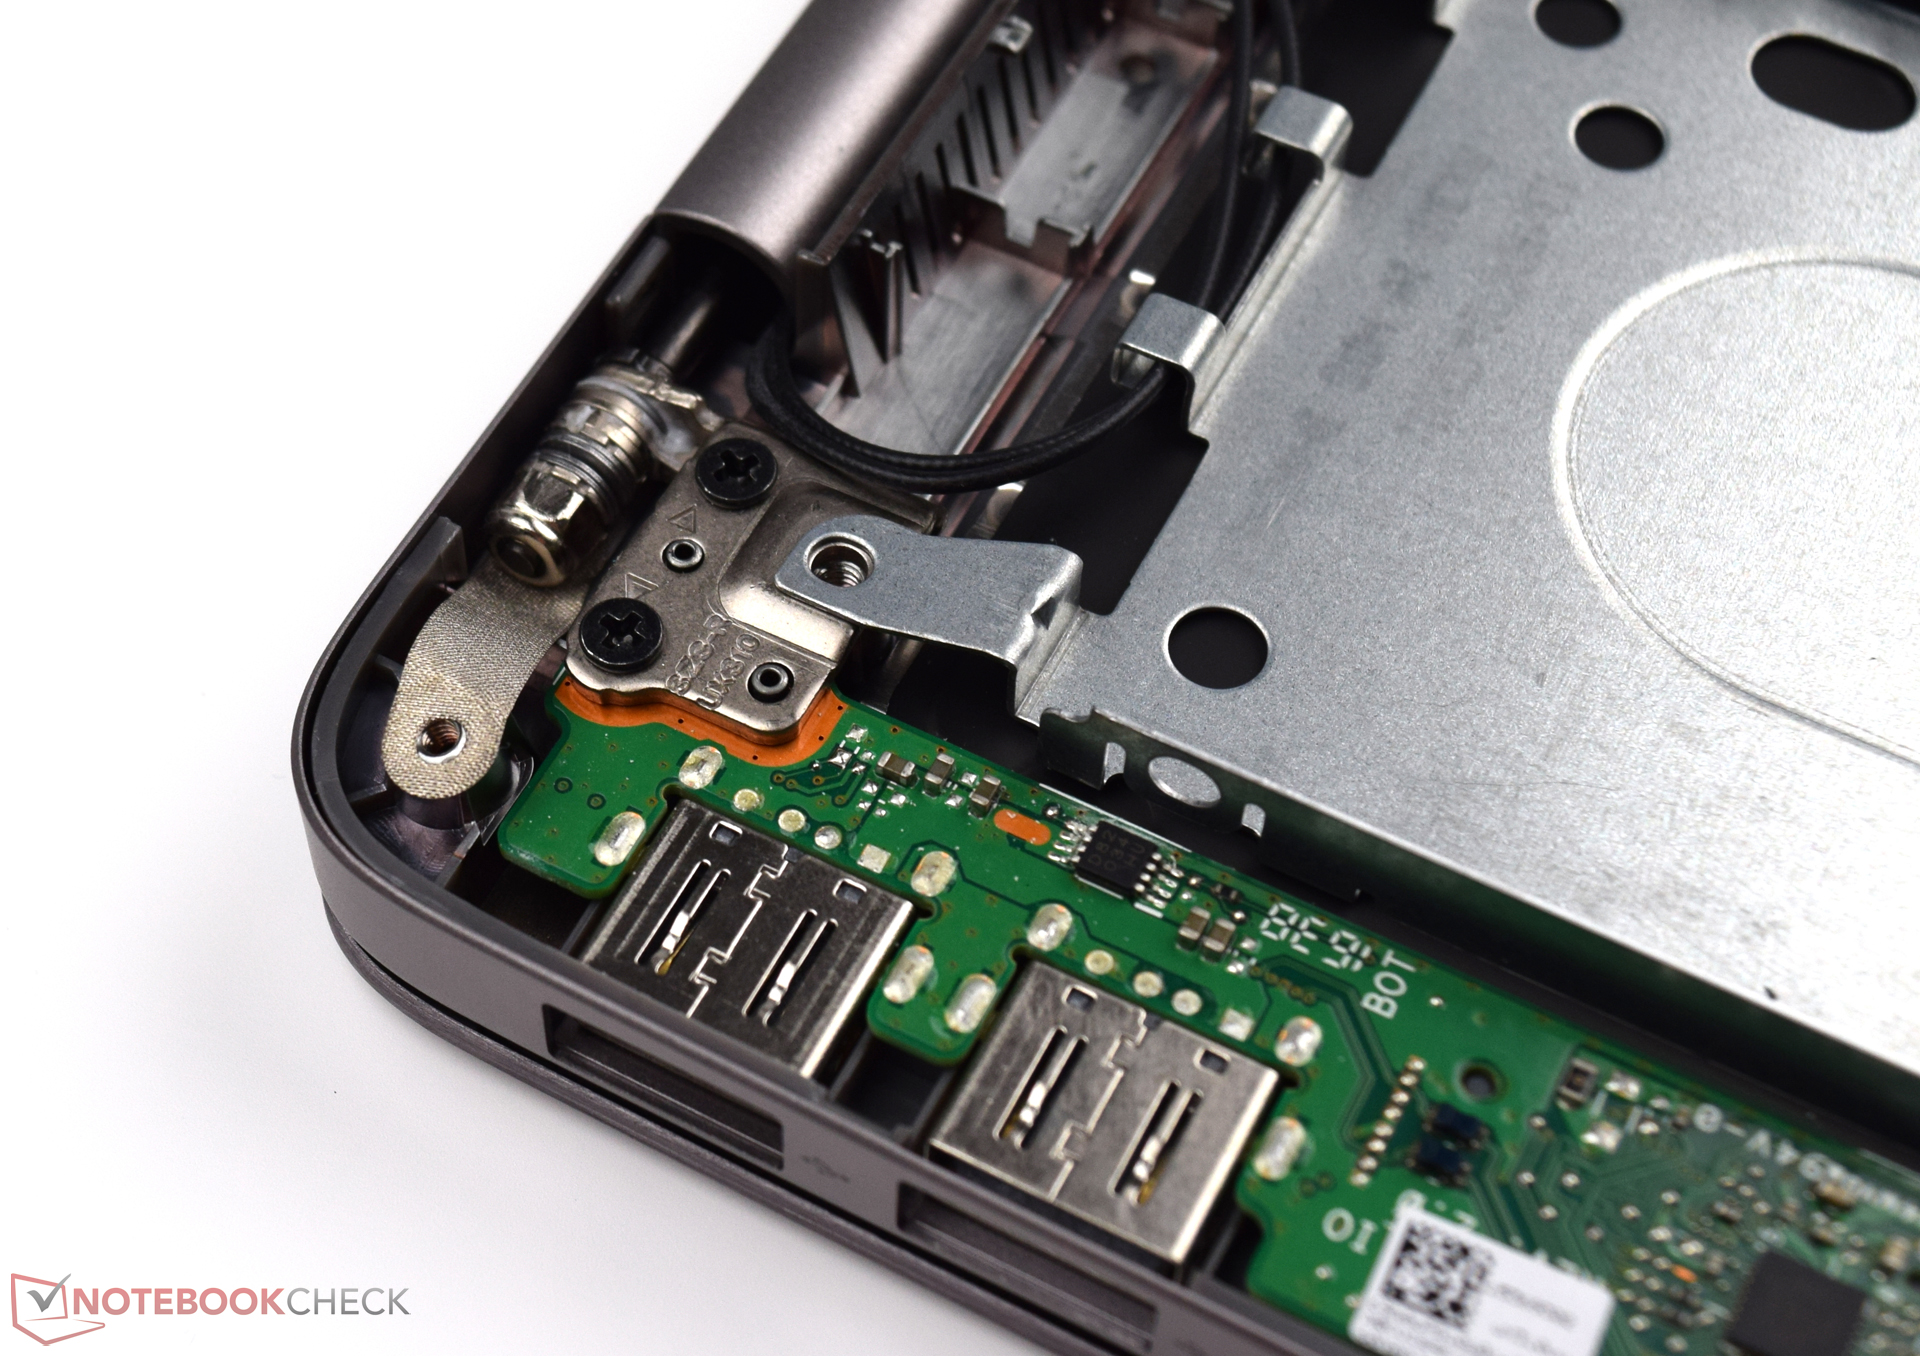
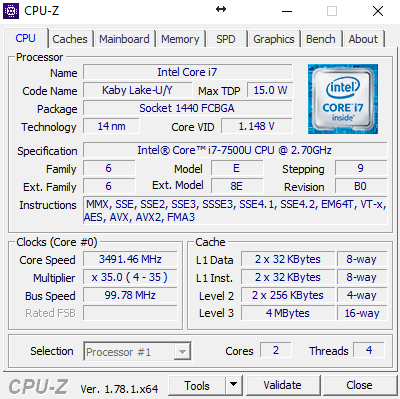
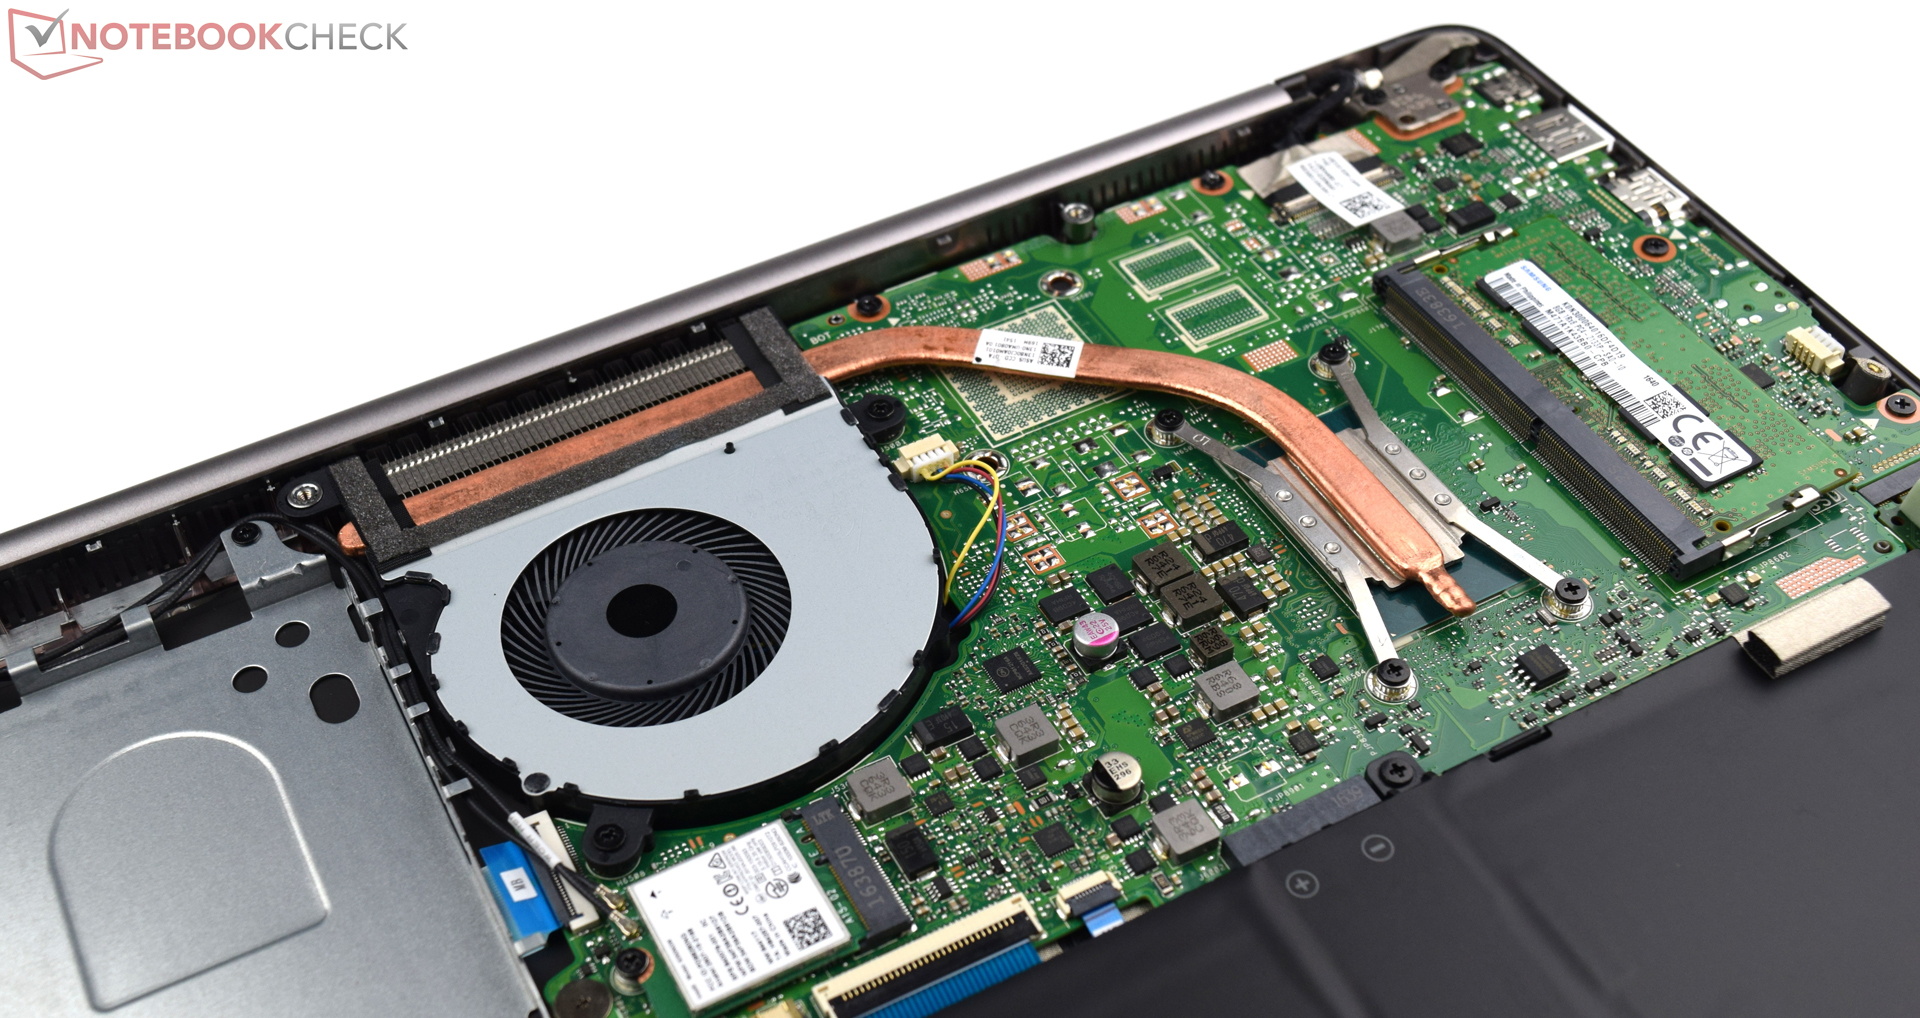
华硕ZenBook UX310UA-FC347T是一台设计优雅的笔记本电脑,它凭借出色的工艺品质得到了十分不错的分数。重量仅1.4千克的这台设备在同类产品中相比十分轻盈,但却不乏坚固度。它的系统能够完全利用英特尔酷睿 i7-7500U处理器的性能。它的存储空间相对有限,不过256GB的固态硬盘算是个很好的开始,用户可以使用它的空闲2.5寸硬盘插槽进行扩展。尽管它没有搭配独立显卡,但这并不是太大的问题,因为英特尔 HD Graphics 620集成显卡的性能可以很好满足这类设备的通常用途所需。
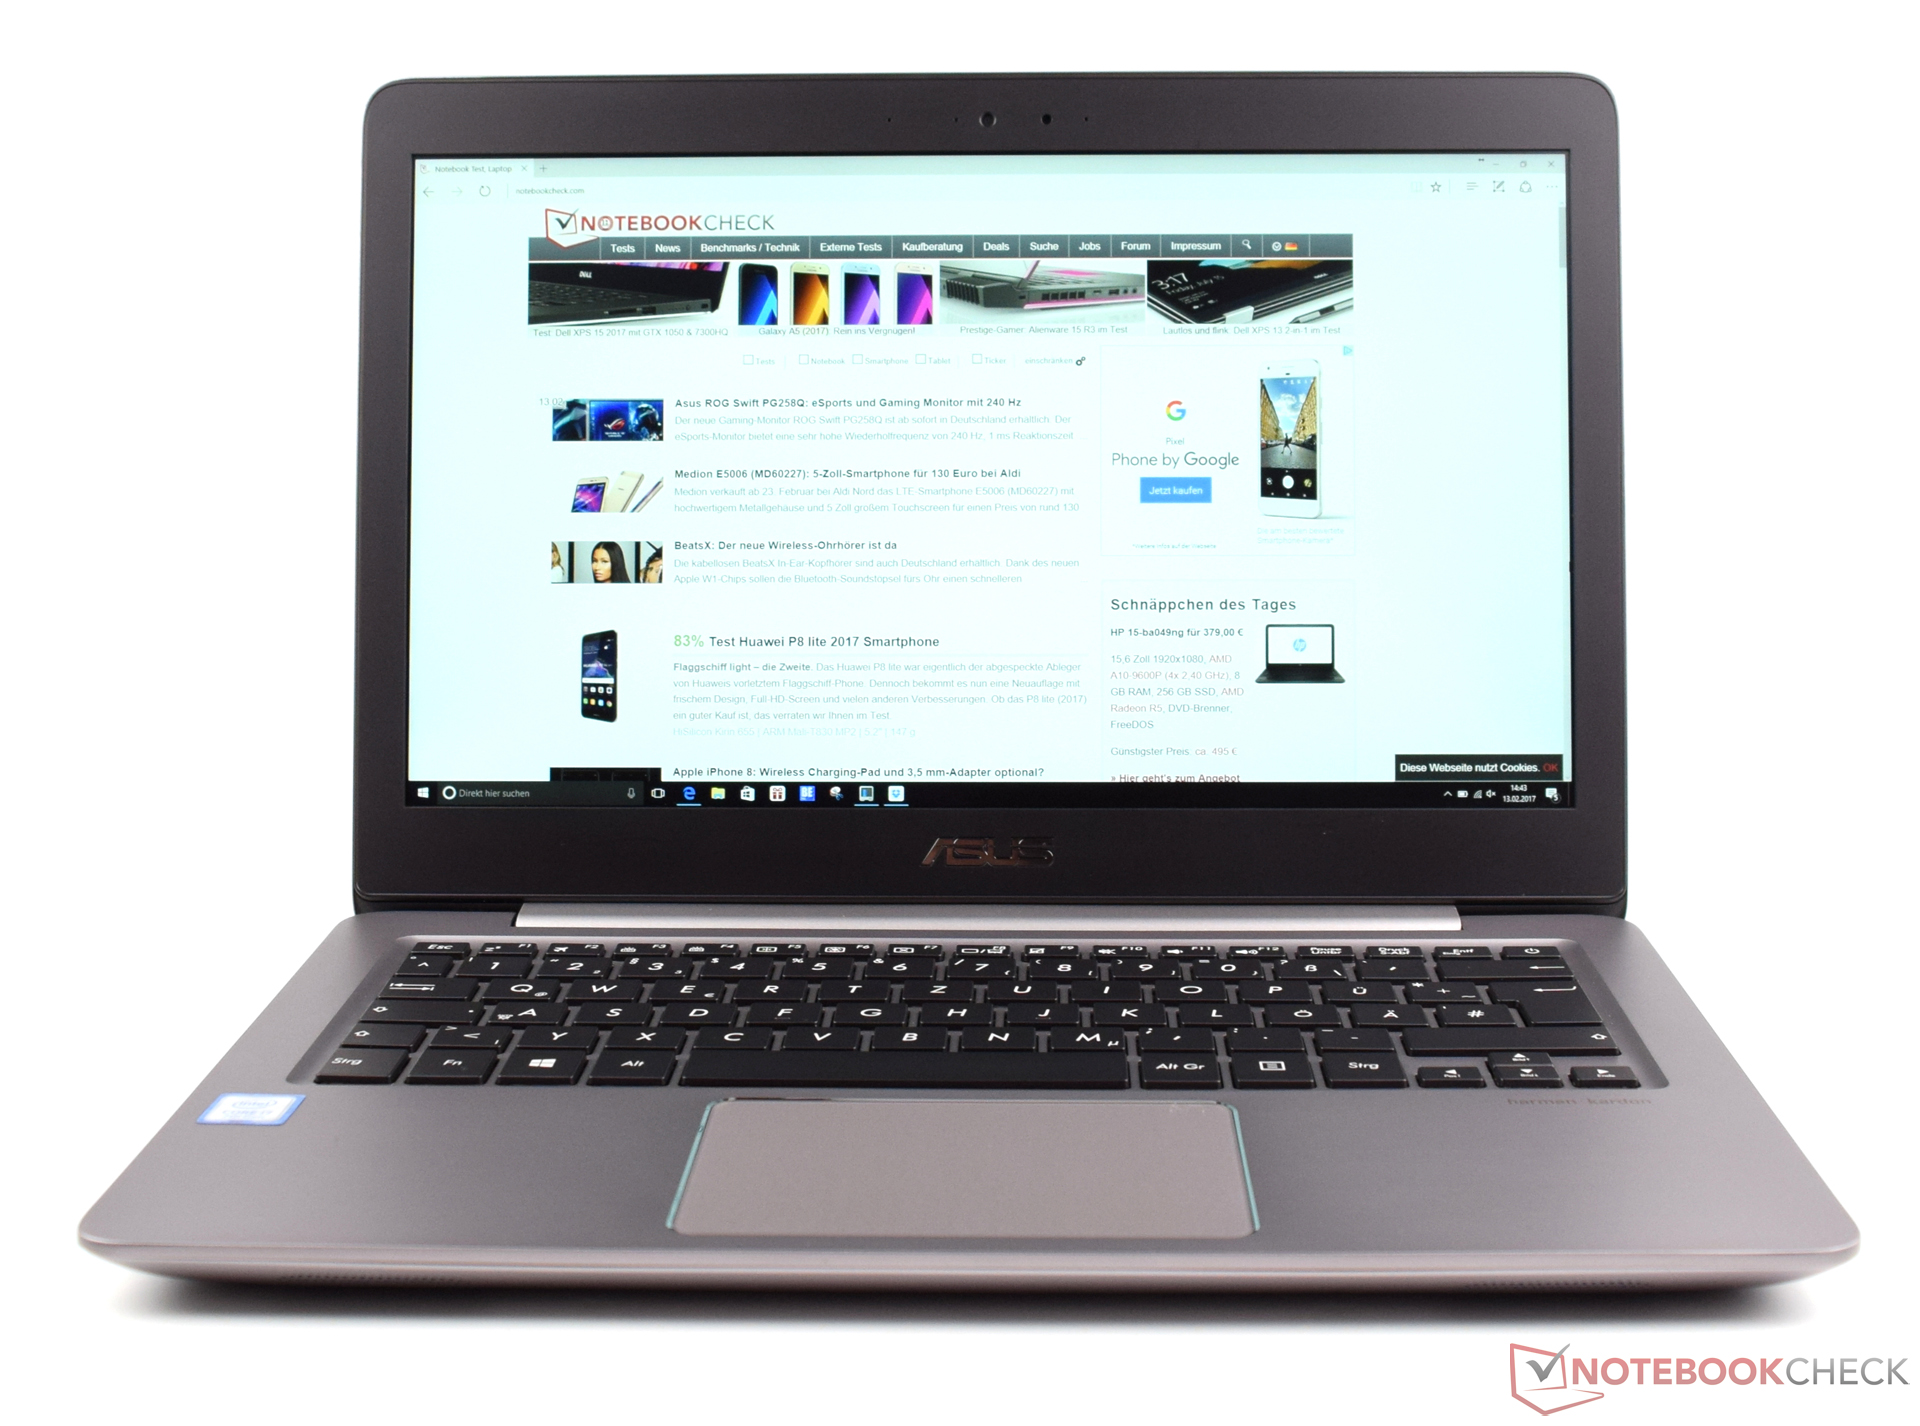
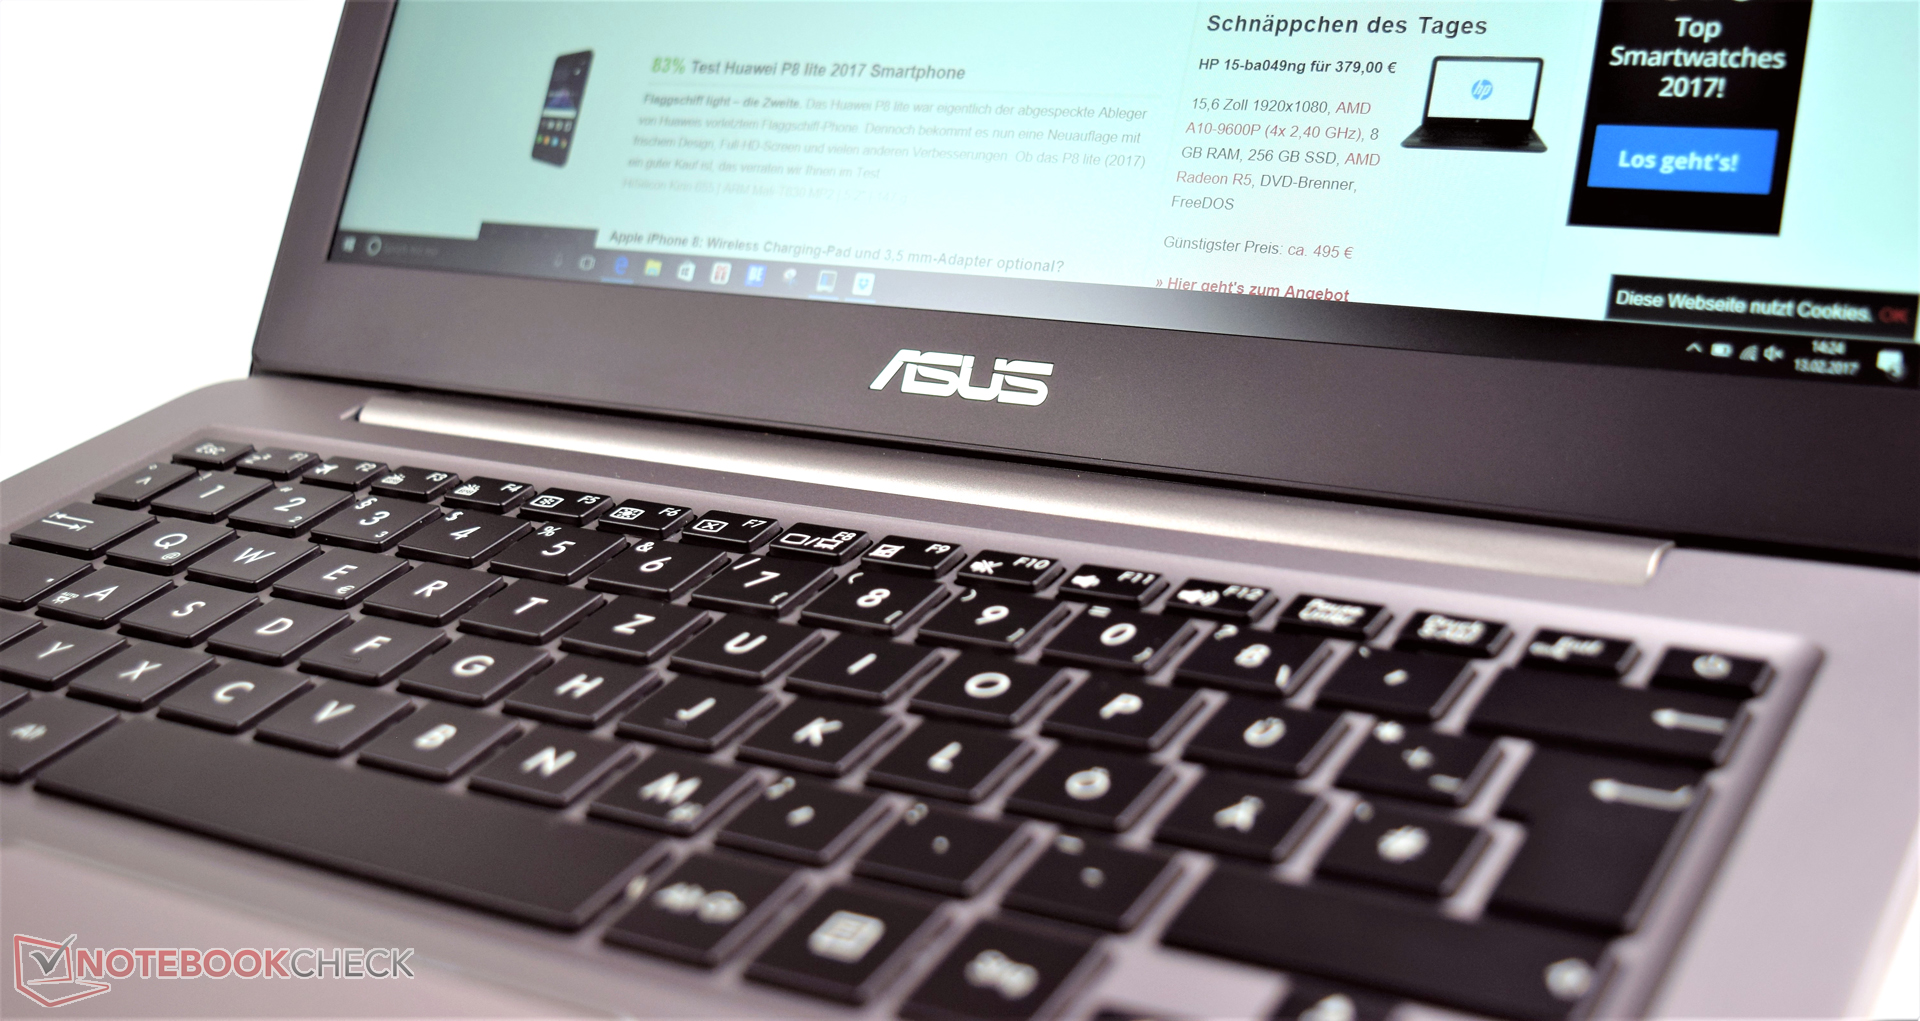
设计经典、工艺精湛的华硕UX310UA-FC347T是一台难得一见的设备。它几乎没有任何弱点,我们认为华硕ZenBook UX310UA-FC347T将会为选择它的用户将带来很长的产品寿命和很好的使用体验。这台ZenBook的优秀输入设备和高品质屏幕也十分引人注目。
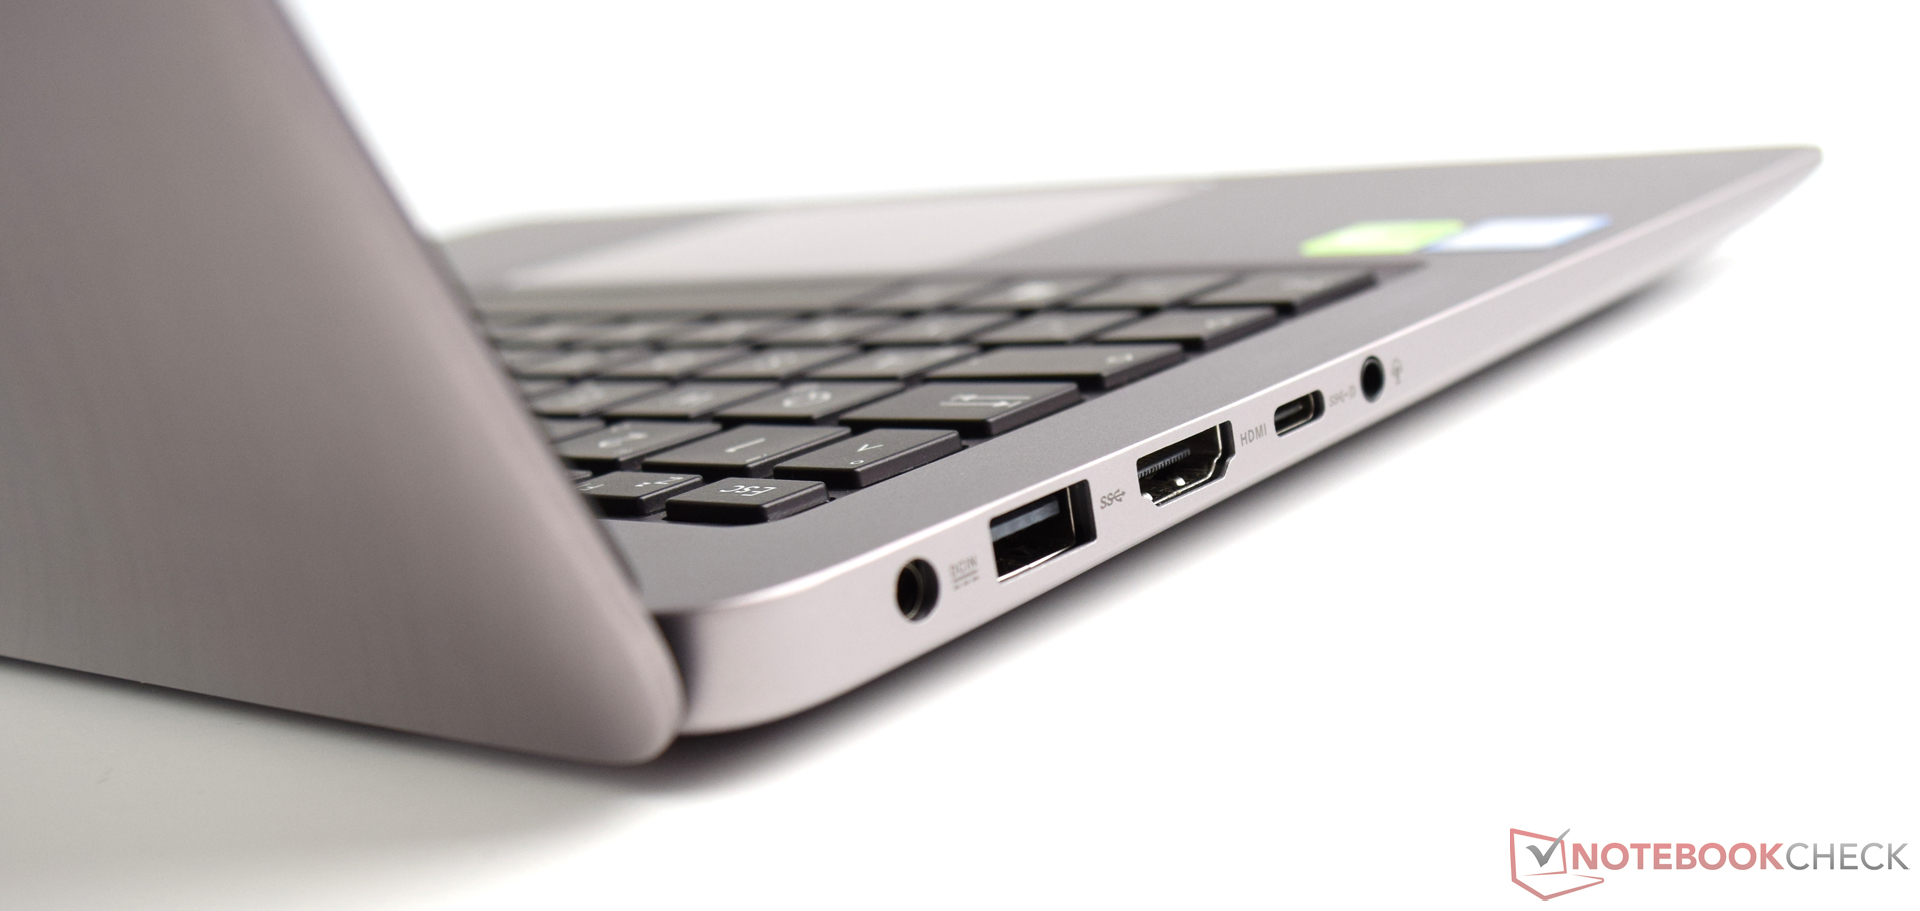
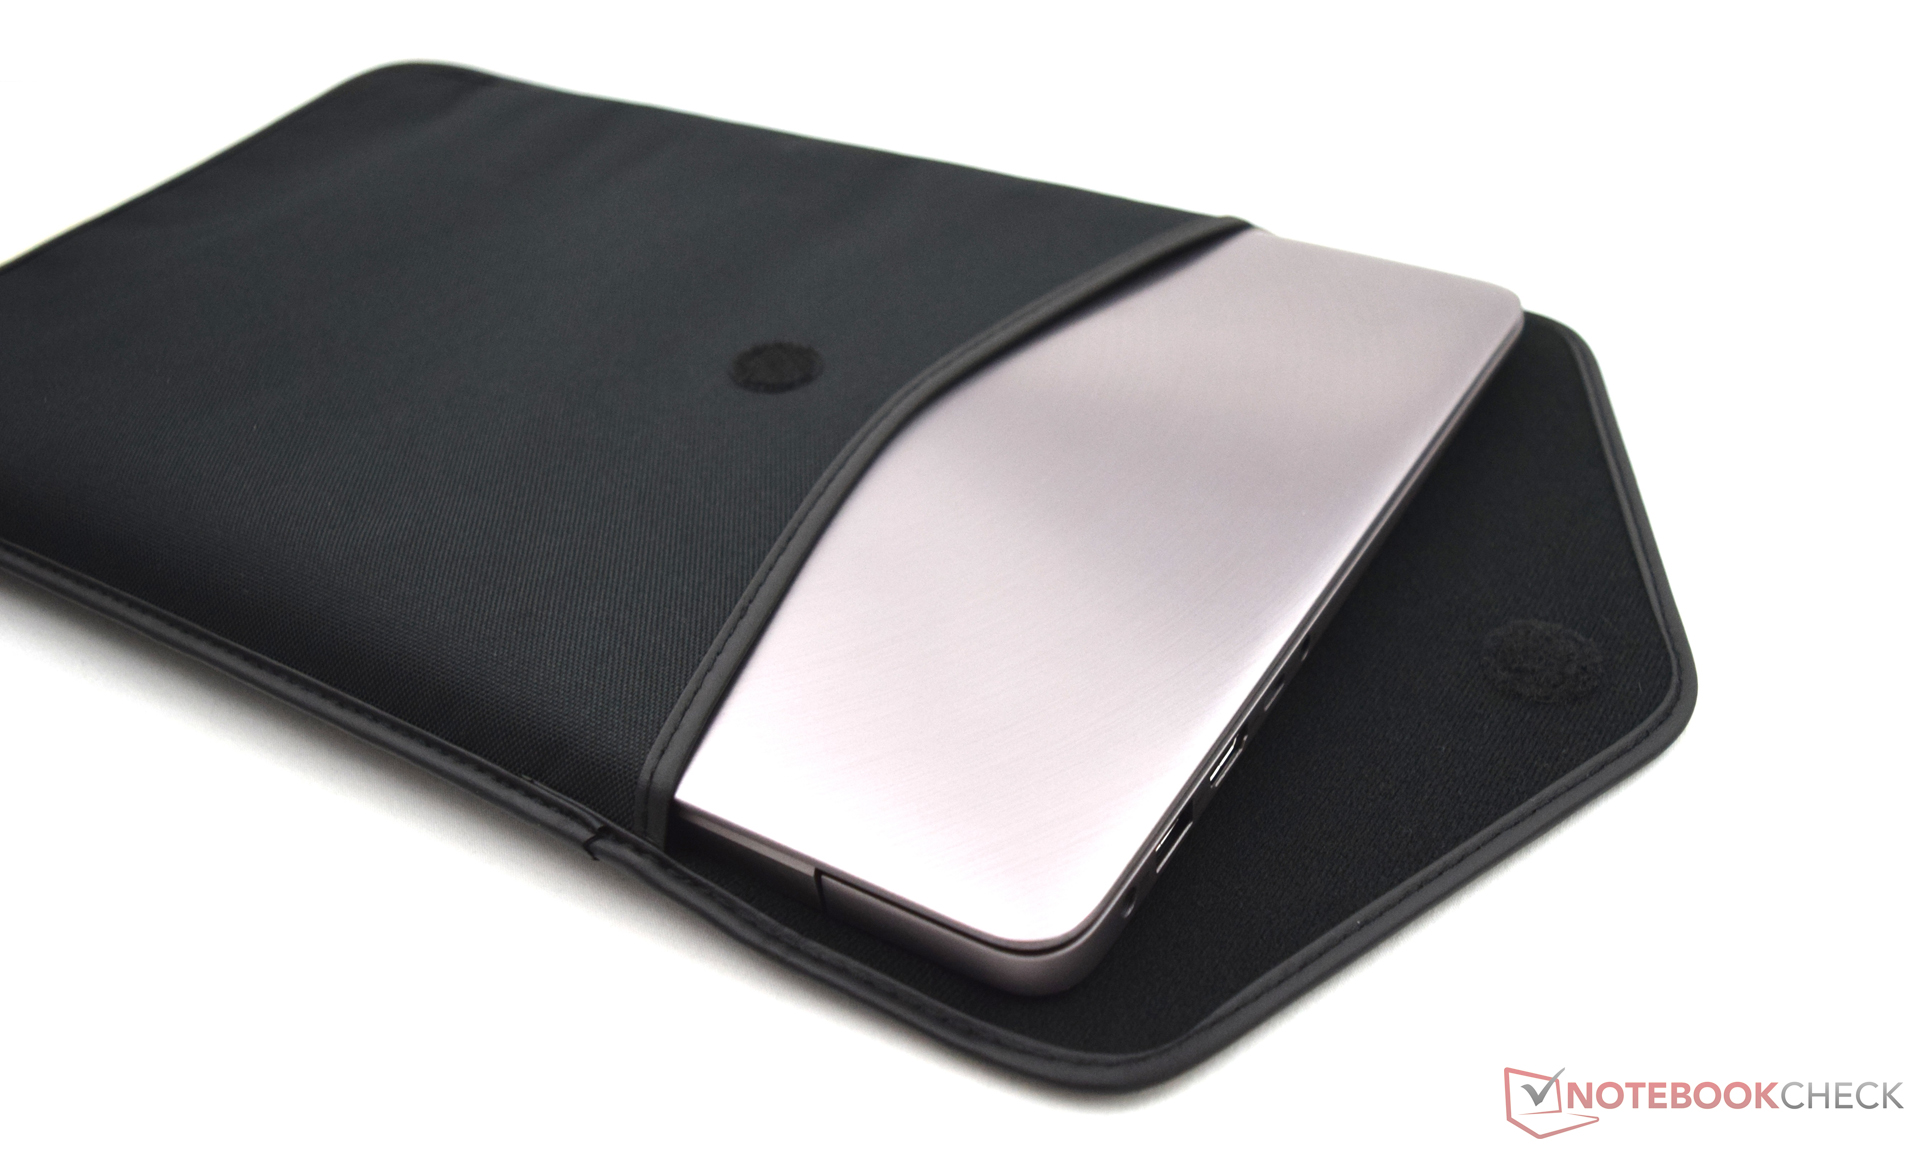
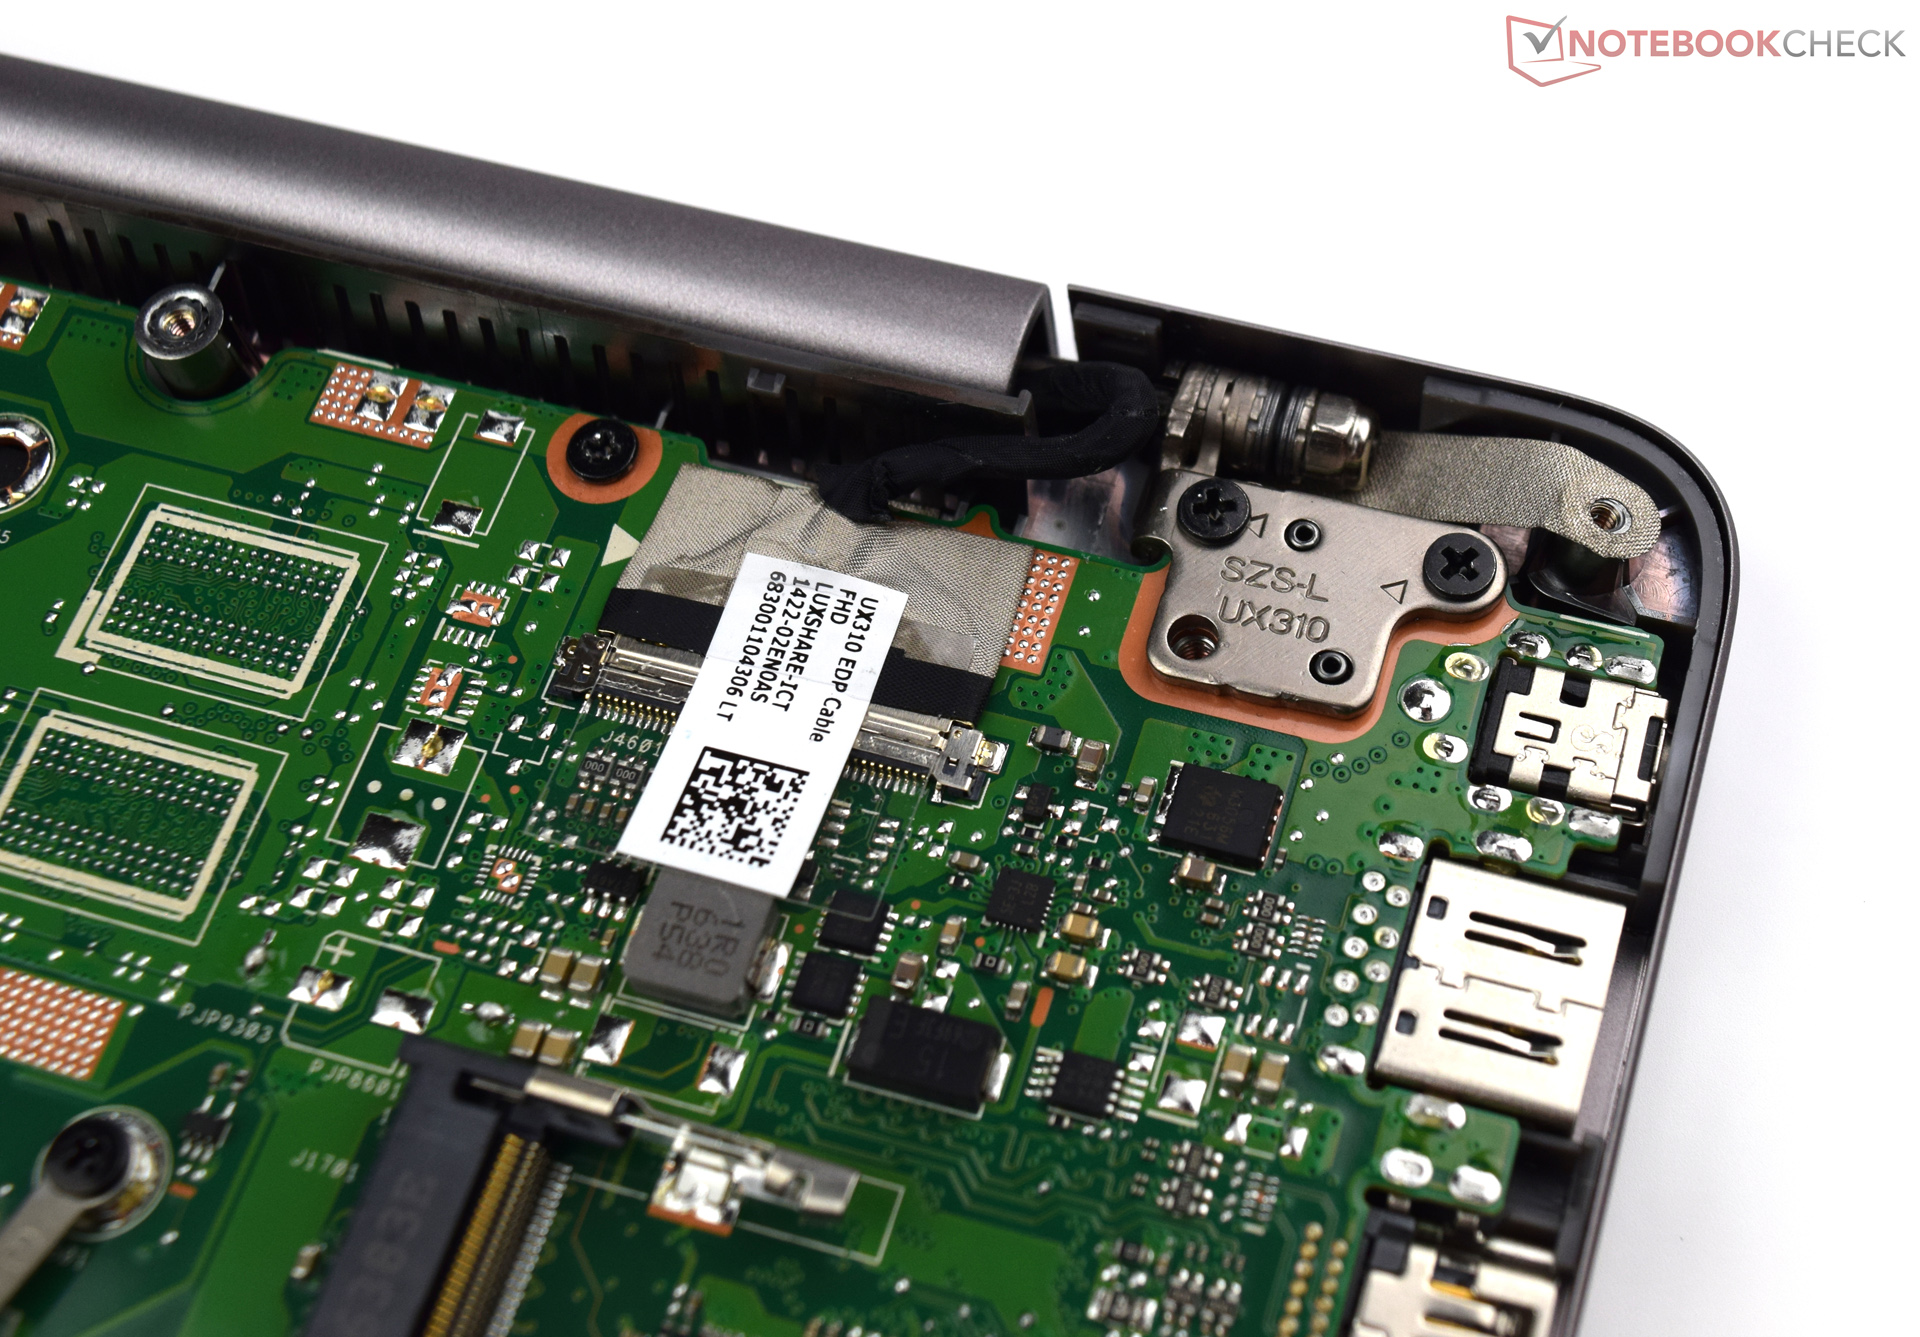
同样值得一提的还有华硕ZenBook UX310UA-FC347T亚笔记本电脑非常优秀的电池续航和相对强劲的性能表现。生产商在连接性上也下足了功夫,归功于对USB-C的支持,这台笔记本也可以与未来的设备兼容。出于这些原因,它999欧元(约7424人民币)的价位十分合理。作为一个小赠品,这台测试机还随机搭配了一个保护套,可以帮助用户在出行时对它提供保护。
注:本文是基于完整评测的缩减版本,阅读完整的英文评测,请点击这里。
Asus Zenbook UX310UA-FC347T iGP
- 02/24/2017 v6 (old)
Sebastian Bade