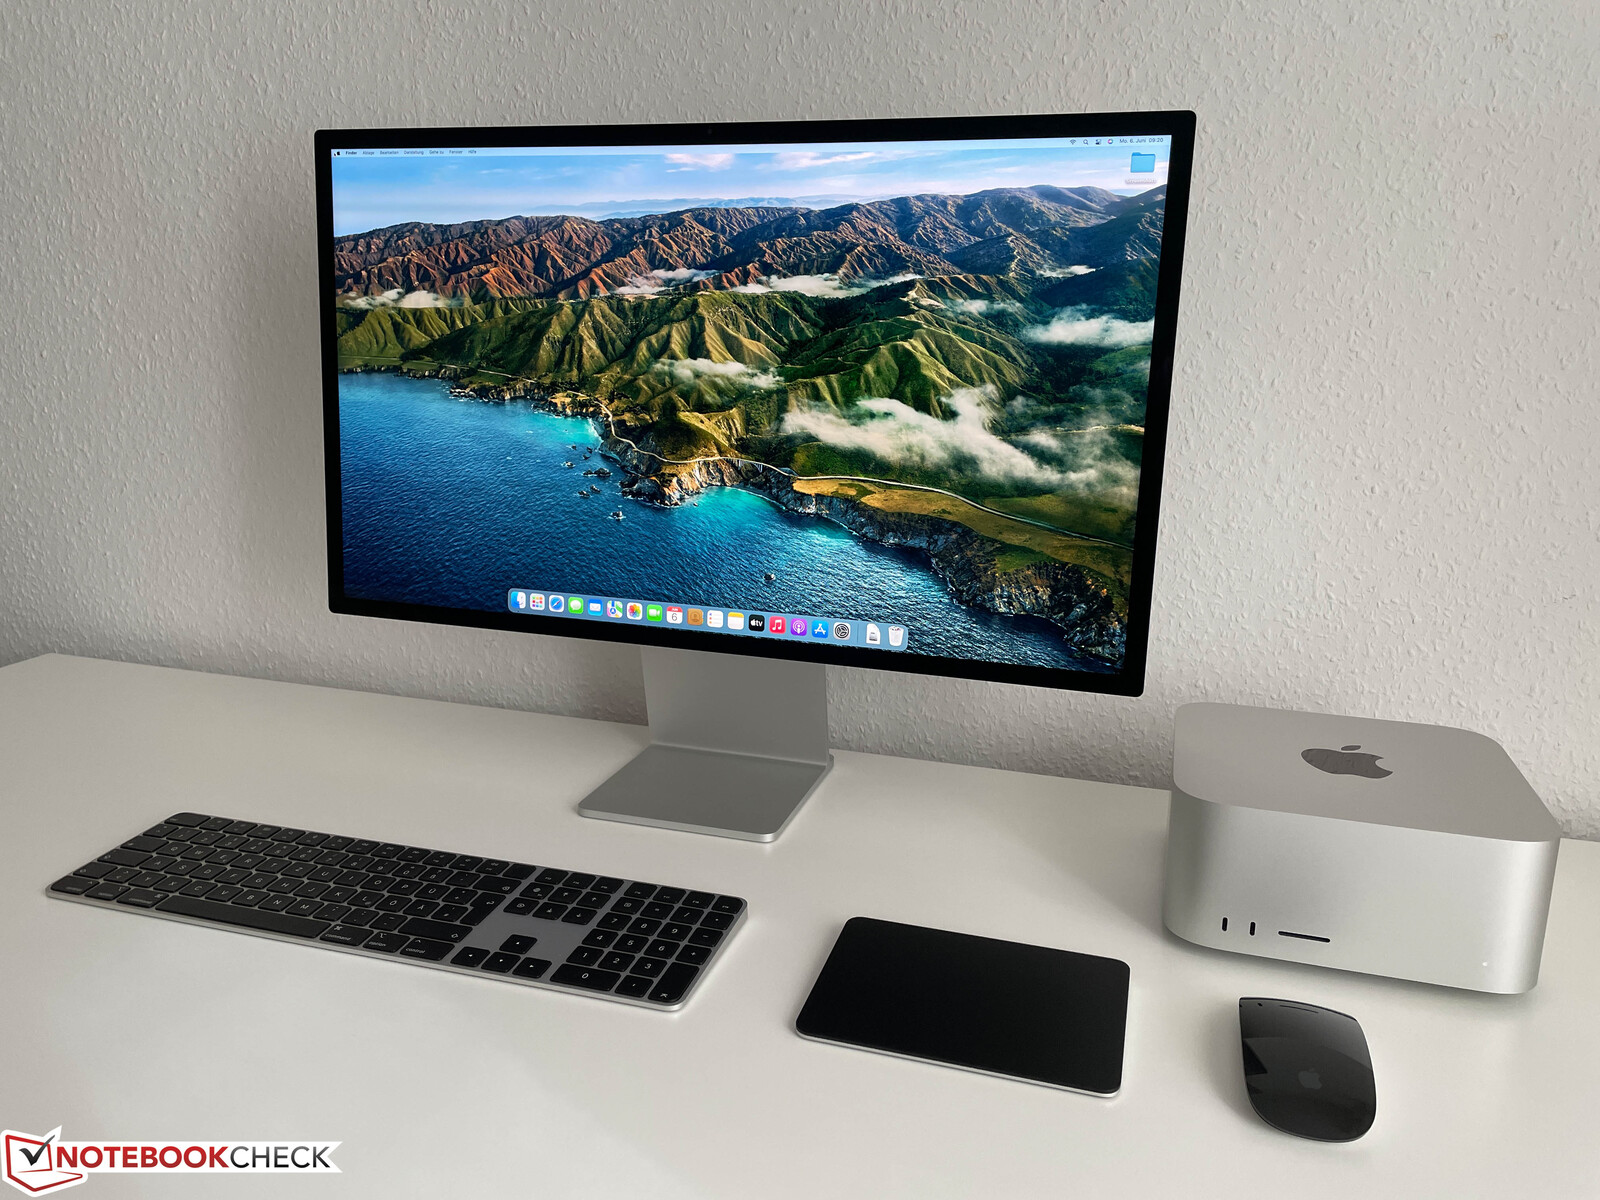
Apple Mac Studio 2022 M1 Max和Studio Display的回顾。内容创作者的完美组合?
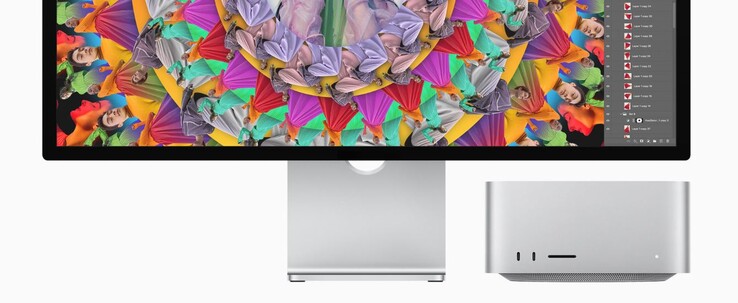
Mac Studio是Apple ,是最新的台式电脑,与目前的 Mac Mini一样,制造商选择了其内部的M1处理器,但在这种情况下,我们有强大的M1 Max版本或新的M1 Ultra,它实际上结合了两个M1 Max芯片。我们的Mac Studio评测单元配备了M1 Max,包括32个GPU核心,64GB共享内存,以及2TB PCIe 4.0固态硬盘;Apple ,该配置收费3679欧元(约3842美元)(不包括输入设备)。作为比较。一台拥有相同硬件和迷你LED面板的MacBook Pro 16价格约为4700欧元(约合4908美元)。
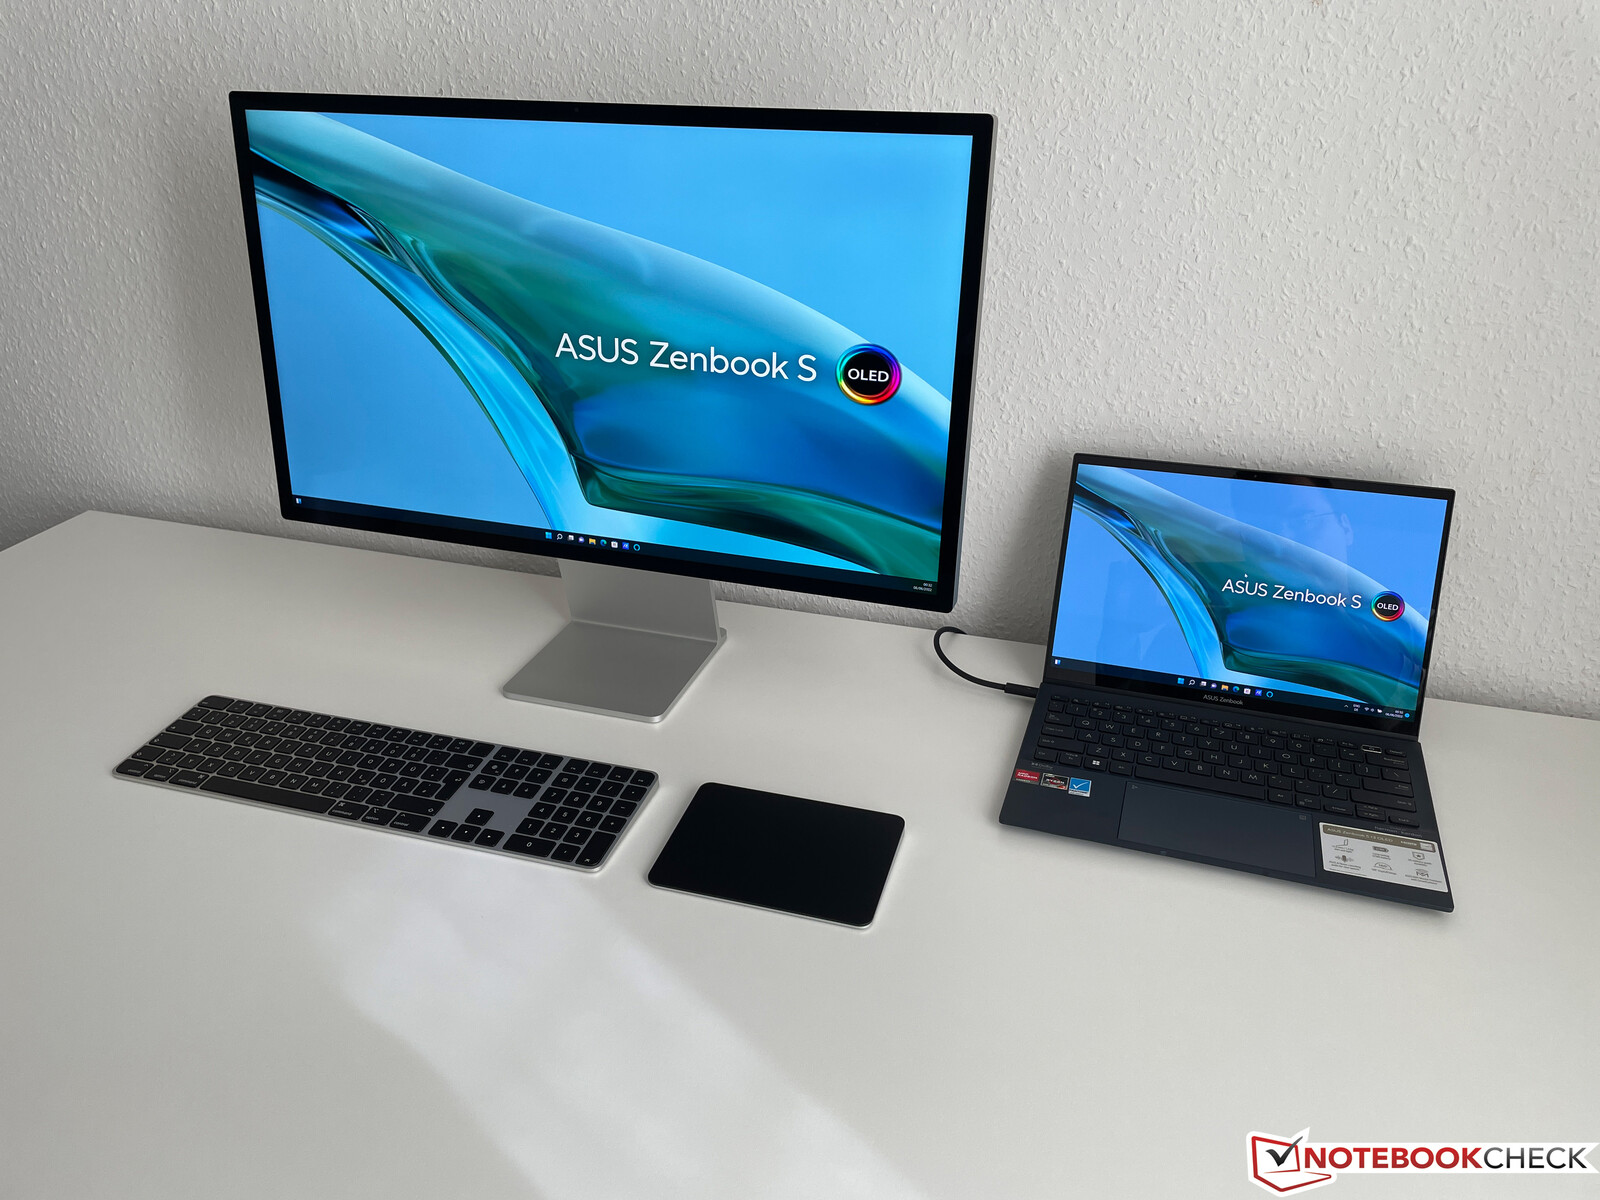
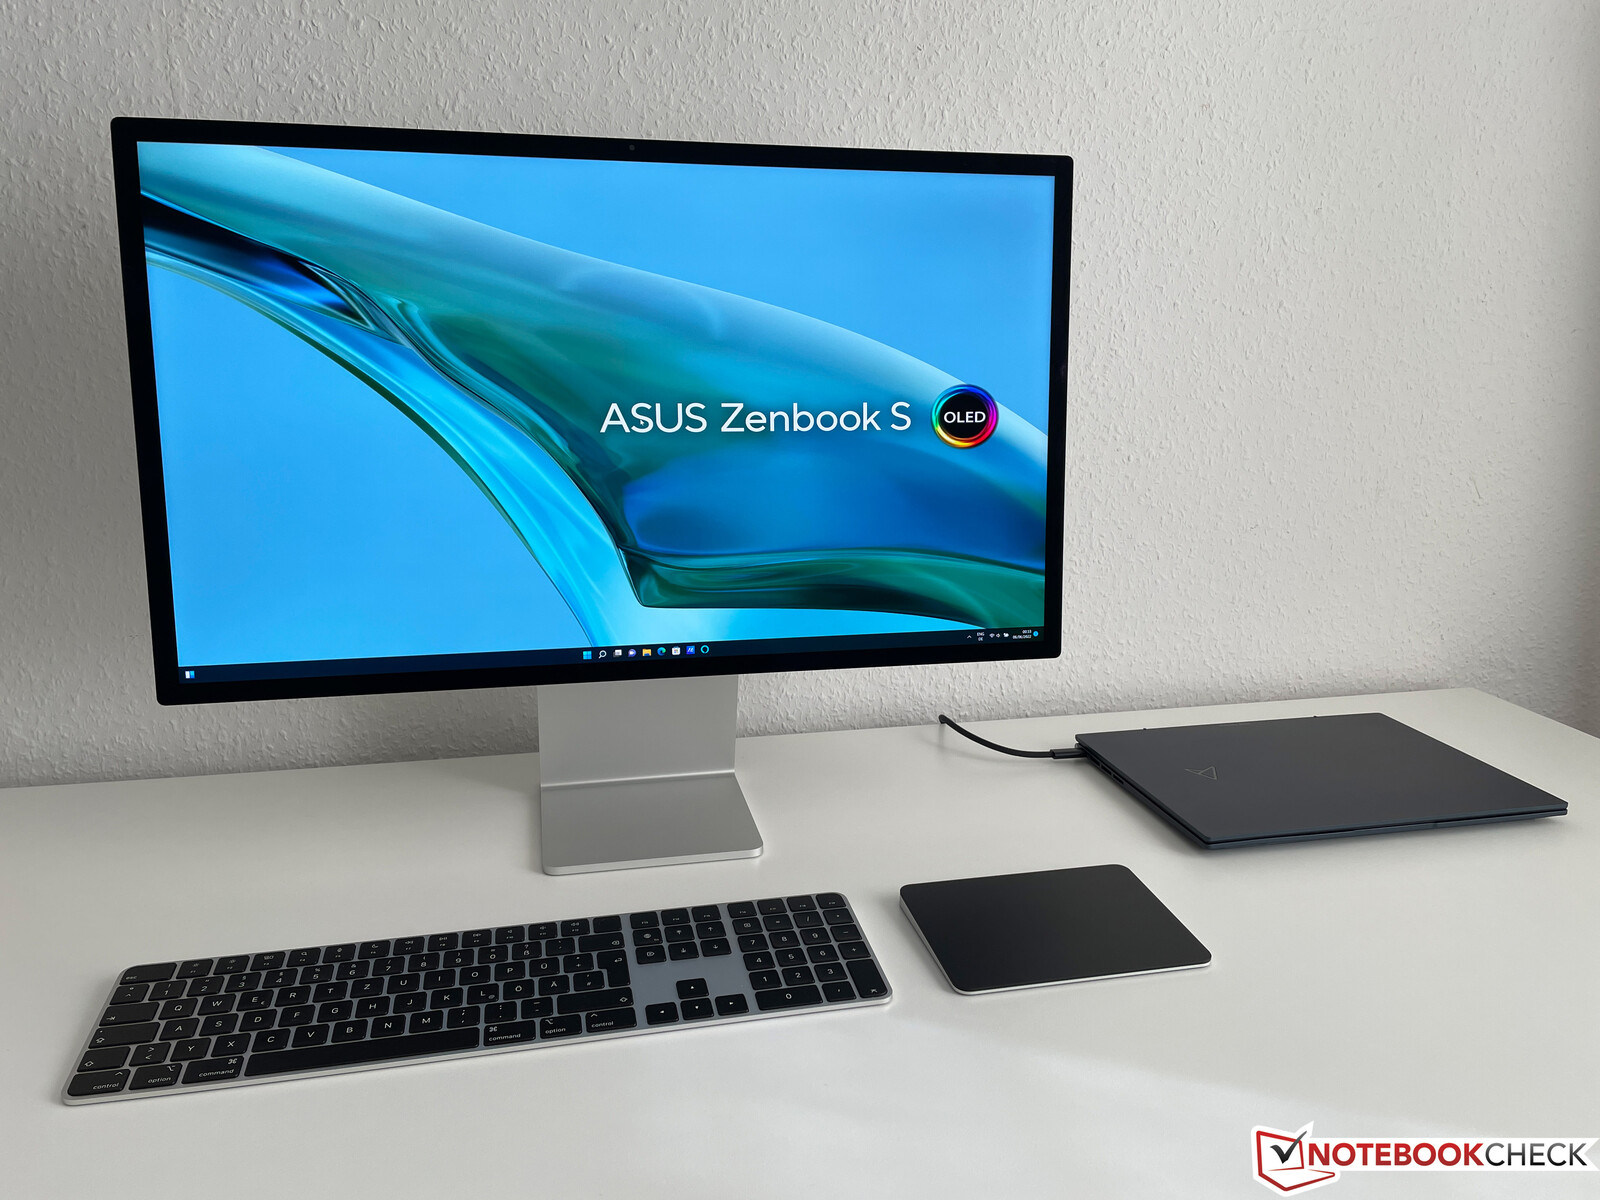
此外,我们还将审查新的Studio Display,Apple ,新的27英寸显示器具有5K分辨率和自己的 A13-SoC.该显示器提供了几个USB-C接口以及Thunderbolt接口,因此除了外围设备(鼠标、键盘、硬盘),你还可以通过Thunderbolt直接连接笔记本电脑,然后以高达96瓦的功率充电。这不仅适用于MacBooks,也适用于Windows笔记本电脑。我们评测的Studio Display型号是标准版,价格为1749欧元(约合人民币1827元);它配有普通的反射玻璃和可倾斜调节的支架。
由于我们很少评测台式电脑,Apple ,特别是MacBook Pro机型将不得不在此作为对比设备。在这一点上,我们也建议看看我们以前的评测文章,在那里我们几乎可以评测所有版本。
- Apple MacBook Pro 14 (M1 Pro 八核CPU, 14核GPU)
- Apple MacBook Pro 14 (M1 Max 10 核 CPU, 24 核 GPU)
- Apple MacBook Pro 16 (M1 Pro 10核CPU,16核GPU)
- Apple MacBook Pro 16 (M1 Max 10-core CPU, 16-core GPU)
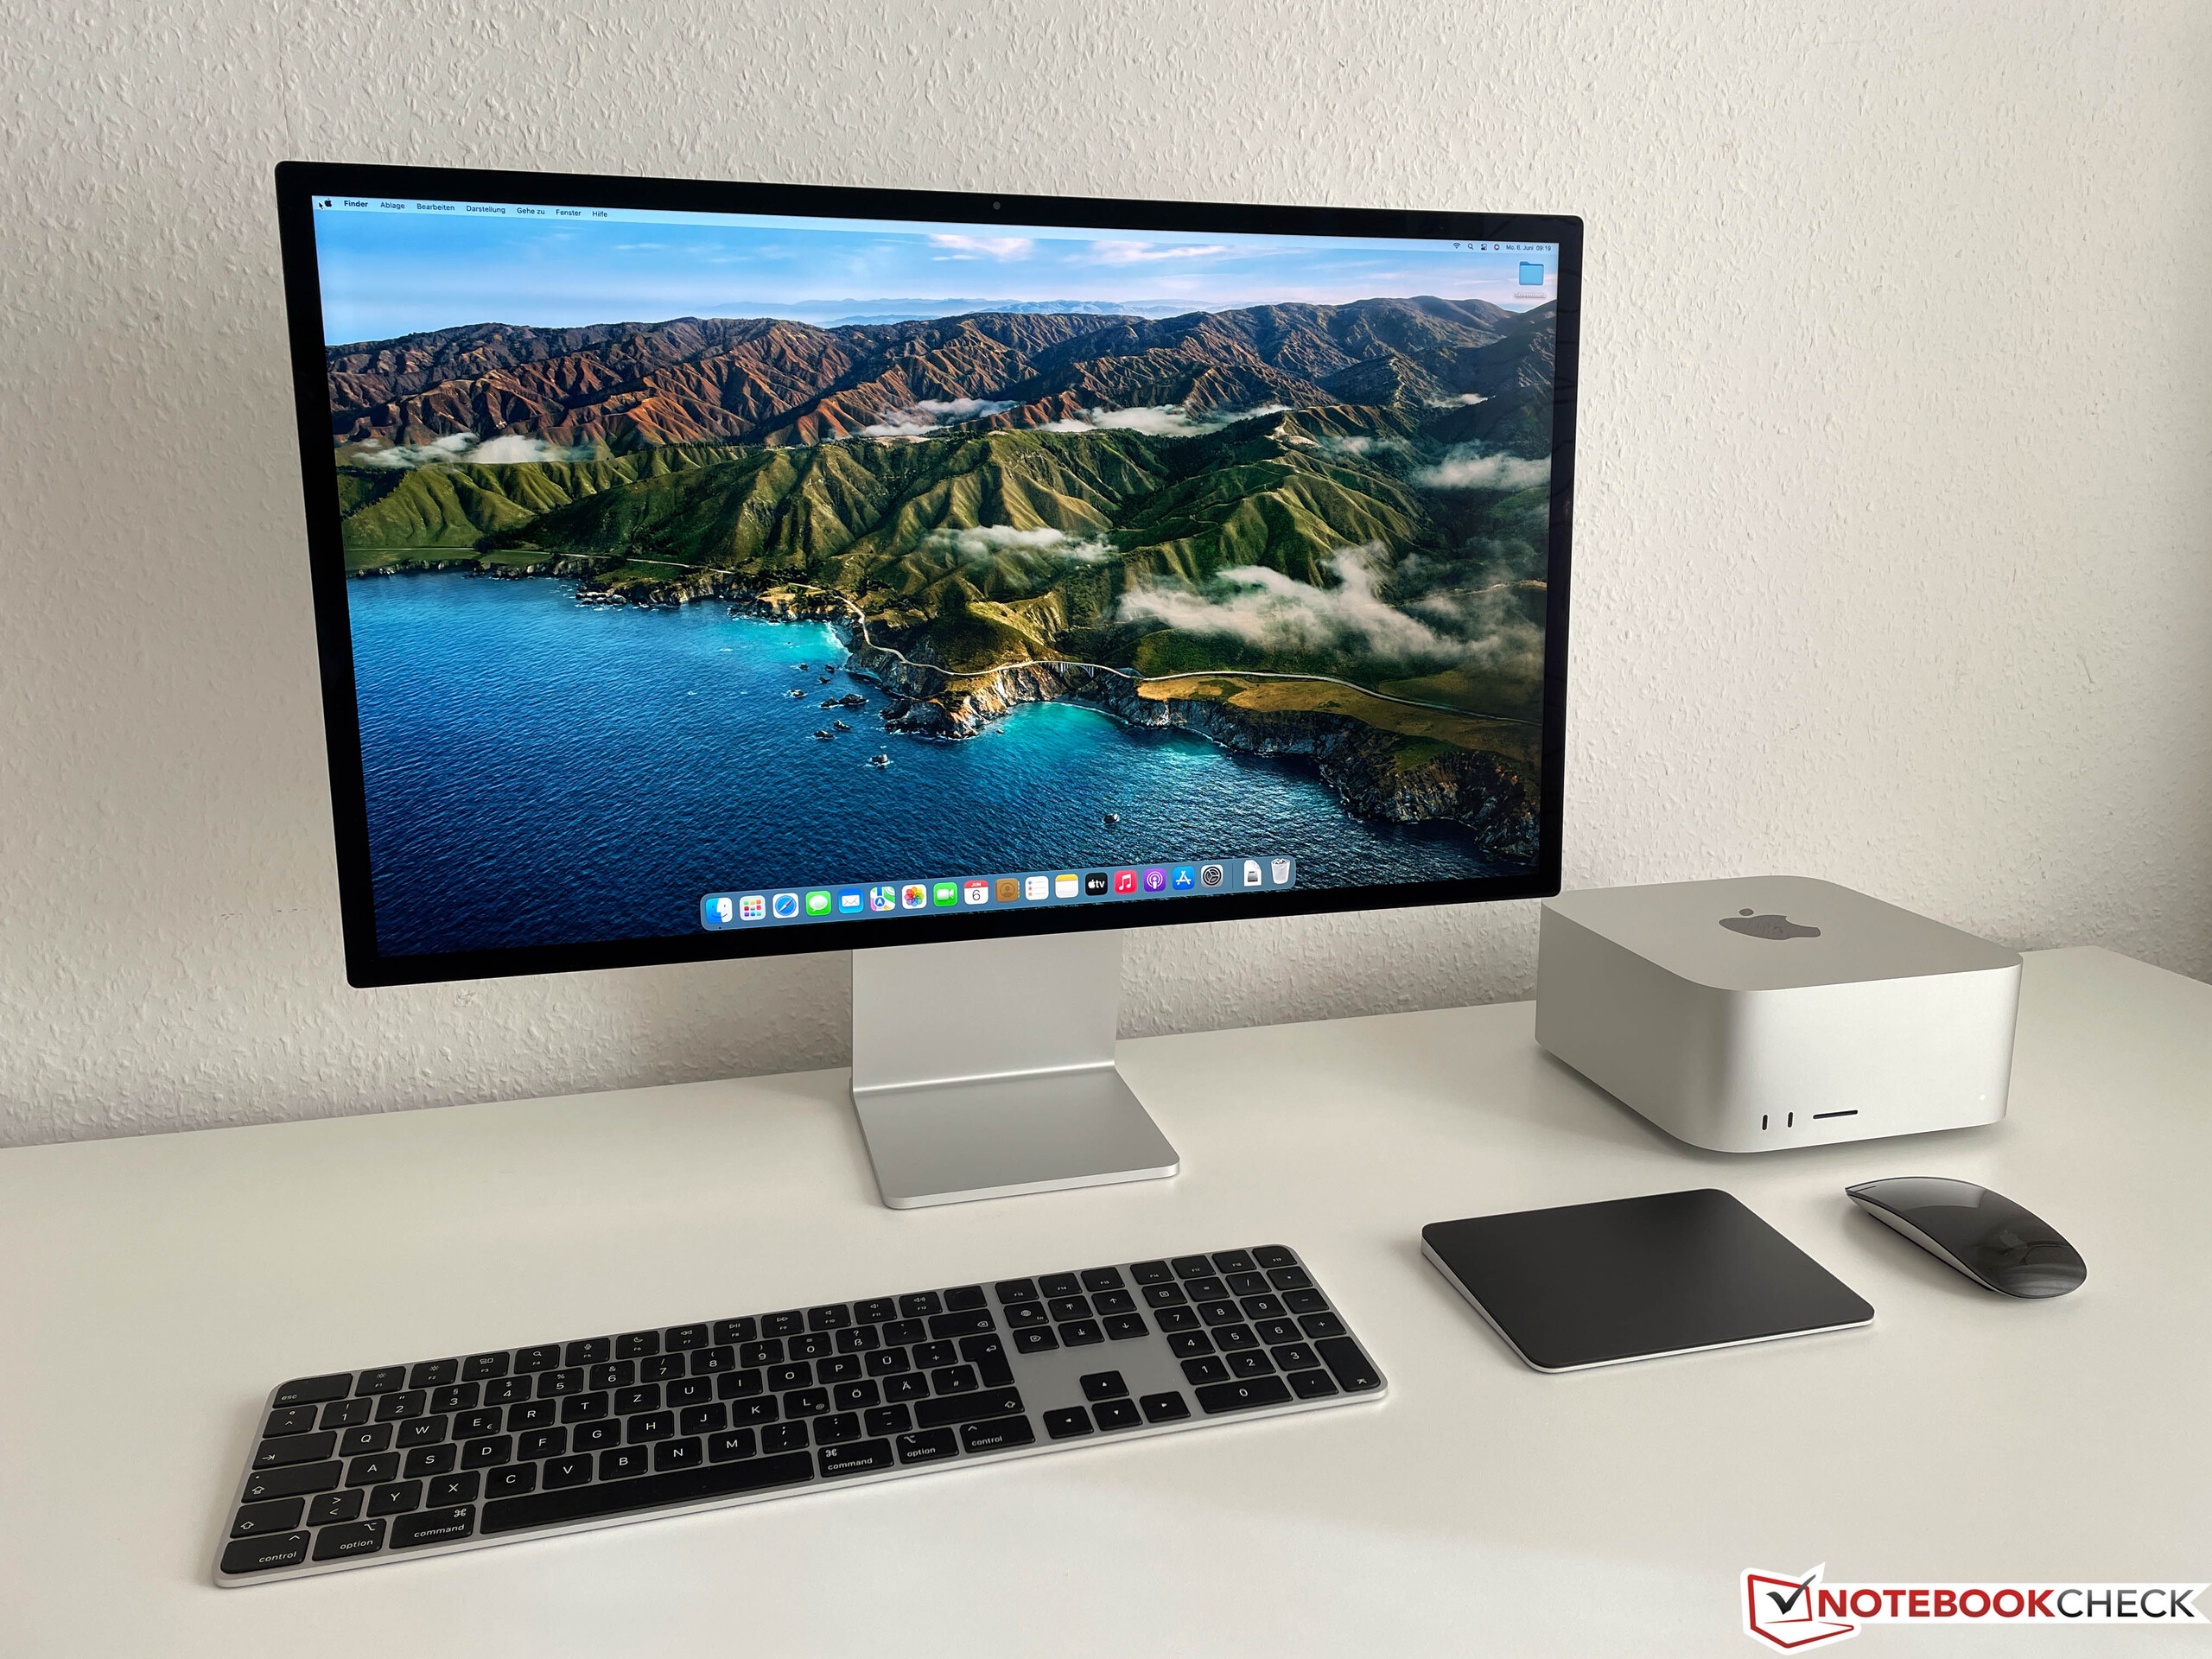
注意:我们将这两款产品放在一起评测,即Mac Studio和Studio Display,但它们自然必须彼此分开购买。将Mac Studio与其他外部显示器一起使用也是可以的;同时,Studio Display也可以与MacBook或其他笔记本电脑/PC一起使用(后面会有更多介绍)。
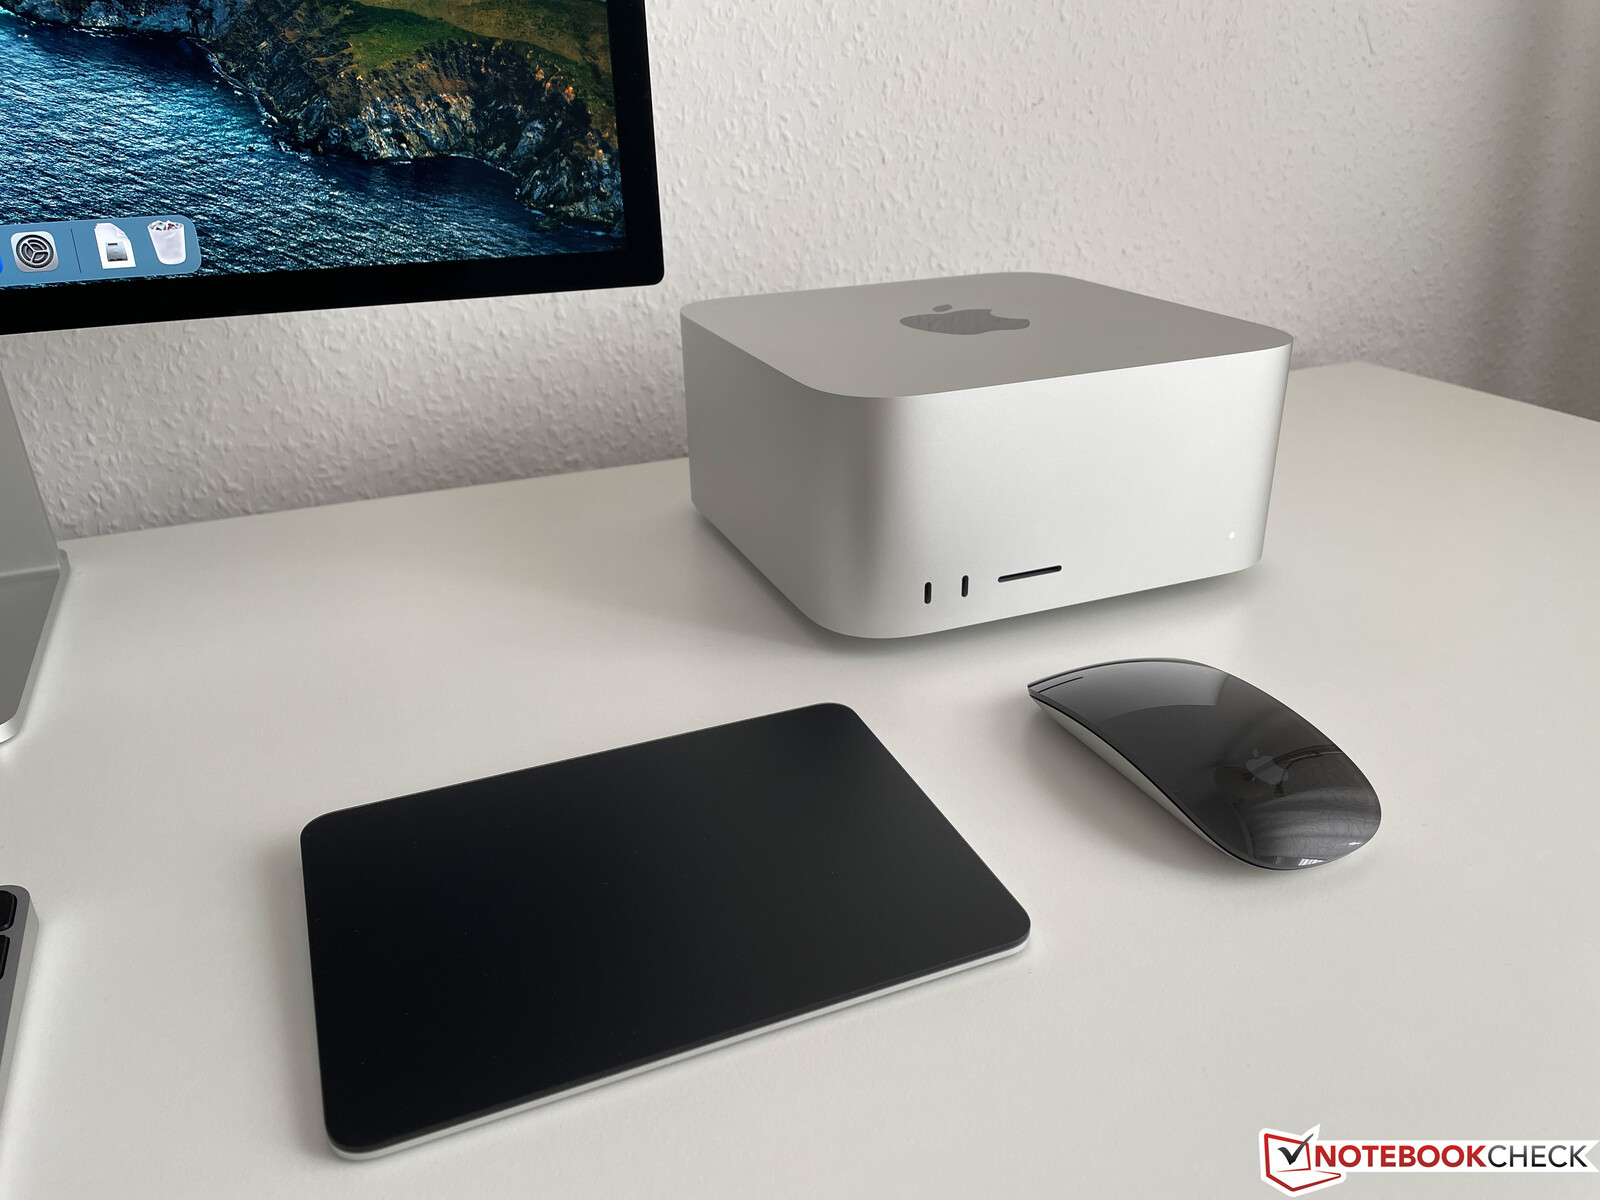
Apple Mac Studio - 一台立体的Mac Mini
新的Mac Studio是我们熟悉的Mac Mini的一个较大版本。 迷你版Mac.它的形状与圆角相同,边长也完全相同,但Mac Studio要高得多,只有不到9.6厘米。电源适配器已经集成在一起,我们带M1 Max的版本的重量是2.695公斤;Apple ,甚至指定带M1 Ultra的版本重量高达3.7公斤。像往常一样,做工是非常高质量的,铝制外壳看起来非常漂亮。Mac Studio只配备了相应的电源线。
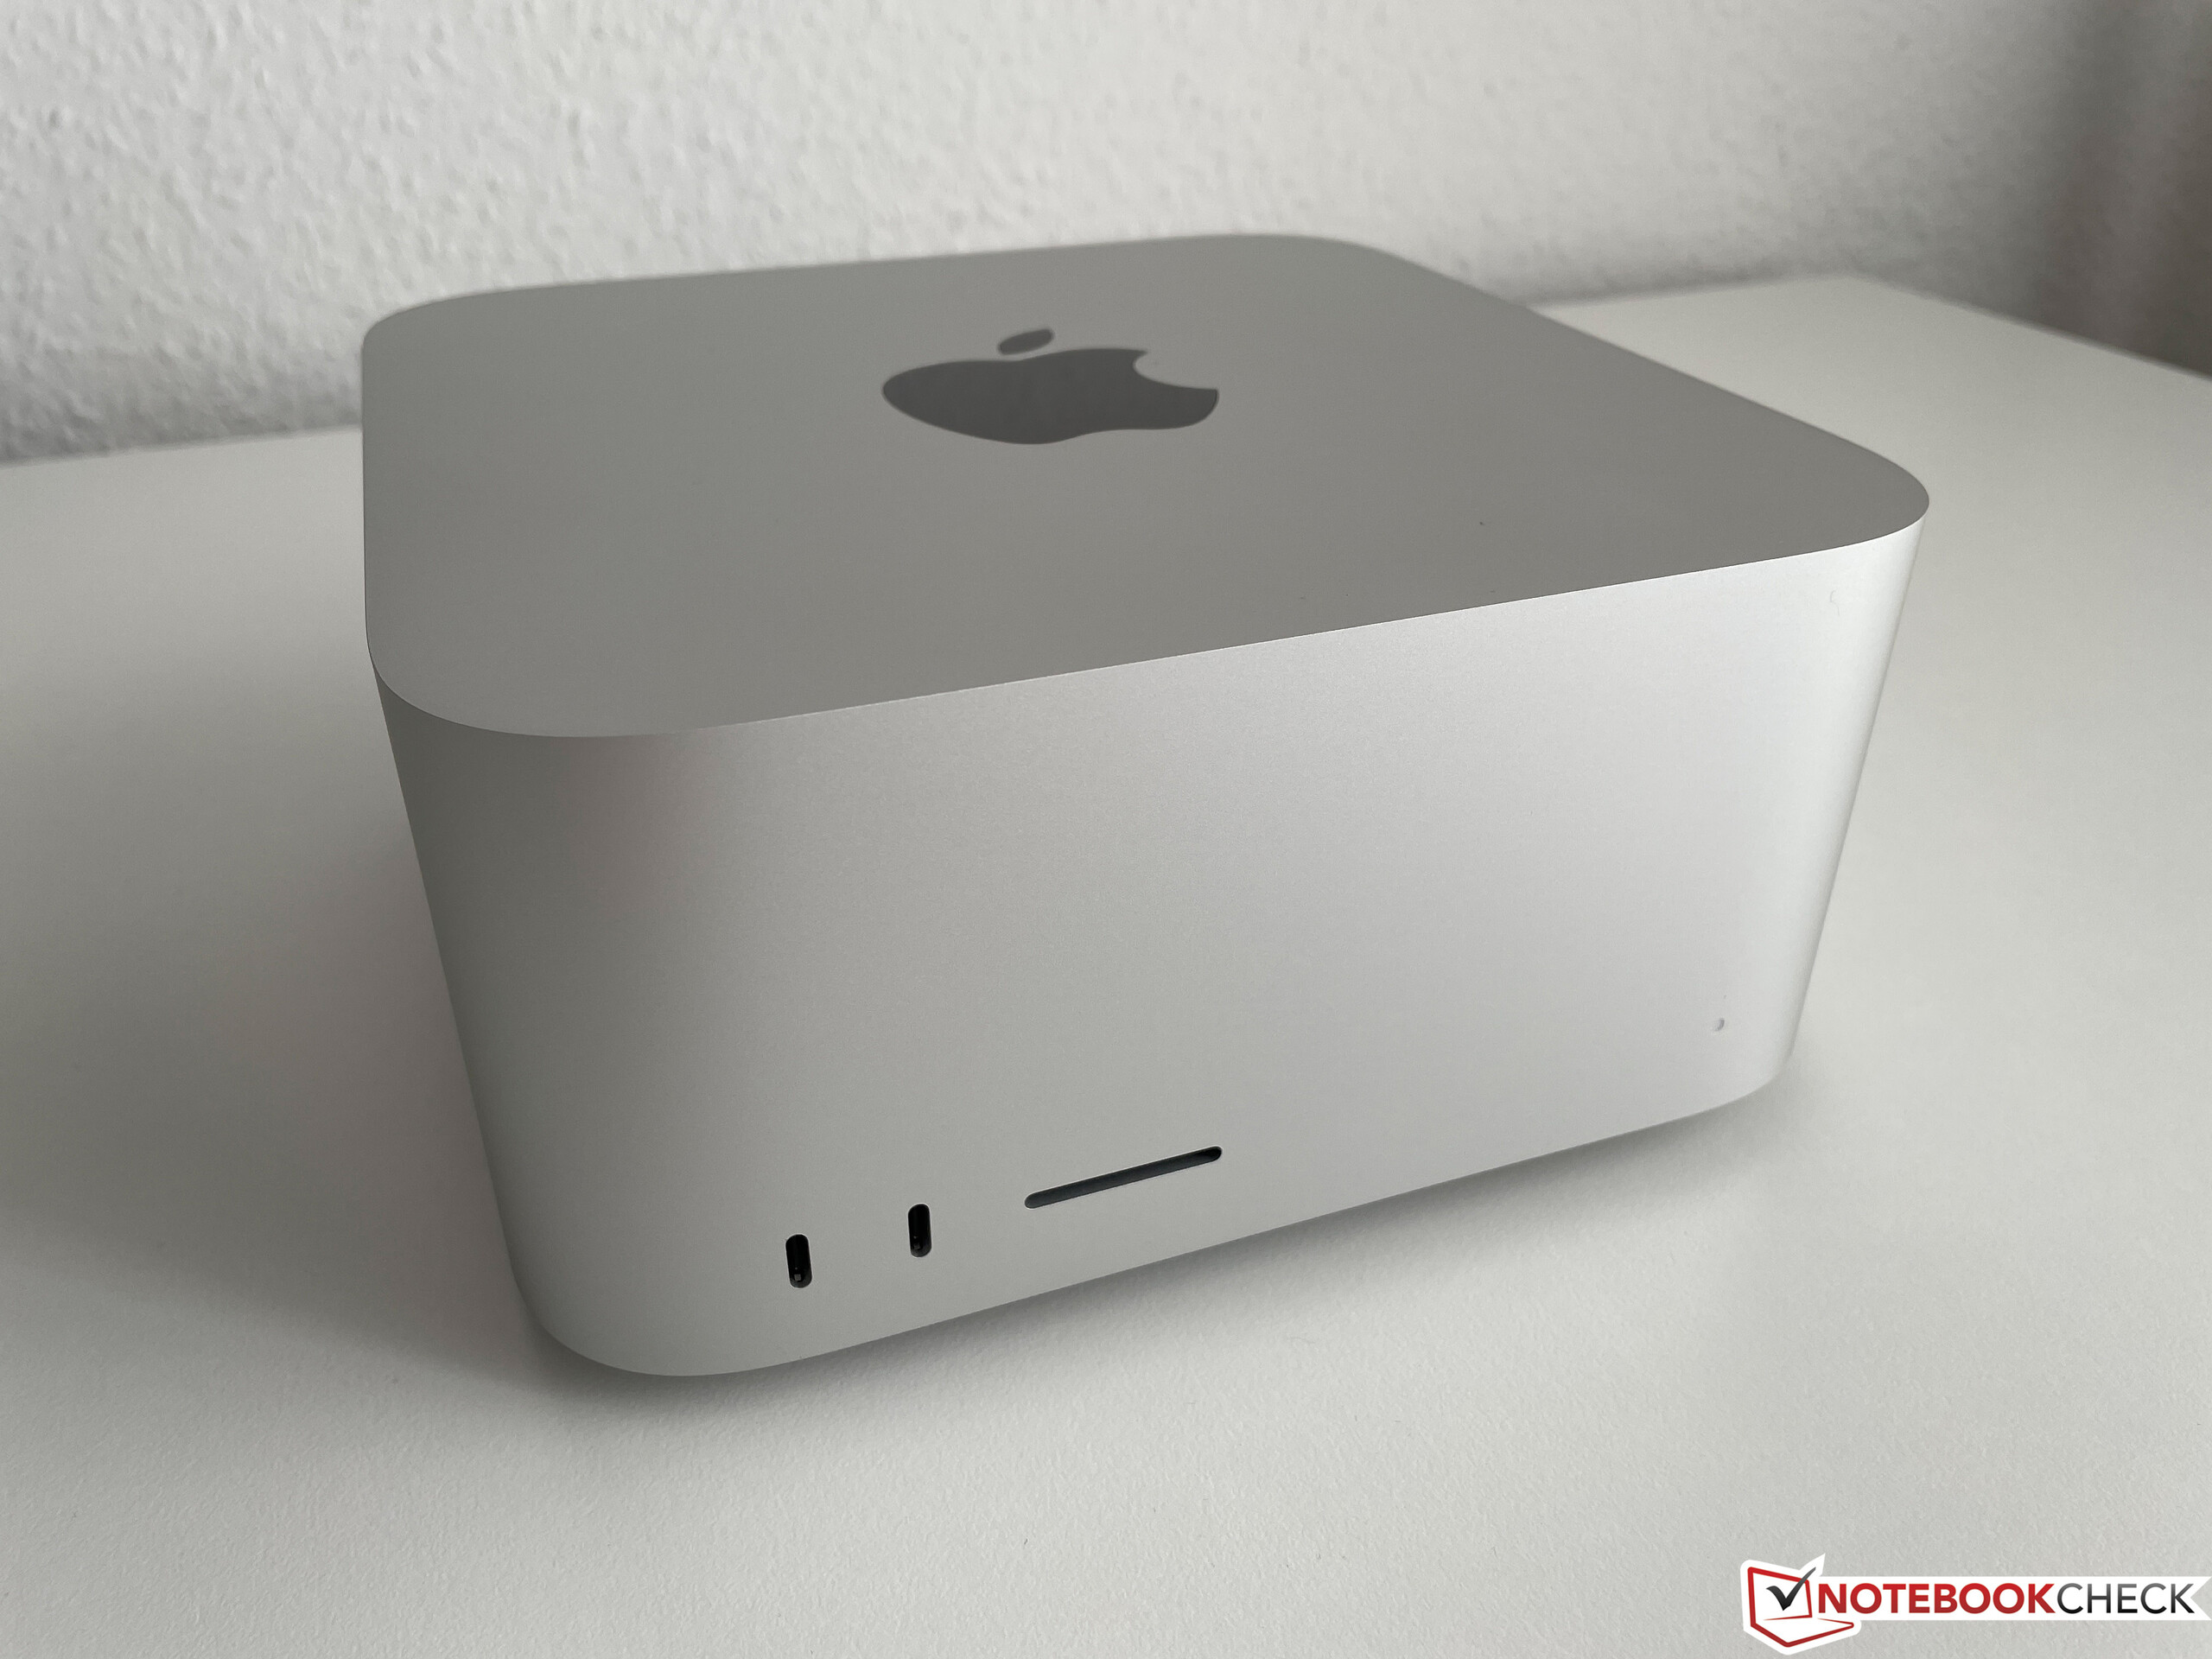
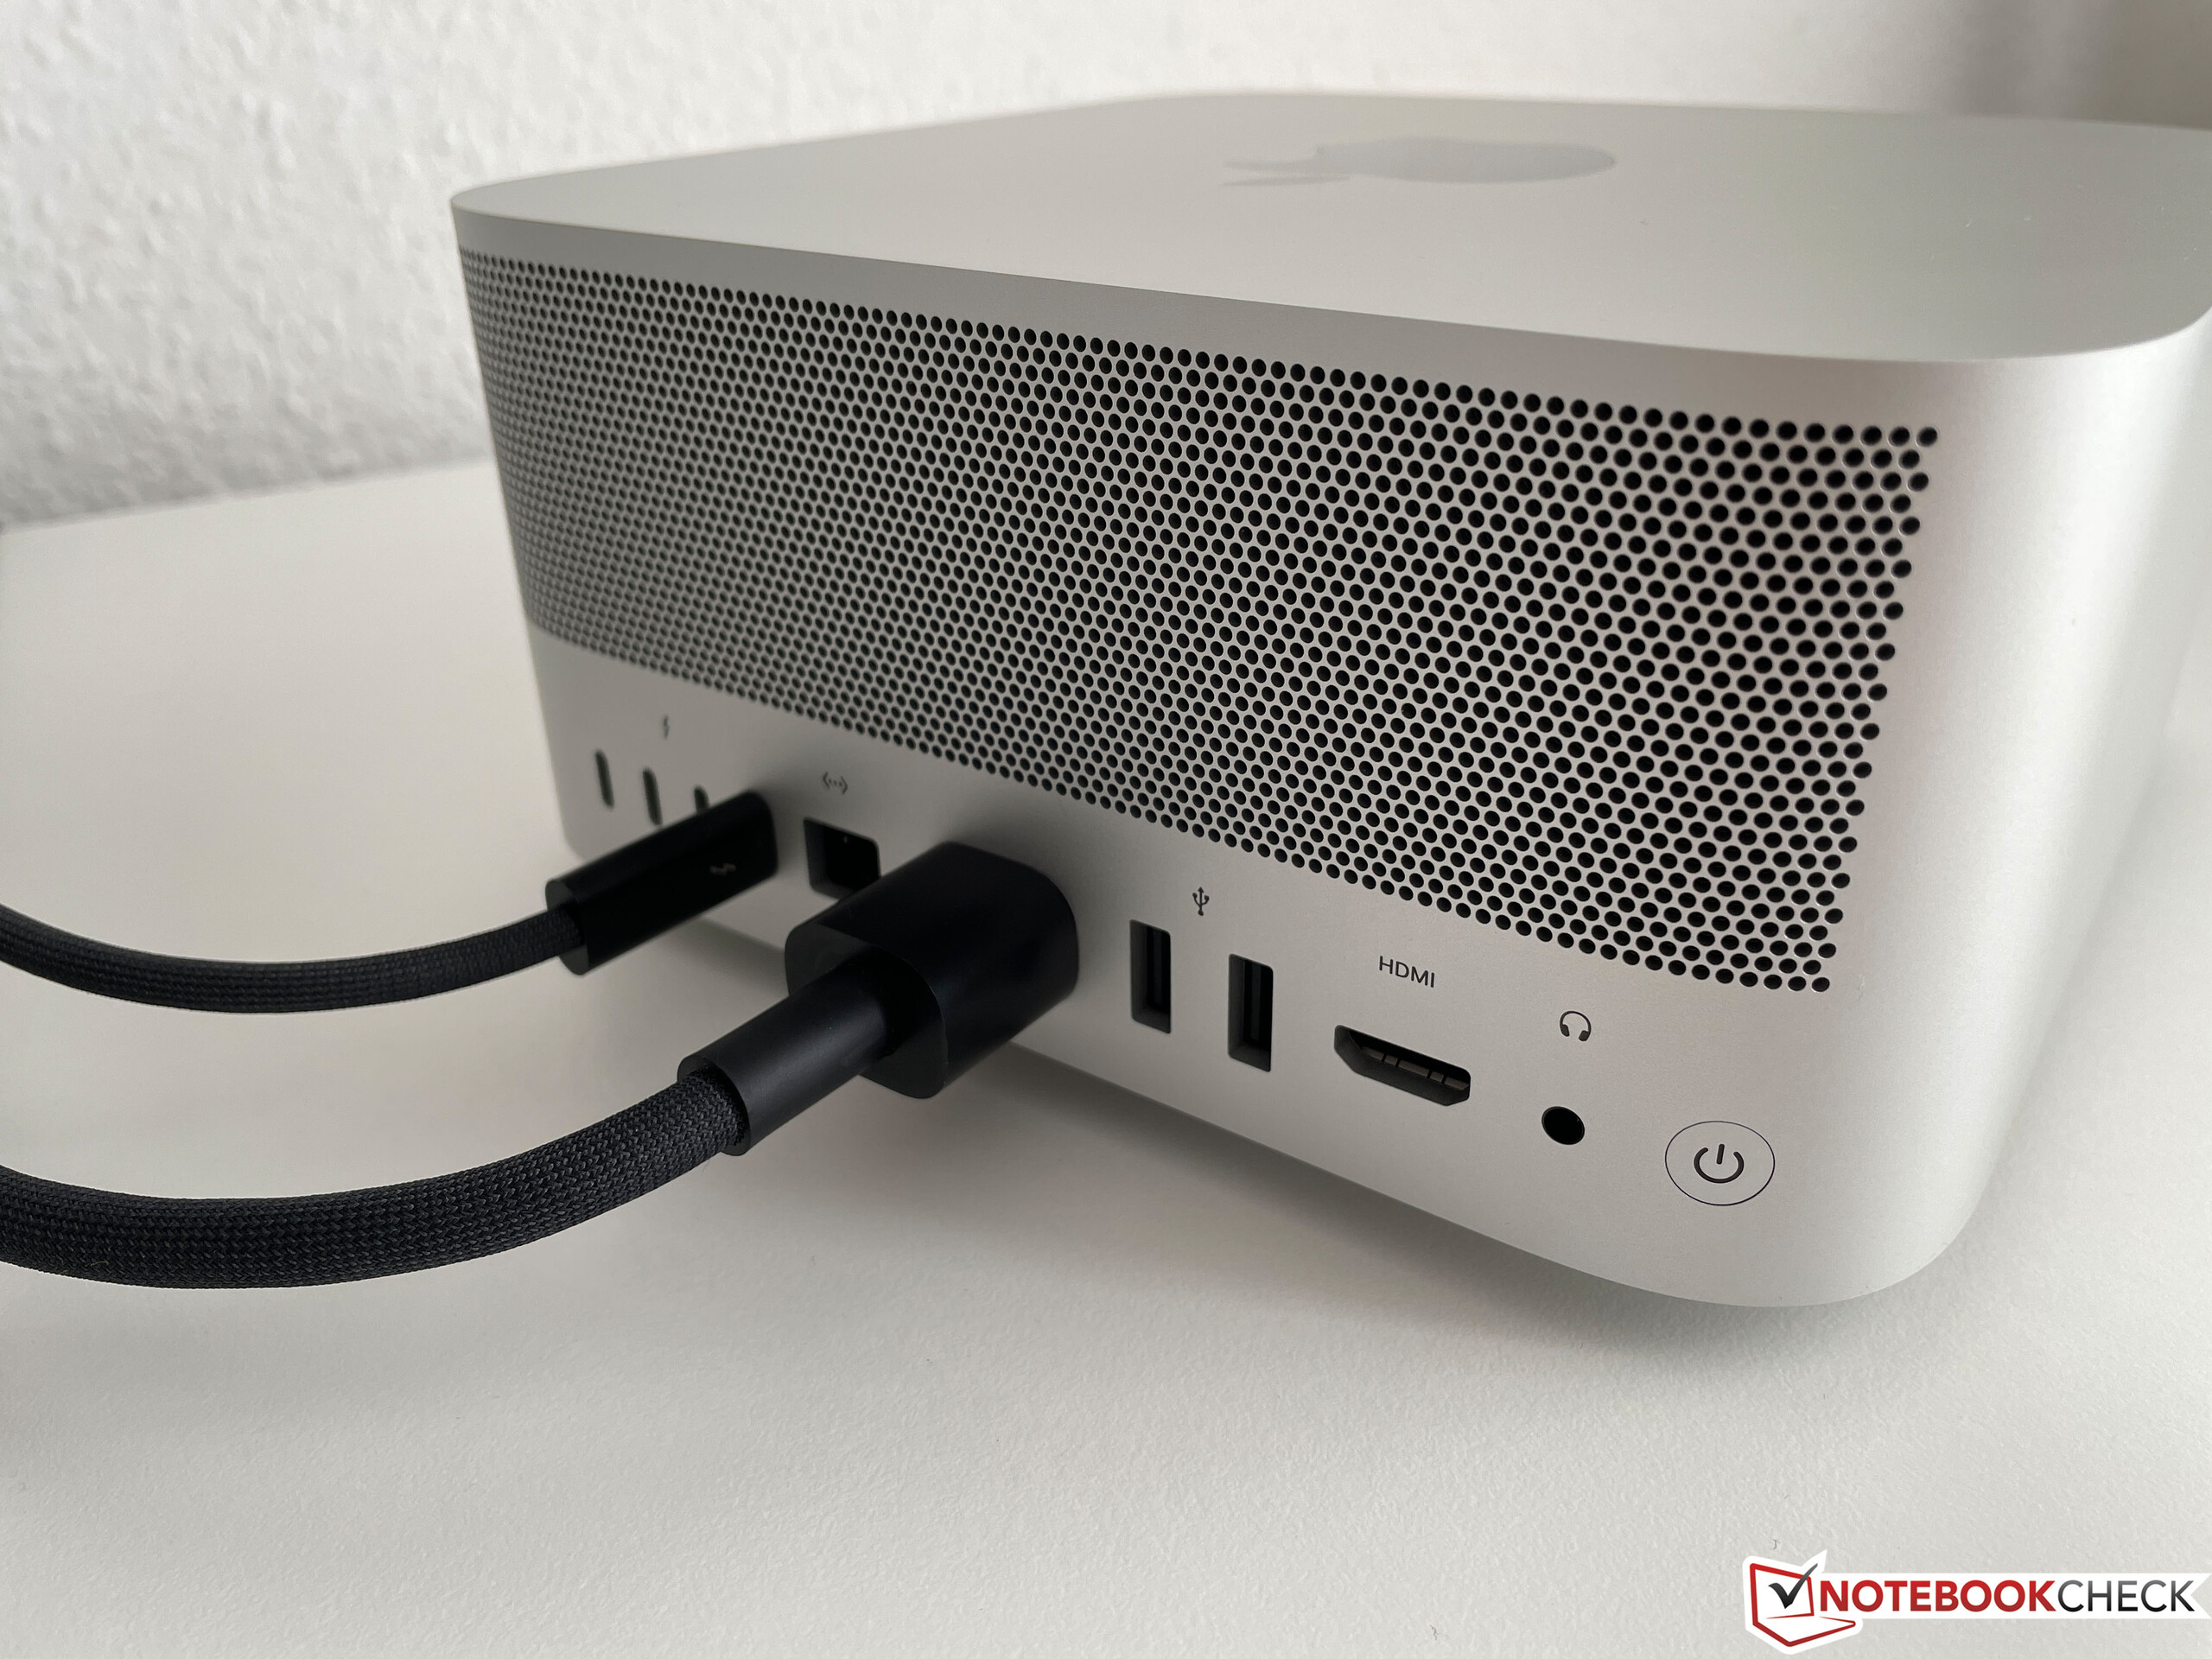
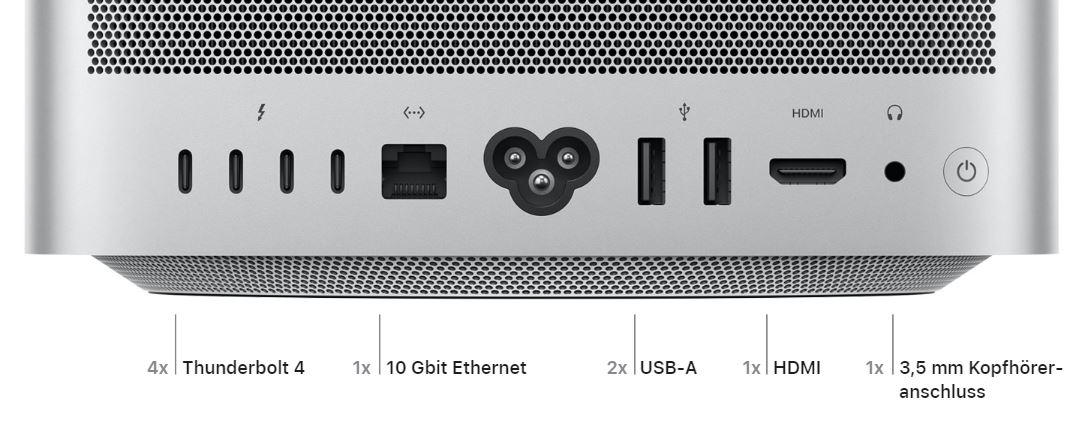
正面有状态指示灯,两个USB-C端口(或Mac Studio上的2个Thunderbolt 4与M1 Ultra),以及读卡器和电源按钮。其余的端口都在背面。不过这两个版本的端口是相同的,它们包括四个Thunderbolt 4端口(USB-C),两个普通的USB-A端口,以及一个10GB以太网端口。此外,音频输出和HDMI 2.0输出也位于这里。
总的来说,配备M1 Max的Mac Studio可以支持四个外部显示器。一台通过HDMI输出的60赫兹的4K显示器,以及通过USB-C的最多三台6K显示器。配备M1 Ultra的Mac Studio最多可支持五台外部显示器(1台通过HDMI的4K/60 Hz,以及4台通过USB-C的6K显示器)。
Apple 工作室显示器 - 5K视网膜显示器,采用A13 SoC
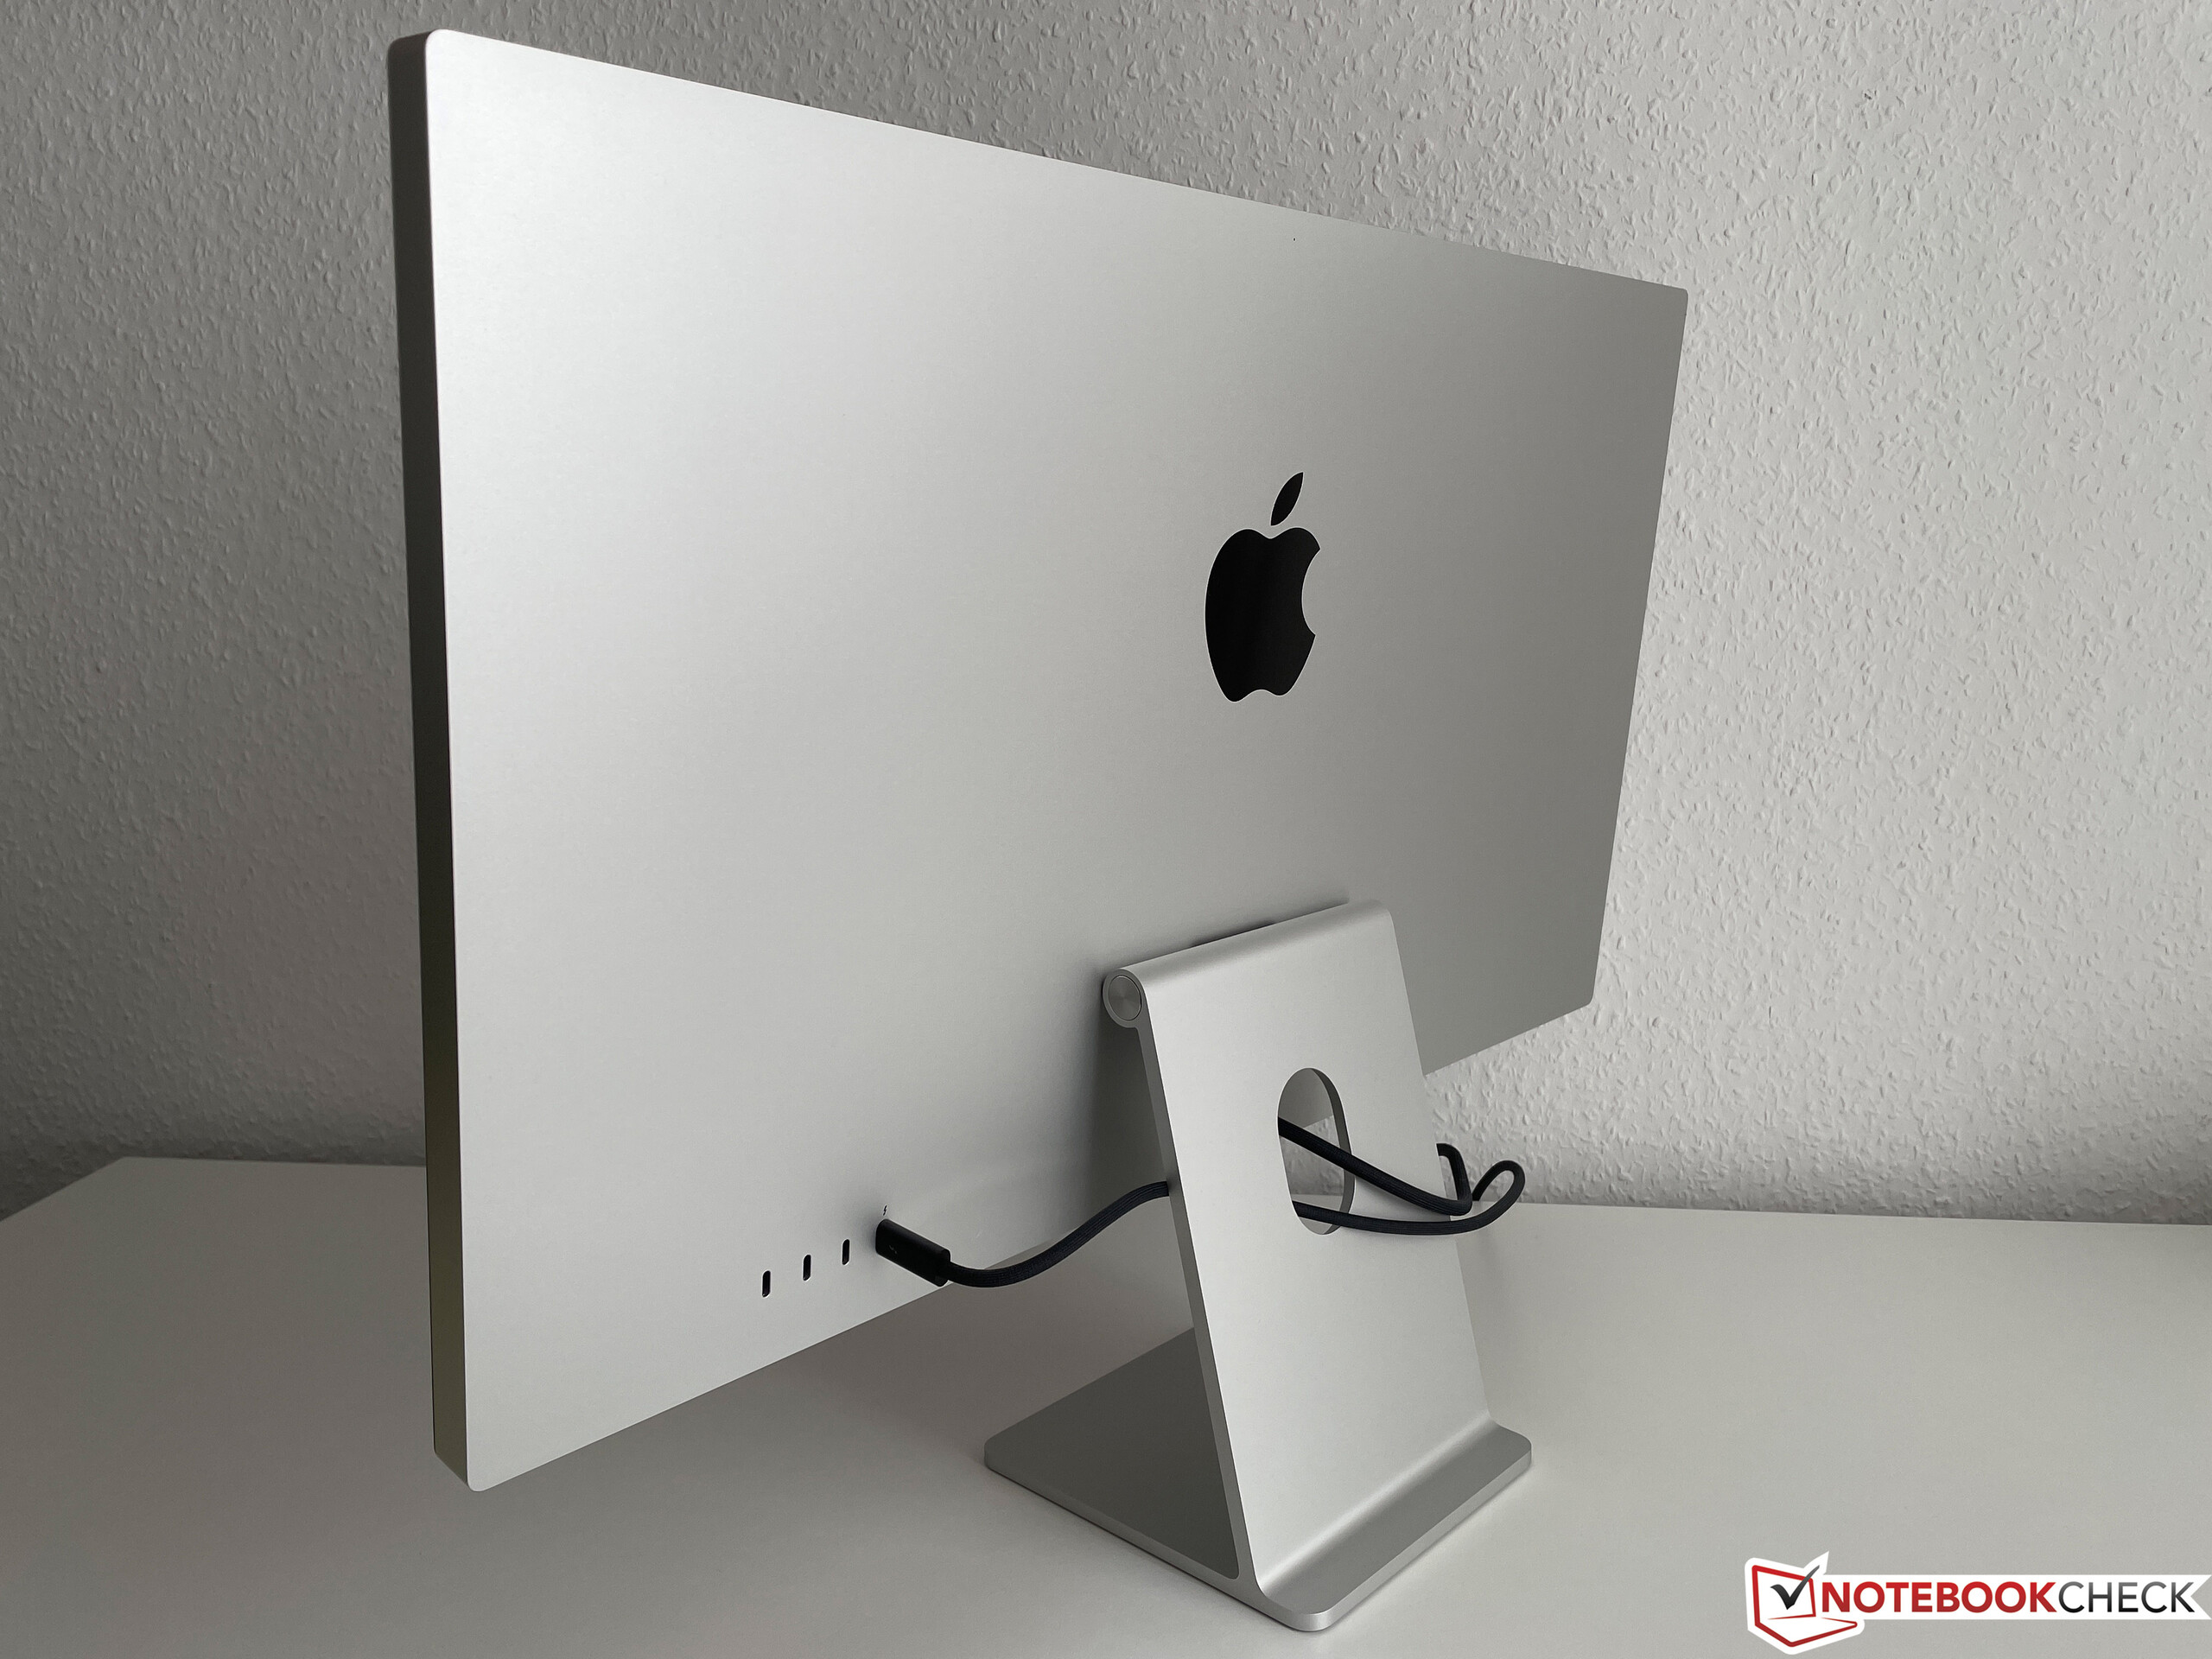
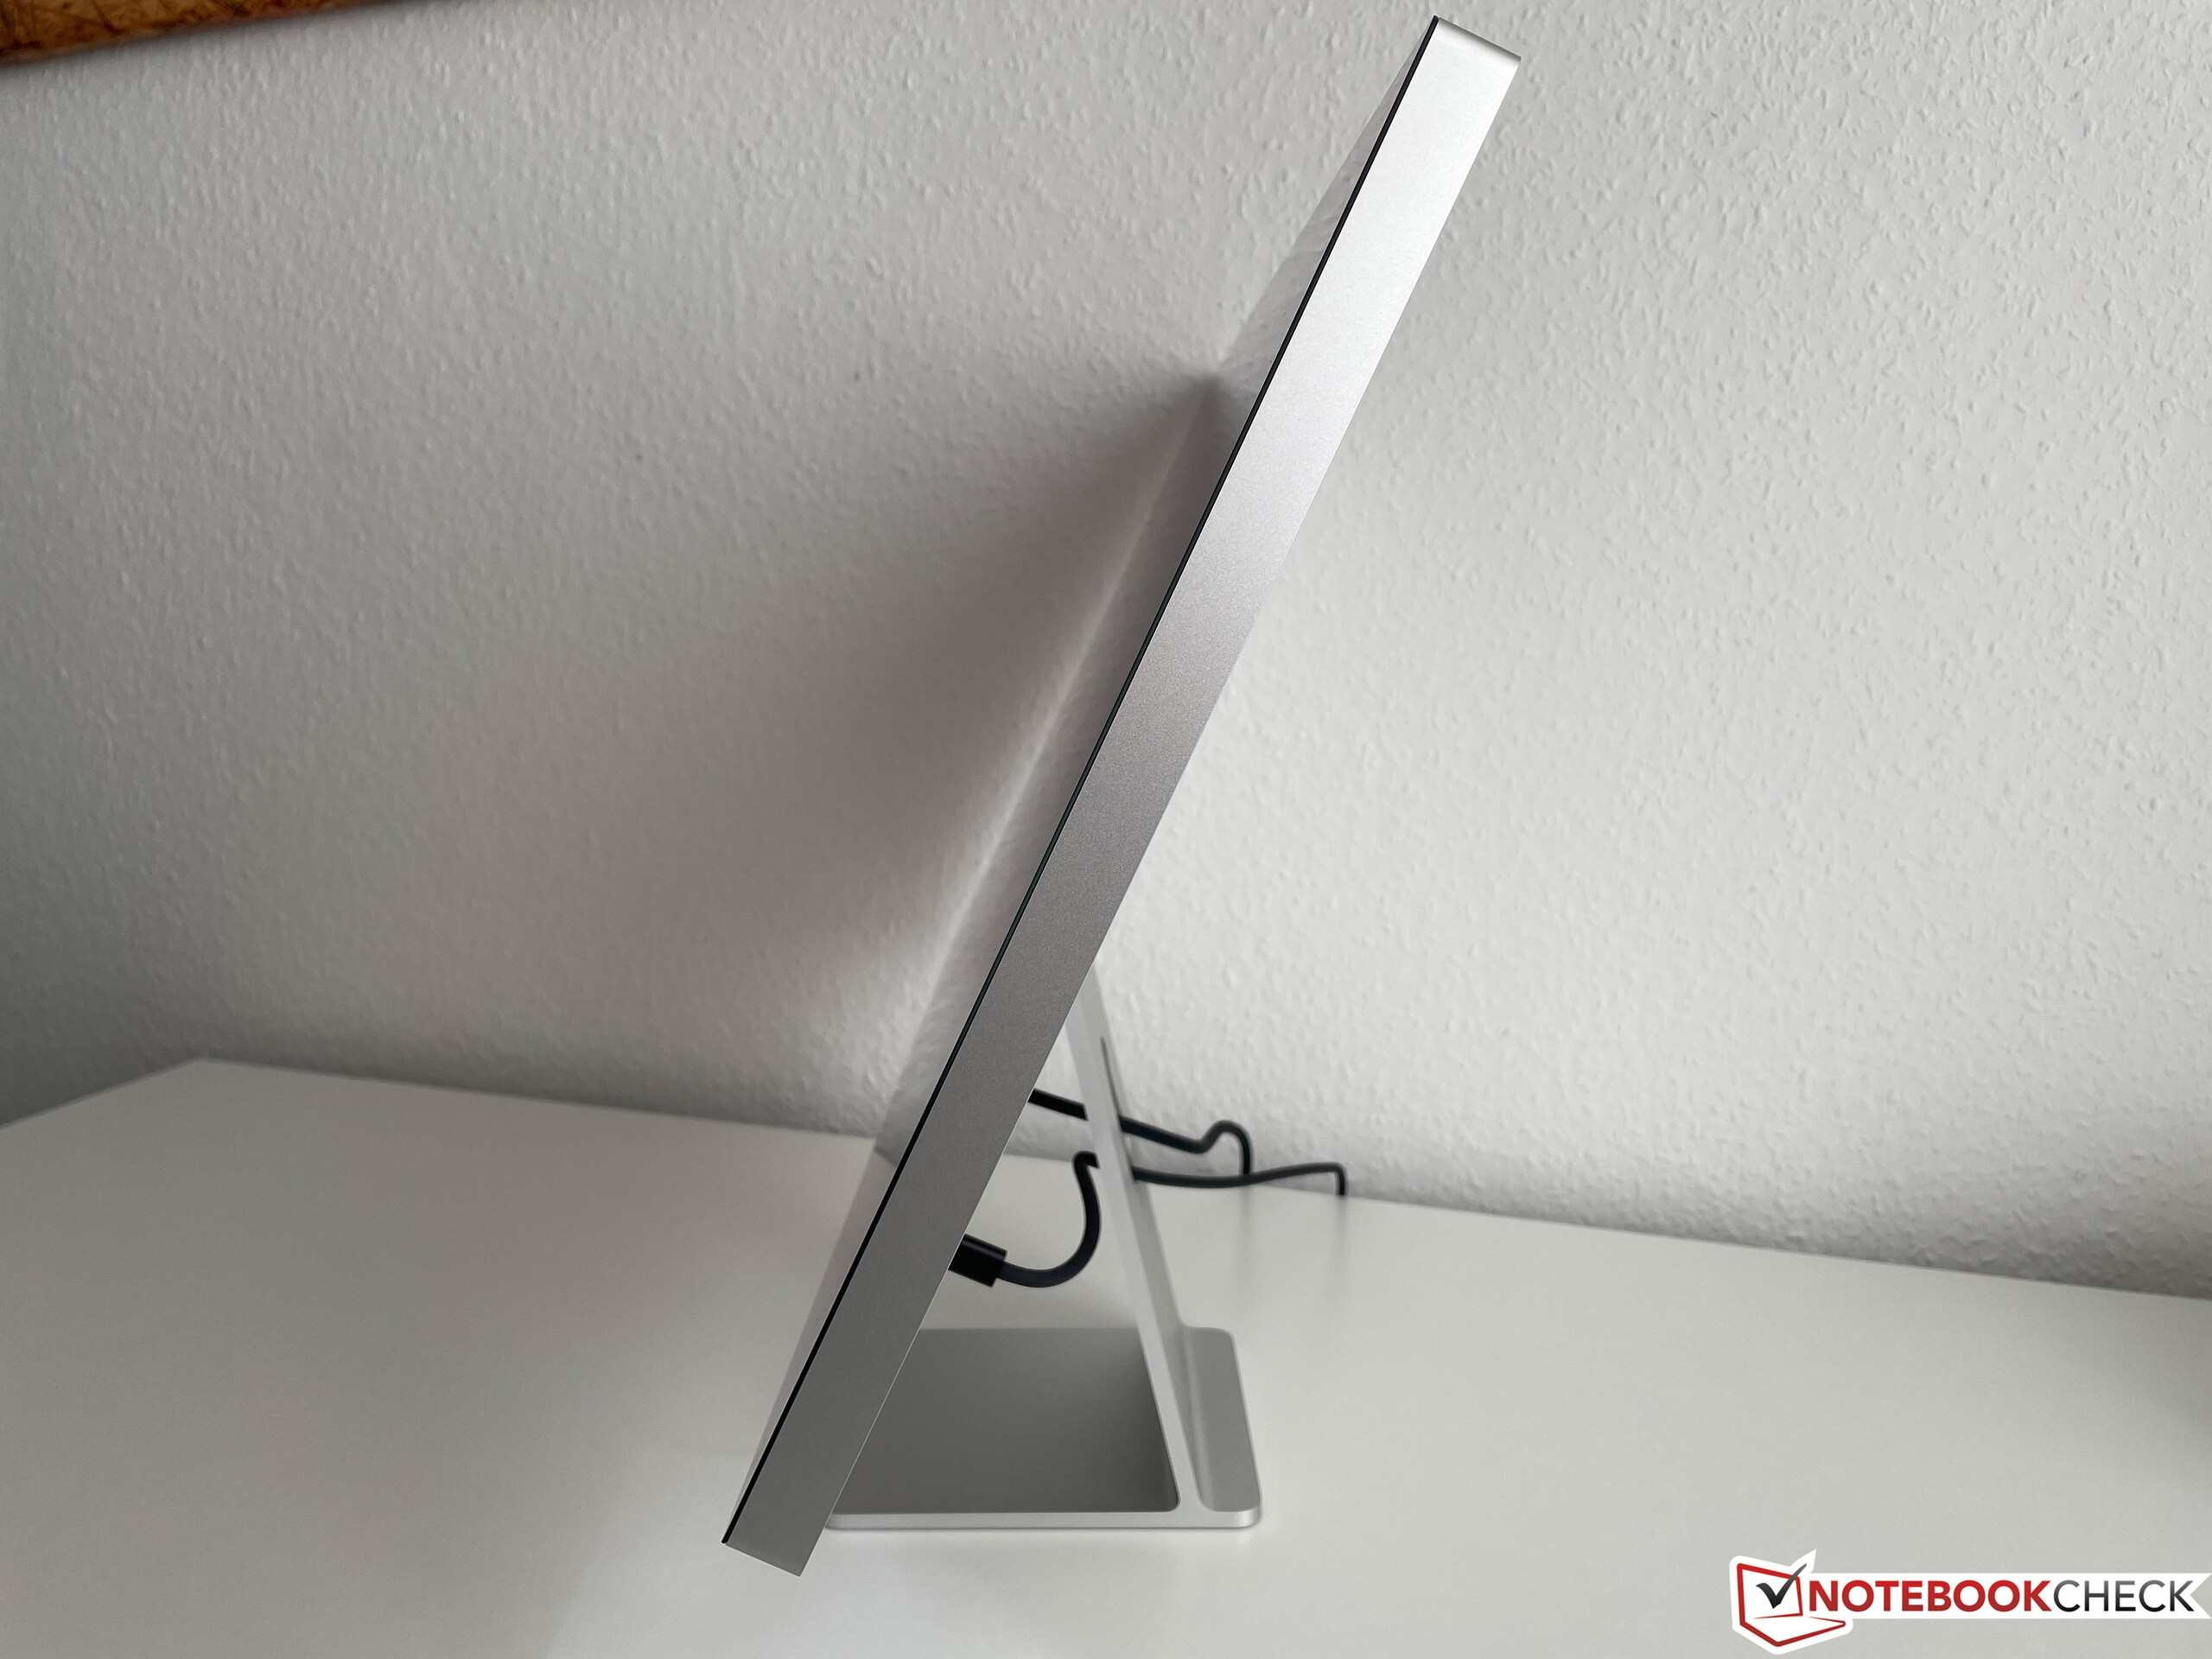
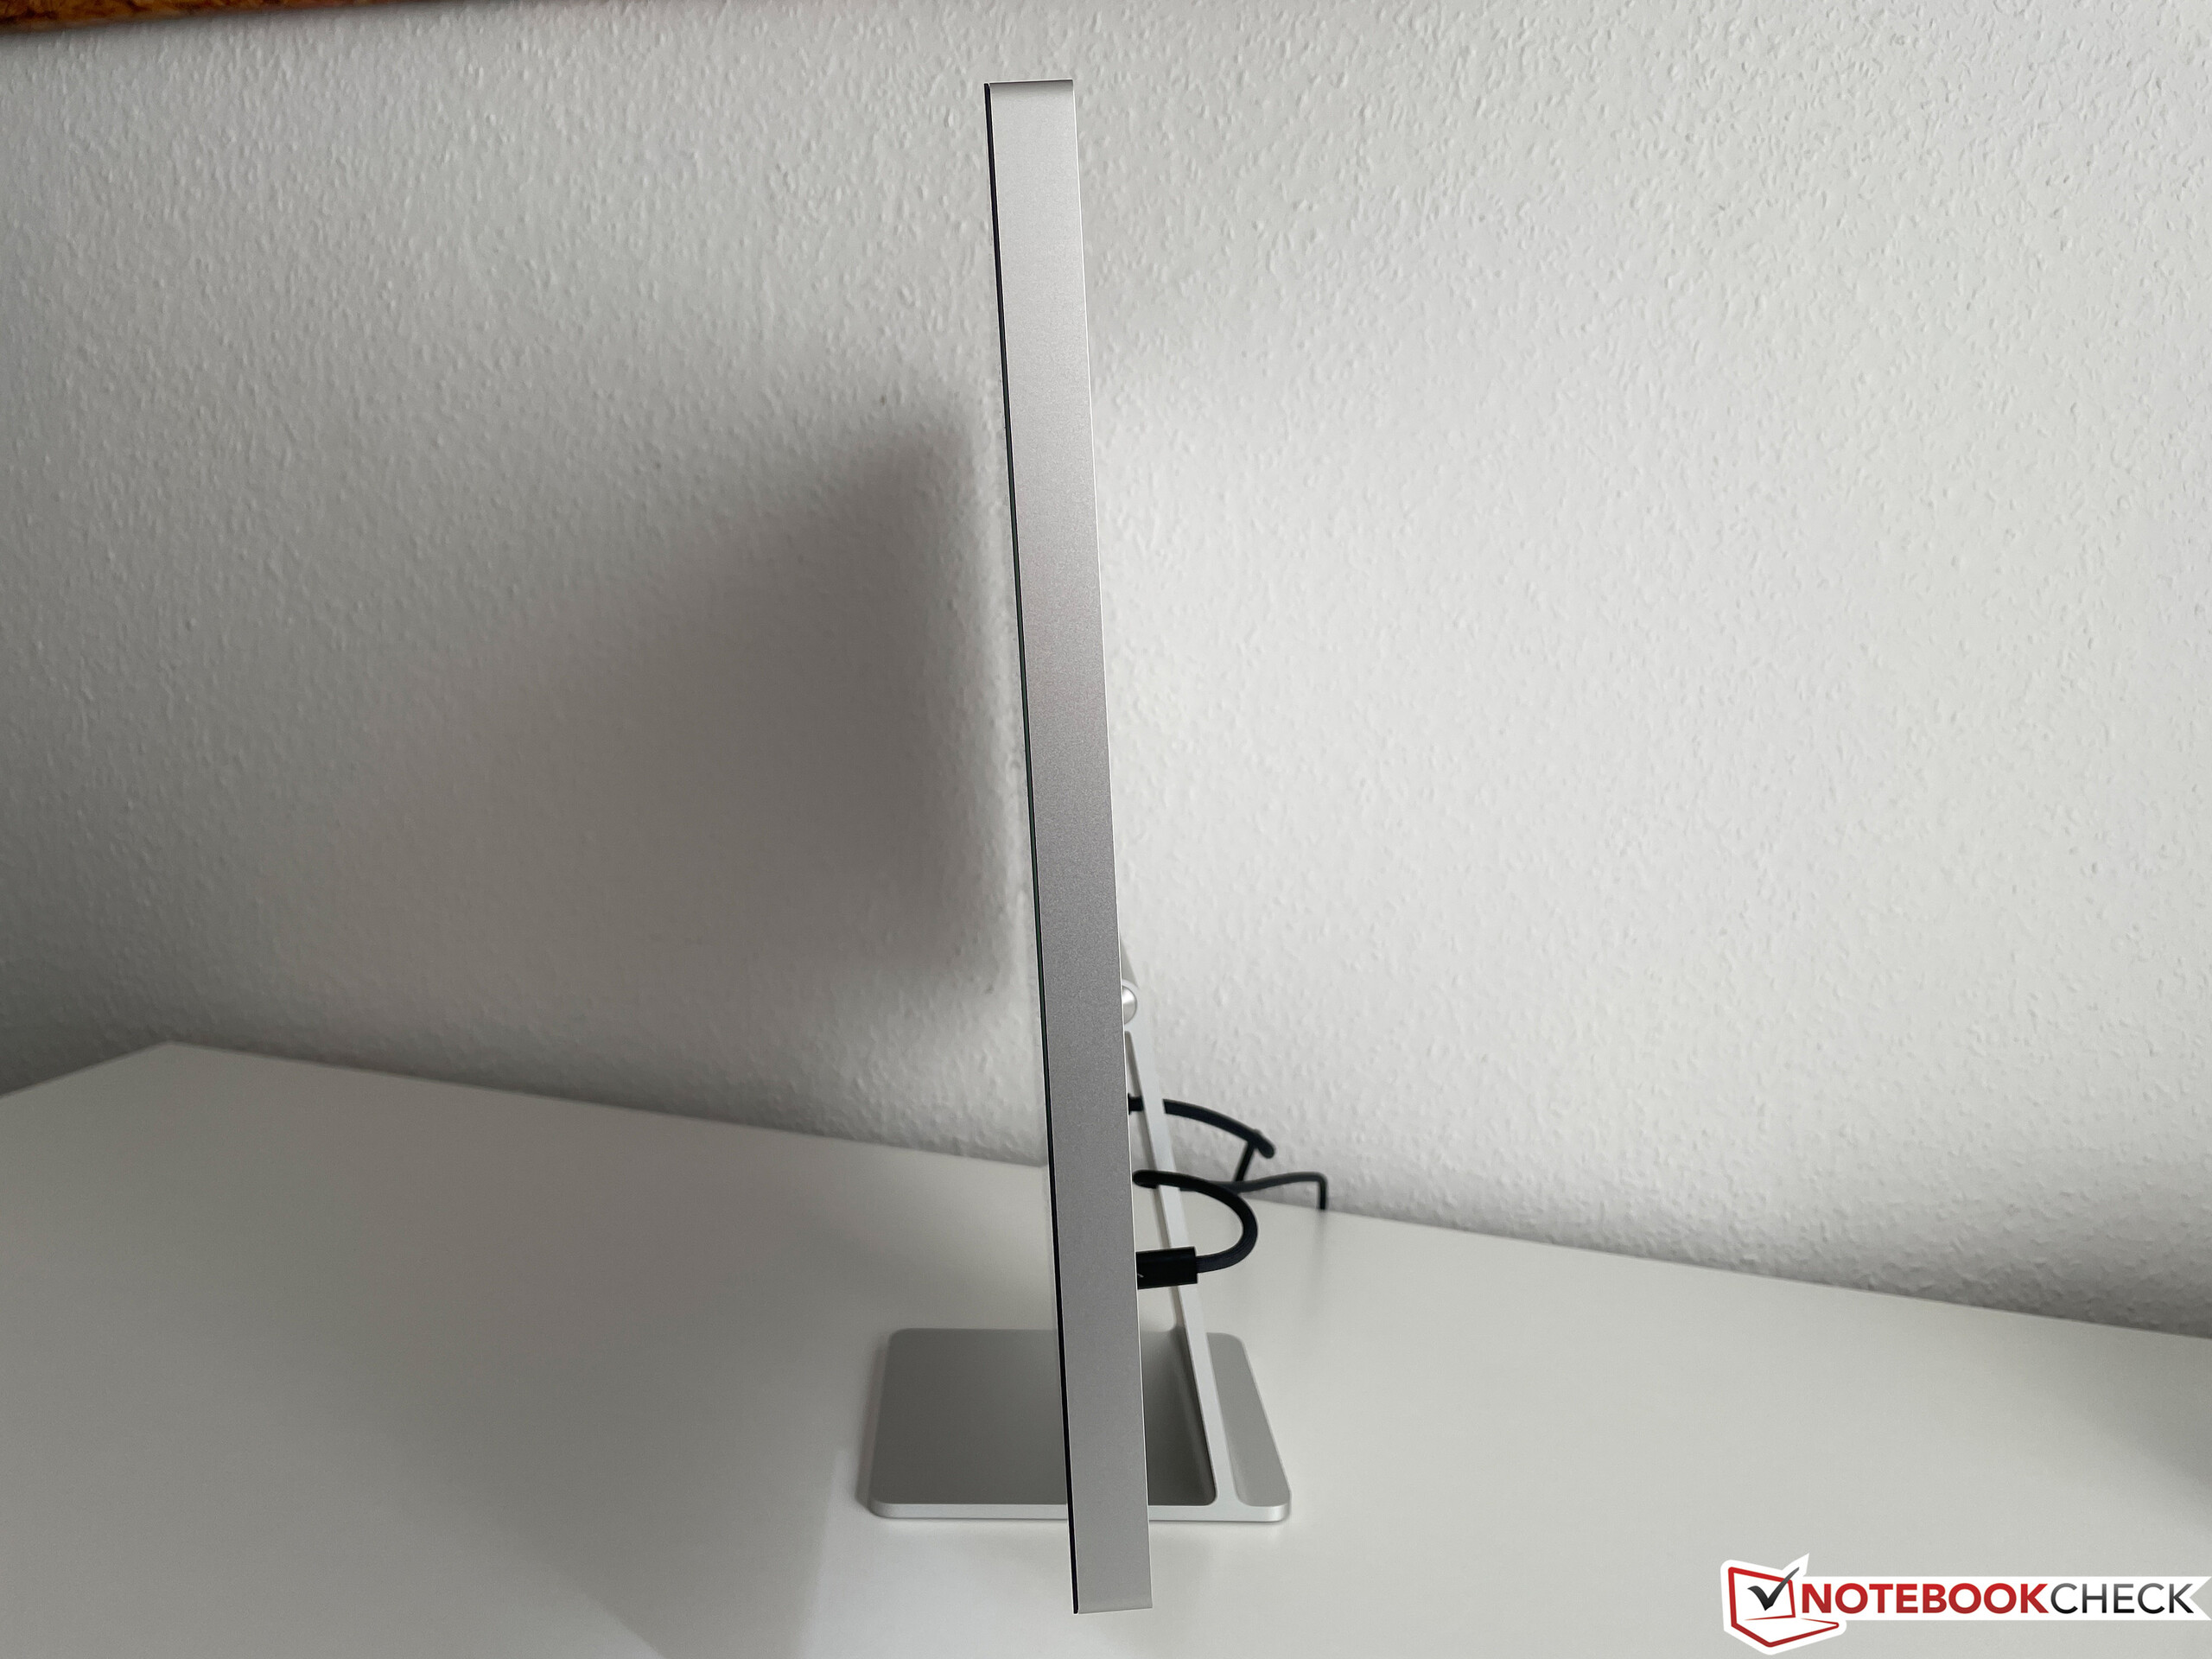
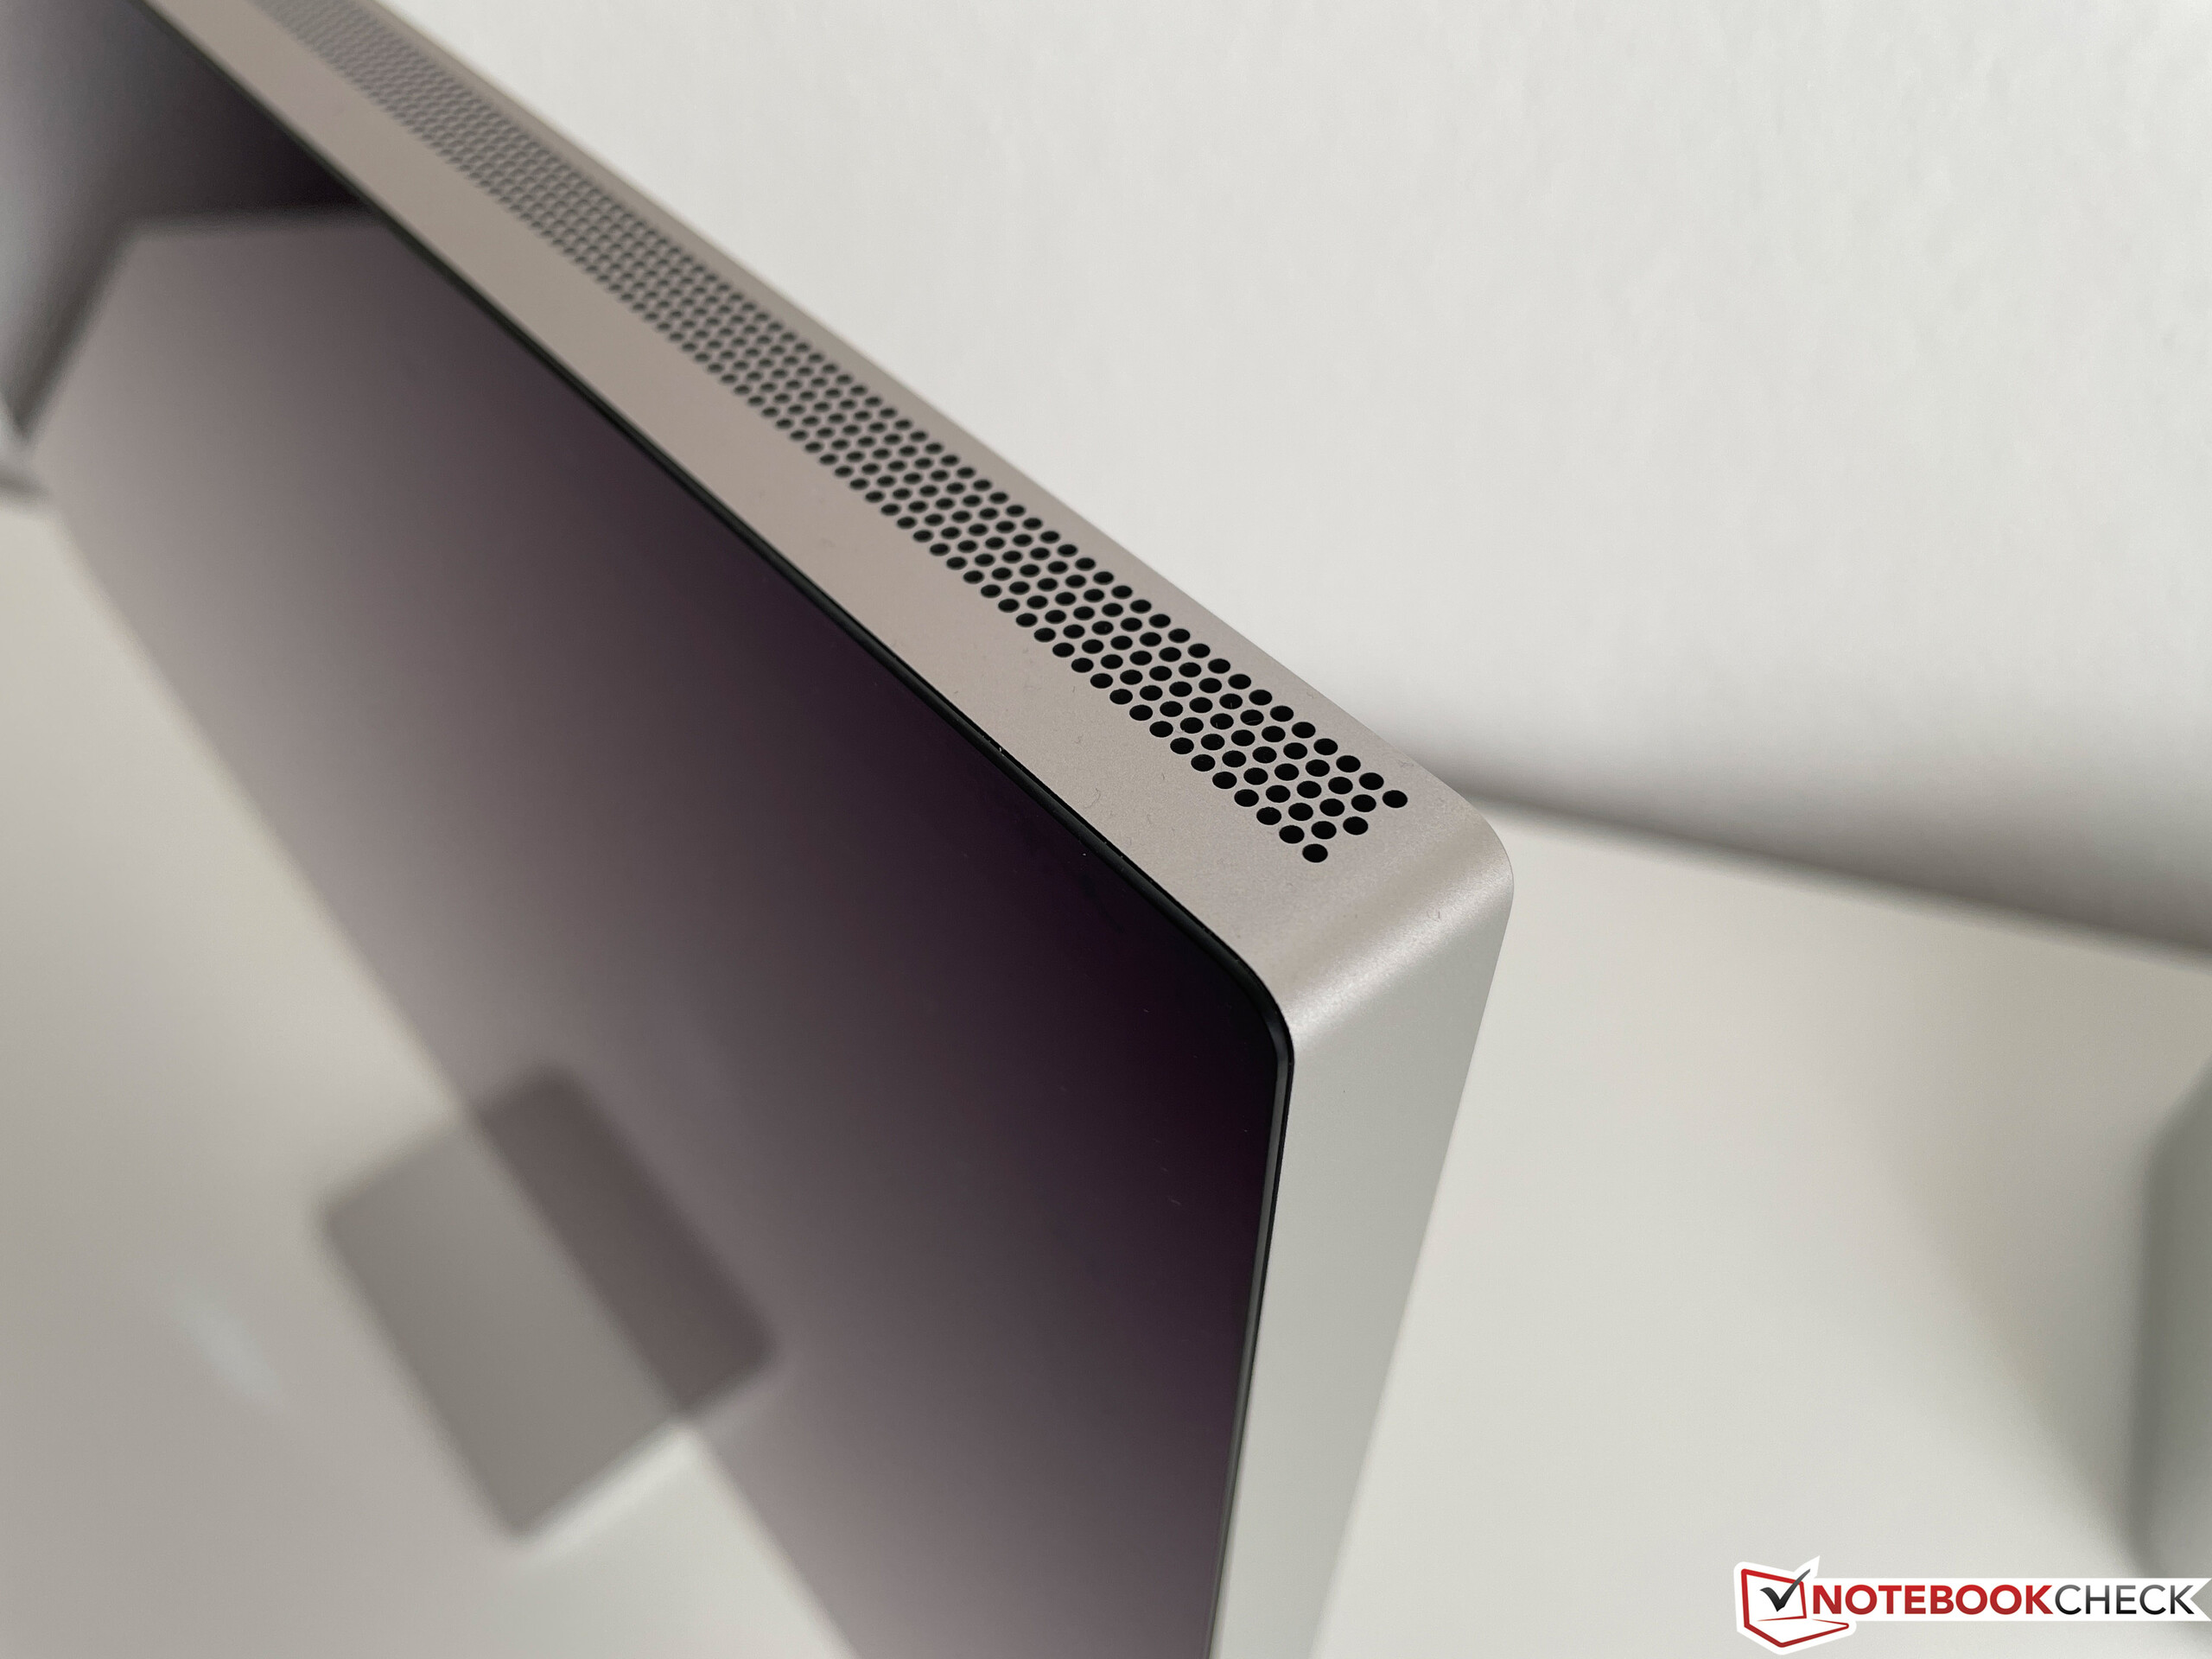
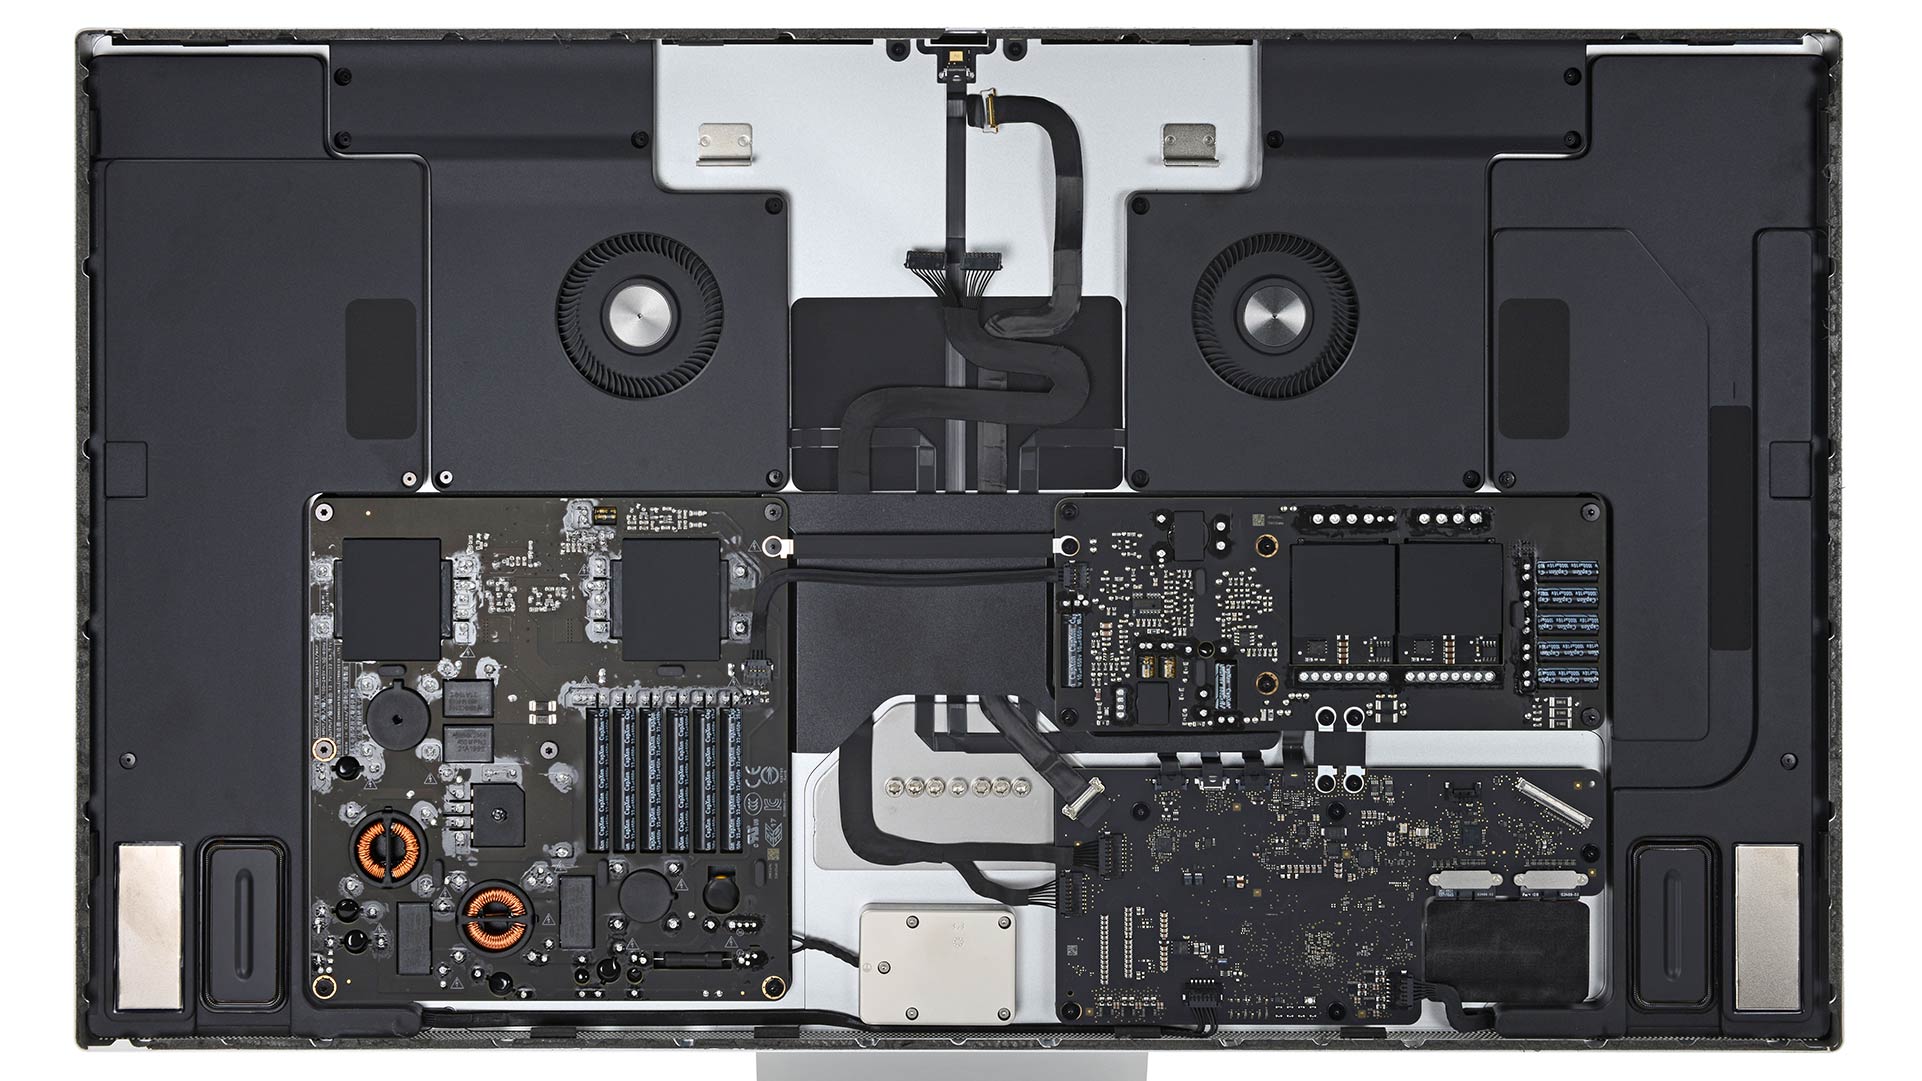
新的Studio Display是Apple ,是最新的外部显示器,对角线尺寸为27英寸,分辨率为5K(5120x2,880像素,16:9,218DPI),与旧的iMac 27完全对应。再一次,圆边和平边的设计已经让我们想起了Pro Display XDR以及新的 iMac 24但该显示器的厚度也令人惊讶地达到了3.1厘米(比Pro Display XDR和iMac都要厚),这自然是由于除了扬声器系统之外还集成了Apple A13 SoC。Studio Display的内部看起来也更像一台旧的英特尔iMac,这可以从我们在iFixit的同事所做的拆解中清楚看到.
扬声器和冷却通风口分布在顶部和底部的整个宽度上。包装中只包括一条Thunderbolt电缆(1米);电源线连接在显示器上,用户无法拆除。Studio显示器的重量为6.292公斤,没有任何控制装置,甚至没有开/关按钮。

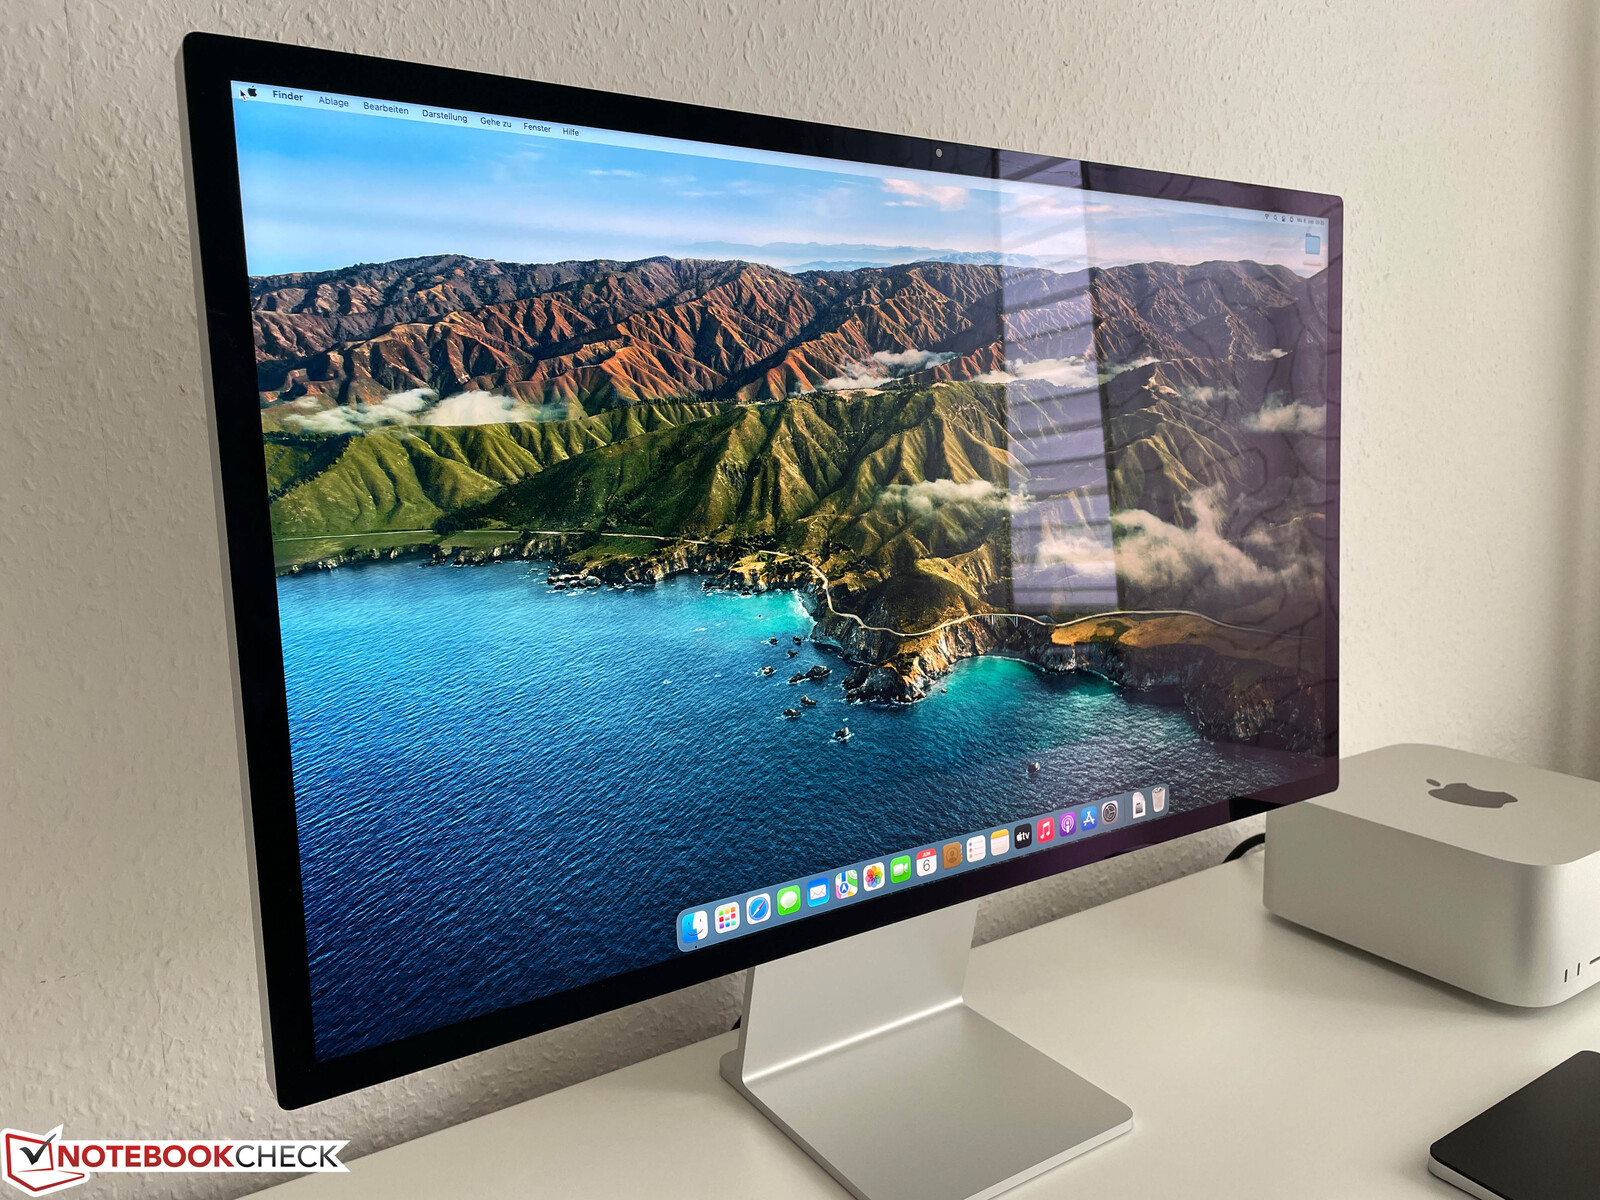
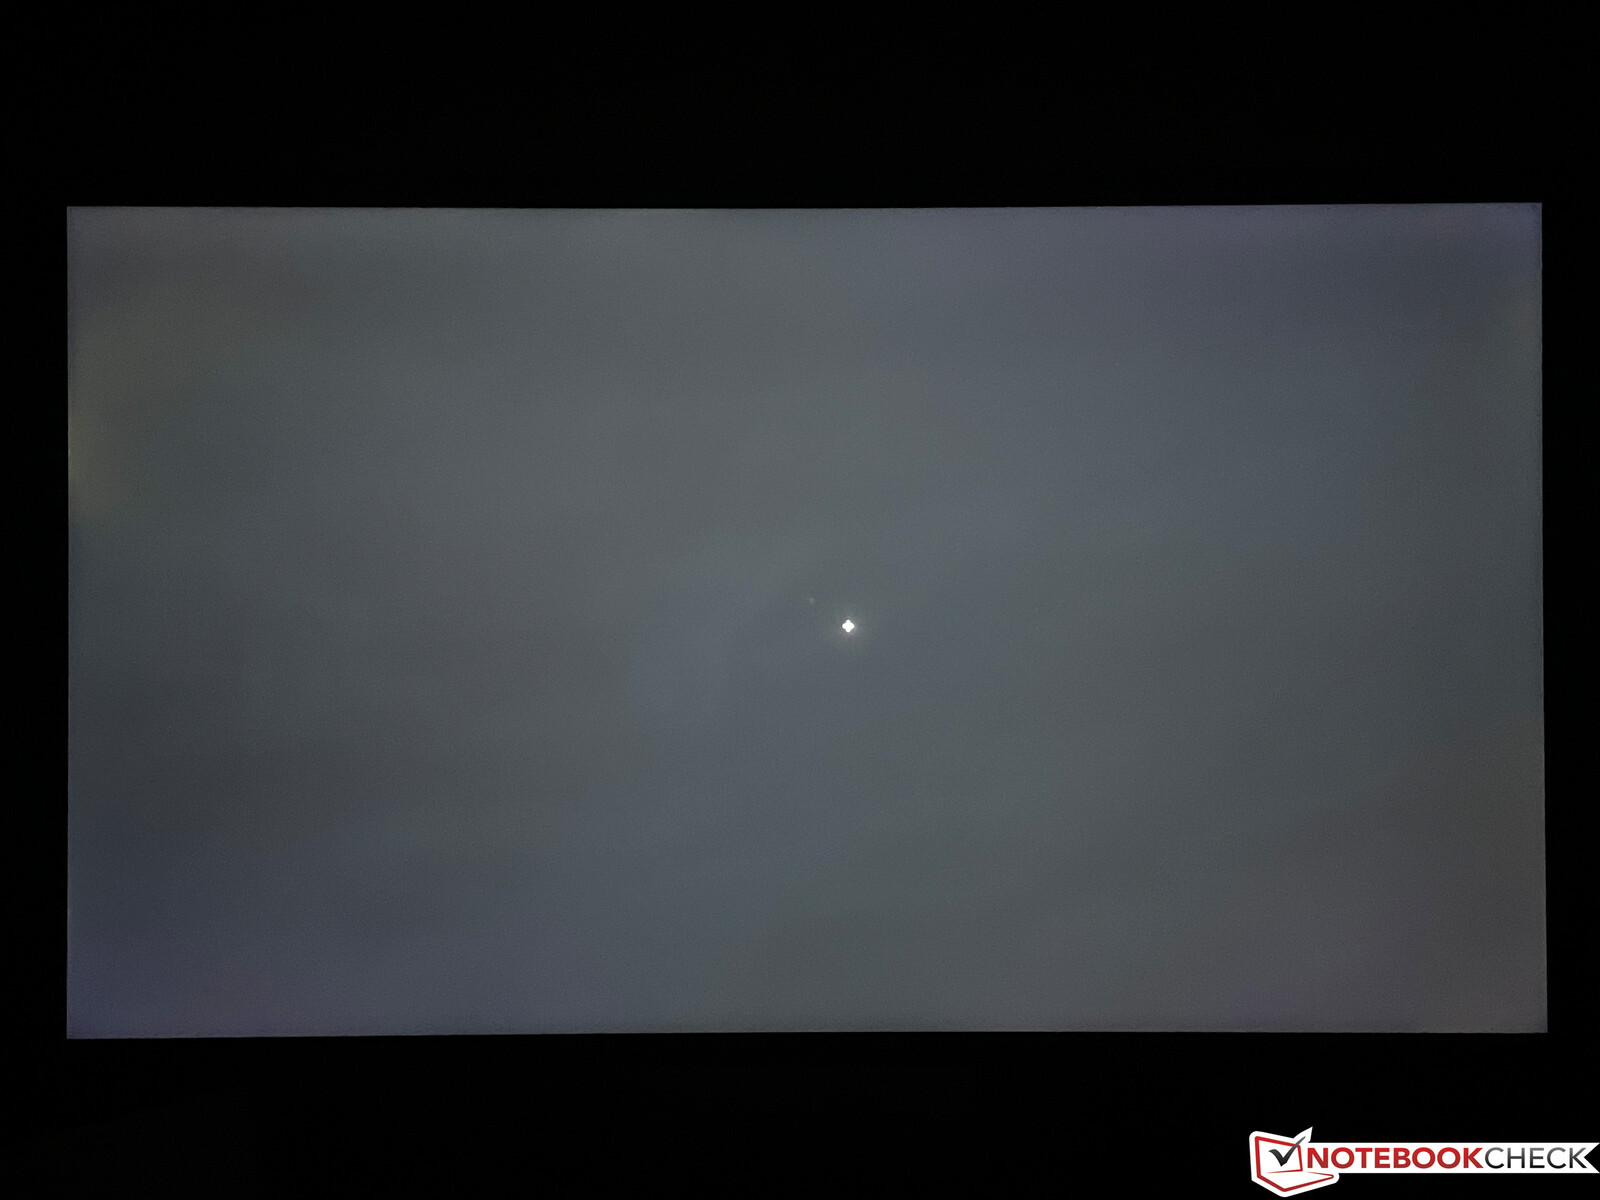
我们评测的是价格为1,749欧元(约合1,827美元)的Studio显示器的普通版本,也就是带有标准光面玻璃的版本。就像MacBooks一样,Apple ,把这称为抗反射涂层,至少从主观上看,反射程度非常相似,与许多其他光面显示器相比,反射程度相当低。尽管如此,你应该事先看一下你的周围环境。背景光源或窗户会导致反射(见图)。不过,如果你想安全起见,你也可以选择带有纳米纹理玻璃的版本,这是一种亚光表面。我们能够审查纳米纹理玻璃在一台iMac 27(2020年的型号)一段时间前,但主观质量印象在这里受到轻微影响,图像根本没有普通版本那么鲜艳。
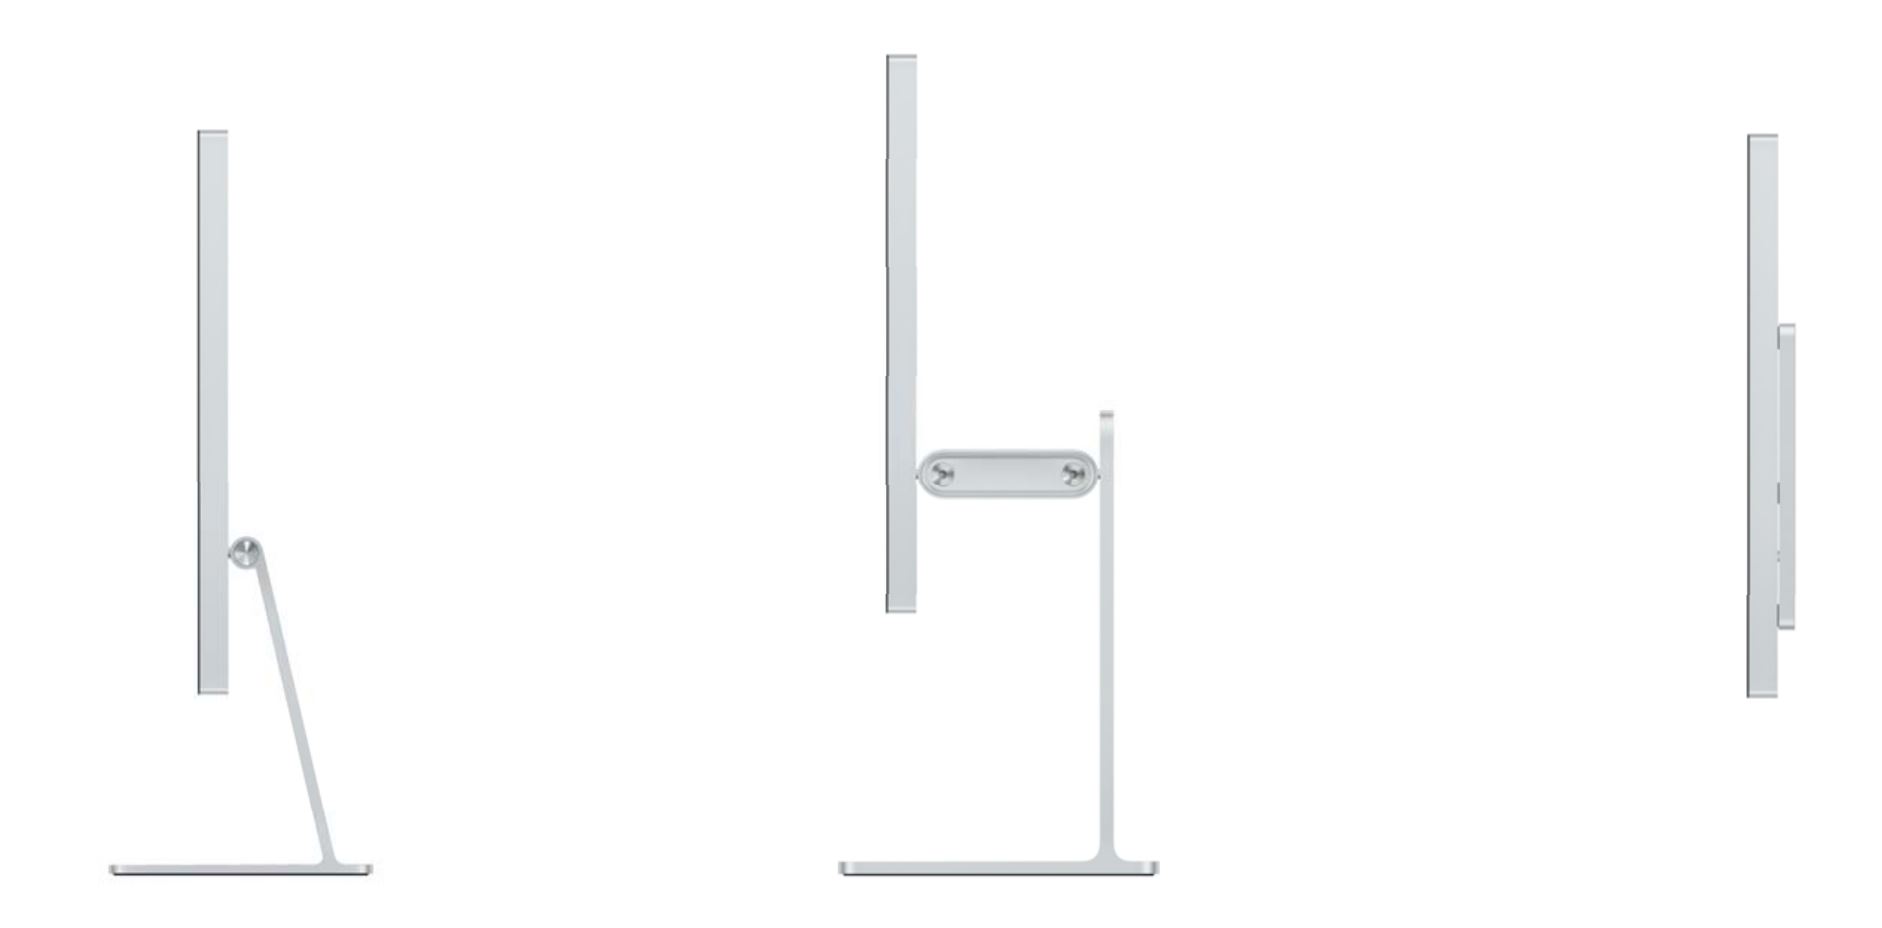
与Pro Display XDR不同,Studio Display默认配备了一个倾斜支架。然而,Apple ,还提供倾斜和高度可调的支架,以及VESA适配器作为选项,买方必须在购买时决定一个变量。VESA适配器是免费提供的,但高度可调的支架需要460欧元(约480美元)的高额价格。

端口也与Pro Display XDR相匹配,因为有一个Thunderbolt 3端口也作为输入源,以及三个额外的USB-C端口(3.2 Gen.2,10 Gbit/s)用于额外的外围设备。笔记本电脑可以通过Thunderbolt端口以高达96瓦的功率充电。这对所有iPad、MacBook Airs和14英寸以下的MacBook Pro机型来说是理想的,这些机型在发货时都配有最大96瓦的电源适配器。不言而喻,Studio显示器也可用于MacBook Pro 16或旧的15英寸版本,但在这些情况下,你需要将设备也连接到电源适配器上,以获得全部性能。
与Mac Studio的连接也是通过Thunderbolt电缆完成的,整个设置非常简单。只要Mac打开,图像也会出现;总的来说,设置工作根本没有问题,而且非常容易进行。像往常一样,亮度传感器工作良好,你很快就会习惯True Tone技术(根据环境光线自动调整色温)。理论上,输入设备可以直接连接到显示器上,但只有当你使用有线连接或无线USB加密狗;蓝牙输入设备需要分别连接到Mac Studio、MacBook或iPad上。
工作室显示器与Windows笔记本电脑相结合
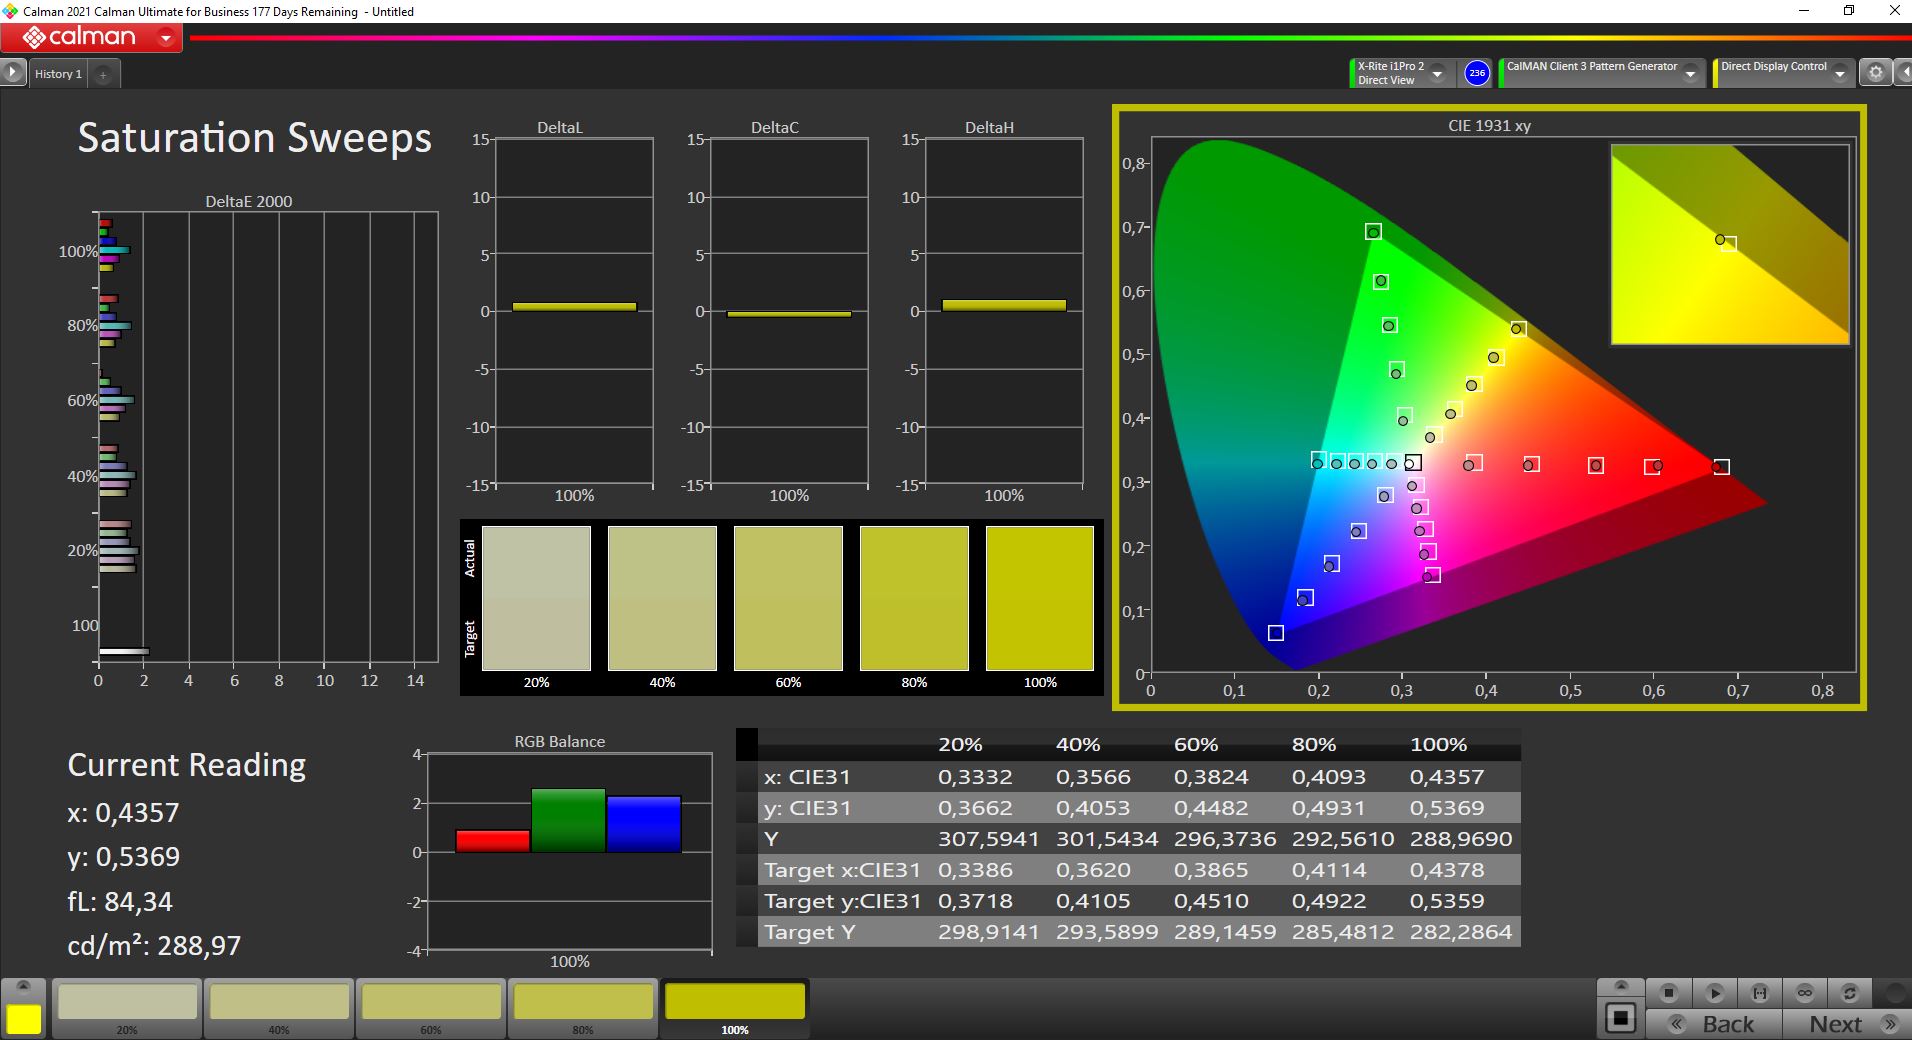
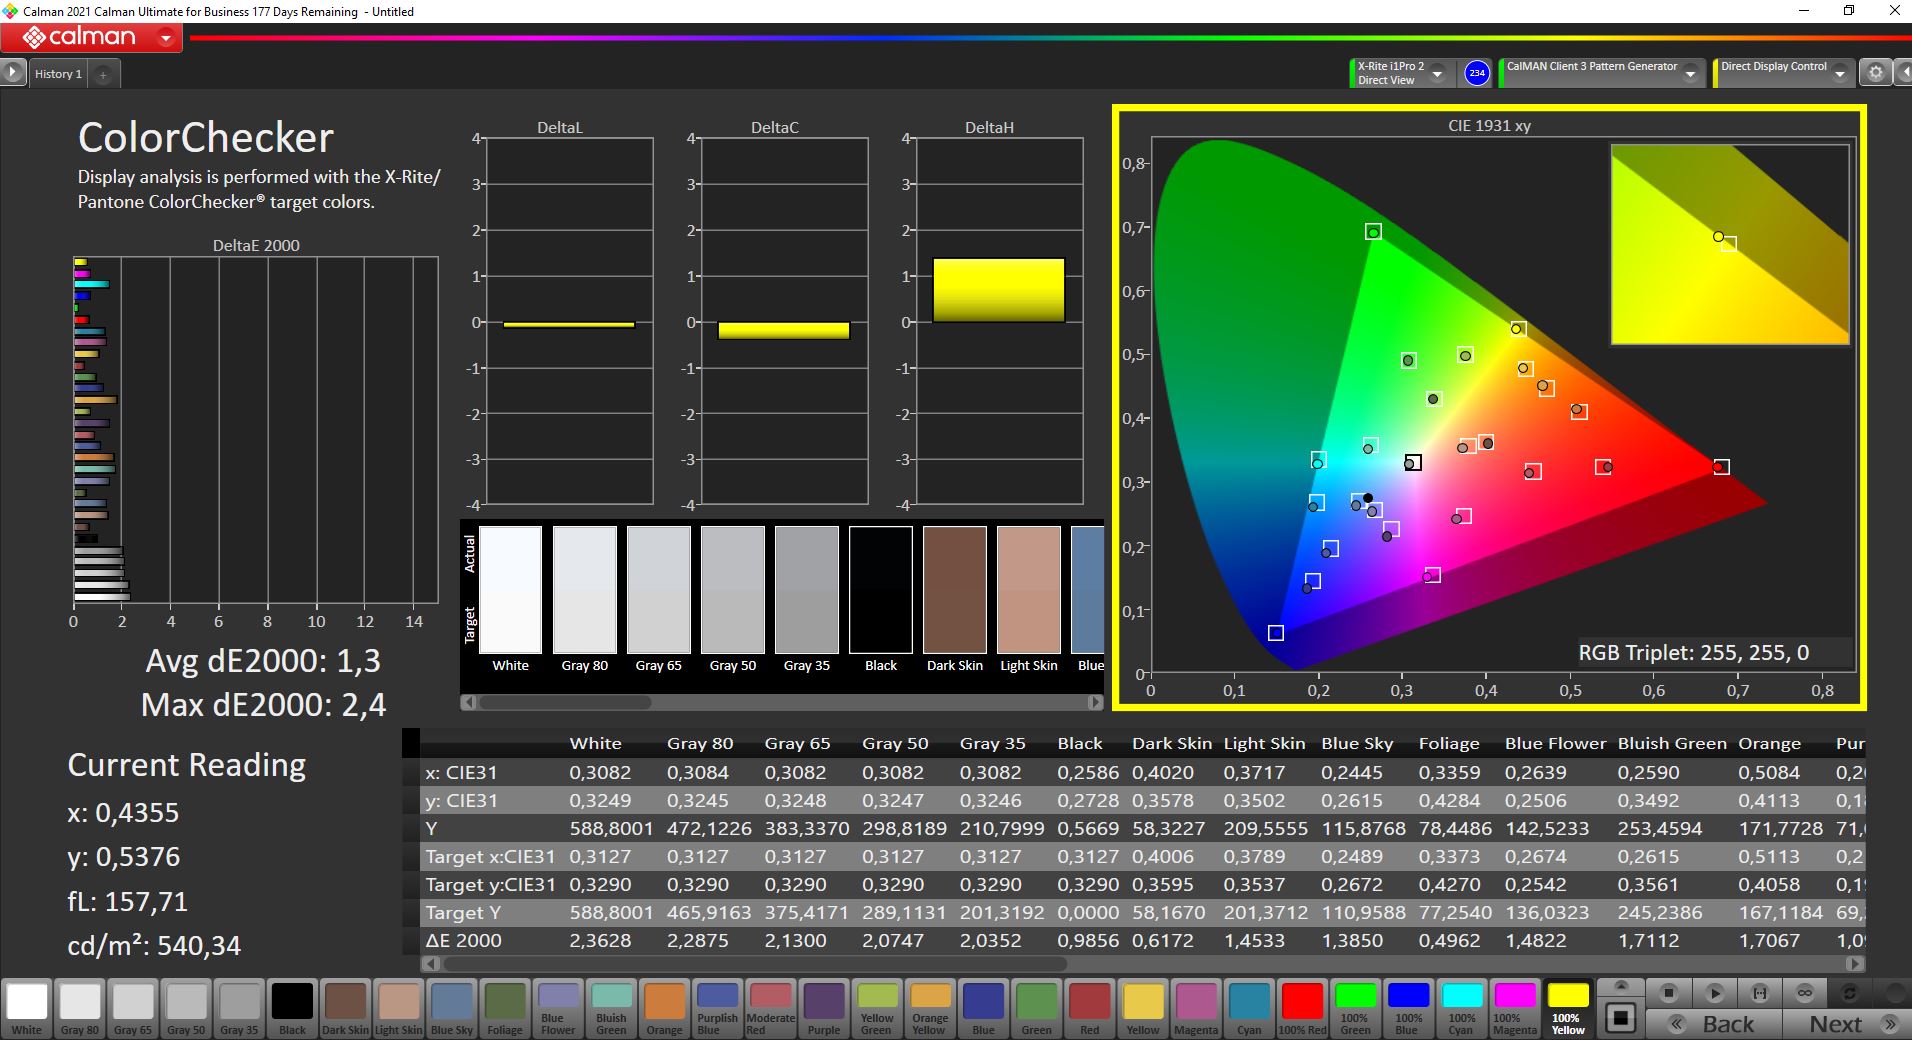
正如我们前面提到的,Studio Display可以与Apple MacBooks一起使用,但你也可以简单地通过USB-C连接Windows笔记本电脑。Studio Display在这里也能提供最大96瓦的功率,这对几乎所有紧凑的次笔记本来说都是足够的。我们用一台华硕Zenbook S 13例如,通过USB 4连接。然而,与Apple 源设备相比,其功能范围是有限的。网络摄像头和扬声器可以工作,你也可以将输入设备连接到Studio Display(但只能使用电缆/加密狗),但像自动亮度控制或True Tone这样的东西却不能工作。在任何情况下,自动安装匹配的Studio Display色彩配置文件的事实是积极的,根据我们的测量,图像质量与使用Apple 设备时观察到的图像质量相吻合(后面会有更多内容)。
连接性 - Mac Studio只配备了80MHz的Wi-Fi 6
SD卡阅读器
在速度方面,Mac Studio前面的全功能读卡器与最新的MacBook Pro机型不相上下。使用我们的参考卡(Angelbird AV Pro V60),在复制图像文件时,我们能够测量到121MB/s的传输速度。
| SD Card Reader - average JPG Copy Test (av. of 3 runs) | |
| Apple iMac 27 Mid 2020 (Toshiba Exceria Pro SDXC 64 GB UHS-II) | |
| Apple MacBook Pro 14 2021 M1 Pro Entry (AV PRO V60) | |
| Apple MacBook Pro 16 2021 M1 Pro (Angelbird AV Pro V60) | |
| Apple Mac Studio 2022 M1 Max (Angelbird AV Pro V60) | |
| Apple iMac Pro (Toshiba Exceria Pro SDXC 64 GB UHS-II) | |
沟通
Mac Studio中的M1 Max支持Wi-Fi 6,但仍然只有80 MHz。然而,结合我们来自华硕的新参考路由器,性能比采用M1 SoC的MacBook机型略好,传输速率在850至950 MB/s之间。尽管如此,你应该能够期望在一台价格超过3000欧元(约3133美元)的最新设备中至少有160赫兹的Wi-Fi 6或最新的Wi-Fi 6E标准。
| Networking | |
| iperf3 transmit AX12 | |
| Average 802.11 a/b/g/n/ac/ax (405 - 1750, n=103) | |
| Apple MacBook Pro 16 2021 M1 Pro | |
| Apple iMac 24 M1 2021 | |
| Apple iMac Pro | |
| Apple MacBook Pro 14 2021 M1 Pro Entry | |
| Apple iMac 27 Mid 2020 | |
| iperf3 receive AX12 | |
| Average 802.11 a/b/g/n/ac/ax (284 - 1414, n=103) | |
| Apple MacBook Pro 16 2021 M1 Pro | |
| Apple MacBook Pro 14 2021 M1 Pro Entry | |
| Apple iMac 27 Mid 2020 | |
| Apple iMac Pro | |
| Apple iMac 24 M1 2021 | |
| iperf3 receive AXE11000 | |
| Apple Mac Studio 2022 M1 Max | |
| Average of class Desktop (n=1last 2 years) | |
| Apple MacBook Pro 16 2021 M1 Pro | |
| Average 802.11 a/b/g/n/ac/ax (234 - 1696, n=166) | |
| iperf3 transmit AXE11000 | |
| Apple Mac Studio 2022 M1 Max | |
| Average 802.11 a/b/g/n/ac/ax (214 - 1757, n=168) | |
| Apple MacBook Pro 16 2021 M1 Pro | |
| Average of class Desktop (n=1last 2 years) | |
网络摄像头
Studio Display提供了一个具有超广角(f/2.4光圈)的1200万像素摄像头,以及追踪模式Center Stage。这一功能是与 iPad Pro 2021,它也配备了1200万像素的广角摄像头。当然,与其他笔记本网络摄像头相比,质量更好,而且该摄像头非常适用于视频通话。中心舞台功能也运作良好,允许用户在摄像头前移动,同时保持对焦。在我们的测试中,麦克风也运作良好,通过Siri进行语音控制也很可靠。


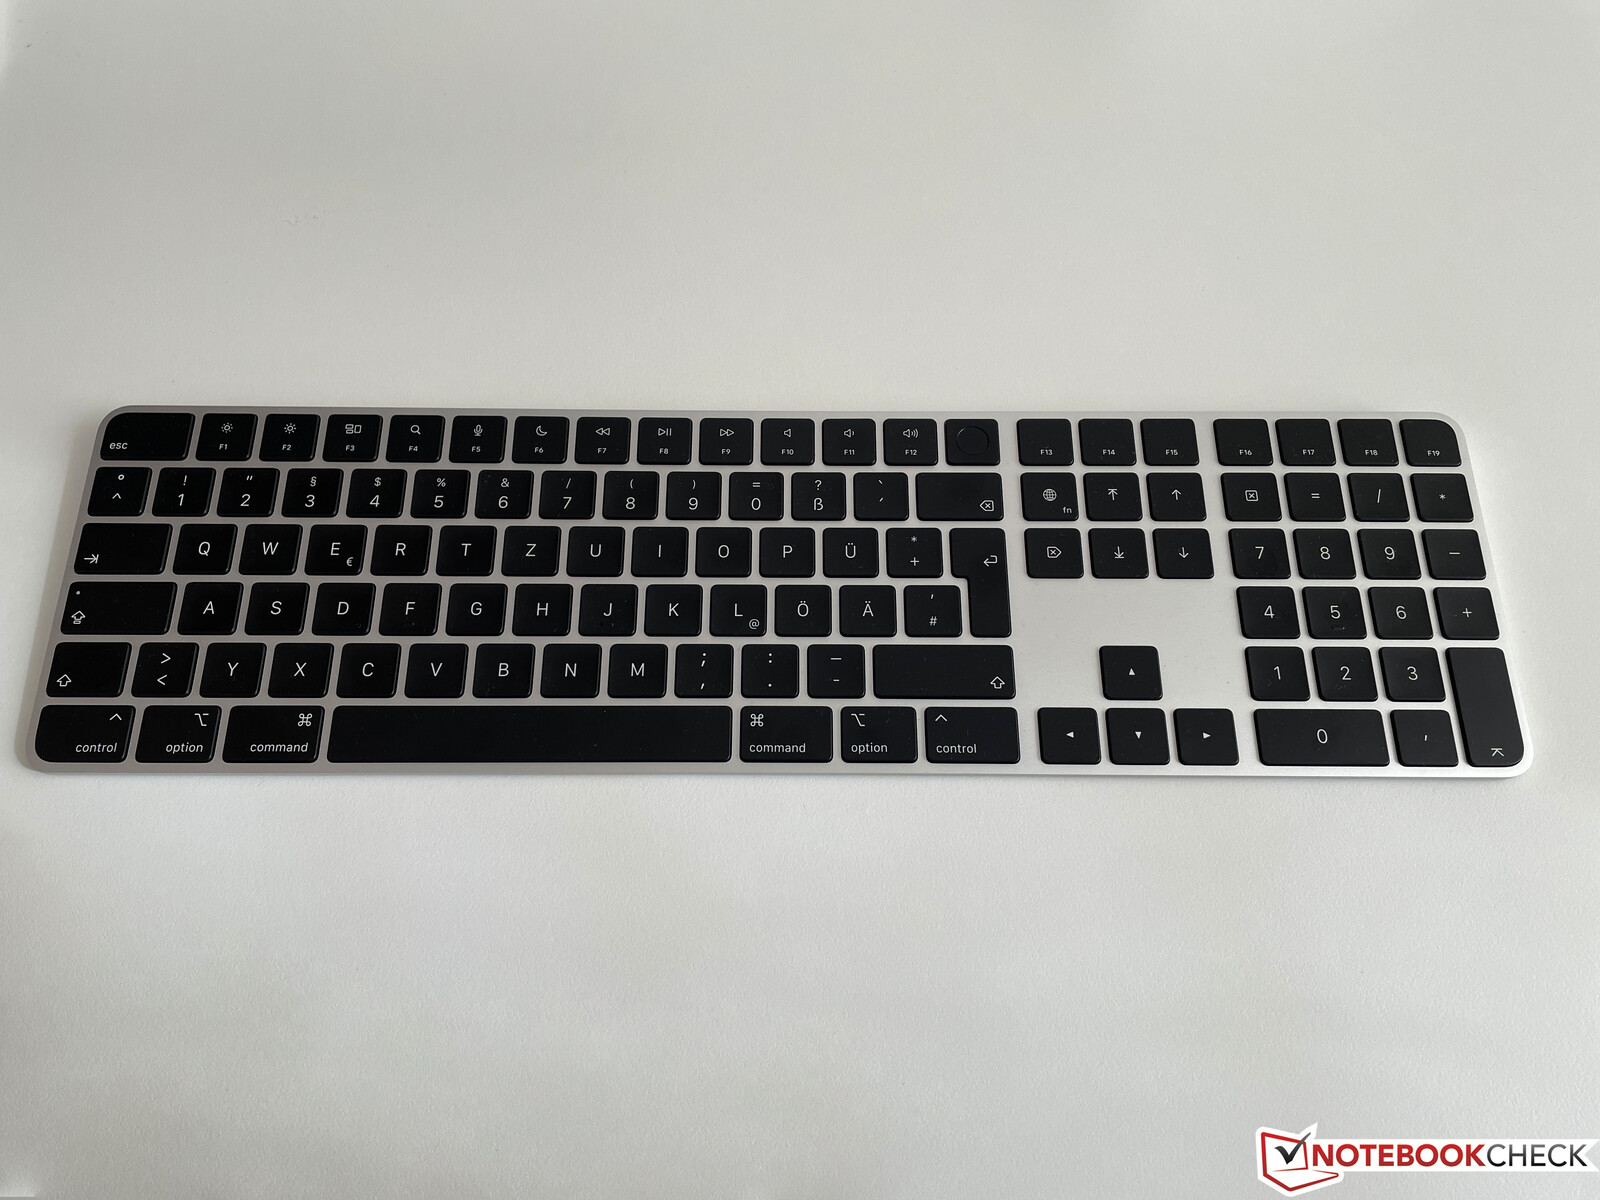
输入设备 - 伟大的MagicPad和无背光键盘
Apple 继续提供常用的输入设备,但这些设备必须从Mac Studio单独购买。主要优势是完美的 ,包括Touch ID。Magic Trackpad工作得非常好,非常直观,特别是如果你已经熟悉在MacBook上使用它。魔术鼠标也很好用;唯一的不便是位于鼠标底部的 ,用于充电。 Apple Lightning
然而,键盘的问题就比较多了,因为对于桌面输入来说,键程很短,至少我们的键盘样品在打字时听起来有点嘎嘎响。然而,按键本身是精确的,而且打字体验基本上与最新的MacBook Pro机型相当。不过,一个明显的不足之处是缺乏背光。虽然Touch ID等便利功能很实用,但考虑到这是一款桌面键盘,肯定还有改进的余地。
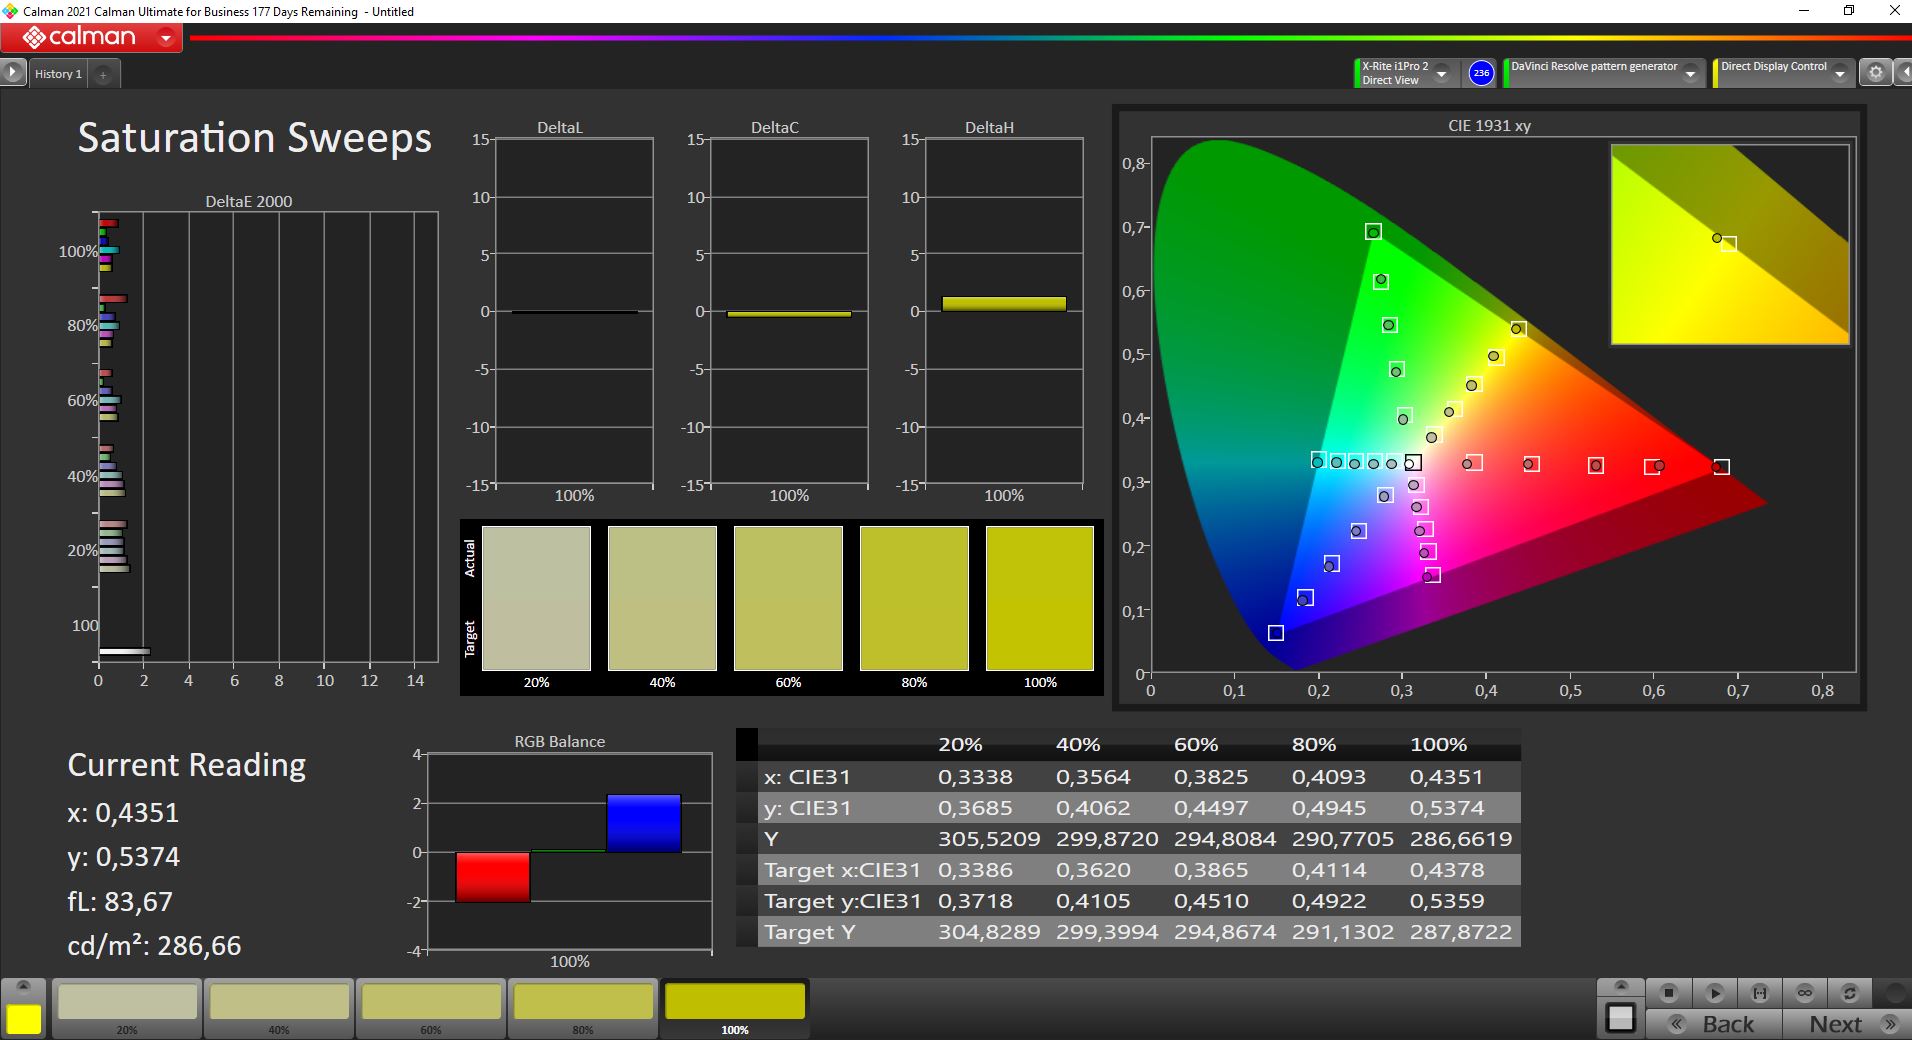
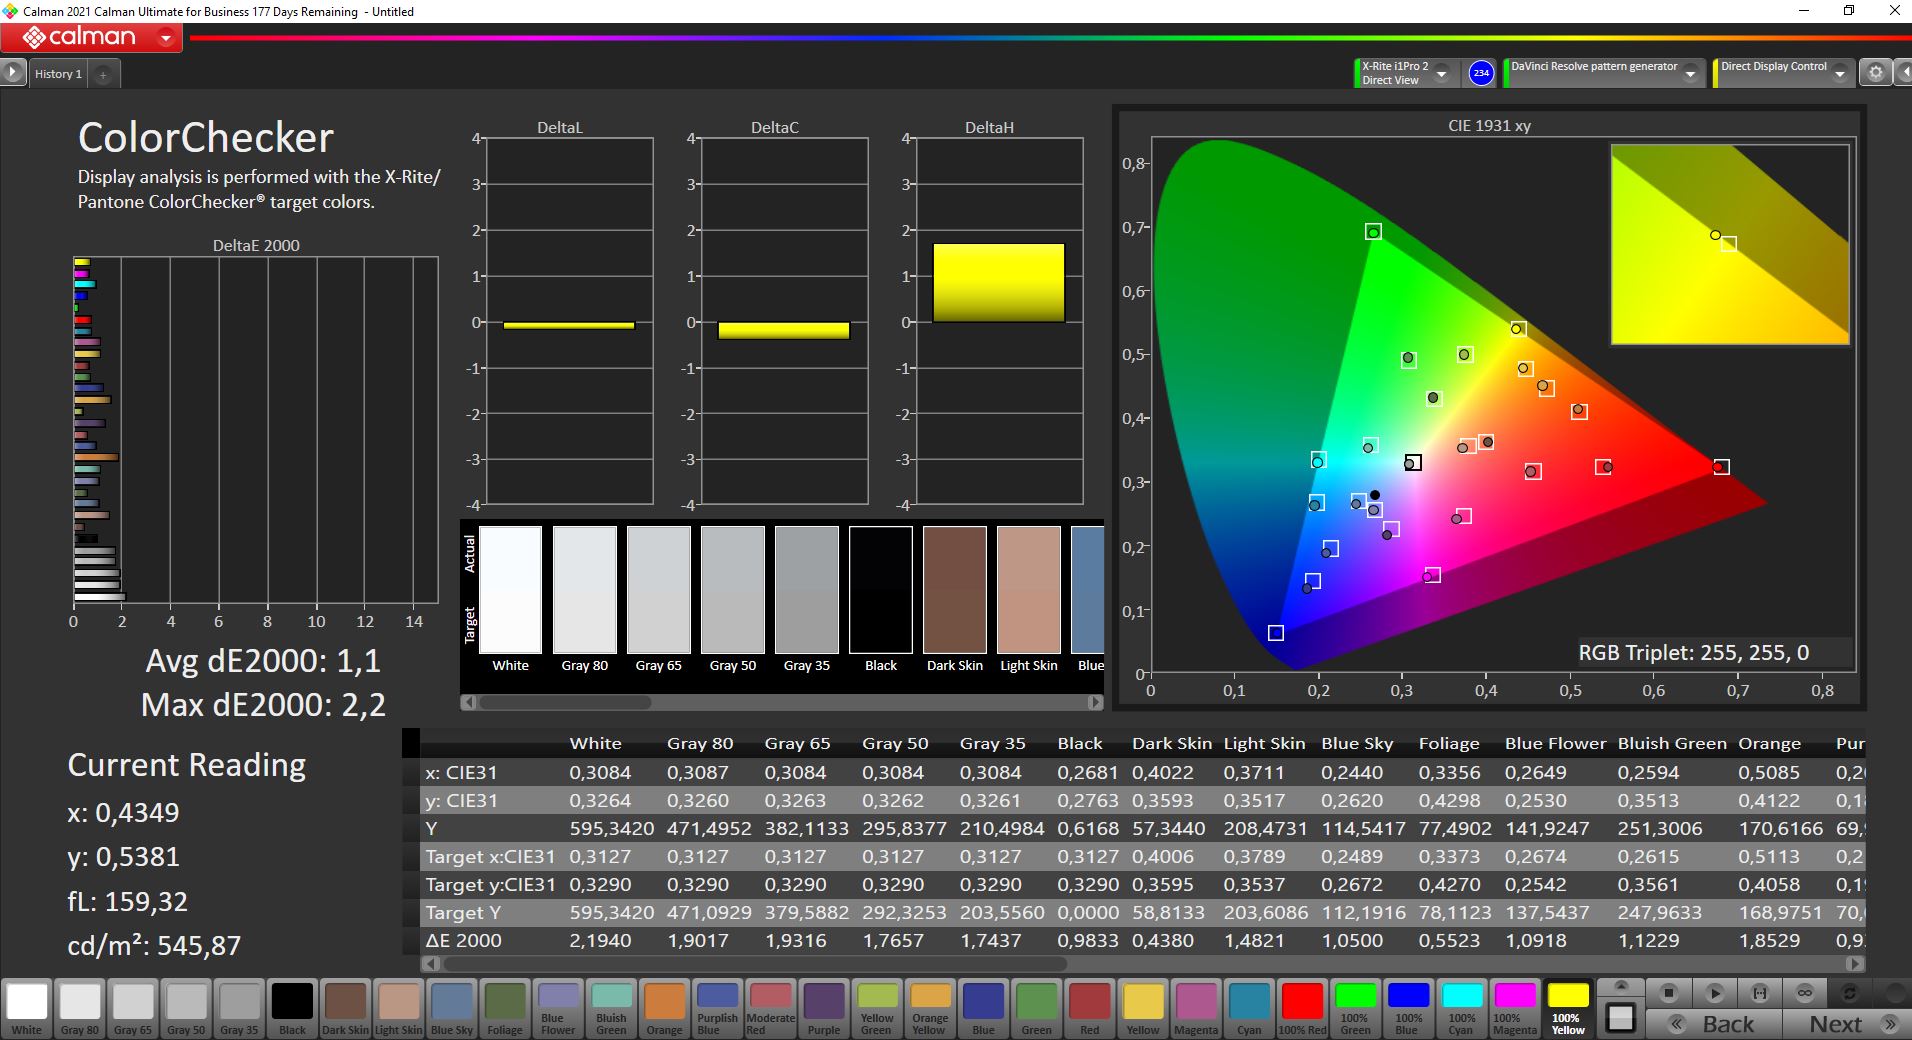
显示器 - 5K IPS,60 Hz
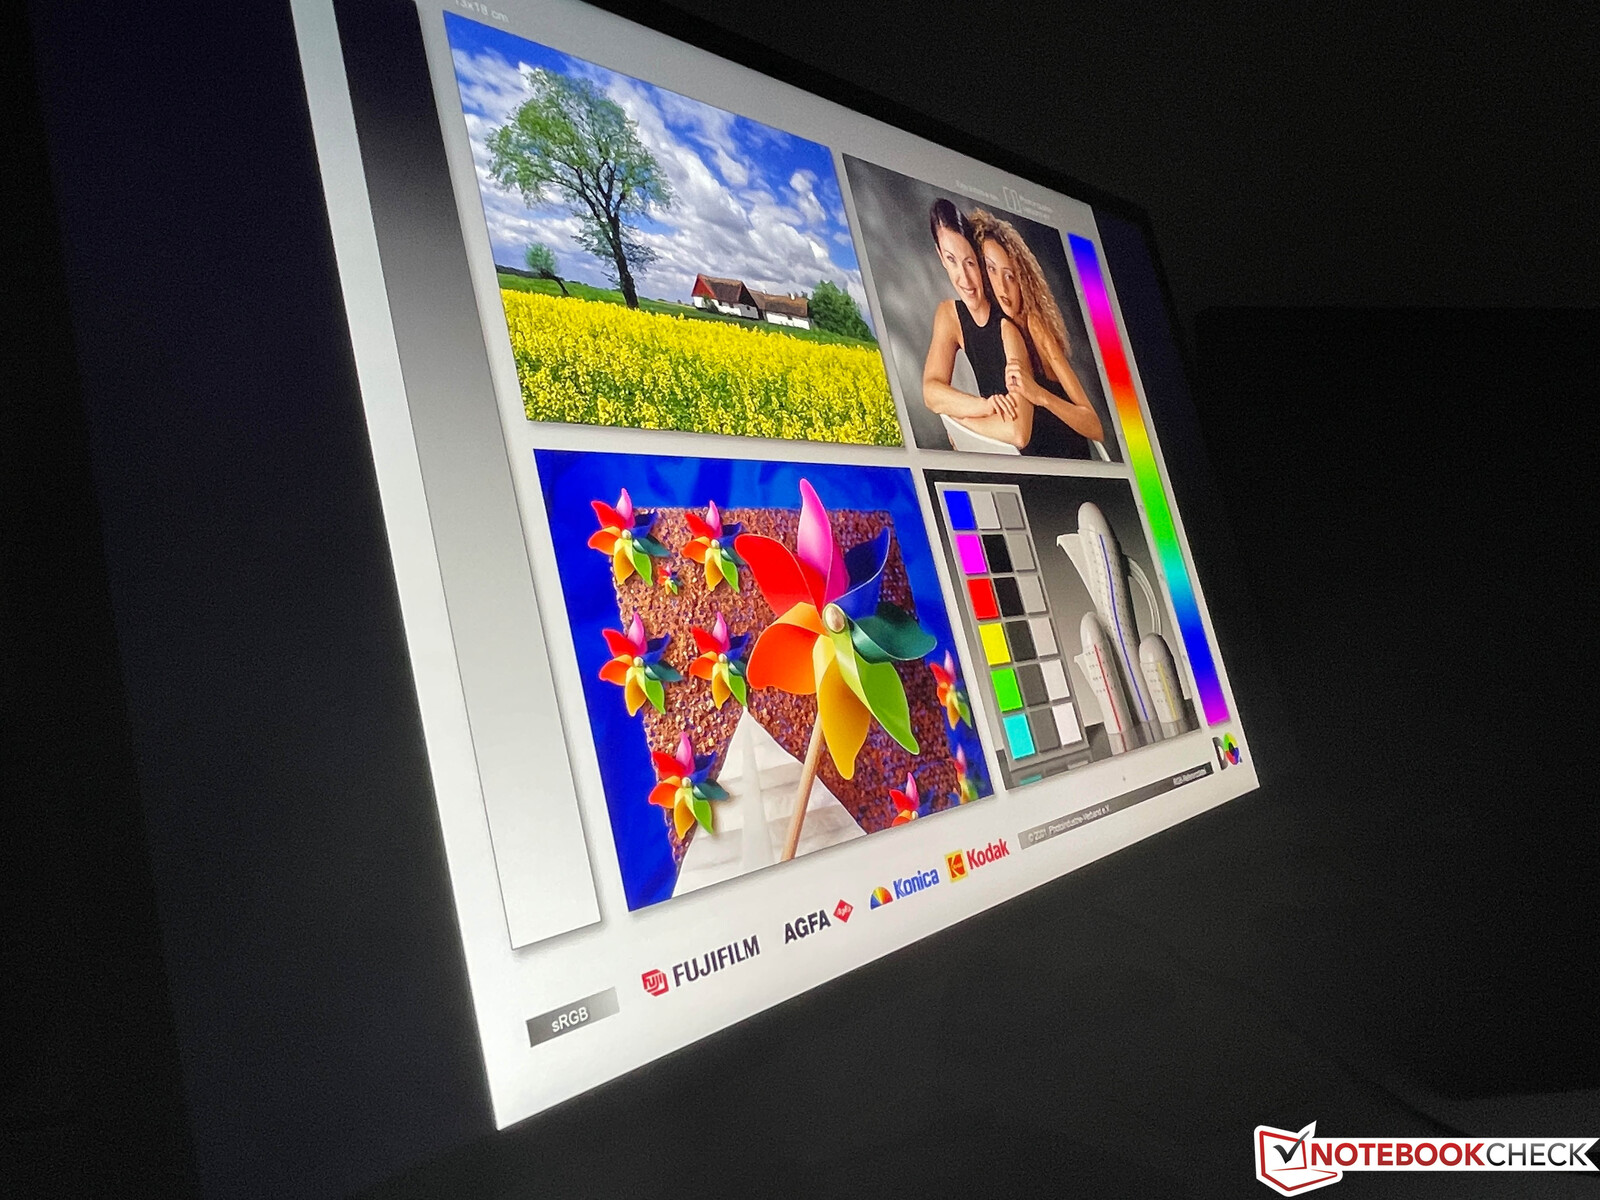
我们已经谈到了工作室显示器的基本规格,总体而言,考虑到其高昂的价格,60赫兹IPS显示器的技术规格并不令人惊叹。然而,这并不影响其伟大的主观图像质量,因为内容是锐利的,图像看起来简直是辉煌。但与采用新的Mini LED面板的MacBook Pro型号(14和16英寸)不同,不支持HDR内容。
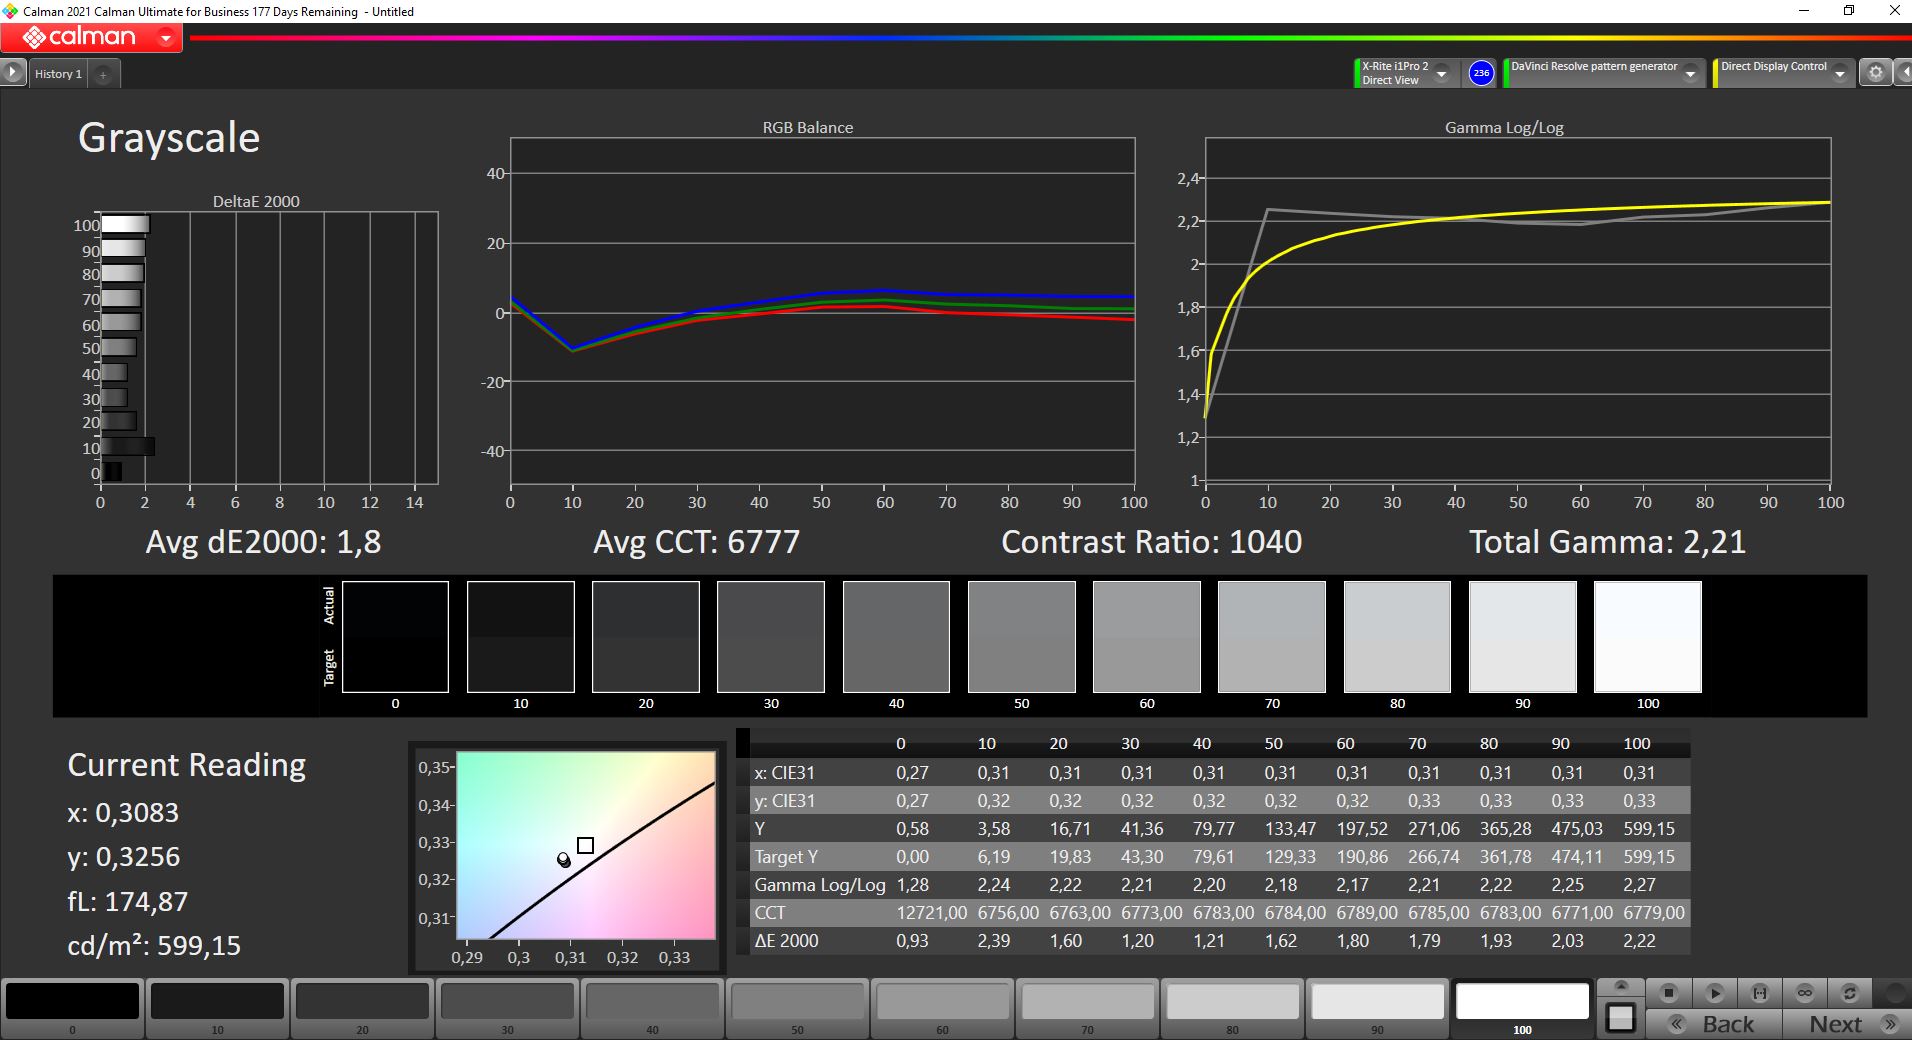
Apple 指定的亮度水平高达600尼特,这一点我们在测量中也可以确认(平均571cd/m²)。也就是说,高亮度也伴随着高黑度,因为0.58cd/m²对于高质量的显示器来说太高了;因此,对比度只有~1,000:1。不过,即使在全亮度的情况下,屏幕出血现象也是微乎其微的,而且我们也检测不到任何PWM。此外,对于一个普通的IPS面板来说,响应时间非常好。IPS面板的可视角度稳定性也非常好。

| |||||||||||||||||||||||||
Brightness Distribution: 88 %
Contrast: 1033:1 (Black: 0.58 cd/m²)
ΔE ColorChecker Calman: 1.1 | ∀{0.5-29.43 Ø4.73}
ΔE Greyscale Calman: 1.8 | ∀{0.09-98 Ø4.97}
Gamma: 2.21
CCT: 6777 K
| Apple Studio Display 2022 5120x2880, 27" | Apple iMac 27 Mid 2020 APPAE32, IPS, 5120x2880, 27" | Apple iMac Pro APPAE1E, , 5120x2880, 27" | Apple iMac 24 M1 2021 IPS, 4480x2520, 23.5" | |
|---|---|---|---|---|
| Display | ||||
| Display P3 Coverage (%) | 98.4 | 98.7 | 99 | 97.7 |
| sRGB Coverage (%) | 100 | 100 | 100 | |
| AdobeRGB 1998 Coverage (%) | 89.5 | 88.8 | 86.6 | |
| Response Times | ||||
| Response Time Grey 50% / Grey 80% * (ms) | 28.8 ? | 27.2 ? | 30.4 ? | 29.2 ? |
| Response Time Black / White * (ms) | 20 ? | 12.4 ? | 18.8 ? | 17.6 ? |
| PWM Frequency (Hz) | 22730 ? | 208.3 ? | ||
| Screen | ||||
| Brightness middle (cd/m²) | 599 | 529 | 496 | 523 |
| Brightness (cd/m²) | 571 | 511 | 468 | 479 |
| Brightness Distribution (%) | 88 | 88 | 87 | 82 |
| Black Level * (cd/m²) | 0.58 | 0.48 | 0.54 | 0.37 |
| Contrast (:1) | 1033 | 1102 | 919 | 1414 |
| Colorchecker dE 2000 * | 1.1 | 1.4 | 3 | 1.1 |
| Colorchecker dE 2000 max. * | 2.2 | 2.6 | 5.8 | 2 |
| Greyscale dE 2000 * | 1.8 | 2.2 | 2.5 | 1.5 |
| Gamma | 2.21 100% | 2.32 95% | 2.22 99% | 2.16 102% |
| CCT | 6777 96% | 6826 95% | 6824 95% | 6729 97% |
| Color Space (Percent of AdobeRGB 1998) (%) | 80 | 79.4 | ||
| Color Space (Percent of sRGB) (%) | 100 | 100 | ||
| Colorchecker dE 2000 calibrated * | 0.9 | 0.4 | ||
| Total Average (Program / Settings) |
* ... smaller is better
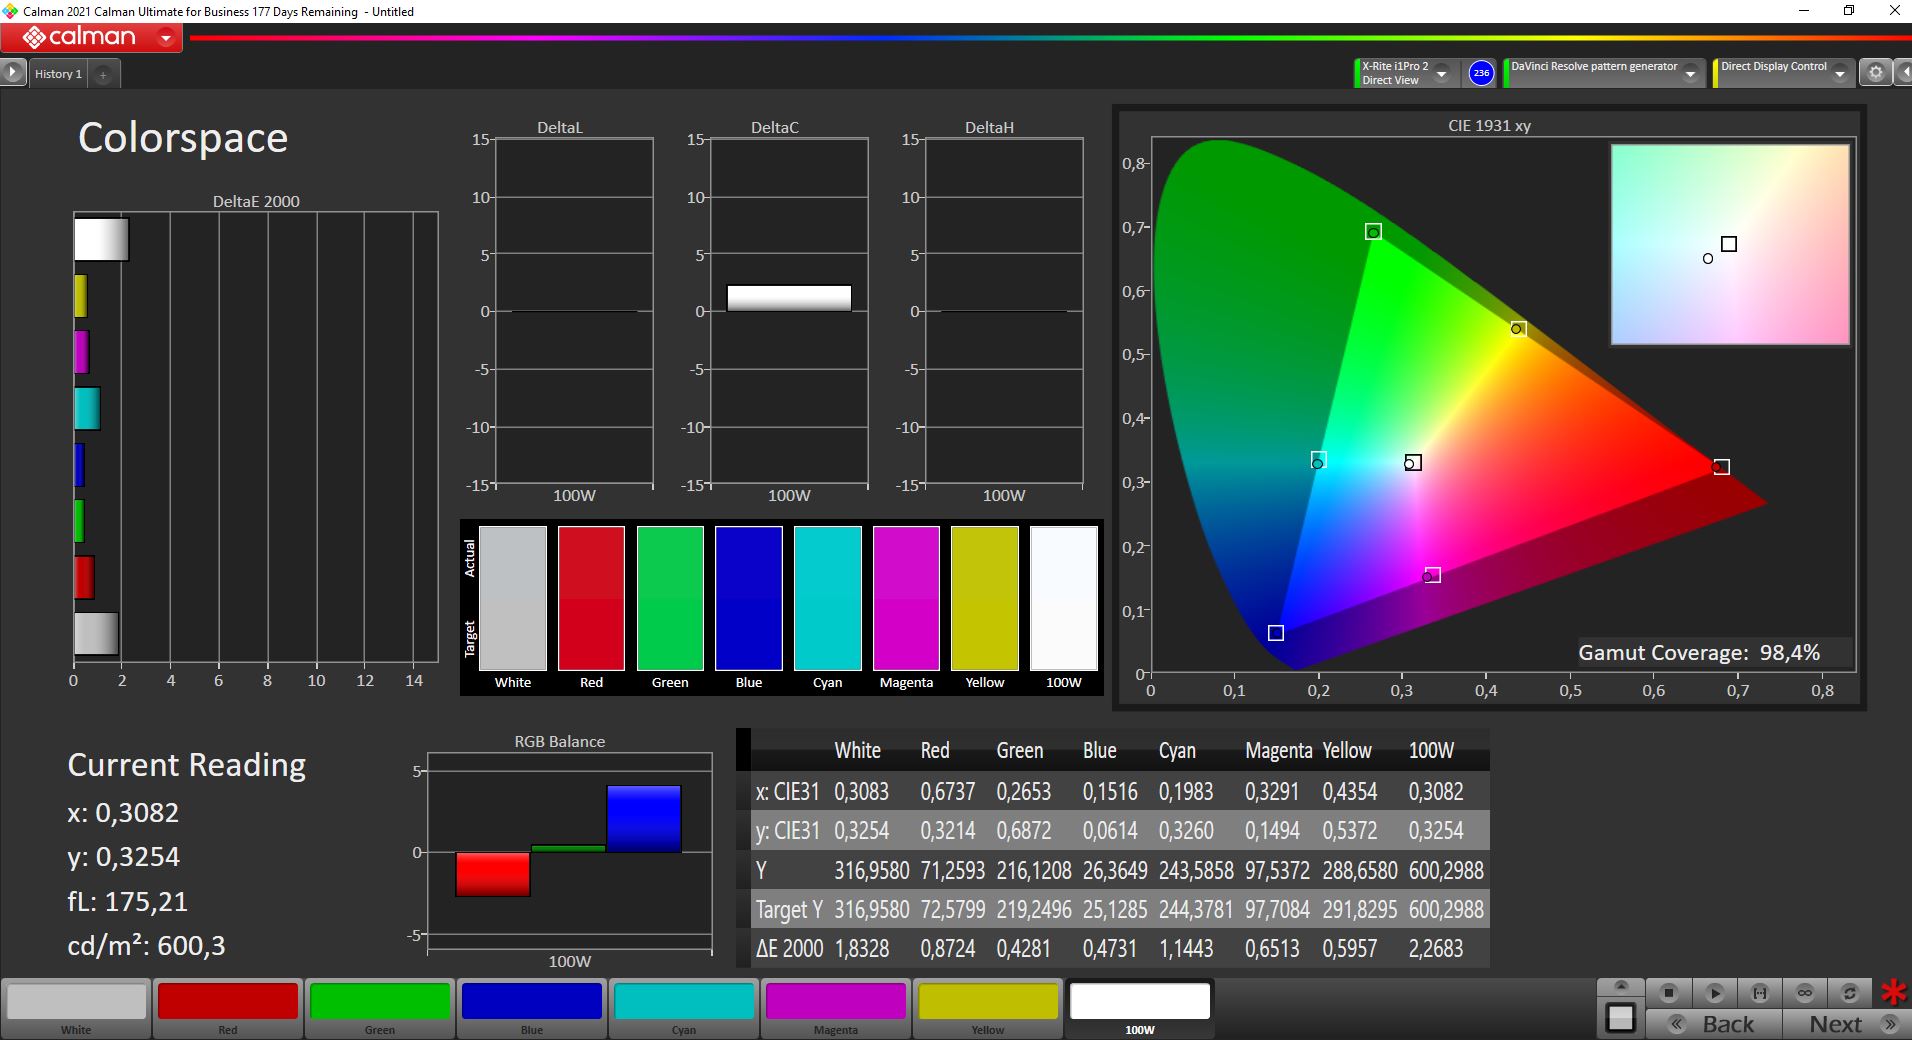
Studio显示器几乎完全覆盖了P3色彩空间,但在连接到Mac时,也可以使用其他参考模式。
开箱后的图像再现已经非常好了,除了灰度中最小的蓝色色调(这在实践中并不明显),没有什么可抱怨的。灰度和所有颜色的平均DeltaE 2000偏差已经远远低于3的重要标志。在使用Windows笔记本电脑作为信号源时,也保持了这种质量。

Display Response Times
| ↔ Response Time Black to White | ||
|---|---|---|
| 20 ms ... rise ↗ and fall ↘ combined | ↗ 12.4 ms rise | 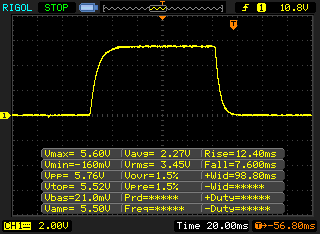 |
| ↘ 7.6 ms fall | ||
| The screen shows good response rates in our tests, but may be too slow for competitive gamers. In comparison, all tested devices range from 0.1 (minimum) to 240 (maximum) ms. » 44 % of all devices are better. This means that the measured response time is similar to the average of all tested devices (19.9 ms). | ||
| ↔ Response Time 50% Grey to 80% Grey | ||
| 28.8 ms ... rise ↗ and fall ↘ combined | ↗ 14 ms rise | 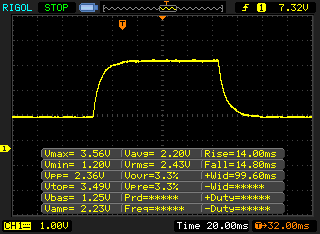 |
| ↘ 14.8 ms fall | ||
| The screen shows relatively slow response rates in our tests and may be too slow for gamers. In comparison, all tested devices range from 0.165 (minimum) to 636 (maximum) ms. » 38 % of all devices are better. This means that the measured response time is similar to the average of all tested devices (31.1 ms). | ||
Screen Flickering / PWM (Pulse-Width Modulation)
| Screen flickering / PWM not detected | 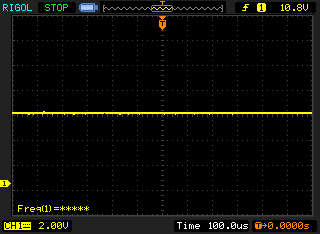 | ||
In comparison: 52 % of all tested devices do not use PWM to dim the display. If PWM was detected, an average of 7794 (minimum: 5 - maximum: 343500) Hz was measured. | |||
性能 - Mac Studio与M1 Max
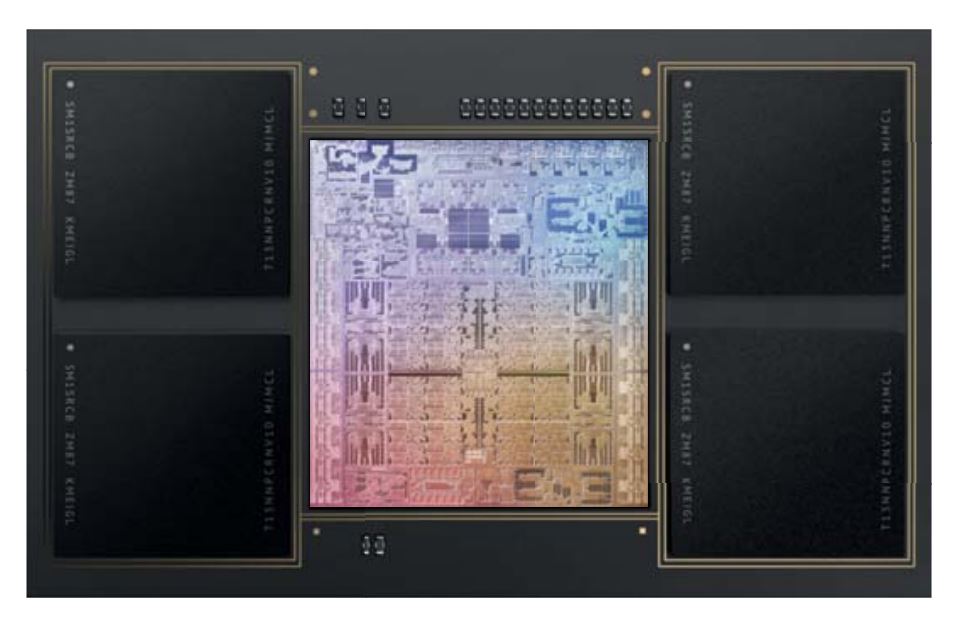
Mac Studio有两种基本配置,一种是我们从MacBooks中熟悉的M1 Max SoC(有24或32个GPU内核),另一种是新的M1 Ultra。M1 Ultra结合了两个 M1 Max SoCApple 称之为Ultra Fusion。这使CPU和GPU核心的数量增加了一倍。
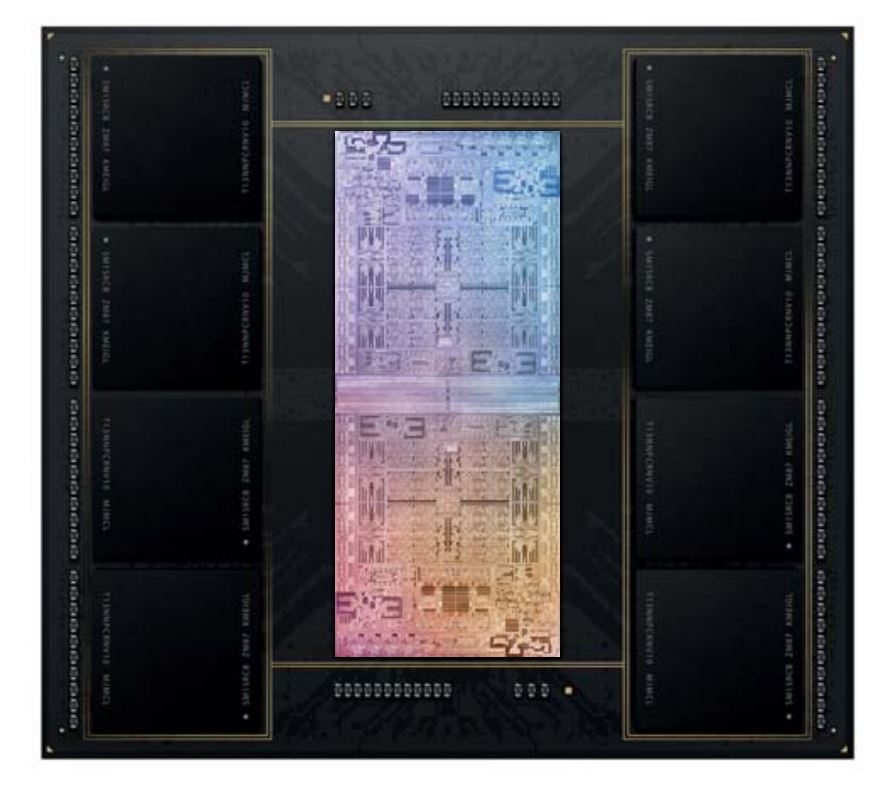
总的来说,你可以在四个SoC型号中选择,但只有M1 Ultra提供了获得高达128GB内存的可能性。存储容量截止到8TB,而且Apple ,升级的费用也很高。顶级Mac Studio型号(M1 Ultra,128GB内存和8TB固态硬盘存储)的价格为9200欧元(约合人民币9608元)。
就纯粹的性能而言,Mac Studio和MacBook Pro 16.0之间没有区别。MacBook Pro 16M1 Max,但台式机放弃了MacBook的额外性能模式(性能模式和静音模式);然而,考虑到不断运行的风扇,特别是静音模式可能不是一个坏的选择。正如我们对MacBook Pro 16的评测一样,我们可以从拥有32个GPU核心的M1 Max中获得约84瓦的最大消耗量(封装功率),其中CPU最多需要30瓦,GPU最多44瓦。在持续负载下,性能也保持在一个恒定的水平。由于风扇仍有很大的余量,我们假设M1 Ultra的大约170瓦也能充分冷却,但两个风扇届时可能会有更多的工作要做。
处理器 - 10个核心的M1
至于处理器,我们可以简单说一下,因为我们已经对拥有10个核心的M1(无论它是专业版还是最大版)非常了解,我们刚刚在我们的 关于当前移动处理器的综合效率文章中进行了分析.该CPU总共由三个集群组成,一个有2个核心的效率集群,以及两个各有4个核心的性能集群。这些核心不支持超线程,因此 "只能 "并行处理10个线程。
尽管如此,性能还是非常好,与其他消耗更多电力的移动处理器相当。然而,这也是棘手的部分,因为Mac Studio不是一台笔记本电脑。虽然效率仍然非常好,但M1 Max在性能方面显然不如其他桌面处理器和移动处理器。
如果我们假设M1 Ultra的性能是它的两倍,情况就会有所不同。我们将使用Cinebench R23进行比较,因为该基准在Mac上原生运行(R15和R20必须通过Rosetta 2进行模拟)。消耗量约为60瓦的20核CPU将快于英特尔酷睿i7-12700H这里的功耗约为120瓦。
Cinebench R15 Multi endurance test
Cinebench R23: Multi Core | Single Core
Cinebench R20: CPU (Multi Core) | CPU (Single Core)
Cinebench R15: CPU Multi 64Bit | CPU Single 64Bit
Blender: v2.79 BMW27 CPU
Geekbench 5.5: Multi-Core | Single-Core
| CPU Performance rating | |
| Average of class Desktop | |
| Intel Core i9-12900K | |
| Lenovo Legion 5 Pro 16 G7 i7 RTX 3070Ti | |
| Apple Mac Studio 2022 M1 Max | |
| Average Apple M1 Max | |
| Apple MacBook Pro 16 2021 M1 Max | |
| Apple iMac 27 Mid 2020 -2! | |
| Apple iMac 24 M1 2021 -1! | |
| Apple iMac Pro -7! | |
| Cinebench R23 / Multi Core | |
| Average of class Desktop (16119 - 44253, n=16, last 2 years) | |
| Intel Core i9-12900K | |
| Lenovo Legion 5 Pro 16 G7 i7 RTX 3070Ti | |
| Apple Mac Studio 2022 M1 Max | |
| Average Apple M1 Max (12385 - 12396, n=3) | |
| Apple MacBook Pro 16 2021 M1 Max | |
| Apple iMac 24 M1 2021 | |
| Cinebench R23 / Single Core | |
| Average of class Desktop (1722 - 2439, n=16, last 2 years) | |
| Intel Core i9-12900K | |
| Lenovo Legion 5 Pro 16 G7 i7 RTX 3070Ti | |
| Apple Mac Studio 2022 M1 Max | |
| Average Apple M1 Max (1530 - 1536, n=3) | |
| Apple MacBook Pro 16 2021 M1 Max | |
| Apple iMac 24 M1 2021 | |
| Cinebench R20 / CPU (Multi Core) | |
| Average of class Desktop (5710 - 17190, n=15, last 2 years) | |
| Intel Core i9-12900K | |
| Lenovo Legion 5 Pro 16 G7 i7 RTX 3070Ti | |
| Apple iMac 27 Mid 2020 | |
| Apple Mac Studio 2022 M1 Max | |
| Average Apple M1 Max (2735 - 2753, n=3) | |
| Apple MacBook Pro 16 2021 M1 Max | |
| Apple iMac 24 M1 2021 | |
| Cinebench R20 / CPU (Single Core) | |
| Average of class Desktop (674 - 922, n=15, last 2 years) | |
| Intel Core i9-12900K | |
| Lenovo Legion 5 Pro 16 G7 i7 RTX 3070Ti | |
| Apple iMac 27 Mid 2020 | |
| Apple iMac 24 M1 2021 | |
| Apple Mac Studio 2022 M1 Max | |
| Average Apple M1 Max (390 - 395, n=3) | |
| Apple MacBook Pro 16 2021 M1 Max | |
| Cinebench R15 / CPU Multi 64Bit | |
| Average of class Desktop (2652 - 6656, n=16, last 2 years) | |
| Intel Core i9-12900K | |
| Lenovo Legion 5 Pro 16 G7 i7 RTX 3070Ti | |
| Apple iMac 27 Mid 2020 | |
| Apple MacBook Pro 16 2021 M1 Max | |
| Apple Mac Studio 2022 M1 Max | |
| Average Apple M1 Max (1689 - 1693, n=3) | |
| Apple iMac Pro | |
| Apple iMac Pro | |
| Apple iMac 24 M1 2021 | |
| Cinebench R15 / CPU Single 64Bit | |
| Average of class Desktop (246 - 356, n=16, last 2 years) | |
| Intel Core i9-12900K | |
| Lenovo Legion 5 Pro 16 G7 i7 RTX 3070Ti | |
| Apple iMac 27 Mid 2020 | |
| Apple iMac 24 M1 2021 | |
| Average Apple M1 Max (197 - 210, n=3) | |
| Apple Mac Studio 2022 M1 Max | |
| Apple MacBook Pro 16 2021 M1 Max | |
| Apple iMac Pro | |
| Blender / v2.79 BMW27 CPU | |
| Apple iMac 27 Mid 2020 | |
| Apple MacBook Pro 16 2021 M1 Max | |
| Average Apple M1 Max (187 - 190, n=3) | |
| Apple Mac Studio 2022 M1 Max | |
| Lenovo Legion 5 Pro 16 G7 i7 RTX 3070Ti | |
| Intel Core i9-12900K | |
| Average of class Desktop (75 - 218, n=15, last 2 years) | |
| Geekbench 5.5 / Multi-Core | |
| Average of class Desktop (12626 - 28535, n=30, last 2 years) | |
| Intel Core i9-12900K | |
| Lenovo Legion 5 Pro 16 G7 i7 RTX 3070Ti | |
| Apple MacBook Pro 16 2021 M1 Max | |
| Apple Mac Studio 2022 M1 Max | |
| Average Apple M1 Max (12563 - 12818, n=4) | |
| Apple iMac 27 Mid 2020 | |
| Apple iMac 24 M1 2021 | |
| Geekbench 5.5 / Single-Core | |
| Average of class Desktop (1755 - 2597, n=30, last 2 years) | |
| Intel Core i9-12900K | |
| Apple Mac Studio 2022 M1 Max | |
| Average Apple M1 Max (1764 - 1798, n=4) | |
| Apple MacBook Pro 16 2021 M1 Max | |
| Lenovo Legion 5 Pro 16 G7 i7 RTX 3070Ti | |
| Apple iMac 24 M1 2021 | |
| Apple iMac 27 Mid 2020 | |
* ... smaller is better
系统性能
配备M1 Max的Mac Studio也是一台反应极为迅速的机器,在整个测试期间我们没有发现任何问题。英特尔Mac的旧版应用程序通过Rosetta 2顺利模拟,这通常工作得非常好,但性能在这里可能比本地应用程序低一点。
一个非常好的例子是Adobe应用程序Photoshop和Premiere Pro,我们用它们进行了PugetBench测试。这些基准测试只适用于模拟的英特尔版本,它们也运行良好,但原生的M1版本总体上要快得多,反应也更快。由于这个原因,应该有点谨慎地看待基准测试结果。
然而,Apple ,在CrossMark或浏览器基准等原生基准测试中表现良好,符合预期。
Blackmagic RAW Speed Test: 12:1 8K Metal | 12:1 8K CPU
Photoshop PugetBench: Overall Score
Premiere Pro PugetBench: Overall Score 0.9
Photoshop PugetBench: Filter Score | General Score | GPU Score
Premiere Pro PugetBench: GPU 0.9 | Live Playback 0.9 | Export 0.9
Jetstream 2: 2.0 Total
WebXPRT 3: Overall
Speedometer 2.0: Result 2.0
| CrossMark / Overall | |
| Average of class Desktop (1685 - 2535, n=16, last 2 years) | |
| Apple Mac Studio 2022 M1 Max | |
| Apple MacBook Pro 14 2021 M1 Max 24-Core GPU | |
| Average Apple M1 Max, Apple M1 Max 32-Core GPU (1586 - 1621, n=2) | |
| Apple MacBook Pro 16 2021 M1 Max | |
| Apple MacBook Pro 16 2021 M1 Pro | |
| CrossMark / Productivity | |
| Average of class Desktop (1557 - 2369, n=16, last 2 years) | |
| Apple Mac Studio 2022 M1 Max | |
| Apple MacBook Pro 14 2021 M1 Max 24-Core GPU | |
| Average Apple M1 Max, Apple M1 Max 32-Core GPU (1361 - 1385, n=2) | |
| Apple MacBook Pro 16 2021 M1 Max | |
| Apple MacBook Pro 16 2021 M1 Pro | |
| CrossMark / Creativity | |
| Average of class Desktop (1943 - 2987, n=16, last 2 years) | |
| Apple MacBook Pro 14 2021 M1 Max 24-Core GPU | |
| Apple Mac Studio 2022 M1 Max | |
| Average Apple M1 Max, Apple M1 Max 32-Core GPU (2102 - 2153, n=2) | |
| Apple MacBook Pro 16 2021 M1 Max | |
| Apple MacBook Pro 16 2021 M1 Pro | |
| CrossMark / Responsiveness | |
| Average of class Desktop (1391 - 2388, n=16, last 2 years) | |
| Apple Mac Studio 2022 M1 Max | |
| Average Apple M1 Max, Apple M1 Max 32-Core GPU (1080 - 1107, n=2) | |
| Apple MacBook Pro 14 2021 M1 Max 24-Core GPU | |
| Apple MacBook Pro 16 2021 M1 Max | |
| Apple MacBook Pro 16 2021 M1 Pro | |
| Blackmagic RAW Speed Test / 12:1 8K Metal | |
| Apple MacBook Pro 16 2021 M1 Max | |
| Apple MacBook Pro 14 2021 M1 Max 24-Core GPU | |
| Average Apple M1 Max, Apple M1 Max 32-Core GPU (200 - 202, n=2) | |
| Apple Mac Studio 2022 M1 Max | |
| Apple MacBook Pro 16 2021 M1 Pro | |
| Apple iMac 24 M1 2021 | |
| Blackmagic RAW Speed Test / 12:1 8K CPU | |
| Apple Mac Studio 2022 M1 Max | |
| Average Apple M1 Max, Apple M1 Max 32-Core GPU (29 - 30, n=2) | |
| Apple MacBook Pro 16 2021 M1 Max | |
| Apple MacBook Pro 14 2021 M1 Max 24-Core GPU | |
| Apple MacBook Pro 16 2021 M1 Pro | |
| Apple iMac 24 M1 2021 | |
| Photoshop PugetBench / Overall Score | |
| Average of class Desktop (n=1last 2 years) | |
| Apple Mac Studio 2022 M1 Max | |
| Average Apple M1 Max, Apple M1 Max 32-Core GPU (809 - 989, n=2) | |
| Apple MacBook Pro 16 2021 M1 Max | |
| Apple MacBook Pro 14 2021 M1 Max 24-Core GPU | |
| Apple MacBook Pro 16 2021 M1 Pro | |
| Apple Mac Mini Late 2020 Entry (M1, 8GB) | |
| Premiere Pro PugetBench / Overall Score 0.9 | |
| Apple MacBook Pro 14 2021 M1 Max 24-Core GPU | |
| Apple MacBook Pro 16 2021 M1 Max | |
| Average Apple M1 Max, Apple M1 Max 32-Core GPU (862 - 1080, n=2) | |
| Apple Mac Studio 2022 M1 Max | |
| Apple MacBook Pro 16 2021 M1 Pro | |
| Average of class Desktop (n=1last 2 years) | |
| Photoshop PugetBench / Filter Score | |
| Average of class Desktop (n=1last 2 years) | |
| Apple Mac Studio 2022 M1 Max | |
| Average Apple M1 Max, Apple M1 Max 32-Core GPU (75.2 - 100.6, n=2) | |
| Apple MacBook Pro 14 2021 M1 Max 24-Core GPU | |
| Apple MacBook Pro 16 2021 M1 Max | |
| Apple MacBook Pro 16 2021 M1 Pro | |
| Apple Mac Mini Late 2020 Entry (M1, 8GB) | |
| Photoshop PugetBench / General Score | |
| Average of class Desktop (n=1last 2 years) | |
| Apple Mac Studio 2022 M1 Max | |
| Average Apple M1 Max, Apple M1 Max 32-Core GPU (86.5 - 97.2, n=2) | |
| Apple MacBook Pro 16 2021 M1 Max | |
| Apple MacBook Pro 14 2021 M1 Max 24-Core GPU | |
| Apple MacBook Pro 16 2021 M1 Pro | |
| Apple Mac Mini Late 2020 Entry (M1, 8GB) | |
| Photoshop PugetBench / GPU Score | |
| Apple Mac Studio 2022 M1 Max | |
| Average Apple M1 Max, Apple M1 Max 32-Core GPU (98.5 - 108.1, n=2) | |
| Apple MacBook Pro 16 2021 M1 Max | |
| Apple MacBook Pro 14 2021 M1 Max 24-Core GPU | |
| Average of class Desktop (n=1last 2 years) | |
| Apple MacBook Pro 16 2021 M1 Pro | |
| Apple Mac Mini Late 2020 Entry (M1, 8GB) | |
| Premiere Pro PugetBench / GPU 0.9 | |
| Apple Mac Studio 2022 M1 Max | |
| Average Apple M1 Max, Apple M1 Max 32-Core GPU (54.8 - 55.8, n=2) | |
| Apple MacBook Pro 16 2021 M1 Max | |
| Apple MacBook Pro 14 2021 M1 Max 24-Core GPU | |
| Apple MacBook Pro 16 2021 M1 Pro | |
| Average of class Desktop (n=1last 2 years) | |
| Premiere Pro PugetBench / Live Playback 0.9 | |
| Apple MacBook Pro 16 2021 M1 Max | |
| Apple MacBook Pro 14 2021 M1 Max 24-Core GPU | |
| Average Apple M1 Max, Apple M1 Max 32-Core GPU (106 - 216, n=2) | |
| Apple MacBook Pro 16 2021 M1 Pro | |
| Apple Mac Studio 2022 M1 Max | |
| Average of class Desktop (n=1last 2 years) | |
| Premiere Pro PugetBench / Export 0.9 | |
| Apple Mac Studio 2022 M1 Max | |
| Apple MacBook Pro 14 2021 M1 Max 24-Core GPU | |
| Average Apple M1 Max, Apple M1 Max 32-Core GPU (53.2 - 90.9, n=2) | |
| Apple MacBook Pro 16 2021 M1 Max | |
| Apple MacBook Pro 16 2021 M1 Pro | |
| Average of class Desktop (n=1last 2 years) | |
| Jetstream 2 / 2.0 Total | |
| Apple Mac Studio 2022 M1 Max | |
| Average Apple M1 Max, Apple M1 Max 32-Core GPU (215 - 215, n=2) | |
| Apple MacBook Pro 16 2021 M1 Max | |
| Apple MacBook Pro 16 2021 M1 Pro | |
| Apple MacBook Pro 14 2021 M1 Max 24-Core GPU | |
| Apple iMac 27 Mid 2020 | |
| Apple Mac Mini Late 2020 Entry (M1, 8GB) | |
| Apple iMac 24 M1 2021 | |
| WebXPRT 3 / Overall | |
| Apple Mac Studio 2022 M1 Max | |
| Apple MacBook Pro 14 2021 M1 Max 24-Core GPU | |
| Average Apple M1 Max, Apple M1 Max 32-Core GPU (350 - 366, n=2) | |
| Average of class Desktop (262 - 409, n=15, last 2 years) | |
| Apple MacBook Pro 16 2021 M1 Max | |
| Apple MacBook Pro 16 2021 M1 Pro | |
| Apple Mac Mini Late 2020 Entry (M1, 8GB) | |
| Apple iMac 24 M1 2021 | |
| Apple iMac 27 Mid 2020 | |
| Speedometer 2.0 / Result 2.0 | |
| Apple Mac Studio 2022 M1 Max | |
| Average Apple M1 Max, Apple M1 Max 32-Core GPU (272 - 349, n=2) | |
| Apple MacBook Pro 14 2021 M1 Max 24-Core GPU | |
| Apple MacBook Pro 16 2021 M1 Pro | |
| Apple MacBook Pro 16 2021 M1 Max | |
| Apple Mac Mini Late 2020 Entry (M1, 8GB) | |
| Apple iMac 24 M1 2021 | |
| Apple iMac 27 Mid 2020 | |
储存
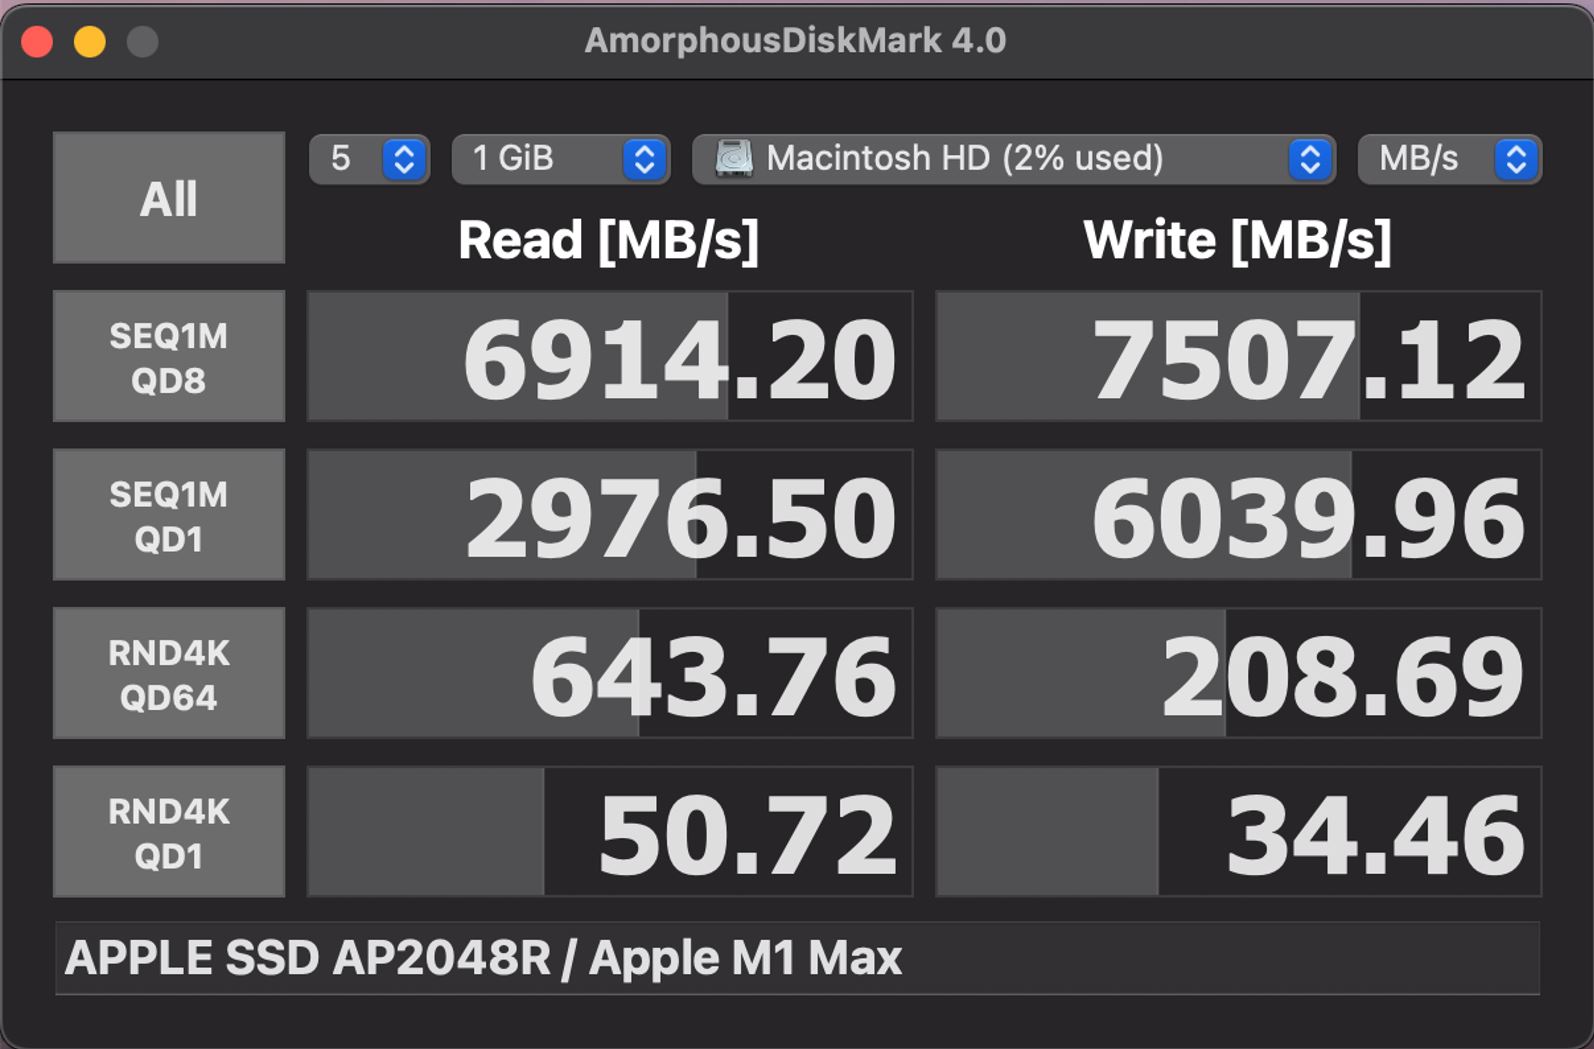
所有版本的Mac Studio都使用了快速的PCIe 4.0固态硬盘,我们的测试设备配备了一个2TB的硬盘,在第一次启动后仍然为用户提供1.98TB的可用存储空间。该驱动器在基准测试中实现了非常高的传输率,在这里没有留下任何批评的余地。M1 Max版本的Mac Studio默认配备了512GB的固态硬盘,2TB版本的额外费用为690欧元(约合人民币721元),而升级到8TB的价格甚至达到了2760欧元(约合人民币2882元)。进一步的SSD基准测试可在 这里.
Mac Studio提供了一个模块化的固态硬盘,甚至还有一个固态硬盘插槽,但到目前为止还不能用于扩展。此外,你必须做大量的修补和拆卸工作(包括拆除电源),甚至才能接触到SSD。
图形卡
芯片M1 Max中的32核GPU有四个集群,每个集群有8个GPU核心,可消耗高达44瓦的功率。再次,性能与配备M1 Max的MacBook Pro 16相当,但由于限制在60赫兹,一些基准测试结果(如3DMark Wild Life Extreme)只有在无限模式下才有意义。在合成测试中,该GPU部分地与GeForce RTX 3070不过,后者的功耗要大得多。
当然,GPU的优势是共享内存,这意味着有更多的VRAM可用于大型项目。游戏仍然是一个挑战。一些游戏通过Rosetta 2运行,而另一些则是原生运行;还有一些额外的解决方案,如CrossWare,允许你玩Windows的游戏,如The Wichter 3。然而,我们参考了我们对MacBook Pro 16和MacBook Pro 14在这里,我们对这个问题进行了更深入的探讨。
| GFXBench | |
| 2560x1440 Aztec Ruins High Tier Offscreen | |
| Apple MacBook Pro 16 2021 M1 Max | |
| Average Apple M1 Max 32-Core GPU (309 - 310, n=2) | |
| Apple Mac Studio 2022 M1 Max | |
| Apple MacBook Pro 14 2021 M1 Max 24-Core GPU | |
| Apple iMac 27 Mid 2020 | |
| Apple MacBook Pro 16 2021 M1 Pro | |
| Apple iMac 24 M1 2021 | |
| 1920x1080 Aztec Ruins Normal Tier Offscreen | |
| Apple MacBook Pro 16 2021 M1 Max | |
| Average Apple M1 Max 32-Core GPU (718 - 752, n=2) | |
| Apple Mac Studio 2022 M1 Max | |
| Apple MacBook Pro 14 2021 M1 Max 24-Core GPU | |
| Apple iMac 27 Mid 2020 | |
| Apple MacBook Pro 16 2021 M1 Pro | |
| Apple iMac 24 M1 2021 | |
| 1920x1080 Car Chase Offscreen | |
| Apple Mac Studio 2022 M1 Max | |
| Average Apple M1 Max 32-Core GPU (424 - 451, n=2) | |
| Apple MacBook Pro 16 2021 M1 Max | |
| Apple MacBook Pro 14 2021 M1 Max 24-Core GPU | |
| Apple MacBook Pro 16 2021 M1 Pro | |
| Apple iMac 24 M1 2021 | |
| low | med. | high | ultra | QHD | 4K | |
|---|---|---|---|---|---|---|
| Shadow of the Tomb Raider (2018) | 139 | 104 | 97 | 88 | 61 | 33 |
| Total War: Three Kingdoms (2019) | 293 | 131 | 83 | 60 | 39 | 20 |
| Borderlands 3 (2019) | 67.4 | 53.2 | 46.1 | 39.6 | 33 | 20.6 |
排放 - Mac Studio的风扇持续运行
噪声排放
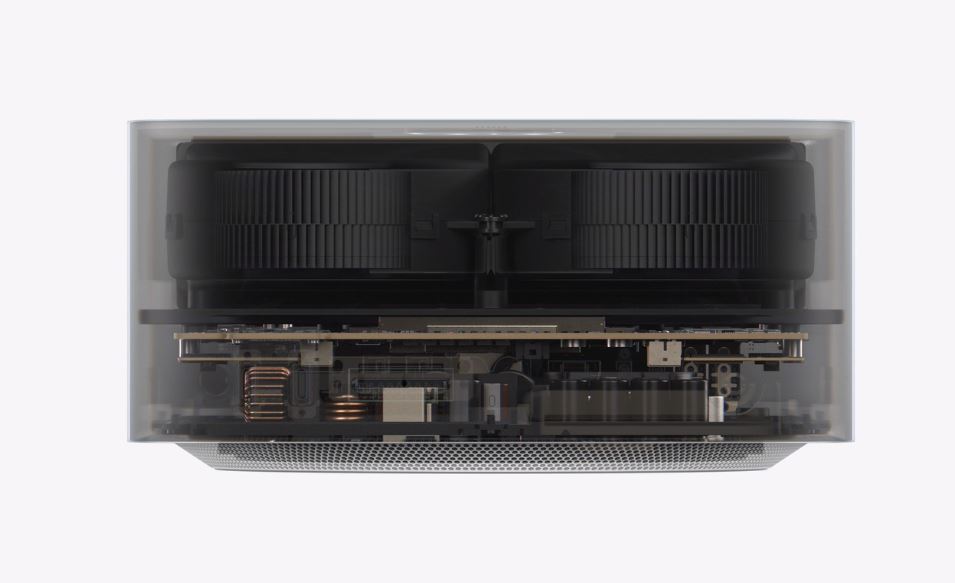
Mac Studio的上半部分完全被冷却系统所占据,它由两个风扇和一个巨大的散热器组成。在我们的评测单元中,我们没有遇到一些报告中提到的刺激性的风扇噪音,但这两个风扇总是以恒定的1300转/分钟的速度运行。这绝对是令人印象深刻的,因为它甚至在一个小时的最大负载(SoC温度~78 °C (~172 °F))后也没有改变,但我们不确定这是否真的有必要,即使在轻度负载下,特别是在与 MacBook Pro 16 M1 Max相比,后者经常安静地运行。像MBP上的可选省电模式,导致风扇被停用,在这里肯定会很有用。虽然持续的噪音绝不是令人讨厌的,只有不到29 dB(A),但它是可以听到的,而且有这样一个高效的芯片,持续的噪音就显得有点不必要了。两个风扇的最高转速可以达到3500转/分,但我们只能用一个额外的软件来管理这个转速。这个小立方体在这里变得相当响亮,达到59.1 dB(A),它也超过了大多数成熟的游戏笔记本电脑。
配备M1 Ultra的Mac Studio使用相同的风扇,但它没有使用铝制散热器,而是使用了铜制散热器,这就是为什么重量也明显增加的原因。虽然Studio显示器也有两个风扇,但它们是听不到的。
Noise level
| Idle |
| 28.8 / 28.8 / 28.8 dB(A) |
| Load |
| 28.8 / 28.8 dB(A) |
 | ||
30 dB silent 40 dB(A) audible 50 dB(A) loud |
||
min: | ||
| Apple Mac Studio 2022 M1 Max M1 Max 32-Core GPU, M1 Max, Apple SSD AP2048R | Apple iMac 27 Mid 2020 Radeon RX 5700 XT (Desktop), i9-10910, Apple SSD AP1024 | Apple iMac Pro Pro Vega 56, W-2145 | Apple iMac 24 M1 2021 M1 8-Core GPU, M1, Apple SSD AP0512 | Apple MacBook Pro 16 2021 M1 Max M1 Max 32-Core GPU, M1 Max, Apple SSD AP2048R | Apple MacBook Pro 14 2021 M1 Max 24-Core GPU M1 Max 24-Core GPU, M1 Max, Apple SSD AP0512 | |
|---|---|---|---|---|---|---|
| Noise | -18% | -23% | -0% | -13% | -9% | |
| off / environment * (dB) | 23.8 | 29.1 -22% | 29.1 -22% | 24.2 -2% | 24.2 -2% | 24.8 -4% |
| Idle Minimum * (dB) | 28.8 | 29.7 -3% | 29.8 -3% | 24.2 16% | 24.2 16% | 24.8 14% |
| Idle Average * (dB) | 28.8 | 29.7 -3% | 29.8 -3% | 24.2 16% | 24.2 16% | 24.8 14% |
| Idle Maximum * (dB) | 28.8 | 29.7 -3% | 29.8 -3% | 24.2 16% | 24.2 16% | 24.8 14% |
| Load Average * (dB) | 28.8 | 35 -22% | 39.7 -38% | 25 13% | 42.9 -49% | 30.4 -6% |
| Witcher 3 ultra * (dB) | 28.8 | 35 -22% | 39.5 -37% | 35.8 -24% | ||
| Load Maximum * (dB) | 28.8 | 43.6 -51% | 47.9 -66% | 46 -60% | 42.9 -49% | 49.5 -72% |
* ... smaller is better
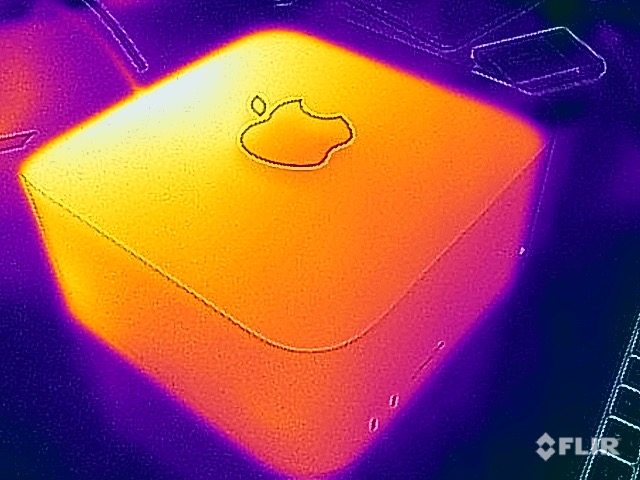
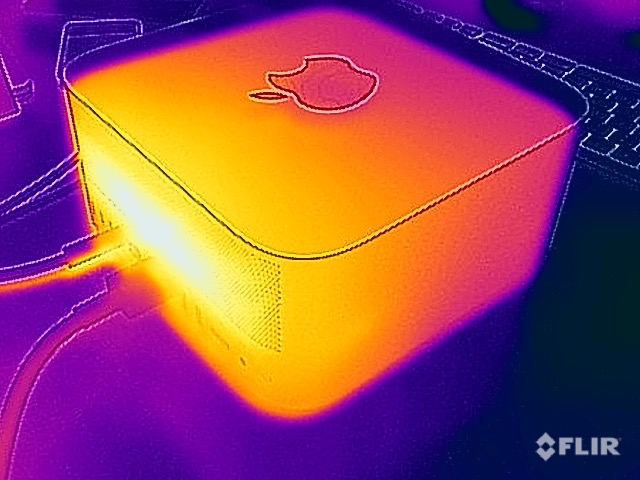
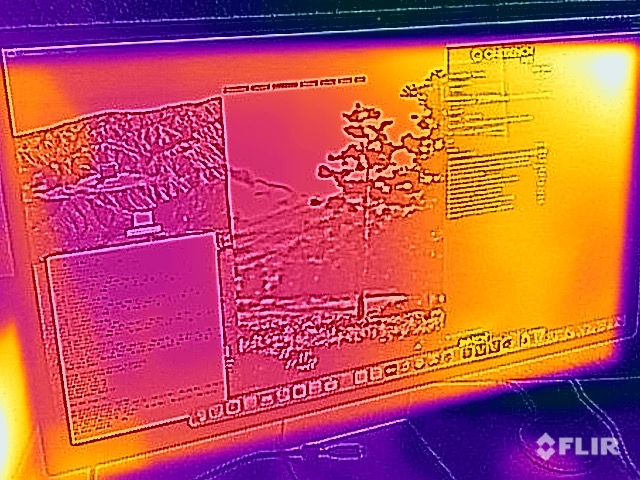
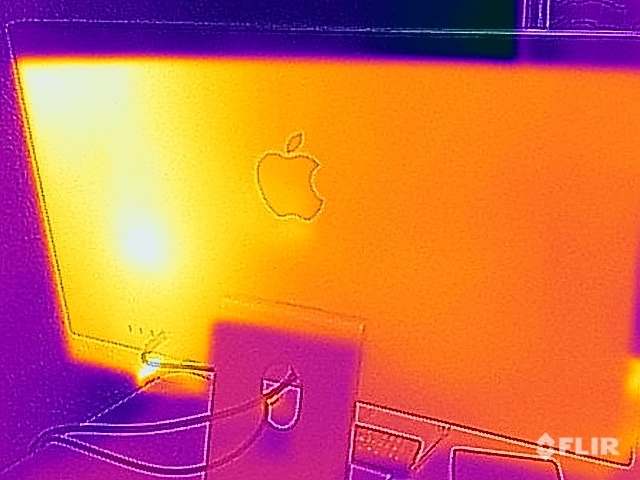
温度
不用说,表面温度对台式电脑和显示器来说并不像对笔记本电脑那样重要,但我们也可以在这里给予全票通过,因为无论如何它都不会真正变热。在压力测试中,Mac Studio的顶部发热到36°C(约97°F)左右,因为散热器在它的正下方。我们在风扇出口处直接登记了约40°C(约104°F),这意味着一切都在安全范围内。Studio Display也显示了背面的一个热点,但30°C(约86°F)是绝对没有问题的。
发言人
让我们从Mac Studio本身开始,它也有一个集成扬声器。它一点也不差,当然可以与一些笔记本电脑相媲美,但当然,它不能接近Studio显示器的音质。
Apple 已经在显示器中安装了一个具有六个扬声器和3D音频支持的系统,这基本上也是我们已经在 MacBook Pro 16.事实上,测量结果也非常相似,但从主观上看,Display自然有更大的外壳优势,声音似乎更强大,也更宽广一些。总的来说,音频性能确实非常好,大多数用户可能可以不用外接扬声器。
Apple Mac Studio 2022 M1 Max audio analysis
(±) | speaker loudness is average but good (77.6 dB)
Bass 100 - 315 Hz
(±) | reduced bass - on average 11.5% lower than median
(±) | linearity of bass is average (10.6% delta to prev. frequency)
Mids 400 - 2000 Hz
(+) | balanced mids - only 3.2% away from median
(+) | mids are linear (3.8% delta to prev. frequency)
Highs 2 - 16 kHz
(+) | balanced highs - only 3.4% away from median
(+) | highs are linear (5.5% delta to prev. frequency)
Overall 100 - 16.000 Hz
(+) | overall sound is linear (12.5% difference to median)
Compared to same class
» 44% of all tested devices in this class were better, 11% similar, 44% worse
» The best had a delta of 6%, average was 16%, worst was 46%
Compared to all devices tested
» 11% of all tested devices were better, 2% similar, 87% worse
» The best had a delta of 4%, average was 24%, worst was 134%
Apple Studio Display 2022 audio analysis
(+) | speakers can play relatively loud (85 dB)
Bass 100 - 315 Hz
(+) | good bass - only 1.8% away from median
(±) | linearity of bass is average (7.4% delta to prev. frequency)
Mids 400 - 2000 Hz
(+) | balanced mids - only 2.7% away from median
(+) | mids are linear (3.9% delta to prev. frequency)
Highs 2 - 16 kHz
(+) | balanced highs - only 2.3% away from median
(+) | highs are linear (6.7% delta to prev. frequency)
Overall 100 - 16.000 Hz
(+) | overall sound is linear (4.2% difference to median)
Compared to same class
» 0% of all tested devices in this class were better, 0% similar, 100% worse
» The best had a delta of 4%, average was 24%, worst was 134%
Compared to all devices tested
» 0% of all tested devices were better, 0% similar, 100% worse
» The best had a delta of 4%, average was 24%, worst was 134%
Apple MacBook Pro 16 2021 M1 Pro audio analysis
(+) | speakers can play relatively loud (84.7 dB)
Bass 100 - 315 Hz
(+) | good bass - only 3.8% away from median
(+) | bass is linear (5.2% delta to prev. frequency)
Mids 400 - 2000 Hz
(+) | balanced mids - only 1.3% away from median
(+) | mids are linear (2.1% delta to prev. frequency)
Highs 2 - 16 kHz
(+) | balanced highs - only 1.9% away from median
(+) | highs are linear (2.7% delta to prev. frequency)
Overall 100 - 16.000 Hz
(+) | overall sound is linear (4.6% difference to median)
Compared to same class
» 0% of all tested devices in this class were better, 0% similar, 100% worse
» The best had a delta of 5%, average was 17%, worst was 45%
Compared to all devices tested
» 0% of all tested devices were better, 0% similar, 100% worse
» The best had a delta of 4%, average was 24%, worst was 134%
能源管理
能源消耗
功耗测量没有显示出任何惊喜,我们大致上与MacBook Pro 16 M1 Max如果你减去Mini LED面板的功耗,我们大致与MacBook Pro 16 M1 Max持平。在压力测试中,我们能够从Mac Studio中获得最大的114瓦,据此,由于Unigine Valley的不同序列,功耗总是有一些波动,但这是正常的。在空闲使用时,功耗略低于12瓦,而在待机模式下,这一数值降至1.8瓦。
工作室显示器本身的功率在17-57瓦之间,这取决于亮度水平,关闭时仍消耗0.28瓦的功率。
| Off / Standby | |
| Idle | |
| Load |
|
Key:
min: | |
Energy consumption
Pros
Cons
结论--M1 Max也适用于台式机
总的来说,新的Mac Studio给人留下了良好的印象。它的性能非常好,有很多端口,与Studio Display和Apple's专有输入设备的互动简直完美无缺。然而,同样明显的是,Mac Studio的冷却系统是为M1 Ultra开发的,因为两个风扇对M1 Max来说很容易,即使在压力测试中,我们也无法从设备中得到更多安静的嘶嘶声。尽管如此,风扇一直在旋转,即使在空闲时也是如此;这里当然也有可能实现无声操作。
在原始显示规格方面,Studio Display与旧版iMac 27相当,当然这不是一件坏事,但你肯定可以从竞争对手那里得到更多的价格。不过,在这种情况下,你不得不放弃一些便利功能。扬声器对于显示器来说也非常好。特别是与MacBook一起使用(最好能达到 MacBook Pro 14,因为那时你真的只需要一个电缆连接,而不需要额外的电源适配器),如果你想在家里有一个更大的屏幕,Studio Display是有意义的。然后你可以简单地通过Thunderbolt连接MacBook,这也将为设备充电。虽然Studio Display也可以在Apple 生态系统之外使用,但在我们看来,它并没有什么意义。这里有更好的选择,在这个价格范围内也有更好或更大的显示器。
如果你想在家里尽可能方便地使用你的MacBook或iPad的大屏幕,并同时拥有True Tone等通常的便利功能以及一个好的音响系统,Studio Display是一个有趣的补充。
正如你所期望的那样,Apple ,硬件并不便宜,但集成的效果非常好。我们将尝试用M1 Ultra评测一台Mac Studio,因为冷却系统在这里可能会受到更大的挑战,而M1 Ultra所谓的双倍性能也相当诱人。
价格和可用性
Apple 在撰写本文时,你可以在百思买的网上商店找到 (32GB内存,512GB固态硬盘)的基本型号的Mac Studio,价格略低于2,000美元。我们的评测配置(M1 Max,配备32核GPU,64GB内存,2TB固态硬盘)可以直接从Apple's在线商店 ,在那里你可以根据自己的需要定制计算机。这种配置将使你花费3199美元。
另一方面,,百思买似乎有几种Studio Display的配置。但目前它们要么被列为 "售罄",要么被列为 "即将推出"。你仍然可以,直接购买Studio Display。Apple,基本配置包括普通反射玻璃和可倾斜调节的支架(与我们的审查配置相同),价格为1599美元。
Price comparison

