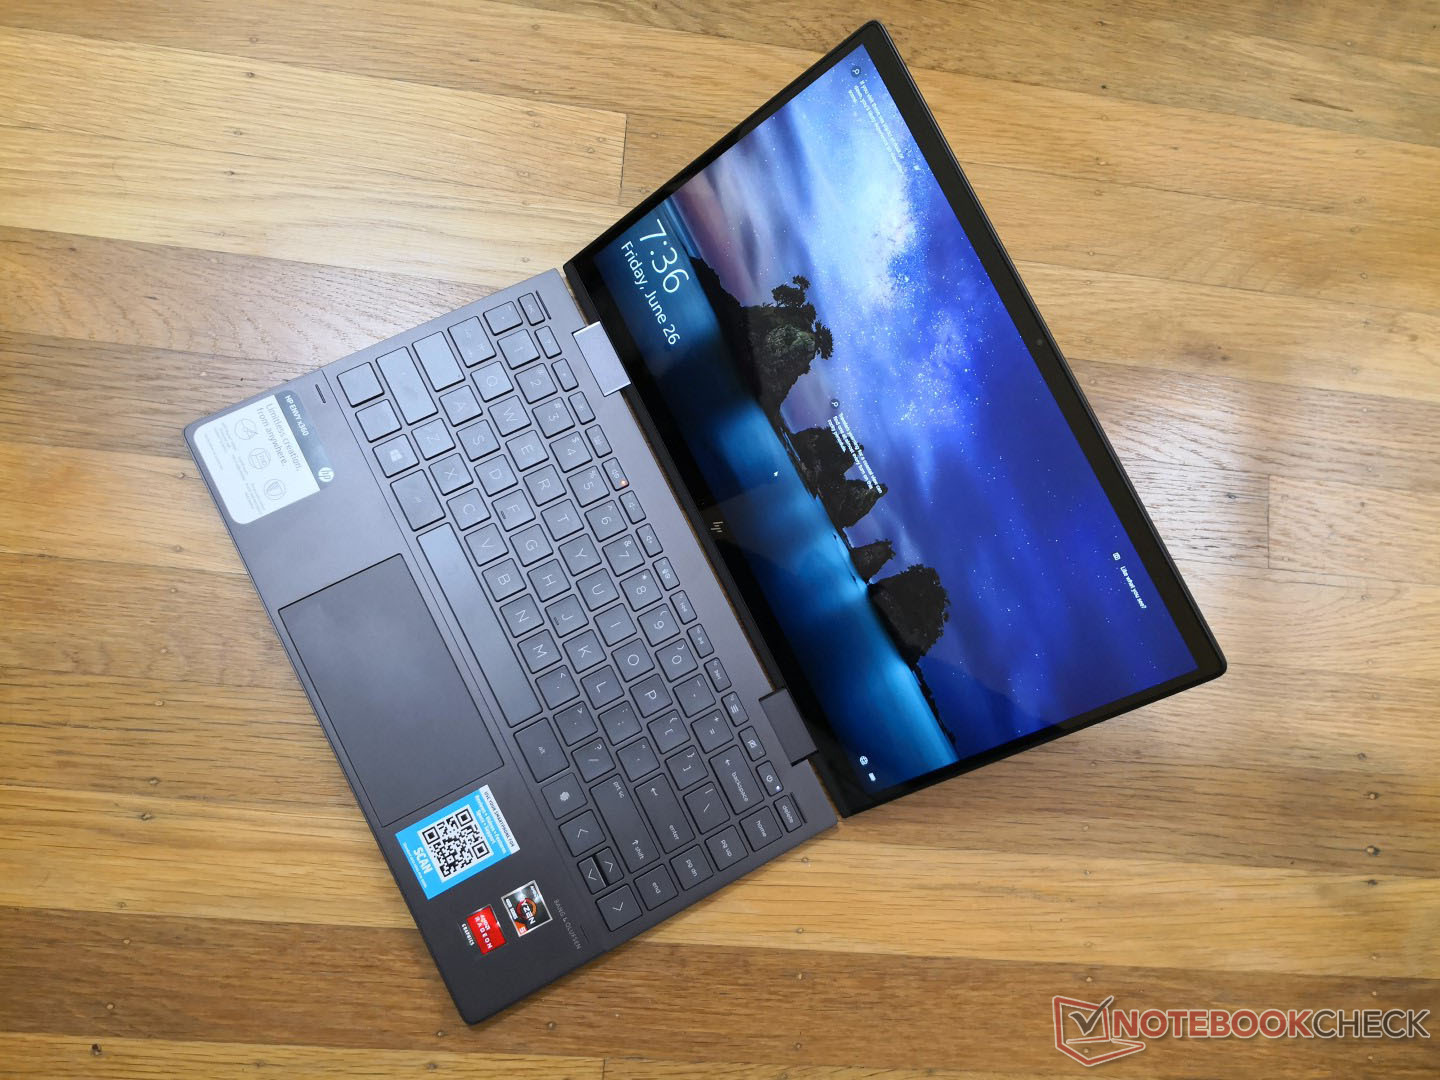
2020 HP Envy x360 13二合一笔记本电脑:Ryzen 5打赢了i7
Rating | Date | Model | Weight | Height | Size | Resolution | Price |
|---|---|---|---|---|---|---|---|
| 85.5 % v7 (old) | 09 / 2020 | HP Envy x360 13-ay0010nr R5 4500U, Vega 6 | 1.3 kg | 16.4 mm | 13.30" | 1920x1080 | |
| 86.3 % v7 (old) | 01 / 2020 | Dell XPS 13 7390 2-in-1 Core i7 i7-1065G7, Iris Plus Graphics G7 (Ice Lake 64 EU) | 1.3 kg | 13 mm | 13.40" | 1920x1200 | |
| 88.4 % v7 (old) | 07 / 2020 | HP Spectre x360 13-aw0013dx i7-1065G7, Iris Plus Graphics G7 (Ice Lake 64 EU) | 1.2 kg | 16.9 mm | 13.30" | 1920x1080 | |
| 86.6 % v6 (old) | 03 / 2019 | Asus ZenBook S13 UX392FN i7-8565U, GeForce MX150 | 1.1 kg | 12.9 mm | 13.90" | 1920x1080 | |
| 92.1 % v7 (old) | 07 / 2020 | Apple MacBook Pro 13 2020 2GHz i5 10th-Gen i5-1038NG7, Iris Plus Graphics G7 (Ice Lake 64 EU) | 1.4 kg | 15.6 mm | 13.30" | 2560x1600 |
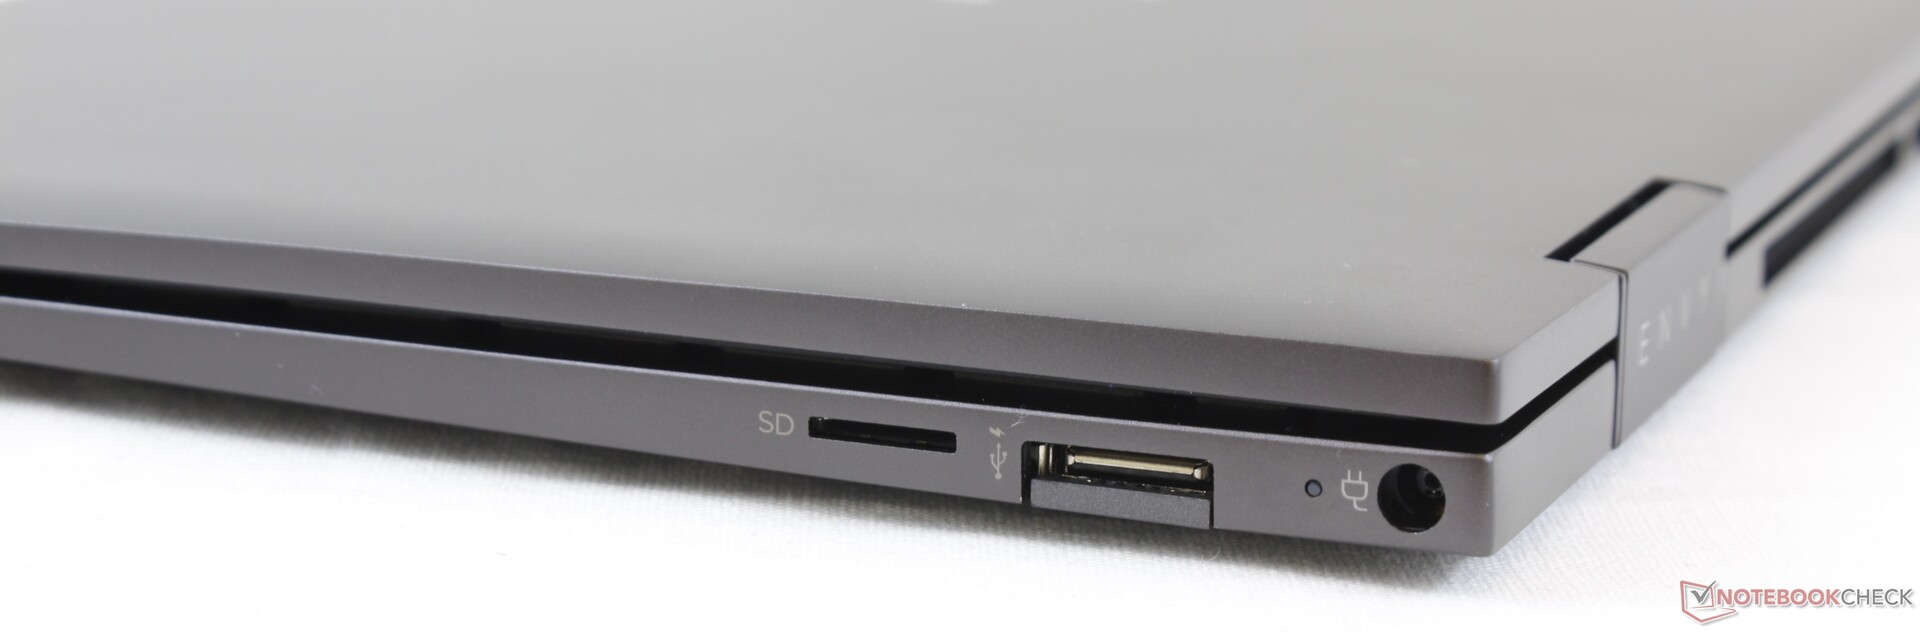

| SD Card Reader | |
| average JPG Copy Test (av. of 3 runs) | |
| HP Spectre x360 13-aw0013dx (Toshiba Exceria Pro M501 microSDXC 64GB) | |
| Dell XPS 13 7390 2-in-1 Core i7 (Toshiba Exceria Pro M501 64 GB UHS-II) | |
| HP Envy x360 13-ay0010nr (Toshiba Exceria Pro M501 64 GB UHS-II) | |
| HP Envy x360 13-ar0601ng (Toshiba Exceria Pro M501 microSDXC 64GB) | |
| Asus ZenBook S13 UX392FN (Toshiba Exceria Pro M501 64 GB UHS-II) | |
| maximum AS SSD Seq Read Test (1GB) | |
| Dell XPS 13 7390 2-in-1 Core i7 (Toshiba Exceria Pro M501 64 GB UHS-II) | |
| HP Spectre x360 13-aw0013dx (Toshiba Exceria Pro M501 microSDXC 64GB) | |
| HP Envy x360 13-ar0601ng (Toshiba Exceria Pro M501 microSDXC 64GB) | |
| HP Envy x360 13-ay0010nr (Toshiba Exceria Pro M501 64 GB UHS-II) | |
| Asus ZenBook S13 UX392FN (Toshiba Exceria Pro M501 64 GB UHS-II) | |


| |||||||||||||||||||||||||
Brightness Distribution: 93 %
Center on Battery: 452.6 cd/m²
Contrast: 1561:1 (Black: 0.29 cd/m²)
ΔE ColorChecker Calman: 2.67 | ∀{0.5-29.43 Ø4.71}
calibrated: 1.36
ΔE Greyscale Calman: 2.1 | ∀{0.09-98 Ø4.96}
97.6% sRGB (Argyll 1.6.3 3D)
62.2% AdobeRGB 1998 (Argyll 1.6.3 3D)
67.8% AdobeRGB 1998 (Argyll 3D)
97.4% sRGB (Argyll 3D)
65.9% Display P3 (Argyll 3D)
Gamma: 2.01
CCT: 6505 K
| HP Envy x360 13-ay0010nr IPS, 13.3", 1920x1080 | HP Envy x360 13-ar0601ng InfoVision, M133NVF3 R2, IPS, 120 Hz, 13.3", 1920x1080 | Dell XPS 13 7390 2-in-1 Core i7 Sharp LQ134N1, IPS, 13.4", 1920x1200 | HP Spectre x360 13-aw0013dx AU Optronics AUO5E2D, IPS, 13.3", 1920x1080 | Asus ZenBook S13 UX392FN Tianma XM, IPS, 13.9", 1920x1080 | Apple MacBook Pro 13 2020 2GHz i5 10th-Gen APPA03D, IPS, 13.3", 2560x1600 | |
|---|---|---|---|---|---|---|
| Display | -6% | 4% | 4% | 1% | 27% | |
| Display P3 Coverage (%) | 65.9 | 63 -4% | 69.9 6% | 69.6 6% | 67.5 2% | 98.8 50% |
| sRGB Coverage (%) | 97.4 | 90.8 -7% | 99.2 2% | 98.9 2% | 95.8 -2% | 99.9 3% |
| AdobeRGB 1998 Coverage (%) | 67.8 | 63.8 -6% | 71.5 5% | 71.5 5% | 69 2% | 86.4 27% |
| Response Times | 29% | 5% | -21% | 12% | 2% | |
| Response Time Grey 50% / Grey 80% * (ms) | 47.6 ? | 35 ? 26% | 47.6 ? -0% | 60.8 ? -28% | 47.2 ? 1% | 46 ? 3% |
| Response Time Black / White * (ms) | 32.4 ? | 22 ? 32% | 29.2 ? 10% | 36.8 ? -14% | 24.8 ? 23% | 32.4 ? -0% |
| PWM Frequency (Hz) | 25000 ? | 4065 ? | 2500 ? | 113600 ? | ||
| Screen | -22% | 0% | -36% | -2% | 12% | |
| Brightness middle (cd/m²) | 452.6 | 633 40% | 549.8 21% | 447.4 -1% | 466 3% | 512 13% |
| Brightness (cd/m²) | 438 | 675 54% | 520 19% | 420 -4% | 462 5% | 491 12% |
| Brightness Distribution (%) | 93 | 75 -19% | 86 -8% | 85 -9% | 90 -3% | 91 -2% |
| Black Level * (cd/m²) | 0.29 | 0.55 -90% | 0.39 -34% | 0.31 -7% | 0.33 -14% | 0.32 -10% |
| Contrast (:1) | 1561 | 1151 -26% | 1410 -10% | 1443 -8% | 1412 -10% | 1600 2% |
| Colorchecker dE 2000 * | 2.67 | 3.12 -17% | 2.12 21% | 4.23 -58% | 1.93 28% | 1.7 36% |
| Colorchecker dE 2000 max. * | 4.11 | 6.37 -55% | 3.66 11% | 9.34 -127% | 4.26 -4% | 3.4 17% |
| Colorchecker dE 2000 calibrated * | 1.36 | 1.83 -35% | 1.37 -1% | 1.32 3% | 1.99 -46% | 1 26% |
| Greyscale dE 2000 * | 2.1 | 3.89 -85% | 2.6 -24% | 6.1 -190% | 1.7 19% | 1.9 10% |
| Gamma | 2.01 109% | 2.39 92% | 2.3 96% | 2.11 104% | 2.15 102% | 2.19 100% |
| CCT | 6505 100% | 6476 100% | 6884 94% | 6136 106% | 6382 102% | 6817 95% |
| Color Space (Percent of AdobeRGB 1998) (%) | 62.2 | 59 -5% | 65.4 5% | 64.8 4% | 62.2 0% | 77.4 24% |
| Color Space (Percent of sRGB) (%) | 97.6 | 91 -7% | 99.7 2% | 98.9 1% | 95.7 -2% | 99.9 2% |
| Total Average (Program / Settings) | 0% /
-13% | 3% /
2% | -18% /
-27% | 4% /
0% | 14% /
13% |
* ... smaller is better
Display Response Times
| ↔ Response Time Black to White | ||
|---|---|---|
| 32.4 ms ... rise ↗ and fall ↘ combined | ↗ 16.4 ms rise | 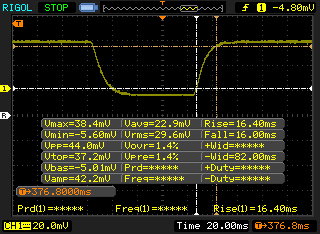 |
| ↘ 16 ms fall | ||
| The screen shows slow response rates in our tests and will be unsatisfactory for gamers. In comparison, all tested devices range from 0.1 (minimum) to 240 (maximum) ms. » 88 % of all devices are better. This means that the measured response time is worse than the average of all tested devices (19.8 ms). | ||
| ↔ Response Time 50% Grey to 80% Grey | ||
| 47.6 ms ... rise ↗ and fall ↘ combined | ↗ 24.8 ms rise | 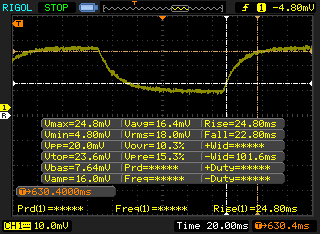 |
| ↘ 22.8 ms fall | ||
| The screen shows slow response rates in our tests and will be unsatisfactory for gamers. In comparison, all tested devices range from 0.165 (minimum) to 636 (maximum) ms. » 82 % of all devices are better. This means that the measured response time is worse than the average of all tested devices (30.9 ms). | ||
Screen Flickering / PWM (Pulse-Width Modulation)
| Screen flickering / PWM detected | 25000 Hz | ≤ 45 % brightness setting | 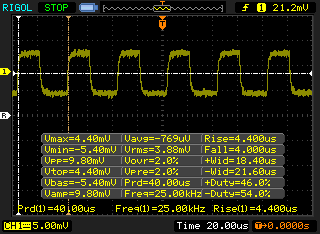 |
The display backlight flickers at 25000 Hz (worst case, e.g., utilizing PWM) Flickering detected at a brightness setting of 45 % and below. There should be no flickering or PWM above this brightness setting. The frequency of 25000 Hz is quite high, so most users sensitive to PWM should not notice any flickering. In comparison: 52 % of all tested devices do not use PWM to dim the display. If PWM was detected, an average of 7741 (minimum: 5 - maximum: 343500) Hz was measured. | |||

Cinebench R15: CPU Multi 64Bit | CPU Single 64Bit
Blender: v2.79 BMW27 CPU
7-Zip 18.03: 7z b 4 -mmt1 | 7z b 4
Geekbench 5.5: Single-Core | Multi-Core
HWBOT x265 Benchmark v2.2: 4k Preset
LibreOffice : 20 Documents To PDF
R Benchmark 2.5: Overall mean
| Cinebench R20 / CPU (Multi Core) | |
| Dell XPS 13 7390 Core i7-10710U | |
| Acer Swift 3 SF314-42-R4XJ | |
| Average AMD Ryzen 5 4500U (1843 - 2530, n=13) | |
| HP Envy x360 13-ay0010nr | |
| Dell XPS 13 9300 Core i7-1065G7 | |
| MSI GF63 Thin 9SC | |
| Dell XPS 13 9300 i5 FHD | |
| Dell Inspiron 15 5000 5585 | |
| Acer Swift 3 SF314-42-R27B | |
| Lenovo ThinkPad X1 Carbon 2020-20UAS04T00 | |
| Huawei MateBook 13 2020 AMD | |
| HP Envy 13-aq0003ng | |
| Dynabook Portege A30-E-174 | |
| Dell Latitude 13 3390 | |
| Cinebench R20 / CPU (Single Core) | |
| Acer Swift 3 SF314-42-R4XJ | |
| Dell XPS 13 7390 Core i7-10710U | |
| Dell XPS 13 9300 Core i7-1065G7 | |
| Average AMD Ryzen 5 4500U (424 - 453, n=12) | |
| Lenovo ThinkPad X1 Carbon 2020-20UAS04T00 | |
| Acer Swift 3 SF314-42-R27B | |
| Dell XPS 13 9300 i5 FHD | |
| HP Envy x360 13-ay0010nr | |
| MSI GF63 Thin 9SC | |
| Dynabook Portege A30-E-174 | |
| Huawei MateBook 13 2020 AMD | |
| HP Envy 13-aq0003ng | |
| Dell Latitude 13 3390 | |
| Dell Inspiron 15 5000 5585 | |
| Cinebench R15 / CPU Multi 64Bit | |
| Dell XPS 13 7390 Core i7-10710U | |
| Acer Swift 3 SF314-42-R4XJ | |
| Average AMD Ryzen 5 4500U (715 - 1007, n=18) | |
| HP Envy x360 13-ay0010nr | |
| MSI GF63 Thin 9SC | |
| Dell XPS 13 9300 Core i7-1065G7 | |
| Lenovo ThinkPad X1 Carbon 2020-20UAS04T00 | |
| Dell Inspiron 15 5000 5585 | |
| Dell XPS 13 9300 i5 FHD | |
| Dell XPS 13 9300 i5 FHD | |
| Huawei MateBook 13 2020 AMD | |
| Acer Swift 3 SF314-42-R27B | |
| Dell Latitude 13 3390 | |
| HP Envy 13-aq0003ng | |
| Dynabook Portege A30-E-174 | |
| Cinebench R15 / CPU Single 64Bit | |
| Lenovo ThinkPad X1 Carbon 2020-20UAS04T00 | |
| Dell XPS 13 7390 Core i7-10710U | |
| Dell XPS 13 9300 Core i7-1065G7 | |
| Acer Swift 3 SF314-42-R4XJ | |
| MSI GF63 Thin 9SC | |
| HP Envy x360 13-ay0010nr | |
| Average AMD Ryzen 5 4500U (156 - 177, n=13) | |
| HP Envy 13-aq0003ng | |
| Dell XPS 13 9300 i5 FHD | |
| Acer Swift 3 SF314-42-R27B | |
| Dynabook Portege A30-E-174 | |
| Huawei MateBook 13 2020 AMD | |
| Dell Latitude 13 3390 | |
| Dell Inspiron 15 5000 5585 | |
| Blender / v2.79 BMW27 CPU | |
| Dell Latitude 13 3390 | |
| Acer Swift 3 SF314-42-R27B | |
| Huawei MateBook 13 2020 AMD | |
| Lenovo ThinkPad X1 Carbon 2020-20UAS04T00 | |
| Dell XPS 13 9300 i5 FHD | |
| HP Envy x360 13-ay0010nr | |
| Average AMD Ryzen 5 4500U (533 - 748, n=11) | |
| Dell XPS 13 7390 Core i7-10710U | |
| Acer Swift 3 SF314-42-R4XJ | |
| 7-Zip 18.03 / 7z b 4 -mmt1 | |
| Lenovo ThinkPad X1 Carbon 2020-20UAS04T00 | |
| Dell XPS 13 7390 Core i7-10710U | |
| Acer Swift 3 SF314-42-R4XJ | |
| Average AMD Ryzen 5 4500U (4235 - 4338, n=11) | |
| HP Envy x360 13-ay0010nr | |
| Dell XPS 13 9300 i5 FHD | |
| Acer Swift 3 SF314-42-R27B | |
| Dell Latitude 13 3390 | |
| Huawei MateBook 13 2020 AMD | |
| 7-Zip 18.03 / 7z b 4 | |
| Dell XPS 13 7390 Core i7-10710U | |
| Acer Swift 3 SF314-42-R4XJ | |
| Average AMD Ryzen 5 4500U (22466 - 25891, n=11) | |
| HP Envy x360 13-ay0010nr | |
| Dell XPS 13 9300 i5 FHD | |
| Lenovo ThinkPad X1 Carbon 2020-20UAS04T00 | |
| Huawei MateBook 13 2020 AMD | |
| Acer Swift 3 SF314-42-R27B | |
| Dell Latitude 13 3390 | |
| Geekbench 5.5 / Single-Core | |
| Dell XPS 13 9300 i5 FHD | |
| Lenovo ThinkPad X1 Carbon 2020-20UAS04T00 | |
| Average AMD Ryzen 5 4500U (1082 - 1220, n=10) | |
| Acer Swift 3 SF314-42-R4XJ | |
| HP Envy x360 13-ay0010nr | |
| Acer Swift 3 SF314-42-R27B | |
| Huawei MateBook 13 2020 AMD | |
| Geekbench 5.5 / Multi-Core | |
| Acer Swift 3 SF314-42-R4XJ | |
| Average AMD Ryzen 5 4500U (4352 - 6234, n=10) | |
| HP Envy x360 13-ay0010nr | |
| Dell XPS 13 9300 i5 FHD | |
| Lenovo ThinkPad X1 Carbon 2020-20UAS04T00 | |
| Acer Swift 3 SF314-42-R27B | |
| Huawei MateBook 13 2020 AMD | |
| HWBOT x265 Benchmark v2.2 / 4k Preset | |
| Acer Swift 3 SF314-42-R4XJ | |
| Average AMD Ryzen 5 4500U (5.86 - 7.33, n=10) | |
| HP Envy x360 13-ay0010nr | |
| Dell XPS 13 7390 Core i7-10710U | |
| Lenovo ThinkPad X1 Carbon 2020-20UAS04T00 | |
| Acer Swift 3 SF314-42-R27B | |
| Dell XPS 13 9300 i5 FHD | |
| Dell Latitude 13 3390 | |
| Huawei MateBook 13 2020 AMD | |
| LibreOffice / 20 Documents To PDF | |
| Huawei MateBook 13 2020 AMD | |
| Average AMD Ryzen 5 4500U (58.2 - 78, n=11) | |
| Acer Swift 3 SF314-42-R27B | |
| HP Envy x360 13-ay0010nr | |
| Acer Swift 3 SF314-42-R4XJ | |
| Lenovo ThinkPad X1 Carbon 2020-20UAS04T00 | |
| R Benchmark 2.5 / Overall mean | |
| Huawei MateBook 13 2020 AMD | |
| Dell XPS 13 9300 i5 FHD | |
| Acer Swift 3 SF314-42-R27B | |
| Lenovo ThinkPad X1 Carbon 2020-20UAS04T00 | |
| Average AMD Ryzen 5 4500U (0.614 - 0.654, n=10) | |
| Acer Swift 3 SF314-42-R4XJ | |
| HP Envy x360 13-ay0010nr | |
Cinebench R15: CPU Multi 64Bit | CPU Single 64Bit
Blender: v2.79 BMW27 CPU
7-Zip 18.03: 7z b 4 -mmt1 | 7z b 4
Geekbench 5.5: Single-Core | Multi-Core
HWBOT x265 Benchmark v2.2: 4k Preset
LibreOffice : 20 Documents To PDF
R Benchmark 2.5: Overall mean
* ... smaller is better
| PCMark 8 Home Score Accelerated v2 | 4127 points | |
| PCMark 8 Work Score Accelerated v2 | 5249 points | |
| PCMark 10 Score | 4884 points | |
Help | ||
| DPC Latencies / LatencyMon - interrupt to process latency (max), Web, Youtube, Prime95 | |
| Dell XPS 15 9500 Core i7 4K UHD | |
| Razer Blade Stealth Core i7 GTX 1650 Ti Max-Q 4K | |
| HP Envy x360 13-ay0010nr | |
| Asus VivoBook 17 S712FA-DS76 | |
* ... smaller is better
| HP Envy x360 13-ay0010nr Toshiba KBG30ZMV256G | HP Envy x360 13-ar0601ng SK Hynix BC501 HFM512GDJTNG | Dell XPS 13 7390 2-in-1 Core i7 Toshiba BG4 KBG40ZPZ512G | HP Spectre x360 13-aw0013dx Intel Optane Memory H10 with Solid State Storage 32GB + 512GB HBRPEKNX0202A(L/H) | Asus ZenBook S13 UX392FN WDC PC SN520 SDAPNUW-512G | |
|---|---|---|---|---|---|
| AS SSD | 21% | 37% | 18% | 86% | |
| Seq Read (MB/s) | 1135 | 1412 24% | 1801 59% | 1039 -8% | 1224 8% |
| Seq Write (MB/s) | 628 | 540 -14% | 1125 79% | 310.1 -51% | 907 44% |
| 4K Read (MB/s) | 42.49 | 32.24 -24% | 39.7 -7% | 76 79% | 41.46 -2% |
| 4K Write (MB/s) | 96.9 | 74.7 -23% | 67 -31% | 118 22% | 126.2 30% |
| 4K-64 Read (MB/s) | 614 | 567 -8% | 1253 104% | 371.8 -39% | 1021 66% |
| 4K-64 Write (MB/s) | 256.4 | 700 173% | 209 -18% | 469.5 83% | 1251 388% |
| Access Time Read * (ms) | 0.162 | 0.049 70% | 0.069 57% | 0.067 59% | 0.053 67% |
| Access Time Write * (ms) | 0.592 | 0.048 92% | 0.625 -6% | 0.138 77% | 0.027 95% |
| Score Read (Points) | 770 | 741 -4% | 1472 91% | 552 -28% | 1185 54% |
| Score Write (Points) | 416 | 829 99% | 388 -7% | 618 49% | 1468 253% |
| Score Total (Points) | 1567 | 1913 22% | 2583 65% | 1448 -8% | 3250 107% |
| Copy ISO MB/s (MB/s) | 843 | 521 -38% | 1293 53% | 764 -9% | 1404 67% |
| Copy Program MB/s (MB/s) | 367.9 | 253.1 -31% | 560 52% | 465.8 27% | 402.4 9% |
| Copy Game MB/s (MB/s) | 727 | 392.9 -46% | 927 28% | 764 5% | 902 24% |
| CrystalDiskMark 5.2 / 6 | -1% | 46% | 44% | 53% | |
| Write 4K (MB/s) | 94.8 | 88.3 -7% | 106.7 13% | 112.6 19% | 149.2 57% |
| Read 4K (MB/s) | 45.5 | 34.84 -23% | 49.94 10% | 131 188% | 47.18 4% |
| Write Seq (MB/s) | 732 | 740 1% | 1223 67% | 458.9 -37% | 750 2% |
| Read Seq (MB/s) | 959 | 985 3% | 1801 88% | 1355 41% | 1137 19% |
| Write 4K Q32T1 (MB/s) | 224.6 | 313.7 40% | 325.3 45% | 341.3 52% | 749 233% |
| Read 4K Q32T1 (MB/s) | 365.2 | 243.1 -33% | 551 51% | 320.6 -12% | 478.7 31% |
| Write Seq Q32T1 (MB/s) | 864 | 846 -2% | 1224 42% | 1219 41% | 1453 68% |
| Read Seq Q32T1 (MB/s) | 1580 | 1783 13% | 2350 49% | 2462 56% | 1713 8% |
| Write 4K Q8T8 (MB/s) | 305.7 | ||||
| Read 4K Q8T8 (MB/s) | 698 | ||||
| Total Average (Program / Settings) | 10% /
13% | 42% /
40% | 31% /
28% | 70% /
74% |
* ... smaller is better

Disk Throttling: DiskSpd Read Loop, Queue Depth 8
| 3DMark 11 Performance | 4563 points | |
| 3DMark Cloud Gate Standard Score | 15183 points | |
| 3DMark Fire Strike Score | 2589 points | |
| 3DMark Time Spy Score | 929 points | |
Help | ||
| low | med. | high | ultra | |
|---|---|---|---|---|
| The Witcher 3 (2015) | 56.4 | 16.6 | 10.6 | |
| Dota 2 Reborn (2015) | 95.1 | 75.6 | 46.3 | 43.3 |
| X-Plane 11.11 (2018) | 39.1 | 30.1 | 26.8 |
| HP Envy x360 13-ay0010nr Vega 6, R5 4500U, Toshiba KBG30ZMV256G | HP Envy x360 13-ar0601ng Vega 10, R7 3700U, SK Hynix BC501 HFM512GDJTNG | Dell XPS 13 7390 2-in-1 Core i7 Iris Plus Graphics G7 (Ice Lake 64 EU), i7-1065G7, Toshiba BG4 KBG40ZPZ512G | HP Spectre x360 13-aw0013dx Iris Plus Graphics G7 (Ice Lake 64 EU), i7-1065G7, Intel Optane Memory H10 with Solid State Storage 32GB + 512GB HBRPEKNX0202A(L/H) | Asus ZenBook S13 UX392FN GeForce MX150, i7-8565U, WDC PC SN520 SDAPNUW-512G | |
|---|---|---|---|---|---|
| Noise | -8% | 4% | 7% | 1% | |
| off / environment * (dB) | 28 | 30.5 -9% | 28.1 -0% | 28.5 -2% | 28.1 -0% |
| Idle Minimum * (dB) | 28 | 32.2 -15% | 28.1 -0% | 28.5 -2% | 28.1 -0% |
| Idle Average * (dB) | 28 | 32.2 -15% | 28.1 -0% | 28.5 -2% | 28.1 -0% |
| Idle Maximum * (dB) | 28.5 | 32.2 -13% | 28.1 1% | 28.5 -0% | 29 -2% |
| Load Average * (dB) | 41.1 | 40.8 1% | 31.7 23% | 28.5 31% | 41.1 -0% |
| Load Maximum * (dB) | 43.5 | 41.9 4% | 43.4 -0% | 35.3 19% | 41.1 6% |
| Witcher 3 ultra * (dB) | 43.4 | 35.3 | 41.1 |
* ... smaller is better
Noise level
| Idle |
| 28 / 28 / 28.5 dB(A) |
| Load |
| 41.1 / 43.5 dB(A) |
 | ||
30 dB silent 40 dB(A) audible 50 dB(A) loud |
||
min: | ||
(±) The maximum temperature on the upper side is 44.8 °C / 113 F, compared to the average of 35.4 °C / 96 F, ranging from 19.6 to 60 °C for the class Convertible.
(±) The bottom heats up to a maximum of 43.8 °C / 111 F, compared to the average of 36.9 °C / 98 F
(+) In idle usage, the average temperature for the upper side is 25.9 °C / 79 F, compared to the device average of 30.3 °C / 87 F.
(±) Playing The Witcher 3, the average temperature for the upper side is 33.4 °C / 92 F, compared to the device average of 30.3 °C / 87 F.
(+) The palmrests and touchpad are cooler than skin temperature with a maximum of 30.2 °C / 86.4 F and are therefore cool to the touch.
(-) The average temperature of the palmrest area of similar devices was 28 °C / 82.4 F (-2.2 °C / -4 F).
| Off / Standby | |
| Idle | |
| Load |
|
Key:
min: | |
| HP Envy x360 13-ay0010nr R5 4500U, Vega 6, Toshiba KBG30ZMV256G, IPS, 1920x1080, 13.3" | HP Envy x360 13-ar0601ng R7 3700U, Vega 10, SK Hynix BC501 HFM512GDJTNG, IPS, 120 Hz, 1920x1080, 13.3" | Dell XPS 13 7390 2-in-1 Core i7 i7-1065G7, Iris Plus Graphics G7 (Ice Lake 64 EU), Toshiba BG4 KBG40ZPZ512G, IPS, 1920x1200, 13.4" | HP Spectre x360 13-aw0013dx i7-1065G7, Iris Plus Graphics G7 (Ice Lake 64 EU), Intel Optane Memory H10 with Solid State Storage 32GB + 512GB HBRPEKNX0202A(L/H), IPS, 1920x1080, 13.3" | Asus ZenBook S13 UX392FN i7-8565U, GeForce MX150, WDC PC SN520 SDAPNUW-512G, IPS, 1920x1080, 13.9" | Apple MacBook Pro 13 2020 2GHz i5 10th-Gen i5-1038NG7, Iris Plus Graphics G7 (Ice Lake 64 EU), Apple SSD SM0512F, IPS, 2560x1600, 13.3" | |
|---|---|---|---|---|---|---|
| Power Consumption | 1% | 5% | -4% | -23% | -34% | |
| Idle Minimum * (Watt) | 3.9 | 3.2 18% | 2.6 33% | 3.9 -0% | 3.4 13% | 3.8 3% |
| Idle Average * (Watt) | 5.8 | 2.8 52% | 5.3 9% | 6.3 -9% | 6.3 -9% | 8.6 -48% |
| Idle Maximum * (Watt) | 6 | 12.4 -107% | 7 -17% | 6.8 -13% | 10.4 -73% | 10.3 -72% |
| Load Average * (Watt) | 41.5 | 24.2 42% | 43.1 -4% | 32.6 21% | 51 -23% | 52.1 -26% |
| Load Maximum * (Watt) | 50.4 | 50 1% | 49 3% | 59 -17% | 62.7 -24% | 65.2 -29% |
| Witcher 3 ultra * (Watt) | 43.1 | 25.6 | 39 | 48.2 |
* ... smaller is better
| HP Envy x360 13-ay0010nr R5 4500U, Vega 6, 51 Wh | HP Envy x360 13-ar0601ng R7 3700U, Vega 10, 53 Wh | Dell XPS 13 7390 2-in-1 Core i7 i7-1065G7, Iris Plus Graphics G7 (Ice Lake 64 EU), 51 Wh | HP Spectre x360 13-aw0013dx i7-1065G7, Iris Plus Graphics G7 (Ice Lake 64 EU), 60 Wh | Asus ZenBook S13 UX392FN i7-8565U, GeForce MX150, 50 Wh | Apple MacBook Pro 13 2020 2GHz i5 10th-Gen i5-1038NG7, Iris Plus Graphics G7 (Ice Lake 64 EU), 58 Wh | |
|---|---|---|---|---|---|---|
| Battery runtime | -30% | -24% | 14% | -17% | 3% | |
| Reader / Idle (h) | 31.9 | 10.5 -67% | 37.1 16% | 28.5 -11% | ||
| WiFi v1.3 (h) | 11.8 | 7.3 -38% | 9 -24% | 9.9 -16% | 8.4 -29% | 12.1 3% |
| Load (h) | 1.9 | 2.2 16% | 2.7 42% | 1.7 -11% |
Pros
Cons
由AMD驱动的2020 Envy x360 13的外观和性能优于其相对较低的价格。它本质上是2019 Spectre x360 13的较便宜版本,不会牺牲机身质量或系统性能来达到较低的价格。如果您正在考虑使用较旧的Envy x360 13或Spectre翻转本,那么值得一试的是这款更快,更便宜,更精简的2020 Envy。
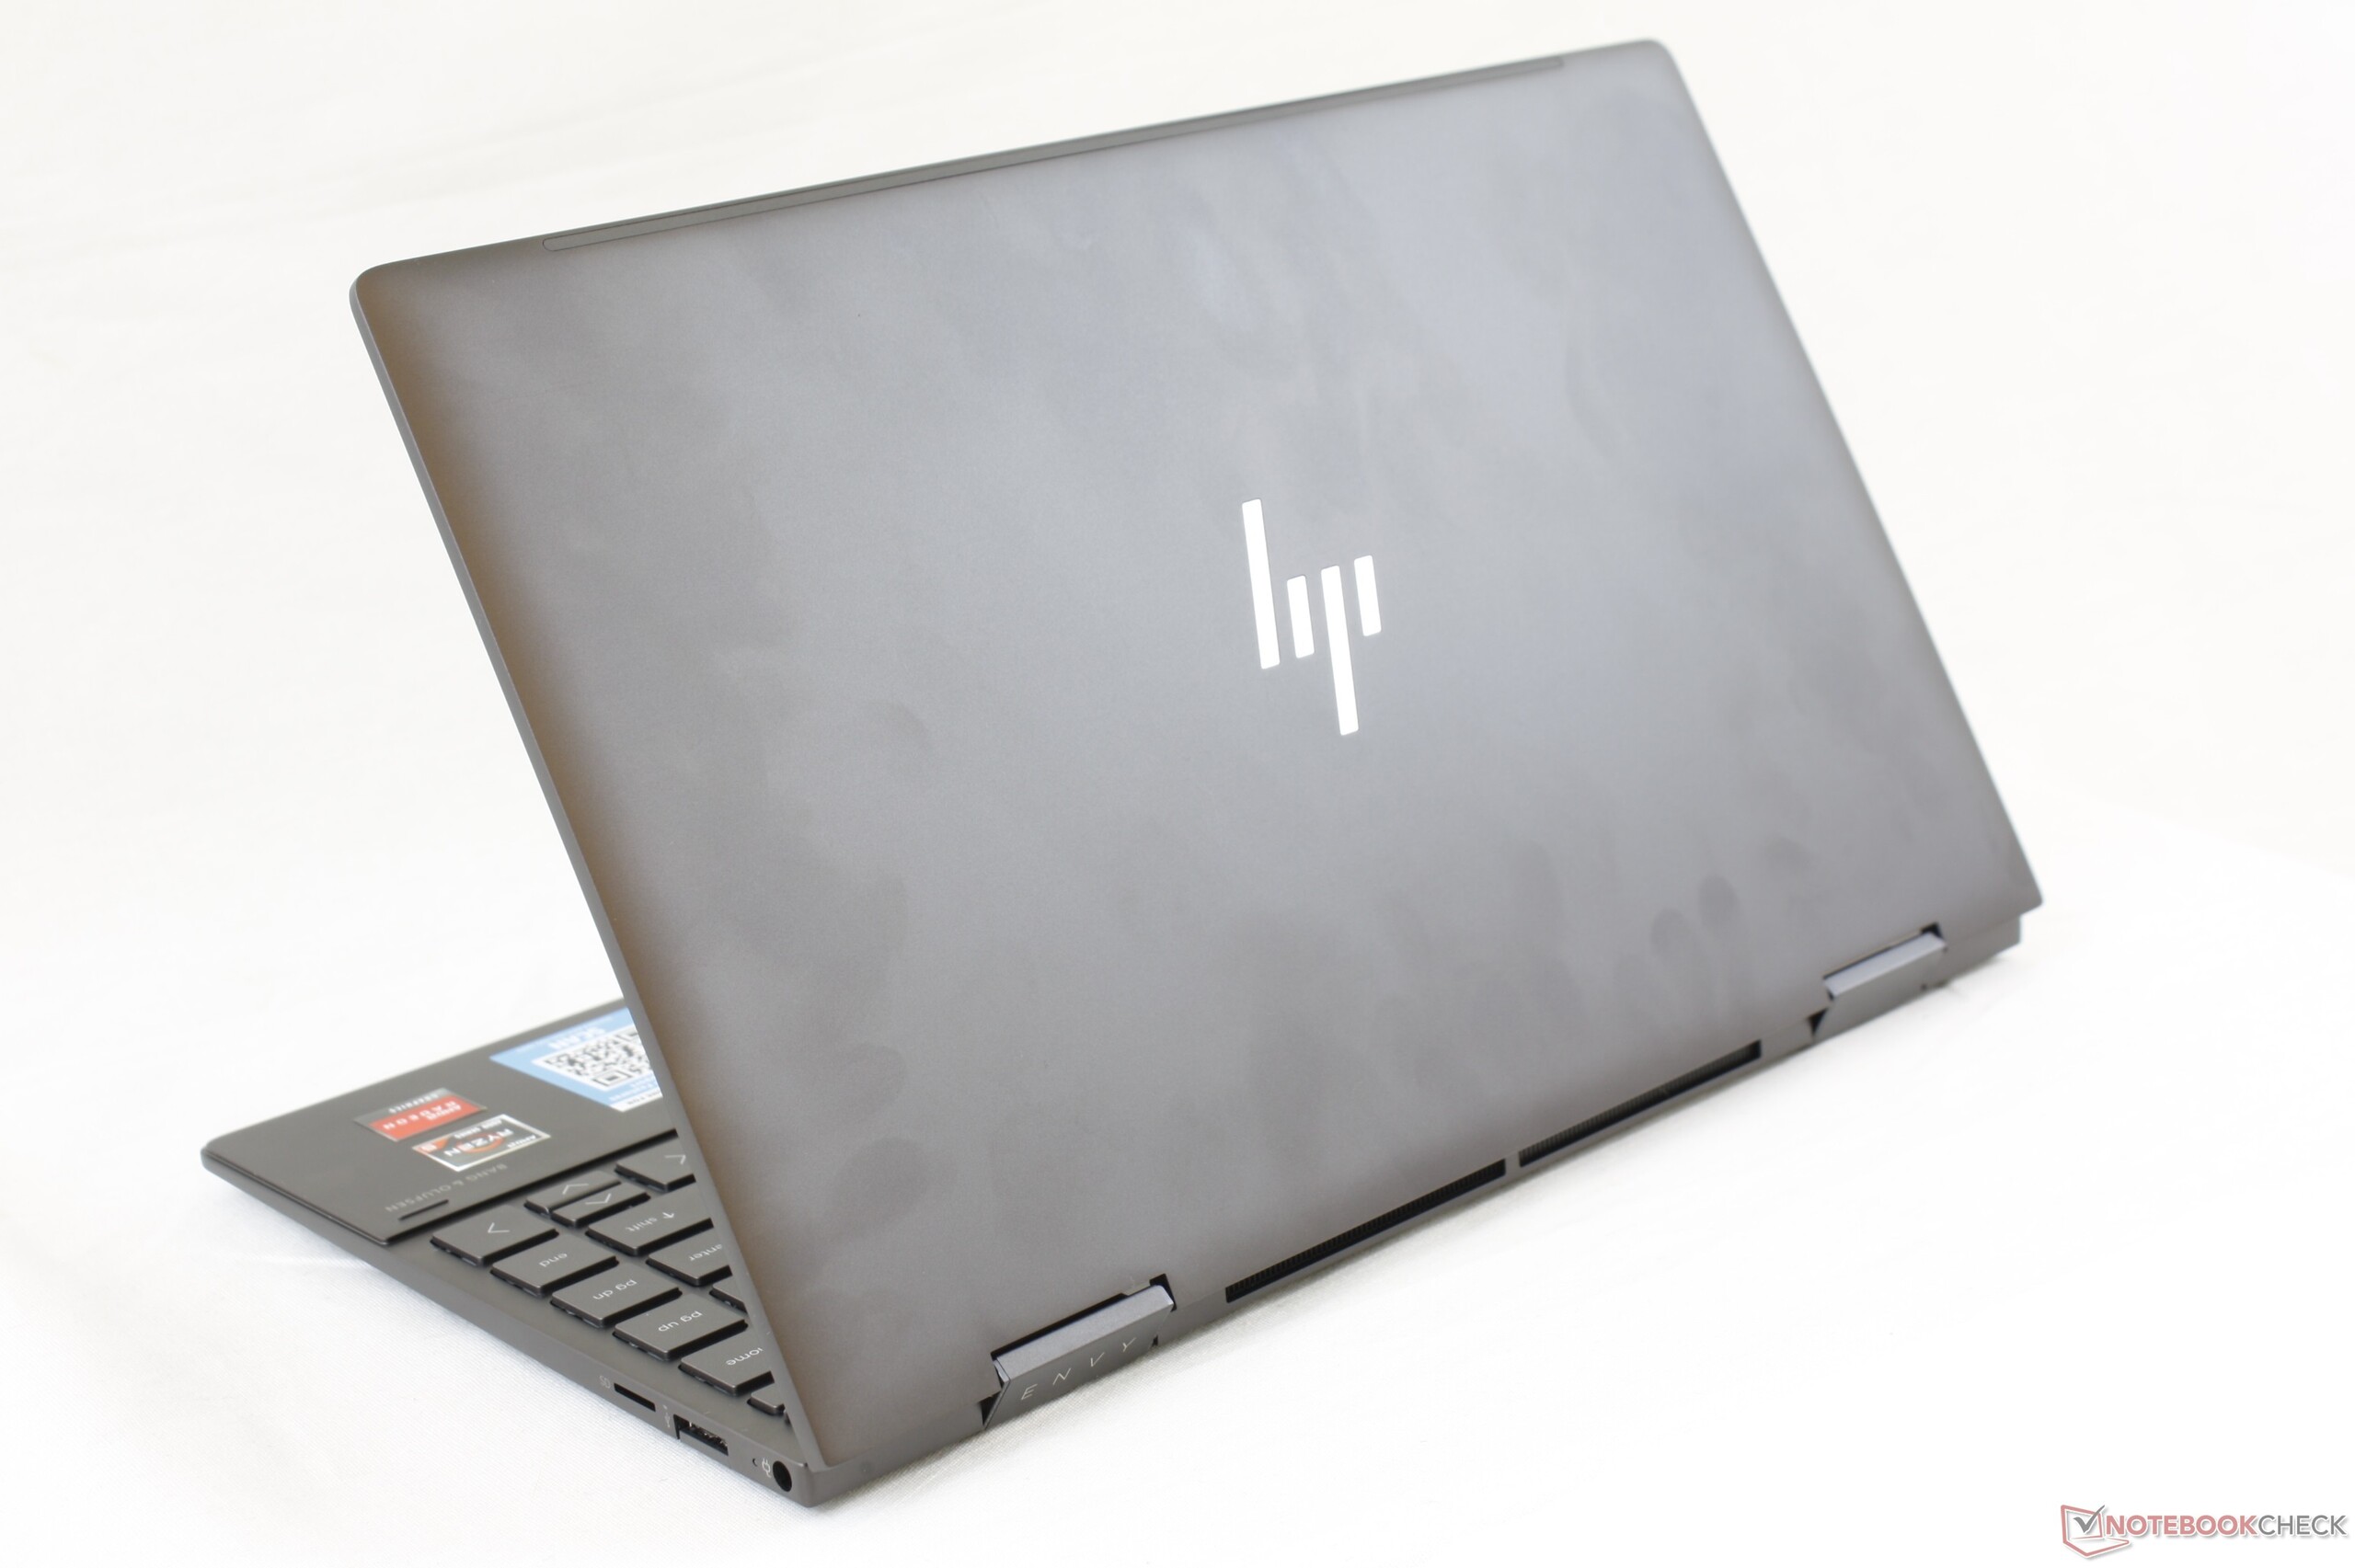
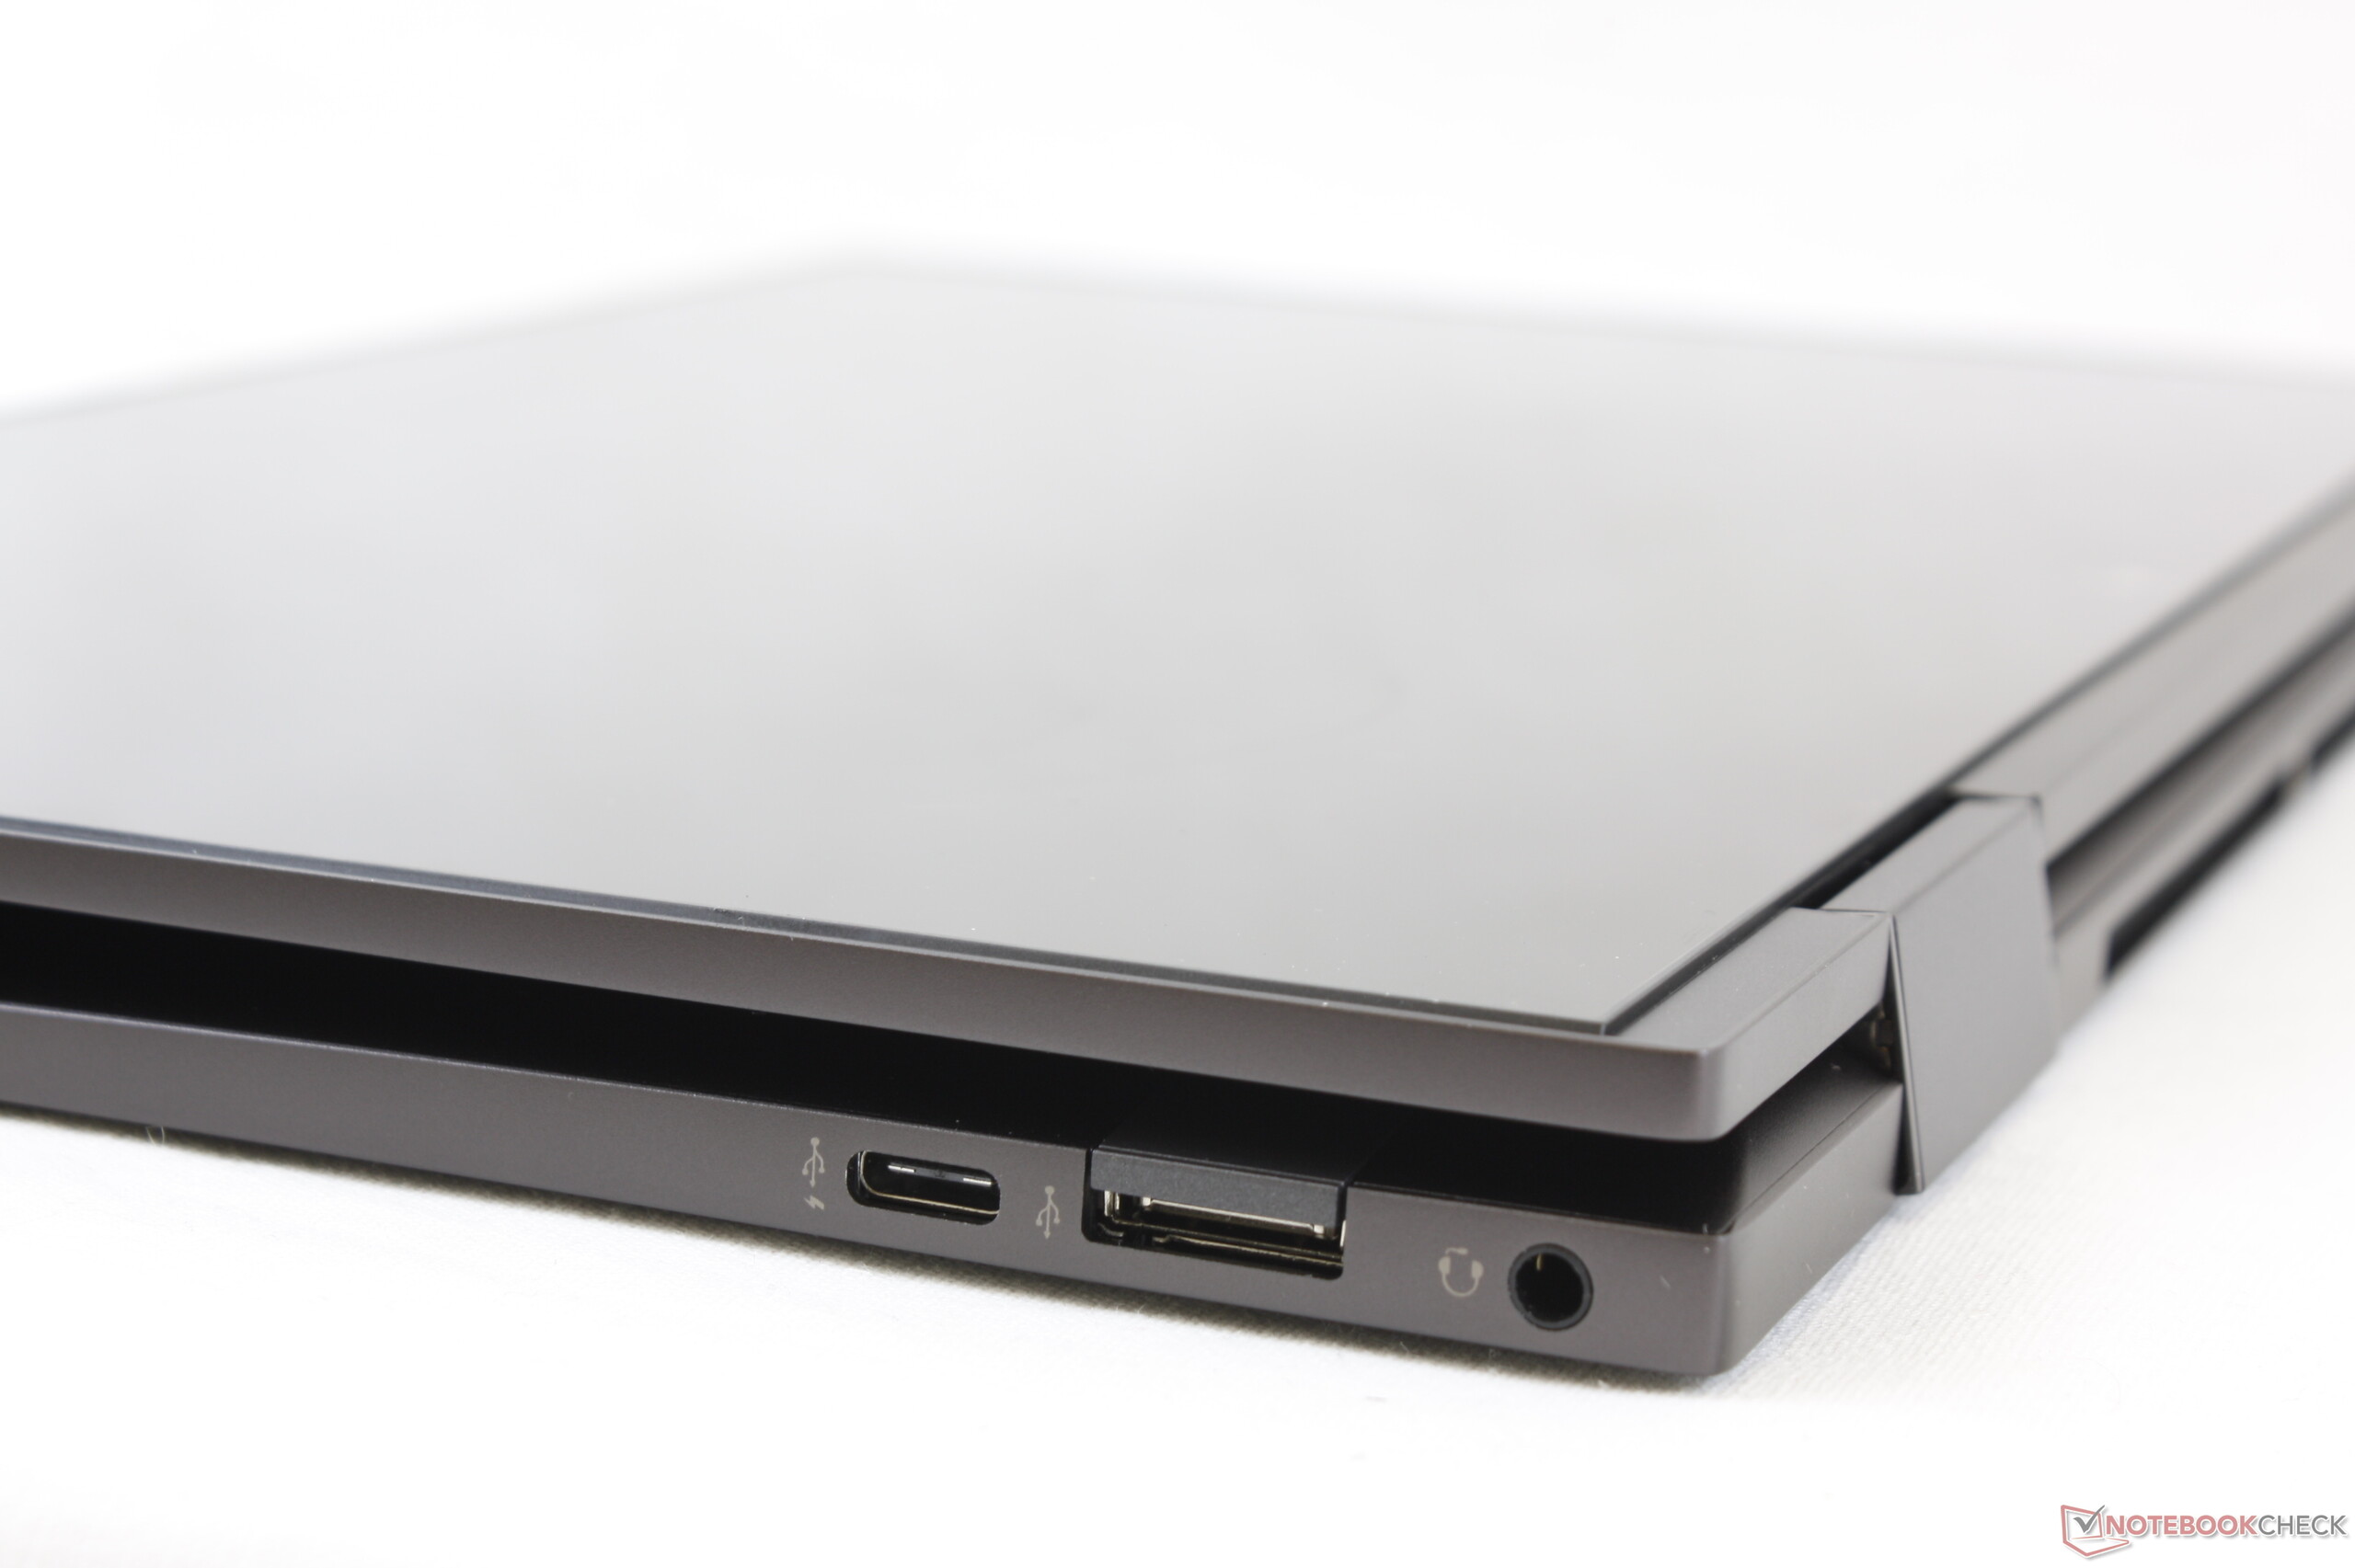
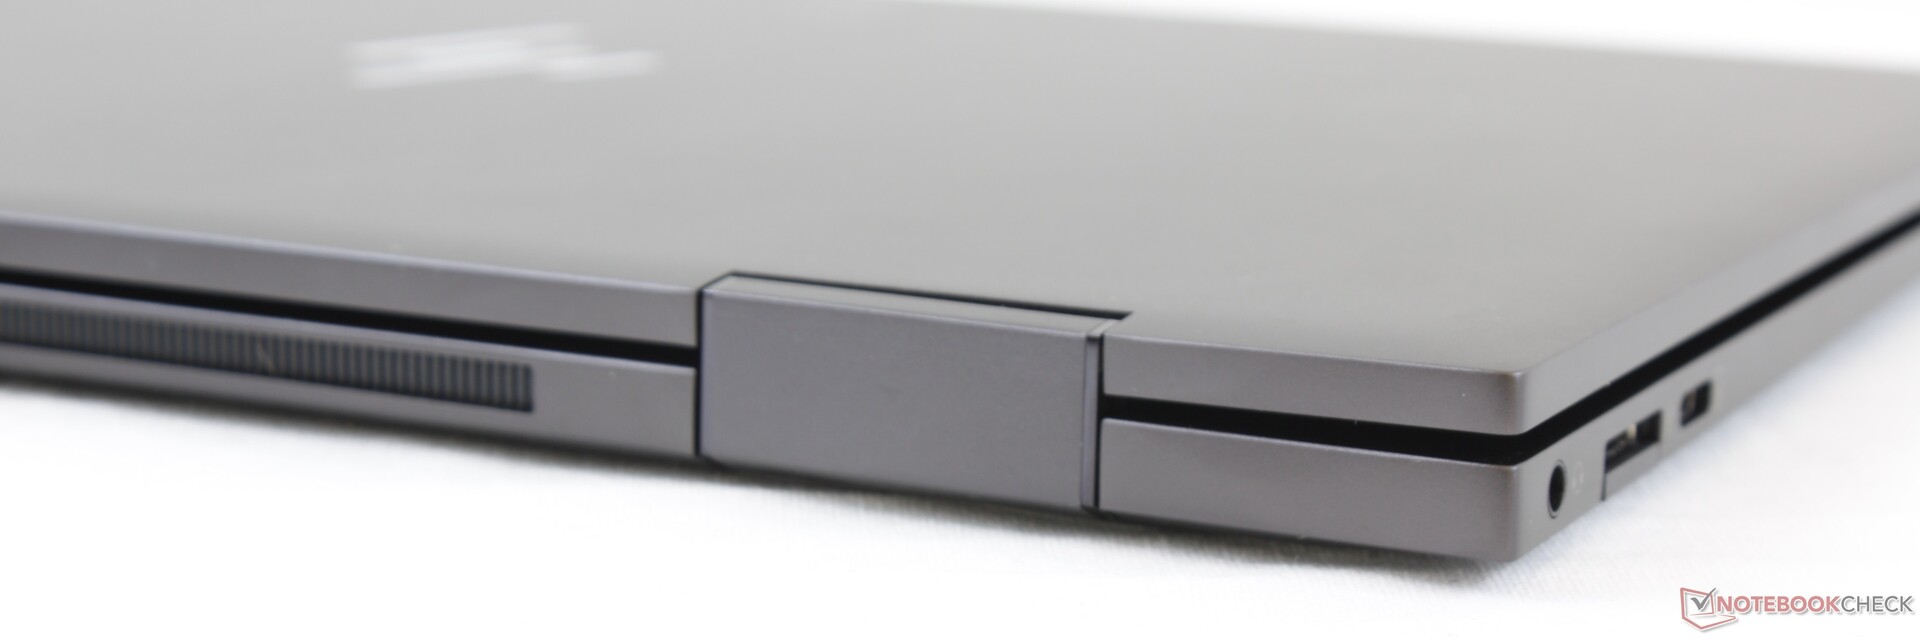
某些硬件限制使Envy x360 13不能成为“终极” 13.3英寸翻转本。没有Thunderbolt 3或HDMI,RAM不可用户升级,这意味着HP可以为16 GB DDR4 SKU额外收费。同时,位置奇怪的指纹读取器需要一些时间来适应,我们认为铰链有点松。联想Yoga C940等替代品还集成了手写笔支架,在平板电脑模式下可以方便使用。
去年下半年,我们将14英寸的Yoga C940命名为消费级翻转本标杆,但该系统零售价接近1500美元。不到1000美元,您现在找不到比2020 HP Envy x360 13更好的平衡性能,重量,质量和价格的13.3英寸翻转本。
就性价比而言, AMD处理器的以做到的事真令人惊奇。经过重新设计的2020 Envy x360 13比去年的机型明显更小,更紧凑,同时更快。
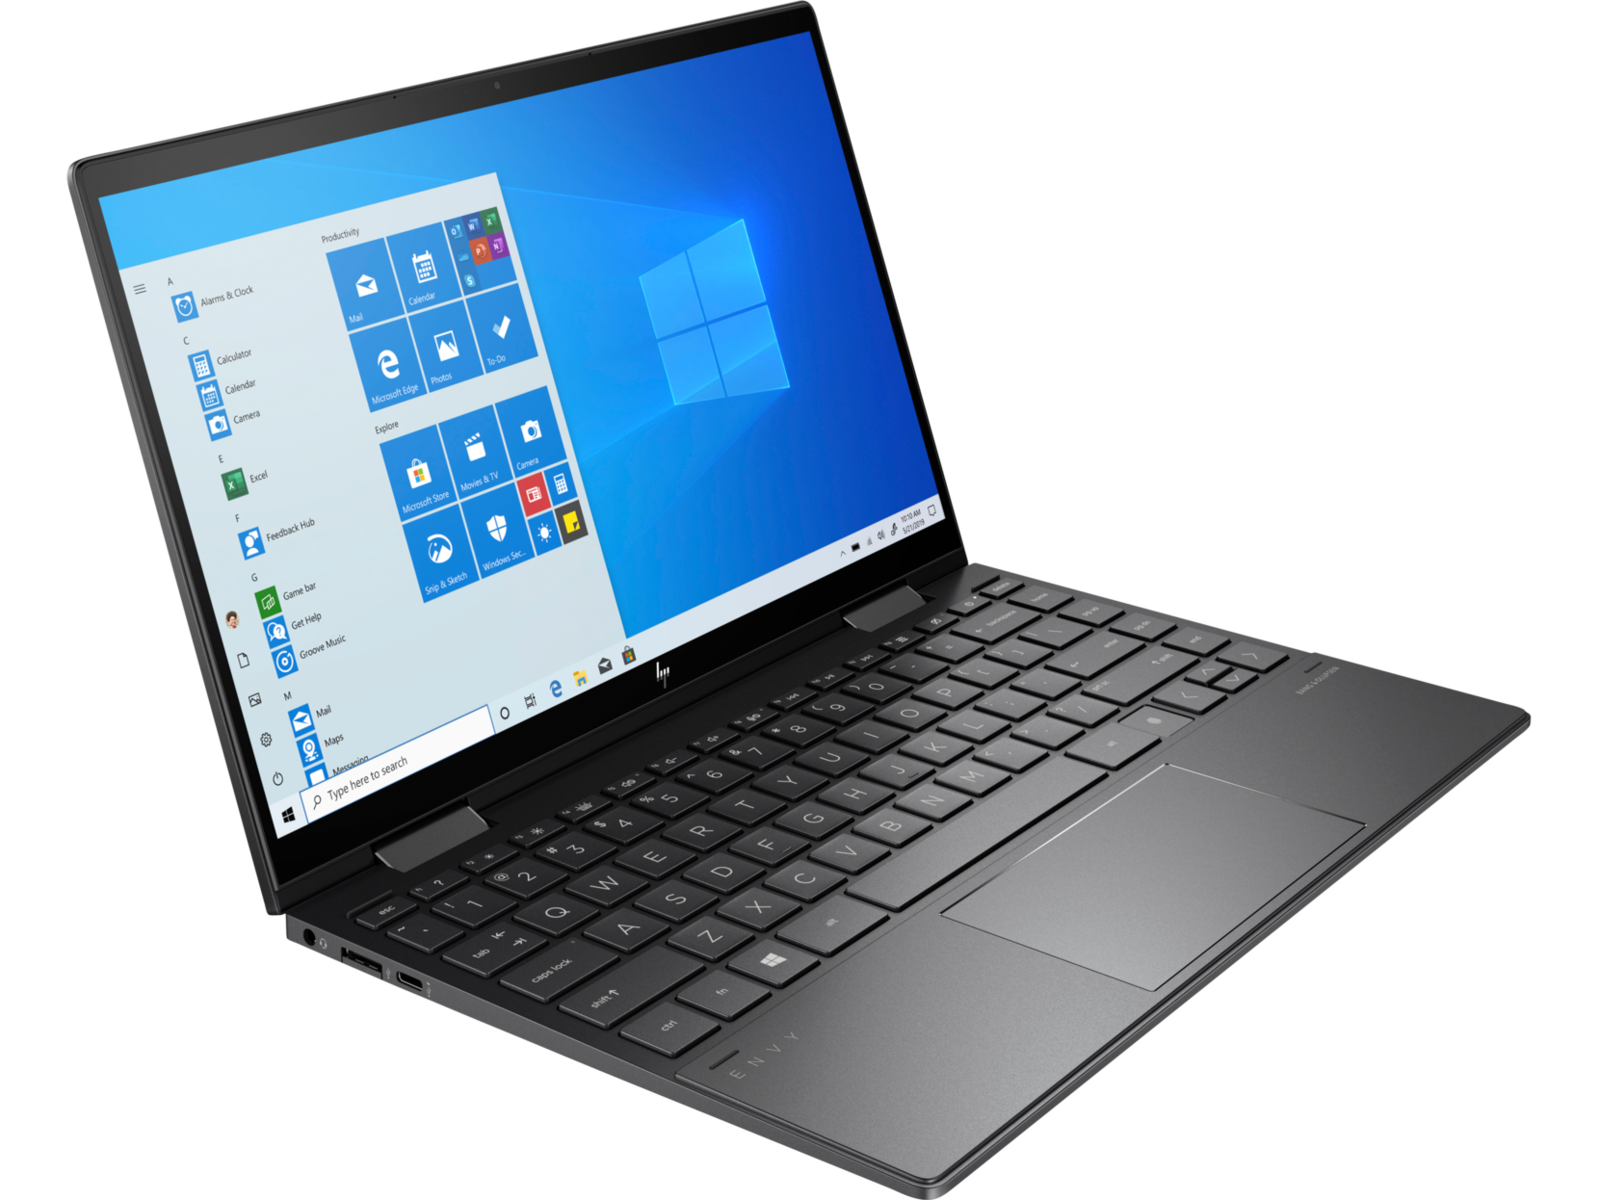
HP Envy x360 13-ay0010nr
- 06/30/2020 v7 (old)
Allen Ngo
Price comparison

