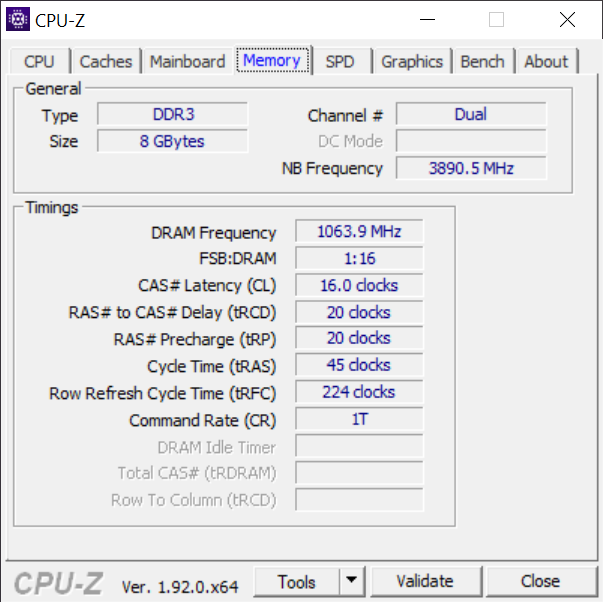
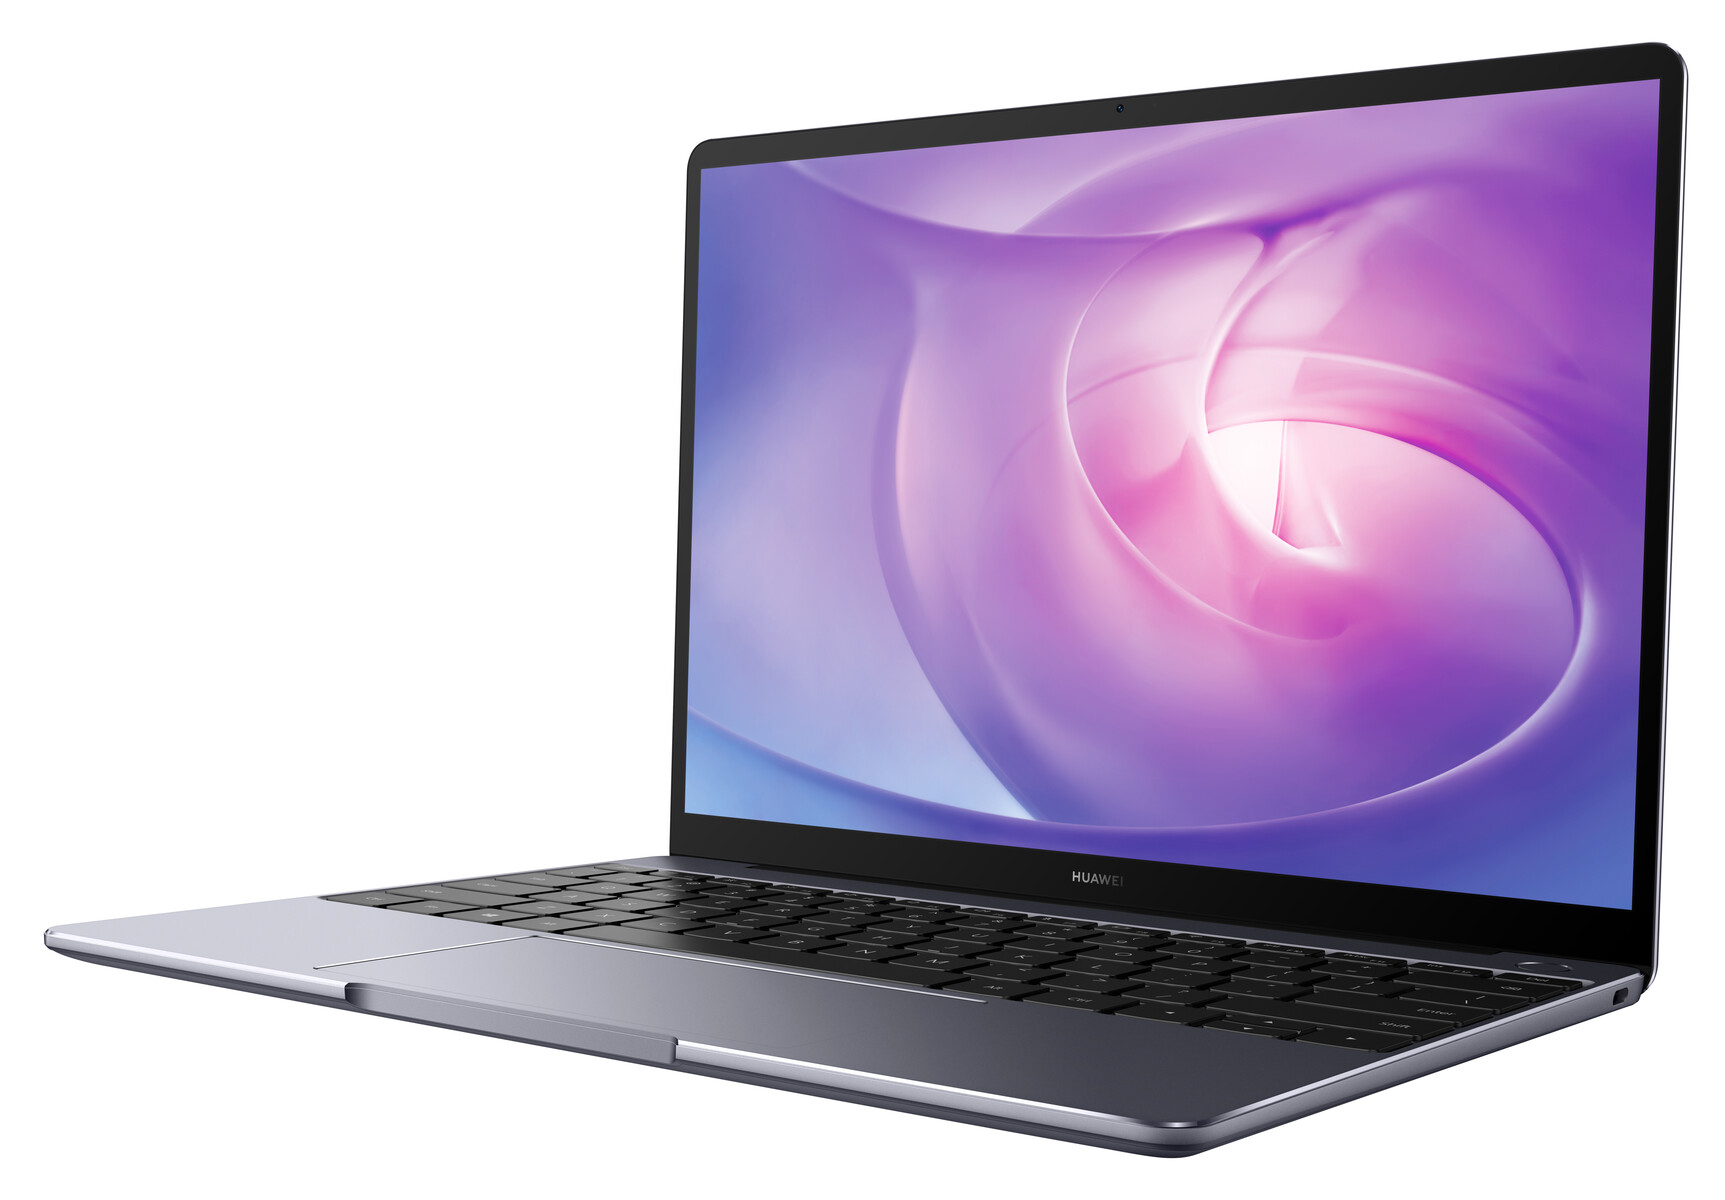
华为MateBook 13 2020笔记本电脑评测:没有性能升级的升级
Rating | Date | Model | Weight | Height | Size | Resolution | Price |
|---|---|---|---|---|---|---|---|
| 84.4 % v7 (old) | 09 / 2020 | Huawei MateBook 13 2020 i5 i5-10210U, UHD Graphics 620 | 1.3 kg | 14.9 mm | 13.00" | 2160x1440 | |
| 84.2 % v7 (old) | 03 / 2019 | Huawei Matebook 13-53010FYW i7-8565U, UHD Graphics 620 | 1.3 kg | 15 mm | 13.00" | 2160x1440 | |
| 89.6 % v7 (old) | 06 / 2020 | Apple MacBook Air 2020 i3 i3-1000NG4, Iris Plus Graphics G4 (Ice Lake 48 EU) | 1.3 kg | 16.1 mm | 13.30" | 2560x1600 | |
| 88.8 % v7 (old) | 05 / 2020 | Dell XPS 13 9300 i5 FHD i5-1035G1, UHD Graphics G1 (Ice Lake 32 EU) | 1.2 kg | 14.8 mm | 13.40" | 1920x1200 | |
| 85.9 % v7 (old) | 09 / 2020 | Acer Swift 3 SF313-52-52AS i5-1035G4, Iris Plus Graphics G4 (Ice Lake 48 EU) | 1.2 kg | 16.6 mm | 13.50" | 2256x1504 |


| |||||||||||||||||||||||||
Brightness Distribution: 94 %
Center on Battery: 423 cd/m²
Contrast: 1041:1 (Black: 0.41 cd/m²)
ΔE ColorChecker Calman: 4.4 | ∀{0.5-29.43 Ø4.71}
calibrated: 1.1
ΔE Greyscale Calman: 7.5 | ∀{0.09-98 Ø4.96}
98.6% sRGB (Argyll 1.6.3 3D)
64% AdobeRGB 1998 (Argyll 1.6.3 3D)
69.6% AdobeRGB 1998 (Argyll 3D)
98.5% sRGB (Argyll 3D)
67.9% Display P3 (Argyll 3D)
Gamma: 2.16
CCT: 6642 K
| Huawei MateBook 13 2020 i5 CMN8201 P130ZFA-BA1, IPS, 2160x1440, 13" | Huawei Matebook 13-53010FYW Chi Mei CMN8201, IPS, 2160x1440, 13" | Apple MacBook Air 2020 i3 APPA042, IPS, 2560x1600, 13.3" | Dell XPS 13 9300 i5 FHD SHP14CB, IPS, 1920x1200, 13.4" | Acer Swift 3 SF313-52-52AS BOE08BC, IPS, 2256x1504, 13.5" | |
|---|---|---|---|---|---|
| Display | 0% | 2% | 4% | 2% | |
| Display P3 Coverage (%) | 67.9 | 68.1 0% | 70.3 4% | 71.5 5% | 70.3 4% |
| sRGB Coverage (%) | 98.5 | 99.3 1% | 98 -1% | 99.4 1% | 99.8 1% |
| AdobeRGB 1998 Coverage (%) | 69.6 | 69.7 0% | 71.6 3% | 73.5 6% | 71.3 2% |
| Response Times | -16% | -5% | -41% | -25% | |
| Response Time Grey 50% / Grey 80% * (ms) | 41.6 ? | 43.2 ? -4% | 38.4 ? 8% | 60 ? -44% | 50 ? -20% |
| Response Time Black / White * (ms) | 24 ? | 30.4 ? -27% | 28.4 ? -18% | 33.2 ? -38% | 31 ? -29% |
| PWM Frequency (Hz) | 62500 ? | 60240 ? | 119000 ? | 2500 ? | 192 ? |
| Screen | 4% | 30% | 25% | 16% | |
| Brightness middle (cd/m²) | 427 | 356 -17% | 416 -3% | 619 45% | 456 7% |
| Brightness (cd/m²) | 415 | 346 -17% | 403 -3% | 591 42% | 432 4% |
| Brightness Distribution (%) | 94 | 86 -9% | 95 1% | 91 -3% | 88 -6% |
| Black Level * (cd/m²) | 0.41 | 0.35 15% | 0.34 17% | 0.35 15% | 0.32 22% |
| Contrast (:1) | 1041 | 1017 -2% | 1224 18% | 1769 70% | 1425 37% |
| Colorchecker dE 2000 * | 4.4 | 3.3 25% | 0.9 80% | 3 32% | 3.49 21% |
| Colorchecker dE 2000 max. * | 11 | 8.7 21% | 1.4 87% | 8.2 25% | 8.4 24% |
| Colorchecker dE 2000 calibrated * | 1.1 | 1.1 -0% | 0.6 45% | 1 9% | 0.72 35% |
| Greyscale dE 2000 * | 7.5 | 5.8 23% | 1 87% | 5.2 31% | 5.53 26% |
| Gamma | 2.16 102% | 2.21 100% | 2.2 100% | 2.14 103% | 2.41 91% |
| CCT | 6642 98% | 6670 97% | 6629 98% | 6340 103% | 6675 97% |
| Color Space (Percent of AdobeRGB 1998) (%) | 64 | 64.1 0% | 63.9 0% | 66.9 5% | 65 2% |
| Color Space (Percent of sRGB) (%) | 98.6 | 99.4 1% | 97.6 -1% | 99.3 1% | 100 1% |
| Total Average (Program / Settings) | -4% /
1% | 9% /
20% | -4% /
13% | -2% /
8% |
* ... smaller is better
Display Response Times
| ↔ Response Time Black to White | ||
|---|---|---|
| 24 ms ... rise ↗ and fall ↘ combined | ↗ 12 ms rise | 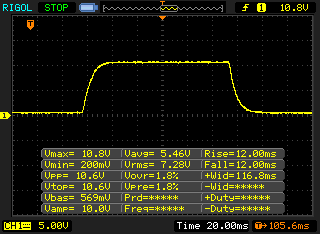 |
| ↘ 12 ms fall | ||
| The screen shows good response rates in our tests, but may be too slow for competitive gamers. In comparison, all tested devices range from 0.1 (minimum) to 240 (maximum) ms. » 54 % of all devices are better. This means that the measured response time is worse than the average of all tested devices (19.8 ms). | ||
| ↔ Response Time 50% Grey to 80% Grey | ||
| 41.6 ms ... rise ↗ and fall ↘ combined | ↗ 22.8 ms rise | 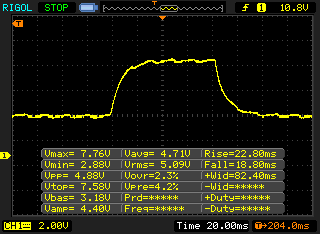 |
| ↘ 18.8 ms fall | ||
| The screen shows slow response rates in our tests and will be unsatisfactory for gamers. In comparison, all tested devices range from 0.165 (minimum) to 636 (maximum) ms. » 67 % of all devices are better. This means that the measured response time is worse than the average of all tested devices (30.9 ms). | ||
Screen Flickering / PWM (Pulse-Width Modulation)
| Screen flickering / PWM detected | 62500 Hz | ≤ 30 % brightness setting | 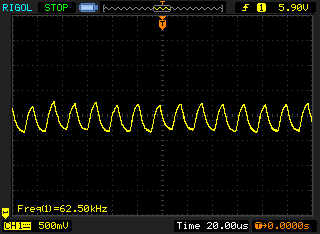 |
The display backlight flickers at 62500 Hz (worst case, e.g., utilizing PWM) Flickering detected at a brightness setting of 30 % and below. There should be no flickering or PWM above this brightness setting. The frequency of 62500 Hz is quite high, so most users sensitive to PWM should not notice any flickering. In comparison: 52 % of all tested devices do not use PWM to dim the display. If PWM was detected, an average of 7748 (minimum: 5 - maximum: 343500) Hz was measured. | |||
Cinebench R15: CPU Single 64Bit | CPU Multi 64Bit
Blender: v2.79 BMW27 CPU
7-Zip 18.03: 7z b 4 -mmt1 | 7z b 4
Geekbench 5.5: Single-Core | Multi-Core
HWBOT x265 Benchmark v2.2: 4k Preset
LibreOffice : 20 Documents To PDF
R Benchmark 2.5: Overall mean
| Cinebench R20 / CPU (Single Core) | |
| Average of class Subnotebook (128 - 832, n=57, last 2 years) | |
| Dell XPS 13 9300 i5 FHD | |
| Huawei MateBook 13 2020 i5 | |
| Average Intel Core i5-10210U (322 - 428, n=30) | |
| Acer Swift 3 SF313-52-52AS | |
| Acer Swift 3 SF313-52-52AS | |
| Apple MacBook Air 2020 i3 | |
| Cinebench R20 / CPU (Multi Core) | |
| Average of class Subnotebook (579 - 8541, n=57, last 2 years) | |
| Dell XPS 13 9300 i5 FHD | |
| Huawei MateBook 13 2020 i5 | |
| Average Intel Core i5-10210U (722 - 1820, n=30) | |
| Acer Swift 3 SF313-52-52AS | |
| Acer Swift 3 SF313-52-52AS | |
| Apple MacBook Air 2020 i3 | |
| Cinebench R15 / CPU Single 64Bit | |
| Average of class Subnotebook (72.4 - 322, n=57, last 2 years) | |
| Huawei Matebook 13-53010FYW | |
| Huawei MateBook 13 2020 i5 | |
| Dell XPS 13 9300 i5 FHD | |
| Average Intel Core i5-10210U (134 - 174, n=35) | |
| Acer Swift 3 SF313-52-52AS | |
| Apple MacBook Air 2020 i3 | |
| Cinebench R15 / CPU Multi 64Bit | |
| Average of class Subnotebook (327 - 3345, n=57, last 2 years) | |
| Huawei Matebook 13-53010FYW | |
| Dell XPS 13 9300 i5 FHD | |
| Dell XPS 13 9300 i5 FHD | |
| Huawei MateBook 13 2020 i5 | |
| Average Intel Core i5-10210U (320 - 790, n=35) | |
| Acer Swift 3 SF313-52-52AS | |
| Apple MacBook Air 2020 i3 | |
| Blender / v2.79 BMW27 CPU | |
| Apple MacBook Air 2020 i3 | |
| Acer Swift 3 SF313-52-52AS | |
| Acer Swift 3 SF313-52-52AS | |
| Average Intel Core i5-10210U (585 - 1339, n=24) | |
| Huawei MateBook 13 2020 i5 | |
| Dell XPS 13 9300 i5 FHD | |
| Average of class Subnotebook (159 - 2271, n=58, last 2 years) | |
| 7-Zip 18.03 / 7z b 4 -mmt1 | |
| Average of class Subnotebook (2643 - 6699, n=59, last 2 years) | |
| Huawei MateBook 13 2020 i5 | |
| Average Intel Core i5-10210U (3504 - 4467, n=24) | |
| Dell XPS 13 9300 i5 FHD | |
| Acer Swift 3 SF313-52-52AS | |
| Acer Swift 3 SF313-52-52AS | |
| Apple MacBook Air 2020 i3 | |
| 7-Zip 18.03 / 7z b 4 | |
| Average of class Subnotebook (11668 - 77867, n=57, last 2 years) | |
| Dell XPS 13 9300 i5 FHD | |
| Average Intel Core i5-10210U (10920 - 21679, n=24) | |
| Huawei MateBook 13 2020 i5 | |
| Acer Swift 3 SF313-52-52AS | |
| Acer Swift 3 SF313-52-52AS | |
| Apple MacBook Air 2020 i3 | |
| Geekbench 5.5 / Single-Core | |
| Average of class Subnotebook (726 - 2224, n=49, last 2 years) | |
| Dell XPS 13 9300 i5 FHD | |
| Apple MacBook Air 2020 i3 | |
| Huawei MateBook 13 2020 i5 | |
| Acer Swift 3 SF313-52-52AS | |
| Acer Swift 3 SF313-52-52AS | |
| Average Intel Core i5-10210U (949 - 1133, n=27) | |
| Geekbench 5.5 / Multi-Core | |
| Average of class Subnotebook (2557 - 17218, n=49, last 2 years) | |
| Dell XPS 13 9300 i5 FHD | |
| Huawei MateBook 13 2020 i5 | |
| Average Intel Core i5-10210U (2079 - 4256, n=27) | |
| Acer Swift 3 SF313-52-52AS | |
| Acer Swift 3 SF313-52-52AS | |
| Apple MacBook Air 2020 i3 | |
| HWBOT x265 Benchmark v2.2 / 4k Preset | |
| Average of class Subnotebook (0.97 - 25.1, n=57, last 2 years) | |
| Huawei MateBook 13 2020 i5 | |
| Average Intel Core i5-10210U (2.36 - 6.28, n=24) | |
| Dell XPS 13 9300 i5 FHD | |
| Acer Swift 3 SF313-52-52AS | |
| Acer Swift 3 SF313-52-52AS | |
| Apple MacBook Air 2020 i3 | |
| LibreOffice / 20 Documents To PDF | |
| Apple MacBook Air 2020 i3 | |
| Acer Swift 3 SF313-52-52AS | |
| Acer Swift 3 SF313-52-52AS | |
| Average Intel Core i5-10210U (49.6 - 80.3, n=18) | |
| Huawei MateBook 13 2020 i5 | |
| Average of class Subnotebook (39.9 - 220, n=56, last 2 years) | |
| R Benchmark 2.5 / Overall mean | |
| Apple MacBook Air 2020 i3 | |
| Acer Swift 3 SF313-52-52AS | |
| Acer Swift 3 SF313-52-52AS | |
| Average Intel Core i5-10210U (0.658 - 0.901, n=24) | |
| Dell XPS 13 9300 i5 FHD | |
| Huawei MateBook 13 2020 i5 | |
| Average of class Subnotebook (0.4024 - 1.456, n=58, last 2 years) | |
* ... smaller is better
| PCMark 8 Home Score Accelerated v2 | 3946 points | |
| PCMark 8 Creative Score Accelerated v2 | 5110 points | |
| PCMark 8 Work Score Accelerated v2 | 4773 points | |
| PCMark 10 Score | 4067 points | |
Help | ||
| DPC Latencies / LatencyMon - interrupt to process latency (max), Web, Youtube, Prime95 | |
| Acer Swift 3 SF313-52-52AS | |
| Dell XPS 13 9300 i5 FHD | |
| Huawei MateBook 13 2020 i5 | |
* ... smaller is better
| Huawei MateBook 13 2020 i5 WDC PC SN730 SDBPNTY-512G | Huawei Matebook 13-53010FYW WDC PC SN520 SDAPNUW-512G | Apple MacBook Air 2020 i3 Apple SSD AP0256 | Dell XPS 13 9300 i5 FHD Toshiba XG6 KXG60ZNV512G | Acer Swift 3 SF313-52-52AS SK Hynix BC501 HFM512GDJTNG | Average WDC PC SN730 SDBPNTY-512G | |
|---|---|---|---|---|---|---|
| CrystalDiskMark 5.2 / 6 | 19% | -41% | 1% | -25% | 15% | |
| Write 4K (MB/s) | 190.5 | 191.2 0% | 34.57 -82% | 121.9 -36% | 120.6 -37% | 164.3 ? -14% |
| Read 4K (MB/s) | 53.7 | 53.1 -1% | 28.48 -47% | 50 -7% | 46.88 -13% | 48.2 ? -10% |
| Write Seq (MB/s) | 1436 | 1768 23% | 1026 -29% | 1497 4% | 1044 -27% | 2096 ? 46% |
| Read Seq (MB/s) | 1356 | 1710 26% | 1109 -18% | 2111 56% | 1147 -15% | 2123 ? 57% |
| Write 4K Q32T1 (MB/s) | 382.5 | 575 50% | 178.4 -53% | 365.9 -4% | 332.4 -13% | 451 ? 18% |
| Read 4K Q32T1 (MB/s) | 502 | 654 30% | 557 11% | 384.6 -23% | 443.3 -12% | 509 ? 1% |
| Write Seq Q32T1 (MB/s) | 2114 | 2544 20% | 970 -54% | 2748 30% | 1052 -50% | 2551 ? 21% |
| Read Seq Q32T1 (MB/s) | 3410 | 3433 1% | 1513 -56% | 3119 -9% | 2171 -36% | 3330 ? -2% |
| AS SSD | -10% | -85% | -32% | -43% | -20% | |
| Seq Read (MB/s) | 2912 | 2934 1% | 1135 -61% | 2328 -20% | 1370 -53% | 2605 ? -11% |
| Seq Write (MB/s) | 2190 | 2407 10% | 1090 -50% | 1137 -48% | 1019 -53% | 1905 ? -13% |
| 4K Read (MB/s) | 49.52 | 48.31 -2% | 14.87 -70% | 48.07 -3% | 50.8 3% | 45.8 ? -8% |
| 4K Write (MB/s) | 167.1 | 179.7 8% | 26.27 -84% | 120.6 -28% | 111.2 -33% | 155.6 ? -7% |
| 4K-64 Read (MB/s) | 1447 | 1296 -10% | 585 -60% | 899 -38% | 770 -47% | 1181 ? -18% |
| 4K-64 Write (MB/s) | 1513 | 1459 -4% | 154.6 -90% | 1220 -19% | 713 -53% | 1372 ? -9% |
| Access Time Read * (ms) | 0.05 | 0.103 -106% | 0.126 -152% | 0.085 -70% | 0.0801 ? -60% | |
| Access Time Write * (ms) | 0.023 | 0.021 9% | 0.058 -152% | 0.033 -43% | 0.034 -48% | 0.04195 ? -82% |
| Score Read (Points) | 1787 | 1638 -8% | 713 -60% | 1180 -34% | 958 -46% | 1488 ? -17% |
| Score Write (Points) | 1899 | 1879 -1% | 290 -85% | 1455 -23% | 926 -51% | 1718 ? -10% |
| Score Total (Points) | 4569 | 4334 -5% | 1365 -70% | 3189 -30% | 2370 -48% | 3938 ? -14% |
| Copy ISO MB/s (MB/s) | 2290 | 1718 ? -25% | ||||
| Copy Program MB/s (MB/s) | 555 | 536 ? -3% | ||||
| Copy Game MB/s (MB/s) | 1300 | 1193 ? -8% | ||||
| Total Average (Program / Settings) | 5% /
2% | -63% /
-66% | -16% /
-18% | -34% /
-35% | -3% /
-8% |
* ... smaller is better

Continuous Performance Read: DiskSpd Read Loop, Queue Depth 8
| 3DMark 11 Performance | 2079 points | |
| 3DMark Cloud Gate Standard Score | 9653 points | |
| 3DMark Fire Strike Score | 1175 points | |
Help | ||
| low | med. | high | ultra | |
|---|---|---|---|---|
| The Witcher 3 (2015) | 18.8 | 12.1 | ||
| Dota 2 Reborn (2015) | 81.3 | 47.8 | 22.1 | 19.4 |
| X-Plane 11.11 (2018) | 13.2 | 10.9 | 10.5 | |
| Far Cry 5 (2018) | 13 | 7 | ||
| F1 2019 (2019) | 32 | 13 |
Noise level
| Idle |
| 29.7 / 29.7 / 29.9 dB(A) |
| Load |
| 31.7 / 32.8 dB(A) |
 | ||
30 dB silent 40 dB(A) audible 50 dB(A) loud |
||
min: | ||
| Huawei MateBook 13 2020 i5 UHD Graphics 620, i5-10210U, WDC PC SN730 SDBPNTY-512G | Huawei Matebook 13-53010FYW UHD Graphics 620, i7-8565U, WDC PC SN520 SDAPNUW-512G | Apple MacBook Air 2020 i3 Iris Plus Graphics G4 (Ice Lake 48 EU), i3-1000NG4, Apple SSD AP0256 | Dell XPS 13 9300 i5 FHD UHD Graphics G1 (Ice Lake 32 EU), i5-1035G1, Toshiba XG6 KXG60ZNV512G | Acer Swift 3 SF313-52-52AS Iris Plus Graphics G4 (Ice Lake 48 EU), i5-1035G4, SK Hynix BC501 HFM512GDJTNG | |
|---|---|---|---|---|---|
| Noise | 1% | -2% | 2% | -5% | |
| off / environment * (dB) | 29.7 | 29.2 2% | 29 2% | 29.3 1% | 31.2 -5% |
| Idle Minimum * (dB) | 29.7 | 29.2 2% | 29 2% | 29.3 1% | 31.2 -5% |
| Idle Average * (dB) | 29.7 | 29.2 2% | 29 2% | 29.3 1% | 31.2 -5% |
| Idle Maximum * (dB) | 29.9 | 29.2 2% | 29 3% | 29.3 2% | 31.2 -4% |
| Load Average * (dB) | 31.7 | 31.7 -0% | 31.6 -0% | 30 5% | 33.2 -5% |
| Load Maximum * (dB) | 32.8 | 33 -1% | 39.4 -20% | 32.4 1% | 34.9 -6% |
* ... smaller is better
(±) The maximum temperature on the upper side is 42.1 °C / 108 F, compared to the average of 35.9 °C / 97 F, ranging from 21.4 to 59 °C for the class Subnotebook.
(-) The bottom heats up to a maximum of 46.2 °C / 115 F, compared to the average of 39.2 °C / 103 F
(+) In idle usage, the average temperature for the upper side is 23.8 °C / 75 F, compared to the device average of 30.8 °C / 87 F.
(±) The palmrests and touchpad can get very hot to the touch with a maximum of 37.2 °C / 99 F.
(-) The average temperature of the palmrest area of similar devices was 28.2 °C / 82.8 F (-9 °C / -16.2 F).
Huawei MateBook 13 2020 i5 audio analysis
(±) | speaker loudness is average but good (75.7 dB)
Bass 100 - 315 Hz
(-) | nearly no bass - on average 18.8% lower than median
(±) | linearity of bass is average (11.3% delta to prev. frequency)
Mids 400 - 2000 Hz
(±) | higher mids - on average 5.7% higher than median
(+) | mids are linear (6.2% delta to prev. frequency)
Highs 2 - 16 kHz
(+) | balanced highs - only 3.1% away from median
(+) | highs are linear (6.9% delta to prev. frequency)
Overall 100 - 16.000 Hz
(±) | linearity of overall sound is average (24.1% difference to median)
Compared to same class
» 82% of all tested devices in this class were better, 4% similar, 14% worse
» The best had a delta of 5%, average was 18%, worst was 53%
Compared to all devices tested
» 73% of all tested devices were better, 6% similar, 21% worse
» The best had a delta of 4%, average was 23%, worst was 134%
Acer Swift 3 SF313-52-52AS audio analysis
(±) | speaker loudness is average but good (77.1 dB)
Bass 100 - 315 Hz
(-) | nearly no bass - on average 26.7% lower than median
(±) | linearity of bass is average (7.8% delta to prev. frequency)
Mids 400 - 2000 Hz
(±) | reduced mids - on average 6.1% lower than median
(±) | linearity of mids is average (10.8% delta to prev. frequency)
Highs 2 - 16 kHz
(±) | higher highs - on average 11% higher than median
(+) | highs are linear (3.9% delta to prev. frequency)
Overall 100 - 16.000 Hz
(-) | overall sound is not linear (32.2% difference to median)
Compared to same class
» 94% of all tested devices in this class were better, 2% similar, 4% worse
» The best had a delta of 5%, average was 18%, worst was 53%
Compared to all devices tested
» 91% of all tested devices were better, 2% similar, 7% worse
» The best had a delta of 4%, average was 23%, worst was 134%
| Off / Standby | |
| Idle | |
| Load |
|
Key:
min: | |
| Huawei MateBook 13 2020 i5 i5-10210U, UHD Graphics 620, WDC PC SN730 SDBPNTY-512G, IPS, 2160x1440, 13" | Huawei Matebook 13-53010FYW i7-8565U, UHD Graphics 620, WDC PC SN520 SDAPNUW-512G, IPS, 2160x1440, 13" | Apple MacBook Air 2020 i3 i3-1000NG4, Iris Plus Graphics G4 (Ice Lake 48 EU), Apple SSD AP0256, IPS, 2560x1600, 13.3" | Dell XPS 13 9300 i5 FHD i5-1035G1, UHD Graphics G1 (Ice Lake 32 EU), Toshiba XG6 KXG60ZNV512G, IPS, 1920x1200, 13.4" | Acer Swift 3 SF313-52-52AS i5-1035G4, Iris Plus Graphics G4 (Ice Lake 48 EU), SK Hynix BC501 HFM512GDJTNG, IPS, 2256x1504, 13.5" | Average Intel UHD Graphics 620 | Average of class Subnotebook | |
|---|---|---|---|---|---|---|---|
| Power Consumption | -7% | 33% | 6% | 25% | 5% | 0% | |
| Idle Minimum * (Watt) | 2.97 | 3.84 -29% | 2.1 29% | 3.4 -14% | 3 -1% | 3.81 ? -28% | 3.71 ? -25% |
| Idle Average * (Watt) | 7.5 | 7.68 -2% | 6.2 17% | 6 20% | 6.1 19% | 6.94 ? 7% | 6.54 ? 13% |
| Idle Maximum * (Watt) | 9.6 | 9.36 2% | 7 27% | 10.2 -6% | 8.4 12% | 8.75 ? 9% | 7.89 ? 18% |
| Load Average * (Watt) | 38.9 | 43.2 -11% | 24.7 37% | 36.6 6% | 25.7 34% | 35 ? 10% | 42.1 ? -8% |
| Load Maximum * (Watt) | 66.7 | 64.8 3% | 30.6 54% | 49.3 26% | 27.6 59% | 47.5 ? 29% | 65.1 ? 2% |
* ... smaller is better
| Huawei MateBook 13 2020 i5 i5-10210U, UHD Graphics 620, 41.7 Wh | Huawei Matebook 13-53010FYW i7-8565U, UHD Graphics 620, 41.7 Wh | Apple MacBook Air 2020 i3 i3-1000NG4, Iris Plus Graphics G4 (Ice Lake 48 EU), 49.9 Wh | Dell XPS 13 9300 i5 FHD i5-1035G1, UHD Graphics G1 (Ice Lake 32 EU), 52 Wh | Acer Swift 3 SF313-52-52AS i5-1035G4, Iris Plus Graphics G4 (Ice Lake 48 EU), 54.5 Wh | Average of class Subnotebook | |
|---|---|---|---|---|---|---|
| Battery runtime | 1% | 32% | 83% | 46% | 64% | |
| H.264 (h) | 9.7 | 11.1 14% | 14.4 48% | 15.3 ? 58% | ||
| WiFi v1.3 (h) | 7.4 | 7 -5% | 11 49% | 11.7 58% | 10.8 46% | 14.1 ? 91% |
| Load (h) | 1.4 | 1.5 7% | 3.4 143% | 1.998 ? 43% |
Pros
Cons
总结——2020 MateBook 13没有提供任何改进:
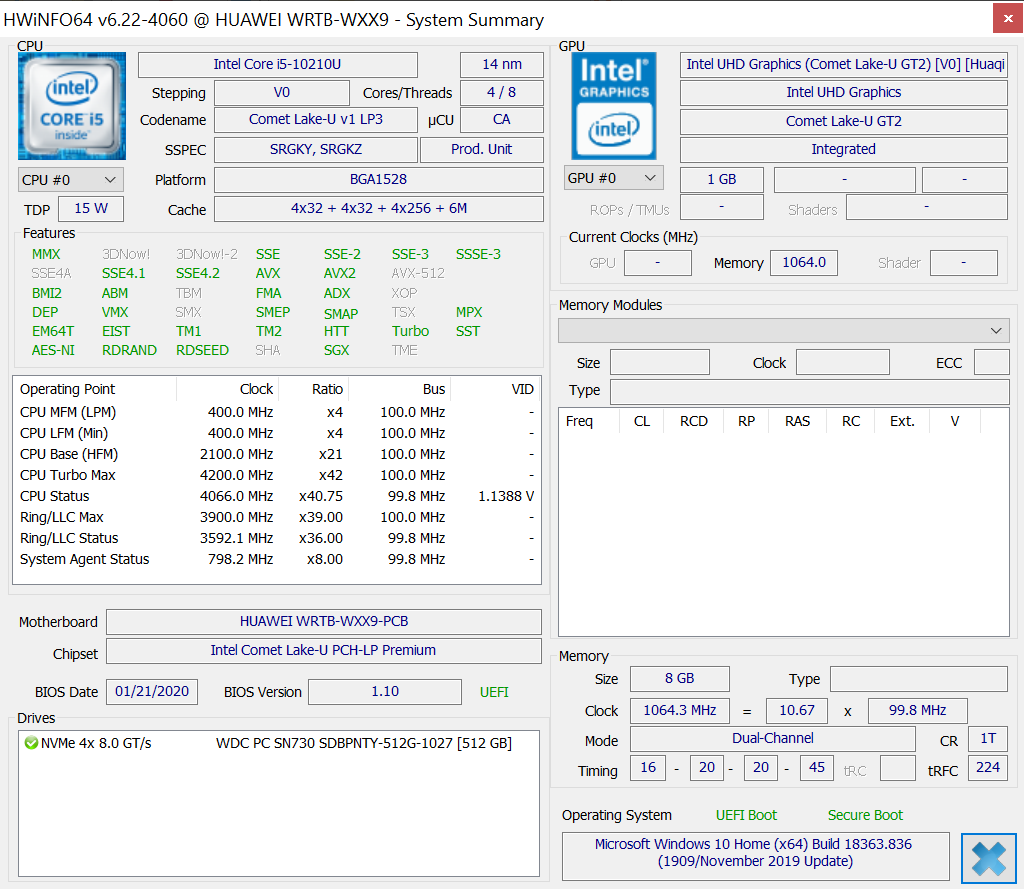
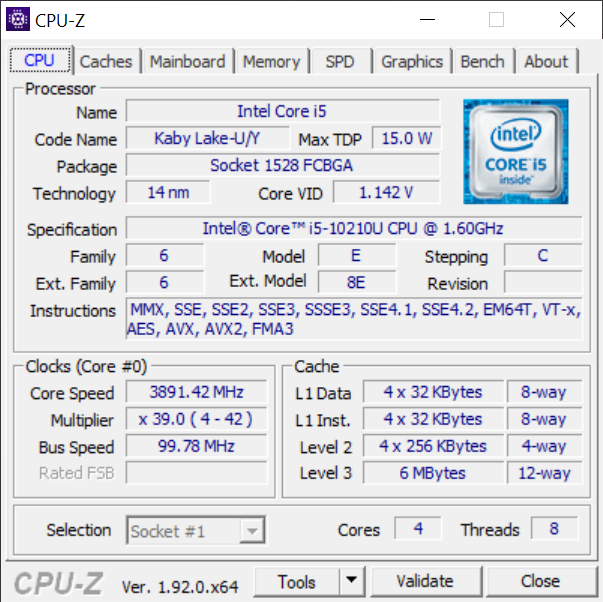
2020 MateBook 13只是一个很小的更新。您将获得新的处理器,但是性能基本上与之前的处理器相同。华为并未在每个地区提供所有配置:例如,德国客户未获得配备GeForce GPU的MateBook 13。
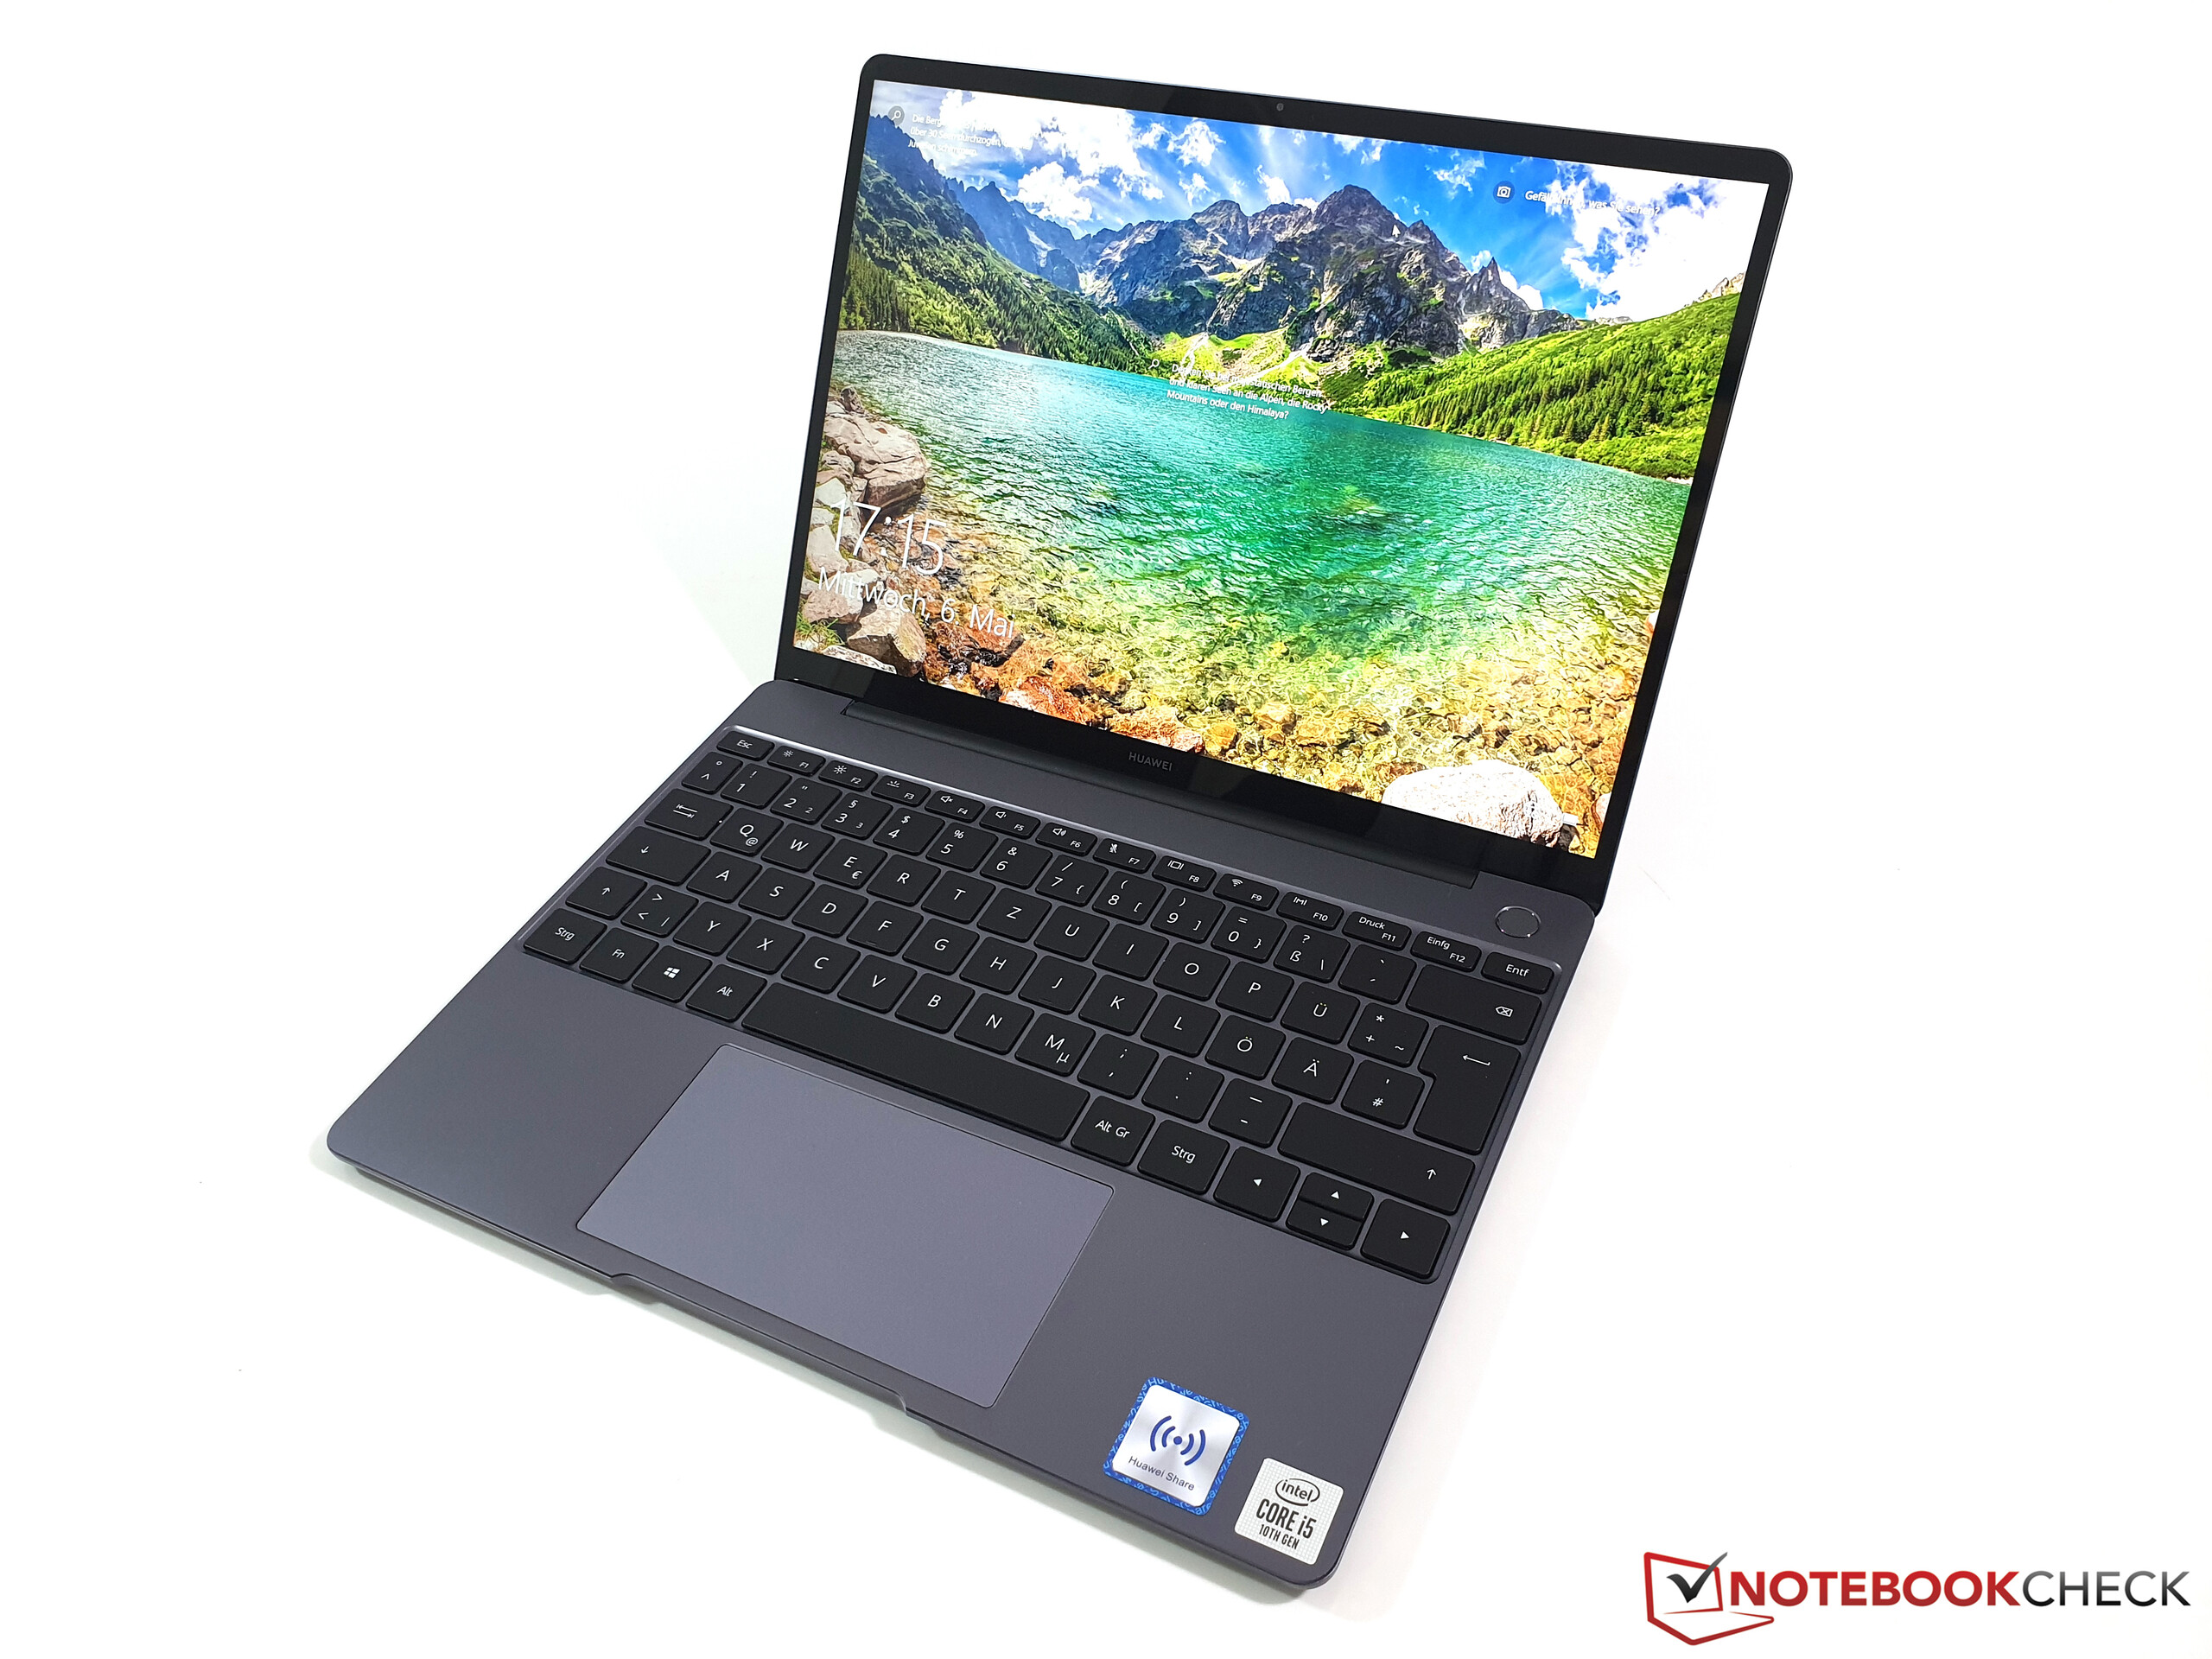
MateBook 13仍然是不错的超极本。我们特别喜欢金属外壳和优质的屏幕,即使它不是触摸屏,您也应该可以校准面板以获得最佳效果。带iGPU的SKU在负载下也非常安静。
MateBook 13没有任何进步,但是它仍然是性价比高的不错的超极本。
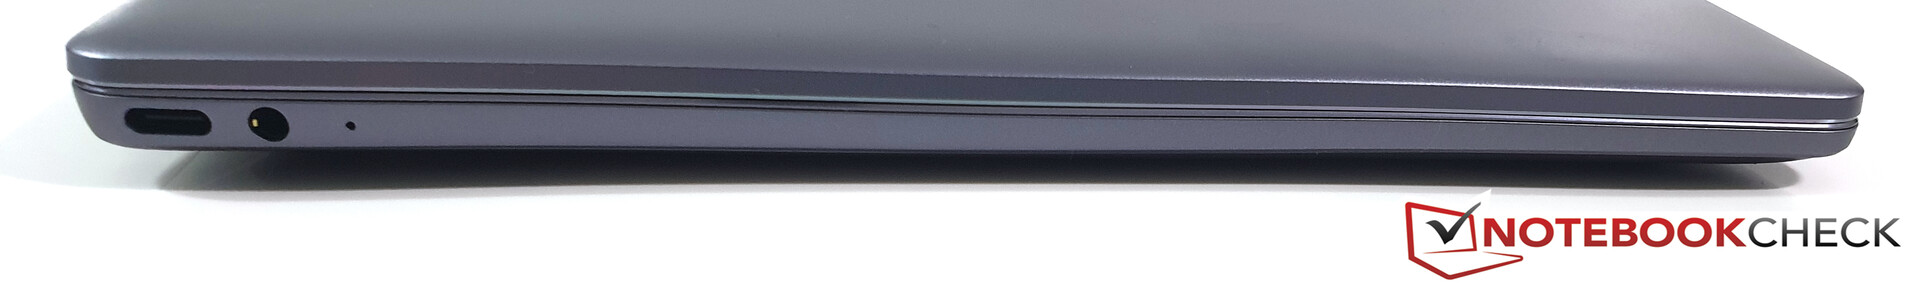
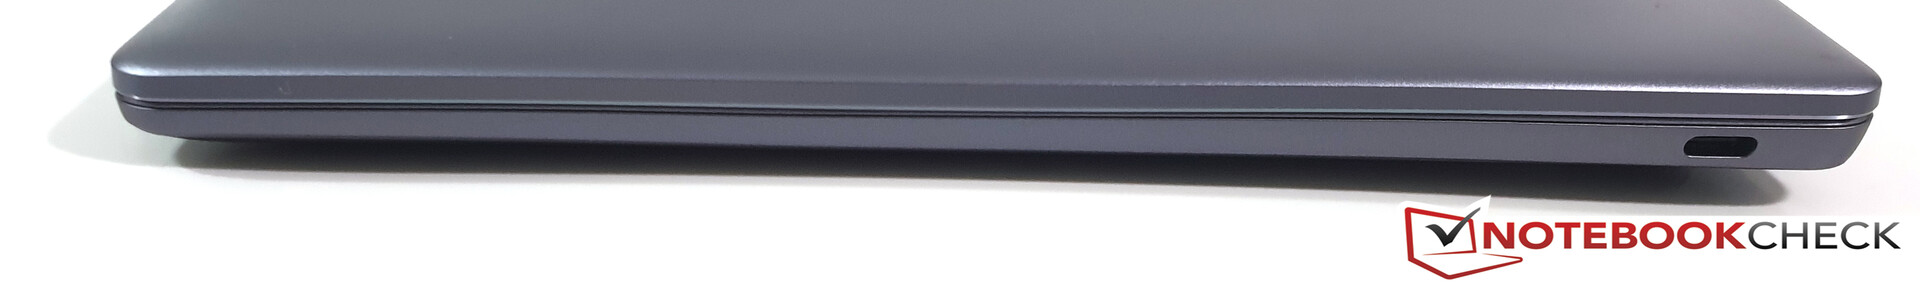
即使竞争对手放弃了更新的Ice Lake处理器在GPU性能方面的优势,性能仍然足以满足日常任务。接口情况也不是完美的,因为您只能在左侧为笔记本电脑充电,而在右侧只能连接外接显示器。没有USB Type-A端口,因此您实际上必须要使用适配器。
Huawei MateBook 13 2020 i5
- 06/09/2020 v7 (old)
Andreas Osthoff
Price comparison

