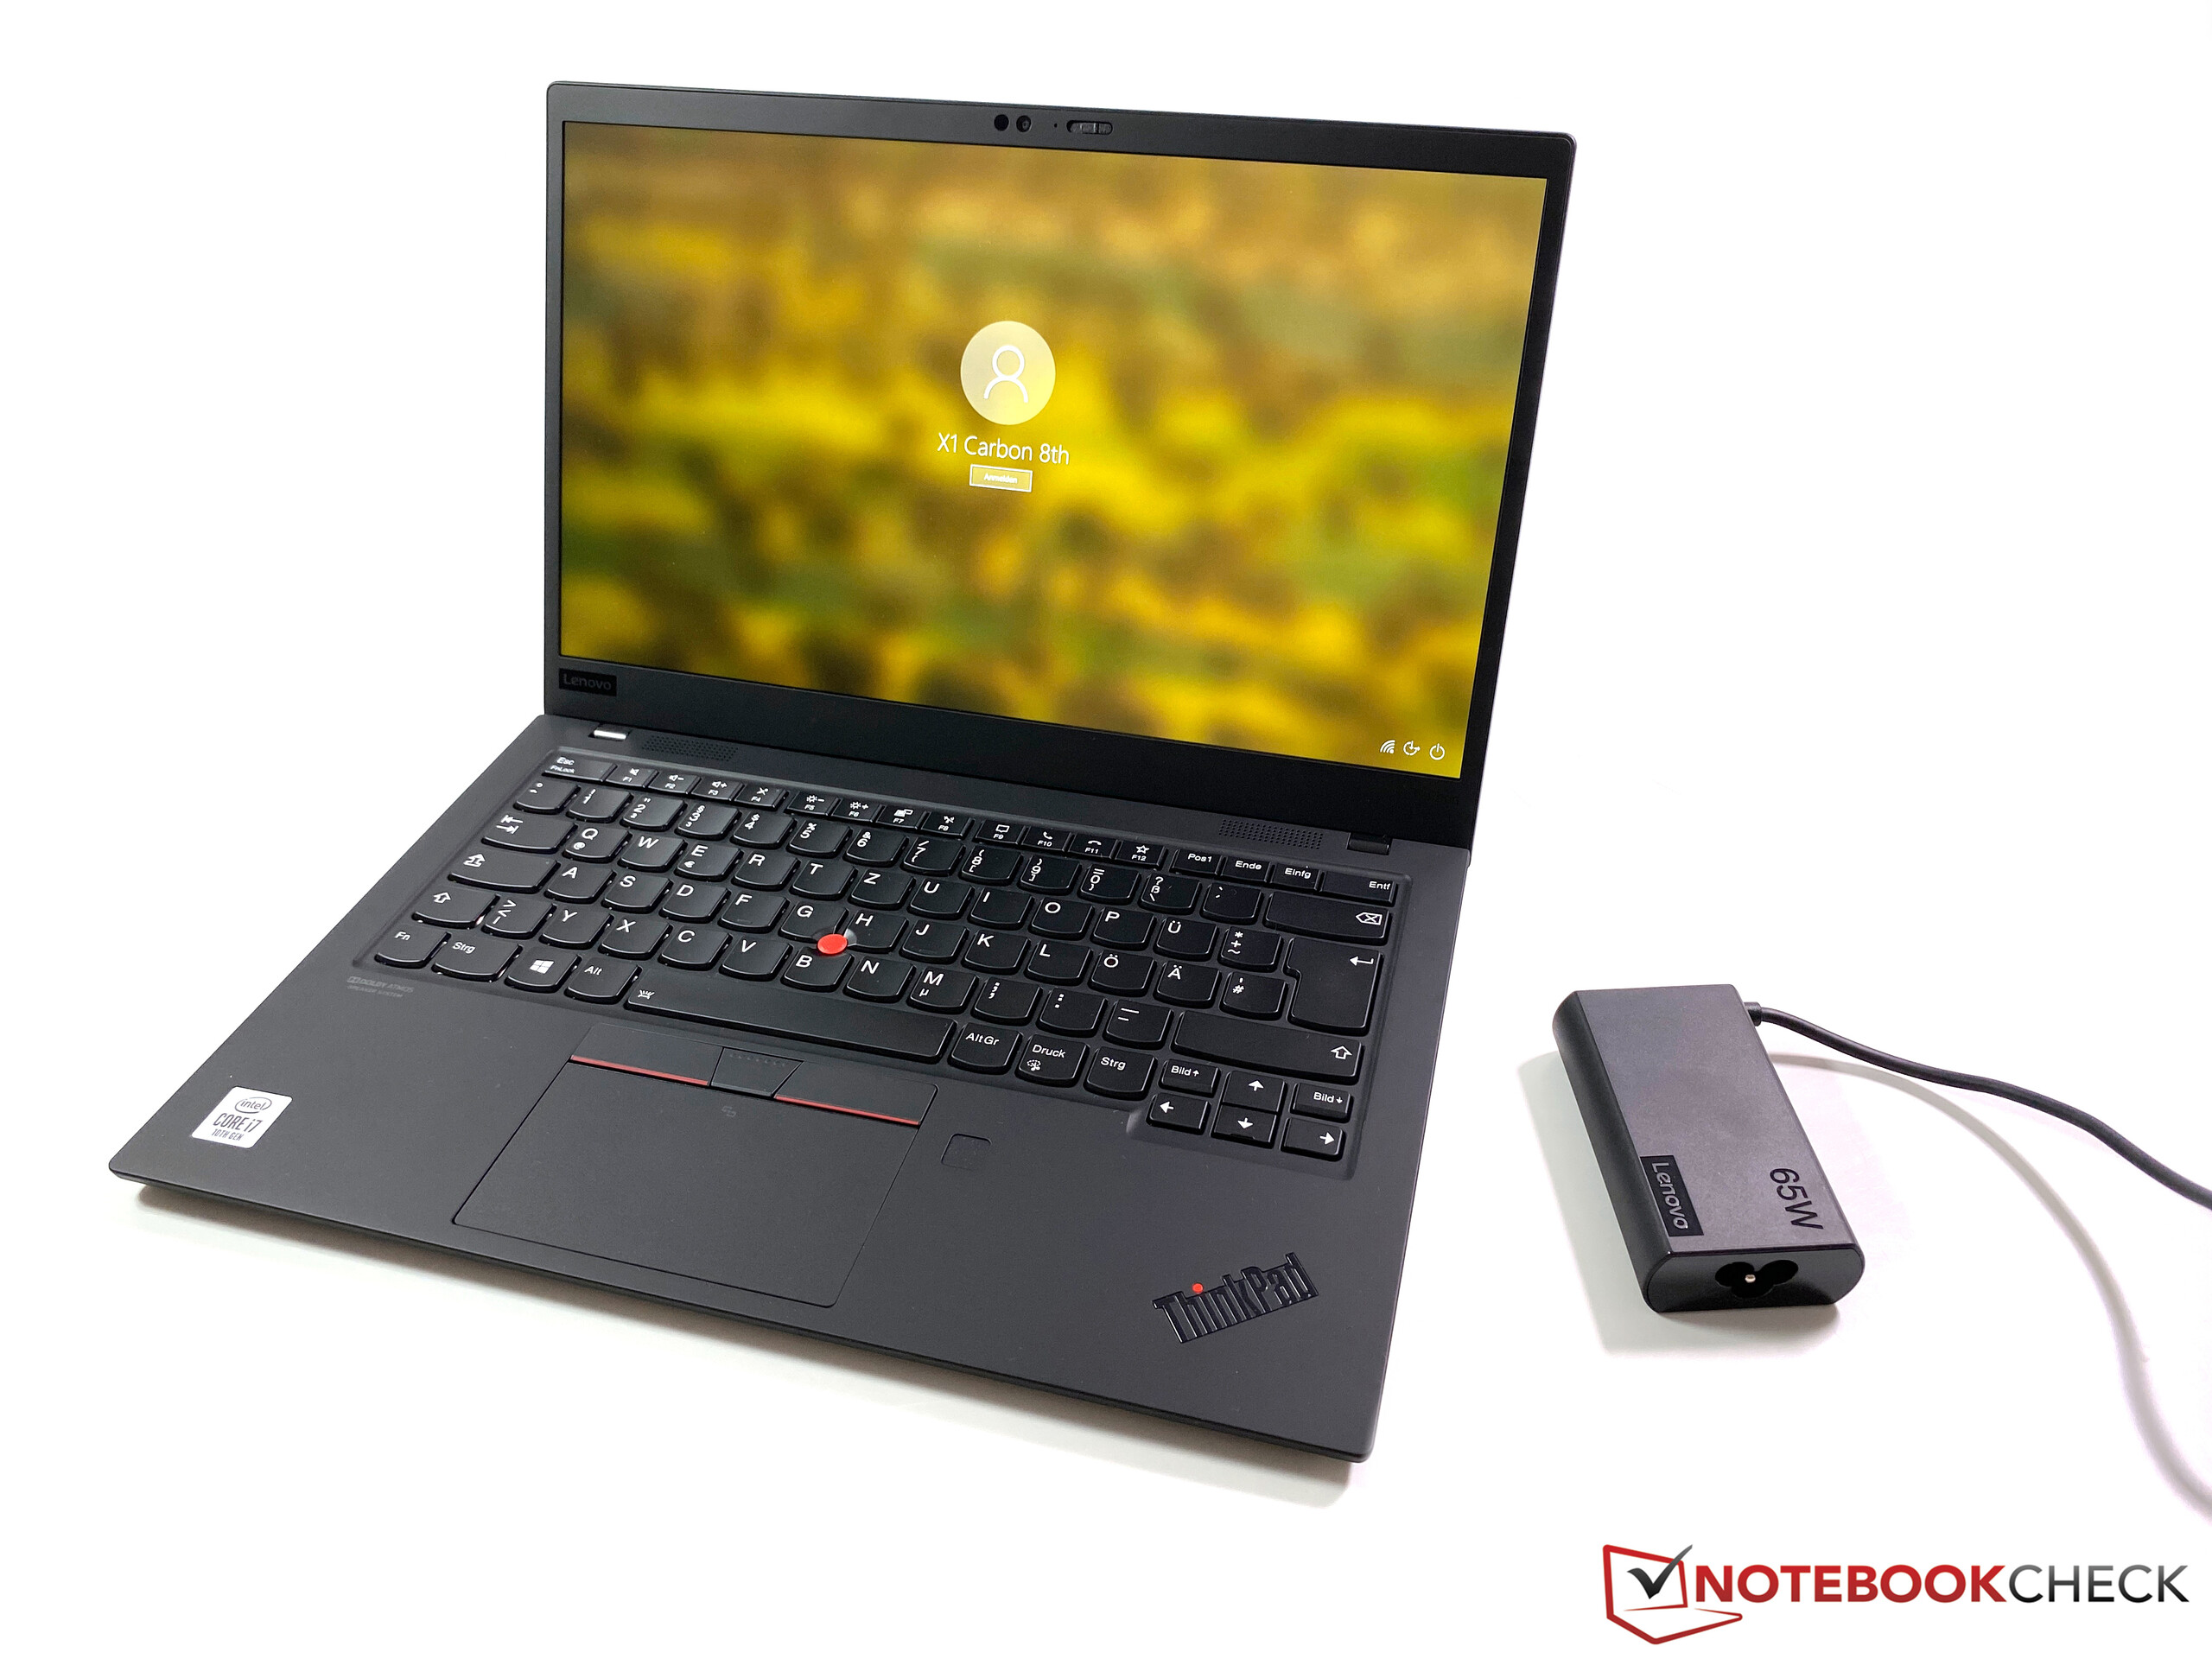
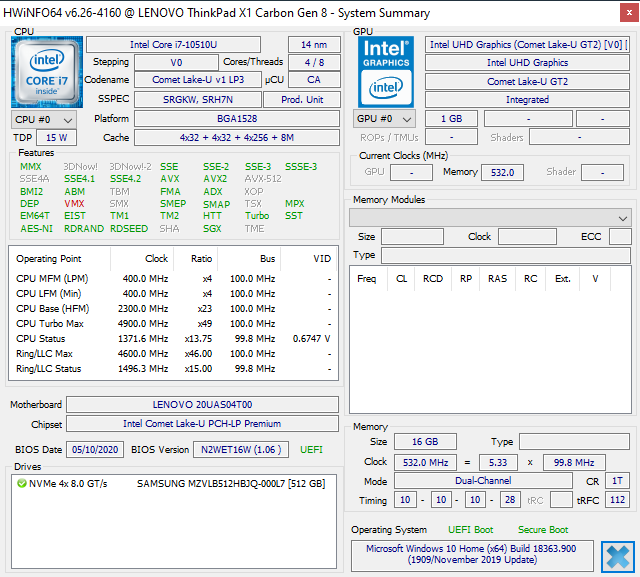
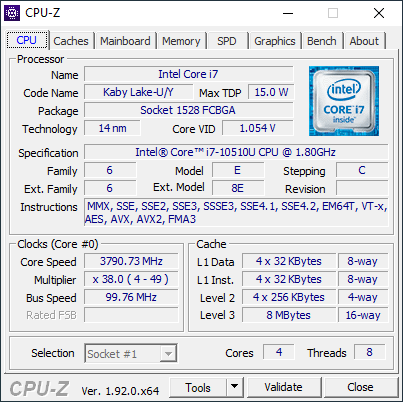
联想ThinkPad X1 Carbon 2020笔记本电脑评测:装备了新电源适配器的商务本
Rating | Date | Model | Weight | Height | Size | Resolution | Price |
|---|---|---|---|---|---|---|---|
| 90.2 % v7 (old) | 09 / 2020 | Lenovo ThinkPad X1 Carbon 2020-20UAS04T00 i7-10510U, UHD Graphics 620 | 1.1 kg | 14.9 mm | 14.00" | 1920x1080 | |
| 90.5 % v7 (old) | 03 / 2019 | HP Elitebook x360 1040 G5 i7-8650U, UHD Graphics 620 | 1.4 kg | 16.9 mm | 14.00" | 1920x1080 | |
| 92.1 % v7 (old) | 07 / 2020 | Apple MacBook Pro 13 2020 2GHz i5 10th-Gen i5-1038NG7, Iris Plus Graphics G7 (Ice Lake 64 EU) | 1.4 kg | 15.6 mm | 13.30" | 2560x1600 | |
| 87.2 % v7 (old) | 08 / 2019 | Dell Latitude 7400-8N6DH i7-8665U, UHD Graphics 620 | 1.5 kg | 18.9 mm | 14.00" | 1920x1080 | |
| 88.5 % v7 (old) | Lenovo ThinkPad X1 Carbon G7 20R1-000YUS i7-10510U, UHD Graphics 620 | 1.2 kg | 15.4 mm | 14.00" | 3840x2160 |

| Networking | |
| iperf3 transmit AX12 | |
| Lenovo ThinkPad X1 Carbon G7 20R1-000YUS | |
| Average Intel Wi-Fi 6 AX201 (49.8 - 1775, n=324) | |
| Lenovo ThinkPad X1 Carbon 2020-20UAS04T00 | |
| Apple MacBook Pro 13 2020 2GHz i5 10th-Gen | |
| Dell Latitude 7400-8N6DH | |
| HP Elitebook x360 1040 G5 | |
| iperf3 receive AX12 | |
| Lenovo ThinkPad X1 Carbon 2020-20UAS04T00 | |
| Average Intel Wi-Fi 6 AX201 (136 - 1743, n=324) | |
| Lenovo ThinkPad X1 Carbon G7 20R1-000YUS | |
| Apple MacBook Pro 13 2020 2GHz i5 10th-Gen | |
| HP Elitebook x360 1040 G5 | |
| Dell Latitude 7400-8N6DH | |


| |||||||||||||||||||||||||
Brightness Distribution: 90 %
Center on Battery: 421 cd/m²
Contrast: 1563:1 (Black: 0.27 cd/m²)
ΔE ColorChecker Calman: 4.7 | ∀{0.5-29.43 Ø4.71}
calibrated: 2
ΔE Greyscale Calman: 6.4 | ∀{0.09-98 Ø4.96}
91.5% sRGB (Argyll 1.6.3 3D)
59.5% AdobeRGB 1998 (Argyll 1.6.3 3D)
67.1% AdobeRGB 1998 (Argyll 3D)
91.6% sRGB (Argyll 3D)
68.9% Display P3 (Argyll 3D)
Gamma: 2.12
CCT: 7106 K
| Lenovo ThinkPad X1 Carbon 2020-20UAS04T00 BOE NE140FHM-N61, IPS, 1920x1080, 14" | HP Elitebook x360 1040 G5 AU Optronics AUO533D, IPS, 1920x1080, 14" | Apple MacBook Pro 13 2020 2GHz i5 10th-Gen APPA03D, IPS, 2560x1600, 13.3" | Dell Latitude 7400-8N6DH AU Optronics B140HAN, IPS, 1920x1080, 14" | Lenovo ThinkPad X1 Carbon G7 20R1-000YUS BOE NV140QUM-N53, IPS, 3840x2160, 14" | |
|---|---|---|---|---|---|
| Display | -2% | 27% | 0% | 18% | |
| Display P3 Coverage (%) | 68.9 | 64.3 -7% | 98.8 43% | 66.1 -4% | 83 20% |
| sRGB Coverage (%) | 91.6 | 94.1 3% | 99.9 9% | 95.3 4% | 99.7 9% |
| AdobeRGB 1998 Coverage (%) | 67.1 | 65.5 -2% | 86.4 29% | 67.5 1% | 83.1 24% |
| Response Times | -11% | 11% | -10% | 9% | |
| Response Time Grey 50% / Grey 80% * (ms) | 64.8 ? | 70.8 ? -9% | 46 ? 29% | 62 ? 4% | 49.2 ? 24% |
| Response Time Black / White * (ms) | 30.4 ? | 34.4 ? -13% | 32.4 ? -7% | 37.6 ? -24% | 32.2 ? -6% |
| PWM Frequency (Hz) | 2404 ? | 735 ? | 113600 ? | 201.6 ? | |
| Screen | 12% | 29% | 5% | -13% | |
| Brightness middle (cd/m²) | 422 | 416.3 -1% | 512 21% | 289 -32% | 532 26% |
| Brightness (cd/m²) | 395 | 400 1% | 491 24% | 286 -28% | 513 30% |
| Brightness Distribution (%) | 90 | 89 -1% | 91 1% | 91 1% | 90 0% |
| Black Level * (cd/m²) | 0.27 | 0.29 -7% | 0.32 -19% | 0.16 41% | 0.41 -52% |
| Contrast (:1) | 1563 | 1436 -8% | 1600 2% | 1806 16% | 1298 -17% |
| Colorchecker dE 2000 * | 4.7 | 2.69 43% | 1.7 64% | 4.7 -0% | 6.88 -46% |
| Colorchecker dE 2000 max. * | 10 | 4.95 50% | 3.4 66% | 8.7 13% | 12.65 -27% |
| Colorchecker dE 2000 calibrated * | 2 | 2.13 -7% | 1 50% | 1.3 35% | 2.52 -26% |
| Greyscale dE 2000 * | 6.4 | 2.9 55% | 1.9 70% | 6.4 -0% | 10.5 -64% |
| Gamma | 2.12 104% | 2.4 92% | 2.19 100% | 2.54 87% | 1.98 111% |
| CCT | 7106 91% | 6623 98% | 6817 95% | 5977 109% | 7394 88% |
| Color Space (Percent of AdobeRGB 1998) (%) | 59.5 | 60.1 1% | 77.4 30% | 61.2 3% | 74.1 25% |
| Color Space (Percent of sRGB) (%) | 91.5 | 94.5 3% | 99.9 9% | 95.1 4% | 99.7 9% |
| Total Average (Program / Settings) | -0% /
6% | 22% /
26% | -2% /
2% | 5% /
-4% |
* ... smaller is better
Display Response Times
| ↔ Response Time Black to White | ||
|---|---|---|
| 30.4 ms ... rise ↗ and fall ↘ combined | ↗ 10.8 ms rise | 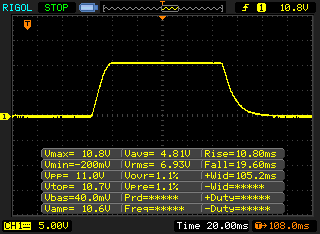 |
| ↘ 19.6 ms fall | ||
| The screen shows slow response rates in our tests and will be unsatisfactory for gamers. In comparison, all tested devices range from 0.1 (minimum) to 240 (maximum) ms. » 82 % of all devices are better. This means that the measured response time is worse than the average of all tested devices (19.8 ms). | ||
| ↔ Response Time 50% Grey to 80% Grey | ||
| 64.8 ms ... rise ↗ and fall ↘ combined | ↗ 30.8 ms rise | 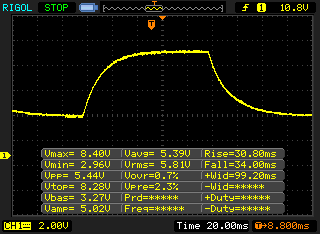 |
| ↘ 34 ms fall | ||
| The screen shows slow response rates in our tests and will be unsatisfactory for gamers. In comparison, all tested devices range from 0.165 (minimum) to 636 (maximum) ms. » 98 % of all devices are better. This means that the measured response time is worse than the average of all tested devices (30.9 ms). | ||
Screen Flickering / PWM (Pulse-Width Modulation)
| Screen flickering / PWM detected | 2404 Hz | ≤ 50 % brightness setting | 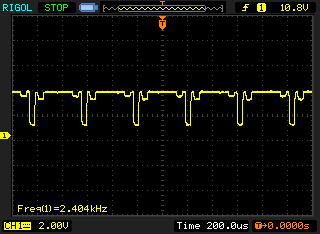 |
The display backlight flickers at 2404 Hz (worst case, e.g., utilizing PWM) Flickering detected at a brightness setting of 50 % and below. There should be no flickering or PWM above this brightness setting. The frequency of 2404 Hz is quite high, so most users sensitive to PWM should not notice any flickering. In comparison: 52 % of all tested devices do not use PWM to dim the display. If PWM was detected, an average of 7741 (minimum: 5 - maximum: 343500) Hz was measured. | |||
Cinebench R15: CPU Single 64Bit | CPU Multi 64Bit
Blender: v2.79 BMW27 CPU
7-Zip 18.03: 7z b 4 -mmt1 | 7z b 4
Geekbench 5.5: Single-Core | Multi-Core
HWBOT x265 Benchmark v2.2: 4k Preset
LibreOffice : 20 Documents To PDF
R Benchmark 2.5: Overall mean
| Cinebench R20 / CPU (Single Core) | |
| Average of class Subnotebook (128 - 832, n=56, last 2 years) | |
| Lenovo ThinkPad X1 Carbon G7 20R1-000YUS | |
| Dell Latitude 7400-8N6DH | |
| Lenovo ThinkPad X1 Carbon 2020-20UAS04T00 | |
| Apple MacBook Pro 13 2020 2GHz i5 10th-Gen | |
| Average Intel Core i7-10510U (362 - 497, n=37) | |
| Cinebench R20 / CPU (Multi Core) | |
| Average of class Subnotebook (579 - 8541, n=56, last 2 years) | |
| Apple MacBook Pro 13 2020 2GHz i5 10th-Gen | |
| Lenovo ThinkPad X1 Carbon G7 20R1-000YUS | |
| Dell Latitude 7400-8N6DH | |
| Lenovo ThinkPad X1 Carbon 2020-20UAS04T00 | |
| Average Intel Core i7-10510U (1015 - 1897, n=38) | |
| Cinebench R15 / CPU Single 64Bit | |
| Average of class Subnotebook (72.4 - 322, n=56, last 2 years) | |
| Lenovo ThinkPad X1 Carbon 2020-20UAS04T00 | |
| Lenovo ThinkPad X1 Carbon G7 20R1-000YUS | |
| Dell Latitude 7400-8N6DH | |
| Average Intel Core i7-10510U (113 - 202, n=42) | |
| HP Elitebook x360 1040 G5 | |
| Apple MacBook Pro 13 2020 2GHz i5 10th-Gen | |
| Cinebench R15 / CPU Multi 64Bit | |
| Average of class Subnotebook (327 - 3345, n=56, last 2 years) | |
| Lenovo ThinkPad X1 Carbon G7 20R1-000YUS | |
| Apple MacBook Pro 13 2020 2GHz i5 10th-Gen | |
| Lenovo ThinkPad X1 Carbon 2020-20UAS04T00 | |
| Dell Latitude 7400-8N6DH | |
| Average Intel Core i7-10510U (482 - 856, n=45) | |
| HP Elitebook x360 1040 G5 | |
| Blender / v2.79 BMW27 CPU | |
| Average Intel Core i7-10510U (628 - 1051, n=31) | |
| Dell Latitude 7400-8N6DH | |
| Lenovo ThinkPad X1 Carbon 2020-20UAS04T00 | |
| Average of class Subnotebook (159 - 2271, n=57, last 2 years) | |
| Apple MacBook Pro 13 2020 2GHz i5 10th-Gen | |
| 7-Zip 18.03 / 7z b 4 -mmt1 | |
| Average of class Subnotebook (2643 - 6699, n=58, last 2 years) | |
| Dell Latitude 7400-8N6DH | |
| Average Intel Core i7-10510U (3747 - 4981, n=31) | |
| Lenovo ThinkPad X1 Carbon 2020-20UAS04T00 | |
| Apple MacBook Pro 13 2020 2GHz i5 10th-Gen | |
| 7-Zip 18.03 / 7z b 4 | |
| Average of class Subnotebook (11668 - 77867, n=56, last 2 years) | |
| Apple MacBook Pro 13 2020 2GHz i5 10th-Gen | |
| Lenovo ThinkPad X1 Carbon 2020-20UAS04T00 | |
| Dell Latitude 7400-8N6DH | |
| Average Intel Core i7-10510U (12196 - 21298, n=31) | |
| Geekbench 5.5 / Single-Core | |
| Average of class Subnotebook (726 - 2224, n=49, last 2 years) | |
| Apple MacBook Pro 13 2020 2GHz i5 10th-Gen | |
| Lenovo ThinkPad X1 Carbon 2020-20UAS04T00 | |
| Average Intel Core i7-10510U (977 - 1287, n=31) | |
| Geekbench 5.5 / Multi-Core | |
| Average of class Subnotebook (2557 - 17218, n=49, last 2 years) | |
| Apple MacBook Pro 13 2020 2GHz i5 10th-Gen | |
| Lenovo ThinkPad X1 Carbon 2020-20UAS04T00 | |
| Average Intel Core i7-10510U (2474 - 4484, n=31) | |
| HWBOT x265 Benchmark v2.2 / 4k Preset | |
| Average of class Subnotebook (0.97 - 25.1, n=56, last 2 years) | |
| Apple MacBook Pro 13 2020 2GHz i5 10th-Gen | |
| Lenovo ThinkPad X1 Carbon 2020-20UAS04T00 | |
| Average Intel Core i7-10510U (3.41 - 6.04, n=31) | |
| Dell Latitude 7400-8N6DH | |
| LibreOffice / 20 Documents To PDF | |
| Apple MacBook Pro 13 2020 2GHz i5 10th-Gen | |
| Average Intel Core i7-10510U (50.7 - 77.8, n=27) | |
| Average of class Subnotebook (39.9 - 220, n=55, last 2 years) | |
| Lenovo ThinkPad X1 Carbon 2020-20UAS04T00 | |
| R Benchmark 2.5 / Overall mean | |
| Apple MacBook Pro 13 2020 2GHz i5 10th-Gen | |
| Average Intel Core i7-10510U (0.637 - 0.81, n=28) | |
| Lenovo ThinkPad X1 Carbon 2020-20UAS04T00 | |
| Average of class Subnotebook (0.4024 - 1.456, n=57, last 2 years) | |
* ... smaller is better
| PCMark 8 | |
| Home Score Accelerated v2 | |
| Lenovo ThinkPad X1 Carbon 2020-20UAS04T00 | |
| Apple MacBook Pro 13 2020 2GHz i5 10th-Gen | |
| Average Intel Core i7-10510U, Intel UHD Graphics 620 (3157 - 4251, n=13) | |
| Dell Latitude 7400-8N6DH | |
| HP Elitebook x360 1040 G5 | |
| Lenovo ThinkPad X1 Carbon G7 20R1-000YUS | |
| Average of class Subnotebook (1739 - 1828, n=2, last 2 years) | |
| Work Score Accelerated v2 | |
| Lenovo ThinkPad X1 Carbon 2020-20UAS04T00 | |
| Dell Latitude 7400-8N6DH | |
| Average Intel Core i7-10510U, Intel UHD Graphics 620 (3734 - 5366, n=13) | |
| HP Elitebook x360 1040 G5 | |
| Lenovo ThinkPad X1 Carbon G7 20R1-000YUS | |
| Apple MacBook Pro 13 2020 2GHz i5 10th-Gen | |
| Average of class Subnotebook (1609 - 1656, n=2, last 2 years) | |
| PCMark 8 Home Score Accelerated v2 | 4251 points | |
| PCMark 8 Creative Score Accelerated v2 | 5447 points | |
| PCMark 8 Work Score Accelerated v2 | 5296 points | |
| PCMark 10 Score | 4527 points | |
Help | ||
| DPC Latencies / LatencyMon - interrupt to process latency (max), Web, Youtube, Prime95 | |
| Lenovo ThinkPad X1 Carbon 2020-20UAS04T00 | |
* ... smaller is better
| Lenovo ThinkPad X1 Carbon 2020-20UAS04T00 Samsung SSD PM981a MZVLB512HBJQ | HP Elitebook x360 1040 G5 Samsung SSD PM981 MZVLB512HAJQ | Apple MacBook Pro 13 2020 2GHz i5 10th-Gen Apple SSD SM0512F | Dell Latitude 7400-8N6DH Samsung SSD PM981 MZVLB512HAJQ | Lenovo ThinkPad X1 Carbon G7 20R1-000YUS WDC PC SN730 SDBPNTY-512G | Average Samsung SSD PM981a MZVLB512HBJQ | |
|---|---|---|---|---|---|---|
| CrystalDiskMark 5.2 / 6 | -8% | -39% | -12% | -1% | 2% | |
| Write 4K (MB/s) | 185 | 122.7 -34% | 28.16 -85% | 118.6 -36% | 151.5 -18% | 140.8 ? -24% |
| Read 4K (MB/s) | 50.6 | 46.57 -8% | 17.5 -65% | 44.68 -12% | 45.83 -9% | 48.6 ? -4% |
| Write Seq (MB/s) | 1543 | 1725 12% | 1195 -23% | 1866 21% | 2060 34% | 2106 ? 36% |
| Read Seq (MB/s) | 1509 | 2392 59% | 1470 -3% | 2173 44% | 1973 31% | 2099 ? 39% |
| Write 4K Q32T1 (MB/s) | 488.8 | 470.6 -4% | 205 -58% | 330.9 -32% | 489.8 0% | 451 ? -8% |
| Read 4K Q32T1 (MB/s) | 579 | 313.2 -46% | 692 20% | 343.1 -41% | 386.2 -33% | 482 ? -17% |
| Write Seq Q32T1 (MB/s) | 2986 | 1869 -37% | 1475 -51% | 1927 -35% | 2703 -9% | 2903 ? -3% |
| Read Seq Q32T1 (MB/s) | 3555 | 3380 -5% | 1920 -46% | 3528 -1% | 3376 -5% | 3511 ? -1% |
| AS SSD | -24% | -127% | -31% | -49% | -21% | |
| Seq Read (MB/s) | 2659 | 1816 -32% | 1300 -51% | 2381 -10% | 1786 -33% | 2412 ? -9% |
| Seq Write (MB/s) | 2551 | 1270 -50% | 1518 -40% | 1290 -49% | 1259 -51% | 1983 ? -22% |
| 4K Read (MB/s) | 56.4 | 46.25 -18% | 14.09 -75% | 52 -8% | 45.86 -19% | 53.1 ? -6% |
| 4K Write (MB/s) | 158 | 104.1 -34% | 24.25 -85% | 134.8 -15% | 147.9 -6% | 131.1 ? -17% |
| 4K-64 Read (MB/s) | 1317 | 1342 2% | 725 -45% | 530 -60% | 885 -33% | 1201 ? -9% |
| 4K-64 Write (MB/s) | 1786 | 1209 -32% | 169.6 -91% | 1177 -34% | 950 -47% | 1726 ? -3% |
| Access Time Read * (ms) | 0.047 | 0.043 9% | 0.172 -266% | 0.05 -6% | 0.058 -23% | 0.05525 ? -18% |
| Access Time Write * (ms) | 0.024 | 0.035 -46% | 0.155 -546% | 0.032 -33% | 0.074 -208% | 0.05394 ? -125% |
| Score Read (Points) | 1640 | 1569 -4% | 869 -47% | 820 -50% | 1110 -32% | 1495 ? -9% |
| Score Write (Points) | 2199 | 1440 -35% | 346 -84% | 1441 -34% | 1224 -44% | 2055 ? -7% |
| Score Total (Points) | 4682 | 3790 -19% | 1667 -64% | 2652 -43% | 2885 -38% | 4303 ? -8% |
| Copy ISO MB/s (MB/s) | 2034 | 1719 | 1384 | 1894 ? | ||
| Copy Program MB/s (MB/s) | 450.3 | 499.6 | 525 | 539 ? | ||
| Copy Game MB/s (MB/s) | 1024 | 1091 | 1008 | 1193 ? | ||
| Total Average (Program / Settings) | -16% /
-17% | -83% /
-90% | -22% /
-23% | -25% /
-29% | -10% /
-11% |
* ... smaller is better

Dauerleistung Lesen: DiskSpd Read Loop, Queue Depth 8
| 3DMark 11 - 1280x720 Performance GPU | |
| Average of class Subnotebook (995 - 18489, n=54, last 2 years) | |
| Apple MacBook Pro 13 2020 2GHz i5 10th-Gen | |
| Lenovo ThinkPad X1 Carbon 2020-20UAS04T00 | |
| Lenovo ThinkPad X1 Carbon G7 20R1-000YUS | |
| HP Elitebook x360 1040 G5 | |
| Dell Latitude 7400-8N6DH | |
| Average Intel UHD Graphics 620 (1144 - 3432, n=244) | |
| 3DMark | |
| 1280x720 Cloud Gate Standard Graphics | |
| Average of class Subnotebook (5577 - 61591, n=28, last 2 years) | |
| Apple MacBook Pro 13 2020 2GHz i5 10th-Gen | |
| HP Elitebook x360 1040 G5 | |
| Lenovo ThinkPad X1 Carbon 2020-20UAS04T00 | |
| Lenovo ThinkPad X1 Carbon G7 20R1-000YUS | |
| Dell Latitude 7400-8N6DH | |
| Average Intel UHD Graphics 620 (6205 - 16400, n=225) | |
| 1920x1080 Fire Strike Graphics | |
| Average of class Subnotebook (832 - 32931, n=56, last 2 years) | |
| Apple MacBook Pro 13 2020 2GHz i5 10th-Gen | |
| Lenovo ThinkPad X1 Carbon 2020-20UAS04T00 | |
| Lenovo ThinkPad X1 Carbon G7 20R1-000YUS | |
| Dell Latitude 7400-8N6DH | |
| Average Intel UHD Graphics 620 (557 - 2608, n=213) | |
| 2560x1440 Time Spy Graphics | |
| Average of class Subnotebook (804 - 14477, n=55, last 2 years) | |
| Apple MacBook Pro 13 2020 2GHz i5 10th-Gen | |
| Lenovo ThinkPad X1 Carbon 2020-20UAS04T00 | |
| Lenovo ThinkPad X1 Carbon G7 20R1-000YUS | |
| Dell Latitude 7400-8N6DH | |
| Average Intel UHD Graphics 620 (299 - 797, n=88) | |
| 3DMark 11 Performance | 2240 points | |
| 3DMark Ice Storm Standard Score | 71820 points | |
| 3DMark Cloud Gate Standard Score | 9816 points | |
| 3DMark Fire Strike Score | 1239 points | |
| 3DMark Time Spy Score | 497 points | |
Help | ||
| low | med. | high | ultra | 4K | |
|---|---|---|---|---|---|
| The Witcher 3 (2015) | 18.2 | 12.1 | |||
| Dota 2 Reborn (2015) | 85.8 | 49.6 | 23 | 20.2 | 7.3 |
| X-Plane 11.11 (2018) | 13.9 | 10.3 | 10.9 | 6.59 | |
| Far Cry 5 (2018) | 16 | ||||
| F1 2019 (2019) | 30 | 12 |
Noise level
| Idle |
| 29.5 / 29.5 / 29.5 dB(A) |
| Load |
| 31.6 / 33.9 dB(A) |
 | ||
30 dB silent 40 dB(A) audible 50 dB(A) loud |
||
min: | ||
| Lenovo ThinkPad X1 Carbon 2020-20UAS04T00 UHD Graphics 620, i7-10510U, Samsung SSD PM981a MZVLB512HBJQ | HP Elitebook x360 1040 G5 UHD Graphics 620, i7-8650U, Samsung SSD PM981 MZVLB512HAJQ | Apple MacBook Pro 13 2020 2GHz i5 10th-Gen Iris Plus Graphics G7 (Ice Lake 64 EU), i5-1038NG7, Apple SSD SM0512F | Dell Latitude 7400-8N6DH UHD Graphics 620, i7-8665U, Samsung SSD PM981 MZVLB512HAJQ | Lenovo ThinkPad X1 Carbon G7 20R1-000YUS UHD Graphics 620, i7-10510U, WDC PC SN730 SDBPNTY-512G | Lenovo ThinkPad X1 Carbon 2019-20QE000VGE UHD Graphics 620, i7-8665U, WDC PC SN720 SDAQNTW-512G | |
|---|---|---|---|---|---|---|
| Noise | 1% | -6% | 0% | -2% | 3% | |
| off / environment * (dB) | 29.5 | 28.3 4% | 29.6 -0% | 28.6 3% | 28.2 4% | 28.4 4% |
| Idle Minimum * (dB) | 29.5 | 28.3 4% | 29.6 -0% | 28.6 3% | 28.2 4% | 28.4 4% |
| Idle Average * (dB) | 29.5 | 28.3 4% | 29.6 -0% | 28.6 3% | 28.2 4% | 28.4 4% |
| Idle Maximum * (dB) | 29.5 | 28.3 4% | 29.6 -0% | 29.1 1% | 29.4 -0% | 28.6 3% |
| Load Average * (dB) | 31.6 | 32.6 -3% | 34.4 -9% | 31.5 -0% | 31.5 -0% | 31.5 -0% |
| Load Maximum * (dB) | 33.9 | 36.6 -8% | 42.1 -24% | 36.9 -9% | 41.2 -22% | 33.1 2% |
| Witcher 3 ultra * (dB) | 36.1 |
* ... smaller is better
(-) The maximum temperature on the upper side is 45.2 °C / 113 F, compared to the average of 35.9 °C / 97 F, ranging from 21.4 to 59 °C for the class Subnotebook.
(-) The bottom heats up to a maximum of 45.7 °C / 114 F, compared to the average of 39.2 °C / 103 F
(+) In idle usage, the average temperature for the upper side is 24.1 °C / 75 F, compared to the device average of 30.8 °C / 87 F.
(+) The palmrests and touchpad are cooler than skin temperature with a maximum of 28.8 °C / 83.8 F and are therefore cool to the touch.
(±) The average temperature of the palmrest area of similar devices was 28.2 °C / 82.8 F (-0.6 °C / -1 F).
| Off / Standby | |
| Idle | |
| Load |
|
Key:
min: | |
| Lenovo ThinkPad X1 Carbon 2020-20UAS04T00 i7-10510U, UHD Graphics 620, Samsung SSD PM981a MZVLB512HBJQ, IPS, 1920x1080, 14" | HP Elitebook x360 1040 G5 i7-8650U, UHD Graphics 620, Samsung SSD PM981 MZVLB512HAJQ, IPS, 1920x1080, 14" | Apple MacBook Pro 13 2020 2GHz i5 10th-Gen i5-1038NG7, Iris Plus Graphics G7 (Ice Lake 64 EU), Apple SSD SM0512F, IPS, 2560x1600, 13.3" | Dell Latitude 7400-8N6DH i7-8665U, UHD Graphics 620, Samsung SSD PM981 MZVLB512HAJQ, IPS, 1920x1080, 14" | Lenovo ThinkPad X1 Carbon G7 20R1-000YUS i7-10510U, UHD Graphics 620, WDC PC SN730 SDBPNTY-512G, IPS, 3840x2160, 14" | Average Intel UHD Graphics 620 | Average of class Subnotebook | |
|---|---|---|---|---|---|---|---|
| Power Consumption | 1% | -22% | -6% | -31% | 0% | -5% | |
| Idle Minimum * (Watt) | 2.96 | 2.7 9% | 3.8 -28% | 3.9 -32% | 3.5 -18% | 3.81 ? -29% | 3.73 ? -26% |
| Idle Average * (Watt) | 5.9 | 6.5 -10% | 8.6 -46% | 6.1 -3% | 10.8 -83% | 6.94 ? -18% | 6.57 ? -11% |
| Idle Maximum * (Watt) | 9.1 | 11.5 -26% | 10.3 -13% | 8.2 10% | 12.5 -37% | 8.75 ? 4% | 7.93 ? 13% |
| Load Average * (Watt) | 42.1 | 38.7 8% | 52.1 -24% | 41 3% | 47.2 -12% | 35 ? 17% | 42.1 ? -0% |
| Load Maximum * (Watt) | 65.1 | 50.5 22% | 65.2 -0% | 69.7 -7% | 68.8 -6% | 47.5 ? 27% | 65.1 ? -0% |
| Witcher 3 ultra * (Watt) | 48.2 |
* ... smaller is better
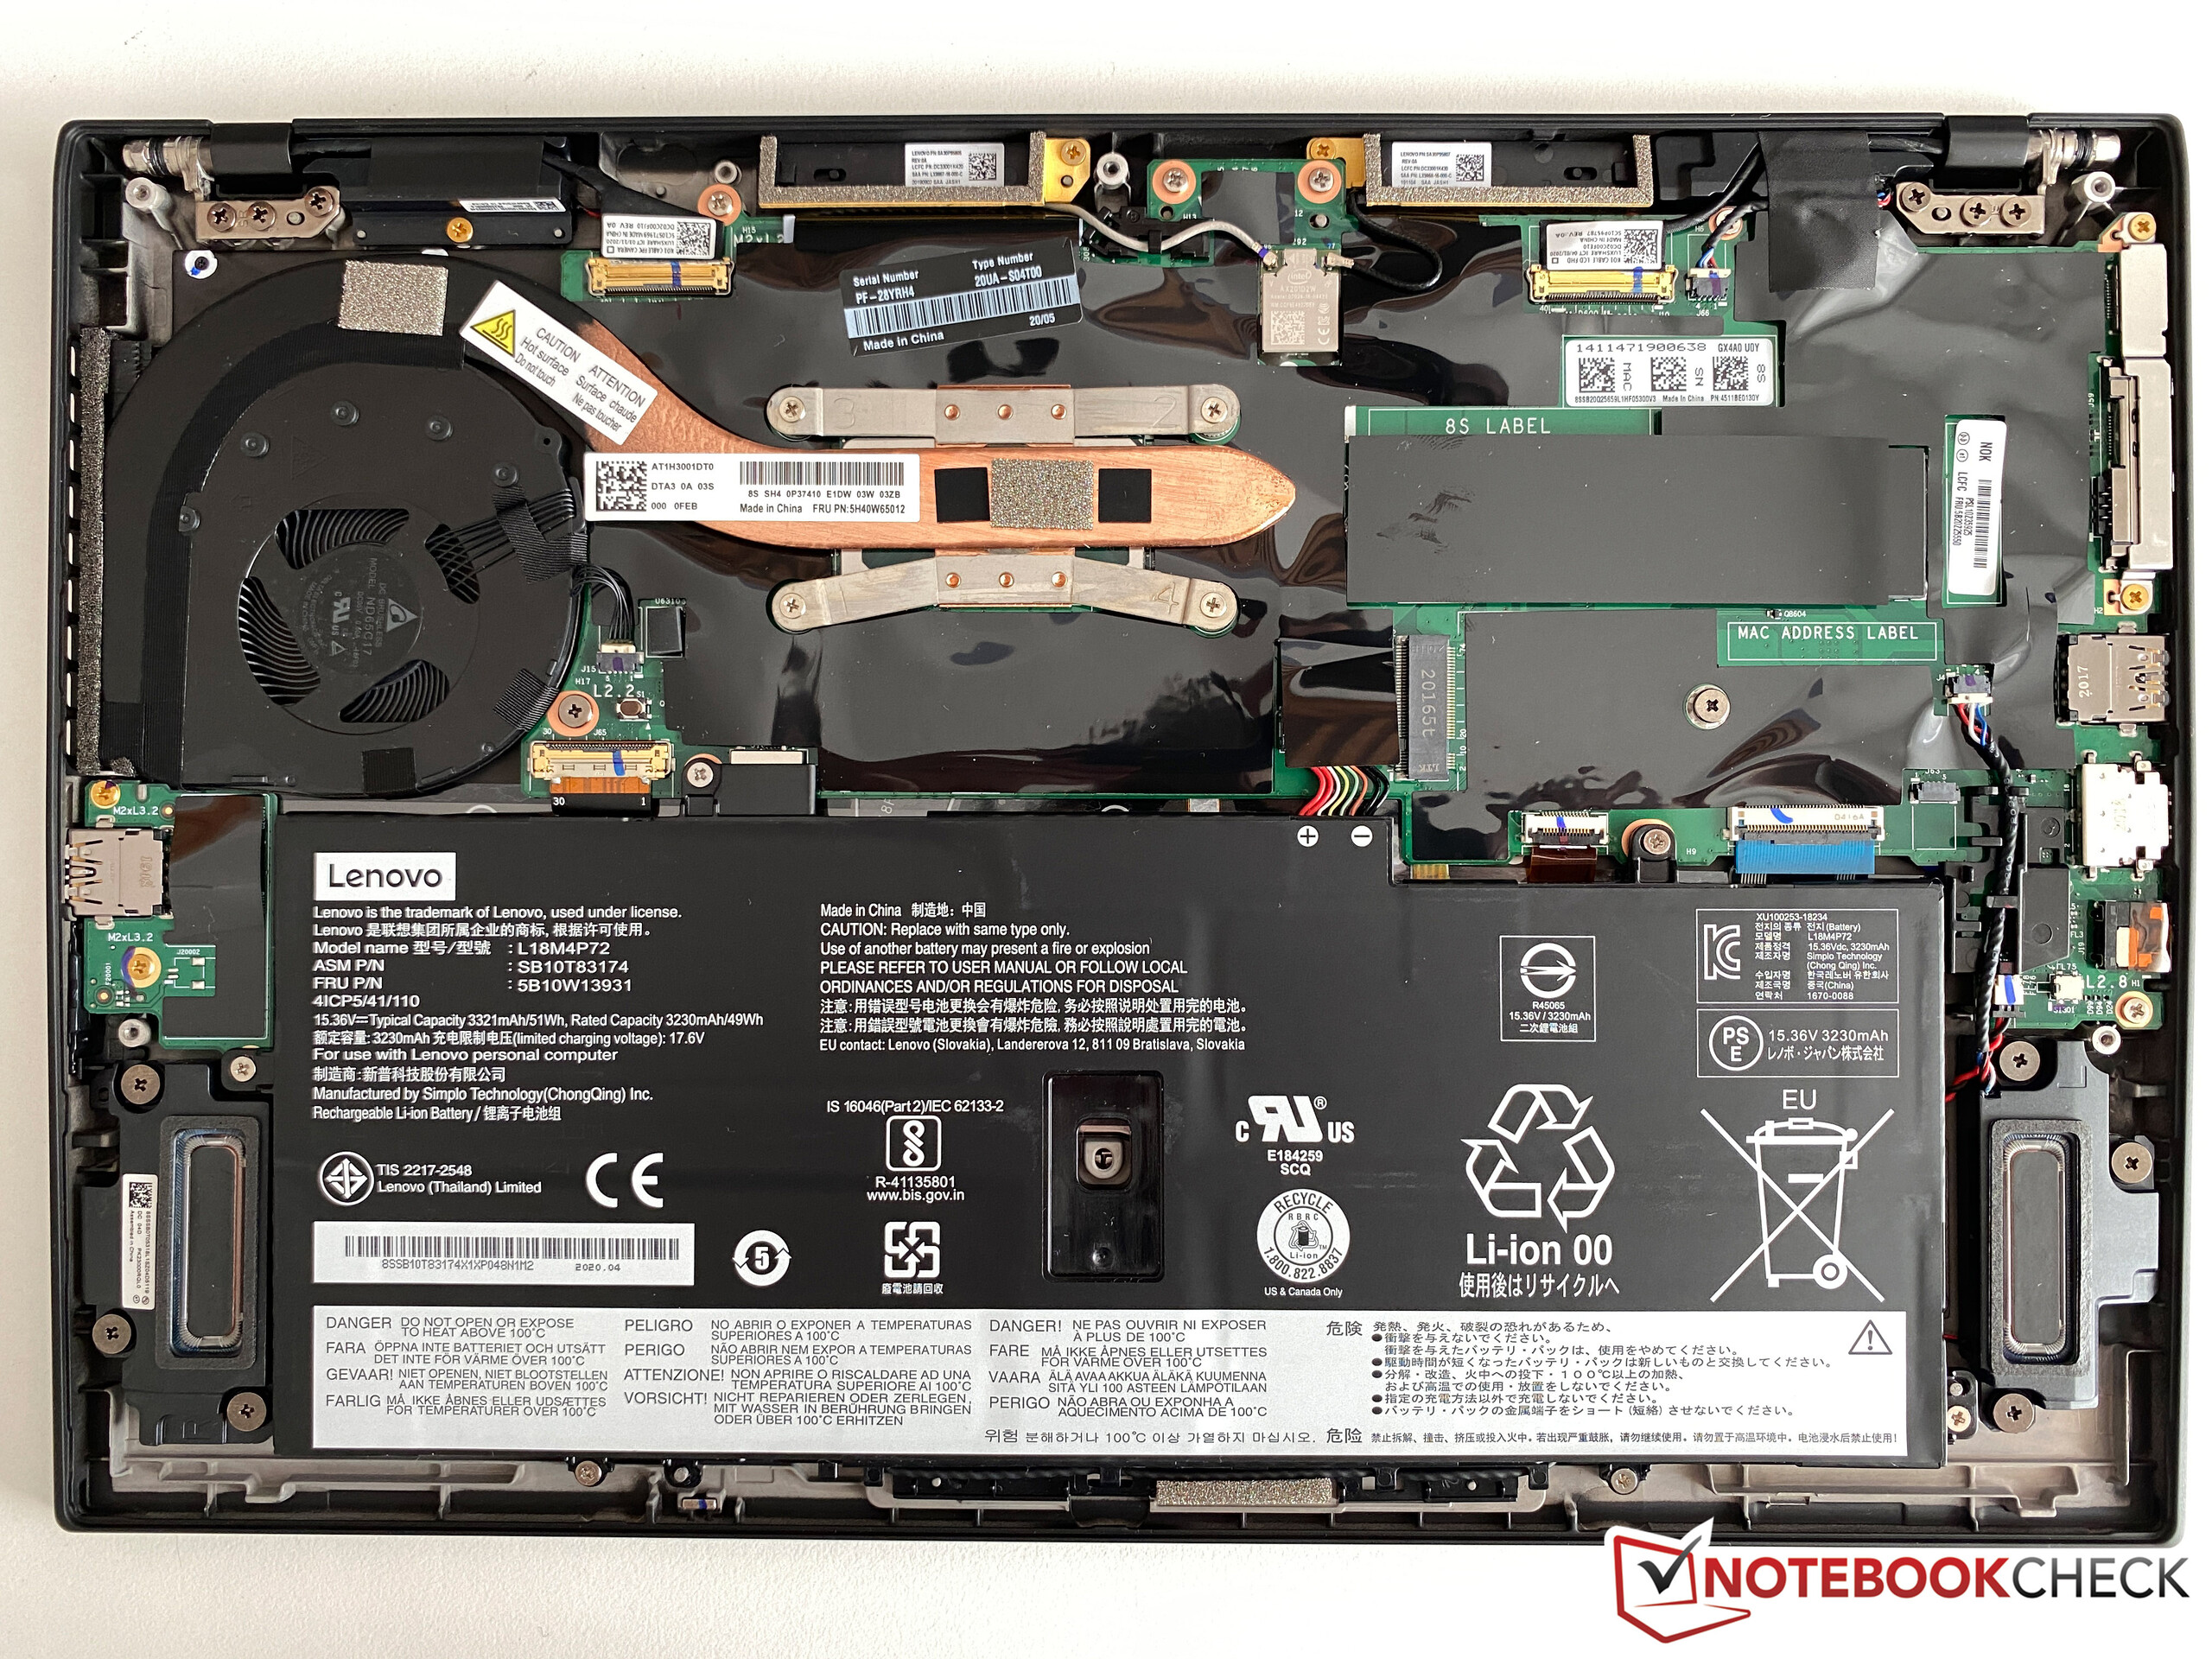
| Lenovo ThinkPad X1 Carbon 2020-20UAS04T00 i7-10510U, UHD Graphics 620, 51 Wh | HP Elitebook x360 1040 G5 i7-8650U, UHD Graphics 620, 56 Wh | Apple MacBook Pro 13 2020 2GHz i5 10th-Gen i5-1038NG7, Iris Plus Graphics G7 (Ice Lake 64 EU), 58 Wh | Dell Latitude 7400-8N6DH i7-8665U, UHD Graphics 620, 60 Wh | Lenovo ThinkPad X1 Carbon G7 20R1-000YUS i7-10510U, UHD Graphics 620, 51 Wh | Lenovo ThinkPad X1 Carbon 2019-20QES01L00 i7-8565U, UHD Graphics 620, 51 Wh | Average of class Subnotebook | |
|---|---|---|---|---|---|---|---|
| Battery runtime | 49% | 5% | 26% | -1% | -12% | 28% | |
| H.264 (h) | 12.8 | 11.5 -10% | 14.4 13% | 11.5 -10% | 15.3 ? 20% | ||
| WiFi v1.3 (h) | 10.1 | 10.4 3% | 12.1 20% | 11.6 15% | 10 -1% | 9.4 -7% | 13.9 ? 38% |
| Load (h) | 1.6 | 3.1 94% | 2.4 50% | 1.3 -19% | 2.04 ? 27% | ||
| Reader / Idle (h) | 27.9 | 26.4 ? |
Pros
Cons
总结——没什么实际提升的更新:
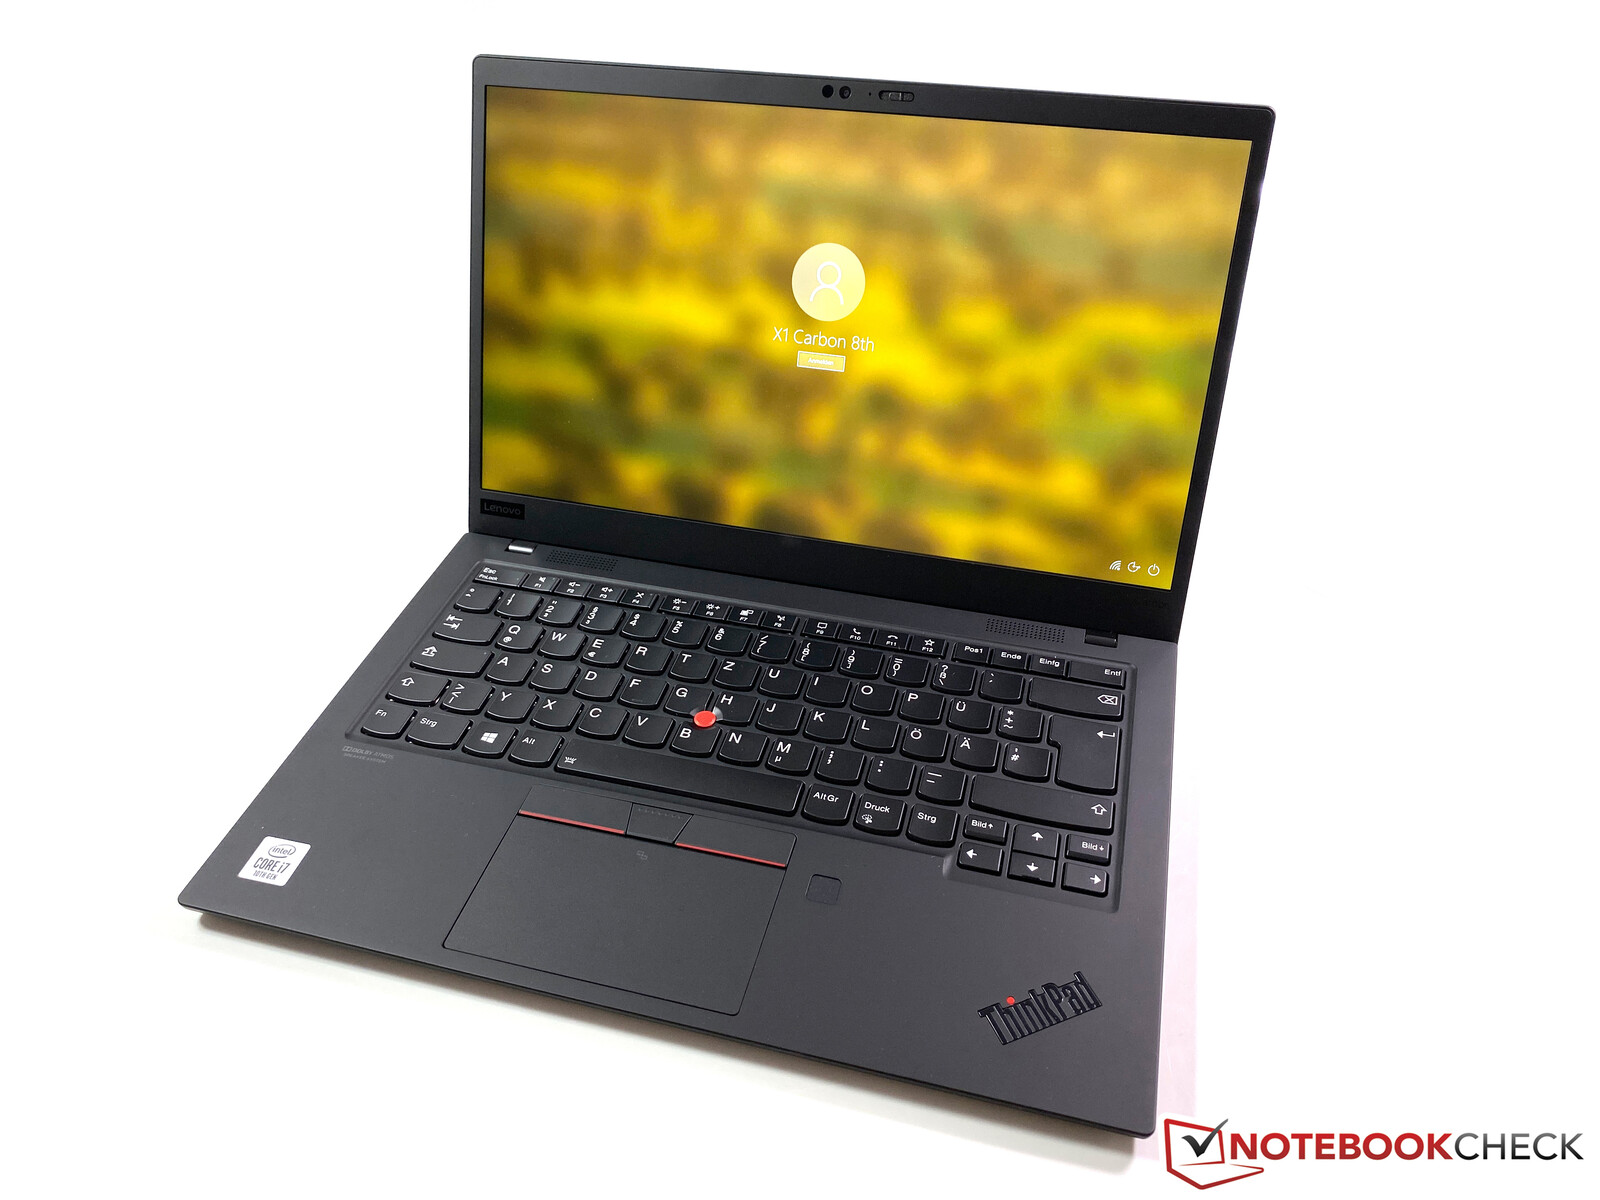
去年ThinkPad X1 Carbon进行了重大更新之后,这次仅获得了次要更新。一些地区已经在2019 G7代中获得Comet Lake处理器;现在,第八代X1 Carbon在每个地区都使用了新的处理器。但是,处理器和图形性能方面的差异基本上是不存在的,因此没有什么真正的升级。唯一的真正优势是新的Wi-Fi 6模块。
即使没有重大升级,ThinkPad X1 Carbon仍然是一款非常出色的商务笔记本电脑,机身轻巧坚固。但是,仍然存在相同的问题,例如LowPower 1080p屏幕的面板抽奖。自去年机身更新以来,键盘的性能也有所下降。总体上来说这是缺点,但是旗舰版ThinkPad不再提供最好的键盘。在这方面,较厚的机器(例如T系列)具有优势。
Lenovo在X1系列上不使用AMD处理器,因此从第8代的升级只是一个较小的更新。它仍然是一台非常好的商务笔记本电脑,但是联想的新型ThinkPad T14(有AMD SoC)可能是最大的竞争对手。
那么值得升级吗?与2019年型号相比,唯一真正的优势是Wi-Fi 6模块以及稍小的电源适配器,但这很难证明需要升级。我们也渴望获得新的ThinkPad T14。它采用了新的机身,应该更接近X1 Carbon,但联想还将出售除Intel SKU之外还配备AMD CPU的机型。如果我们对比带有AMD 4000 CPU的廉价ThinkPad E15的最初结果,则AMD T14应该比X1 Carbon提供更多的性能。
Lenovo ThinkPad X1 Carbon 2020-20UAS04T00
- 07/01/2020 v7 (old)
Andreas Osthoff
Price comparison

