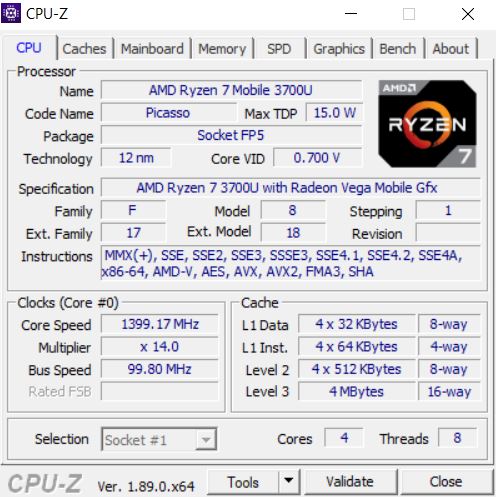
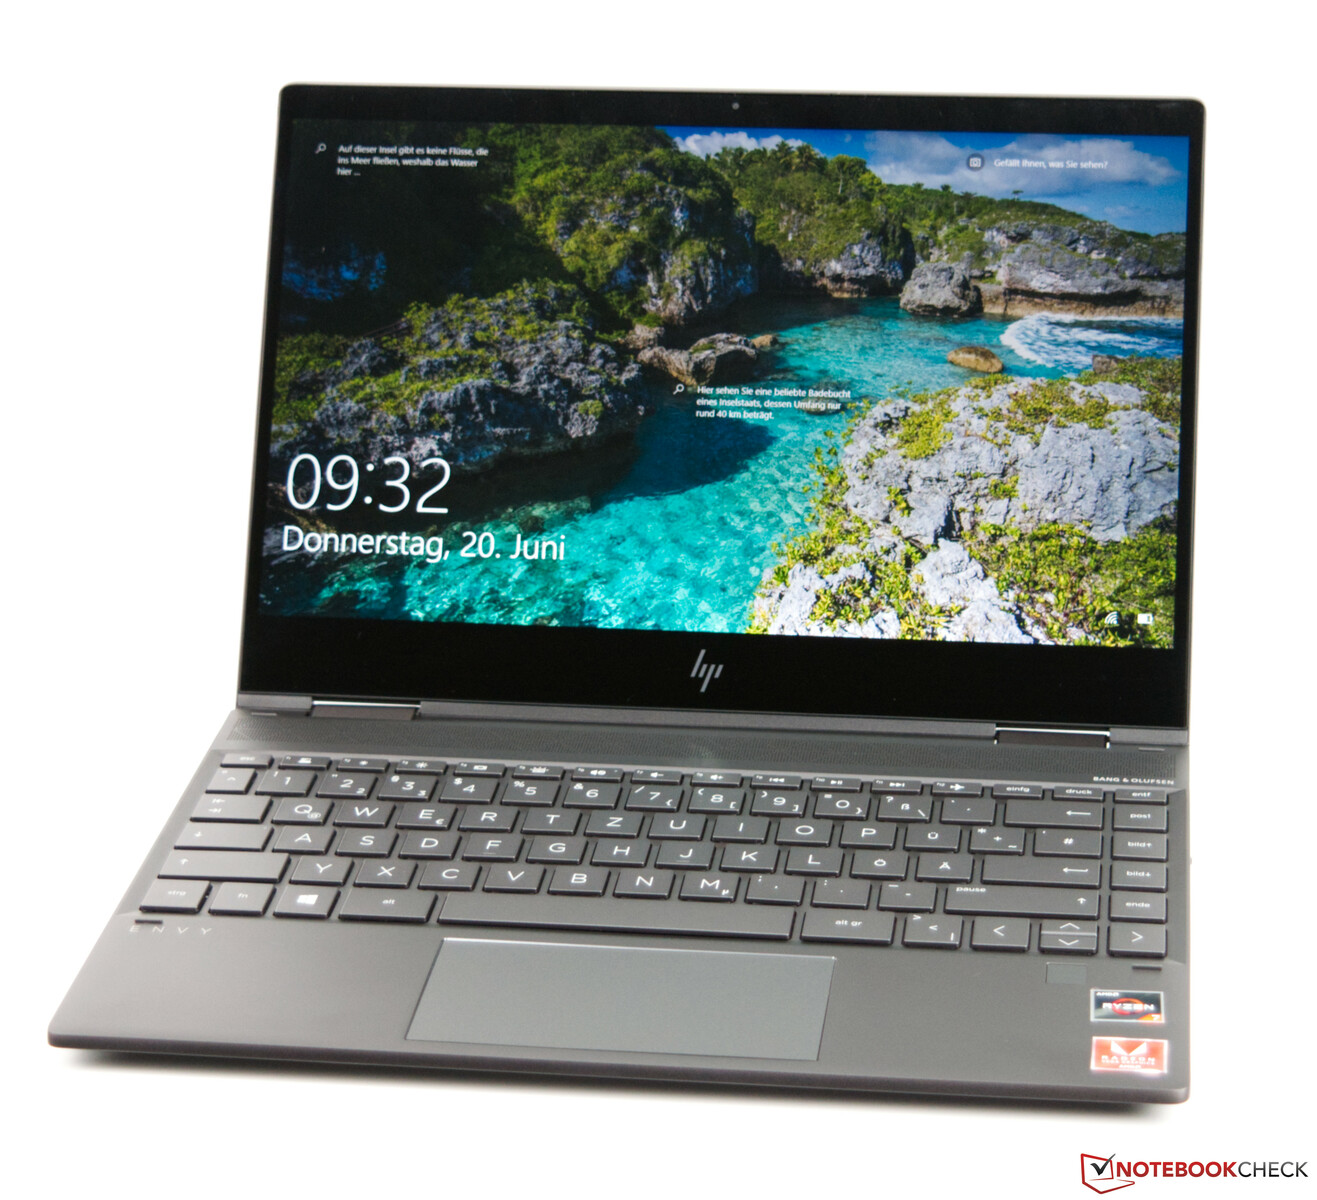
HP Envy x360 13翻转本评测:亮眼的屏幕,AMD的处理器


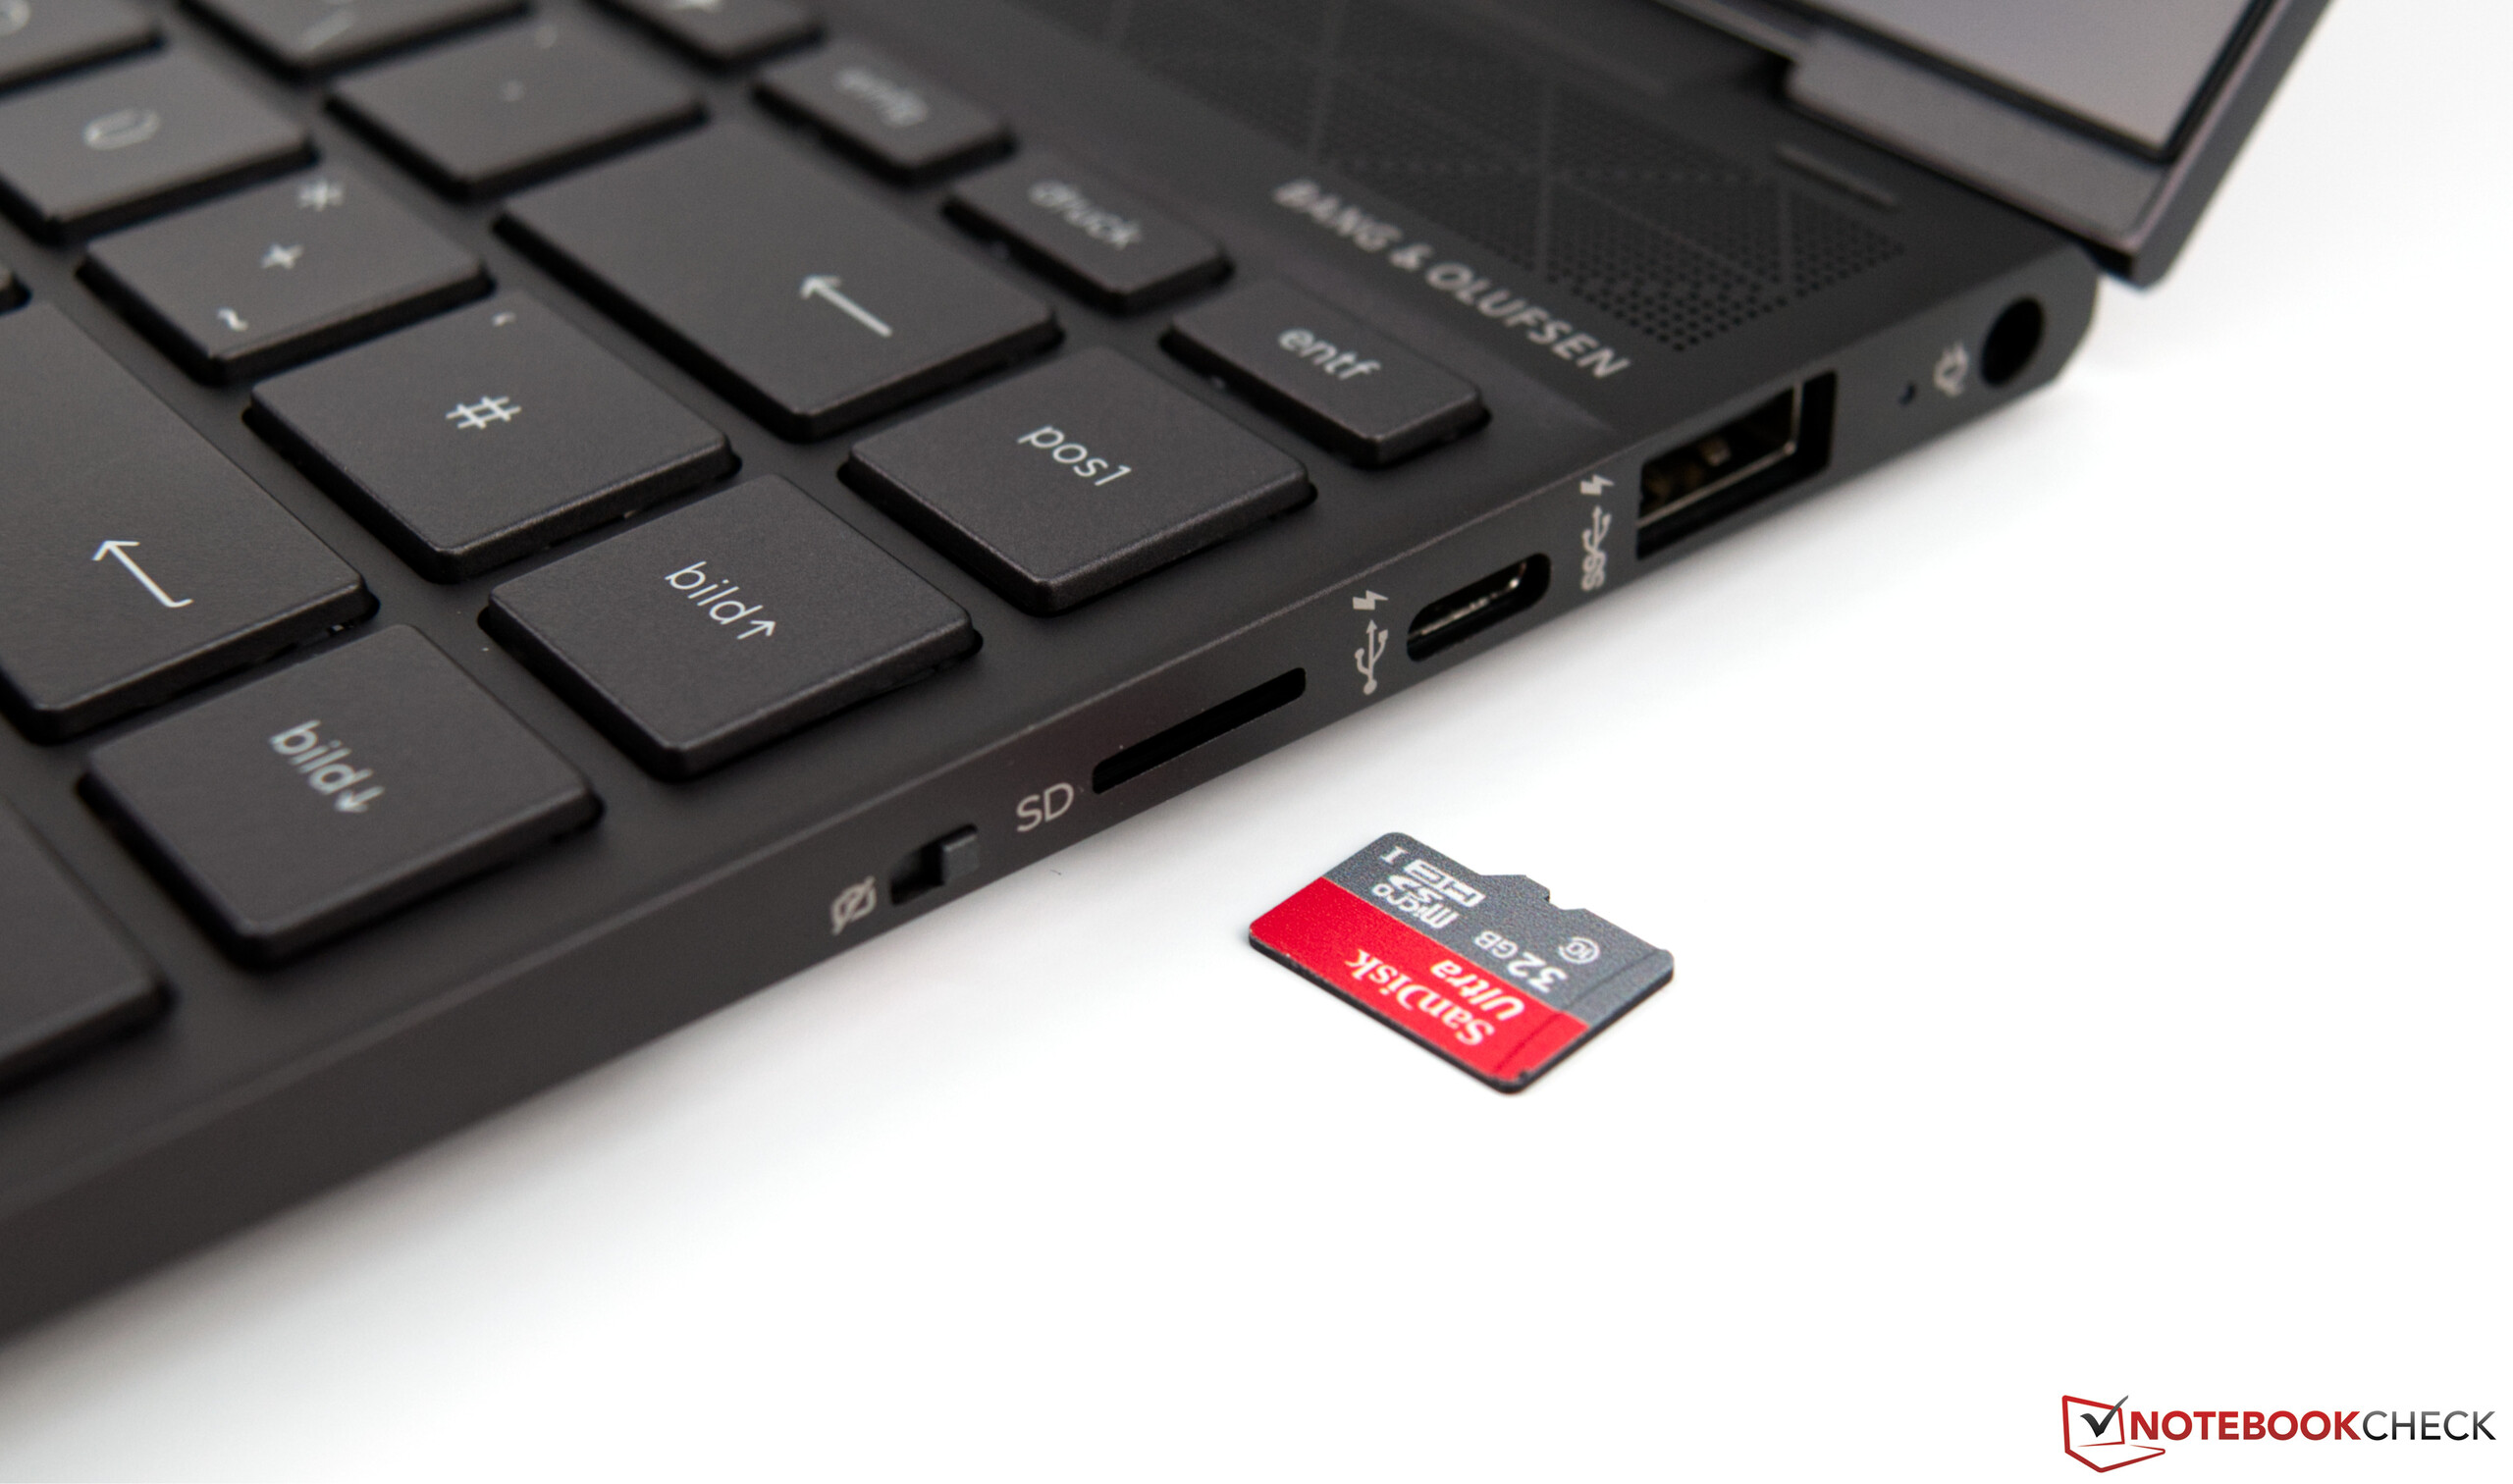
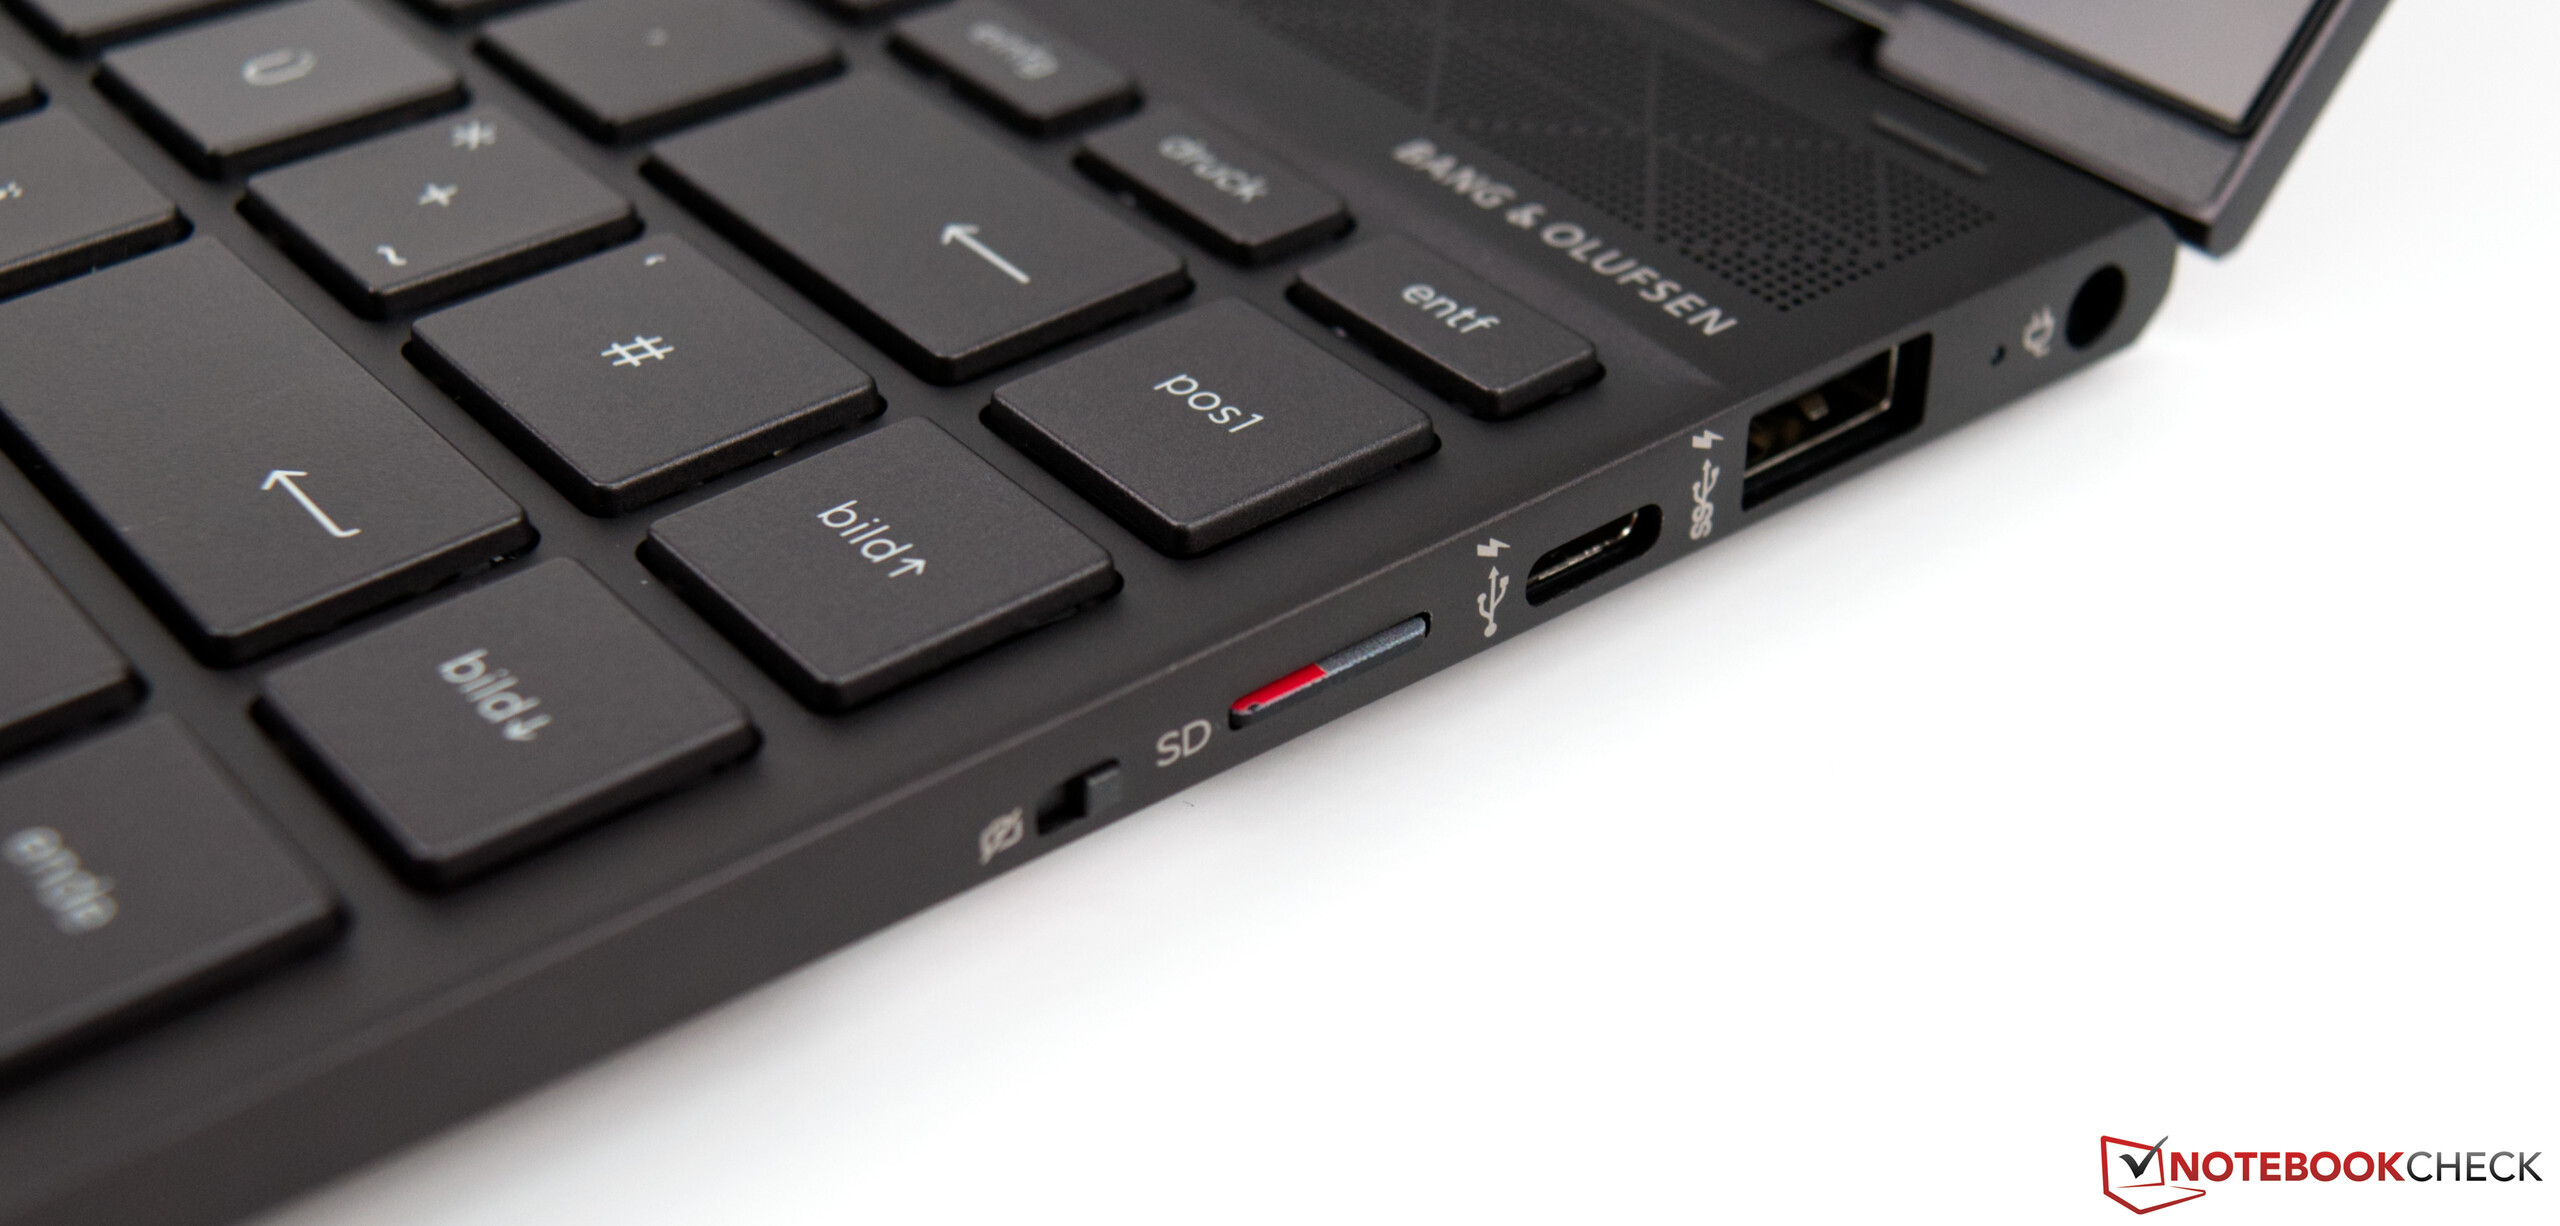
| SD Card Reader | |
| average JPG Copy Test (av. of 3 runs) | |
| Lenovo ThinkPad X390 Yoga-20NQS05R00 (Toshiba Exceria Pro M501) | |
| HP Envy x360 13-ar0601ng (Toshiba Exceria Pro M501 microSDXC 64GB) | |
| Lenovo ThinkPad L390 Yoga-20NT000XGE (Toshiba Exceria Pro M501 UHS-II) | |
| Average of class Convertible (29.4 - 186, n=21, last 2 years) | |
| Dell Latitude 13 3390 (Toshiba Exceria Pro SDXC 64 GB UHS-II) | |
| maximum AS SSD Seq Read Test (1GB) | |
| Average of class Convertible (67.5 - 254, n=20, last 2 years) | |
| HP Envy x360 13-ar0601ng (Toshiba Exceria Pro M501 microSDXC 64GB) | |
| Lenovo ThinkPad X390 Yoga-20NQS05R00 (Toshiba Exceria Pro M501) | |
| Lenovo ThinkPad L390 Yoga-20NT000XGE (Toshiba Exceria Pro M501 UHS-II) | |
| Dell Inspiron 13 7386 (Toshiba Exceria Pro M501 microSDXC 64GB) | |
| Dell Latitude 13 3390 (Toshiba Exceria Pro SDXC 64 GB UHS-II) | |
| Networking | |
| iperf3 transmit AX12 | |
| Lenovo ThinkPad L390 Yoga-20NT000XGE | |
| Lenovo ThinkPad X390 Yoga-20NQS05R00 | |
| Lenovo Yoga C930-13IKB 81C4 | |
| Dell Inspiron 13 7386 | |
| HP Envy x360 13-ar0601ng | |
| Dell Latitude 13 3390 | |
| iperf3 receive AX12 | |
| Lenovo ThinkPad L390 Yoga-20NT000XGE | |
| Lenovo ThinkPad X390 Yoga-20NQS05R00 | |
| Dell Inspiron 13 7386 | |
| Lenovo Yoga C930-13IKB 81C4 | |
| HP Envy x360 13-ar0601ng | |
| Dell Latitude 13 3390 | |
| |||||||||||||||||||||||||
Brightness Distribution: 75 %
Center on Battery: 635 cd/m²
Contrast: 1151:1 (Black: 0.55 cd/m²)
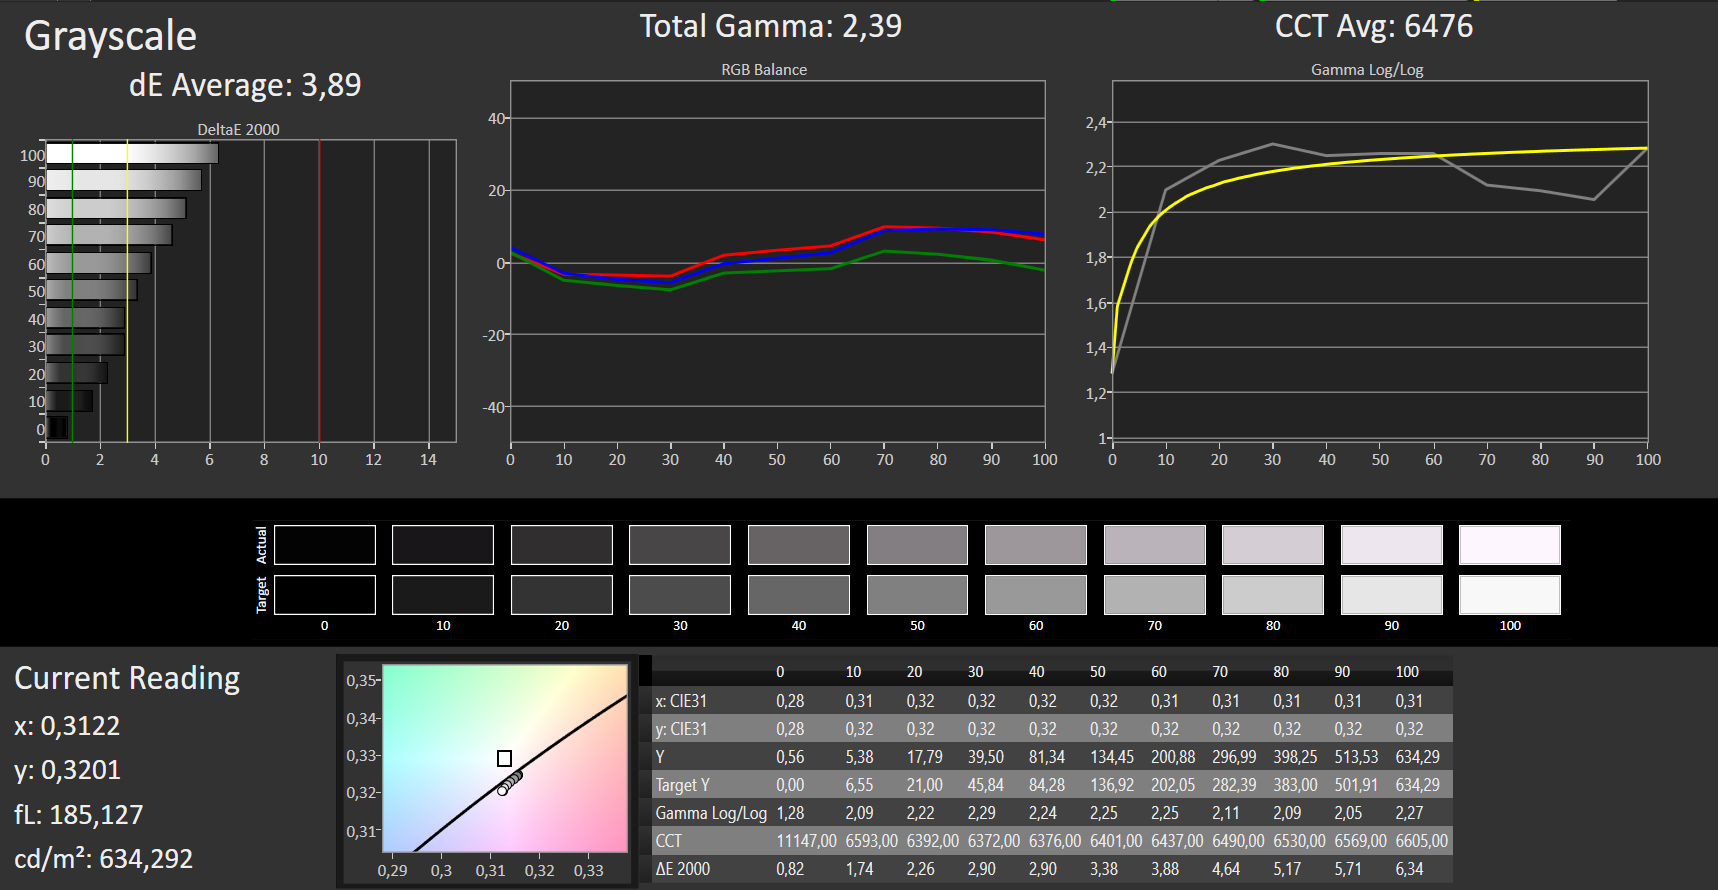
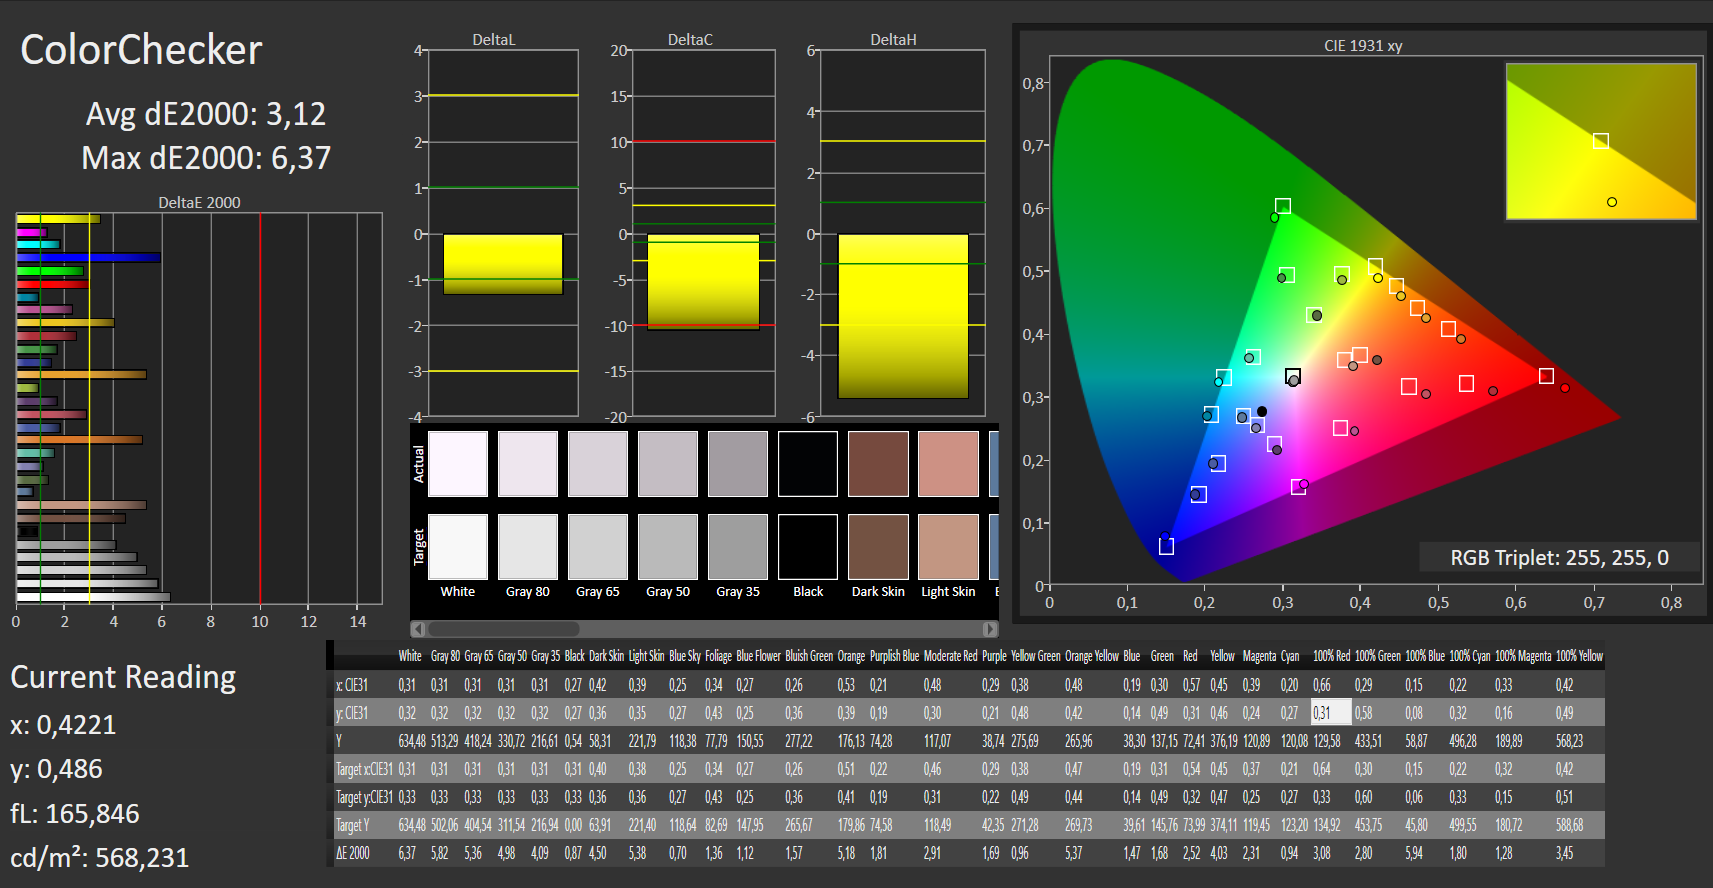
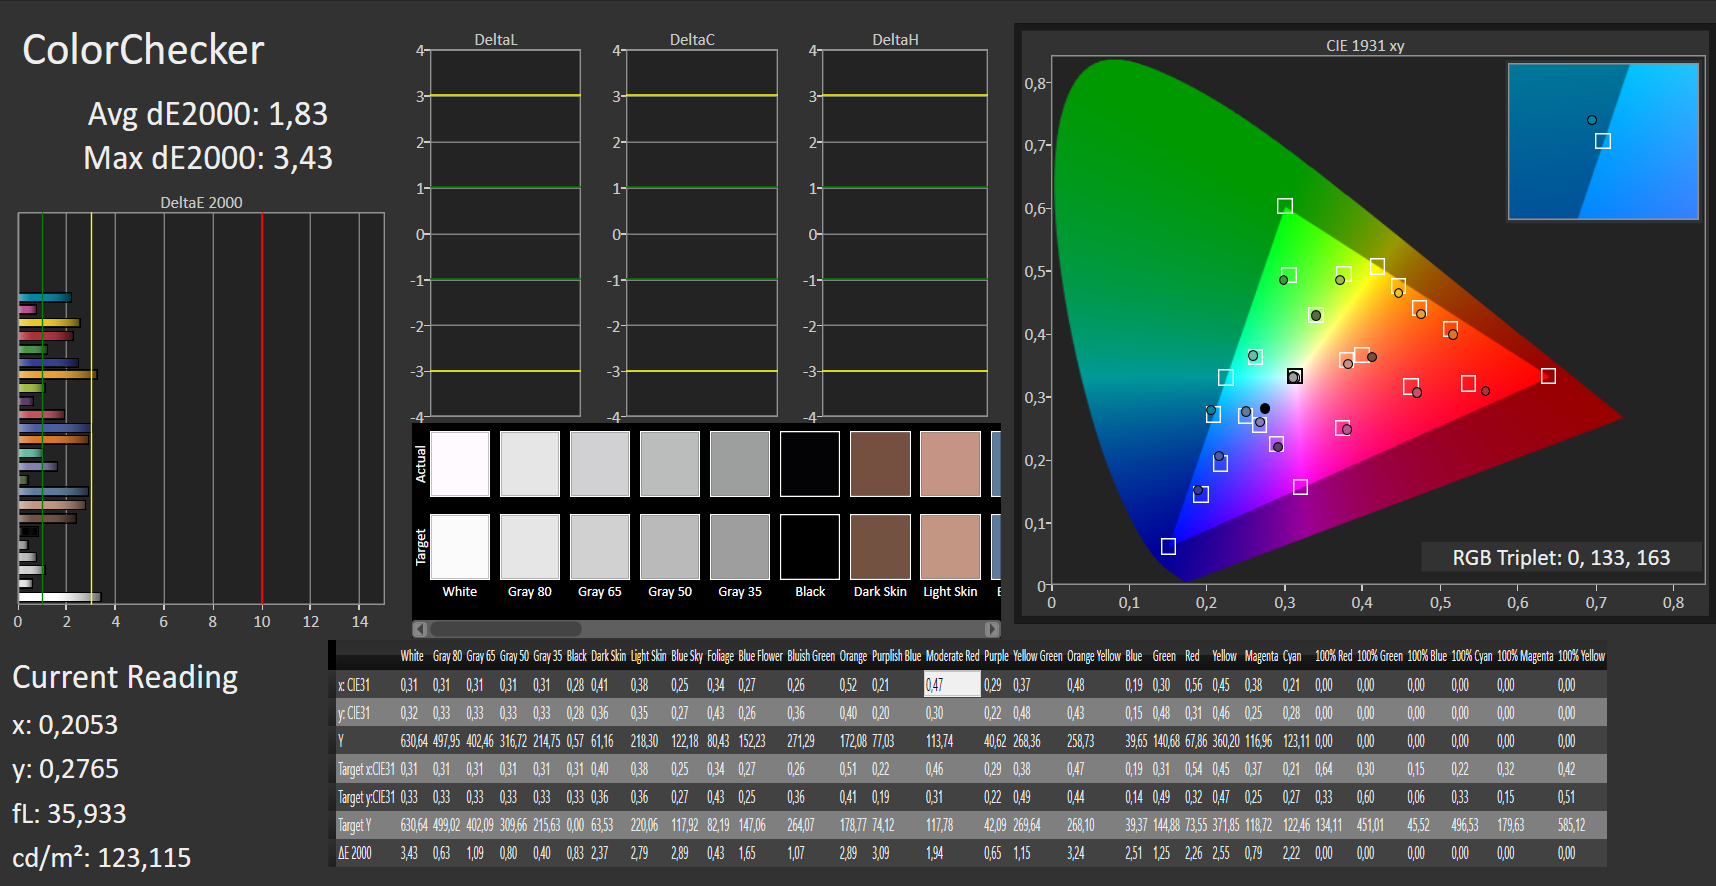
ΔE ColorChecker Calman: 3.12 | ∀{0.5-29.43 Ø4.71}
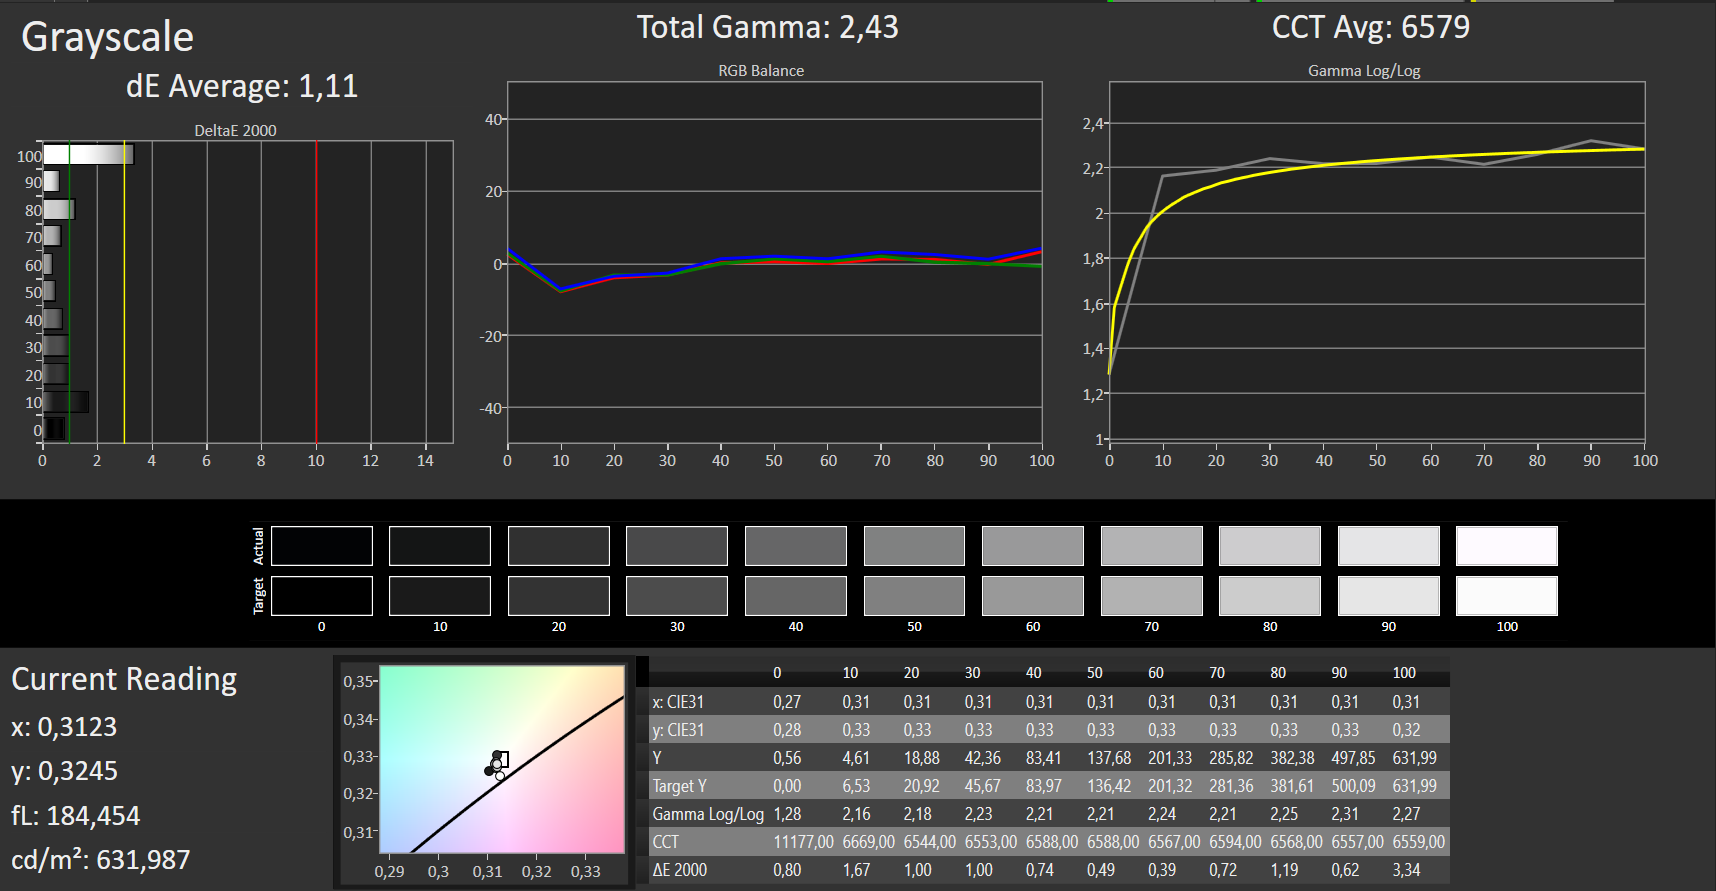
calibrated: 1.83
ΔE Greyscale Calman: 3.89 | ∀{0.09-98 Ø4.96}
91% sRGB (Argyll 1.6.3 3D)
59% AdobeRGB 1998 (Argyll 1.6.3 3D)
63.8% AdobeRGB 1998 (Argyll 3D)
90.8% sRGB (Argyll 3D)
63% Display P3 (Argyll 3D)
Gamma: 2.39
CCT: 6476 K
| HP Envy x360 13-ar0601ng InfoVision, M133NVF3 R2, IPS, 120 Hz, 1920x1080, 13.3" | Lenovo ThinkPad X390 Yoga-20NQS05R00 LP133WF7-SPA1, IPS LED, 1920x1080, 13.3" | Dell Latitude 13 3390 BOE06A7, NV13FHM, IPS, 1920x1080, 13.3" | Lenovo ThinkPad L390 Yoga-20NT000XGE LEN4094, NV133FHM-N5A, IPS LED, 1920x1080, 13.3" | Dell Inspiron 13 7386 Chi Mei CMN1385 / 133DCE / Dell 3GRT6, IPS, 3840x2160, 13.3" | Lenovo Yoga C930-13IKB B139HAN03_0, IPS, 1920x1080, 13.9" | |
|---|---|---|---|---|---|---|
| Display | 5% | -34% | 5% | 9% | 3% | |
| Display P3 Coverage (%) | 63 | 65.2 3% | 40.9 -35% | 69.2 10% | 68.2 8% | 64.3 2% |
| sRGB Coverage (%) | 90.8 | 97 7% | 61.3 -32% | 90.6 0% | 99.8 10% | 94.6 4% |
| AdobeRGB 1998 Coverage (%) | 63.8 | 67.3 5% | 42.29 -34% | 66.3 4% | 70 10% | 66.2 4% |
| Response Times | -55% | -33% | -57% | -50% | -21% | |
| Response Time Grey 50% / Grey 80% * (ms) | 35 ? | 59.2 ? -69% | 42 ? -20% | 51.2 ? -46% | 57 ? -63% | 40.8 ? -17% |
| Response Time Black / White * (ms) | 22 ? | 30.8 ? -40% | 32 ? -45% | 36.8 ? -67% | 30 ? -36% | 27.6 ? -25% |
| PWM Frequency (Hz) | 4065 ? | 208 ? | 1000 ? | 26000 ? | ||
| Screen | -13% | -66% | -28% | -2% | -33% | |
| Brightness middle (cd/m²) | 633 | 319 -50% | 276 -56% | 313 -51% | 318 -50% | 316 -50% |
| Brightness (cd/m²) | 675 | 306 -55% | 274 -59% | 295 -56% | 278 -59% | 291 -57% |
| Brightness Distribution (%) | 75 | 90 20% | 82 9% | 90 20% | 81 8% | 83 11% |
| Black Level * (cd/m²) | 0.55 | 0.15 73% | 0.29 47% | 0.22 60% | 0.18 67% | 0.36 35% |
| Contrast (:1) | 1151 | 2127 85% | 952 -17% | 1423 24% | 1767 54% | 878 -24% |
| Colorchecker dE 2000 * | 3.12 | 6.1 -96% | 5.84 -87% | 6.2 -99% | 2.91 7% | 5.9 -89% |
| Colorchecker dE 2000 max. * | 6.37 | 9.7 -52% | 26.72 -319% | 10.7 -68% | 6.11 4% | 12.9 -103% |
| Colorchecker dE 2000 calibrated * | 1.83 | 1 45% | 5.15 -181% | 2.5 -37% | 2.91 -59% | 1.3 29% |
| Greyscale dE 2000 * | 3.89 | 8.6 -121% | 3.54 9% | 8 -106% | 4.37 -12% | 8.6 -121% |
| Gamma | 2.39 92% | 2.62 84% | 2.43 91% | 2.38 92% | 2.26 97% | 2.1 105% |
| CCT | 6476 100% | 6613 98% | 6747 96% | 7100 92% | 6448 101% | 6854 95% |
| Color Space (Percent of AdobeRGB 1998) (%) | 59 | 61.9 5% | 39 -34% | 59.1 0% | 70 19% | 60.7 3% |
| Color Space (Percent of sRGB) (%) | 91 | 96.8 6% | 61 -33% | 90.6 0% | 93 2% | 94.5 4% |
| Total Average (Program / Settings) | -21% /
-15% | -44% /
-55% | -27% /
-26% | -14% /
-6% | -17% /
-25% |
* ... smaller is better

Display Response Times
| ↔ Response Time Black to White | ||
|---|---|---|
| 22 ms ... rise ↗ and fall ↘ combined | ↗ 12 ms rise | 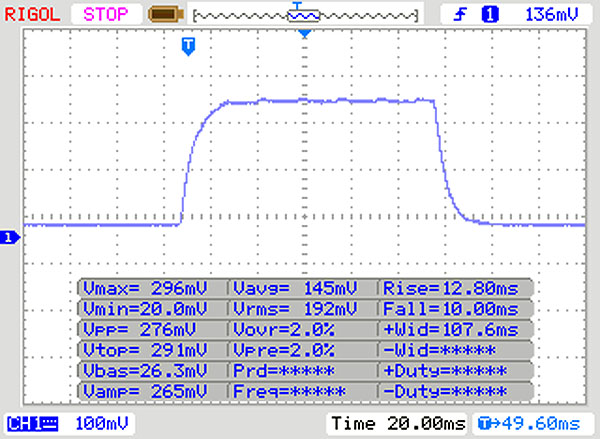 |
| ↘ 10 ms fall | ||
| The screen shows good response rates in our tests, but may be too slow for competitive gamers. In comparison, all tested devices range from 0.1 (minimum) to 240 (maximum) ms. » 49 % of all devices are better. This means that the measured response time is worse than the average of all tested devices (19.8 ms). | ||
| ↔ Response Time 50% Grey to 80% Grey | ||
| 35 ms ... rise ↗ and fall ↘ combined | ↗ 18 ms rise | 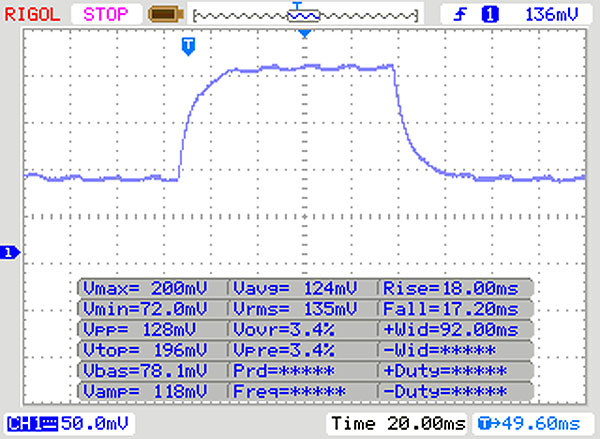 |
| ↘ 17 ms fall | ||
| The screen shows slow response rates in our tests and will be unsatisfactory for gamers. In comparison, all tested devices range from 0.165 (minimum) to 636 (maximum) ms. » 49 % of all devices are better. This means that the measured response time is worse than the average of all tested devices (30.9 ms). | ||
Screen Flickering / PWM (Pulse-Width Modulation)
| Screen flickering / PWM detected | 4065 Hz | ≤ 90 % brightness setting | 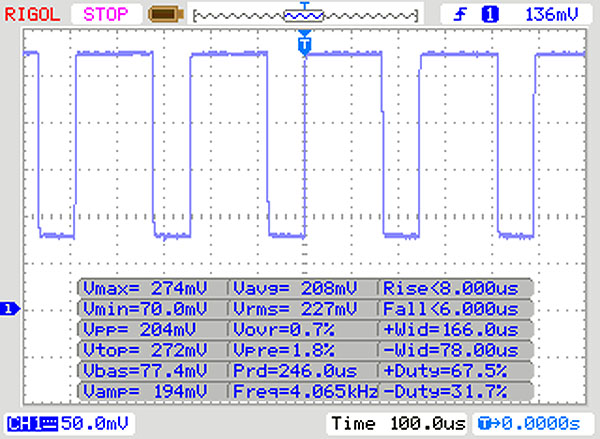 |
The display backlight flickers at 4065 Hz (worst case, e.g., utilizing PWM) Flickering detected at a brightness setting of 90 % and below. There should be no flickering or PWM above this brightness setting. The frequency of 4065 Hz is quite high, so most users sensitive to PWM should not notice any flickering. In comparison: 52 % of all tested devices do not use PWM to dim the display. If PWM was detected, an average of 7741 (minimum: 5 - maximum: 343500) Hz was measured. | |||
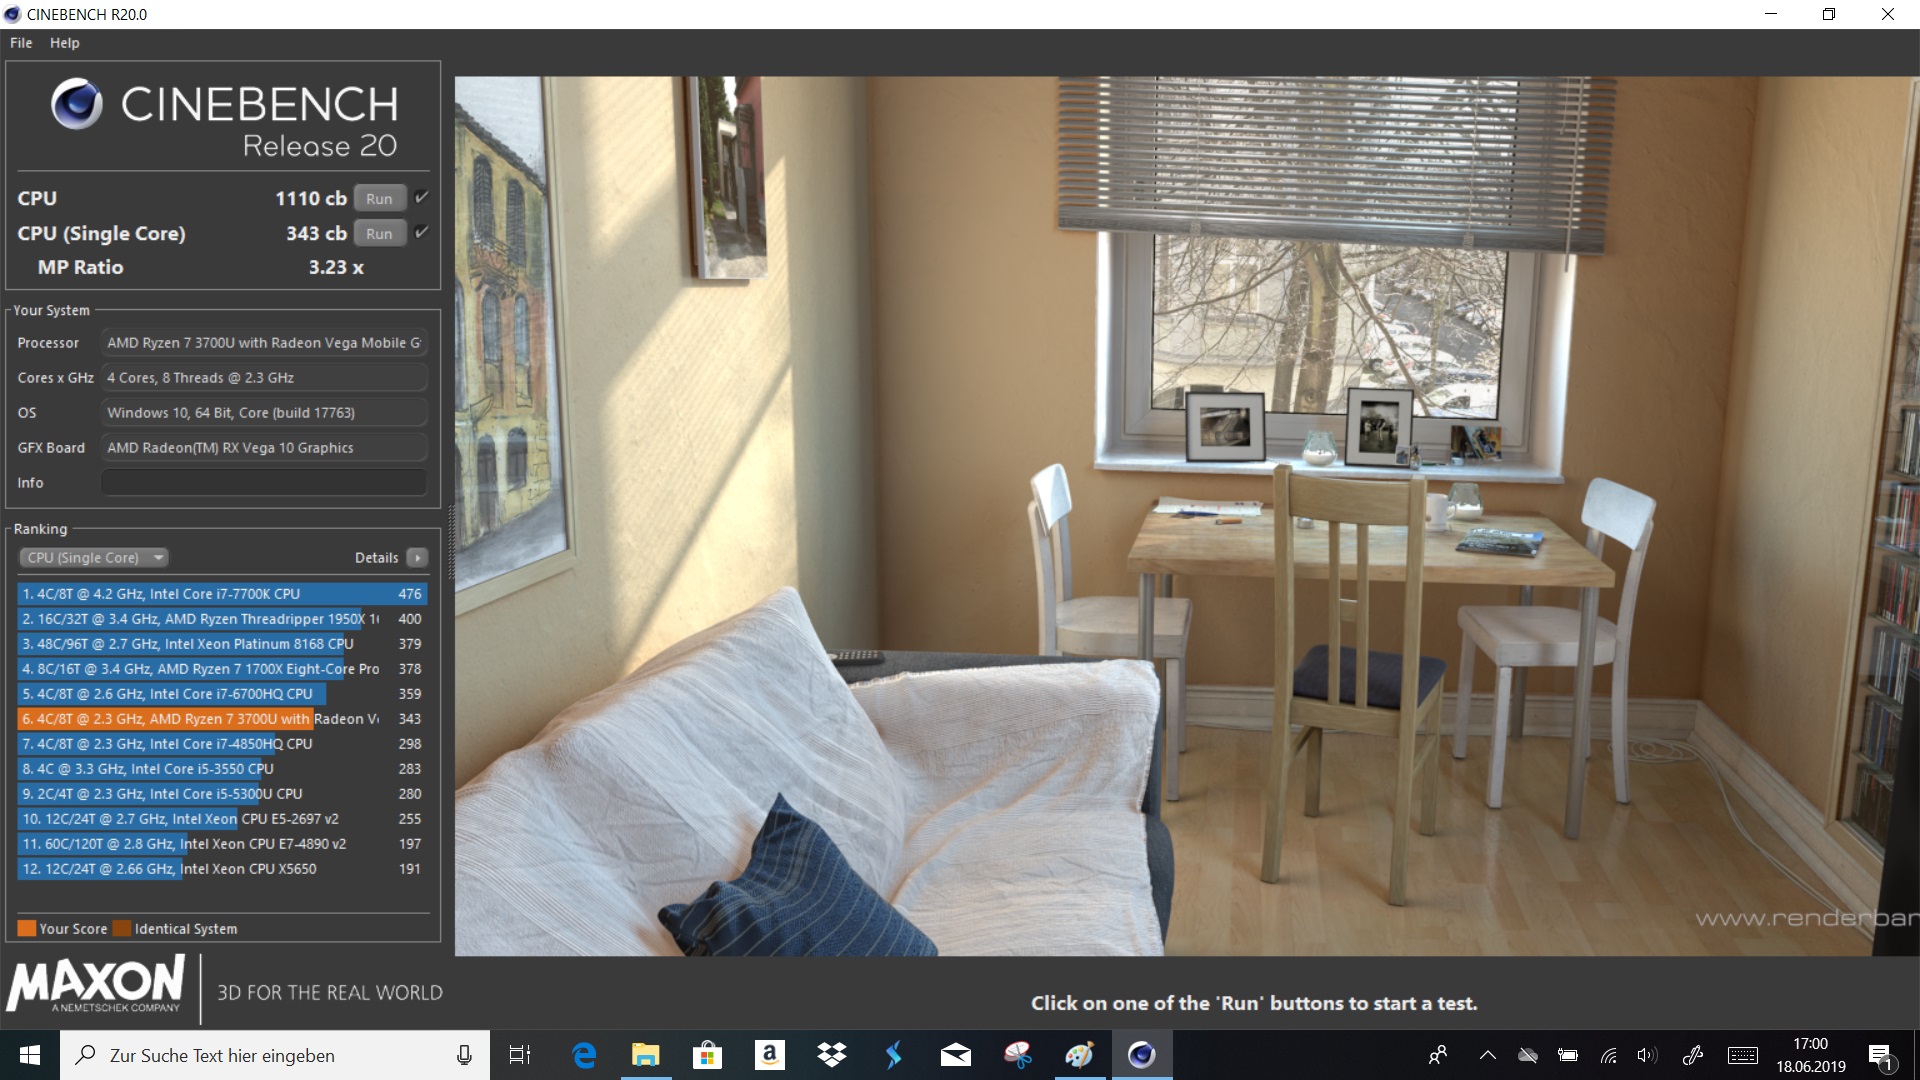
| Cinebench R20 | |
| CPU (Single Core) | |
| Average of class Convertible (273 - 834, n=49, last 2 years) | |
| Lenovo ThinkPad X390 Yoga-20NQS05R00 | |
| Dell Latitude 13 3390 | |
| HP Envy x360 13-ar0601ng | |
| Average AMD Ryzen 7 3700U (285 - 368, n=5) | |
| CPU (Multi Core) | |
| Average of class Convertible (595 - 12102, n=49, last 2 years) | |
| Average AMD Ryzen 7 3700U (1047 - 1560, n=5) | |
| Lenovo ThinkPad X390 Yoga-20NQS05R00 | |
| Dell Latitude 13 3390 | |
| HP Envy x360 13-ar0601ng | |
| HWBOT x265 Benchmark v2.2 - 4k Preset | |
| Average of class Convertible (3.43 - 36.2, n=48, last 2 years) | |
| Lenovo ThinkPad L390 Yoga-20NT000XGE | |
| Lenovo ThinkPad X390 Yoga-20NQS05R00 | |
| Dell Latitude 13 3390 | |
| Average AMD Ryzen 7 3700U (2.76 - 3.9, n=4) | |
| HP Envy x360 13-ar0601ng | |
| Blender - v2.79 BMW27 CPU | |
| HP Envy x360 13-ar0601ng | |
| Dell Latitude 13 3390 | |
| Lenovo ThinkPad L390 Yoga-20NT000XGE | |
| Lenovo ThinkPad X390 Yoga-20NQS05R00 | |
| Average AMD Ryzen 7 3700U (671 - 1018, n=3) | |
| Average of class Convertible (105 - 1051, n=48, last 2 years) | |
* ... smaller is better
| PCMark 8 | |
| Home Score Accelerated v2 | |
| Average of class Convertible (n=1last 2 years) | |
| HP Envy x360 13-ar0601ng | |
| Dell Latitude 13 3390 | |
| Lenovo ThinkPad L390 Yoga-20NT000XGE | |
| Lenovo Yoga C930-13IKB | |
| Lenovo ThinkPad X390 Yoga-20NQS05R00 | |
| Average AMD Ryzen 7 3700U, AMD Radeon RX Vega 10 (3325 - 3993, n=7) | |
| Work Score Accelerated v2 | |
| Average of class Convertible (n=1last 2 years) | |
| Lenovo ThinkPad X390 Yoga-20NQS05R00 | |
| HP Envy x360 13-ar0601ng | |
| Lenovo Yoga C930-13IKB | |
| Lenovo ThinkPad L390 Yoga-20NT000XGE | |
| Dell Latitude 13 3390 | |
| Average AMD Ryzen 7 3700U, AMD Radeon RX Vega 10 (4418 - 4869, n=6) | |
| PCMark 8 Home Score Accelerated v2 | 3863 points | |
| PCMark 8 Creative Score Accelerated v2 | 4974 points | |
| PCMark 8 Work Score Accelerated v2 | 4869 points | |
| PCMark 10 Score | 3685 points | |
Help | ||
| HP Envy x360 13-ar0601ng SK Hynix BC501 HFM512GDJTNG | Lenovo ThinkPad X390 Yoga-20NQS05R00 Intel SSD Pro 7600p SSDPEKKF512G8L | Dell Latitude 13 3390 SK hynix SC311 SATA | Lenovo ThinkPad L390 Yoga-20NT000XGE Samsung SSD PM981 MZVLB256HAHQ | Dell Inspiron 13 7386 SK Hynix BC501 HFM512GDJTNG | Lenovo Yoga C930-13IKB SK hynix PC401 HFS256GD9TNG | Average SK Hynix BC501 HFM512GDJTNG | |
|---|---|---|---|---|---|---|---|
| AS SSD | 81% | -51% | 55% | 16% | -11% | 15% | |
| Seq Read (MB/s) | 1412 | 2742 94% | 479.5 -66% | 1724 22% | 1122 -21% | 1850 31% | 1323 ? -6% |
| Seq Write (MB/s) | 540 | 1511 180% | 354.9 -34% | 1123 108% | 619 15% | 661 22% | 697 ? 29% |
| 4K Read (MB/s) | 32.24 | 66.3 106% | 23.88 -26% | 51.8 61% | 39.58 23% | 38.04 18% | 40.4 ? 25% |
| 4K Write (MB/s) | 74.7 | 175.2 135% | 51.3 -31% | 133.8 79% | 108.5 45% | 95 27% | 100.8 ? 35% |
| 4K-64 Read (MB/s) | 567 | 873 54% | 294.8 -48% | 745 31% | 776 37% | 434.3 -23% | 686 ? 21% |
| 4K-64 Write (MB/s) | 700 | 594 -15% | 217.5 -69% | 1193 70% | 671 -4% | 266.3 -62% | 660 ? -6% |
| Access Time Read * (ms) | 0.049 | 0.035 29% | 0.093 -90% | 0.041 16% | 0.045 8% | 0.069 -41% | 0.06071 ? -24% |
| Access Time Write * (ms) | 0.048 | 0.021 56% | 0.071 -48% | 0.028 42% | 0.033 31% | 0.056 -17% | 0.037 ? 23% |
| Score Read (Points) | 741 | 1213 64% | 367 -50% | 969 31% | 928 25% | 657 -11% | 858 ? 16% |
| Score Write (Points) | 829 | 920 11% | 304 -63% | 1440 74% | 841 1% | 427 -48% | 830 ? 0% |
| Score Total (Points) | 1913 | 2712 42% | 860 -55% | 2889 51% | 2228 16% | 1373 -28% | 2107 ? 10% |
| Copy ISO MB/s (MB/s) | 521 | 1725 231% | 294 -44% | 1025 97% | 539 3% | 802 ? 54% | |
| Copy Program MB/s (MB/s) | 253.1 | 418.3 65% | 137.4 -46% | 322.1 27% | 209.7 -17% | 265 ? 5% | |
| Copy Game MB/s (MB/s) | 392.9 | 687 75% | 202.2 -49% | 637 62% | 340 -13% | 487 ? 24% |
* ... smaller is better

| 3DMark 11 - 1280x720 Performance GPU | |
| Average of class Convertible (1505 - 40732, n=48, last 2 years) | |
| HP Envy x360 13-ar0601ng | |
| Average AMD Radeon RX Vega 10 (2688 - 4165, n=17) | |
| Dell Inspiron 13 7386 | |
| Lenovo ThinkPad X390 Yoga-20NQS05R00 | |
| Lenovo Yoga C930-13IKB | |
| Lenovo ThinkPad L390 Yoga-20NT000XGE | |
| Dell Latitude 13 3390 | |
| 3DMark | |
| 1280x720 Cloud Gate Standard Graphics | |
| Average of class Convertible (7885 - 57566, n=32, last 2 years) | |
| Average AMD Radeon RX Vega 10 (9364 - 20784, n=16) | |
| HP Envy x360 13-ar0601ng | |
| Dell Inspiron 13 7386 | |
| Lenovo ThinkPad X390 Yoga-20NQS05R00 | |
| Lenovo Yoga C930-13IKB | |
| Dell Latitude 13 3390 | |
| Lenovo ThinkPad L390 Yoga-20NT000XGE | |
| 1920x1080 Fire Strike Graphics | |
| Average of class Convertible (1185 - 27447, n=48, last 2 years) | |
| Average AMD Radeon RX Vega 10 (1567 - 2999, n=17) | |
| HP Envy x360 13-ar0601ng | |
| Dell Inspiron 13 7386 | |
| Lenovo ThinkPad X390 Yoga-20NQS05R00 | |
| Lenovo Yoga C930-13IKB | |
| Dell Latitude 13 3390 | |
| Lenovo ThinkPad L390 Yoga-20NT000XGE | |
| 2560x1440 Time Spy Graphics | |
| Average of class Convertible (327 - 10434, n=51, last 2 years) | |
| Average AMD Radeon RX Vega 10 (578 - 852, n=7) | |
| HP Envy x360 13-ar0601ng | |
| Lenovo Yoga C930-13IKB | |
| Dell Latitude 13 3390 | |
| 3DMark 11 Performance | 3737 points | |
| 3DMark Ice Storm Standard Score | 69242 points | |
| 3DMark Cloud Gate Standard Score | 9802 points | |
| 3DMark Fire Strike Score | 1669 points | |
| 3DMark Fire Strike Extreme Score | 813 points | |
| 3DMark Time Spy Score | 647 points | |
Help | ||
| low | med. | high | ultra | |
|---|---|---|---|---|
| BioShock Infinite (2013) | 113 | 14 | ||
| Dota 2 Reborn (2015) | 67.4 | 43.8 | 23.3 | 22.3 |
| Rise of the Tomb Raider (2016) | 45.9 | 8.3 | ||
| X-Plane 11.11 (2018) | 23.4 | 16.8 | 14.8 |
Noise level
| Idle |
| 32.2 / 32.2 / 32.2 dB(A) |
| Load |
| 40.8 / 41.9 dB(A) |
 | ||
30 dB silent 40 dB(A) audible 50 dB(A) loud |
||
min: | ||
| HP Envy x360 13-ar0601ng Vega 10, R7 3700U, SK Hynix BC501 HFM512GDJTNG | Lenovo ThinkPad X390 Yoga-20NQS05R00 UHD Graphics 620, i7-8565U, Intel SSD Pro 7600p SSDPEKKF512G8L | Dell Latitude 13 3390 UHD Graphics 620, i5-8250U, SK hynix SC311 SATA | Lenovo ThinkPad L390 Yoga-20NT000XGE UHD Graphics 620, i5-8265U, Samsung SSD PM981 MZVLB256HAHQ | Dell Inspiron 13 7386 UHD Graphics 620, i7-8565U, SK Hynix BC501 HFM512GDJTNG | Lenovo Yoga C930-13IKB UHD Graphics 620, i5-8250U, SK hynix PC401 HFS256GD9TNG | |
|---|---|---|---|---|---|---|
| Noise | 10% | 9% | 13% | 9% | 12% | |
| off / environment * (dB) | 30.5 | 29.2 4% | 30.6 -0% | 29.5 3% | 30.3 1% | 29.3 4% |
| Idle Minimum * (dB) | 32.2 | 29.2 9% | 30.6 5% | 29.5 8% | 30.4 6% | 29.3 9% |
| Idle Average * (dB) | 32.2 | 29.2 9% | 30.6 5% | 29.5 8% | 30.4 6% | 29.3 9% |
| Idle Maximum * (dB) | 32.2 | 29.2 9% | 30.6 5% | 29.5 8% | 30.4 6% | 29.7 8% |
| Load Average * (dB) | 40.8 | 35 14% | 33.3 18% | 30.6 25% | 34.3 16% | 31.8 22% |
| Load Maximum * (dB) | 41.9 | 35 16% | 33 21% | 30.6 27% | 34.2 18% | 32.7 22% |
* ... smaller is better
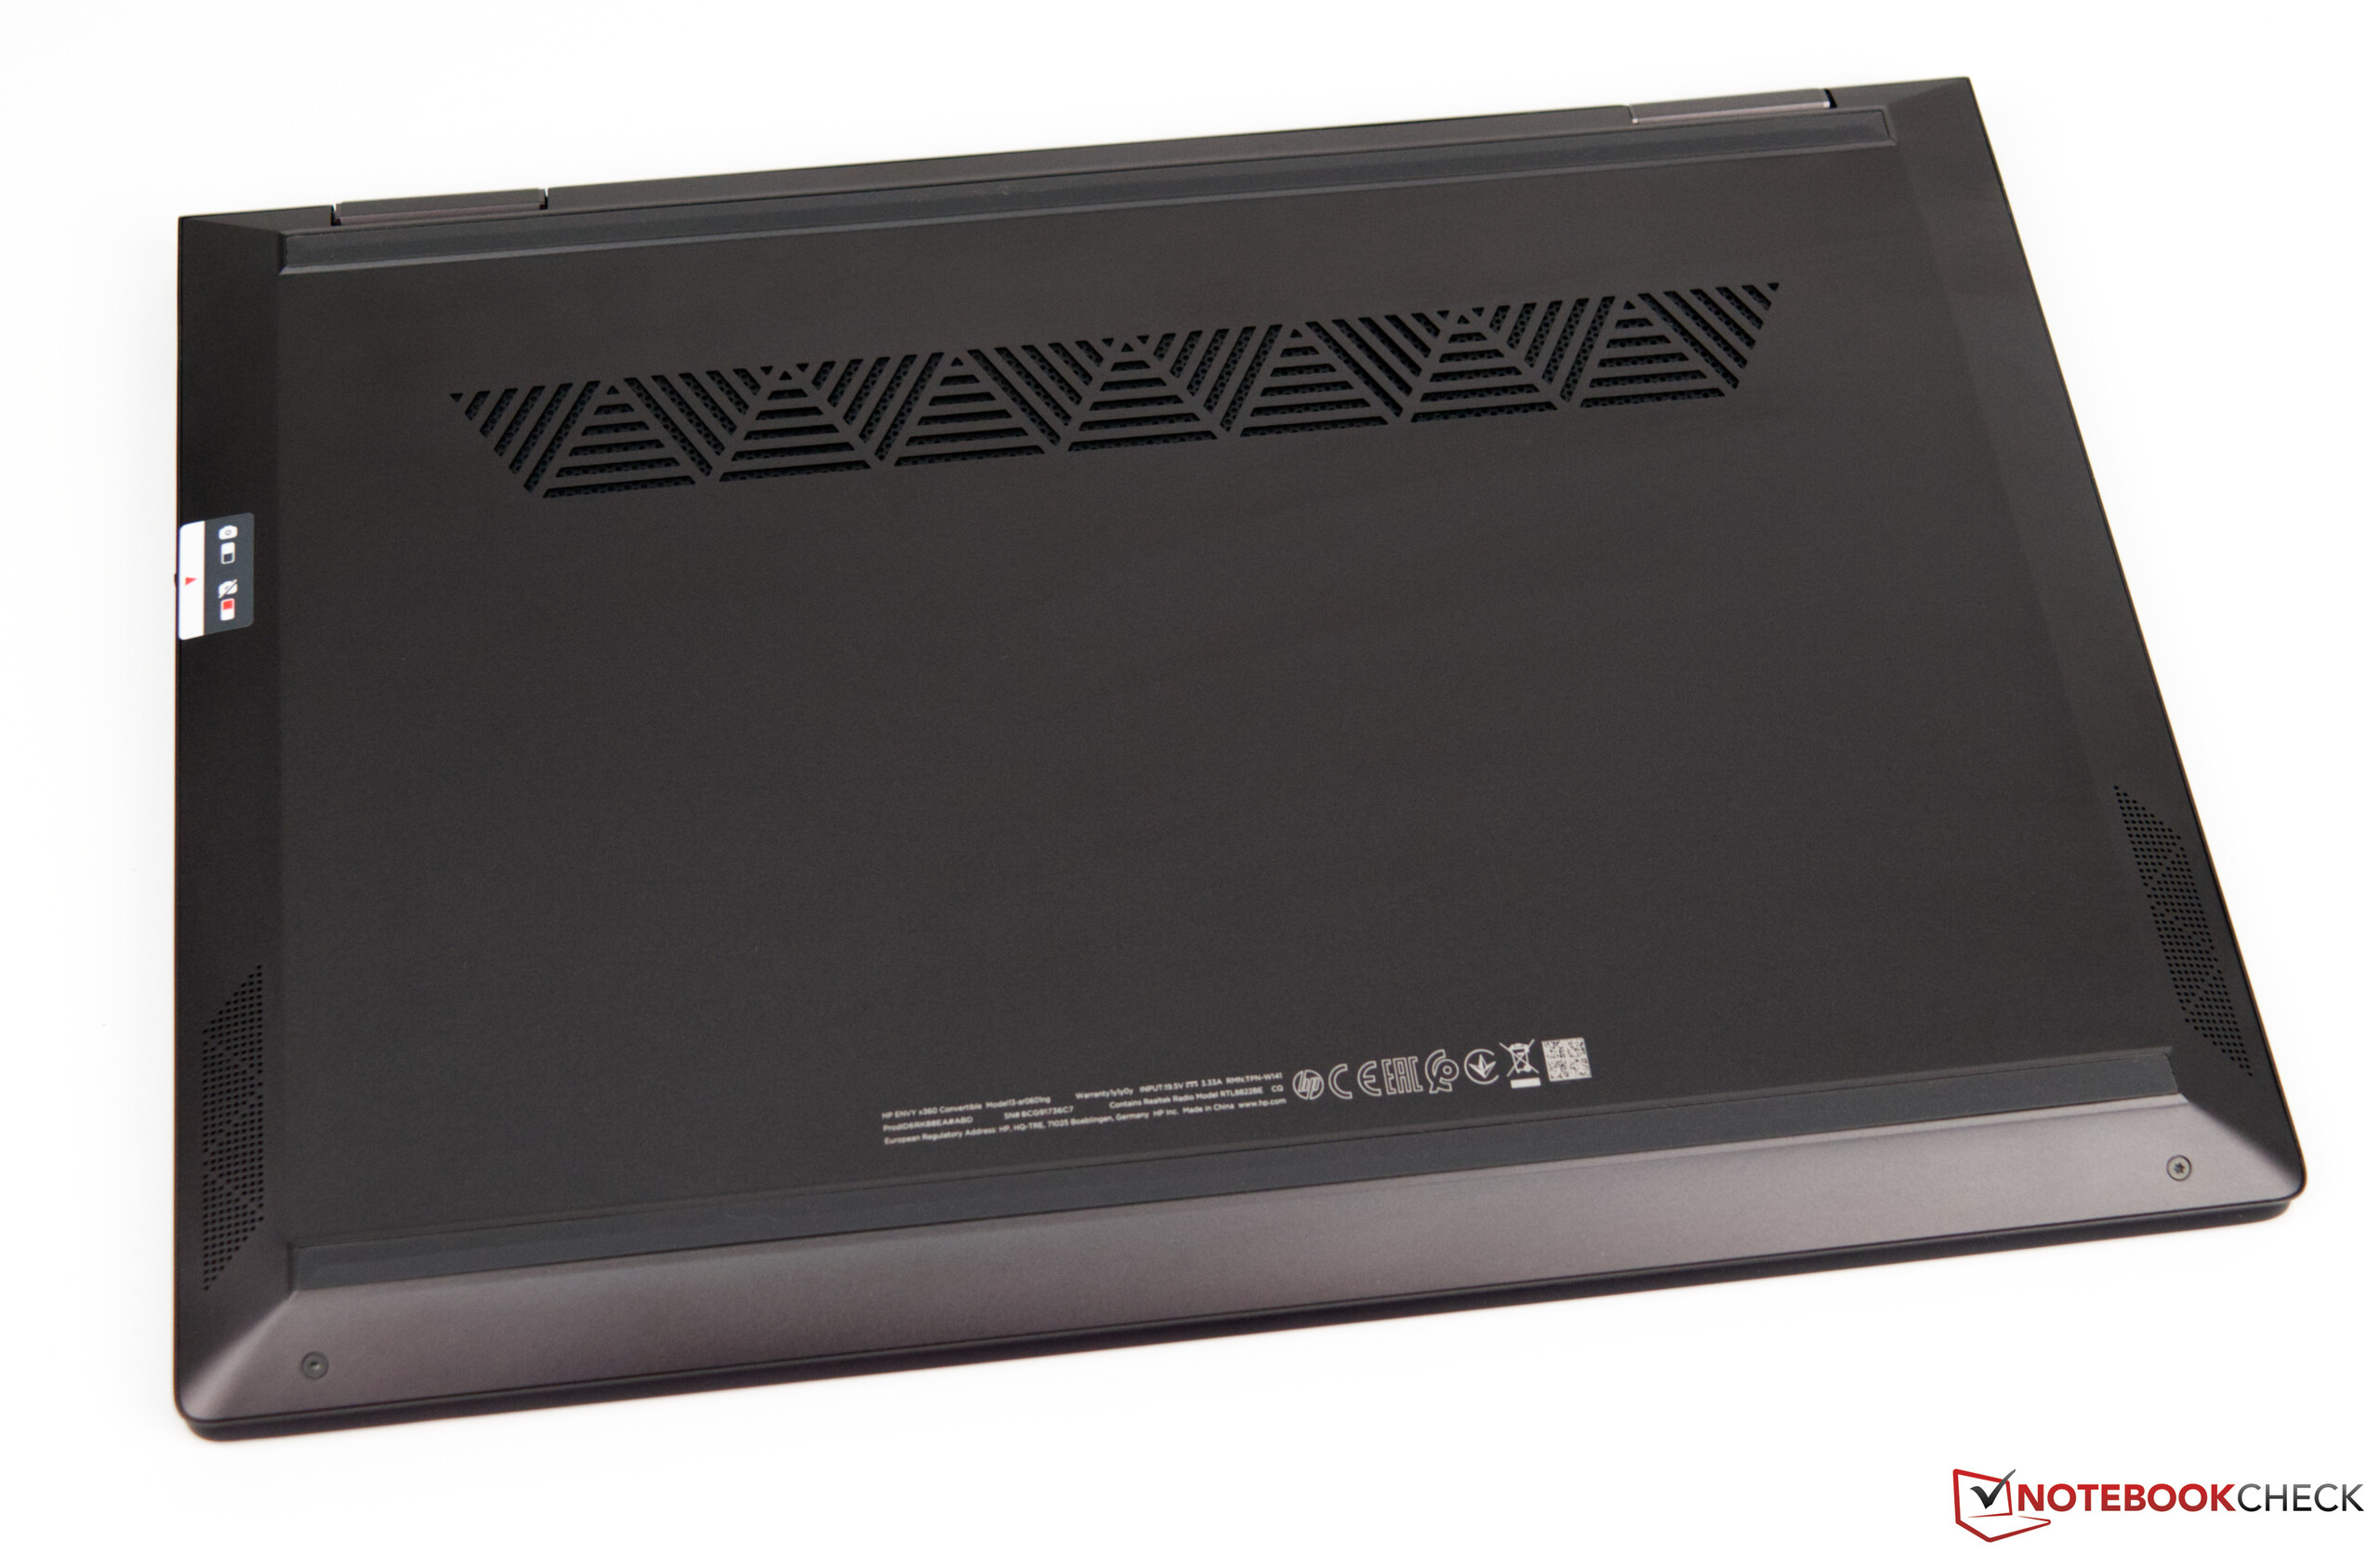
(±) The maximum temperature on the upper side is 43 °C / 109 F, compared to the average of 35.4 °C / 96 F, ranging from 19.6 to 60 °C for the class Convertible.
(±) The bottom heats up to a maximum of 43.6 °C / 110 F, compared to the average of 36.9 °C / 98 F
(+) In idle usage, the average temperature for the upper side is 30.7 °C / 87 F, compared to the device average of 30.3 °C / 87 F.
(+) The palmrests and touchpad are reaching skin temperature as a maximum (33.3 °C / 91.9 F) and are therefore not hot.
(-) The average temperature of the palmrest area of similar devices was 28 °C / 82.4 F (-5.3 °C / -9.5 F).
| HP Envy x360 13-ar0601ng Vega 10, R7 3700U, SK Hynix BC501 HFM512GDJTNG | Lenovo ThinkPad X390 Yoga-20NQS05R00 UHD Graphics 620, i7-8565U, Intel SSD Pro 7600p SSDPEKKF512G8L | Dell Latitude 13 3390 UHD Graphics 620, i5-8250U, SK hynix SC311 SATA | Lenovo ThinkPad L390 Yoga-20NT000XGE UHD Graphics 620, i5-8265U, Samsung SSD PM981 MZVLB256HAHQ | Dell Inspiron 13 7386 UHD Graphics 620, i7-8565U, SK Hynix BC501 HFM512GDJTNG | Lenovo Yoga C930-13IKB UHD Graphics 620, i5-8250U, SK hynix PC401 HFS256GD9TNG | |
|---|---|---|---|---|---|---|
| Heat | 3% | 11% | 6% | 13% | 14% | |
| Maximum Upper Side * (°C) | 43 | 41.7 3% | 40 7% | 46.7 -9% | 40.5 6% | 41.8 3% |
| Maximum Bottom * (°C) | 43.6 | 50.1 -15% | 46.1 -6% | 50.7 -16% | 41.6 5% | 40.9 6% |
| Idle Upper Side * (°C) | 33.1 | 27.8 16% | 25.7 22% | 23.8 28% | 26.3 21% | 25.6 23% |
| Idle Bottom * (°C) | 32.5 | 30.2 7% | 26 20% | 25.6 21% | 26.2 19% | 24.5 25% |
* ... smaller is better
HP Envy x360 13-ar0601ng audio analysis
(-) | not very loud speakers (70.3 dB)
Bass 100 - 315 Hz
(-) | nearly no bass - on average 19.5% lower than median
(±) | linearity of bass is average (12.6% delta to prev. frequency)
Mids 400 - 2000 Hz
(+) | balanced mids - only 4.3% away from median
(±) | linearity of mids is average (7.2% delta to prev. frequency)
Highs 2 - 16 kHz
(+) | balanced highs - only 3.1% away from median
(+) | highs are linear (4.7% delta to prev. frequency)
Overall 100 - 16.000 Hz
(±) | linearity of overall sound is average (21.2% difference to median)
Compared to same class
» 57% of all tested devices in this class were better, 11% similar, 32% worse
» The best had a delta of 6%, average was 20%, worst was 57%
Compared to all devices tested
» 59% of all tested devices were better, 7% similar, 34% worse
» The best had a delta of 4%, average was 23%, worst was 134%
| Off / Standby | |
| Idle | |
| Load |
|
Key:
min: | |
| HP Envy x360 13-ar0601ng R7 3700U, Vega 10, SK Hynix BC501 HFM512GDJTNG, IPS, 120 Hz, 1920x1080, 13.3" | Lenovo ThinkPad X390 Yoga-20NQS05R00 i7-8565U, UHD Graphics 620, Intel SSD Pro 7600p SSDPEKKF512G8L, IPS LED, 1920x1080, 13.3" | Dell Latitude 13 3390 i5-8250U, UHD Graphics 620, SK hynix SC311 SATA, IPS, 1920x1080, 13.3" | Lenovo ThinkPad L390 Yoga-20NT000XGE i5-8265U, UHD Graphics 620, Samsung SSD PM981 MZVLB256HAHQ, IPS LED, 1920x1080, 13.3" | Dell Inspiron 13 7386 i7-8565U, UHD Graphics 620, SK Hynix BC501 HFM512GDJTNG, IPS, 3840x2160, 13.3" | Lenovo Yoga C930-13IKB i5-8250U, UHD Graphics 620, SK hynix PC401 HFS256GD9TNG, IPS, 1920x1080, 13.9" | Average AMD Radeon RX Vega 10 | Average of class Convertible | |
|---|---|---|---|---|---|---|---|---|
| Power Consumption | -42% | -24% | -41% | -96% | -41% | -45% | -55% | |
| Idle Minimum * (Watt) | 3.2 | 3.46 -8% | 3.9 -22% | 4 -25% | 6.5 -103% | 3.3 -3% | 4.73 ? -48% | 4.28 ? -34% |
| Idle Average * (Watt) | 2.8 | 5.88 -110% | 6.5 -132% | 7.1 -154% | 12.2 -336% | 6.8 -143% | 7.61 ? -172% | 6.96 ? -149% |
| Idle Maximum * (Watt) | 12.4 | 9.12 26% | 8.6 31% | 10.7 14% | 12.7 -2% | 9.5 23% | 9.63 ? 22% | 8.67 ? 30% |
| Load Average * (Watt) | 24.2 | 45.6 -88% | 25 -3% | 33.8 -40% | 39 -61% | 40.8 -69% | 33.3 ? -38% | 45.1 ? -86% |
| Load Maximum * (Watt) | 50 | 65.9 -32% | 48.1 4% | 48.8 2% | 39 22% | 57 -14% | 45.1 ? 10% | 67.7 ? -35% |
* ... smaller is better
| HP Envy x360 13-ar0601ng R7 3700U, Vega 10, 53 Wh | Lenovo ThinkPad X390 Yoga-20NQS05R00 i7-8565U, UHD Graphics 620, 50 Wh | Dell Latitude 13 3390 i5-8250U, UHD Graphics 620, 42 Wh | Lenovo ThinkPad L390 Yoga-20NT000XGE i5-8265U, UHD Graphics 620, 45 Wh | Dell Inspiron 13 7386 i7-8565U, UHD Graphics 620, 38 Wh | Lenovo Yoga C930-13IKB i5-8250U, UHD Graphics 620, 60 Wh | Average of class Convertible | |
|---|---|---|---|---|---|---|---|
| Battery runtime | 11% | 6% | 8% | -33% | 53% | 82% | |
| Reader / Idle (h) | 10.5 | 16.7 59% | 15.8 50% | 6.7 -36% | 23.9 128% | 26.7 ? 154% | |
| H.264 (h) | 6.5 | 10 54% | 5.9 -9% | 7.4 14% | 5.5 -15% | 10.5 62% | 15 ? 131% |
| WiFi v1.3 (h) | 7.3 | 8.2 12% | 6.7 -8% | 7.2 -1% | 3.9 -47% | 9.2 26% | 12 ? 64% |
| Load (h) | 2.2 | 1.5 -32% | 1.8 -18% | 1.5 -32% | 1.5 -32% | 2.1 -5% | 1.713 ? -22% |
Pros
Cons
Verdict - A good display and an AMD APU
HP Envy x360 13是价格实惠的翻转本,售价不到1000欧元(约合7800元)。凭借其AMD Ryzen 7 3700U和AMD Radeon RX Vega 10,这款二合一设备可为日常任务提供良好的性能。您还可以使用AMD SoC的iGPU运行较旧的游戏。毕竟,这种组合提供了比英特尔当前SoC更好的3D性能。
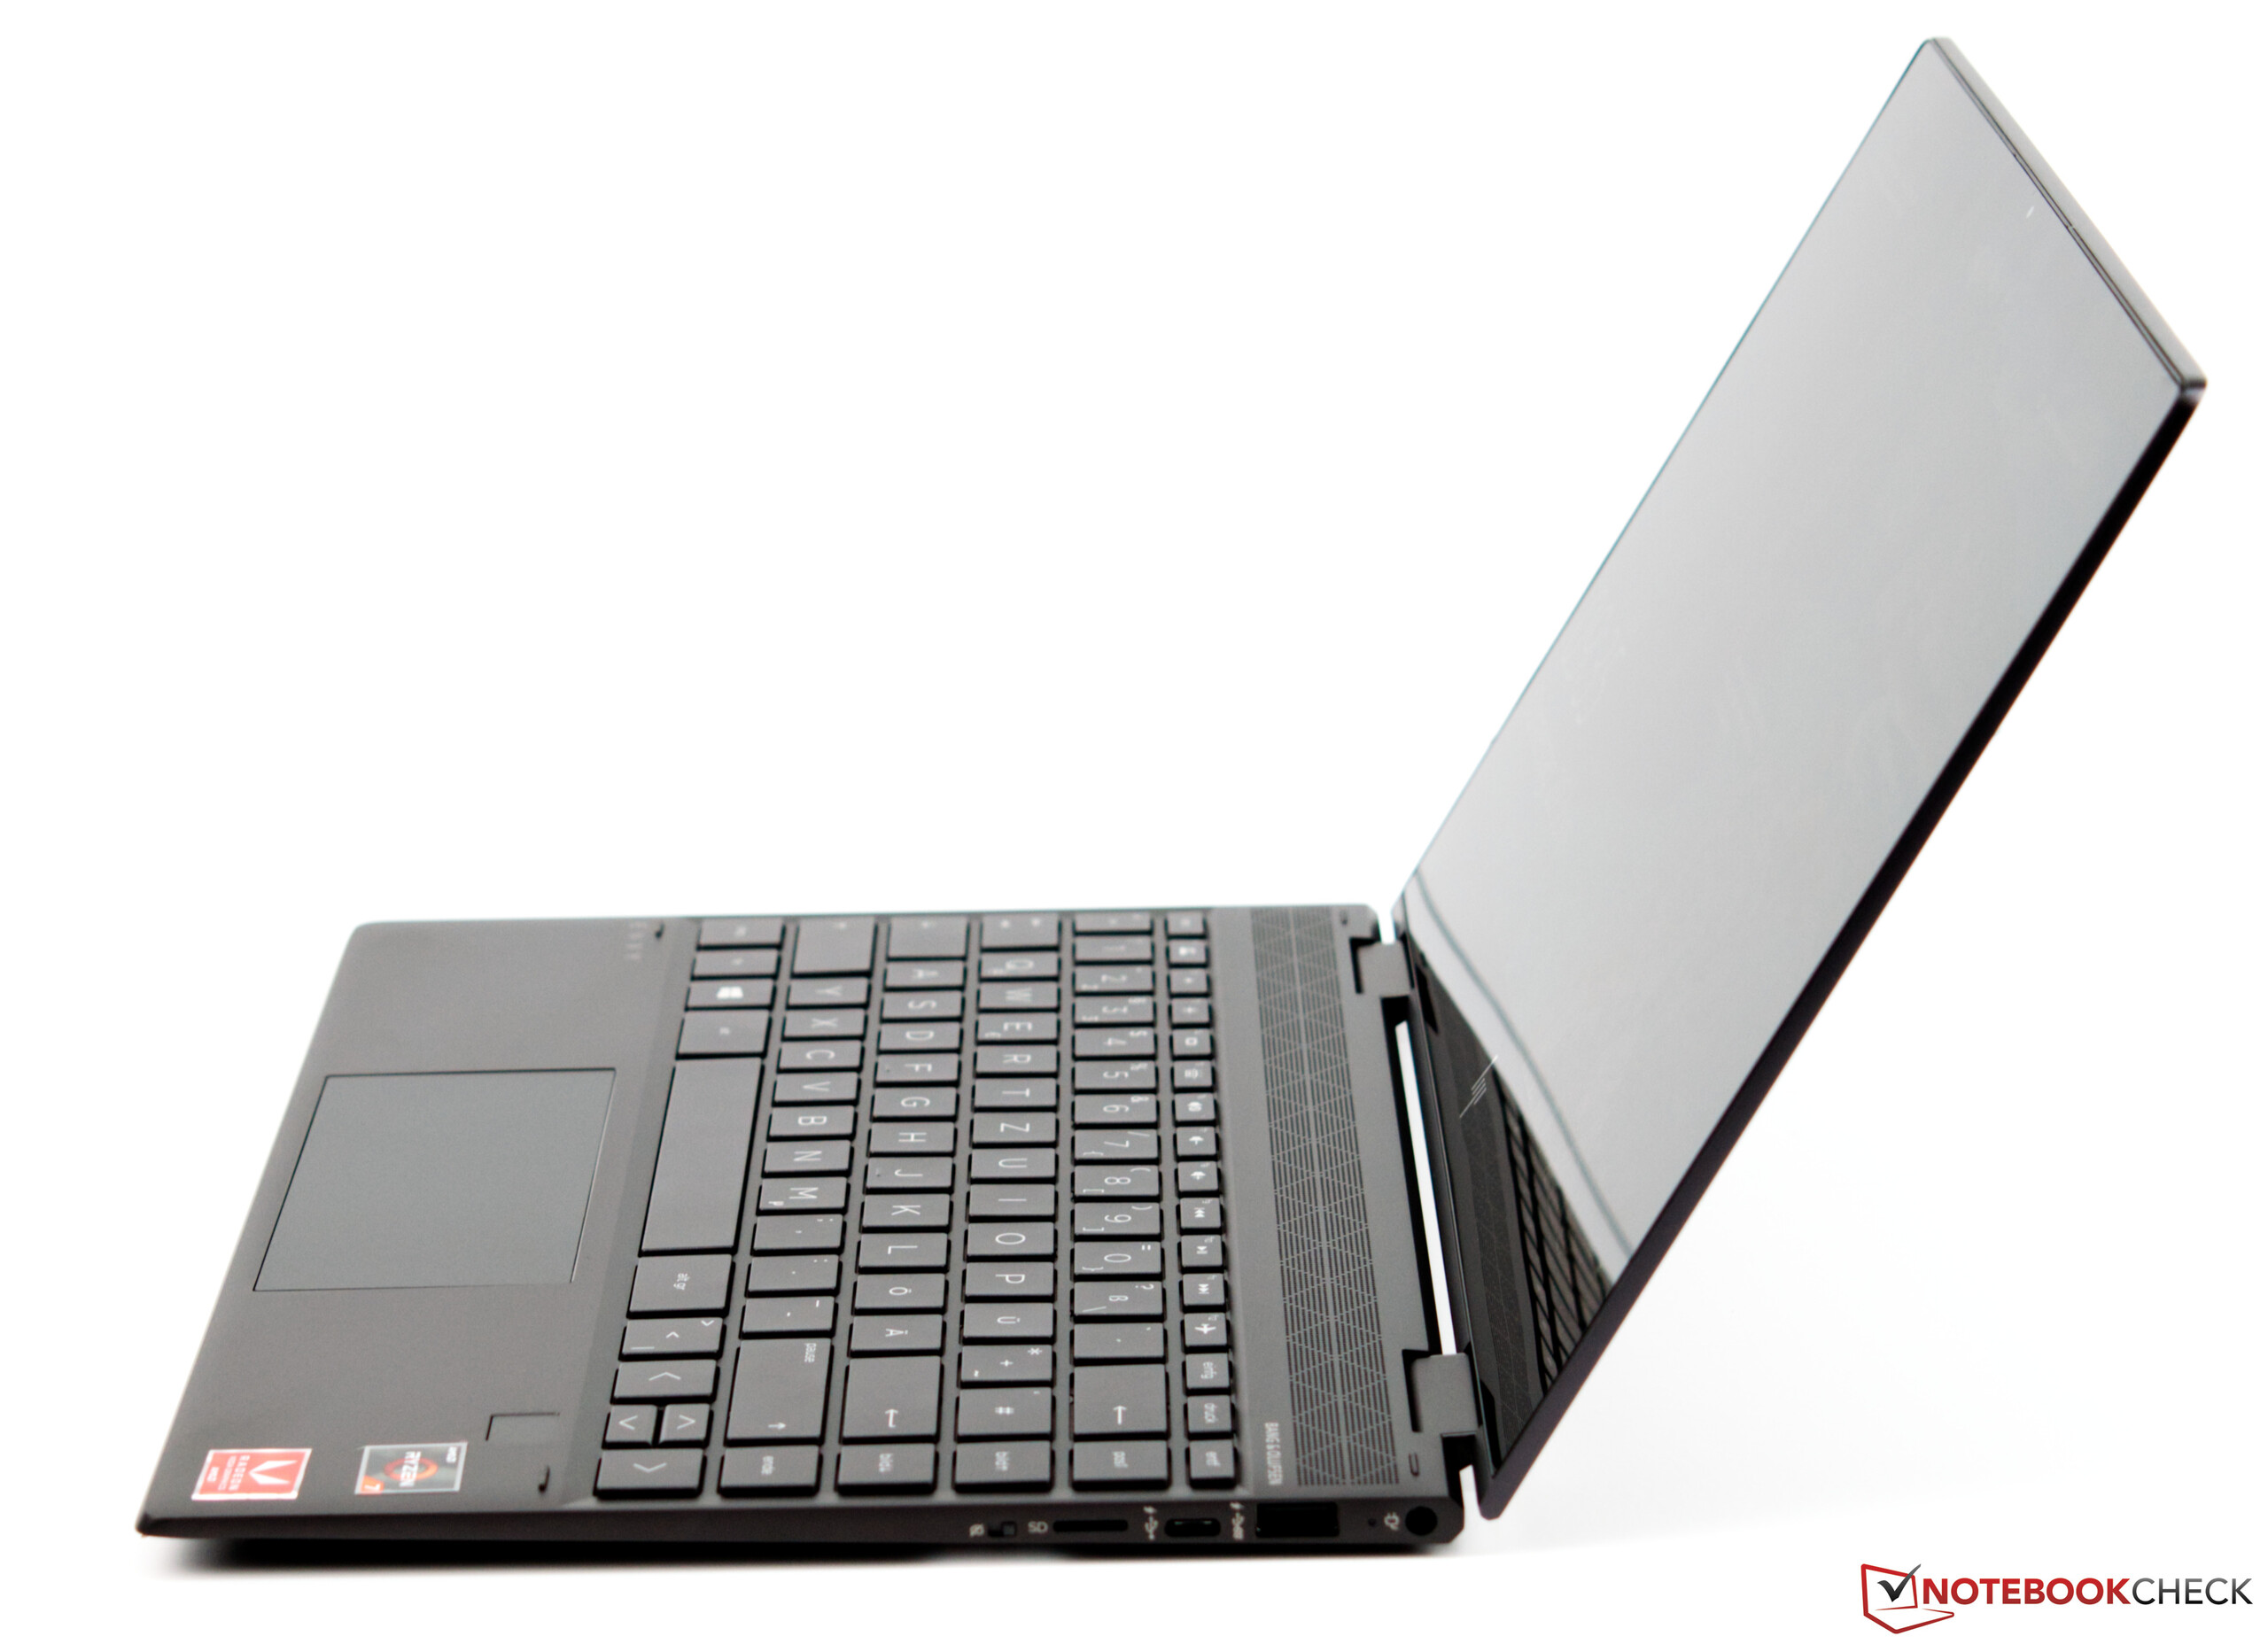
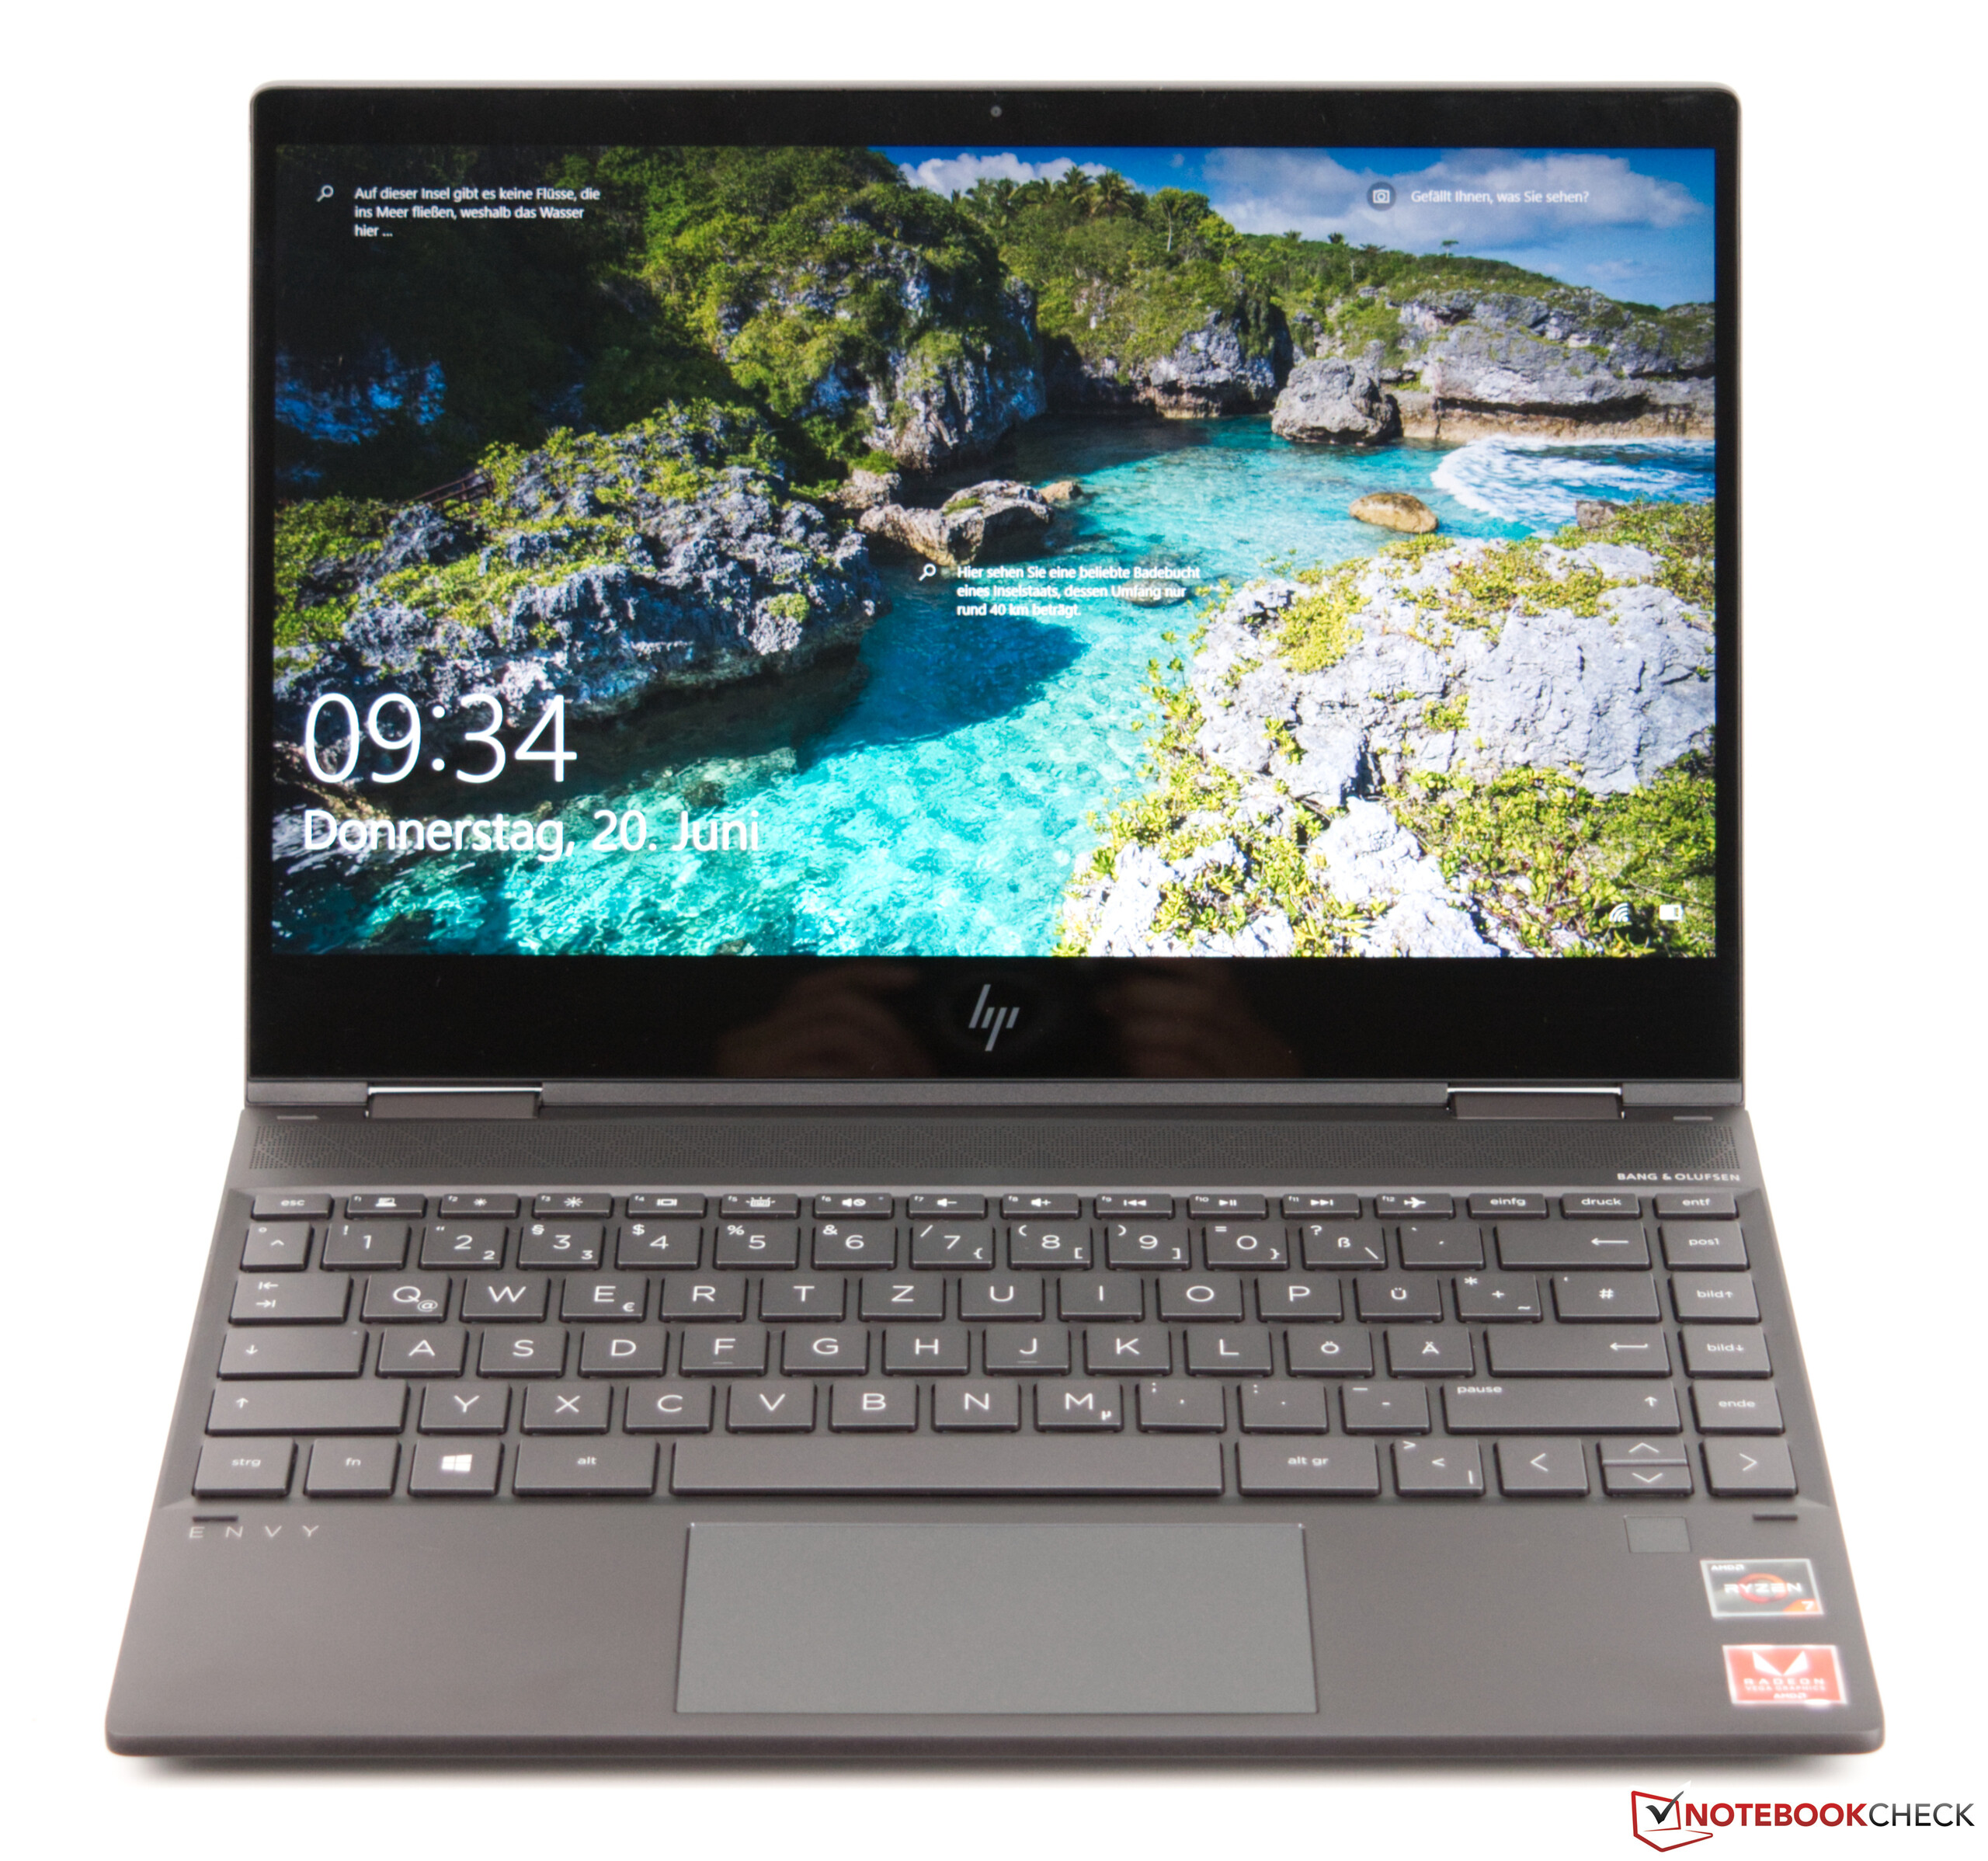
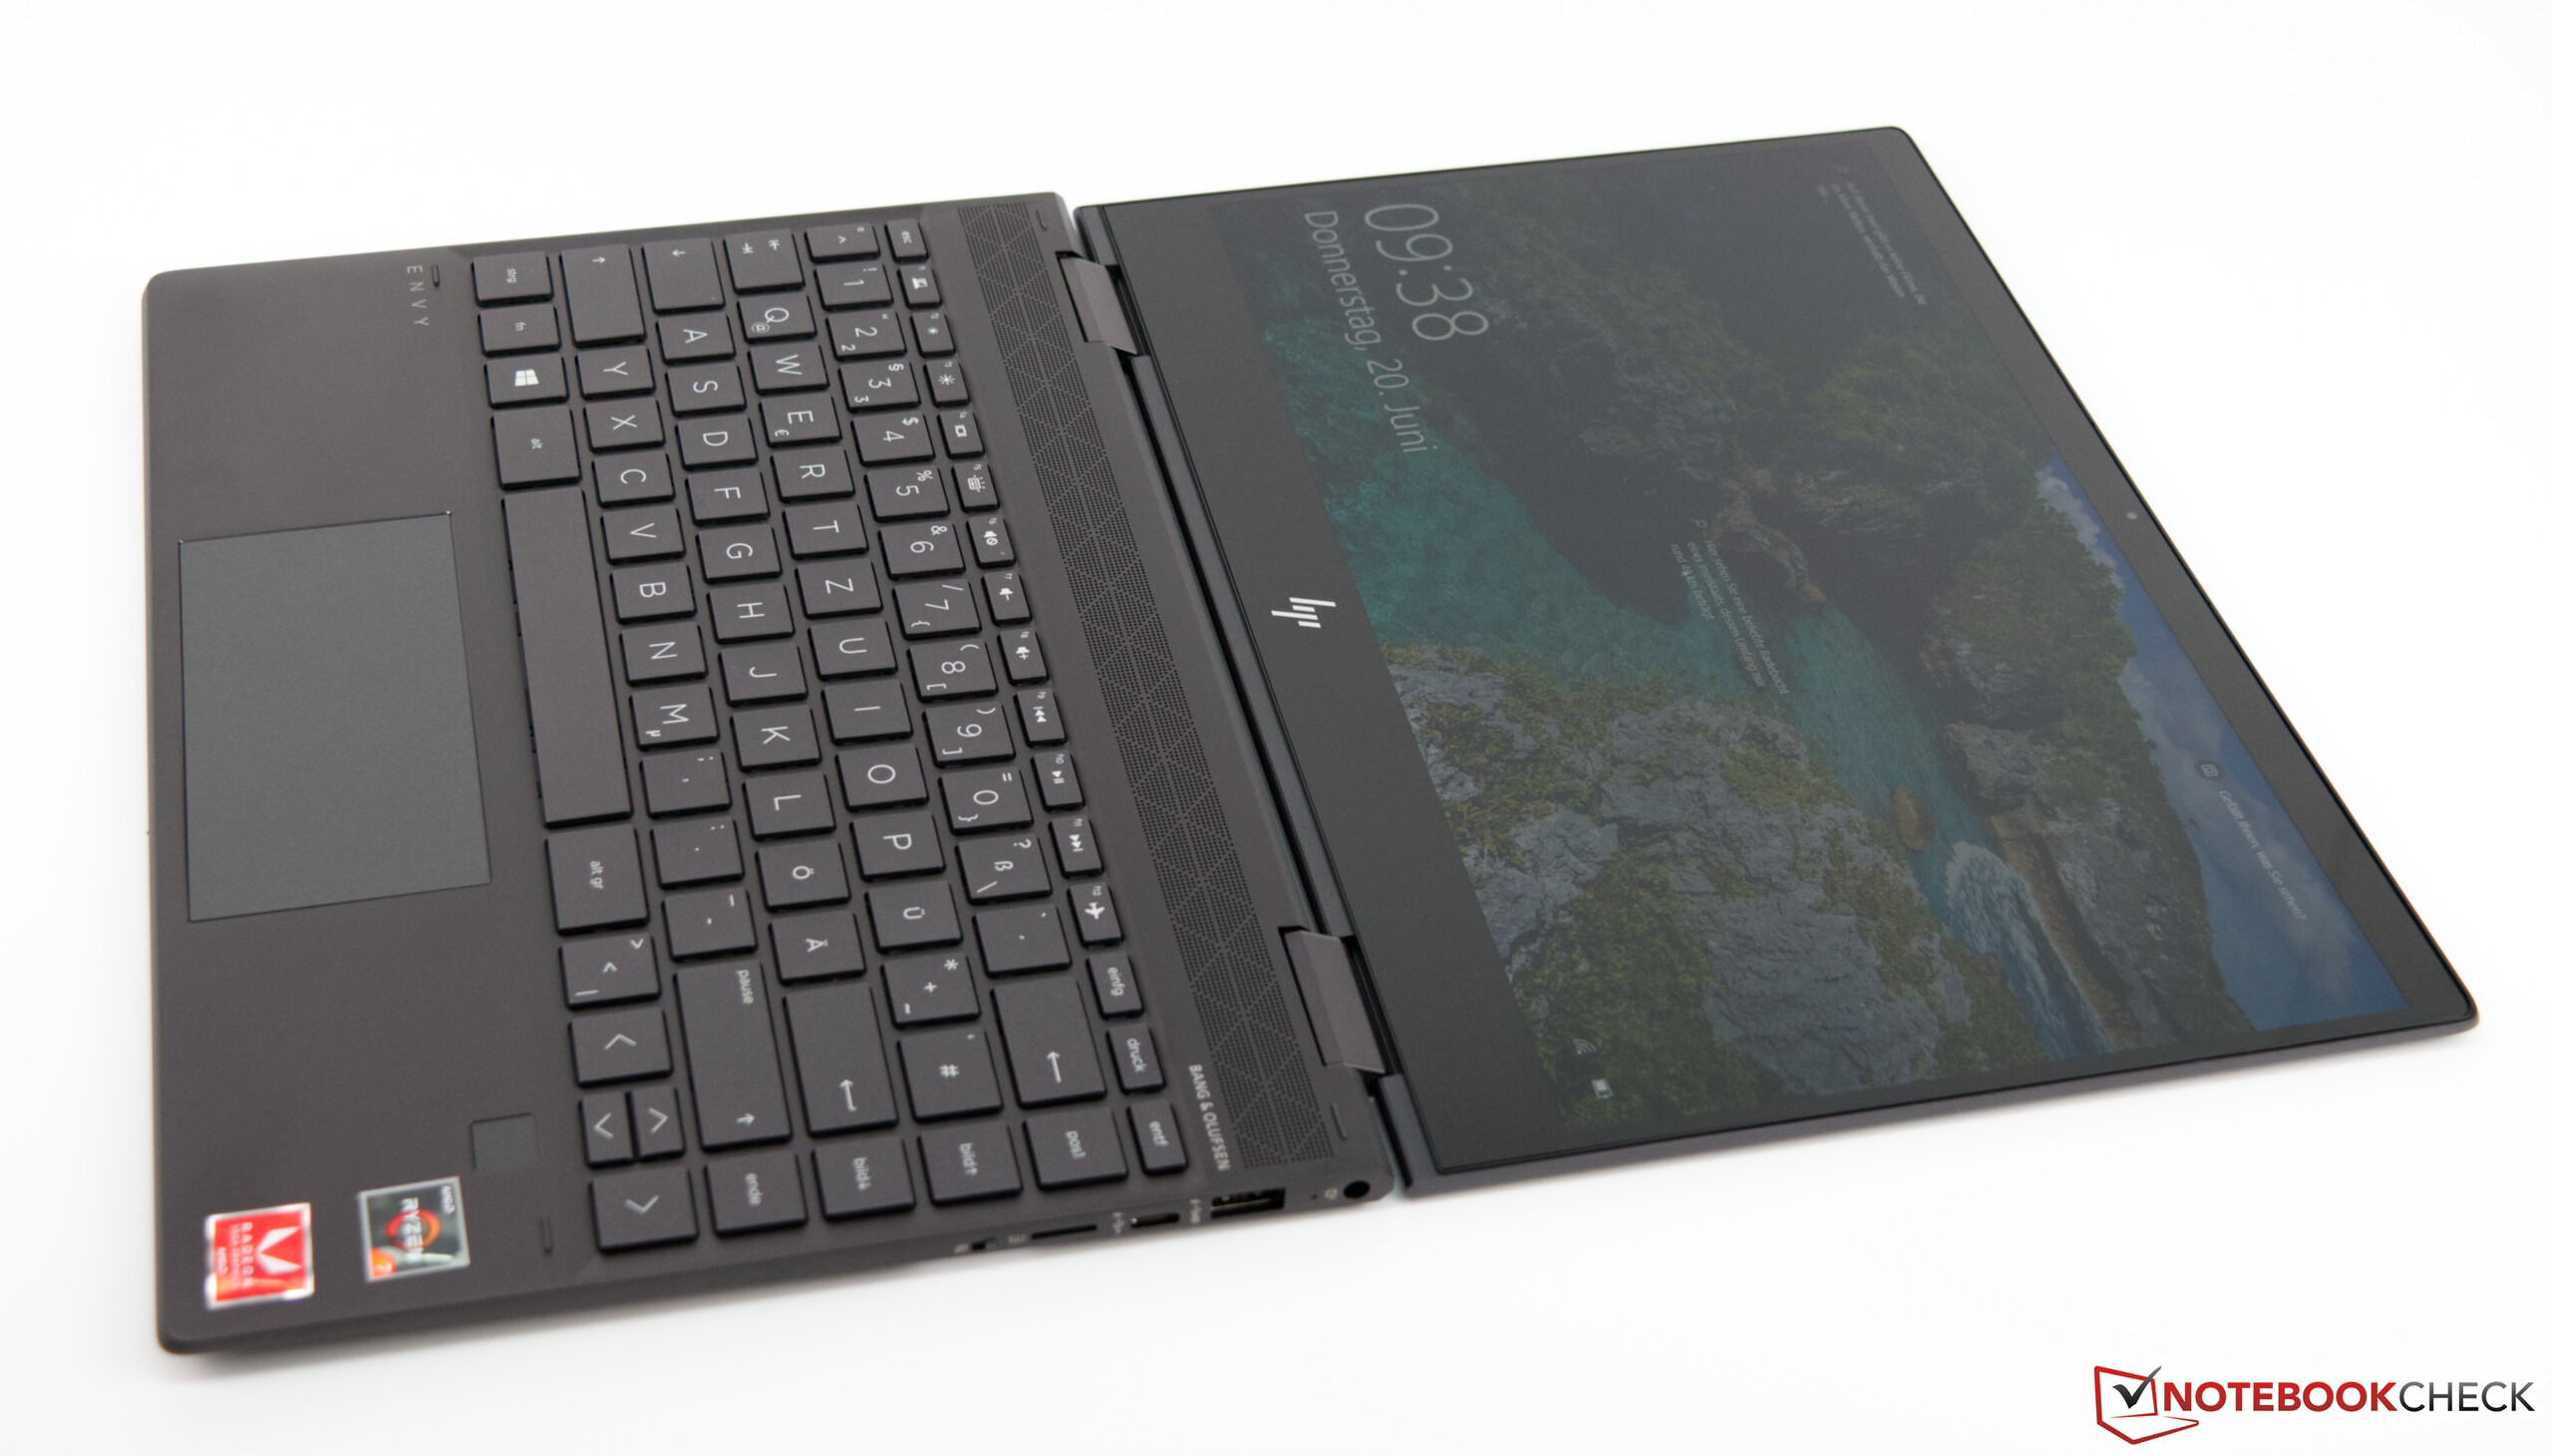
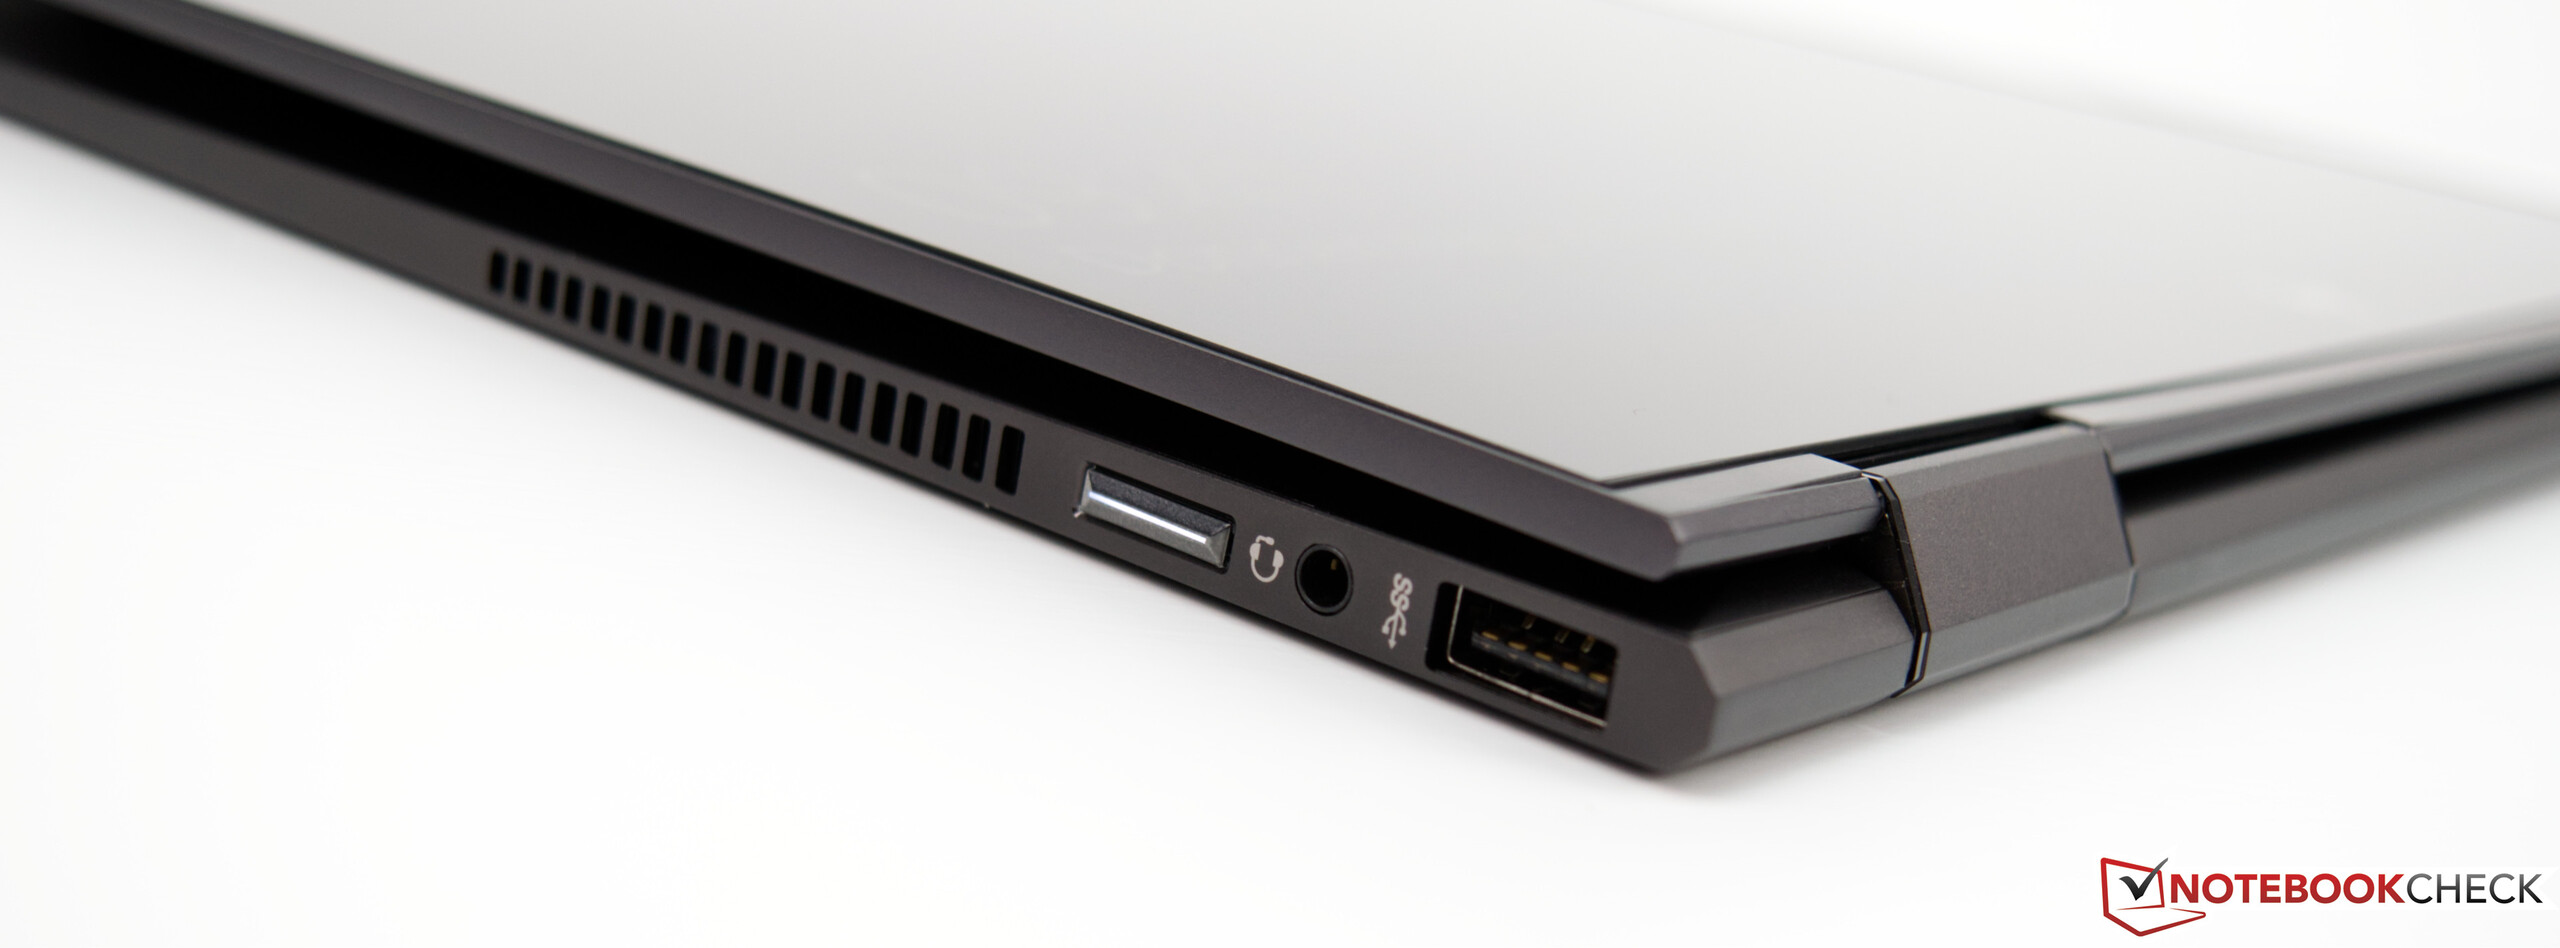
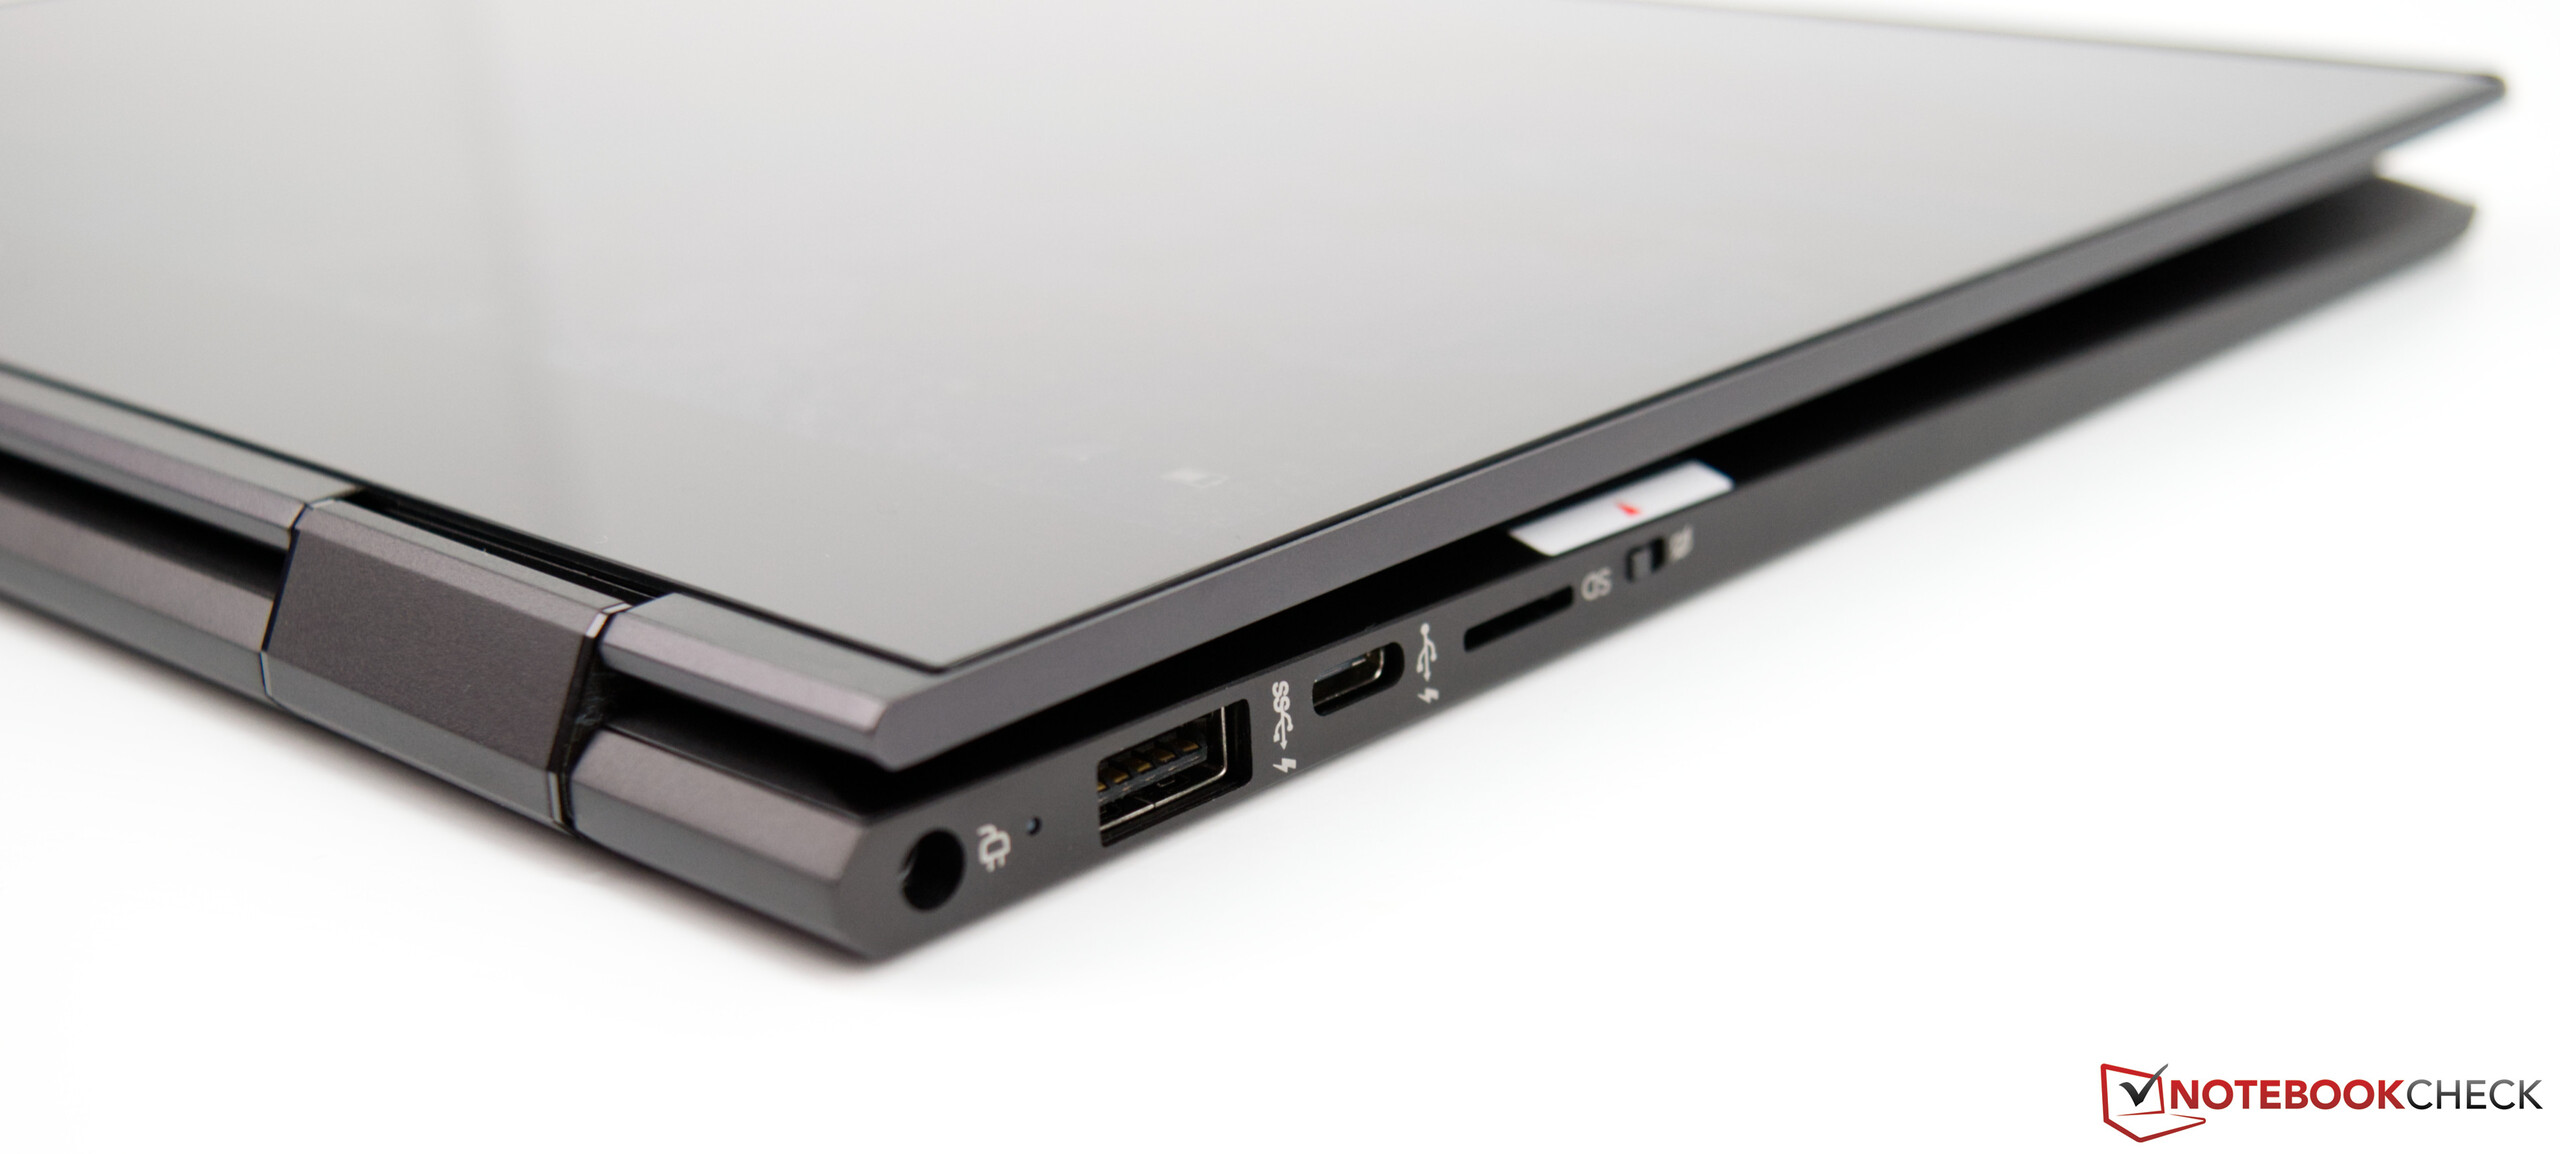
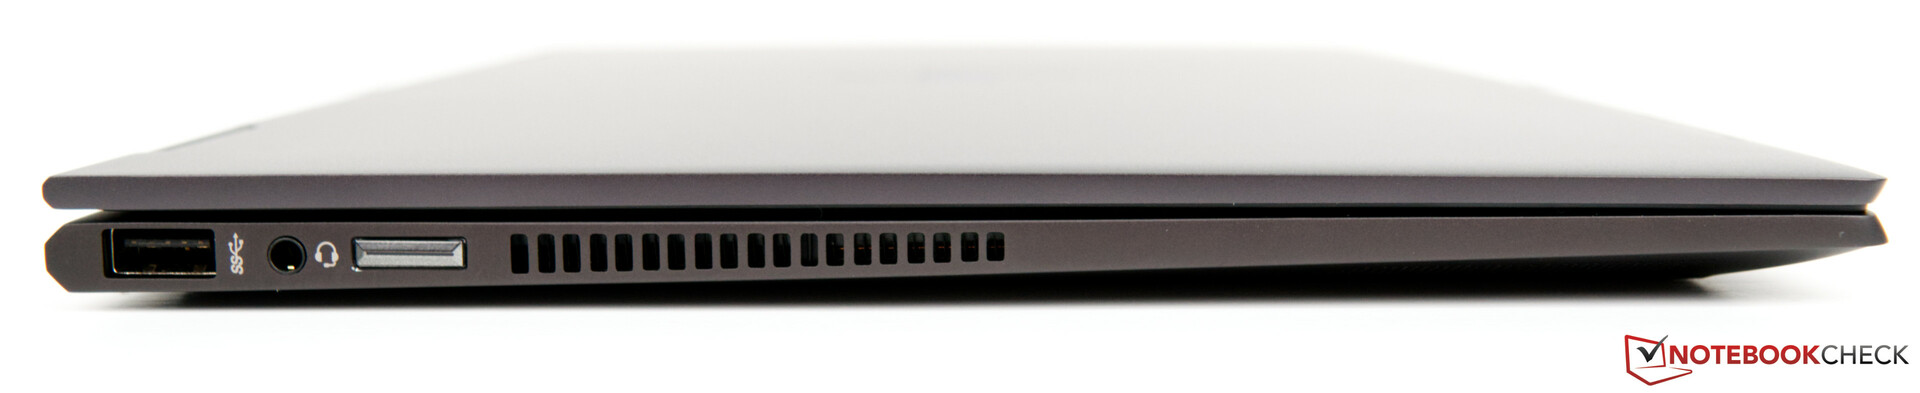
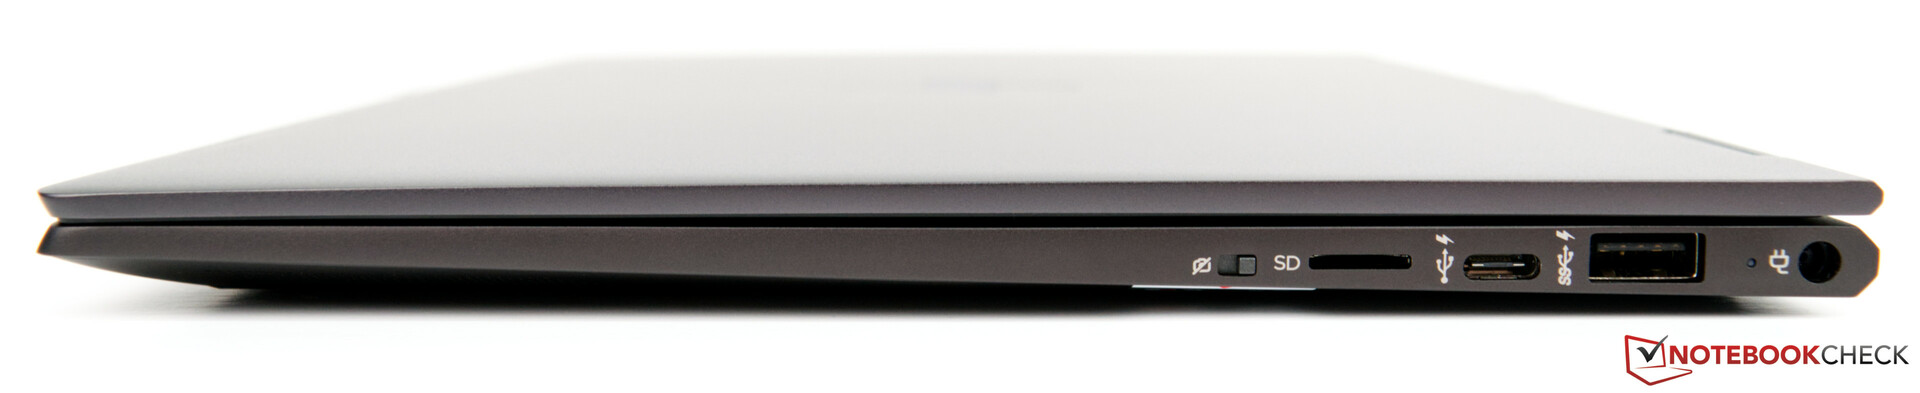
该设备已经从外观上得到了良好的印象,由于其薄的显示器边框而显得非常现代。那些没有过多接口的人可以通过三个可用的USB获得良好的体验。另一方面,我们也不会抱怨缺少Thunderbolt的Type-C连接。但至少USB Type-C支持DisplayPort。这是我们的最低期望,因为除此之外没有直接的HDMI或DisplayPort连接。
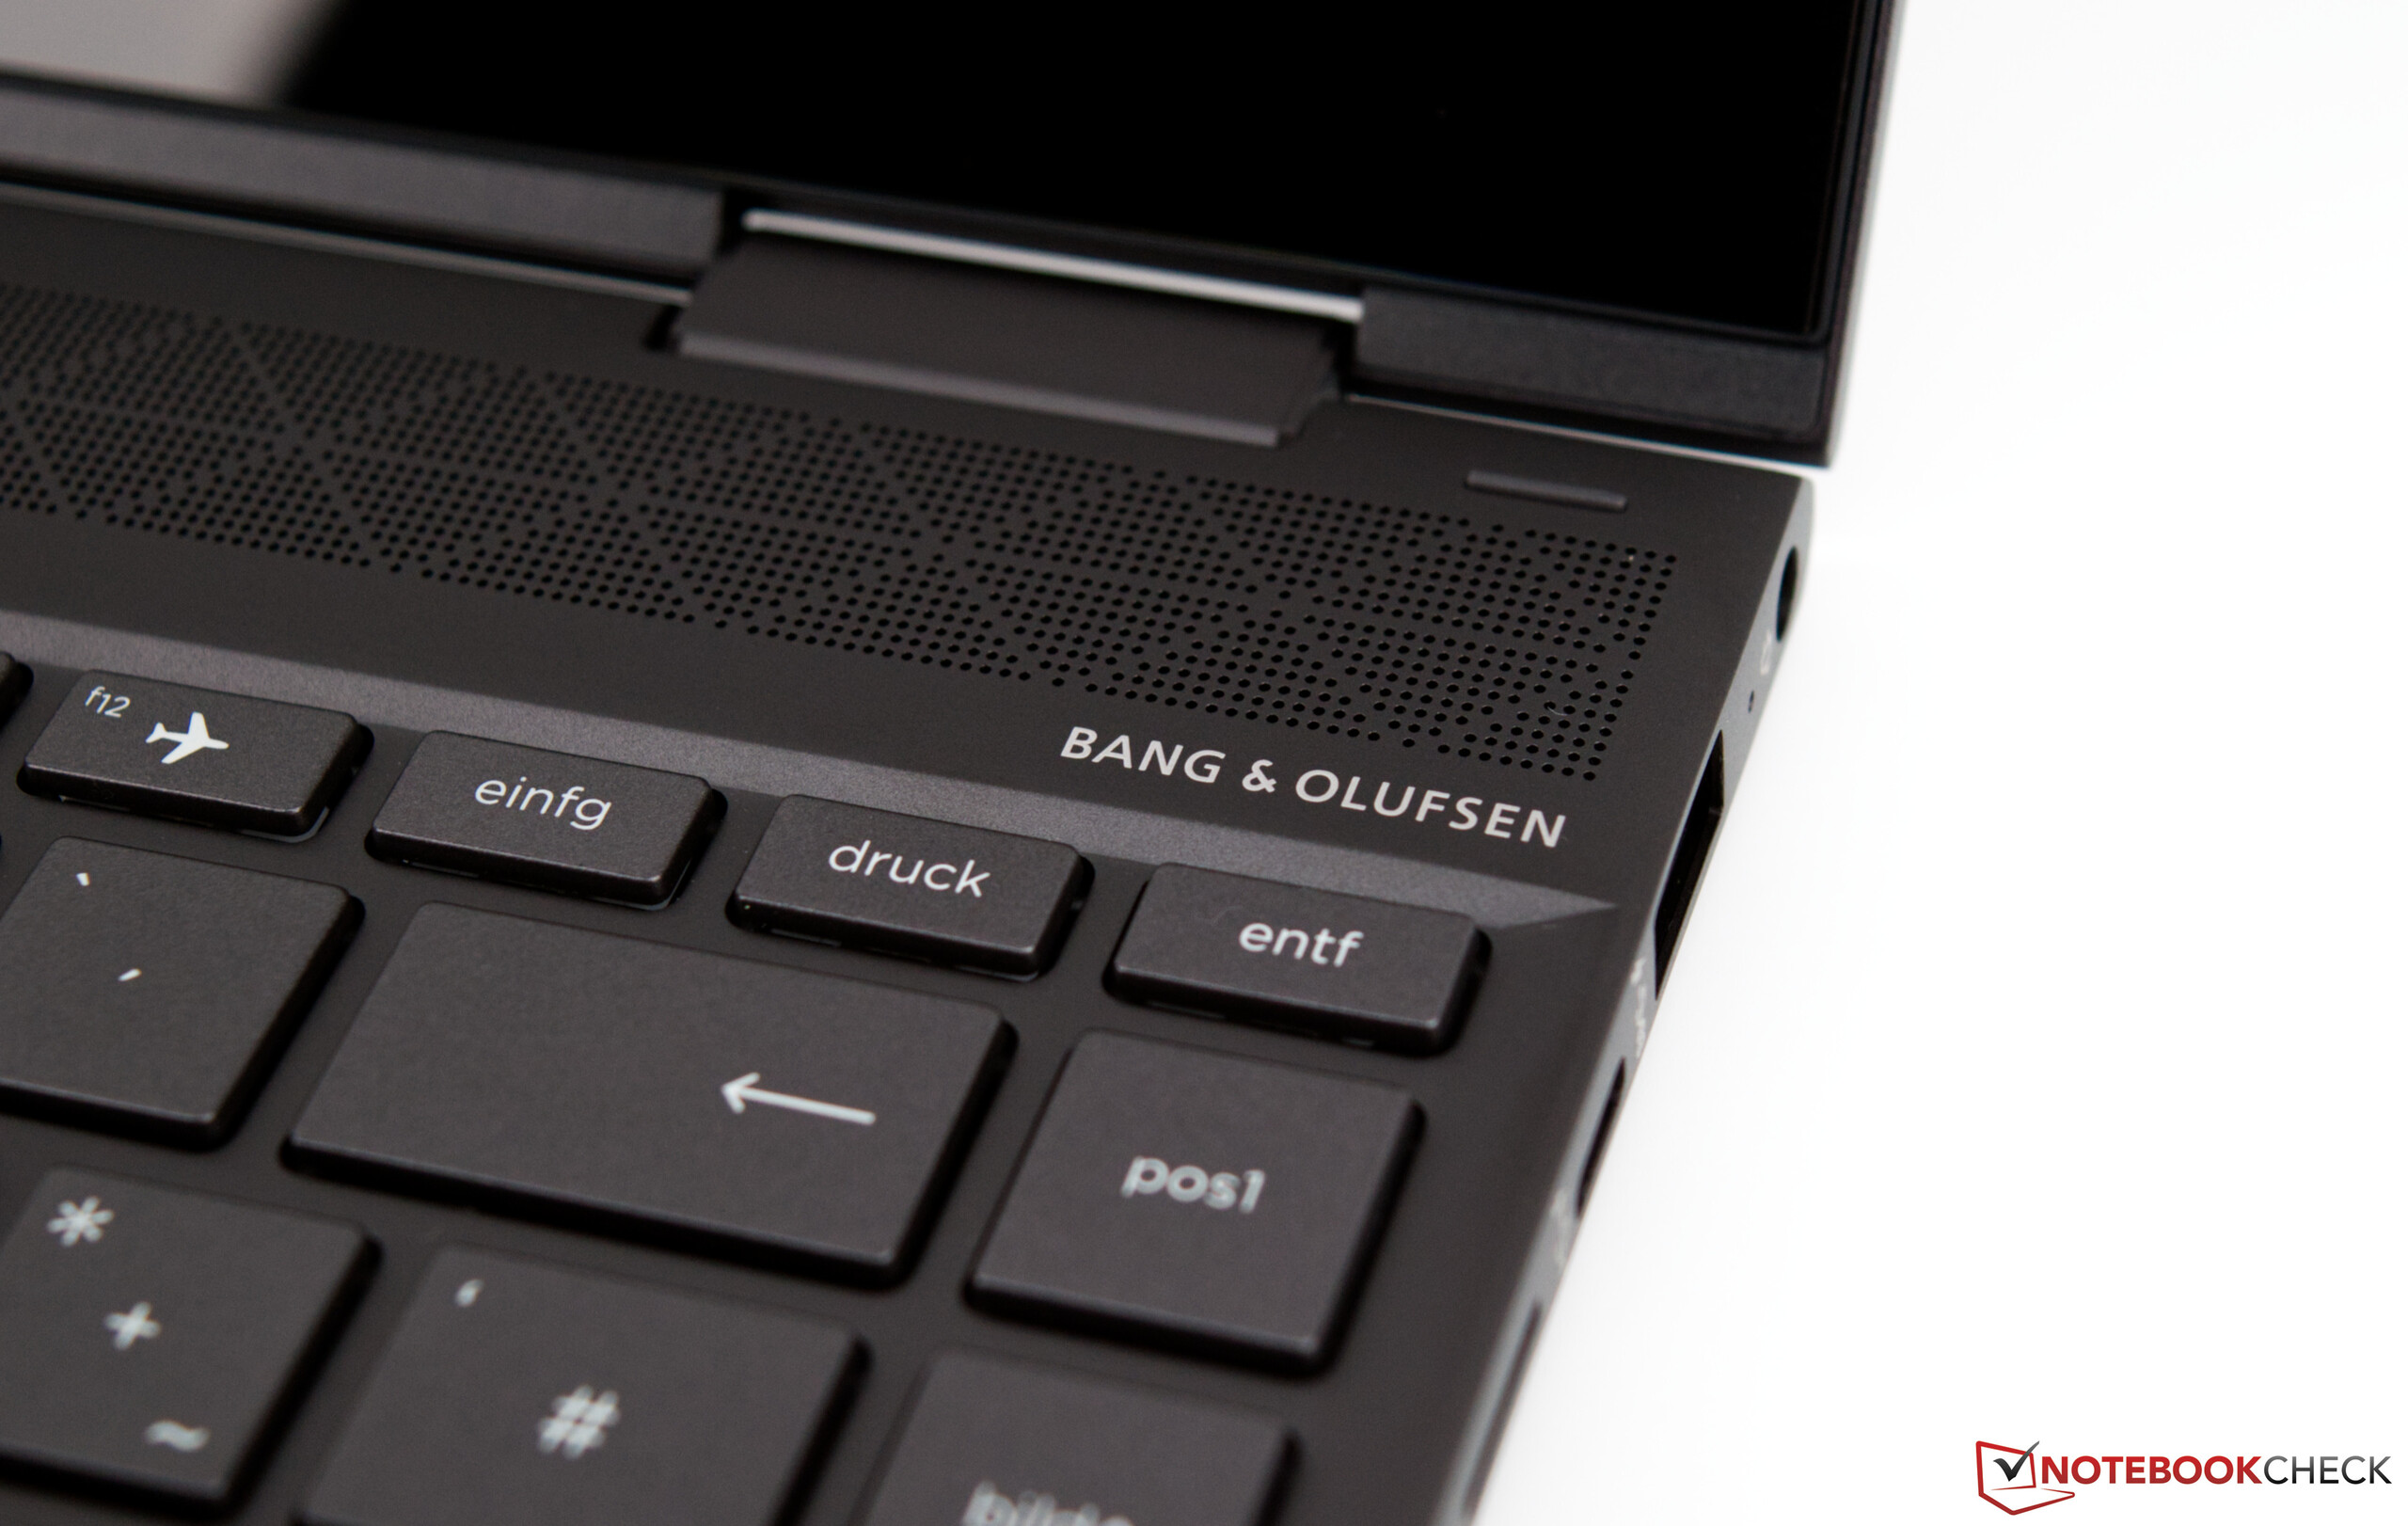
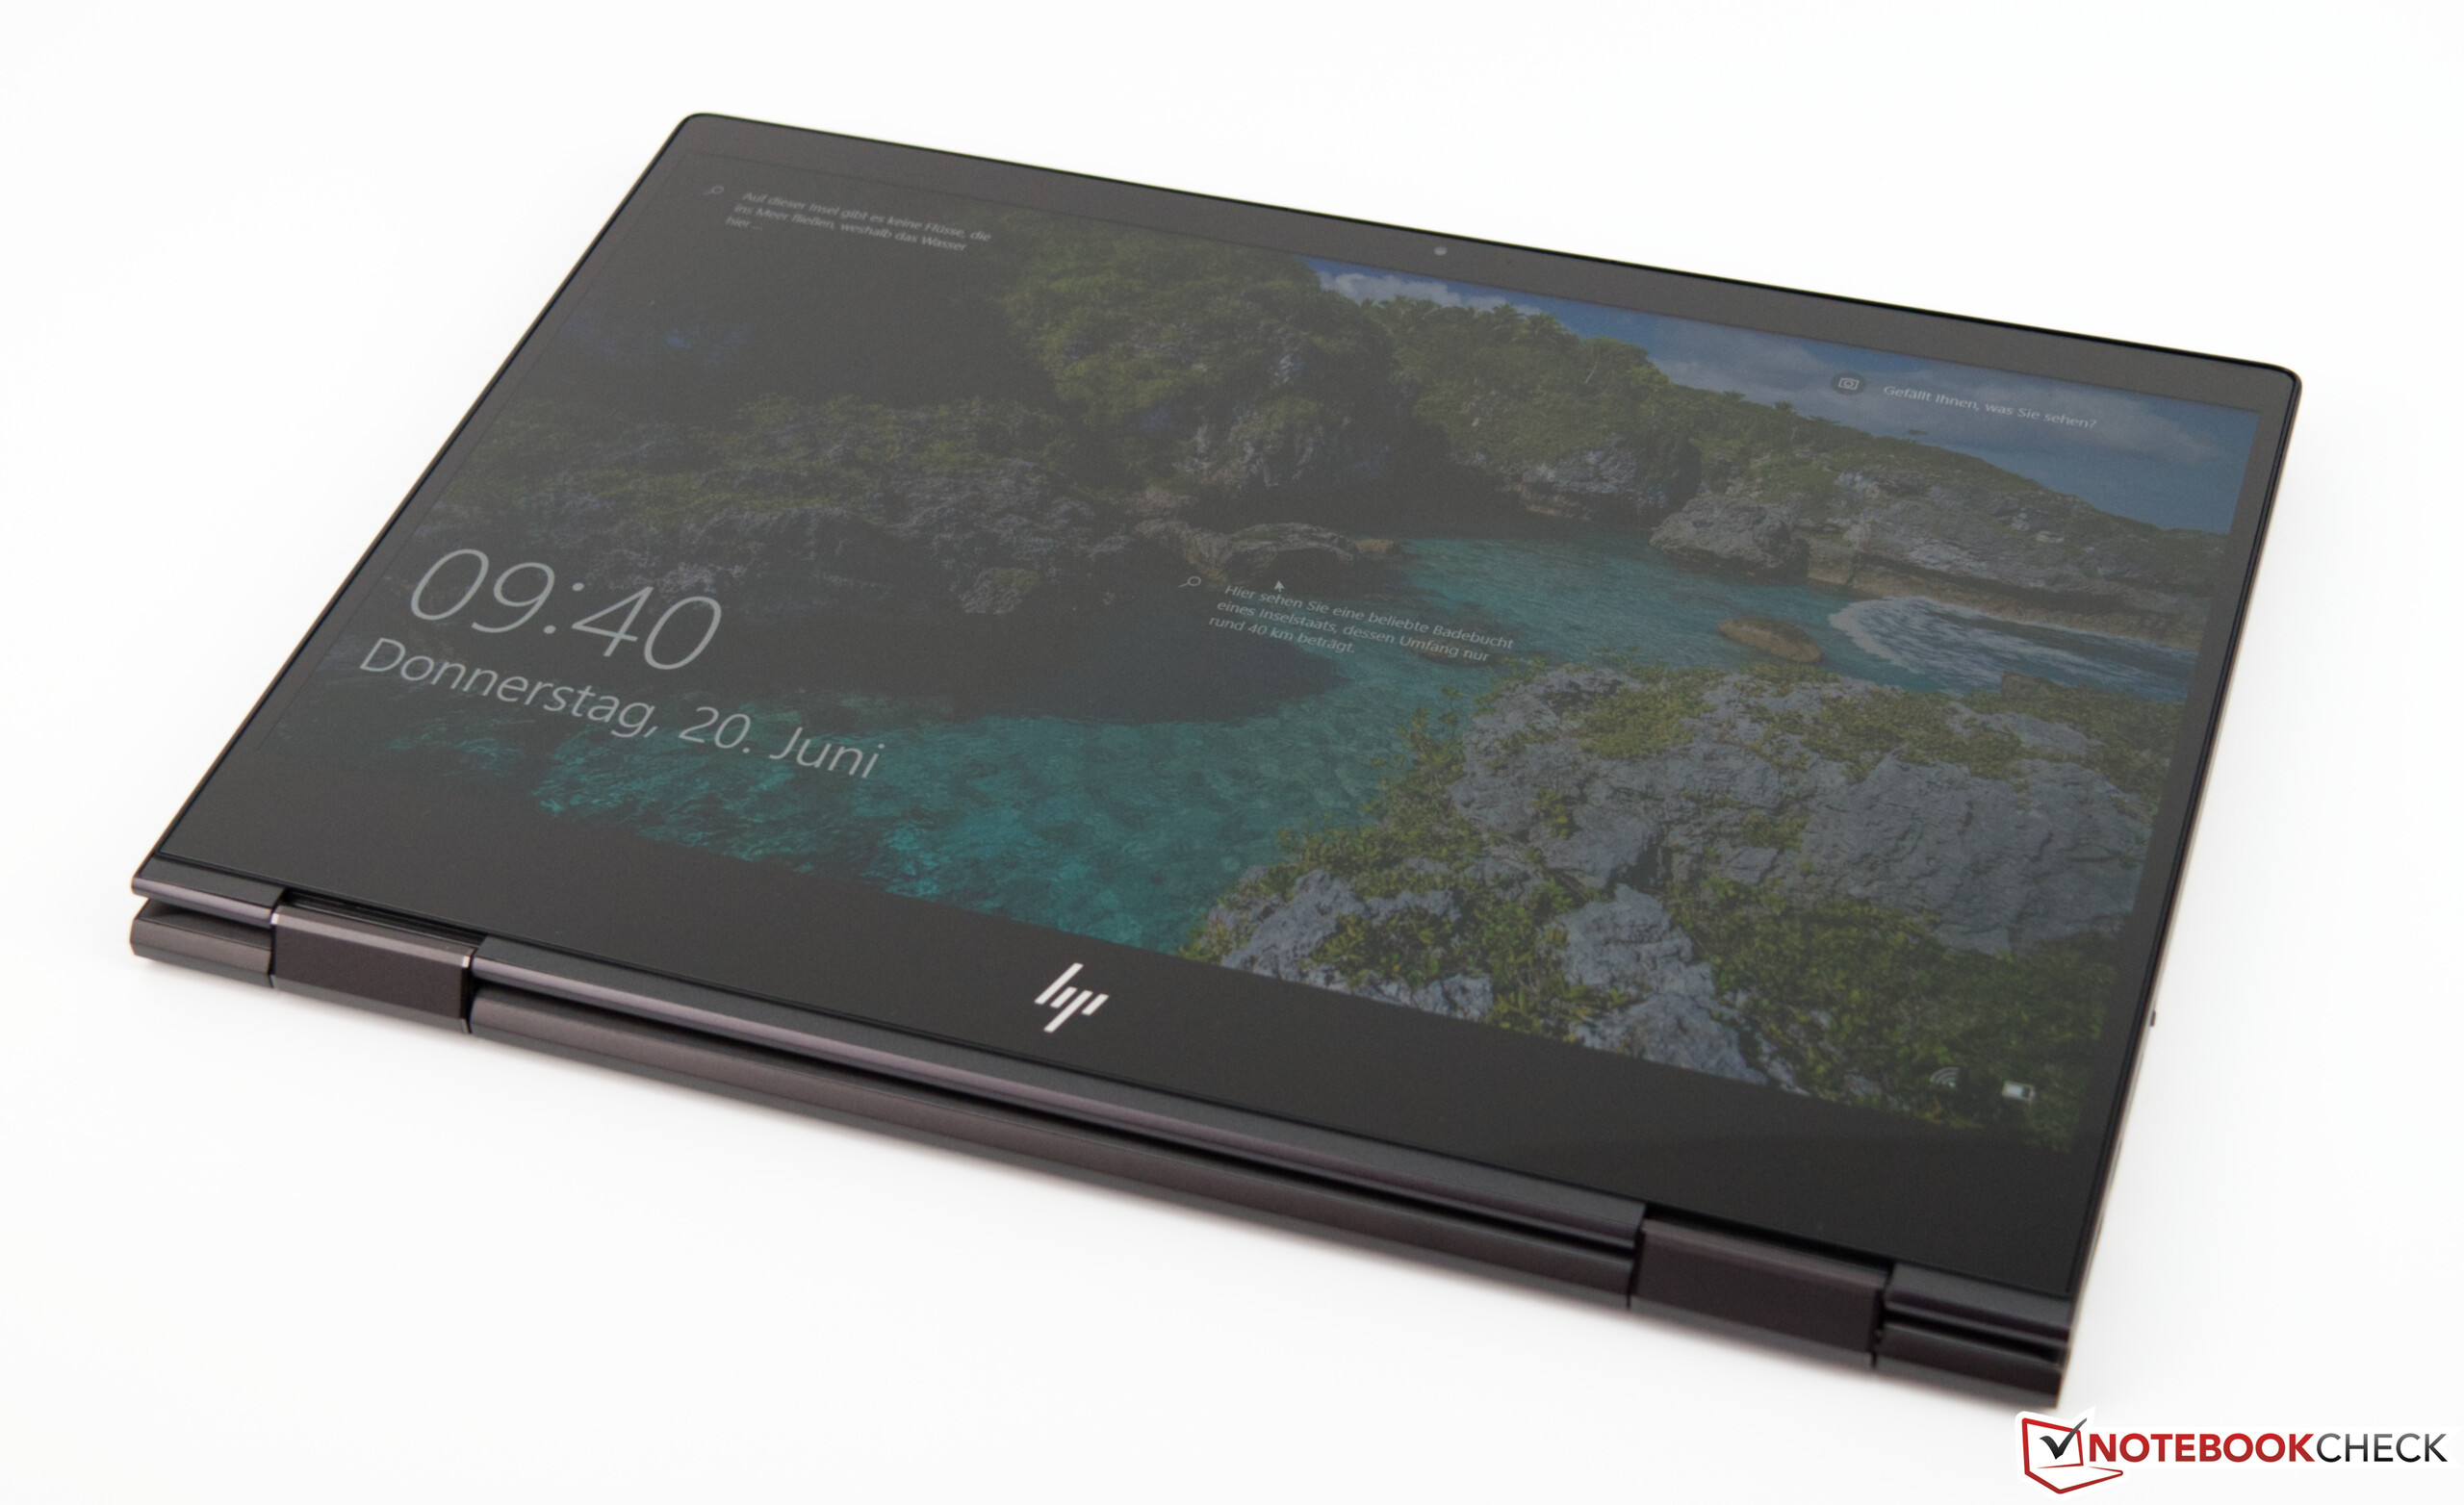
能耗不错和扬声器也可圈可点。具有四个扬声器的设计能提供良好的听觉体验,与所使用的模式(笔记本,支架,平板电脑和帐篷模式)无关。
不幸的是,HP Envy x360 13无法将低功耗转换为长续航。如果没有充电,只有七个小时的电池续航时间都撑不过整个工作日。
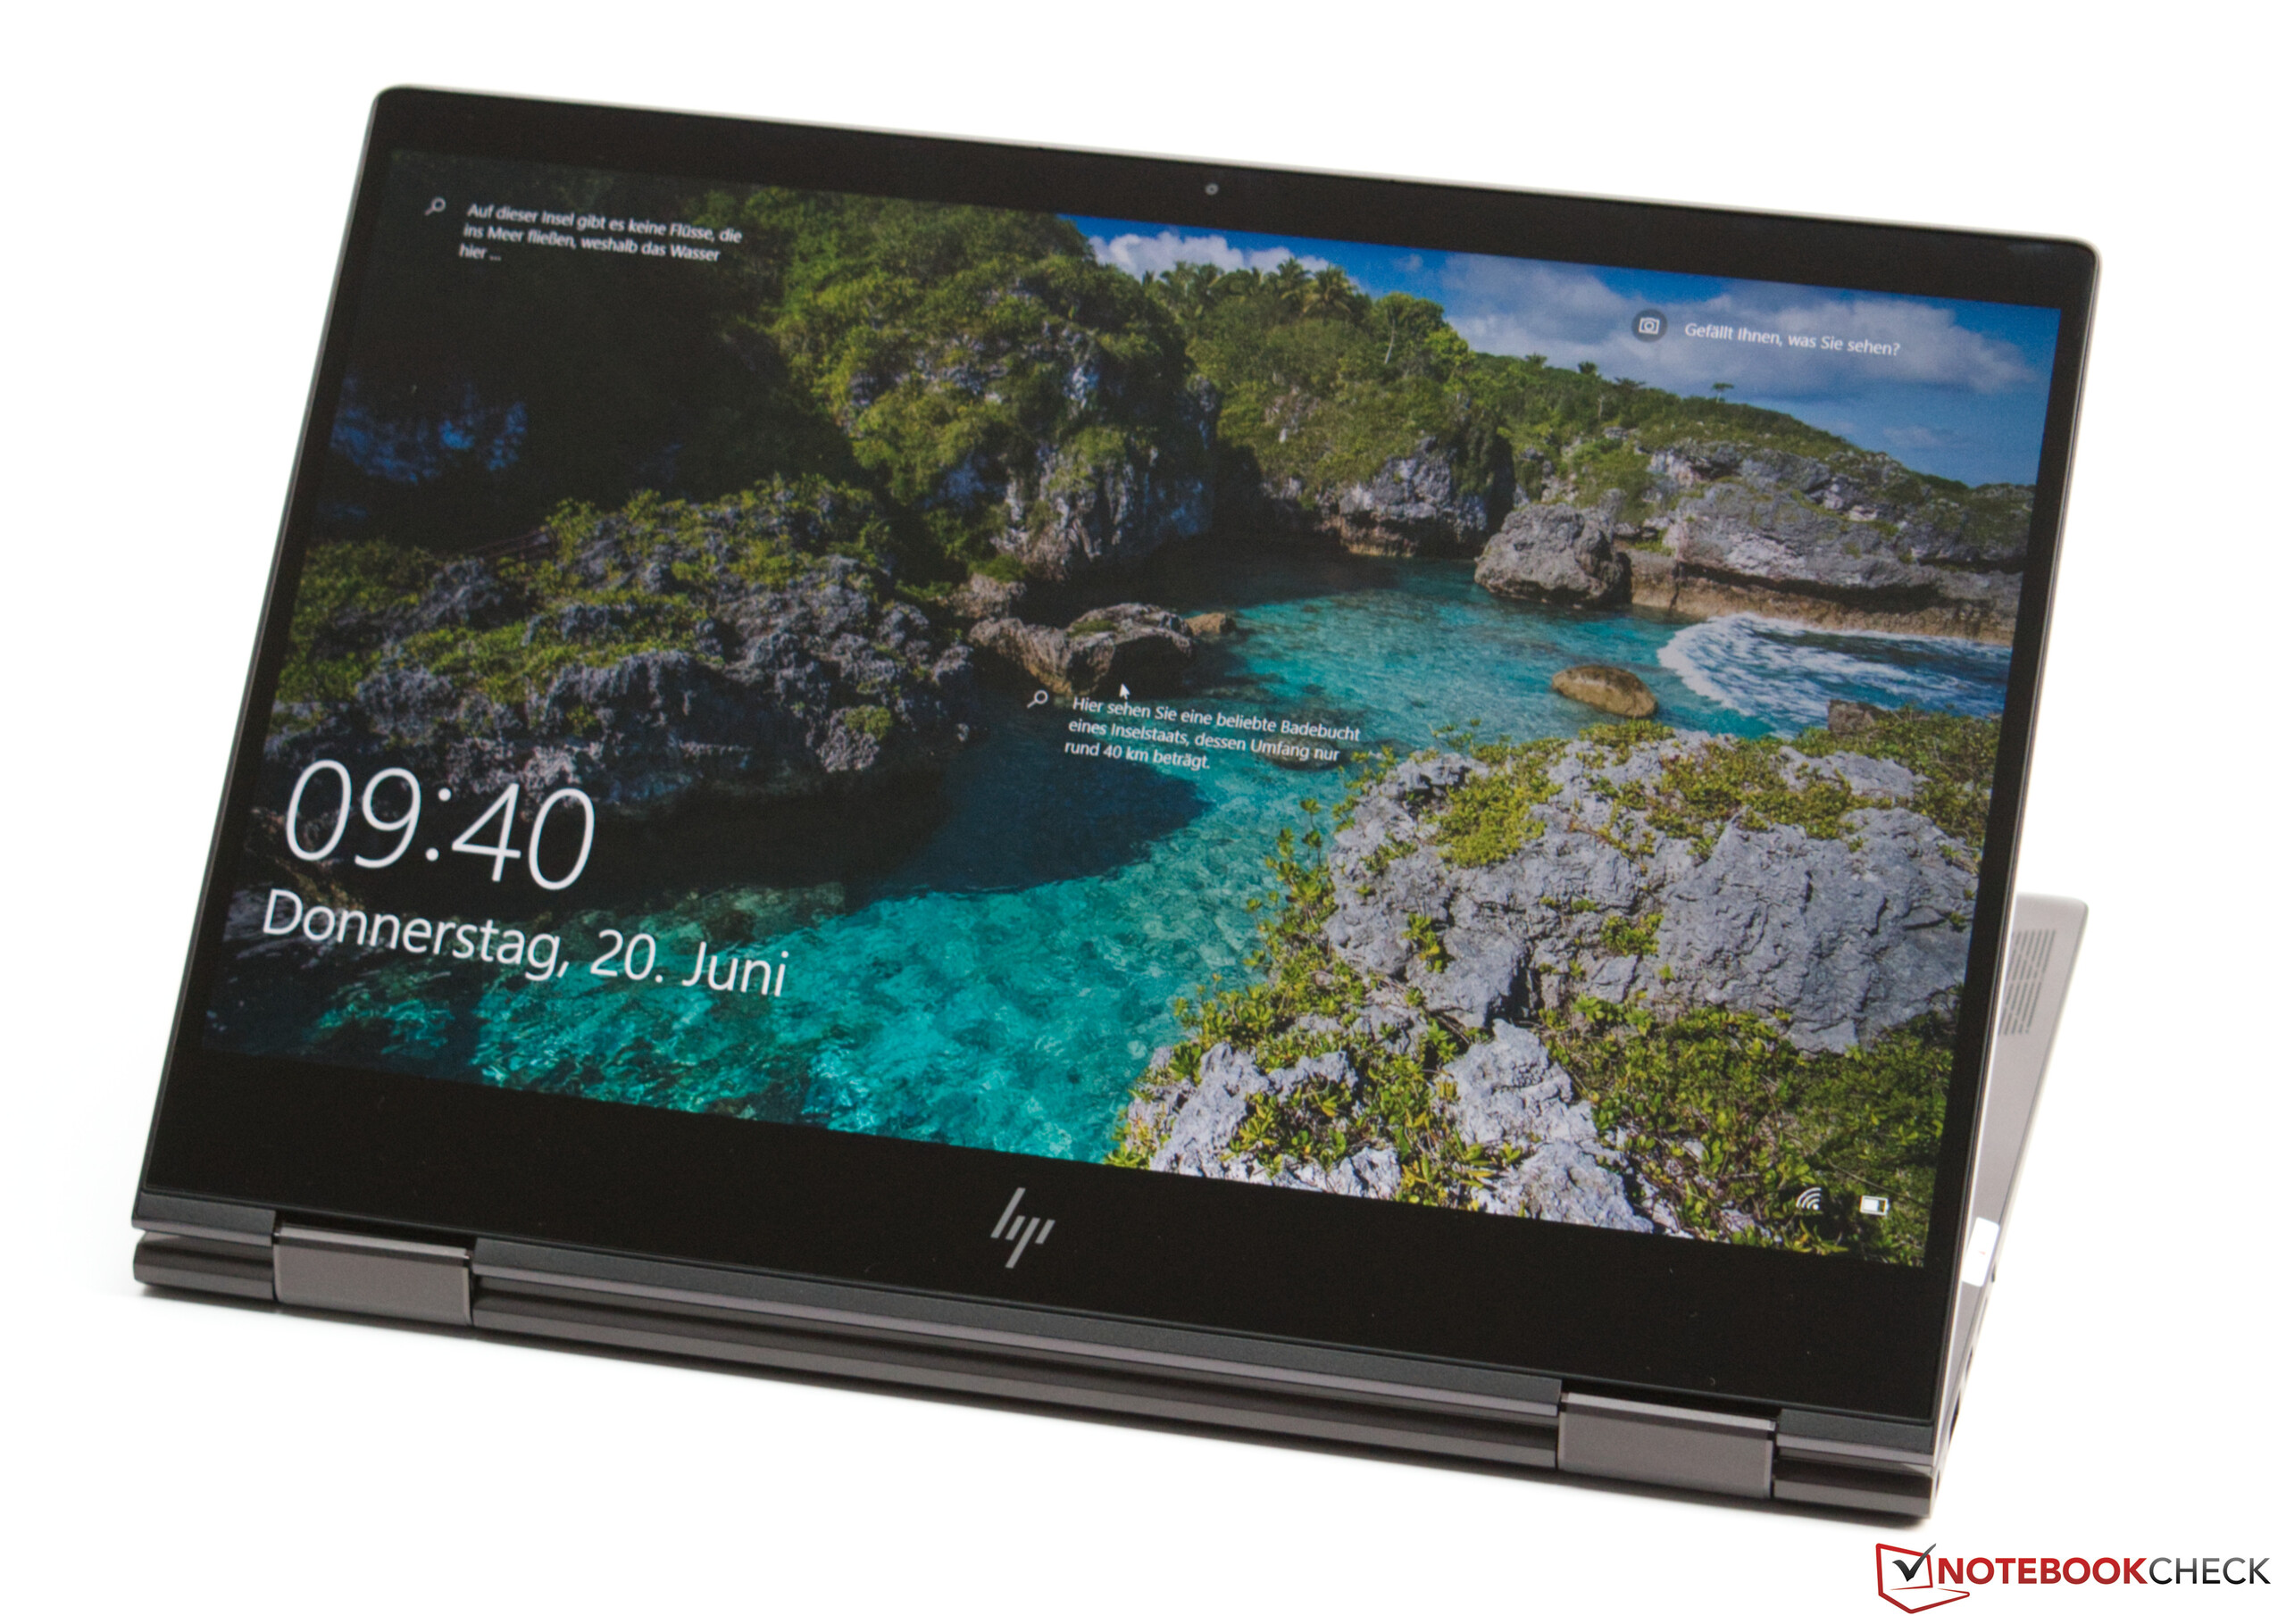
HP Envy x360 13最大的惊喜之一就是120 Hz的出色显示效果。凭借其非常好的亮度和高对比度显示,在该设备上工作可以很有趣。不幸的是,用户在户外工作会有一些限制,因为尽管具有出色的显示亮度,但高反射的显示器表面也会造成其他损失。然而,这块屏幕仍然有值得抱怨的地方,因为Envy x360 13没有对笔的支持。
这款价格实惠的二合一配有AMD CPU和良好的屏幕,这一切都是惠普Envy x360 13所能提供的。
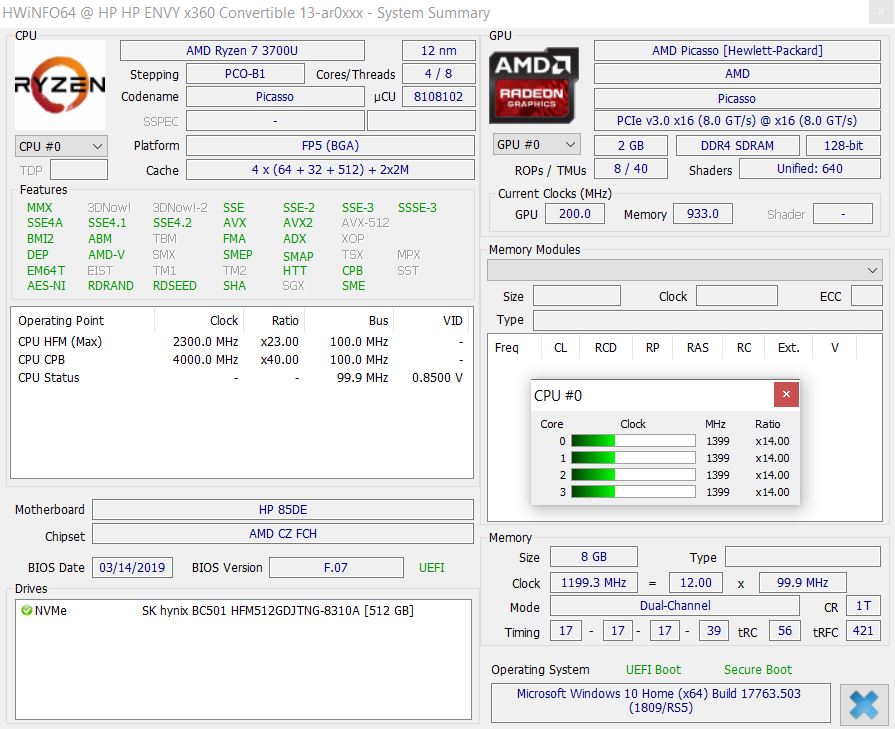
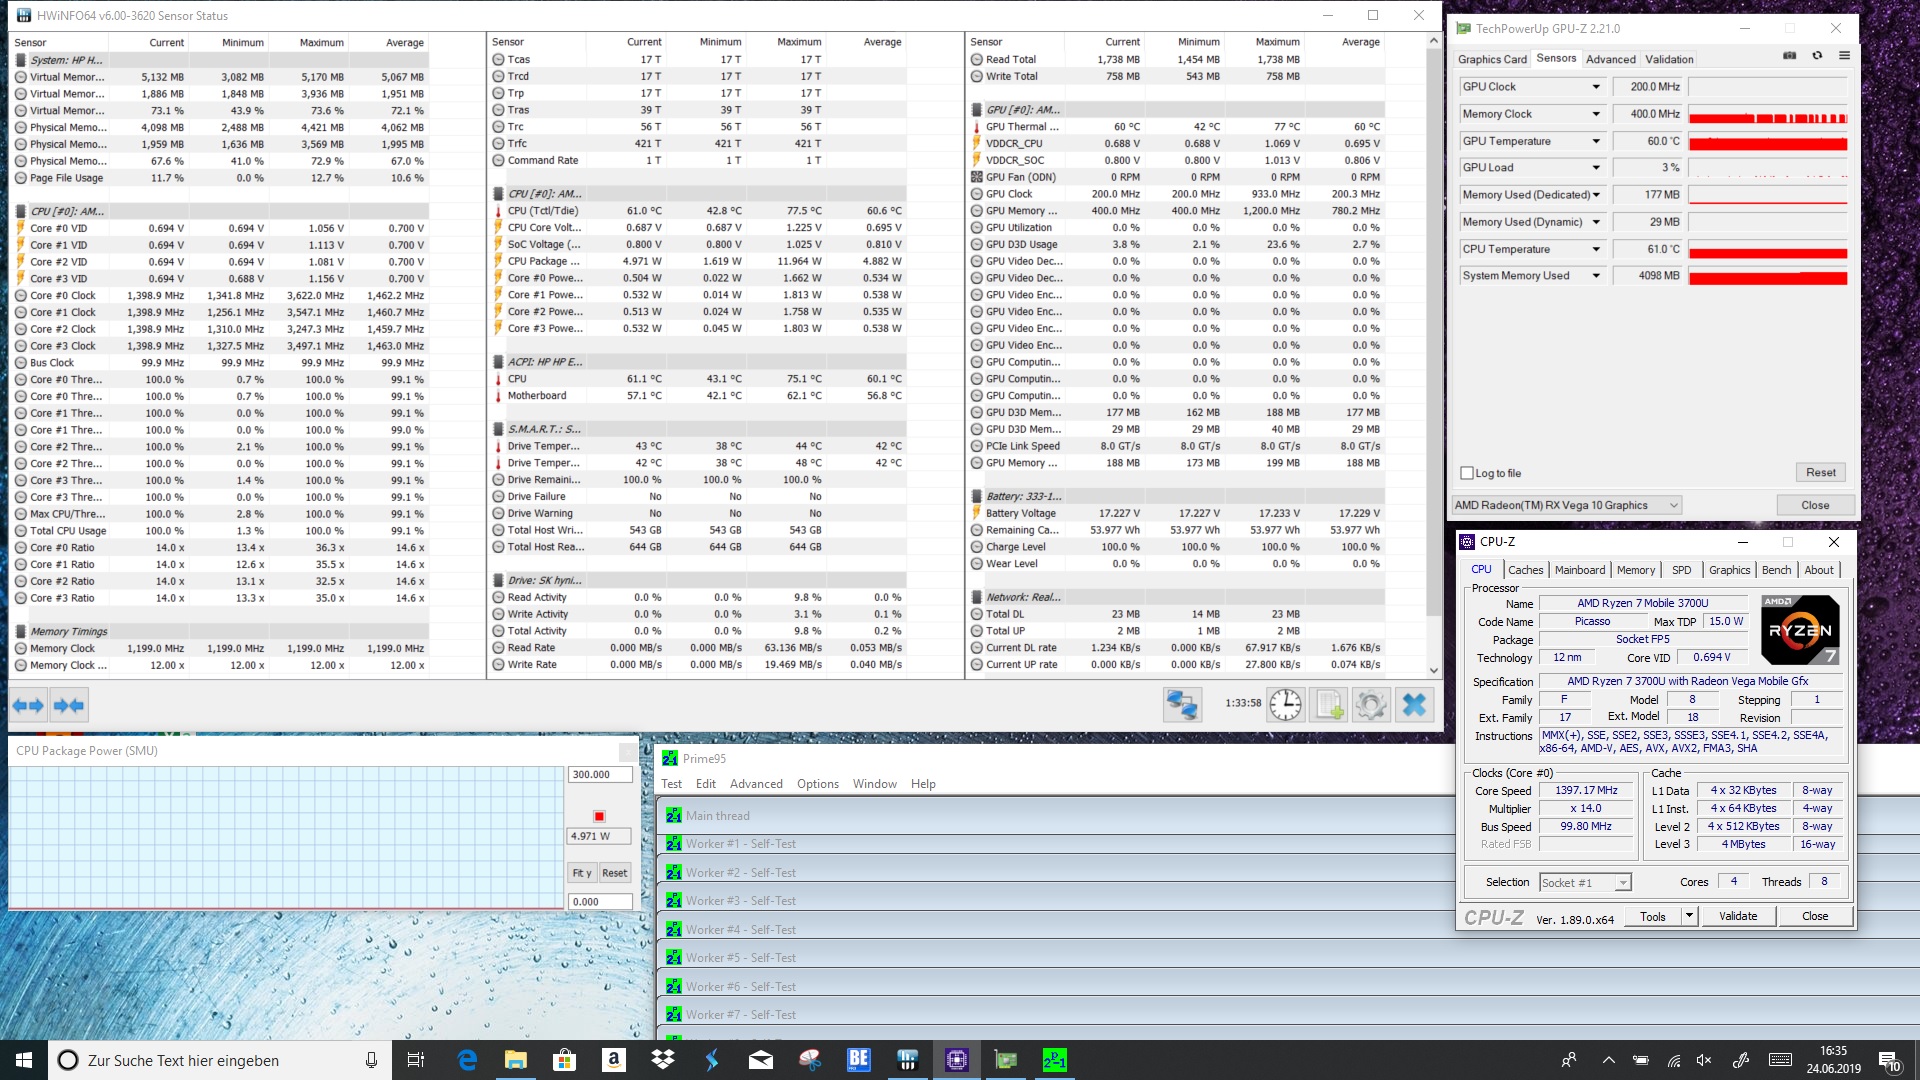
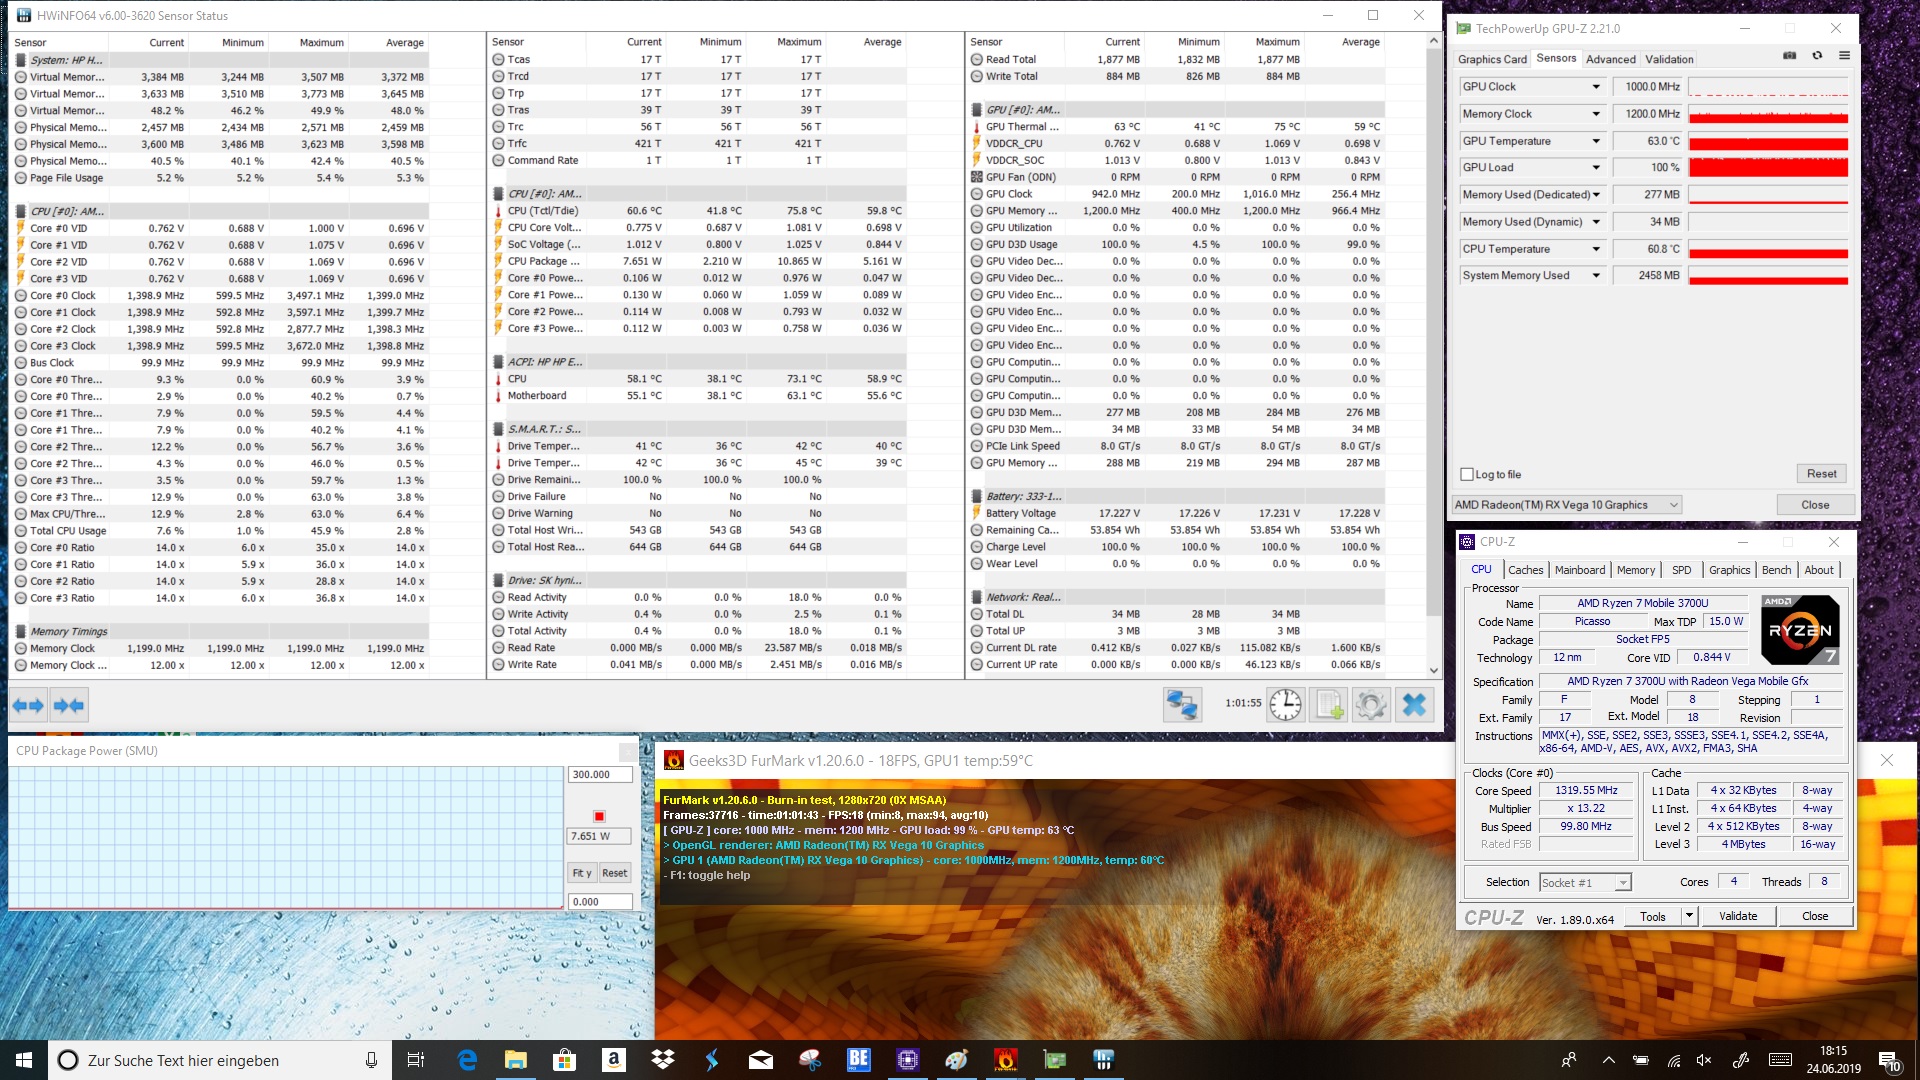
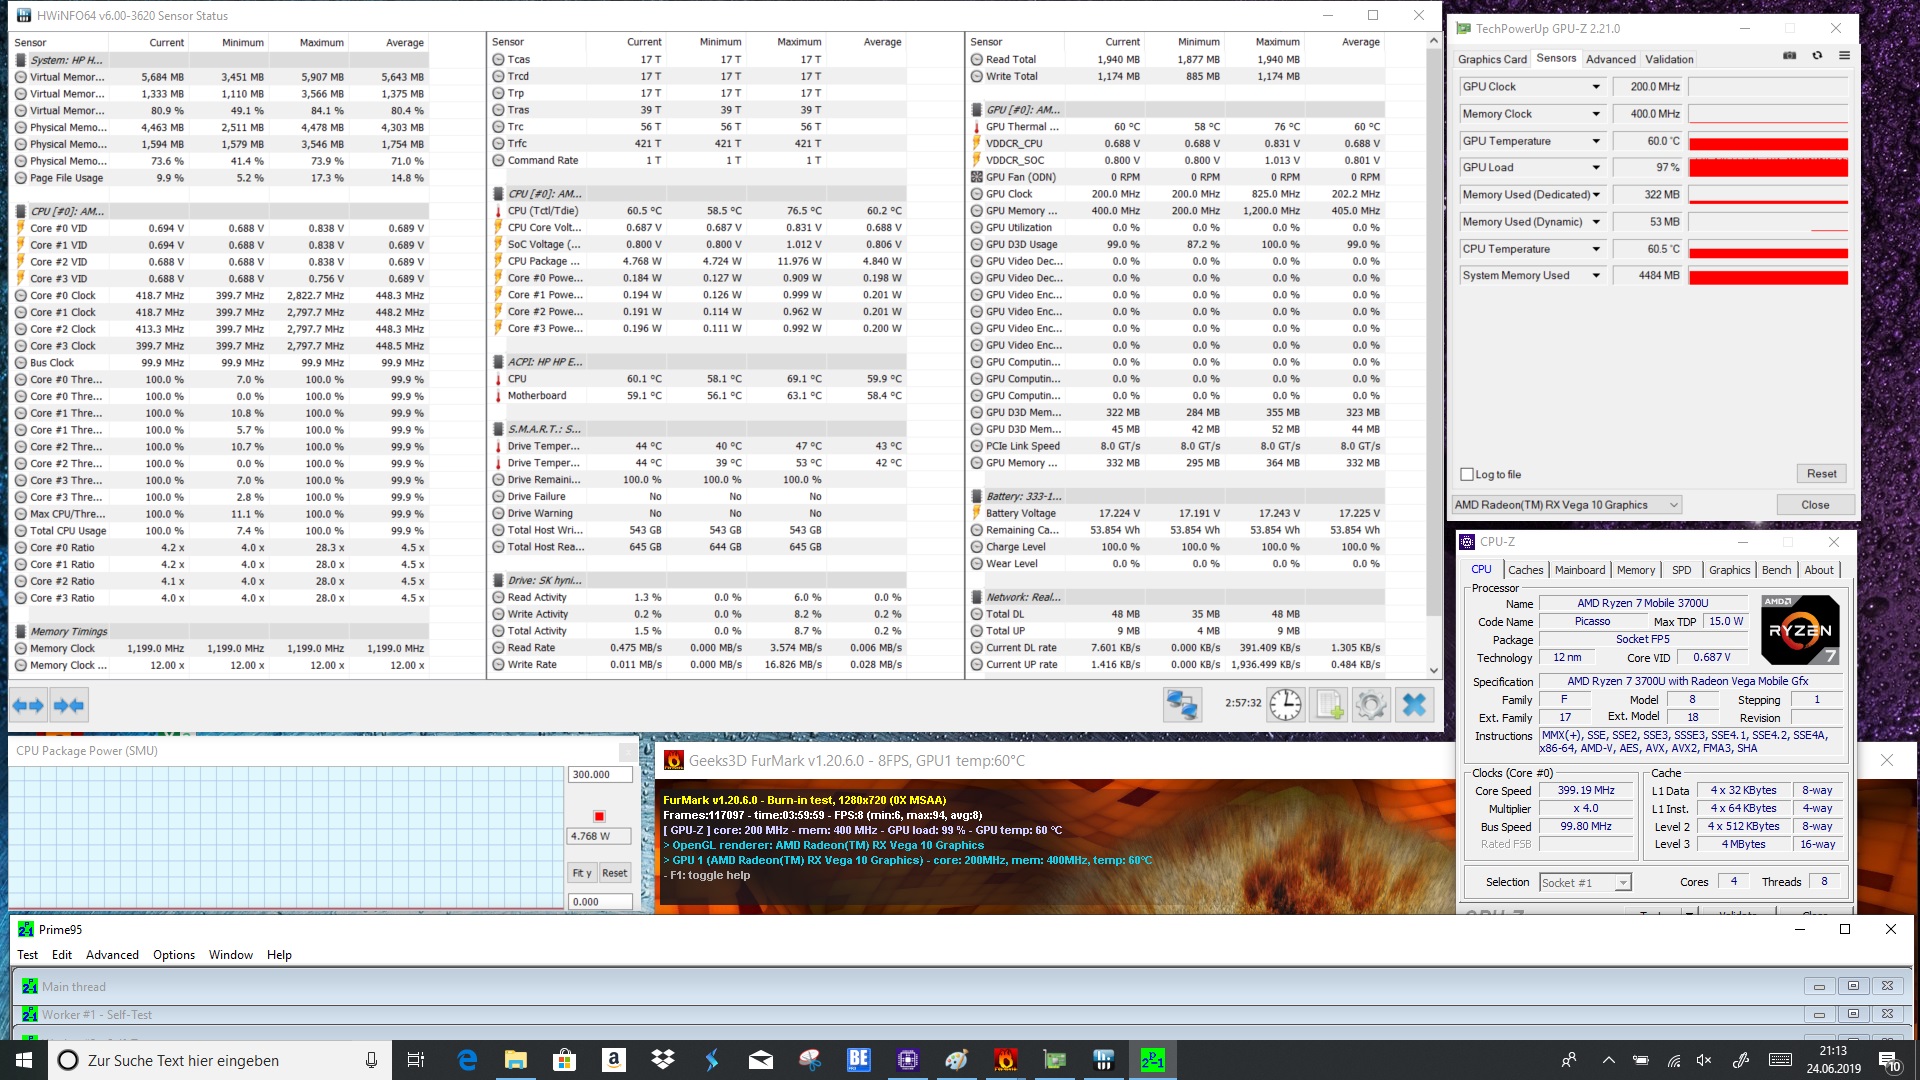
HP Envy x360 13的最大缺点之一是负载下显着降频的AMD APU。但是那些不依赖于持续高性能的人可以很好地适应AMD Ryzen 7 3700U。
HP Envy x360 13-ar0601ng
- 06/28/2019 v6 (old)
Sebastian Bade
Price comparison

