苹果MacBook Pro 2020笔记本电脑评测:苹果的超极本只得到了强制的更新
Rating | Date | Model | Weight | Height | Size | Resolution | Price |
|---|---|---|---|---|---|---|---|
| 92.1 % v7 (old) | 07 / 2020 | Apple MacBook Pro 13 2020 2GHz i5 10th-Gen i5-1038NG7, Iris Plus Graphics G7 (Ice Lake 64 EU) | 1.4 kg | 15.6 mm | 13.30" | 2560x1600 | |
| 90.7 % v7 (old) | 03 / 2020 | Apple MacBook Pro 13 2019 i5 4TB3 i5-8279U, Iris Plus Graphics 655 | 1.4 kg | 14.9 mm | 13.30" | 2560x1600 | |
| 87 % v7 (old) | 04 / 2020 | Acer Swift 3 SF313-52-71Y7 i7-1065G7, Iris Plus Graphics G7 (Ice Lake 64 EU) | 1.2 kg | 16.6 mm | 13.50" | 2256x1504 | |
| 88 % v7 (old) | 06 / 2020 | Dell XPS 13 9300 4K UHD i7-1065G7, Iris Plus Graphics G7 (Ice Lake 64 EU) | 1.2 kg | 14.8 mm | 13.40" | 3840x2400 | |
| 88.4 % v7 (old) | 07 / 2020 | HP Spectre x360 13-aw0013dx i7-1065G7, Iris Plus Graphics G7 (Ice Lake 64 EU) | 1.2 kg | 16.9 mm | 13.30" | 1920x1080 | |
| 84 % v7 (old) | 03 / 2020 | Microsoft Surface Laptop 3 13 Core i5-1035G7 i5-1035G7, Iris Plus Graphics G7 (Ice Lake 64 EU) | 1.3 kg | 14.5 mm | 13.50" | 2256x1504 |

, i5-1038NG7, Apple SSD SM0512F")
, i5-1038NG7, Apple SSD SM0512F")
| |||||||||||||||||||||||||
Brightness Distribution: 91 %
Center on Battery: 510 cd/m²
Contrast: 1600:1 (Black: 0.32 cd/m²)
ΔE ColorChecker Calman: 1.7 | ∀{0.5-29.43 Ø4.72}
calibrated: 1
ΔE Greyscale Calman: 1.9 | ∀{0.09-98 Ø4.97}
99.9% sRGB (Argyll 1.6.3 3D)
77.4% AdobeRGB 1998 (Argyll 1.6.3 3D)
86.4% AdobeRGB 1998 (Argyll 3D)
99.9% sRGB (Argyll 3D)
98.8% Display P3 (Argyll 3D)
Gamma: 2.19
CCT: 6817 K
| Apple MacBook Pro 13 2020 2GHz i5 10th-Gen APPA03D, IPS, 2560x1600, 13.3" | Apple MacBook Pro 13 2019 i5 4TB3 APPA03E, IPS, 2560x1600, 13.3" | Acer Swift 3 SF313-52-71Y7 BOE, NE135FBM-N41, IPS, 2256x1504, 13.5" | Dell XPS 13 9300 4K UHD Sharp LQ134R1, IPS, 3840x2400, 13.4" | HP Spectre x360 13-aw0013dx AU Optronics AUO5E2D, IPS, 1920x1080, 13.3" | Microsoft Surface Laptop 3 13 Core i5-1035G7 Sharp LQ135P1JX51, IPS, 2256x1504, 13.5" | |
|---|---|---|---|---|---|---|
| Display | 1% | -16% | -22% | -16% | -19% | |
| Display P3 Coverage (%) | 98.8 | 98.7 0% | 70.1 -29% | 64.5 -35% | 69.6 -30% | 65.7 -34% |
| sRGB Coverage (%) | 99.9 | 100 0% | 99.8 0% | 91.4 -9% | 98.9 -1% | 98.6 -1% |
| AdobeRGB 1998 Coverage (%) | 86.4 | 87.7 2% | 71.2 -18% | 66.6 -23% | 71.5 -17% | 67.8 -22% |
| Response Times | 8% | -8% | 16% | -23% | -29% | |
| Response Time Grey 50% / Grey 80% * (ms) | 46 ? | 43.2 ? 6% | 55 ? -20% | 41.6 ? 10% | 60.8 ? -32% | 59.2 ? -29% |
| Response Time Black / White * (ms) | 32.4 ? | 29.6 ? 9% | 31 ? 4% | 25.6 ? 21% | 36.8 ? -14% | 41.6 ? -28% |
| PWM Frequency (Hz) | 113600 ? | 208 ? | 21740 ? | |||
| Screen | -14% | -38% | -49% | -58% | 2% | |
| Brightness middle (cd/m²) | 512 | 518 1% | 474 -7% | 414 -19% | 447.4 -13% | 403.4 -21% |
| Brightness (cd/m²) | 491 | 480 -2% | 426 -13% | 401 -18% | 420 -14% | 397 -19% |
| Brightness Distribution (%) | 91 | 87 -4% | 82 -10% | 94 3% | 85 -7% | 89 -2% |
| Black Level * (cd/m²) | 0.32 | 0.34 -6% | 0.29 9% | 0.28 12% | 0.31 3% | 0.34 -6% |
| Contrast (:1) | 1600 | 1524 -5% | 1634 2% | 1479 -8% | 1443 -10% | 1186 -26% |
| Colorchecker dE 2000 * | 1.7 | 1.5 12% | 2.38 -40% | 3.06 -80% | 4.23 -149% | 0.94 45% |
| Colorchecker dE 2000 max. * | 3.4 | 2.8 18% | 5.88 -73% | 6.5 -91% | 9.34 -175% | 2.92 14% |
| Colorchecker dE 2000 calibrated * | 1 | 2.6 -160% | 2.69 -169% | 3.5 -250% | 1.32 -32% | 0.99 1% |
| Greyscale dE 2000 * | 1.9 | 2 -5% | 3.75 -97% | 3 -58% | 6.1 -221% | 0.9 53% |
| Gamma | 2.19 100% | 2.22 99% | 2.37 93% | 2.42 91% | 2.11 104% | 2.13 103% |
| CCT | 6817 95% | 6898 94% | 6466 101% | 6840 95% | 6136 106% | 6620 98% |
| Color Space (Percent of AdobeRGB 1998) (%) | 77.4 | 78.4 1% | 65 -16% | 61.1 -21% | 64.8 -16% | 62.3 -20% |
| Color Space (Percent of sRGB) (%) | 99.9 | 99.9 0% | 100 0% | 91.4 -9% | 98.9 -1% | 98.7 -1% |
| Total Average (Program / Settings) | -2% /
-8% | -21% /
-30% | -18% /
-36% | -32% /
-46% | -15% /
-6% |
* ... smaller is better
Display Response Times
| ↔ Response Time Black to White | ||
|---|---|---|
| 32.4 ms ... rise ↗ and fall ↘ combined | ↗ 18.4 ms rise | 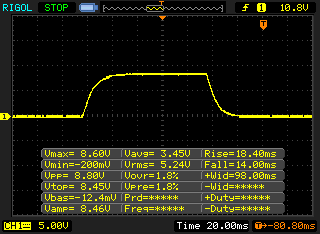 |
| ↘ 14 ms fall | ||
| The screen shows slow response rates in our tests and will be unsatisfactory for gamers. In comparison, all tested devices range from 0.1 (minimum) to 240 (maximum) ms. » 88 % of all devices are better. This means that the measured response time is worse than the average of all tested devices (19.8 ms). | ||
| ↔ Response Time 50% Grey to 80% Grey | ||
| 46 ms ... rise ↗ and fall ↘ combined | ↗ 22 ms rise | 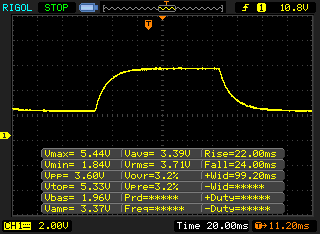 |
| ↘ 24 ms fall | ||
| The screen shows slow response rates in our tests and will be unsatisfactory for gamers. In comparison, all tested devices range from 0.165 (minimum) to 636 (maximum) ms. » 79 % of all devices are better. This means that the measured response time is worse than the average of all tested devices (31 ms). | ||
Screen Flickering / PWM (Pulse-Width Modulation)
| Screen flickering / PWM detected | 113600 Hz | ≤ 75 % brightness setting | 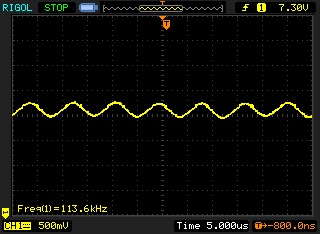 |
The display backlight flickers at 113600 Hz (worst case, e.g., utilizing PWM) Flickering detected at a brightness setting of 75 % and below. There should be no flickering or PWM above this brightness setting. The frequency of 113600 Hz is quite high, so most users sensitive to PWM should not notice any flickering. In comparison: 52 % of all tested devices do not use PWM to dim the display. If PWM was detected, an average of 7753 (minimum: 5 - maximum: 343500) Hz was measured. | |||
Cinebench R15: CPU Single 64Bit | CPU Multi 64Bit
Blender: v2.79 BMW27 CPU
7-Zip 18.03: 7z b 4 -mmt1 | 7z b 4
Geekbench 5.5: Single-Core | Multi-Core
HWBOT x265 Benchmark v2.2: 4k Preset
LibreOffice : 20 Documents To PDF
R Benchmark 2.5: Overall mean
| Cinebench R20 / CPU (Single Core) | |
| Average of class Subnotebook (128 - 832, n=56, last 2 years) | |
| Acer Swift 3 SF314-42-R4XJ | |
| Dell XPS 13 9300 4K UHD | |
| Acer Swift 3 SF313-52-71Y7 | |
| Microsoft Surface Laptop 3 13 Core i5-1035G7 | |
| Apple MacBook Pro 13 2020 2GHz i5 10th-Gen | |
| Average Intel Core i5-1038NG7 (n=1) | |
| Apple MacBook Pro 13 2019 i5 4TB3 | |
| HP Spectre x360 13-aw0013dx | |
| Cinebench R20 / CPU (Multi Core) | |
| Average of class Subnotebook (579 - 8541, n=56, last 2 years) | |
| Acer Swift 3 SF314-42-R4XJ | |
| Apple MacBook Pro 13 2020 2GHz i5 10th-Gen | |
| Average Intel Core i5-1038NG7 (n=1) | |
| Apple MacBook Pro 13 2019 i5 4TB3 | |
| HP Spectre x360 13-aw0013dx | |
| Microsoft Surface Laptop 3 13 Core i5-1035G7 | |
| Dell XPS 13 9300 4K UHD | |
| Acer Swift 3 SF313-52-71Y7 | |
| Cinebench R15 / CPU Single 64Bit | |
| Average of class Subnotebook (72.4 - 322, n=56, last 2 years) | |
| Dell XPS 13 9300 4K UHD | |
| Acer Swift 3 SF314-42-R4XJ | |
| HP Spectre x360 13-aw0013dx | |
| Acer Swift 3 SF313-52-71Y7 | |
| Microsoft Surface Laptop 3 13 Core i5-1035G7 | |
| Apple MacBook Pro 13 2019 i5 4TB3 | |
| Apple MacBook Pro 13 2019 i5 4TB3 | |
| Apple MacBook Pro 13 2020 2GHz i5 10th-Gen | |
| Average Intel Core i5-1038NG7 (n=1) | |
| Cinebench R15 / CPU Multi 64Bit | |
| Average of class Subnotebook (327 - 3345, n=56, last 2 years) | |
| Acer Swift 3 SF314-42-R4XJ | |
| Apple MacBook Pro 13 2020 2GHz i5 10th-Gen | |
| Average Intel Core i5-1038NG7 (n=1) | |
| Dell XPS 13 9300 4K UHD | |
| Apple MacBook Pro 13 2019 i5 4TB3 | |
| Apple MacBook Pro 13 2019 i5 4TB3 | |
| Microsoft Surface Laptop 3 13 Core i5-1035G7 | |
| HP Spectre x360 13-aw0013dx | |
| Acer Swift 3 SF313-52-71Y7 | |
| Blender / v2.79 BMW27 CPU | |
| Acer Swift 3 SF313-52-71Y7 | |
| Microsoft Surface Laptop 3 13 Core i5-1035G7 | |
| Dell XPS 13 9300 4K UHD | |
| Apple MacBook Pro 13 2019 i5 4TB3 | |
| Acer Swift 3 SF314-42-R4XJ | |
| Average of class Subnotebook (159 - 2271, n=57, last 2 years) | |
| Apple MacBook Pro 13 2020 2GHz i5 10th-Gen | |
| Average Intel Core i5-1038NG7 (n=1) | |
| 7-Zip 18.03 / 7z b 4 -mmt1 | |
| Average of class Subnotebook (2643 - 6699, n=58, last 2 years) | |
| Dell XPS 13 9300 4K UHD | |
| Acer Swift 3 SF313-52-71Y7 | |
| Acer Swift 3 SF314-42-R4XJ | |
| Apple MacBook Pro 13 2019 i5 4TB3 | |
| Microsoft Surface Laptop 3 13 Core i5-1035G7 | |
| Apple MacBook Pro 13 2020 2GHz i5 10th-Gen | |
| Average Intel Core i5-1038NG7 (n=1) | |
| 7-Zip 18.03 / 7z b 4 | |
| Average of class Subnotebook (11668 - 77867, n=56, last 2 years) | |
| Acer Swift 3 SF314-42-R4XJ | |
| Apple MacBook Pro 13 2019 i5 4TB3 | |
| Dell XPS 13 9300 4K UHD | |
| Apple MacBook Pro 13 2020 2GHz i5 10th-Gen | |
| Average Intel Core i5-1038NG7 (n=1) | |
| Microsoft Surface Laptop 3 13 Core i5-1035G7 | |
| Acer Swift 3 SF313-52-71Y7 | |
| Geekbench 5.5 / Single-Core | |
| Average of class Subnotebook (726 - 2224, n=47, last 2 years) | |
| Dell XPS 13 9300 4K UHD | |
| Acer Swift 3 SF313-52-71Y7 | |
| Apple MacBook Pro 13 2020 2GHz i5 10th-Gen | |
| Average Intel Core i5-1038NG7 (n=1) | |
| Acer Swift 3 SF314-42-R4XJ | |
| Geekbench 5.5 / Multi-Core | |
| Average of class Subnotebook (2557 - 17218, n=47, last 2 years) | |
| Dell XPS 13 9300 4K UHD | |
| Acer Swift 3 SF314-42-R4XJ | |
| Apple MacBook Pro 13 2020 2GHz i5 10th-Gen | |
| Average Intel Core i5-1038NG7 (n=1) | |
| Acer Swift 3 SF313-52-71Y7 | |
| HWBOT x265 Benchmark v2.2 / 4k Preset | |
| Average of class Subnotebook (0.97 - 25.1, n=56, last 2 years) | |
| Acer Swift 3 SF314-42-R4XJ | |
| Dell XPS 13 9300 4K UHD | |
| Apple MacBook Pro 13 2019 i5 4TB3 | |
| Apple MacBook Pro 13 2020 2GHz i5 10th-Gen | |
| Average Intel Core i5-1038NG7 (n=1) | |
| Acer Swift 3 SF313-52-71Y7 | |
| Microsoft Surface Laptop 3 13 Core i5-1035G7 | |
| LibreOffice / 20 Documents To PDF | |
| Apple MacBook Pro 13 2020 2GHz i5 10th-Gen | |
| Average Intel Core i5-1038NG7 (n=1) | |
| Dell XPS 13 9300 4K UHD | |
| Acer Swift 3 SF314-42-R4XJ | |
| Average of class Subnotebook (39.9 - 220, n=55, last 2 years) | |
| R Benchmark 2.5 / Overall mean | |
| Apple MacBook Pro 13 2020 2GHz i5 10th-Gen | |
| Average Intel Core i5-1038NG7 (n=1) | |
| Acer Swift 3 SF313-52-71Y7 | |
| Dell XPS 13 9300 4K UHD | |
| Acer Swift 3 SF314-42-R4XJ | |
| Average of class Subnotebook (0.4024 - 1.456, n=57, last 2 years) | |
* ... smaller is better
| PCMark 8 Home Score Accelerated v2 | 3928 points | |
| PCMark 8 Creative Score Accelerated v2 | 5715 points | |
| PCMark 8 Work Score Accelerated v2 | 2407 points | |
| PCMark 10 Score | 3222 points | |
Help | ||

| 3DMark 06 Standard Score | 17100 points | |
| 3DMark 11 Performance | 4683 points | |
| 3DMark Ice Storm Standard Score | 56619 points | |
| 3DMark Cloud Gate Standard Score | 12647 points | |
| 3DMark Fire Strike Score | 2680 points | |
| 3DMark Fire Strike Extreme Score | 1329 points | |
| 3DMark Time Spy Score | 932 points | |
Help | ||
| low | med. | high | ultra | |
|---|---|---|---|---|
| The Witcher 3 (2015) | 54.2 | 33.1 | 18 | |
| Dota 2 Reborn (2015) | 94.7 | 62.8 | 38.5 | 35.7 |
| X-Plane 11.11 (2018) | 25.9 | 11.7 | 10.9 | |
| Far Cry 5 (2018) | 26 | 12 | ||
| F1 2019 (2019) | 62 | 27 | 25 | 21 |
Noise level
| Idle |
| 29.6 / 29.6 / 29.6 dB(A) |
| Load |
| 34.4 / 42.1 dB(A) |
 | ||
30 dB silent 40 dB(A) audible 50 dB(A) loud |
||
min: | ||
| Apple MacBook Pro 13 2020 2GHz i5 10th-Gen Iris Plus Graphics G7 (Ice Lake 64 EU), i5-1038NG7, Apple SSD SM0512F | Apple MacBook Pro 13 2019 i5 4TB3 Iris Plus Graphics 655, i5-8279U, Apple SSD AP0512 | Acer Swift 3 SF313-52-71Y7 Iris Plus Graphics G7 (Ice Lake 64 EU), i7-1065G7, Intel SSD 660p 1TB SSDPEKNW010T8 | Dell XPS 13 9300 4K UHD Iris Plus Graphics G7 (Ice Lake 64 EU), i7-1065G7, Intel SSDPEMKF512G8 NVMe SSD | HP Spectre x360 13-aw0013dx Iris Plus Graphics G7 (Ice Lake 64 EU), i7-1065G7, Intel Optane Memory H10 with Solid State Storage 32GB + 512GB HBRPEKNX0202A(L/H) | Microsoft Surface Laptop 3 13 Core i5-1035G7 Iris Plus Graphics G7 (Ice Lake 64 EU), i5-1035G7, SK hynix BC501 HFM256GDGTNG | |
|---|---|---|---|---|---|---|
| Noise | 2% | 4% | 0% | 7% | 4% | |
| off / environment * (dB) | 29.6 | 29 2% | 30.3 -2% | 29 2% | 28.5 4% | 28.5 4% |
| Idle Minimum * (dB) | 29.6 | 29 2% | 30.3 -2% | 29 2% | 28.5 4% | 28.5 4% |
| Idle Average * (dB) | 29.6 | 29 2% | 30.3 -2% | 29 2% | 28.5 4% | 28.5 4% |
| Idle Maximum * (dB) | 29.6 | 29 2% | 30.3 -2% | 29 2% | 28.5 4% | 28.5 4% |
| Load Average * (dB) | 34.4 | 33.9 1% | 31.7 8% | 33.5 3% | 28.5 17% | 28.5 17% |
| Witcher 3 ultra * (dB) | 36.1 | 40.5 -12% | 35.3 2% | 40.4 -12% | ||
| Load Maximum * (dB) | 42.1 | 41.8 1% | 32.7 22% | 40.5 4% | 35.3 16% | 40.4 4% |
* ... smaller is better
(±) The maximum temperature on the upper side is 40.7 °C / 105 F, compared to the average of 35.9 °C / 97 F, ranging from 21.4 to 59 °C for the class Subnotebook.
(+) The bottom heats up to a maximum of 39.4 °C / 103 F, compared to the average of 39.2 °C / 103 F
(+) In idle usage, the average temperature for the upper side is 24.2 °C / 76 F, compared to the device average of 30.8 °C / 87 F.
(+) The palmrests and touchpad are cooler than skin temperature with a maximum of 27 °C / 80.6 F and are therefore cool to the touch.
(±) The average temperature of the palmrest area of similar devices was 28.2 °C / 82.8 F (+1.2 °C / 2.2 F).
Apple MacBook Pro 13 2020 2GHz i5 10th-Gen audio analysis
(±) | speaker loudness is average but good (80.1 dB)
Bass 100 - 315 Hz
(±) | reduced bass - on average 8.7% lower than median
(+) | bass is linear (5.7% delta to prev. frequency)
Mids 400 - 2000 Hz
(+) | balanced mids - only 2% away from median
(+) | mids are linear (3.4% delta to prev. frequency)
Highs 2 - 16 kHz
(+) | balanced highs - only 3.4% away from median
(+) | highs are linear (4.2% delta to prev. frequency)
Overall 100 - 16.000 Hz
(+) | overall sound is linear (11.7% difference to median)
Compared to same class
» 13% of all tested devices in this class were better, 3% similar, 84% worse
» The best had a delta of 5%, average was 18%, worst was 53%
Compared to all devices tested
» 8% of all tested devices were better, 3% similar, 89% worse
» The best had a delta of 4%, average was 23%, worst was 134%
Microsoft Surface Laptop 3 13 Core i5-1035G7 audio analysis
(±) | speaker loudness is average but good (79 dB)
Bass 100 - 315 Hz
(+) | good bass - only 4.2% away from median
(±) | linearity of bass is average (10.5% delta to prev. frequency)
Mids 400 - 2000 Hz
(+) | balanced mids - only 3.6% away from median
(±) | linearity of mids is average (7.1% delta to prev. frequency)
Highs 2 - 16 kHz
(+) | balanced highs - only 1.8% away from median
(+) | highs are linear (6.5% delta to prev. frequency)
Overall 100 - 16.000 Hz
(+) | overall sound is linear (11.4% difference to median)
Compared to same class
» 3% of all tested devices in this class were better, 2% similar, 95% worse
» The best had a delta of 7%, average was 21%, worst was 53%
Compared to all devices tested
» 7% of all tested devices were better, 2% similar, 91% worse
» The best had a delta of 4%, average was 23%, worst was 134%
| Off / Standby | |
| Idle | |
| Load |
|
Key:
min: | |
| Apple MacBook Pro 13 2020 2GHz i5 10th-Gen i5-1038NG7, Iris Plus Graphics G7 (Ice Lake 64 EU), Apple SSD SM0512F, IPS, 2560x1600, 13.3" | Apple MacBook Pro 13 2019 i5 4TB3 i5-8279U, Iris Plus Graphics 655, Apple SSD AP0512, IPS, 2560x1600, 13.3" | Acer Swift 3 SF313-52-71Y7 i7-1065G7, Iris Plus Graphics G7 (Ice Lake 64 EU), Intel SSD 660p 1TB SSDPEKNW010T8, IPS, 2256x1504, 13.5" | Dell XPS 13 9300 4K UHD i7-1065G7, Iris Plus Graphics G7 (Ice Lake 64 EU), Intel SSDPEMKF512G8 NVMe SSD, IPS, 3840x2400, 13.4" | HP Spectre x360 13-aw0013dx i7-1065G7, Iris Plus Graphics G7 (Ice Lake 64 EU), Intel Optane Memory H10 with Solid State Storage 32GB + 512GB HBRPEKNX0202A(L/H), IPS, 1920x1080, 13.3" | Microsoft Surface Laptop 3 13 Core i5-1035G7 i5-1035G7, Iris Plus Graphics G7 (Ice Lake 64 EU), SK hynix BC501 HFM256GDGTNG, IPS, 2256x1504, 13.5" | Average Intel Iris Plus Graphics G7 (Ice Lake 64 EU) | Average of class Subnotebook | |
|---|---|---|---|---|---|---|---|---|
| Power Consumption | 15% | 49% | 4% | 25% | 10% | 14% | 14% | |
| Idle Minimum * (Watt) | 3.8 | 2.2 42% | 1.8 53% | 5.3 -39% | 3.9 -3% | 4.4 -16% | 3.91 ? -3% | 3.78 ? 1% |
| Idle Average * (Watt) | 8.6 | 7.2 16% | 4.6 47% | 7.8 9% | 6.3 27% | 7.5 13% | 7.33 ? 15% | 6.57 ? 24% |
| Idle Maximum * (Watt) | 10.3 | 8.2 20% | 6.1 41% | 9.8 5% | 6.8 34% | 7.8 24% | 9.16 ? 11% | 7.94 ? 23% |
| Load Average * (Watt) | 52.1 | 54 -4% | 27.4 47% | 46 12% | 32.6 37% | 41.9 20% | 39.2 ? 25% | 41.9 ? 20% |
| Witcher 3 ultra * (Watt) | 48.2 | 43 11% | 25.6 47% | 40.8 15% | ||||
| Load Maximum * (Watt) | 65.2 | 63.9 2% | 27 59% | 48.3 26% | 59 10% | 63.9 2% | 49.8 ? 24% | 64.4 ? 1% |
* ... smaller is better
| Apple MacBook Pro 13 2020 2GHz i5 10th-Gen i5-1038NG7, Iris Plus Graphics G7 (Ice Lake 64 EU), 58 Wh | Apple MacBook Pro 13 2019 i5 4TB3 i5-8279U, Iris Plus Graphics 655, 58 Wh | Acer Swift 3 SF313-52-71Y7 i7-1065G7, Iris Plus Graphics G7 (Ice Lake 64 EU), 54.5 Wh | Dell XPS 13 9300 4K UHD i7-1065G7, Iris Plus Graphics G7 (Ice Lake 64 EU), 52 Wh | HP Spectre x360 13-aw0013dx i7-1065G7, Iris Plus Graphics G7 (Ice Lake 64 EU), 60 Wh | Microsoft Surface Laptop 3 13 Core i5-1035G7 i5-1035G7, Iris Plus Graphics G7 (Ice Lake 64 EU), 45 Wh | Average of class Subnotebook | |
|---|---|---|---|---|---|---|---|
| Battery runtime | -1% | -12% | -6% | -18% | -31% | 25% | |
| H.264 (h) | 11.5 | 12 4% | 10.5 -9% | 15.4 ? 34% | |||
| WiFi v1.3 (h) | 12.1 | 11.5 -5% | 10.3 -15% | 11.4 -6% | 9.9 -18% | 8.3 -31% | 14 ? 16% |
Pros
Cons
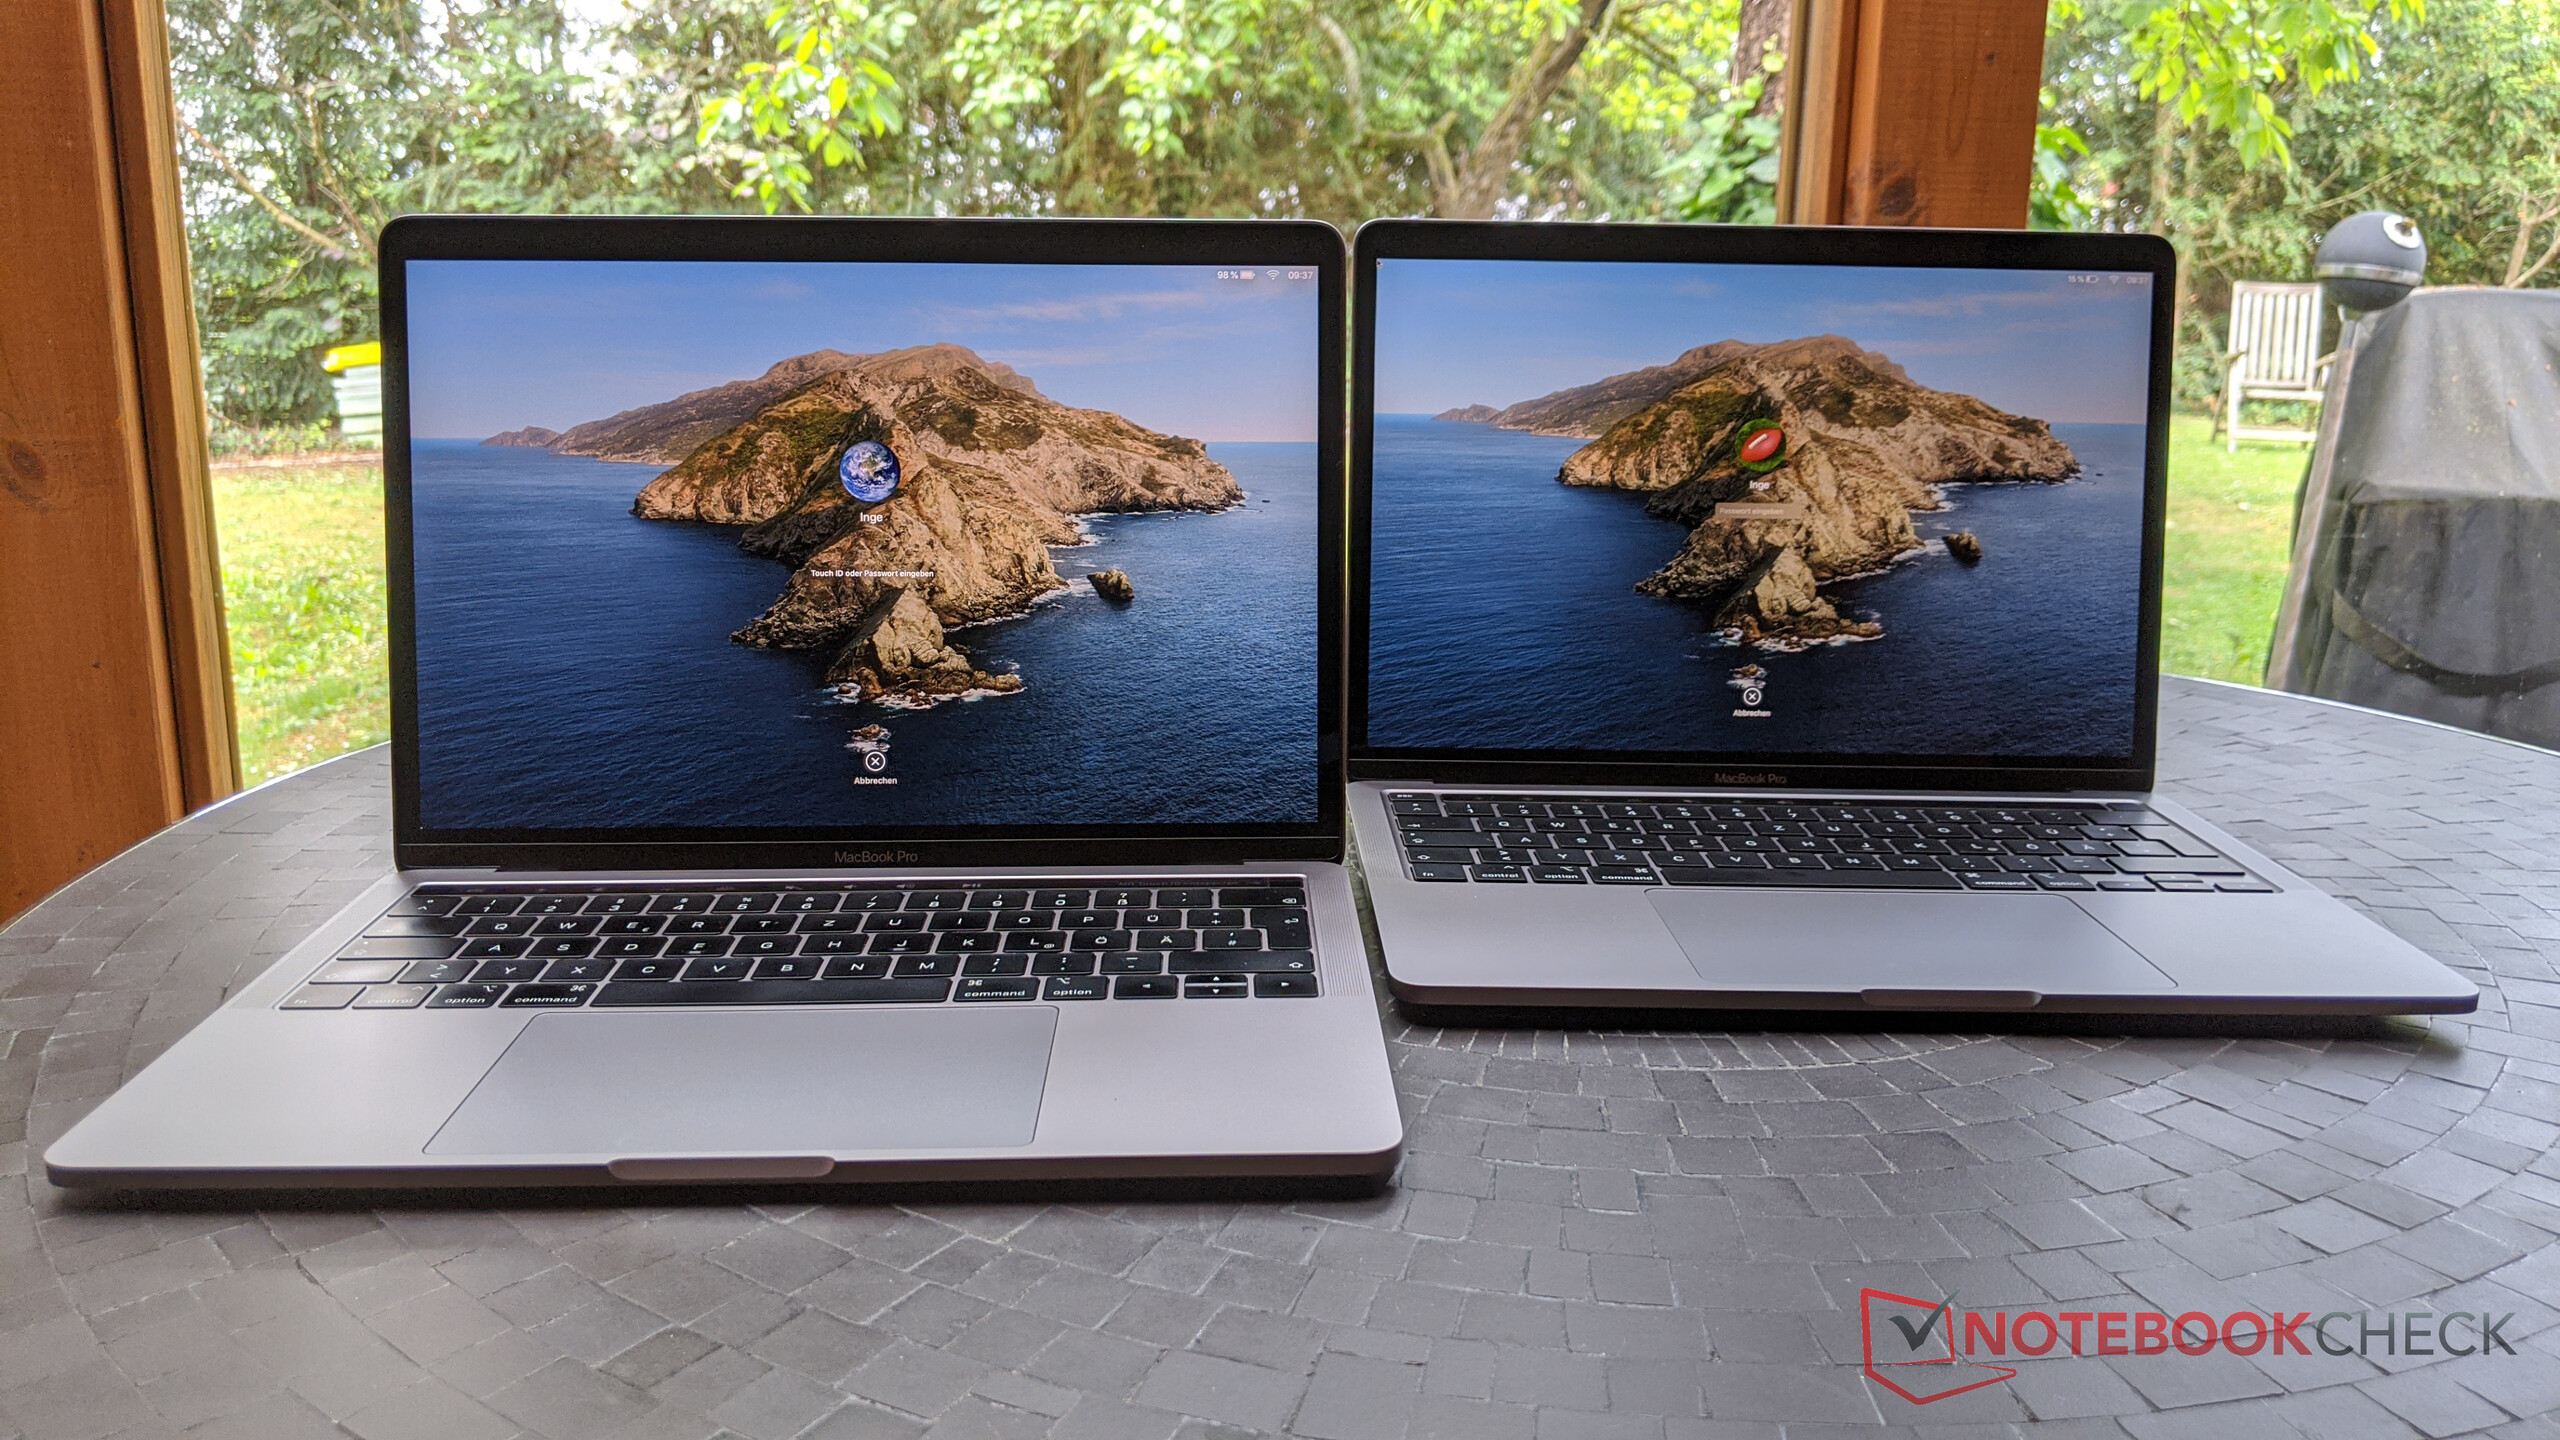
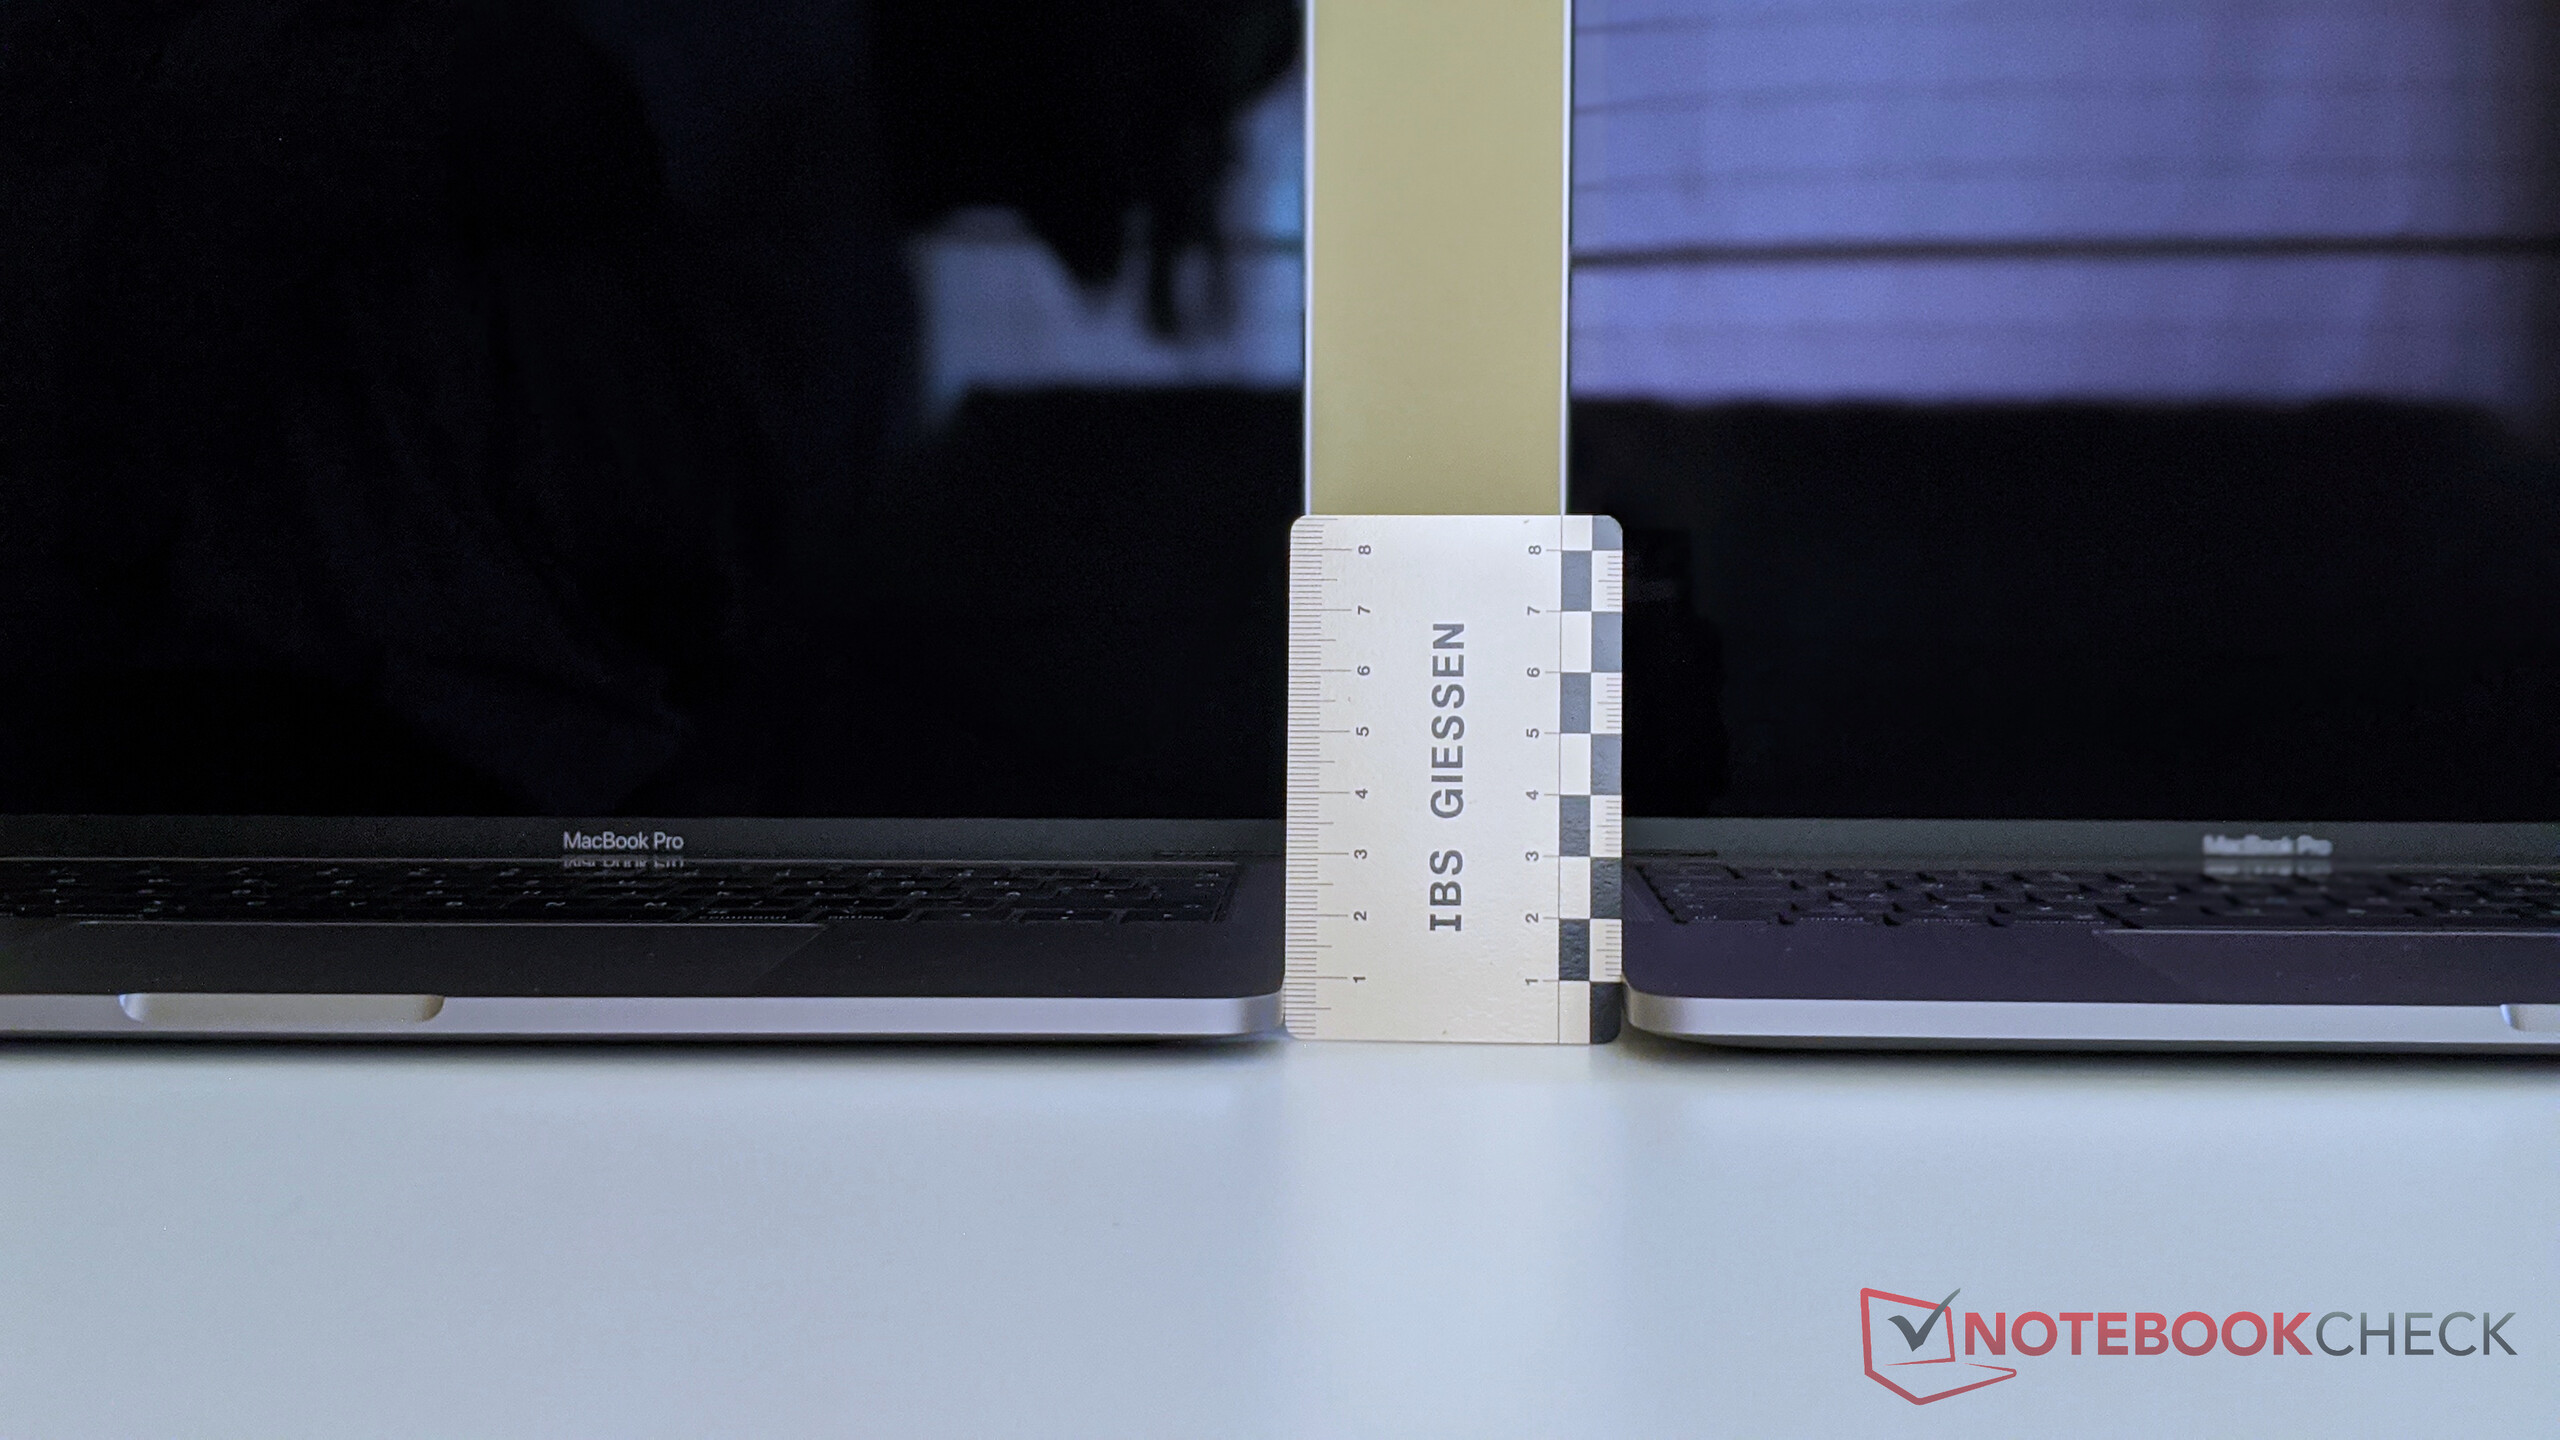
总结——有了新键盘的MacBook 13更好:
2020年的MacBook Pro 13几乎只是一项强制性更新,因为这是继MacBook Pro 16和MacBook Air均已收到更新之后的最后一款使用旧蝶形键盘的MacBook。老实说,升级到Ice Lake处理器的变化并不是很明显。您可以获得更高的GPU性能,但是CPU性能几乎没有变化。将结果与新的AMD Renoir处理器进行比较时,您可以清楚地看到Intel的问题。
但是,在性能方面,MacBook Pro 13仍然比许多其他超极本更具优势,因为即使在持续的工作负载下也没有大的下降。按键行程更长的新型Magic键盘可能会吸引更多客户。如果您由于键盘问题而没有考虑MacBook,则绝对应该尝试一下新机型。
带有新键盘的MacBook Pro 13应该会吸引更多客户,并且比以前的产品更好。但是,您必须承受高昂的售价并接受几乎不存在的可维修性。
说实在的,我们在发布之前希望会有更多创新(尤其是转向传闻中的MacBook Pro 14),毕竟MacBook在过去几年中没有任何真正的进步/创新,但是MacBook Pro 13仍然是一台非常不错的笔记本电脑。出色的一体式机身和显示效果仍然是两个亮点。该型号还得益于新改进的键盘,但是所有这些代价都很高,因为我们的评测设备非常昂贵,售价14499元。
Apple MacBook Pro 13 2020 2GHz i5 10th-Gen
- 06/01/2020 v7 (old)
Andreas Osthoff
Price comparison

