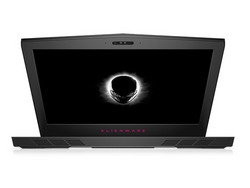
Alienware 15 R3 笔记本电脑简短评测
» Notebookcheck多媒体笔记本电脑Top 10排名
» Notebookcheck游戏笔记本电脑Top 10排名
» Notebookcheck低价办公/商务笔记本电脑Top 10排名
» Notebookcheck高端办公/商务笔记本电脑Top 10排名
» Notebookcheck工作站笔记本电脑Top 10排名
» Notebookcheck亚笔记本电脑Top 10排名
» Notebookcheck超级本产品Top 10排名
» Notebookcheck变形本产品Top 10排名
» Notebookcheck平板电脑Top 10排名
» Notebookcheck智能手机Top 10排名
» Notebookcheck评测过最出色的笔记本电脑屏幕
» Notebookcheck售价500欧元以下笔记本电脑Top 10排名
» Notebookcheck售价300欧元以下笔记本电脑Top 10排名
| Networking | |
| iperf3 transmit AX12 | |
| Alienware 15 R3 | |
| Schenker XMG P507 PRO | |
| iperf3 receive AX12 | |
| Alienware 15 R3 | |
| Schenker XMG P507 PRO | |
| |||||||||||||||||||||||||
Brightness Distribution: 93 %
Center on Battery: 386 cd/m²
Contrast: 990:1 (Black: 0.39 cd/m²)
ΔE ColorChecker Calman: 10.2 | ∀{0.5-29.43 Ø4.76}
ΔE Greyscale Calman: 11.28 | ∀{0.09-98 Ø5}
90% sRGB (Argyll 1.6.3 3D)
59% AdobeRGB 1998 (Argyll 1.6.3 3D)
66.2% AdobeRGB 1998 (Argyll 3D)
90.5% sRGB (Argyll 3D)
66% Display P3 (Argyll 3D)
Gamma: 2.23
CCT: 11383 K
| Alienware 15 R3 HPJGK_B156HTN (AUO51ED), 1920x1080 | Alienware 15 R2 (Skylake) Samsung 4NDDJ_156HL (SDC4C48), 1920x1080 | Asus Strix GL502VS-FY032T LG Philips LP156WF6-SPB6 (LGD046F), 1920x1080 | MSI GT62VR-6RE16H21 LG Philips LP156WF6 (LGD046F), 1920x1080 | Schenker XMG P507 PRO AUO B156HTN05.2 (AUO52ED), 1920x1080 | |
|---|---|---|---|---|---|
| Display | -36% | -6% | -5% | -1% | |
| Display P3 Coverage (%) | 66 | 40.3 -39% | 64.5 -2% | 64.6 -2% | 66.4 1% |
| sRGB Coverage (%) | 90.5 | 60.2 -33% | 83.1 -8% | 84.6 -7% | 88.9 -2% |
| AdobeRGB 1998 Coverage (%) | 66.2 | 41.67 -37% | 60.8 -8% | 61.8 -7% | 65.1 -2% |
| Response Times | -114% | -72% | -60% | 2% | |
| Response Time Grey 50% / Grey 80% * (ms) | 25 ? | 48.8 ? -95% | 38 ? -52% | 34 ? -36% | 24 ? 4% |
| Response Time Black / White * (ms) | 12 ? | 28 ? -133% | 23 ? -92% | 22 ? -83% | 12 ? -0% |
| PWM Frequency (Hz) | 200 ? | ||||
| Screen | -7% | 11% | 15% | -6% | |
| Brightness middle (cd/m²) | 386 | 180 -53% | 315 -18% | 273 -29% | 357 -8% |
| Brightness (cd/m²) | 382 | 179 -53% | 290 -24% | 278 -27% | 365 -4% |
| Brightness Distribution (%) | 93 | 83 -11% | 85 -9% | 88 -5% | 85 -9% |
| Black Level * (cd/m²) | 0.39 | 0.19 51% | 0.32 18% | 0.27 31% | 0.5 -28% |
| Contrast (:1) | 990 | 947 -4% | 984 -1% | 1011 2% | 714 -28% |
| Colorchecker dE 2000 * | 10.2 | 6.74 34% | 4.88 52% | 3.67 64% | 9.93 3% |
| Colorchecker dE 2000 max. * | 15.81 | 8.88 44% | 8.33 47% | 14.87 6% | |
| Greyscale dE 2000 * | 11.28 | 6.44 43% | 4.17 63% | 2.73 76% | 10.32 9% |
| Gamma | 2.23 99% | 2.29 96% | 2.53 87% | 2.49 88% | 2.11 104% |
| CCT | 11383 57% | 6465 101% | 6683 97% | 7029 92% | 10096 64% |
| Color Space (Percent of AdobeRGB 1998) (%) | 59 | 38 -36% | 55 -7% | 55 -7% | 58 -2% |
| Color Space (Percent of sRGB) (%) | 90 | 60 -33% | 83 -8% | 84 -7% | 89 -1% |
| Total Average (Program / Settings) | -52% /
-29% | -22% /
-3% | -17% /
1% | -2% /
-4% |
* ... smaller is better
Display Response Times
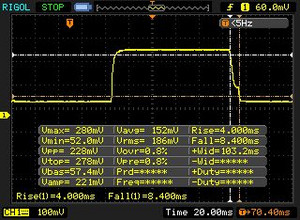
| ↔ Response Time Black to White | ||
|---|---|---|
| 12 ms ... rise ↗ and fall ↘ combined | ↗ 4 ms rise | |
| ↘ 8 ms fall | ||
| The screen shows good response rates in our tests, but may be too slow for competitive gamers. In comparison, all tested devices range from 0.1 (minimum) to 240 (maximum) ms. » 31 % of all devices are better. This means that the measured response time is better than the average of all tested devices (20.1 ms). | ||
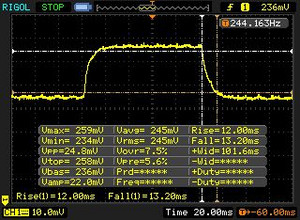
| ↔ Response Time 50% Grey to 80% Grey | ||
| 25 ms ... rise ↗ and fall ↘ combined | ↗ 12 ms rise | |
| ↘ 13 ms fall | ||
| The screen shows relatively slow response rates in our tests and may be too slow for gamers. In comparison, all tested devices range from 0.165 (minimum) to 636 (maximum) ms. » 34 % of all devices are better. This means that the measured response time is better than the average of all tested devices (31.5 ms). | ||
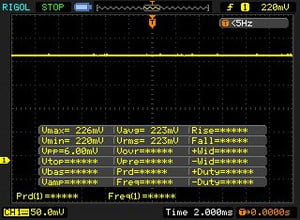
Screen Flickering / PWM (Pulse-Width Modulation)
| Screen flickering / PWM not detected | |||
In comparison: 53 % of all tested devices do not use PWM to dim the display. If PWM was detected, an average of 8039 (minimum: 5 - maximum: 343500) Hz was measured. | |||
| PCMark 8 | |
| Home Score Accelerated v2 | |
| Alienware 15 R3 | |
| Asus Strix GL502VS-FY032T | |
| MSI GT62VR-6RE16H21 | |
| Schenker XMG P507 PRO | |
| Alienware 15 R2 (Skylake) | |
| Work Score Accelerated v2 | |
| Alienware 15 R3 | |
| Schenker XMG P507 PRO | |
| Alienware 15 R2 (Skylake) | |
| Asus Strix GL502VS-FY032T | |
| MSI GT62VR-6RE16H21 | |
| PCMark 7 - Score | |
| Alienware 15 R3 | |
| Schenker XMG P507 PRO | |
| MSI GT62VR-6RE16H21 | |
| Alienware 15 R2 (Skylake) | |
| PCMark 7 Score | 6886 points | |
| PCMark 8 Home Score Accelerated v2 | 4966 points | |
| PCMark 8 Creative Score Accelerated v2 | 7678 points | |
| PCMark 8 Work Score Accelerated v2 | 5299 points | |
Help | ||
| Alienware 15 R3 | Alienware 15 R2 (Skylake) Samsung PM951 NVMe MZ-VLV256D | Asus Strix GL502VS-FY032T SanDisk SD8SNAT256G1002 | MSI GT62VR-6RE16H21 Toshiba HG6 THNSNJ256G8NY | Schenker XMG P507 PRO Samsung SSD 960 Evo 500GB m.2 NVMe | |
|---|---|---|---|---|---|
| CrystalDiskMark 3.0 | -7% | -44% | -23% | 104% | |
| Read Seq (MB/s) | 1123 | 1213 8% | 485.4 -57% | 523 -53% | 1718 53% |
| Write Seq (MB/s) | 429.2 | 306 -29% | 312.4 -27% | 485.5 13% | 1635 281% |
| Read 512 (MB/s) | 833 | 652 -22% | 294.8 -65% | 444.7 -47% | 873 5% |
| Write 512 (MB/s) | 428.1 | 304.8 -29% | 287.8 -33% | 471.2 10% | 1216 184% |
| Read 4k (MB/s) | 37.8 | 42.62 13% | 21.44 -43% | 21.86 -42% | 59.1 56% |
| Write 4k (MB/s) | 122.9 | 143.7 17% | 75.7 -38% | 98.8 -20% | 177.5 44% |
| 3DMark - 1920x1080 Fire Strike Graphics | |
| Alienware 15 R3 | |
| MSI GT62VR-6RE16H21 | |
| Schenker XMG P507 PRO | |
| Asus Strix GL502VS-FY032T | |
| Alienware 15 R2 (Skylake) | |
| 3DMark 11 - 1280x720 Performance GPU | |
| Alienware 15 R3 | |
| MSI GT62VR-6RE16H21 | |
| Asus Strix GL502VS-FY032T | |
| Schenker XMG P507 PRO | |
| Alienware 15 R2 (Skylake) | |
| Unigine Heaven 4.0 - Extreme Preset DX11 | |
| Alienware 15 R3 | |
| Schenker XMG P507 PRO | |
| MSI GT62VR-6RE16H21 | |
| Alienware 15 R2 (Skylake) | |
| 3DMark 11 Performance | 16435 points | |
| 3DMark Ice Storm Standard Score | 135715 points | |
| 3DMark Cloud Gate Standard Score | 26672 points | |
| 3DMark Fire Strike Score | 13728 points | |
Help | ||
| Titanfall 2 | |
| 1920x1080 Very High (Insane Texture Quality) / Enabled AA:TS AF:16x | |
| Alienware 15 R3 | |
| Schenker XMG P507 PRO | |
| 1920x1080 High / Enabled AA:TS AF:8x | |
| Alienware 15 R3 | |
| Schenker XMG P507 PRO | |
| Call of Duty Infinite Warfare | |
| 1920x1080 Ultra / On AA:T2X SM | |
| Alienware 15 R3 | |
| Schenker XMG P507 PRO | |
| 1920x1080 High / On AA:FX | |
| Alienware 15 R3 | |
| Schenker XMG P507 PRO | |
| Dishonored 2 | |
| 1920x1080 Ultra Preset AA:TX | |
| Alienware 15 R3 | |
| Schenker XMG P507 PRO | |
| 1920x1080 High Preset AA:TX | |
| Schenker XMG P507 PRO | |
| Alienware 15 R3 | |
| Watch Dogs 2 | |
| 1920x1080 Ultra Preset | |
| Alienware 15 R3 | |
| Schenker XMG P507 PRO | |
| 1920x1080 High Preset | |
| Alienware 15 R3 | |
| Schenker XMG P507 PRO | |
| Resident Evil 7 | |
| 1920x1080 Very High / On AA:FXAA+T | |
| Alienware 15 R3 | |
| 1920x1080 High / On AA:FXAA+T | |
| Alienware 15 R3 | |
| Battlefield 1 | |
| 1920x1080 Ultra Preset AA:T | |
| Alienware 15 R3 | |
| 1920x1080 High Preset AA:T | |
| Alienware 15 R3 | |
| low | med. | high | ultra | |
|---|---|---|---|---|
| Battlefield 1 (2016) | 121 | 109 | ||
| Titanfall 2 (2016) | 132 | 121 | ||
| Call of Duty Infinite Warfare (2016) | 121 | 114 | ||
| Dishonored 2 (2016) | 85 | 73.3 | ||
| Watch Dogs 2 (2016) | 83.2 | 62.9 | ||
| Resident Evil 7 (2017) | 156 | 130 |
Noise level
| Idle |
| 31 / 32 / 42 dB(A) |
| HDD |
| 32 dB(A) |
| Load |
| 49 / 50 dB(A) |
 | ||
30 dB silent 40 dB(A) audible 50 dB(A) loud |
||
min: | ||
| Alienware 15 R3 GeForce GTX 1070 Mobile, i7-7700HQ | Alienware 15 R2 (Skylake) GeForce GTX 980M, 6700HQ | Asus Strix GL502VS-FY032T GeForce GTX 1070 Mobile, 6700HQ | MSI GT62VR-6RE16H21 GeForce GTX 1070 Mobile, 6700HQ | Schenker XMG P507 PRO GeForce GTX 1070 Mobile, i7-7700HQ | |
|---|---|---|---|---|---|
| Noise | 4% | 5% | 7% | -3% | |
| off / environment * (dB) | 30 | 30 -0% | 30 -0% | 31 -3% | |
| Idle Minimum * (dB) | 31 | 33.6 -8% | 32 -3% | 32 -3% | 33 -6% |
| Idle Average * (dB) | 32 | 33.8 -6% | 33 -3% | 33 -3% | 34 -6% |
| Idle Maximum * (dB) | 42 | 34 19% | 34 19% | 34 19% | 44 -5% |
| Load Average * (dB) | 49 | 39.3 20% | 39 20% | 40 18% | 46 6% |
| Load Maximum * (dB) | 50 | 51.4 -3% | 51 -2% | 46 8% | 52 -4% |
* ... smaller is better
(-) The maximum temperature on the upper side is 46 °C / 115 F, compared to the average of 40.4 °C / 105 F, ranging from 21.2 to 68.8 °C for the class Gaming.
(-) The bottom heats up to a maximum of 51.8 °C / 125 F, compared to the average of 43.3 °C / 110 F
(+) In idle usage, the average temperature for the upper side is 31.7 °C / 89 F, compared to the device average of 33.9 °C / 93 F.
(+) The palmrests and touchpad are cooler than skin temperature with a maximum of 26.6 °C / 79.9 F and are therefore cool to the touch.
(+) The average temperature of the palmrest area of similar devices was 28.8 °C / 83.8 F (+2.2 °C / 3.9 F).
| Alienware 15 R3 GeForce GTX 1070 Mobile, i7-7700HQ | Alienware 15 R2 (Skylake) GeForce GTX 980M, 6700HQ | Asus Strix GL502VS-FY032T GeForce GTX 1070 Mobile, 6700HQ | MSI GT62VR-6RE16H21 GeForce GTX 1070 Mobile, 6700HQ | Schenker XMG P507 PRO GeForce GTX 1070 Mobile, i7-7700HQ | |
|---|---|---|---|---|---|
| Heat | 3% | 9% | 12% | -1% | |
| Maximum Upper Side * (°C) | 46 | 48 -4% | 48 -4% | 44 4% | 49.2 -7% |
| Maximum Bottom * (°C) | 51.8 | 57.3 -11% | 46.8 10% | 53.1 -3% | 62 -20% |
| Idle Upper Side * (°C) | 36.5 | 31.9 13% | 33.7 8% | 28.8 21% | 32.4 11% |
| Idle Bottom * (°C) | 38.2 | 33.4 13% | 30.5 20% | 28.2 26% | 33 14% |
* ... smaller is better
Alienware 15 R3 audio analysis
(+) | speakers can play relatively loud (82 dB)
Bass 100 - 315 Hz
(-) | nearly no bass - on average 19.1% lower than median
(±) | linearity of bass is average (10.4% delta to prev. frequency)
Mids 400 - 2000 Hz
(±) | higher mids - on average 6.7% higher than median
(±) | linearity of mids is average (7.5% delta to prev. frequency)
Highs 2 - 16 kHz
(+) | balanced highs - only 3.6% away from median
(+) | highs are linear (5.2% delta to prev. frequency)
Overall 100 - 16.000 Hz
(±) | linearity of overall sound is average (21.6% difference to median)
Compared to same class
» 77% of all tested devices in this class were better, 5% similar, 18% worse
» The best had a delta of 6%, average was 18%, worst was 132%
Compared to all devices tested
» 61% of all tested devices were better, 7% similar, 33% worse
» The best had a delta of 4%, average was 24%, worst was 134%
Asus Strix GL502VS-FY032T audio analysis
(±) | speaker loudness is average but good (77 dB)
Bass 100 - 315 Hz
(-) | nearly no bass - on average 16.2% lower than median
(±) | linearity of bass is average (11.9% delta to prev. frequency)
Mids 400 - 2000 Hz
(+) | balanced mids - only 0.7% away from median
(+) | mids are linear (3.1% delta to prev. frequency)
Highs 2 - 16 kHz
(+) | balanced highs - only 3.5% away from median
(±) | linearity of highs is average (7.4% delta to prev. frequency)
Overall 100 - 16.000 Hz
(±) | linearity of overall sound is average (16.8% difference to median)
Compared to same class
» 43% of all tested devices in this class were better, 11% similar, 46% worse
» The best had a delta of 6%, average was 18%, worst was 132%
Compared to all devices tested
» 29% of all tested devices were better, 8% similar, 64% worse
» The best had a delta of 4%, average was 24%, worst was 134%
| Off / Standby | |
| Idle | |
| Load |
|
Key:
min: | |
| Alienware 15 R3 GeForce GTX 1070 Mobile, i7-7700HQ | Alienware 15 R2 (Skylake) GeForce GTX 980M, 6700HQ | Asus Strix GL502VS-FY032T GeForce GTX 1070 Mobile, 6700HQ | MSI GT62VR-6RE16H21 GeForce GTX 1070 Mobile, 6700HQ | Schenker XMG P507 PRO GeForce GTX 1070 Mobile, i7-7700HQ | |
|---|---|---|---|---|---|
| Power Consumption | 16% | -1% | -10% | 12% | |
| Idle Minimum * (Watt) | 19 | 11.4 40% | 20 -5% | 20 -5% | 14 26% |
| Idle Average * (Watt) | 23 | 16.5 28% | 24 -4% | 26 -13% | 18 22% |
| Idle Maximum * (Watt) | 29 | 22 24% | 29 -0% | 32 -10% | 24 17% |
| Load Average * (Watt) | 85 | 94.2 -11% | 86 -1% | 100 -18% | 87 -2% |
| Load Maximum * (Watt) | 192 | 192.2 -0% | 183 5% | 202 -5% | 201 -5% |
* ... smaller is better
| Alienware 15 R3 GeForce GTX 1070 Mobile, i7-7700HQ, 99 Wh | Alienware 15 R2 (Skylake) GeForce GTX 980M, 6700HQ, 96 Wh | Asus Strix GL502VS-FY032T GeForce GTX 1070 Mobile, 6700HQ, 62 Wh | MSI GT62VR-6RE16H21 GeForce GTX 1070 Mobile, 6700HQ, 75.24 Wh | Schenker XMG P507 PRO GeForce GTX 1070 Mobile, i7-7700HQ, 60 Wh | |
|---|---|---|---|---|---|
| Battery runtime | 63% | -34% | -12% | -22% | |
| Reader / Idle (h) | 6.4 | 12.8 100% | 4.1 -36% | 5 -22% | |
| H.264 (h) | 4.4 | 7.6 73% | 3.6 -18% | ||
| WiFi v1.3 (h) | 4.4 | 7.4 68% | 3.3 -25% | 4.1 -7% | 3.3 -25% |
| Load (h) | 1.7 | 1.9 12% | 1 -41% | 1.6 -6% |
Pros
Cons
Alienware 15 R3这台经过三次更新的设备在外观上近乎完美(除了突出的风扇区域)。目前没有任何其他游戏笔记本电脑提供了如此工艺精良、坚固且充满质感的机身。同时它也有独一无二的设计感,出色的输入设备和丰富的背光。
它的性能在未来几年内也不会有任何问题。尽管它的显卡现在略显迟缓,但是你可以通过Thunderbolt 3或Graphics Amplifier接口连接外置显卡。120赫兹刷新率的屏幕给了我们比较复杂的感受。它的响应速度、亮度和对比度都无可挑剔,但是可视角度范围、黑值和色彩准确度都不足平均水平。这也是TN技术与生俱来的不足之处(60赫兹屏幕采用IPS技术)。
不过,这台测试机最大的问题在于负载下的噪音和发热量——读者可以从“散热噪音”测试结果中发现。这可能源于它的处理器不同核心间的不均匀发热。在3D程序下它风扇带来的50dB(A)噪音显得有些过分,尽管Alienware 15 R3的厚度仅仅2.5厘米。我们将会测试另一台15寸设备,看看这是否是一个普遍问题,或者是我们测试机的个体缺陷。由于风扇和发热量的问题,我们决定在它的总分中减去1分。
如果你能够接受较差的音响效果这个细节问题的话,Alienware 15 R3几乎在所有方面都表现不同凡响。酷睿 i7-7700HQ和GeForce GTX 1070的组合可以在1920x1080像素分辨率和超高设定下运行所有最新游戏。
注:本文是基于完整评测的缩减版本,阅读完整的英文评测,请点击这里。
Alienware 15 R3
- 02/08/2017 v6 (old)
Florian Glaser


